Embed Size (px)
Citation preview

In s t itu tio n a l E q u it ie s
Initi
atin
g C
over
age
Bandhan Bank
Reuters: BANH.BO; Bloomberg: BANDHAN IN
High earnings visibility on back of continued MFI dominance We initiate coverage on Bandhan Bank with a BUY rating and fair value estimate of Rs490 based on 3.5x 1HFY23E ABV. Bandhan Bank enjoys a dominant position in the Indian micro-finance industry. Having maintained 20% market share over the last 4 years, we believe that Bandhan Bank is strongly positioned to gain in an industry which is expected to grow at 15% CAGR over FY21-26E. Bandhan Bank’s loans have grown at a 30% CAGR over FY17-20, backed by very high-quality and granular growth in deposits. While micro-finance is expected to continue on the strong growth trajectory for the bank, we expect non-micro-finance segments to grow at a higher rate given the management’s vision 2025. We also expect Bandhan Bank to gain deposit market share, especially in West Bengal given that it offers relatively higher rate than frontline banks. The higher-rate strategy, even if it continues for longer, is not concerning as the high margins on the asset side shall be able to accommodate it. The bank has done a commendable job in terms of improving the opex ratios. – cost/income ratio has improved from 36.3% (FY17) to 30.8% (FY20). We are building in a cost/income ratio of 32% over FY22-23E. Given that micro-finance collections are now inching towards normalcy and in absence of any large-ticket/corporate NPAs or state-specific agitations (such as in Assam), we believe that the bank’s balance sheet is sufficiently provided for in terms of addressing the asset quality impact due to Covid-19. We expect credit cost to start moderating FY22E onwards, which will be a major driver of ROE improvement. Overall, we expect the bank to deliver an ROE of 18.6-22.9% over FY21-23E. In our view, Bandhan Bank is one of the few banks which provide a high degree of overall growth and earnings visibility. This comfort comes partially from the bank’s track record and its performance vis-à-vis peers. What strongly adds to our ‘visibility’ thesis is the specialized nature of the business i.e., micro-finance where the bank commands 20% market share. Market dominance to continue: Bandhan Bank has maintained its Microfinance industry market share at 20% in last few years. Given the industry growth opportunity (15% CAGR FY21-26E) coupled with superior execution capability (as demonstrated so far), we expect Bandhan Bank to improve upon its market share (23.6% by FY25E). Non-MFI to grow at a higher rate: Under the vision 2025, the non-MFI segments (housing, SME, personal/retail) are expected to see higher growth. Over FY20-23E, we expect Bandhan Bank’s micro-finance portfolio to grow at ~21% CAGR, led by improving penetration in east/north-east India. Untapped states of West Bengal, Jharkhand and UP are expected to provide impetus for housing finance growth. We expect the non-micro-finance portfolio to grow at ~30% CAGR over FY20-23E. Deposit scale up impressive; West Bengal market share to improve: The bank’s deposits have grown at 35% CAGR over FY17-20. Compared to 71% as of FY17, retail deposits constituted ~78% of the total deposits as of 2QFY21. Over FY17-20, CASA deposits have grown at 45.4% CAGR and retail TDs have grown at 34.9% CAGR. We expect Bandhan Bank to gain further deposit market share in West Bengal given it currently holds only 3% (1QFY21) vis-a-vis ~70% held by PSBs despite Bandhan Bank offering higher rates. Expect NIM to compress: Given that the share of micro-finance is expected to decline further, we expect blended NIM to compress. We expect 86bps compression in NIMs over FY20-23E. Superior cost ratios: Over FY17-20, the C/I ratio has improved from 36.3% to 30.8%. Bandhan Bank’s employee cost per head is about 50% lower and rent per banking outlet is 63% lower than the second-lowest bank in our coverage. Given the geographical spread of the business, majority of the workforce and banking outlets are based in east/north-east where wages and rents are generally lower than other parts of the country. We see scope for 17-18% improvement in micro-borrowers-per-DSC ratio. Historical asset quality track record better than industry: During some of the recent events, which proved to be detrimental to the micro-finance industry’s asset quality, Bandhan Bank’s 90+ dpd numbers were 50-90% lower than the industry. Even in the current situation, Bandhan Bank has reported better-than-industry collections in the micro-finance portfolio. We expect credit cost to trend down FY22E onwards, which will be a major driver of ROE improvement.
BUY
Sector: Banks
CMP: Rs407
Target Price: Rs490
Upside: 20%
Raghav Garg, CFA Research Analyst [email protected] +91-22-6273 8192 Arjun Bagga Research Associate [email protected] +91-22-6273 8111
Key Data
Current Shares O/S (mn) 1,610.4
Mkt Cap (Rsbn/US$bn) 663.7/9.0
52 Wk H / L (Rs) 527/152
Daily Vol. (3M NSE Avg.) 11,207,660
Share holding (%) 4QFY20 1QFY21 2QFY21
Promoters 40.0 40.0 61.0
Public 60.0 60.0 39.0
Others - - -
One Year Indexed Stock Performance
Price Performance (%)
1 M 6 M 1 Yr
Bandhan Bank. 20.0 53.8 (15.8)
Nifty Index 6.2 36.9 12.6
Source: Bloomberg
Y/E March (Rsmn) FY20 FY21E FY22E FY23E
NII 63,239 79,523 96,526 1,15,023
PPOP 54,466 67,240 79,459 94,525
PAT 30,237 30,568 43,138 54,828
Loans 6,66,299 7,85,272 9,54,764 11,71,101
RoA (%) 3.9 3.0 3.5 3.7
RoE (%) 22.2 18.6 21.6 22.9
P/ABV 2.2 3.8 3.2 2.7
Source: Company, Nirmal Bang Institutional Equities Research
0102030405060708090
100110120
Dec-19 Feb-20 Apr-20 Jun-20 Aug-20 Oct-20 Dec-20
BANDHAN BANK LTD Nifty 50
18 December 2020
In s t itu tio n a l E q u it ie s
Bandhan Bank 2
Outlook and valuation
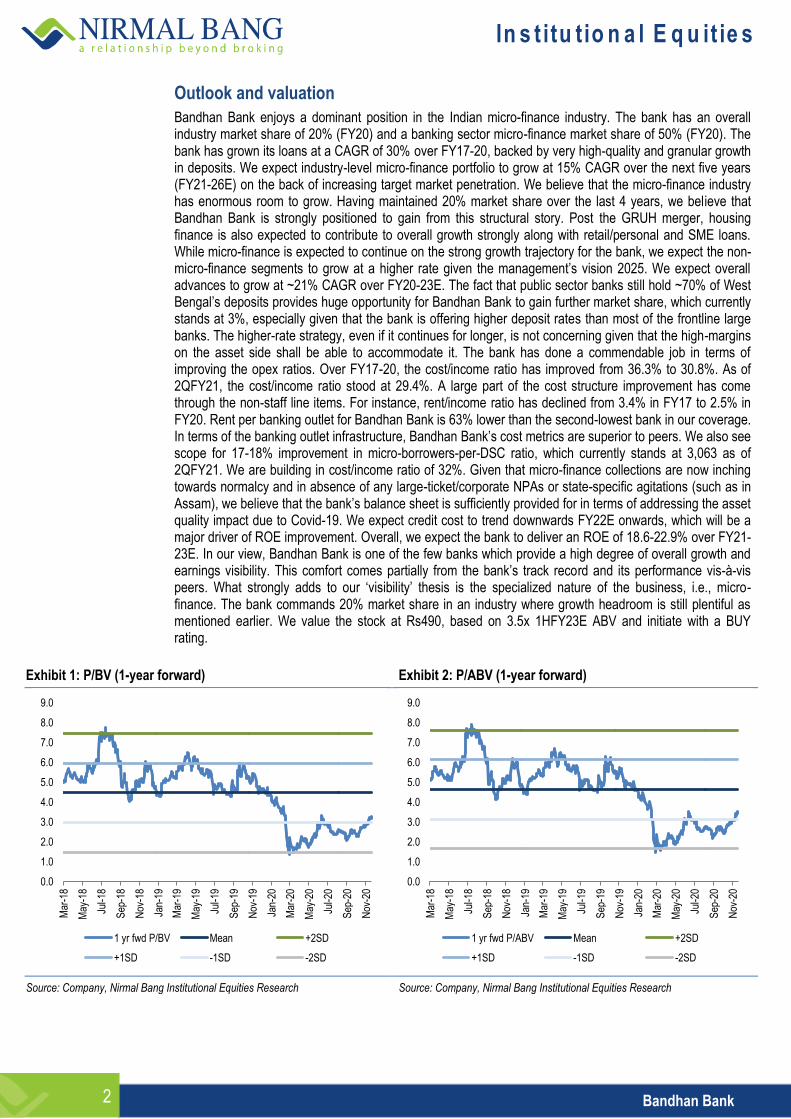
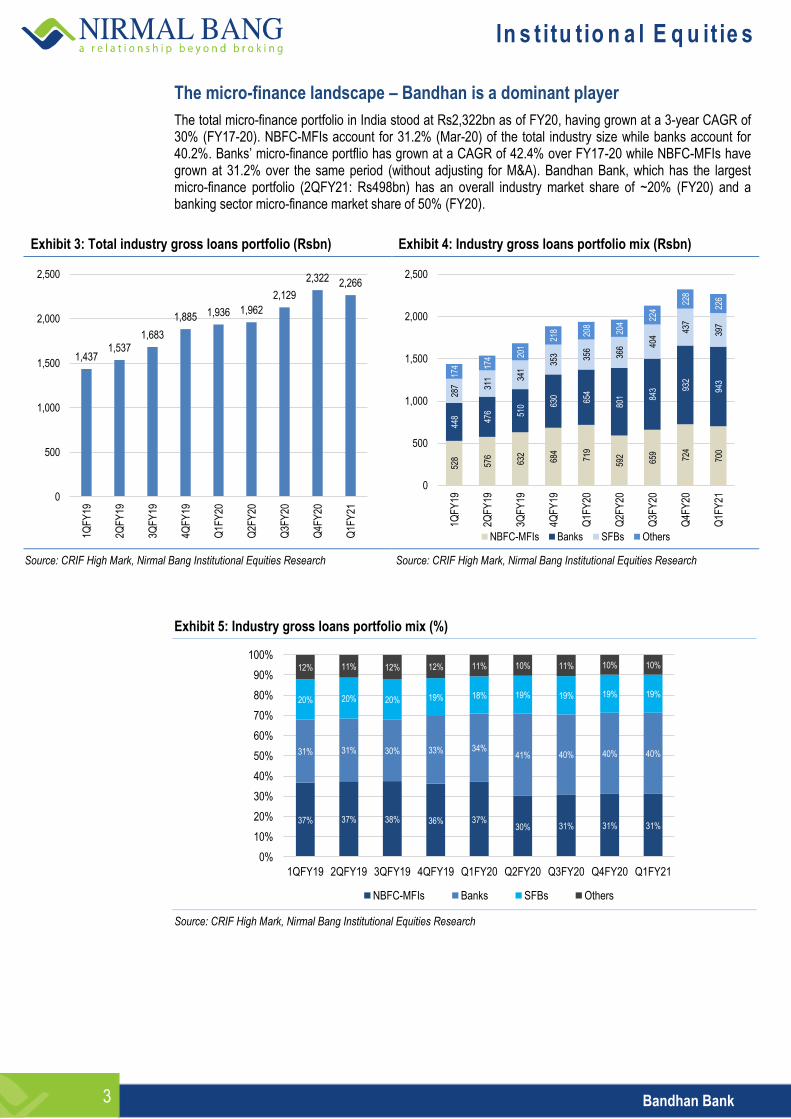
Bandhan Bank enjoys a dominant position in the Indian micro-finance industry. The bank has an overall industry market share of 20% (FY20) and a banking sector micro-finance market share of 50% (FY20). The bank has grown its loans at a CAGR of 30% over FY17-20, backed by very high-quality and granular growth in deposits. We expect industry-level micro-finance portfolio to grow at 15% CAGR over the next five years (FY21-26E) on the back of increasing target market penetration. We believe that the micro-finance industry has enormous room to grow. Having maintained 20% market share over the last 4 years, we believe that Bandhan Bank is strongly positioned to gain from this structural story. Post the GRUH merger, housing finance is also expected to contribute to overall growth strongly along with retail/personal and SME loans. While micro-finance is expected to continue on the strong growth trajectory for the bank, we expect the non-micro-finance segments to grow at a higher rate given the management’s vision 2025. We expect overall advances to grow at ~21% CAGR over FY20-23E. The fact that public sector banks still hold ~70% of West Bengal’s deposits provides huge opportunity for Bandhan Bank to gain further market share, which currently stands at 3%, especially given that the bank is offering higher deposit rates than most of the frontline large banks. The higher-rate strategy, even if it continues for longer, is not concerning given that the high-margins on the asset side shall be able to accommodate it. The bank has done a commendable job in terms of improving the opex ratios. Over FY17-20, the cost/income ratio has improved from 36.3% to 30.8%. As of 2QFY21, the cost/income ratio stood at 29.4%. A large part of the cost structure improvement has come through the non-staff line items. For instance, rent/income ratio has declined from 3.4% in FY17 to 2.5% in FY20. Rent per banking outlet for Bandhan Bank is 63% lower than the second-lowest bank in our coverage. In terms of the banking outlet infrastructure, Bandhan Bank’s cost metrics are superior to peers. We also see scope for 17-18% improvement in micro-borrowers-per-DSC ratio, which currently stands at 3,063 as of 2QFY21. We are building in cost/income ratio of 32%. Given that micro-finance collections are now inching towards normalcy and in absence of any large-ticket/corporate NPAs or state-specific agitations (such as in Assam), we believe that the bank’s balance sheet is sufficiently provided for in terms of addressing the asset quality impact due to Covid-19. We expect credit cost to trend downwards FY22E onwards, which will be a major driver of ROE improvement. Overall, we expect the bank to deliver an ROE of 18.6-22.9% over FY21-23E. In our view, Bandhan Bank is one of the few banks which provide a high degree of overall growth and earnings visibility. This comfort comes partially from the bank’s track record and its performance vis-à-vis peers. What strongly adds to our ‘visibility’ thesis is the specialized nature of the business, i.e., micro-finance. The bank commands 20% market share in an industry where growth headroom is still plentiful as mentioned earlier. We value the stock at Rs490, based on 3.5x 1HFY23E ABV and initiate with a BUY rating.
Exhibit 1: P/BV (1-year forward) Exhibit 2: P/ABV (1-year forward)
Source: Company, Nirmal Bang Institutional Equities Research Source: Company, Nirmal Bang Institutional Equities Research
0.0
1.0
2.0
3.0
4.0
5.0
6.0
7.0
8.0
9.0
Mar
-18
May
-18
Jul-1
8
Sep
-18
Nov
-18
Jan-
19
Mar
-19
May
-19
Jul-1
9
Sep
-19
Nov
-19
Jan-
20
Mar
-20
May
-20
Jul-2
0
Sep
-20
Nov
-20
1 yr fwd P/BV Mean +2SD
+1SD -1SD -2SD
0.0
1.0
2.0
3.0
4.0
5.0
6.0
7.0
8.0
9.0
Mar
-18
May
-18
Jul-1
8
Sep
-18
Nov
-18
Jan-
19
Mar
-19
May
-19
Jul-1
9
Sep
-19
Nov
-19
Jan-
20
Mar
-20
May
-20
Jul-2
0
Sep
-20
Nov
-20
1 yr fwd P/ABV Mean +2SD
+1SD -1SD -2SD
In s t itu tio n a l E q u it ie s
Bandhan Bank 3
The micro-finance landscape – Bandhan is a dominant player
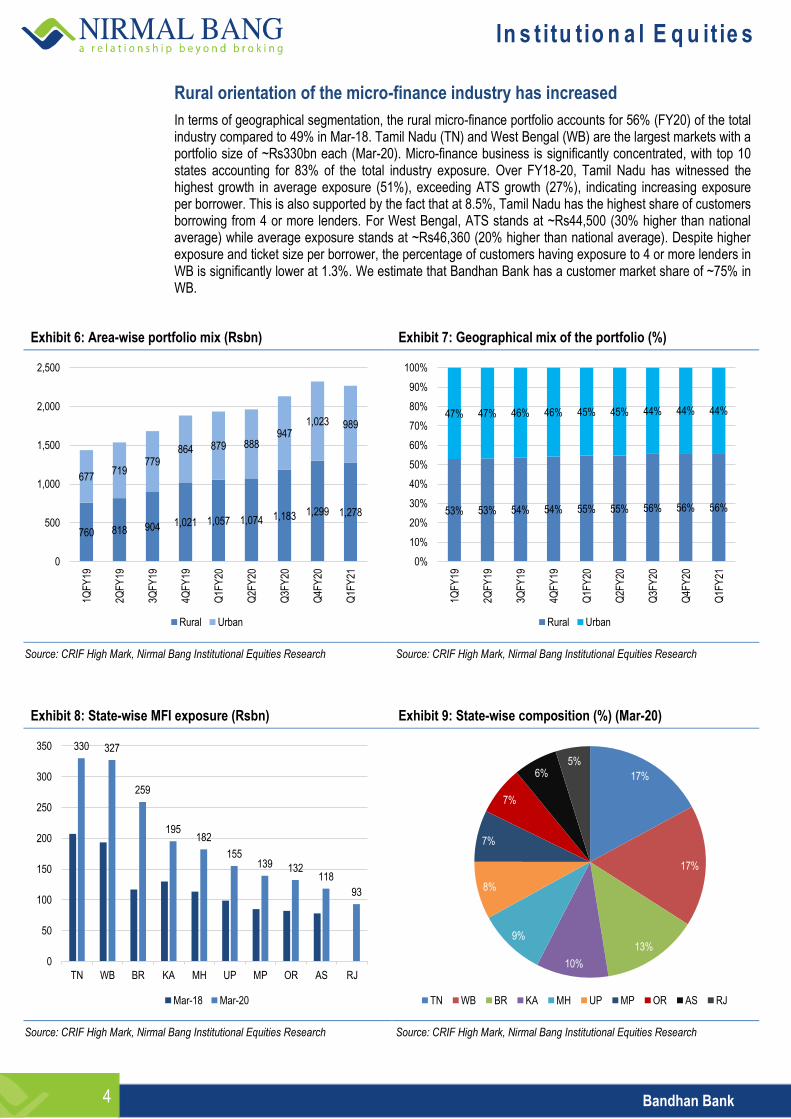
The total micro-finance portfolio in India stood at Rs2,322bn as of FY20, having grown at a 3-year CAGR of 30% (FY17-20). NBFC-MFIs account for 31.2% (Mar-20) of the total industry size while banks account for 40.2%. Banks’ micro-finance portflio has grown at a CAGR of 42.4% over FY17-20 while NBFC-MFIs have grown at 31.2% over the same period (without adjusting for M&A). Bandhan Bank, which has the largest micro-finance portfolio (2QFY21: Rs498bn) has an overall industry market share of ~20% (FY20) and a banking sector micro-finance market share of 50% (FY20).
Exhibit 3: Total industry gross loans portfolio (Rsbn) Exhibit 4: Industry gross loans portfolio mix (Rsbn)
Source: CRIF High Mark, Nirmal Bang Institutional Equities Research Source: CRIF High Mark, Nirmal Bang Institutional Equities Research
Exhibit 5: Industry gross loans portfolio mix (%)
Source: CRIF High Mark, Nirmal Bang Institutional Equities Research
1,437 1,537
1,683
1,885 1,936 1,962
2,129
2,322 2,266
0
500
1,000
1,500
2,000
2,500
1QF
Y19
2QF
Y19
3QF
Y19
4QF
Y19
Q1F
Y20
Q2F
Y20
Q3F
Y20
Q4F
Y20
Q1F
Y21
528
576
632
684
719
592
659
724
700
448 47
6 510 63
0
654
801 84
3 932
943
287 31
1 341
353 35
6
366 40
4
437
397
174 17
4 201
218 20
8
204
224
228
226
0
500
1,000
1,500
2,000
2,500
1QF
Y19
2QF
Y19
3QF
Y19
4QF
Y19
Q1F
Y20
Q2F
Y20
Q3F
Y20
Q4F
Y20
Q1F
Y21
NBFC-MFIs Banks SFBs Others
37% 37% 38% 36% 37% 30% 31% 31% 31%
31% 31% 30% 33% 34% 41% 40% 40% 40%
20% 20% 20% 19% 18% 19% 19% 19% 19%
12% 11% 12% 12% 11% 10% 11% 10% 10%
0%
10%
20%
30%
40%
50%
60%
70%
80%
90%
100%
1QFY19 2QFY19 3QFY19 4QFY19 Q1FY20 Q2FY20 Q3FY20 Q4FY20 Q1FY21
NBFC-MFIs Banks SFBs Others
In s t itu tio n a l E q u it ie s
Bandhan Bank 4
Rural orientation of the micro-finance industry has increased
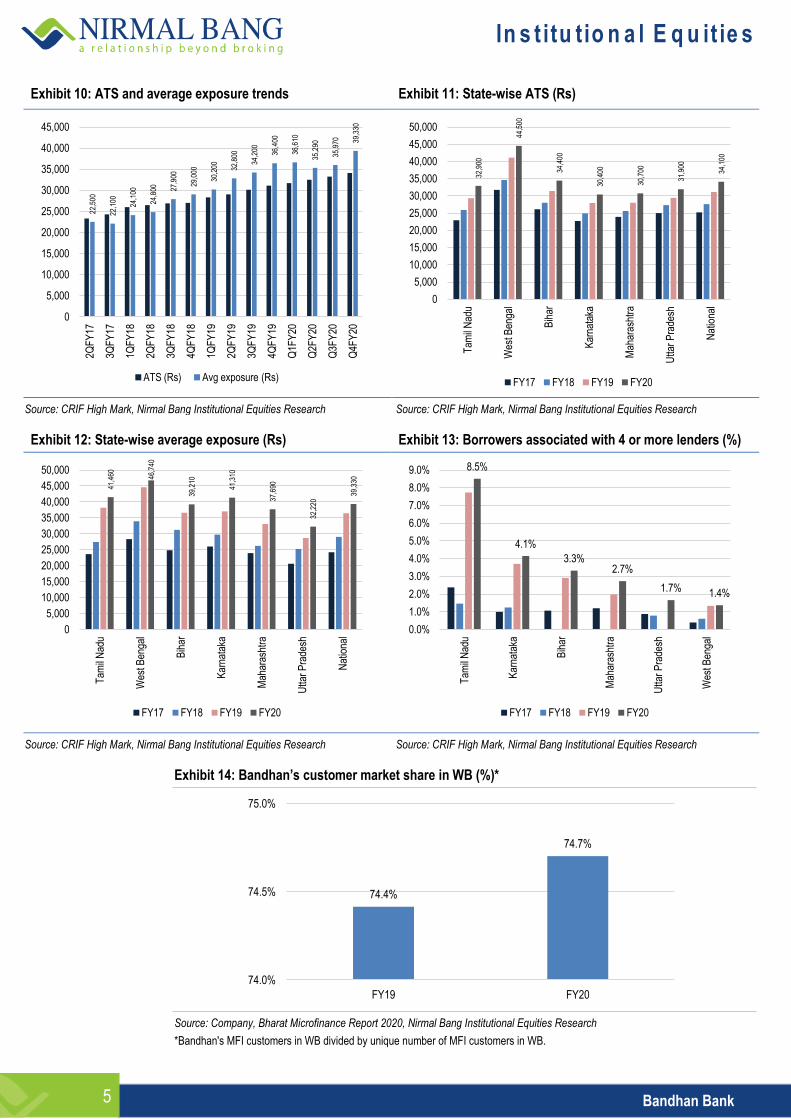
In terms of geographical segmentation, the rural micro-finance portfolio accounts for 56% (FY20) of the total industry compared to 49% in Mar-18. Tamil Nadu (TN) and West Bengal (WB) are the largest markets with a portfolio size of ~Rs330bn each (Mar-20). Micro-finance business is significantly concentrated, with top 10 states accounting for 83% of the total industry exposure. Over FY18-20, Tamil Nadu has witnessed the highest growth in average exposure (51%), exceeding ATS growth (27%), indicating increasing exposure per borrower. This is also supported by the fact that at 8.5%, Tamil Nadu has the highest share of customers borrowing from 4 or more lenders. For West Bengal, ATS stands at ~Rs44,500 (30% higher than national average) while average exposure stands at ~Rs46,360 (20% higher than national average). Despite higher exposure and ticket size per borrower, the percentage of customers having exposure to 4 or more lenders in WB is significantly lower at 1.3%. We estimate that Bandhan Bank has a customer market share of ~75% in WB.
Exhibit 6: Area-wise portfolio mix (Rsbn) Exhibit 7: Geographical mix of the portfolio (%)
Source: CRIF High Mark, Nirmal Bang Institutional Equities Research Source: CRIF High Mark, Nirmal Bang Institutional Equities Research
Exhibit 8: State-wise MFI exposure (Rsbn) Exhibit 9: State-wise composition (%) (Mar-20)
Source: CRIF High Mark, Nirmal Bang Institutional Equities Research Source: CRIF High Mark, Nirmal Bang Institutional Equities Research
760 818 904 1,021 1,057 1,074 1,183 1,299 1,278
677 719
779 864 879 888
947 1,023 989
0
500
1,000
1,500
2,000
2,500
1QF
Y19
2QF
Y19
3QF
Y19
4QF
Y19
Q1F
Y20
Q2F
Y20
Q3F
Y20
Q4F
Y20
Q1F
Y21
Rural Urban
53% 53% 54% 54% 55% 55% 56% 56% 56%
47% 47% 46% 46% 45% 45% 44% 44% 44%
0%
10%
20%
30%
40%
50%
60%
70%
80%
90%
100%
1QF
Y19
2QF
Y19
3QF
Y19
4QF
Y19
Q1F
Y20
Q2F
Y20
Q3F
Y20
Q4F
Y20
Q1F
Y21
Rural Urban
330 327
259
195 182
155 139 132
118
93
0
50
100
150
200
250
300
350
TN WB BR KA MH UP MP OR AS RJ
Mar-18 Mar-20
17%
17%
13%
10%
9%
8%
7%
7%
6% 5%
TN WB BR KA MH UP MP OR AS RJ
In s t itu tio n a l E q u it ie s
Bandhan Bank 5
Exhibit 10: ATS and average exposure trends Exhibit 11: State-wise ATS (Rs)
Source: CRIF High Mark, Nirmal Bang Institutional Equities Research Source: CRIF High Mark, Nirmal Bang Institutional Equities Research
Exhibit 12: State-wise average exposure (Rs) Exhibit 13: Borrowers associated with 4 or more lenders (%)
Source: CRIF High Mark, Nirmal Bang Institutional Equities Research Source: CRIF High Mark, Nirmal Bang Institutional Equities Research
Exhibit 14: Bandhan’s customer market share in WB (%)*
Source: Company, Bharat Microfinance Report 2020, Nirmal Bang Institutional Equities Research
*Bandhan's MFI customers in WB divided by unique number of MFI customers in WB.
22,5
00
22,1
00
24,1
00
24,8
00
27,9
00
29,0
00
30,2
00
32,8
00
34,2
00
36,4
00
36,6
10
35,2
90
35,9
70
39,3
30
0
5,000
10,000
15,000
20,000
25,000
30,000
35,000
40,000
45,000
2QF
Y17
3QF
Y17
1QF
Y18
2QF
Y18
3QF
Y18
4QF
Y18
1QF
Y19
2QF
Y19
3QF
Y19
4QF
Y19
Q1F
Y20
Q2F
Y20
Q3F
Y20
Q4F
Y20
ATS (Rs) Avg exposure (Rs)
32,9
00
44,5
00
34,4
00
30,4
00
30,7
00
31,9
00
34,1
00
0
5,000
10,000
15,000
20,000
25,000
30,000
35,000
40,000
45,000
50,000
Tam
il N
adu
Wes
t Ben
gal
Bih
ar
Kar
nata
ka
Mah
aras
htra
Utta
r P
rade
sh
Nat
iona
l
FY17 FY18 FY19 FY20
41,4
60
46,7
40
39,2
10
41,3
10
37,6
90
32,2
20 39
,330
0
5,000
10,000
15,000
20,000
25,000
30,000
35,000
40,000
45,000
50,000
Tam
il N
adu
Wes
t Ben
gal
Bih
ar
Kar
nata
ka
Mah
aras
htra
Utta
r P
rade
sh
Nat
iona
l
FY17 FY18 FY19 FY20
8.5%
4.1%
3.3% 2.7%
1.7% 1.4%
0.0%
1.0%
2.0%
3.0%
4.0%
5.0%
6.0%
7.0%
8.0%
9.0% T
amil
Nad
u
Kar
nata
ka
Bih
ar
Mah
aras
htra
Utta
r P
rade
sh
Wes
t Ben
gal
FY17 FY18 FY19 FY20
74.4%
74.7%
74.0%
74.5%
75.0%
FY19 FY20
In s t itu tio n a l E q u it ie s
Bandhan Bank 6
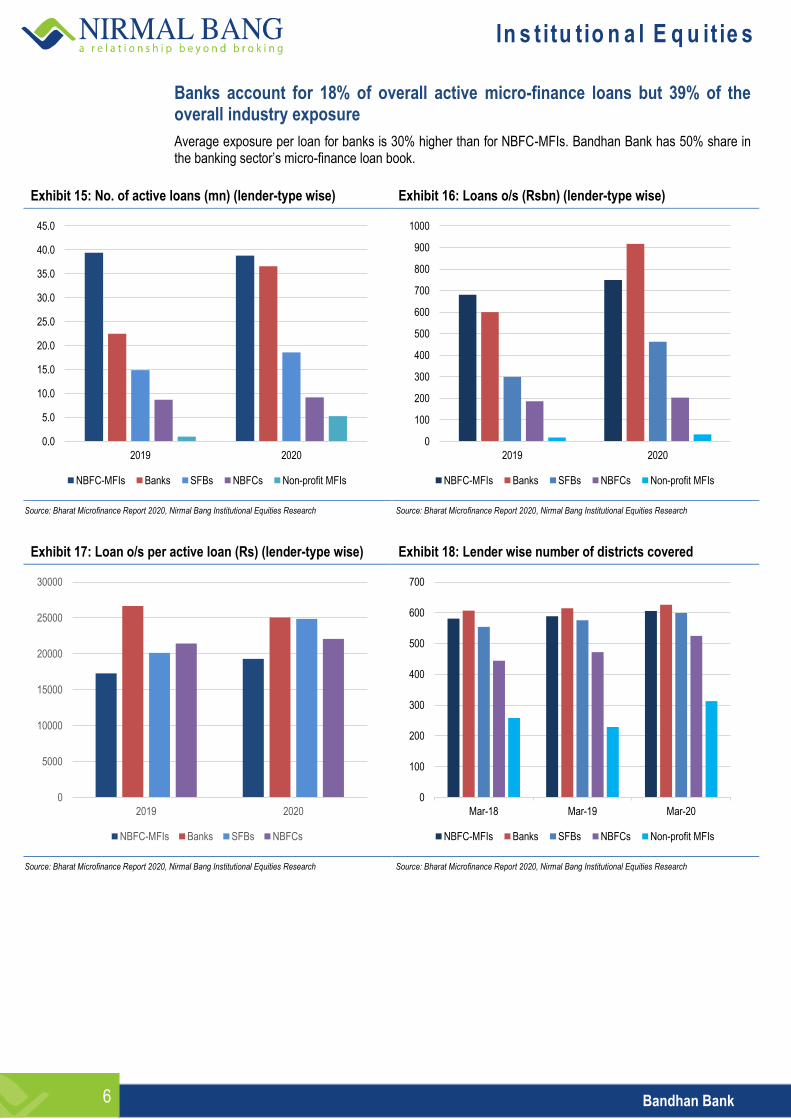
Banks account for 18% of overall active micro-finance loans but 39% of the overall industry exposure
Average exposure per loan for banks is 30% higher than for NBFC-MFIs. Bandhan Bank has 50% share in the banking sector’s micro-finance loan book.
Exhibit 15: No. of active loans (mn) (lender-type wise) Exhibit 16: Loans o/s (Rsbn) (lender-type wise)
Source: Bharat Microfinance Report 2020, Nirmal Bang Institutional Equities Research Source: Bharat Microfinance Report 2020, Nirmal Bang Institutional Equities Research
Exhibit 17: Loan o/s per active loan (Rs) (lender-type wise) Exhibit 18: Lender wise number of districts covered
Source: Bharat Microfinance Report 2020, Nirmal Bang Institutional Equities Research Source: Bharat Microfinance Report 2020, Nirmal Bang Institutional Equities Research
0.0
5.0
10.0
15.0
20.0
25.0
30.0
35.0
40.0
45.0
2019 2020
NBFC-MFIs Banks SFBs NBFCs Non-profit MFIs
0
100
200
300
400
500
600
700
800
900
1000
2019 2020
NBFC-MFIs Banks SFBs NBFCs Non-profit MFIs
0
5000
10000
15000
20000
25000
30000
2019 2020
NBFC-MFIs Banks SFBs NBFCs
0
100
200
300
400
500
600
700
Mar-18 Mar-19 Mar-20
NBFC-MFIs Banks SFBs NBFCs Non-profit MFIs

In s t itu tio n a l E q u it ie s
Bandhan Bank 7
Exhibit 19: Delinquency trends across states
30+ delinquency by value FY20 FY19
States Industry NBFC-MFIs Banks SFBs NBFCs NFPs Industry
Andhra Pradesh 0.53% 0.41% 2.66% 0.11% 0.47% 0.00% 0.69%
Arunachal Pradesh 1.32% 0.10% 6.22% 1.11% NA NA 2.65%
Assam 13.90% 21.21% 9.76% 15.43% 31.20% NA 0.37%
Bihar 0.30% 0.30% 0.31% 0.31% 0.27% 0.02% 0.25%
Chandigarh 2.83% 0.85% 2.21% 0.28% 24.95% NA 0.31%
Chhattisgarh 1.37% 1.18% 0.98% 1.80% 2.87% 0.27% 0.67%
Delhi 1.30% 1.98% 1.15% 1.08% 3.92% NA 1.86%
Gujarat 1.64% 1.32% 1.56% 1.52% 2.98% 1.84% 1.20%
Haryana 0.75% 0.55% 0.61% 0.48% 2.98% 0.23% 0.87%
Himachal Pradesh 1.32% 0.59% 2.55% 0.08% 6.64% 0.00% 0.96%
Jammu & Kashmir 2.24% 0.65% 26.14% 0.00% 0.00% NA 1.45%
Jharkhand 0.83% 0.79% 0.76% 0.58% 3.01% 0.01% 0.70%
Karnataka 3.16% 3.51% 3.45% 1.18% 4.07% 0.00% 0.63%
Kerala 1.28% 2.19% 1.41% 0.36% 2.16% 0.00% 2.20%
Madhya Pradesh 1.41% 1.24% 0.91% 1.73% 3.41% 1.43% 1.34%
Maharashtra 1.15% 0.93% 0.74% 1.98% 1.96% 1.05% 0.89%
Manipur 0.87% 0.11% 0.38% 8.70% 0.00% NA 0.17%
Meghalaya 1.50% 2.06% 0.66% 3.27% NA NA 0.86%
Mizoram 1.19% 1.47% 0.55% 4.43% NA NA 0.27%
Nagaland 1.69% 0.01% 2.02% 0.03% NA 0.00% 0.29%
Odisha 1.38% 1.21% 1.27% 1.44% 3.27% 0.00% 2.89%
Pondicherry 0.69% 1.23% 0.33% 0.48% 0.99% 0.00% 0.56%
Punjab 0.95% 0.39% 0.69% 0.55% 6.01% 0.00% 0.80%
Rajasthan 0.59% 0.61% 0.34% 0.58% 1.66% 0.01% 0.57%
Sikkim 2.70% 0.27% 2.73% 3.39% NA NA 1.71%
Tamil Nadu 1.19% 1.25% 0.56% 1.06% 2.04% 1.64% 1.51%
Telangana 0.54% 1.80% 0.31% 0.01% 1.09% NA 1.86%
Tripura 0.85% 1.00% 0.66% 0.37% 8.62% 0.00% 0.28%
Uttar Pradesh 0.73% 0.84% 0.56% 0.69% 2.07% 0.12% 1.18%
Uttarakhand 0.98% 1.23% 0.57% 1.00% 2.79% 0.00% 2.16%
West Bengal 0.70% 0.80% 0.68% 0.68% 0.77% 0.23% 0.45%
Source: Bharat Microfinance Report 2020, Nirmal Bang Institutional Equities Research

In s t itu tio n a l E q u it ie s
Bandhan Bank 8
We estimate the micro-finance industry to grow at 15% CAGR over FY21-26E
Based on our micro-finance demand-supply model, we estimate the industry-level portfolio to grow at 15% CAGR over the next 5 years (FY21-26E) to Rs5,452bn. Our projections assume target market penetration of 28% by FY26E and a CAGR of 8% over FY21-26E in exposure per borrower.
Exhibit 20: Demand forecast model
MFI demand forecast FY19 FY20 FY21E FY22E FY23E FY24E FY25E FY26E
Urban target market (no. of households) (mn) 55.6 55.6 55.6 55.6 55.6 55.6 55.6 55.6
Rural target market (no. of households) (mn) 112.3 112.3 112.3 112.3 112.3 112.3 112.3 112.3
Total target market (no. of households) (mn) 167.9 167.9 167.9 167.9 167.9 167.9 167.9 167.9
No. of potential borrowers per household 2.0 2.0 2.0 2.0 2.0 2.0 2.0 2.0
Total no. of target individuals (mn) 335.8 335.8 335.8 335.8 335.8 335.8 335.8 335.8
Live customer base (mn) (source: Crif) 56.0 63.0 68.0 73.1 78.1 83.1 88.2 93.2
Live customer base penetration (as % of target market) 17% 19% 20% 22% 23% 25% 26% 28%
Change in penetration (%) - 2.1% 1.5% 1.5% 1.5% 1.5% 1.5% 1.5%
Exposure per borrower (Rs) 33,661 36,857 39,806 42,990 46,429 50,144 54,155 58,488
Growth p.a. in exposure per borrower (%) - 9.5% 8.0% 8.0% 8.0% 8.0% 8.0% 8.0%
GLP (Rsbn) 1,885 2,322 2,708 3,141 3,627 4,169 4,776 5,452
Growth in MFI GLP (%) - 23.2% 16.6% 16.0% 15.4% 15.0% 14.5% 14.2%
Source: Company, Nirmal Bang Institutional Equities Research
Exhibit 21: Industry micro-finance portfolio growth forecast
Source: Nirmal Bang Institutional Equities Research
0%
5%
10%
15%
20%
25%
30%
35%
40%
45%
50%
0
1,000
2,000
3,000
4,000
5,000
6,000
FY18 FY19 FY20 FY21E FY22E FY23E FY24E FY25E FY26E
Total industry (Rsbn) Industry growth (%)
In s t itu tio n a l E q u it ie s
Bandhan Bank 9
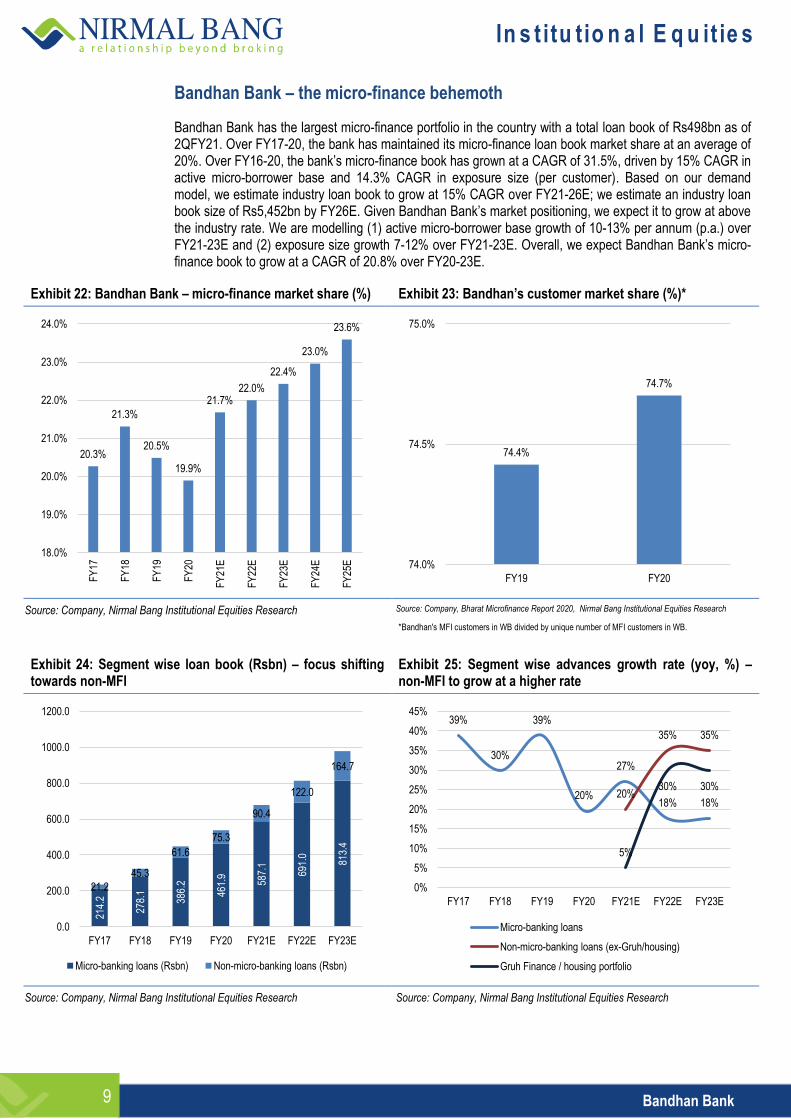
Bandhan Bank – the micro-finance behemoth
Bandhan Bank has the largest micro-finance portfolio in the country with a total loan book of Rs498bn as of 2QFY21. Over FY17-20, the bank has maintained its micro-finance loan book market share at an average of 20%. Over FY16-20, the bank’s micro-finance book has grown at a CAGR of 31.5%, driven by 15% CAGR in active micro-borrower base and 14.3% CAGR in exposure size (per customer). Based on our demand model, we estimate industry loan book to grow at 15% CAGR over FY21-26E; we estimate an industry loan book size of Rs5,452bn by FY26E. Given Bandhan Bank’s market positioning, we expect it to grow at above the industry rate. We are modelling (1) active micro-borrower base growth of 10-13% per annum (p.a.) over FY21-23E and (2) exposure size growth 7-12% over FY21-23E. Overall, we expect Bandhan Bank’s micro-finance book to grow at a CAGR of 20.8% over FY20-23E.
Exhibit 22: Bandhan Bank – micro-finance market share (%) Exhibit 23: Bandhan’s customer market share (%)*
Source: Company, Nirmal Bang Institutional Equities Research Source: Company, Bharat Microfinance Report 2020, Nirmal Bang Institutional Equities Research
*Bandhan's MFI customers in WB divided by unique number of MFI customers in WB.
Exhibit 24: Segment wise loan book (Rsbn) – focus shifting towards non-MFI
Exhibit 25: Segment wise advances growth rate (yoy, %) – non-MFI to grow at a higher rate
Source: Company, Nirmal Bang Institutional Equities Research Source: Company, Nirmal Bang Institutional Equities Research
20.3%
21.3%
20.5%
19.9%
21.7% 22.0%
22.4%
23.0%
23.6%
18.0%
19.0%
20.0%
21.0%
22.0%
23.0%
24.0%
FY
17
FY
18
FY
19
FY
20
FY
21E
FY
22E
FY
23E
FY
24E
FY
25E
74.4%
74.7%
74.0%
74.5%
75.0%
FY19 FY20
214.
2
278.
1
386.
2
461.
9
587.
1
691.
0
813.
4
21.2
45.3
61.6
75.3
90.4
122.0
164.7
0.0
200.0
400.0
600.0
800.0
1000.0
1200.0
FY17 FY18 FY19 FY20 FY21E FY22E FY23E
Micro-banking loans (Rsbn) Non-micro-banking loans (Rsbn)
39%
30%
39%
20%
27%
18% 18% 20%
35% 35%
5%
30% 30%
0%
5%
10%
15%
20%
25%
30%
35%
40%
45%
FY17 FY18 FY19 FY20 FY21E FY22E FY23E
Micro-banking loans
Non-micro-banking loans (ex-Gruh/housing)
Gruh Finance / housing portfolio

In s t itu tio n a l E q u it ie s
Bandhan Bank 10
Exhibit 26: Segment wise advances mix (%) Exhibit 27: Growth in micro-banking disbursements (yoy, %)
Source: Company, Nirmal Bang Institutional Equities Research Source: Company, Nirmal Bang Institutional Equities Research
Exhibit 28: Micro-finance portfolio mix by state (%) (Q2FY21)
Source: Company, Nirmal Bang Institutional Equities Research
91%
86%
86%
64%
68%
65%
63%
9%
14%
14%
10%
10%
12%
13%
25%
22%
23%
25%
0%
10%
20%
30%
40%
50%
60%
70%
80%
90%
100%
FY17 FY18 FY19 FY20 FY21E FY22E FY23E
Share of micro-banking loans (%) Share of non-micro-banking loans (%)
Share of GRUH loans (%)
99%
21%
33% 16%
-75%
-21%
-100%
-80%
-60%
-40%
-20%
0%
20%
40%
60%
80%
100%
120%
FY17 FY18 FY19 FY20 1QFY21 2QFY21
47%
16%
9%
5%
West Bengal Assam Bihar Maharashtra
In s t itu tio n a l E q u it ie s
Bandhan Bank 11
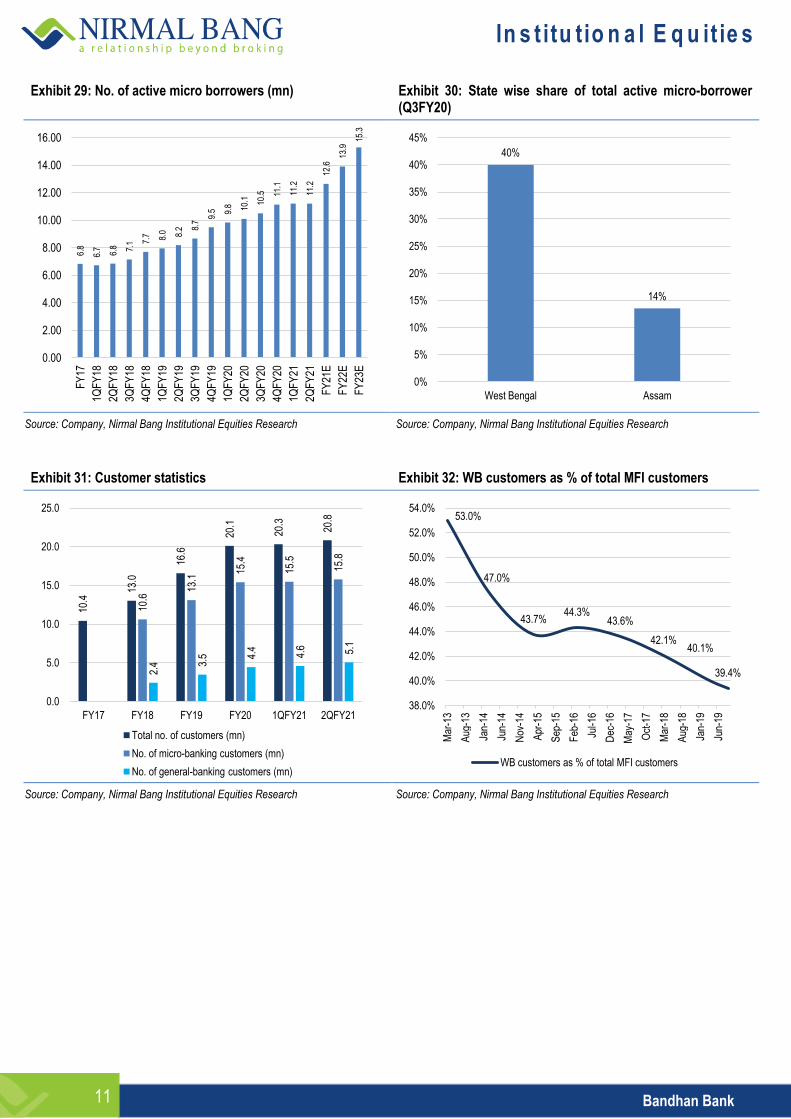
Exhibit 29: No. of active micro borrowers (mn) Exhibit 30: State wise share of total active micro-borrower (Q3FY20)
Source: Company, Nirmal Bang Institutional Equities Research Source: Company, Nirmal Bang Institutional Equities Research
Exhibit 31: Customer statistics Exhibit 32: WB customers as % of total MFI customers
Source: Company, Nirmal Bang Institutional Equities Research Source: Company, Nirmal Bang Institutional Equities Research
6.8
6.7
6.8 7.1 7.
7 8.0 8.2 8.
7
9.5 9.
8 10.1
10.5
11.1
11.2
11.2
12.6
13.9
15.3
0.00
2.00
4.00
6.00
8.00
10.00
12.00
14.00
16.00
FY
17
1QF
Y18
2QF
Y18
3QF
Y18
4QF
Y18
1QF
Y19
2QF
Y19
3QF
Y19
4QF
Y19
1QF
Y20
2QF
Y20
3QF
Y20
4QF
Y20
1QF
Y21
2QF
Y21
FY
21E
FY
22E
FY
23E
40%
14%
0%
5%
10%
15%
20%
25%
30%
35%
40%
45%
West Bengal Assam
10.4
13.0
16.6
20.1
20.3
20.8
10.6
13.1
15.4
15.5
15.8
2.4 3.
5 4.4
4.6 5.1
0.0
5.0
10.0
15.0
20.0
25.0
FY17 FY18 FY19 FY20 1QFY21 2QFY21
Total no. of customers (mn)
No. of micro-banking customers (mn)
No. of general-banking customers (mn)
53.0%
47.0%
43.7% 44.3%
43.6%
42.1% 40.1%
39.4%
38.0%
40.0%
42.0%
44.0%
46.0%
48.0%
50.0%
52.0%
54.0%
Mar
-13
Aug
-13
Jan-
14
Jun-
14
Nov
-14
Apr
-15
Sep
-15
Feb
-16
Jul-1
6
Dec
-16
May
-17
Oct
-17
Mar
-18
Aug
-18
Jan-
19
Jun-
19
WB customers as % of total MFI customers
In s t itu tio n a l E q u it ie s
Bandhan Bank 12
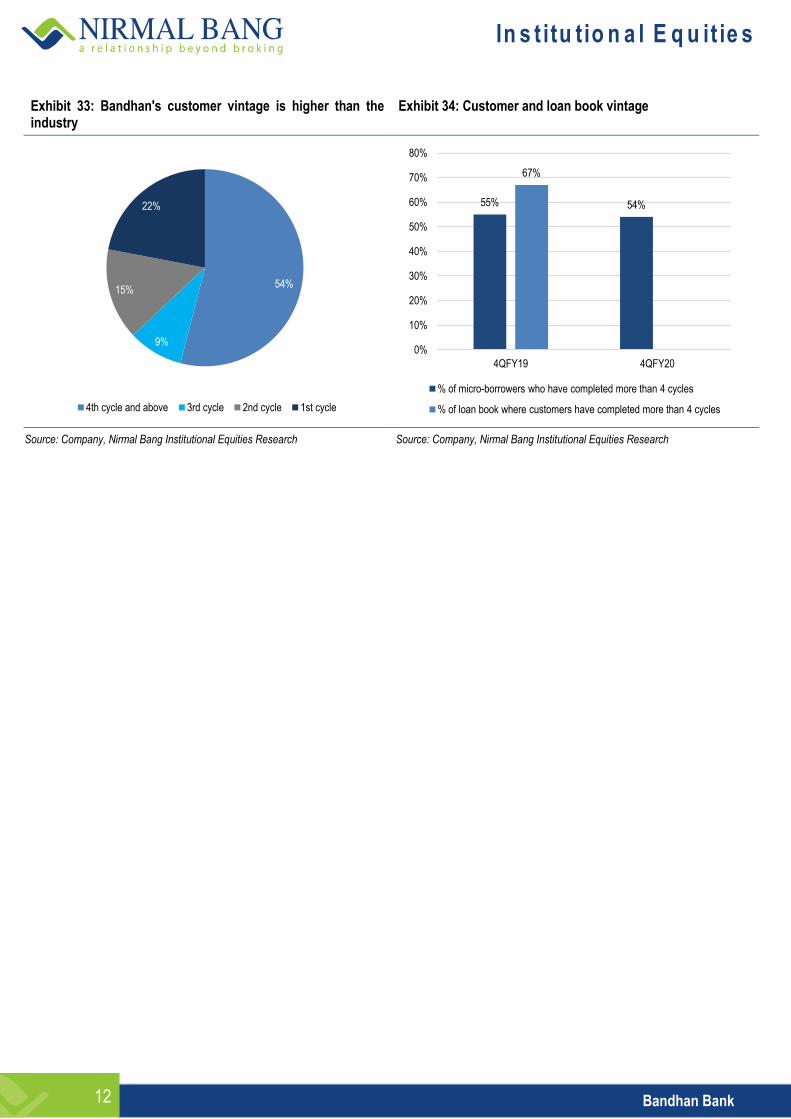
Exhibit 33: Bandhan's customer vintage is higher than the industry
Exhibit 34: Customer and loan book vintage
Source: Company, Nirmal Bang Institutional Equities Research Source: Company, Nirmal Bang Institutional Equities Research
54%
9%
15%
22%
4th cycle and above 3rd cycle 2nd cycle 1st cycle
55% 54%
67%
0%
10%
20%
30%
40%
50%
60%
70%
80%
4QFY19 4QFY20
% of micro-borrowers who have completed more than 4 cycles
% of loan book where customers have completed more than 4 cycles
In s t itu tio n a l E q u it ie s
Bandhan Bank 13
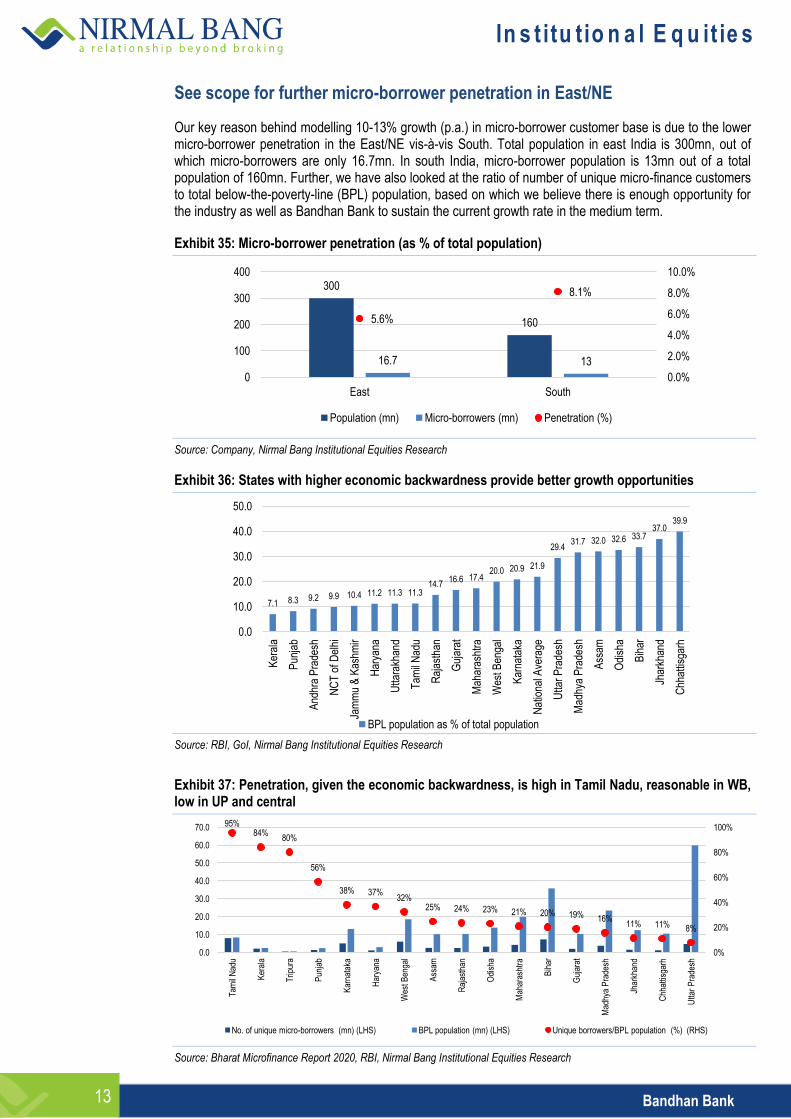
See scope for further micro-borrower penetration in East/NE
Our key reason behind modelling 10-13% growth (p.a.) in micro-borrower customer base is due to the lower micro-borrower penetration in the East/NE vis-à-vis South. Total population in east India is 300mn, out of which micro-borrowers are only 16.7mn. In south India, micro-borrower population is 13mn out of a total population of 160mn. Further, we have also looked at the ratio of number of unique micro-finance customers to total below-the-poverty-line (BPL) population, based on which we believe there is enough opportunity for the industry as well as Bandhan Bank to sustain the current growth rate in the medium term.
Exhibit 35: Micro-borrower penetration (as % of total population)
Source: Company, Nirmal Bang Institutional Equities Research
Exhibit 36: States with higher economic backwardness provide better growth opportunities
Source: RBI, GoI, Nirmal Bang Institutional Equities Research
Exhibit 37: Penetration, given the economic backwardness, is high in Tamil Nadu, reasonable in WB, low in UP and central
Source: Bharat Microfinance Report 2020, RBI, Nirmal Bang Institutional Equities Research
300
160
16.7 13
5.6%
8.1%
0.0%
2.0%
4.0%
6.0%
8.0%
10.0%
0
100
200
300
400
East South
Population (mn) Micro-borrowers (mn) Penetration (%)
7.1 8.3 9.2 9.9 10.4 11.2 11.3 11.3 14.7
16.6 17.4 20.0 20.9 21.9
29.4 31.7 32.0 32.6 33.7
37.0 39.9
0.0
10.0
20.0
30.0
40.0
50.0
Ker
ala
Pun
jab
And
hra
Pra
desh
NC
T o
f Del
hi
Jam
mu
& K
ashm
ir
Har
yana
Utta
rakh
and
Tam
il N
adu
Raj
asth
an
Guj
arat
Mah
aras
htra
Wes
t Ben
gal
Kar
nata
ka
Nat
iona
l Ave
rage
Utta
r P
rade
sh
Mad
hya
Pra
desh
Ass
am
Odi
sha
Bih
ar
Jhar
khan
d
Chh
attis
garh
BPL population as % of total population
95% 84%
80%
56%
38% 37% 32%
25% 24% 23% 21% 20% 19% 16% 11% 11% 8%
0%
20%
40%
60%
80%
100%
0.0
10.0
20.0
30.0
40.0
50.0
60.0
70.0
Tam
il N
adu
Ker
ala
Trip
ura
Pun
jab
Kar
nata
ka
Har
yana
Wes
t Ben
gal
Ass
am
Raj
asth
an
Odi
sha
Mah
aras
htra
Bih
ar
Guj
arat
Mad
hya
Pra
desh
Jhar
khan
d
Chh
attis
garh
Utta
r P
rade
sh
No. of unique micro-borrowers (mn) (LHS) BPL population (mn) (LHS) Unique borrowers/BPL population (%) (RHS)
In s t itu tio n a l E q u it ie s
Bandhan Bank 14
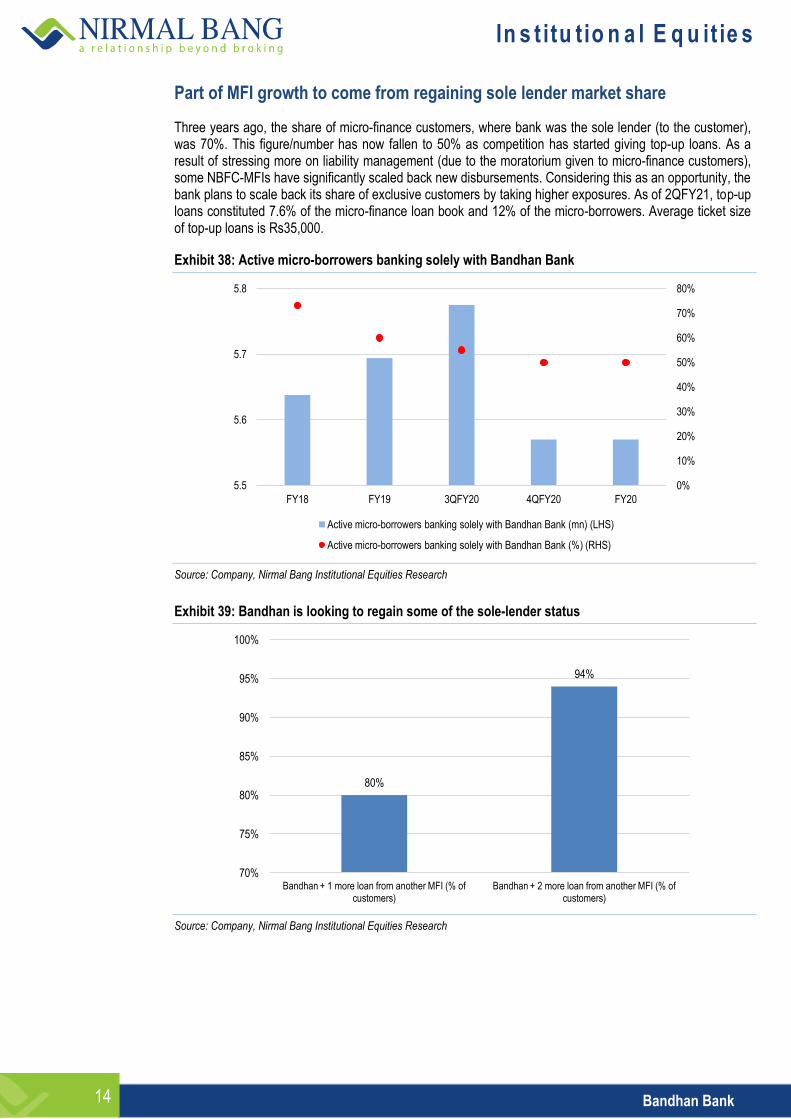
Part of MFI growth to come from regaining sole lender market share
Three years ago, the share of micro-finance customers, where bank was the sole lender (to the customer), was 70%. This figure/number has now fallen to 50% as competition has started giving top-up loans. As a result of stressing more on liability management (due to the moratorium given to micro-finance customers), some NBFC-MFIs have significantly scaled back new disbursements. Considering this as an opportunity, the bank plans to scale back its share of exclusive customers by taking higher exposures. As of 2QFY21, top-up loans constituted 7.6% of the micro-finance loan book and 12% of the micro-borrowers. Average ticket size of top-up loans is Rs35,000.
Exhibit 38: Active micro-borrowers banking solely with Bandhan Bank
Source: Company, Nirmal Bang Institutional Equities Research
Exhibit 39: Bandhan is looking to regain some of the sole-lender status
Source: Company, Nirmal Bang Institutional Equities Research
0%
10%
20%
30%
40%
50%
60%
70%
80%
5.5
5.6
5.7
5.8
FY18 FY19 3QFY20 4QFY20 FY20
Active micro-borrowers banking solely with Bandhan Bank (mn) (LHS)
Active micro-borrowers banking solely with Bandhan Bank (%) (RHS)
80%
94%
70%
75%
80%
85%
90%
95%
100%
Bandhan + 1 more loan from another MFI (% of customers)
Bandhan + 2 more loan from another MFI (% of customers)
In s t itu tio n a l E q u it ie s
Bandhan Bank 15
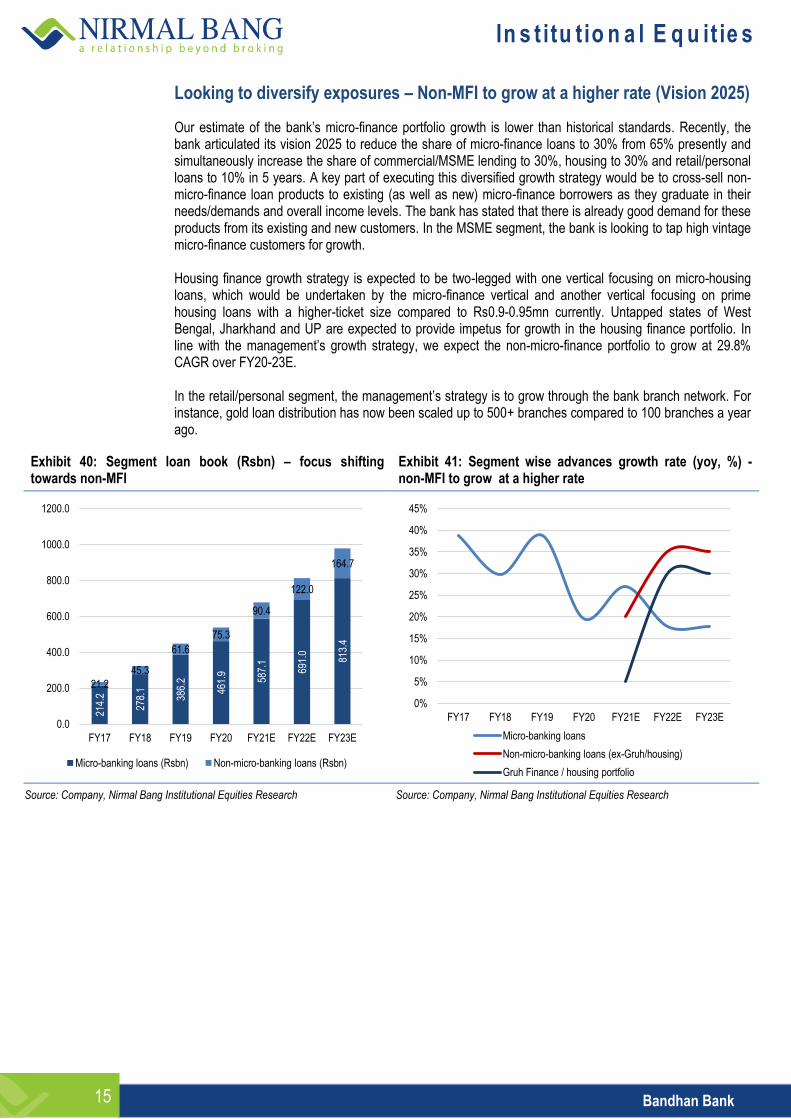
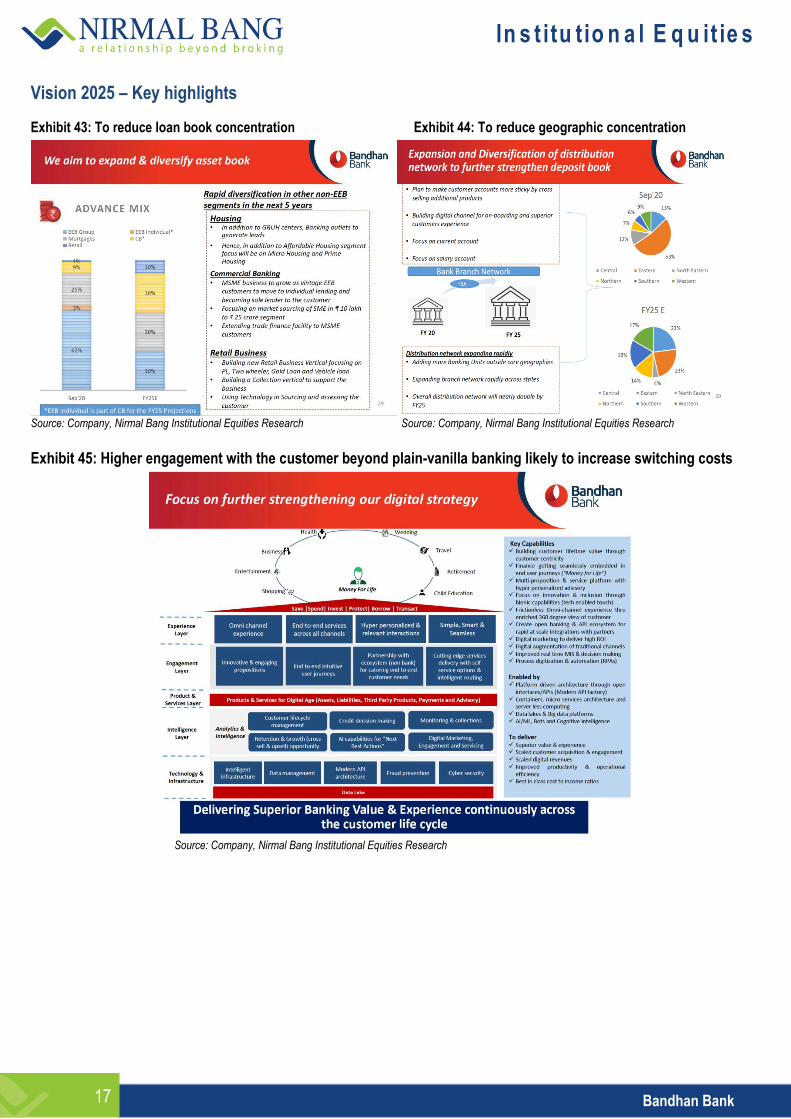
Looking to diversify exposures – Non-MFI to grow at a higher rate (Vision 2025)
Our estimate of the bank’s micro-finance portfolio growth is lower than historical standards. Recently, the bank articulated its vision 2025 to reduce the share of micro-finance loans to 30% from 65% presently and simultaneously increase the share of commercial/MSME lending to 30%, housing to 30% and retail/personal loans to 10% in 5 years. A key part of executing this diversified growth strategy would be to cross-sell non-micro-finance loan products to existing (as well as new) micro-finance borrowers as they graduate in their needs/demands and overall income levels. The bank has stated that there is already good demand for these products from its existing and new customers. In the MSME segment, the bank is looking to tap high vintage micro-finance customers for growth. Housing finance growth strategy is expected to be two-legged with one vertical focusing on micro-housing loans, which would be undertaken by the micro-finance vertical and another vertical focusing on prime housing loans with a higher-ticket size compared to Rs0.9-0.95mn currently. Untapped states of West Bengal, Jharkhand and UP are expected to provide impetus for growth in the housing finance portfolio. In line with the management’s growth strategy, we expect the non-micro-finance portfolio to grow at 29.8% CAGR over FY20-23E. In the retail/personal segment, the management’s strategy is to grow through the bank branch network. For instance, gold loan distribution has now been scaled up to 500+ branches compared to 100 branches a year ago.
Exhibit 40: Segment loan book (Rsbn) – focus shifting towards non-MFI
Exhibit 41: Segment wise advances growth rate (yoy, %) - non-MFI to grow at a higher rate
Source: Company, Nirmal Bang Institutional Equities Research Source: Company, Nirmal Bang Institutional Equities Research
214.
2
278.
1
386.
2
461.
9
587.
1
691.
0
813.
4
21.2
45.3
61.6
75.3
90.4
122.0
164.7
0.0
200.0
400.0
600.0
800.0
1000.0
1200.0
FY17 FY18 FY19 FY20 FY21E FY22E FY23E
Micro-banking loans (Rsbn) Non-micro-banking loans (Rsbn)
0%
5%
10%
15%
20%
25%
30%
35%
40%
45%
FY17 FY18 FY19 FY20 FY21E FY22E FY23E
Micro-banking loans
Non-micro-banking loans (ex-Gruh/housing)
Gruh Finance / housing portfolio
In s t itu tio n a l E q u it ie s
Bandhan Bank 16
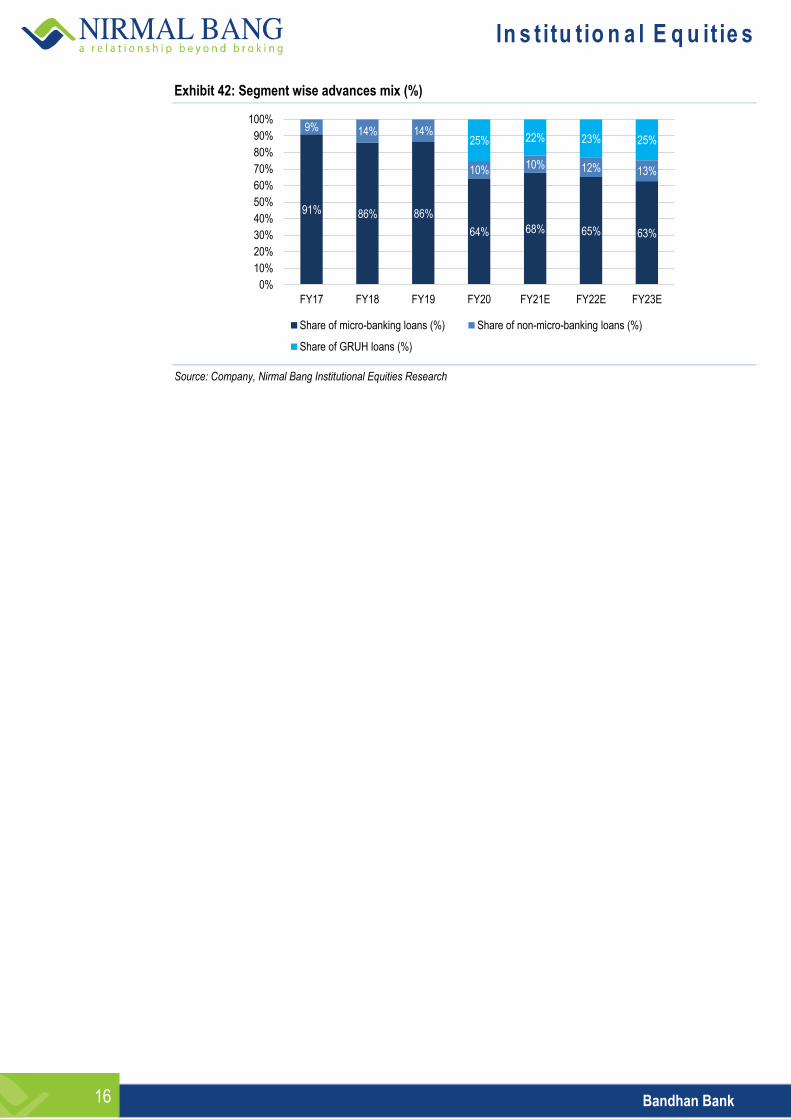
Exhibit 42: Segment wise advances mix (%)
Source: Company, Nirmal Bang Institutional Equities Research
91% 86% 86%
64% 68% 65% 63%
9% 14% 14%
10% 10% 12% 13%
25% 22% 23% 25%
0%
10%
20%
30%
40%
50%
60%
70%
80%
90%
100%
FY17 FY18 FY19 FY20 FY21E FY22E FY23E
Share of micro-banking loans (%) Share of non-micro-banking loans (%)
Share of GRUH loans (%)
In s t itu tio n a l E q u it ie s
Bandhan Bank 17
Vision 2025 – Key highlights
Exhibit 43: To reduce loan book concentration Exhibit 44: To reduce geographic concentration
Source: Company, Nirmal Bang Institutional Equities Research Source: Company, Nirmal Bang Institutional Equities Research
Exhibit 45: Higher engagement with the customer beyond plain-vanilla banking likely to increase switching costs
Source: Company, Nirmal Bang Institutional Equities Research
In s t itu tio n a l E q u it ie s
Bandhan Bank 18
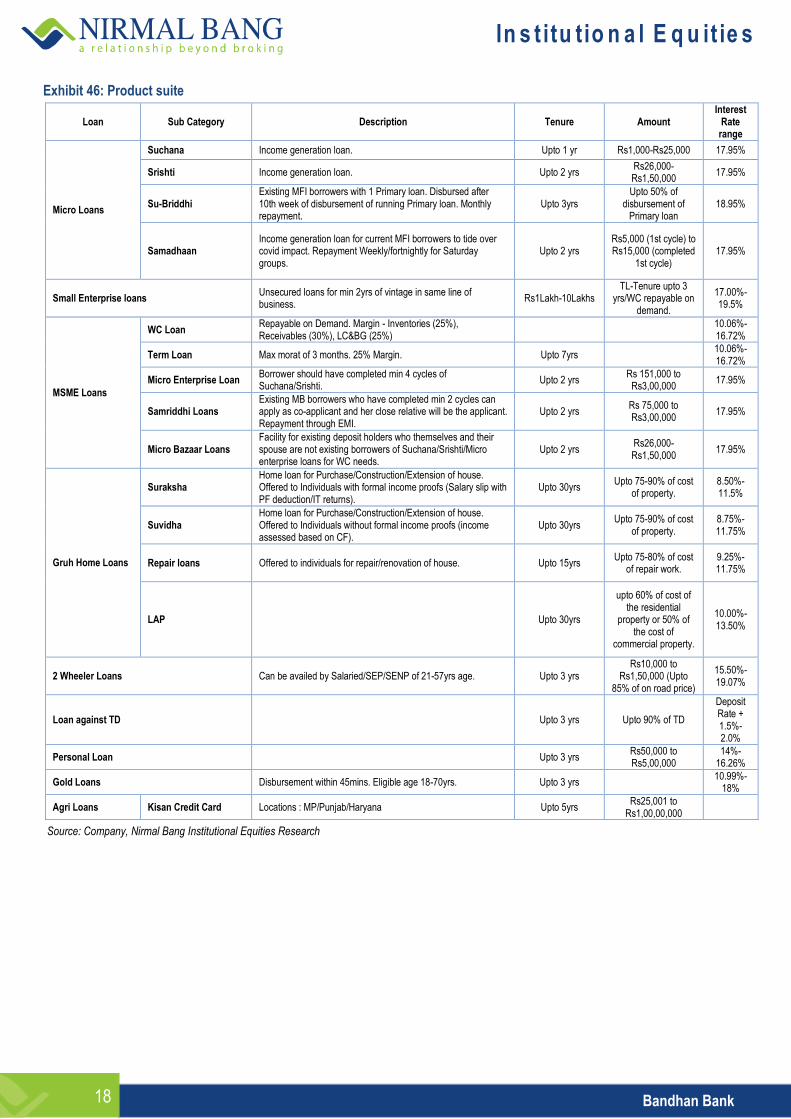
Exhibit 46: Product suite
Loan Sub Category Description Tenure Amount Interest
Rate range
Micro Loans
Suchana Income generation loan. Upto 1 yr Rs1,000-Rs25,000 17.95%
Srishti Income generation loan. Upto 2 yrs Rs26,000-Rs1,50,000
17.95%
Su-Briddhi Existing MFI borrowers with 1 Primary loan. Disbursed after 10th week of disbursement of running Primary loan. Monthly repayment.
Upto 3yrs Upto 50% of
disbursement of Primary loan
18.95%
Samadhaan Income generation loan for current MFI borrowers to tide over covid impact. Repayment Weekly/fortnightly for Saturday groups.
Upto 2 yrs Rs5,000 (1st cycle) to Rs15,000 (completed
1st cycle) 17.95%
Small Enterprise loans Unsecured loans for min 2yrs of vintage in same line of business.
Rs1Lakh-10Lakhs TL-Tenure upto 3
yrs/WC repayable on demand.
17.00%-19.5%
MSME Loans
WC Loan Repayable on Demand. Margin - Inventories (25%), Receivables (30%), LC&BG (25%)
10.06%-16.72%
Term Loan Max morat of 3 months. 25% Margin. Upto 7yrs
10.06%-16.72%
Micro Enterprise Loan Borrower should have completed min 4 cycles of Suchana/Srishti.
Upto 2 yrs Rs 151,000 to
Rs3,00,000 17.95%
Samriddhi Loans Existing MB borrowers who have completed min 2 cycles can apply as co-applicant and her close relative will be the applicant. Repayment through EMI.
Upto 2 yrs Rs 75,000 to Rs3,00,000
17.95%
Micro Bazaar Loans Facility for existing deposit holders who themselves and their spouse are not existing borrowers of Suchana/Srishti/Micro enterprise loans for WC needs.
Upto 2 yrs Rs26,000-Rs1,50,000
17.95%
Gruh Home Loans
Suraksha Home loan for Purchase/Construction/Extension of house. Offered to Individuals with formal income proofs (Salary slip with PF deduction/IT returns).
Upto 30yrs Upto 75-90% of cost
of property. 8.50%-11.5%
Suvidha Home loan for Purchase/Construction/Extension of house. Offered to Individuals without formal income proofs (income assessed based on CF).
Upto 30yrs Upto 75-90% of cost
of property. 8.75%-11.75%
Repair loans Offered to individuals for repair/renovation of house. Upto 15yrs Upto 75-80% of cost
of repair work. 9.25%-11.75%
LAP
Upto 30yrs
upto 60% of cost of the residential
property or 50% of the cost of
commercial property.
10.00%-13.50%
2 Wheeler Loans Can be availed by Salaried/SEP/SENP of 21-57yrs age. Upto 3 yrs Rs10,000 to
Rs1,50,000 (Upto 85% of on road price)
15.50%-19.07%
Loan against TD
Upto 3 yrs Upto 90% of TD
Deposit Rate + 1.5%-2.0%
Personal Loan
Upto 3 yrs Rs50,000 to Rs5,00,000
14%-16.26%
Gold Loans Disbursement within 45mins. Eligible age 18-70yrs. Upto 3 yrs
10.99%-18%
Agri Loans Kisan Credit Card Locations : MP/Punjab/Haryana Upto 5yrs Rs25,001 to
Rs1,00,00,000
Source: Company, Nirmal Bang Institutional Equities Research
In s t itu tio n a l E q u it ie s
Bandhan Bank 19
Predominantly focused on east/north east with a rural/semi-urban orientation
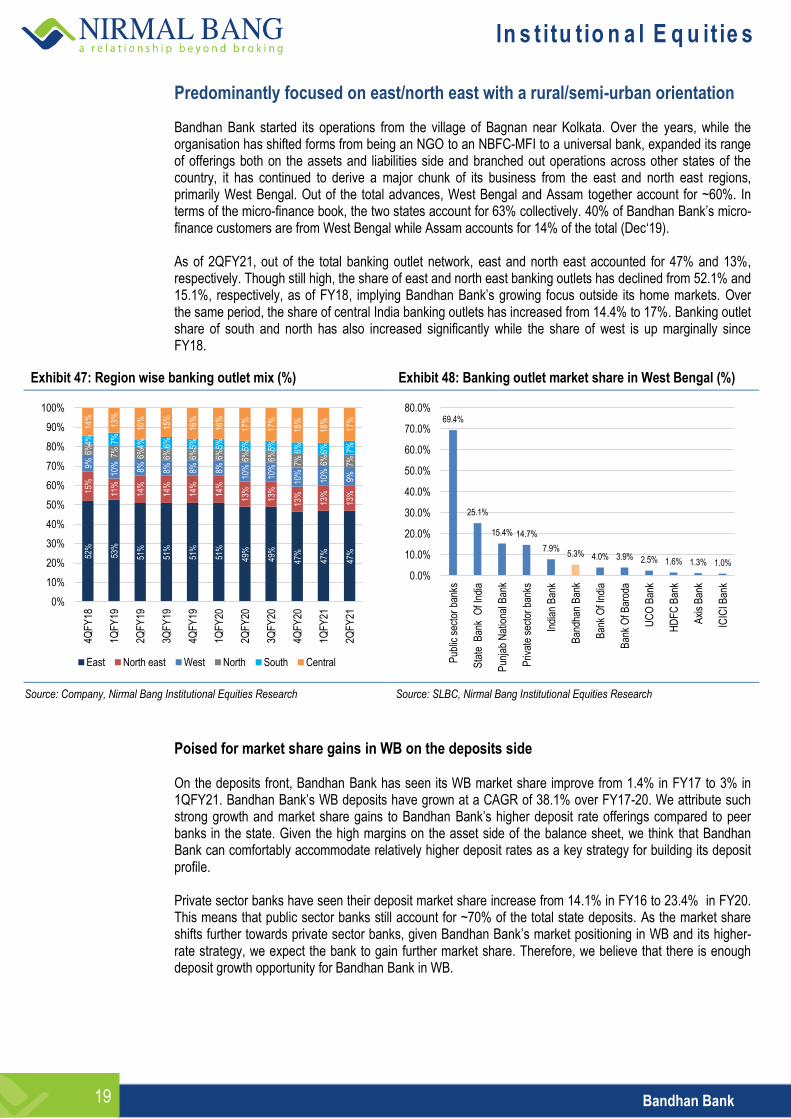
Bandhan Bank started its operations from the village of Bagnan near Kolkata. Over the years, while the organisation has shifted forms from being an NGO to an NBFC-MFI to a universal bank, expanded its range of offerings both on the assets and liabilities side and branched out operations across other states of the country, it has continued to derive a major chunk of its business from the east and north east regions, primarily West Bengal. Out of the total advances, West Bengal and Assam together account for ~60%. In terms of the micro-finance book, the two states account for 63% collectively. 40% of Bandhan Bank’s micro-finance customers are from West Bengal while Assam accounts for 14% of the total (Dec‘19). As of 2QFY21, out of the total banking outlet network, east and north east accounted for 47% and 13%, respectively. Though still high, the share of east and north east banking outlets has declined from 52.1% and 15.1%, respectively, as of FY18, implying Bandhan Bank’s growing focus outside its home markets. Over the same period, the share of central India banking outlets has increased from 14.4% to 17%. Banking outlet share of south and north has also increased significantly while the share of west is up marginally since FY18.
Exhibit 47: Region wise banking outlet mix (%) Exhibit 48: Banking outlet market share in West Bengal (%)
Source: Company, Nirmal Bang Institutional Equities Research Source: SLBC, Nirmal Bang Institutional Equities Research
Poised for market share gains in WB on the deposits side On the deposits front, Bandhan Bank has seen its WB market share improve from 1.4% in FY17 to 3% in 1QFY21. Bandhan Bank’s WB deposits have grown at a CAGR of 38.1% over FY17-20. We attribute such strong growth and market share gains to Bandhan Bank’s higher deposit rate offerings compared to peer banks in the state. Given the high margins on the asset side of the balance sheet, we think that Bandhan Bank can comfortably accommodate relatively higher deposit rates as a key strategy for building its deposit profile. Private sector banks have seen their deposit market share increase from 14.1% in FY16 to 23.4% in FY20. This means that public sector banks still account for ~70% of the total state deposits. As the market share shifts further towards private sector banks, given Bandhan Bank’s market positioning in WB and its higher-rate strategy, we expect the bank to gain further market share. Therefore, we believe that there is enough deposit growth opportunity for Bandhan Bank in WB.
52%
53%
51%
51%
51%
51%
49%
49%
47%
47%
47%
15%
11%
14%
14%
14%
14%
13%
13%
13%
13%
13%
9%
10%
8%
8%
8%
8%
10%
10%
10%
10%
9%
6%
7%
6%
6%
6%
6%
6%
6%
7%
6%
7%
4%
7%
4%
6%
5%
5%
5%
5%
6%
6%
7%
14%
13%
16%
15%
16%
16%
17%
17%
18%
18%
17%
0%
10%
20%
30%
40%
50%
60%
70%
80%
90%
100%
4QF
Y18
1QF
Y19
2QF
Y19
3QF
Y19
4QF
Y19
1QF
Y20
2QF
Y20
3QF
Y20
4QF
Y20
1QF
Y21
2QF
Y21
East North east West North South Central
69.4%
25.1%
15.4% 14.7%
7.9% 5.3% 4.0% 3.9% 2.5% 1.6% 1.3% 1.0%
0.0%
10.0%
20.0%
30.0%
40.0%
50.0%
60.0%
70.0%
80.0%
Pub
lic s
ecto
r ba
nks
Sta
te B
ank
Of I
ndia
Pun
jab
Nat
iona
l Ban
k
Priv
ate
sect
or b
anks
Indi
an B
ank
Ban
dhan
Ban
k
Ban
k O
f Ind
ia
Ban
k O
f Bar
oda
UC
O B
ank
HD
FC
Ban
k
Axi
s B
ank
ICIC
I Ban
k
In s t itu tio n a l E q u it ie s
Bandhan Bank 20
Exhibit 49: Deposits market share in West Bengal (%)
Source: SLBC, Nirmal Bang Institutional Equities Research.
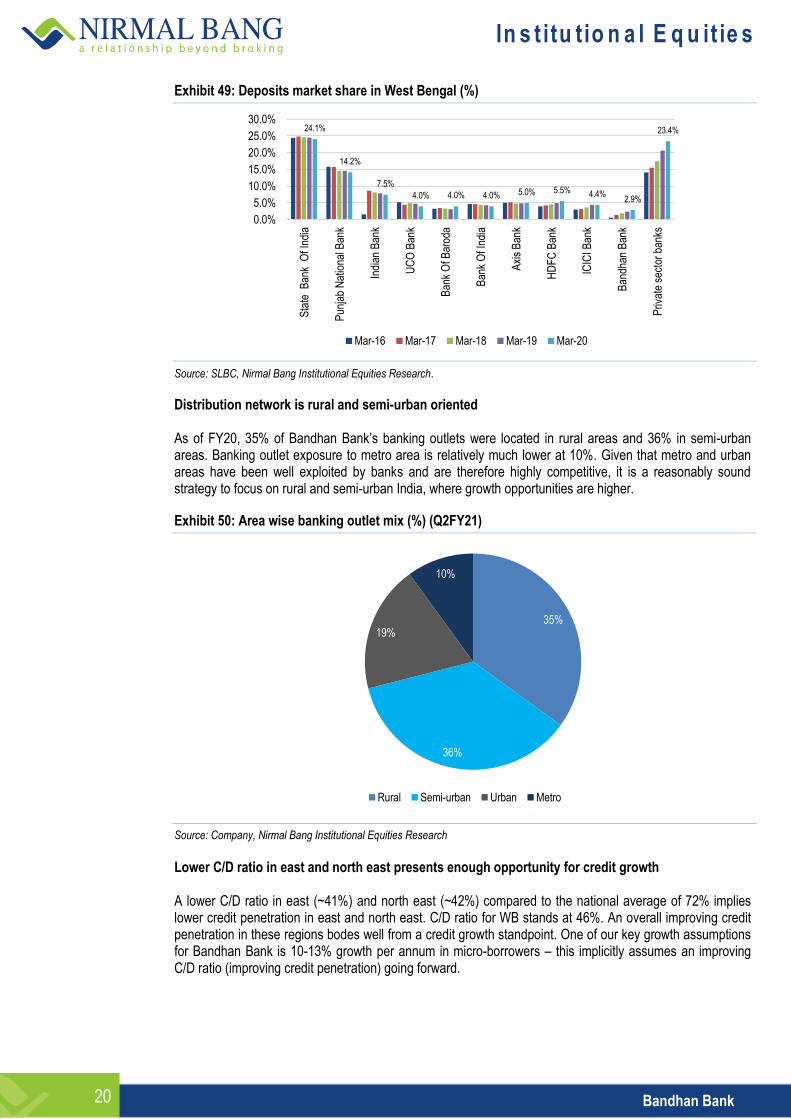
Distribution network is rural and semi-urban oriented As of FY20, 35% of Bandhan Bank’s banking outlets were located in rural areas and 36% in semi-urban areas. Banking outlet exposure to metro area is relatively much lower at 10%. Given that metro and urban areas have been well exploited by banks and are therefore highly competitive, it is a reasonably sound strategy to focus on rural and semi-urban India, where growth opportunities are higher.
Exhibit 50: Area wise banking outlet mix (%) (Q2FY21)
Source: Company, Nirmal Bang Institutional Equities Research
Lower C/D ratio in east and north east presents enough opportunity for credit growth A lower C/D ratio in east (~41%) and north east (~42%) compared to the national average of 72% implies lower credit penetration in east and north east. C/D ratio for WB stands at 46%. An overall improving credit penetration in these regions bodes well from a credit growth standpoint. One of our key growth assumptions for Bandhan Bank is 10-13% growth per annum in micro-borrowers – this implicitly assumes an improving C/D ratio (improving credit penetration) going forward.
24.1%
14.2%
7.5%
4.0% 4.0% 4.0% 5.0% 5.5% 4.4% 2.9%
23.4%
0.0%
5.0%
10.0%
15.0%
20.0%
25.0%
30.0%
Sta
te B
ank
Of I
ndia
Pun
jab
Nat
iona
l Ban
k
Indi
an B
ank
UC
O B
ank
Ban
k O
f Bar
oda
Ban
k O
f Ind
ia
Axi
s B
ank
HD
FC
Ban
k
ICIC
I Ban
k
Ban
dhan
Ban
k
Priv
ate
sect
or b
anks
Mar-16 Mar-17 Mar-18 Mar-19 Mar-20
35%
36%
19%
10%
Rural Semi-urban Urban Metro

In s t itu tio n a l E q u it ie s
Bandhan Bank 21
West Bengal accounts for >40% of the total business
Bandhan Bank’s deposit exposure to West Bengal (WB) is 41.5% (Jun-20) while market share in total state deposits is 3% (Jun-20). In terms of MFI exposure, WB accounts for 47% of the micro-credit advances (Sep-20). Therefore, there is a case for geographic concentration risk. Post GRUH acquisition, this risk has been addressed to some extent. However, the bank still remains susceptible to the state-specific vagaries. Any major adverse development or disruption in the state could have negative implications for Bandhan Bank.
Exhibit 51: Bandhan's share of loans from WB (% of total advances)
Exhibit 52: Bandhan’s share of deposits from WB (%)
Source: SLBC, Nirmal Bang Institutional Equities Research Source: SLBC, Nirmal Bang Institutional Equities Research
Exhibit 53: Bandhan's WB market share (%)
Source: SLBC, Nirmal Bang Institutional Equities Research
62.2%
47.4% 48.9%
35.8% 35.2%
0.0%
10.0%
20.0%
30.0%
40.0%
50.0%
60.0%
Mar-17 Mar-18 Mar-19 Mar-20 Jun-20
39.2% 39.7%
42.6% 42.0% 41.5%
0.0%
10.0%
20.0%
30.0%
40.0%
Mar-17 Mar-18 Mar-19 Mar-20 Jun-20
2.5%
3.0%
3.9%
4.7% 4.9%
1.4%
1.9%
2.4%
2.9% 3.0%
0.0%
1.0%
2.0%
3.0%
4.0%
5.0%
6.0%
Mar-17 Mar-18 Mar-19 Mar-20 Jun-20
Advances Deposits
In s t itu tio n a l E q u it ie s
Bandhan Bank 22
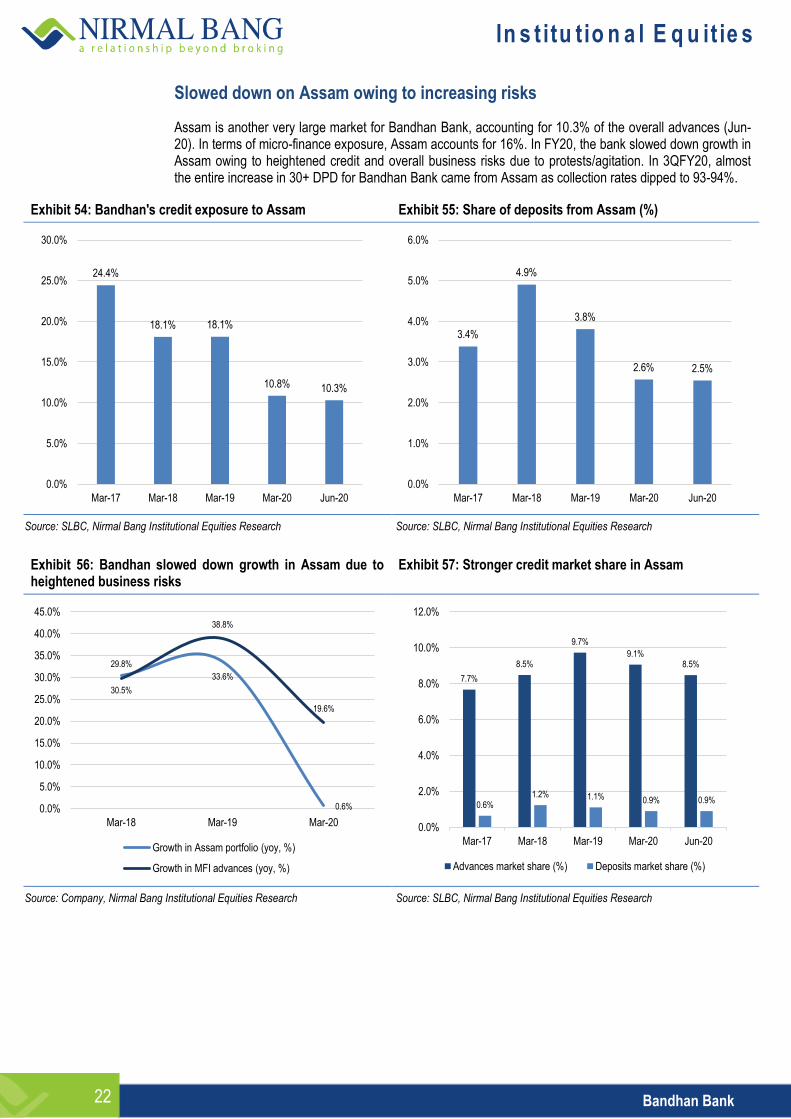
Slowed down on Assam owing to increasing risks
Assam is another very large market for Bandhan Bank, accounting for 10.3% of the overall advances (Jun-20). In terms of micro-finance exposure, Assam accounts for 16%. In FY20, the bank slowed down growth in Assam owing to heightened credit and overall business risks due to protests/agitation. In 3QFY20, almost the entire increase in 30+ DPD for Bandhan Bank came from Assam as collection rates dipped to 93-94%.
Exhibit 54: Bandhan's credit exposure to Assam Exhibit 55: Share of deposits from Assam (%)
Source: SLBC, Nirmal Bang Institutional Equities Research Source: SLBC, Nirmal Bang Institutional Equities Research
Exhibit 56: Bandhan slowed down growth in Assam due to heightened business risks
Exhibit 57: Stronger credit market share in Assam
Source: Company, Nirmal Bang Institutional Equities Research Source: SLBC, Nirmal Bang Institutional Equities Research
24.4%
18.1% 18.1%
10.8% 10.3%
0.0%
5.0%
10.0%
15.0%
20.0%
25.0%
30.0%
Mar-17 Mar-18 Mar-19 Mar-20 Jun-20
3.4%
4.9%
3.8%
2.6% 2.5%
0.0%
1.0%
2.0%
3.0%
4.0%
5.0%
6.0%
Mar-17 Mar-18 Mar-19 Mar-20 Jun-20
30.5%
33.6%
0.6%
29.8%
38.8%
19.6%
0.0%
5.0%
10.0%
15.0%
20.0%
25.0%
30.0%
35.0%
40.0%
45.0%
Mar-18 Mar-19 Mar-20
Growth in Assam portfolio (yoy, %)
Growth in MFI advances (yoy, %)
7.7%
8.5%
9.7%
9.1% 8.5%
0.6% 1.2% 1.1% 0.9% 0.9%
0.0%
2.0%
4.0%
6.0%
8.0%
10.0%
12.0%
Mar-17 Mar-18 Mar-19 Mar-20 Jun-20
Advances market share (%) Deposits market share (%)
In s t itu tio n a l E q u it ie s
Bandhan Bank 23
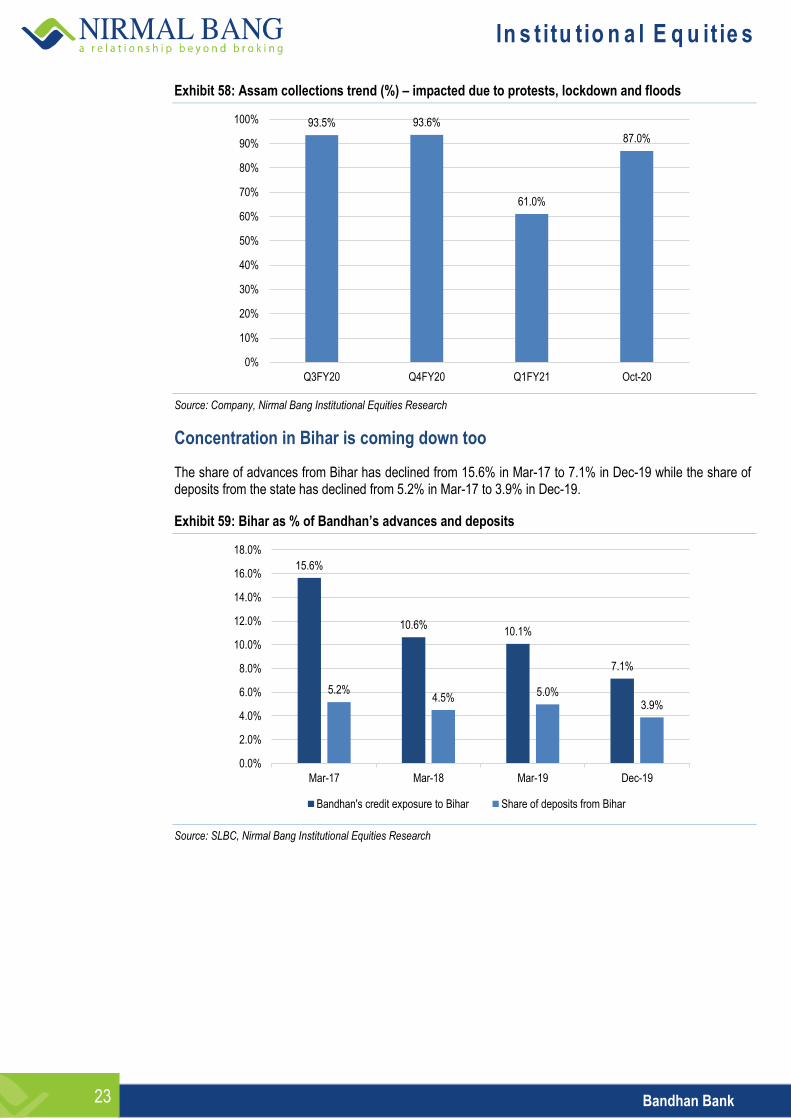
Exhibit 58: Assam collections trend (%) – impacted due to protests, lockdown and floods
Source: Company, Nirmal Bang Institutional Equities Research
Concentration in Bihar is coming down too
The share of advances from Bihar has declined from 15.6% in Mar-17 to 7.1% in Dec-19 while the share of deposits from the state has declined from 5.2% in Mar-17 to 3.9% in Dec-19.
Exhibit 59: Bihar as % of Bandhan’s advances and deposits
Source: SLBC, Nirmal Bang Institutional Equities Research
93.5% 93.6%
61.0%
87.0%
0%
10%
20%
30%
40%
50%
60%
70%
80%
90%
100%
Q3FY20 Q4FY20 Q1FY21 Oct-20
15.6%
10.6% 10.1%
7.1%
5.2% 4.5%
5.0% 3.9%
0.0%
2.0%
4.0%
6.0%
8.0%
10.0%
12.0%
14.0%
16.0%
18.0%
Mar-17 Mar-18 Mar-19 Dec-19
Bandhan's credit exposure to Bihar Share of deposits from Bihar
In s t itu tio n a l E q u it ie s
Bandhan Bank 24
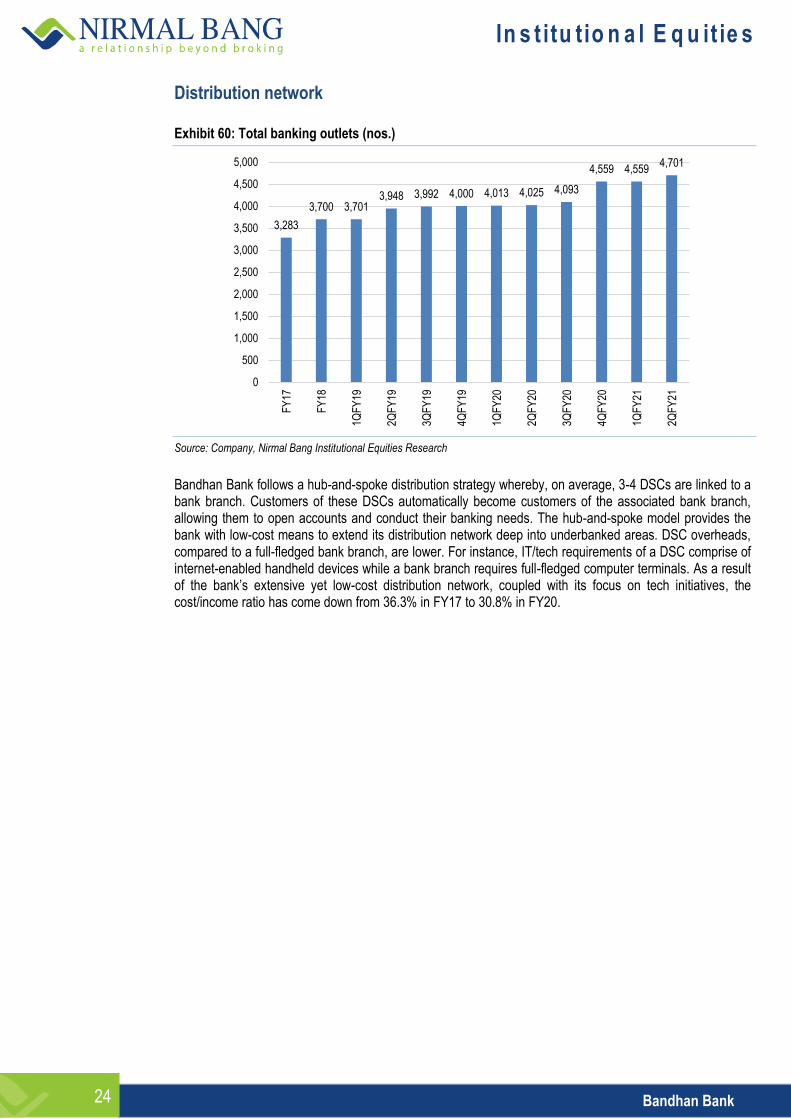
Distribution network
Exhibit 60: Total banking outlets (nos.)
Source: Company, Nirmal Bang Institutional Equities Research
Bandhan Bank follows a hub-and-spoke distribution strategy whereby, on average, 3-4 DSCs are linked to a bank branch. Customers of these DSCs automatically become customers of the associated bank branch, allowing them to open accounts and conduct their banking needs. The hub-and-spoke model provides the bank with low-cost means to extend its distribution network deep into underbanked areas. DSC overheads, compared to a full-fledged bank branch, are lower. For instance, IT/tech requirements of a DSC comprise of internet-enabled handheld devices while a bank branch requires full-fledged computer terminals. As a result of the bank’s extensive yet low-cost distribution network, coupled with its focus on tech initiatives, the cost/income ratio has come down from 36.3% in FY17 to 30.8% in FY20.
3,283
3,700 3,701 3,948 3,992 4,000 4,013 4,025 4,093
4,559 4,559 4,701
0
500
1,000
1,500
2,000
2,500
3,000
3,500
4,000
4,500
5,000
FY
17
FY
18
1QF
Y19
2QF
Y19
3QF
Y19
4QF
Y19
1QF
Y20
2QF
Y20
3QF
Y20
4QF
Y20
1QF
Y21
2QF
Y21
In s t itu tio n a l E q u it ie s
Bandhan Bank 25
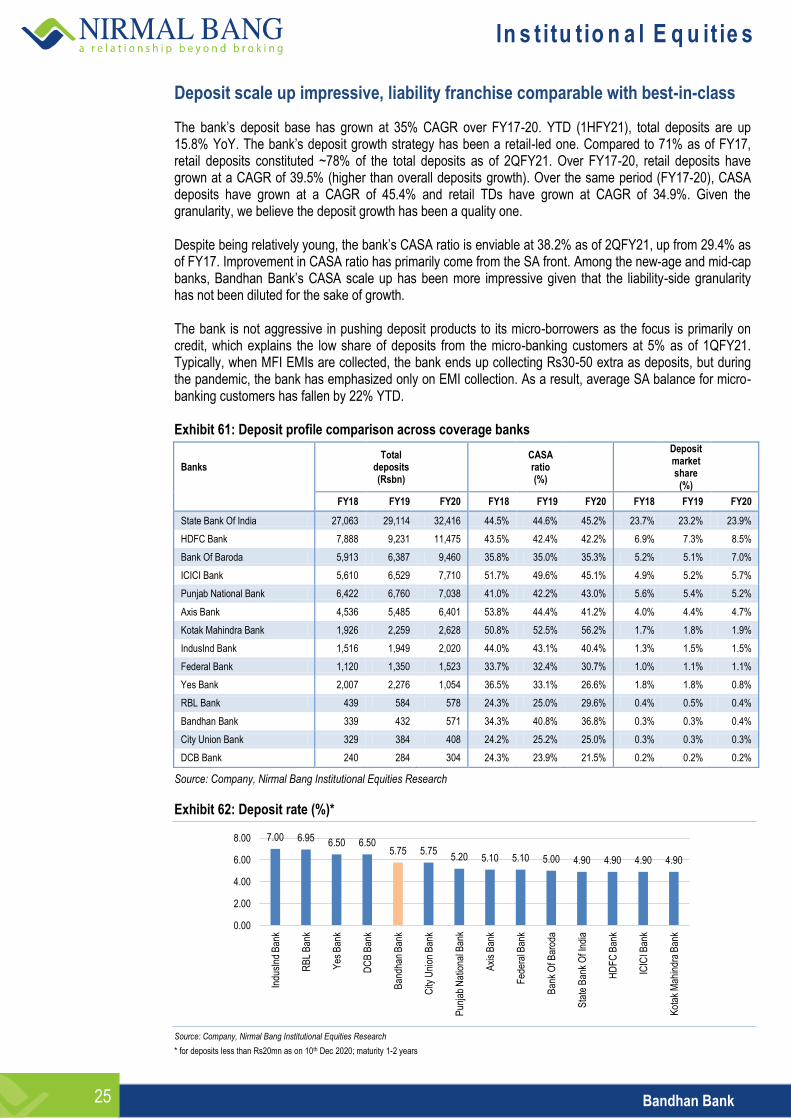
Deposit scale up impressive, liability franchise comparable with best-in-class
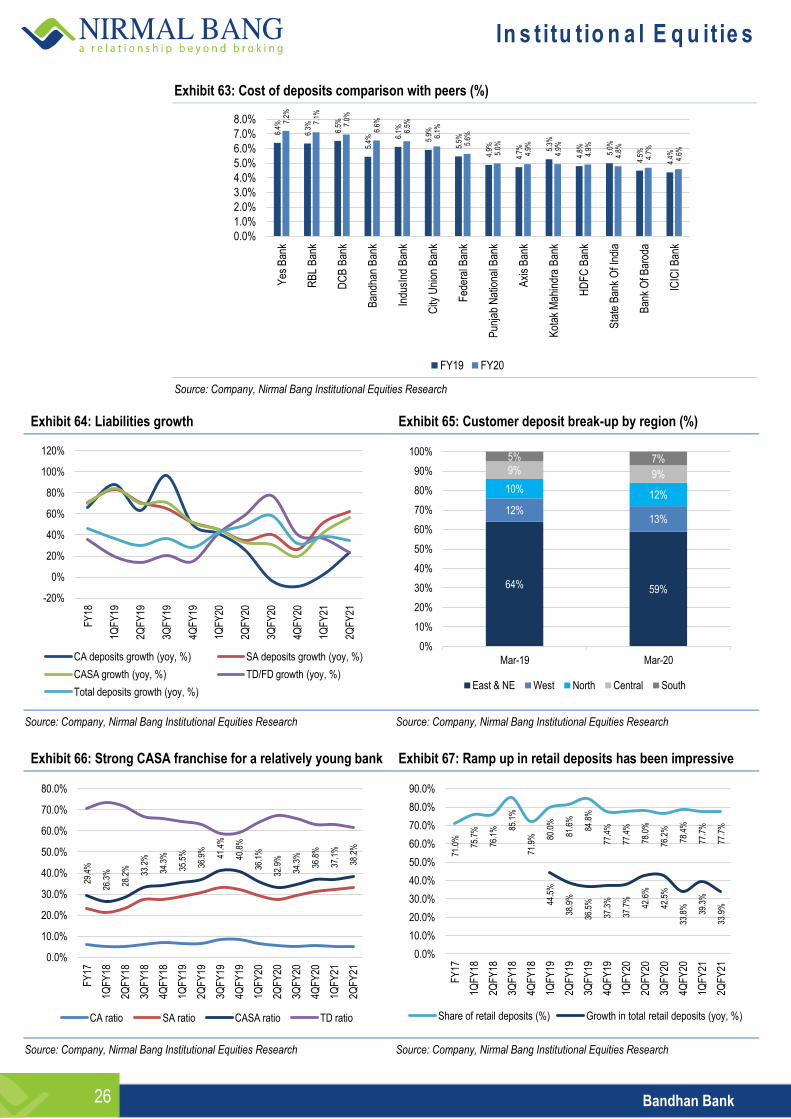
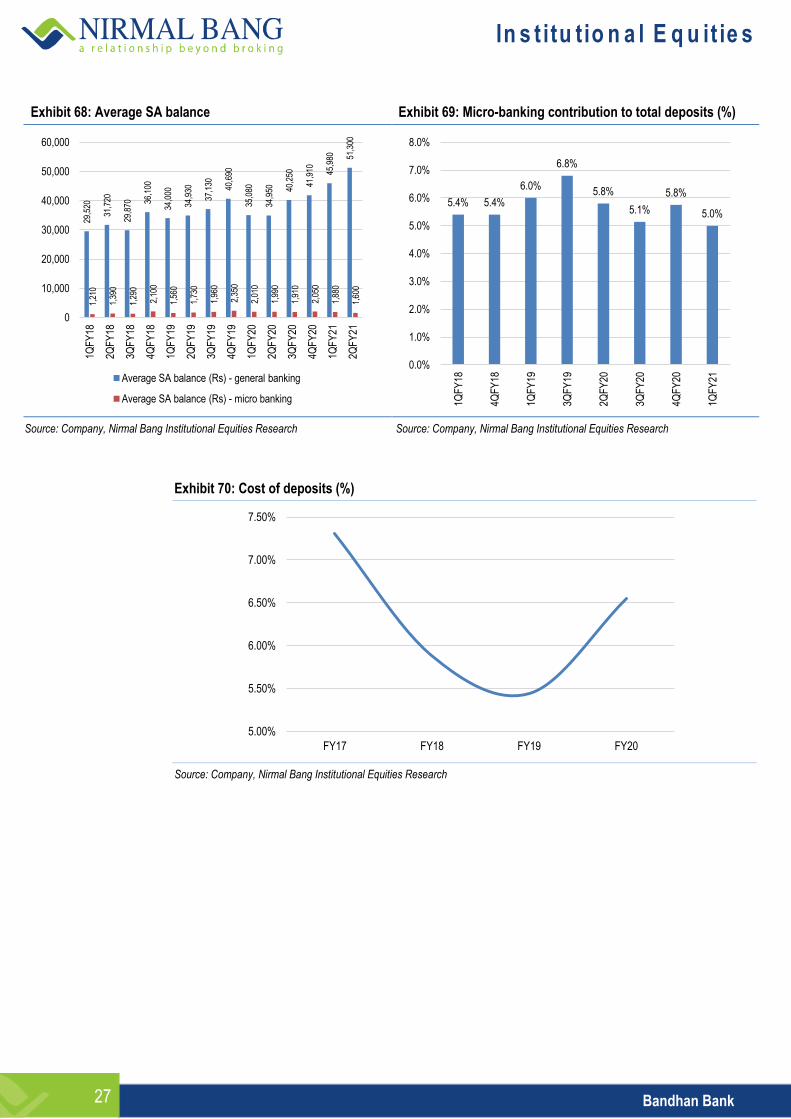
The bank’s deposit base has grown at 35% CAGR over FY17-20. YTD (1HFY21), total deposits are up 15.8% YoY. The bank’s deposit growth strategy has been a retail-led one. Compared to 71% as of FY17, retail deposits constituted ~78% of the total deposits as of 2QFY21. Over FY17-20, retail deposits have grown at a CAGR of 39.5% (higher than overall deposits growth). Over the same period (FY17-20), CASA deposits have grown at a CAGR of 45.4% and retail TDs have grown at CAGR of 34.9%. Given the granularity, we believe the deposit growth has been a quality one. Despite being relatively young, the bank’s CASA ratio is enviable at 38.2% as of 2QFY21, up from 29.4% as of FY17. Improvement in CASA ratio has primarily come from the SA front. Among the new-age and mid-cap banks, Bandhan Bank’s CASA scale up has been more impressive given that the liability-side granularity has not been diluted for the sake of growth. The bank is not aggressive in pushing deposit products to its micro-borrowers as the focus is primarily on credit, which explains the low share of deposits from the micro-banking customers at 5% as of 1QFY21. Typically, when MFI EMIs are collected, the bank ends up collecting Rs30-50 extra as deposits, but during the pandemic, the bank has emphasized only on EMI collection. As a result, average SA balance for micro-banking customers has fallen by 22% YTD. Exhibit 61: Deposit profile comparison across coverage banks
Banks
Total deposits (Rsbn)
CASA ratio (%)
Deposit market share
(%)
FY18 FY19 FY20 FY18 FY19 FY20 FY18 FY19 FY20
State Bank Of India 27,063 29,114 32,416 44.5% 44.6% 45.2% 23.7% 23.2% 23.9%
HDFC Bank 7,888 9,231 11,475 43.5% 42.4% 42.2% 6.9% 7.3% 8.5%
Bank Of Baroda 5,913 6,387 9,460 35.8% 35.0% 35.3% 5.2% 5.1% 7.0%
ICICI Bank 5,610 6,529 7,710 51.7% 49.6% 45.1% 4.9% 5.2% 5.7%
Punjab National Bank 6,422 6,760 7,038 41.0% 42.2% 43.0% 5.6% 5.4% 5.2%
Axis Bank 4,536 5,485 6,401 53.8% 44.4% 41.2% 4.0% 4.4% 4.7%
Kotak Mahindra Bank 1,926 2,259 2,628 50.8% 52.5% 56.2% 1.7% 1.8% 1.9%
IndusInd Bank 1,516 1,949 2,020 44.0% 43.1% 40.4% 1.3% 1.5% 1.5%
Federal Bank 1,120 1,350 1,523 33.7% 32.4% 30.7% 1.0% 1.1% 1.1%
Yes Bank 2,007 2,276 1,054 36.5% 33.1% 26.6% 1.8% 1.8% 0.8%
RBL Bank 439 584 578 24.3% 25.0% 29.6% 0.4% 0.5% 0.4%
Bandhan Bank 339 432 571 34.3% 40.8% 36.8% 0.3% 0.3% 0.4%
City Union Bank 329 384 408 24.2% 25.2% 25.0% 0.3% 0.3% 0.3%
DCB Bank 240 284 304 24.3% 23.9% 21.5% 0.2% 0.2% 0.2%
Source: Company, Nirmal Bang Institutional Equities Research
Exhibit 62: Deposit rate (%)*
Source: Company, Nirmal Bang Institutional Equities Research
* for deposits less than Rs20mn as on 10th Dec 2020; maturity 1-2 years
7.00 6.95 6.50 6.50 5.75 5.75
5.20 5.10 5.10 5.00 4.90 4.90 4.90 4.90
0.00
2.00
4.00
6.00
8.00
Indu
sInd
Ban
k
RB
L B
ank
Yes
Ban
k
DC
B B
ank
Ban
dhan
Ban
k
City
Uni
on B
ank
Pun
jab
Nat
iona
l Ban
k
Axi
s B
ank
Fed
eral
Ban
k
Ban
k O
f Bar
oda
Sta
te B
ank
Of I
ndia
HD
FC
Ban
k
ICIC
I Ban
k
Kot
ak M
ahin
dra
Ban
k
In s t itu tio n a l E q u it ie s
Bandhan Bank 26
Exhibit 63: Cost of deposits comparison with peers (%)
Source: Company, Nirmal Bang Institutional Equities Research
Exhibit 64: Liabilities growth Exhibit 65: Customer deposit break-up by region (%)
Source: Company, Nirmal Bang Institutional Equities Research Source: Company, Nirmal Bang Institutional Equities Research
Exhibit 66: Strong CASA franchise for a relatively young bank Exhibit 67: Ramp up in retail deposits has been impressive
Source: Company, Nirmal Bang Institutional Equities Research Source: Company, Nirmal Bang Institutional Equities Research
6.4%
6.3%
6.5%
5.4%
6.1%
5.9%
5.5%
4.9%
4.7%
5.3%
4.8%
5.0%
4.5%
4.4%
7.2%
7.1%
7.0%
6.6%
6.5%
6.1%
5.6%
5.0%
4.9%
4.9%
4.9%
4.8%
4.7%
4.6%
0.0%
1.0%
2.0%
3.0%
4.0%
5.0%
6.0%
7.0%
8.0%
Yes
Ban
k
RB
L B
ank
DC
B B
ank
Ban
dhan
Ban
k
Indu
sInd
Ban
k
City
Uni
on B
ank
Fed
eral
Ban
k
Pun
jab
Nat
iona
l Ban
k
Axi
s B
ank
Kot
ak M
ahin
dra
Ban
k
HD
FC
Ban
k
Sta
te B
ank
Of I
ndia
Ban
k O
f Bar
oda
ICIC
I Ban
k
FY19 FY20
-20%
0%
20%
40%
60%
80%
100%
120%
FY
18
1QF
Y19
2QF
Y19
3QF
Y19
4QF
Y19
1QF
Y20
2QF
Y20
3QF
Y20
4QF
Y20
1QF
Y21
2QF
Y21
CA deposits growth (yoy, %) SA deposits growth (yoy, %)
CASA growth (yoy, %) TD/FD growth (yoy, %)
Total deposits growth (yoy, %)
64% 59%
12% 13%
10% 12%
9% 9%
5% 7%
0%
10%
20%
30%
40%
50%
60%
70%
80%
90%
100%
Mar-19 Mar-20
East & NE West North Central South
29.4
%
26.3
%
28.2
%
33.2
%
34.3
%
35.5
%
36.9
%
41.4
%
40.8
%
36.1
%
32.9
%
34.3
%
36.8
%
37.1
%
38.2
%
0.0%
10.0%
20.0%
30.0%
40.0%
50.0%
60.0%
70.0%
80.0%
FY
17
1QF
Y18
2QF
Y18
3QF
Y18
4QF
Y18
1QF
Y19
2QF
Y19
3QF
Y19
4QF
Y19
1QF
Y20
2QF
Y20
3QF
Y20
4QF
Y20
1QF
Y21
2QF
Y21
CA ratio SA ratio CASA ratio TD ratio
71.0
%
75.7
%
76.1
%
85.1
%
71.9
%
80.0
%
81.6
%
84.8
%
77.4
%
77.4
%
78.0
%
76.2
%
78.4
%
77.7
%
77.7
%
44.5
%
38.9
%
36.5
%
37.3
%
37.7
%
42.6
%
42.5
%
33.8
%
39.3
%
33.9
%
0.0%
10.0%
20.0%
30.0%
40.0%
50.0%
60.0%
70.0%
80.0%
90.0%
FY
17
1QF
Y18
2QF
Y18
3QF
Y18
4QF
Y18
1QF
Y19
2QF
Y19
3QF
Y19
4QF
Y19
1QF
Y20
2QF
Y20
3QF
Y20
4QF
Y20
1QF
Y21
2QF
Y21
Share of retail deposits (%) Growth in total retail deposits (yoy, %)
In s t itu tio n a l E q u it ie s
Bandhan Bank 27
Exhibit 68: Average SA balance Exhibit 69: Micro-banking contribution to total deposits (%)
Source: Company, Nirmal Bang Institutional Equities Research Source: Company, Nirmal Bang Institutional Equities Research
Exhibit 70: Cost of deposits (%)
Source: Company, Nirmal Bang Institutional Equities Research
29,5
20
31,7
20
29,8
70
36,1
00
34,0
00
34,9
30
37,1
30
40,6
90
35,0
80
34,9
50
40,2
50
41,9
10
45,9
80
51,3
00
1,21
0
1,39
0
1,29
0
2,10
0
1,56
0
1,73
0
1,96
0
2,35
0
2,01
0
1,99
0
1,91
0
2,05
0
1,88
0
1,60
0
0
10,000
20,000
30,000
40,000
50,000
60,000
1QF
Y18
2QF
Y18
3QF
Y18
4QF
Y18
1QF
Y19
2QF
Y19
3QF
Y19
4QF
Y19
1QF
Y20
2QF
Y20
3QF
Y20
4QF
Y20
1QF
Y21
2QF
Y21
Average SA balance (Rs) - general banking
Average SA balance (Rs) - micro banking
5.4% 5.4%
6.0%
6.8%
5.8%
5.1%
5.8%
5.0%
0.0%
1.0%
2.0%
3.0%
4.0%
5.0%
6.0%
7.0%
8.0%
1QF
Y18
4QF
Y18
1QF
Y19
3QF
Y19
2QF
Y20
3QF
Y20
4QF
Y20
1QF
Y21
5.00%
5.50%
6.00%
6.50%
7.00%
7.50%
FY17 FY18 FY19 FY20

In s t itu tio n a l E q u it ie s
Bandhan Bank 28
Higher growth in non-MFI to lead to NIM compression
Over FY17-20, the NII has grown at a CAGR of 38% compared to a CAGR of 58% in overall loans. As of FY17, the share of high-margin micro-finance business was 91% but has since declined to 64% as of FY20. Accordingly, over the same period, NIMs have declined by 112bps. Despite a sharp decline in the share of micro-finance loans, NIM compression has to some extent been cushioned by the decline in cost of deposits. Given that the share of micro-finance is expected to decline further, we expect blended NIM to compress going forward. We expect 86bps compression in NIMs over FY20-23E and 116bps over the next 5 years (by FY25E). Even though we expect the overall cost of funds to improve over our forecast period, yield compression is likely to be higher on account of higher growth in the bank’s non-micro finance portfolio.
Exhibit 71: NIM (%)
Source: Company, Nirmal Bang Institutional Equities Research
9.79%
8.27%
9.07%
8.67%
7.98% 7.99%
7.81%
7.50%
8.00%
8.50%
9.00%
9.50%
10.00%
FY17 FY18 FY19 FY20 FY21E FY22E FY23E
In s t itu tio n a l E q u it ie s
Bandhan Bank 29
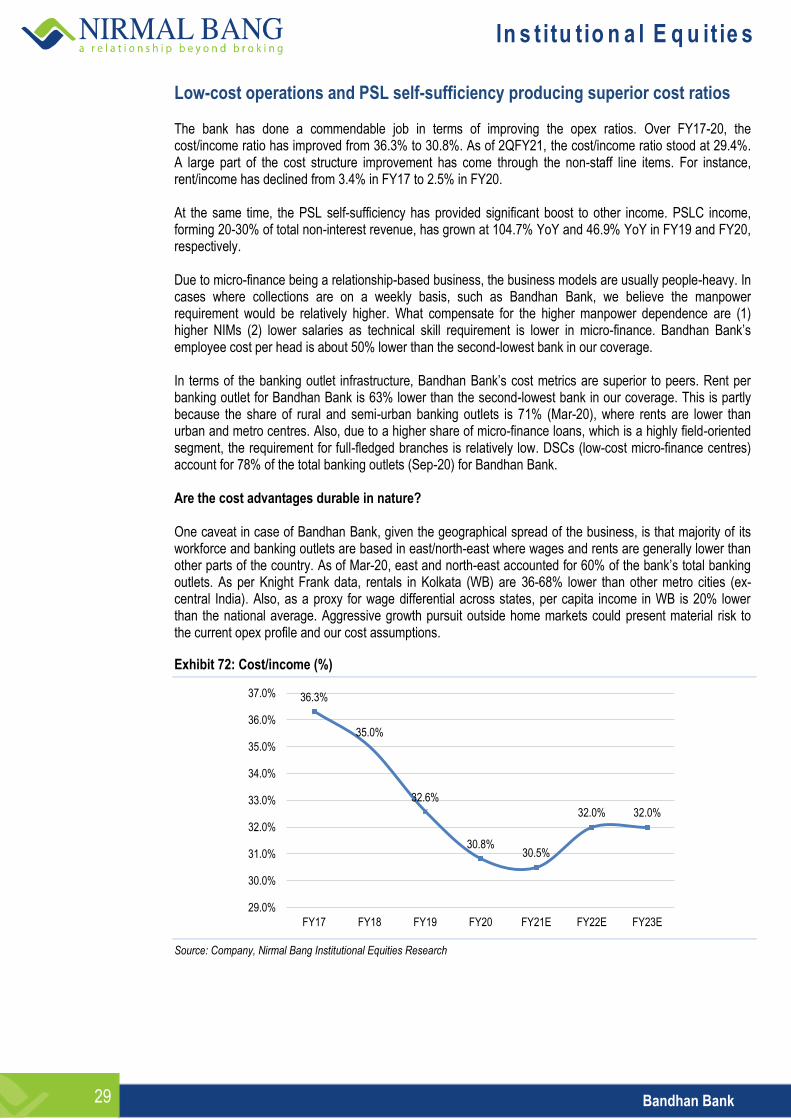
Low-cost operations and PSL self-sufficiency producing superior cost ratios
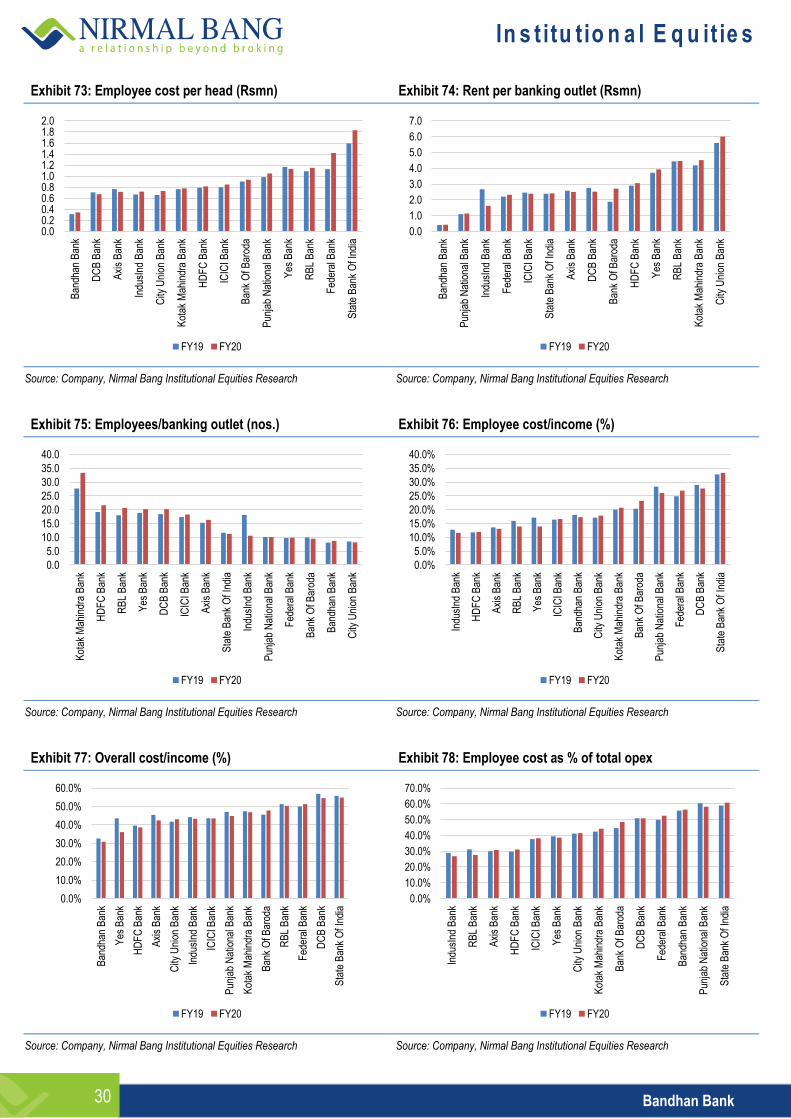
The bank has done a commendable job in terms of improving the opex ratios. Over FY17-20, the cost/income ratio has improved from 36.3% to 30.8%. As of 2QFY21, the cost/income ratio stood at 29.4%. A large part of the cost structure improvement has come through the non-staff line items. For instance, rent/income has declined from 3.4% in FY17 to 2.5% in FY20. At the same time, the PSL self-sufficiency has provided significant boost to other income. PSLC income, forming 20-30% of total non-interest revenue, has grown at 104.7% YoY and 46.9% YoY in FY19 and FY20, respectively. Due to micro-finance being a relationship-based business, the business models are usually people-heavy. In cases where collections are on a weekly basis, such as Bandhan Bank, we believe the manpower requirement would be relatively higher. What compensate for the higher manpower dependence are (1) higher NIMs (2) lower salaries as technical skill requirement is lower in micro-finance. Bandhan Bank’s employee cost per head is about 50% lower than the second-lowest bank in our coverage. In terms of the banking outlet infrastructure, Bandhan Bank’s cost metrics are superior to peers. Rent per banking outlet for Bandhan Bank is 63% lower than the second-lowest bank in our coverage. This is partly because the share of rural and semi-urban banking outlets is 71% (Mar-20), where rents are lower than urban and metro centres. Also, due to a higher share of micro-finance loans, which is a highly field-oriented segment, the requirement for full-fledged branches is relatively low. DSCs (low-cost micro-finance centres) account for 78% of the total banking outlets (Sep-20) for Bandhan Bank. Are the cost advantages durable in nature? One caveat in case of Bandhan Bank, given the geographical spread of the business, is that majority of its workforce and banking outlets are based in east/north-east where wages and rents are generally lower than other parts of the country. As of Mar-20, east and north-east accounted for 60% of the bank’s total banking outlets. As per Knight Frank data, rentals in Kolkata (WB) are 36-68% lower than other metro cities (ex-central India). Also, as a proxy for wage differential across states, per capita income in WB is 20% lower than the national average. Aggressive growth pursuit outside home markets could present material risk to the current opex profile and our cost assumptions.
Exhibit 72: Cost/income (%)
Source: Company, Nirmal Bang Institutional Equities Research
36.3%
35.0%
32.6%
30.8% 30.5%
32.0% 32.0%
29.0%
30.0%
31.0%
32.0%
33.0%
34.0%
35.0%
36.0%
37.0%
FY17 FY18 FY19 FY20 FY21E FY22E FY23E
In s t itu tio n a l E q u it ie s
Bandhan Bank 30
Exhibit 73: Employee cost per head (Rsmn) Exhibit 74: Rent per banking outlet (Rsmn)
Source: Company, Nirmal Bang Institutional Equities Research Source: Company, Nirmal Bang Institutional Equities Research
Exhibit 75: Employees/banking outlet (nos.) Exhibit 76: Employee cost/income (%)
Source: Company, Nirmal Bang Institutional Equities Research Source: Company, Nirmal Bang Institutional Equities Research
Exhibit 77: Overall cost/income (%) Exhibit 78: Employee cost as % of total opex
Source: Company, Nirmal Bang Institutional Equities Research Source: Company, Nirmal Bang Institutional Equities Research
0.0 0.2 0.4 0.6 0.8 1.0 1.2 1.4 1.6 1.8 2.0
Ban
dhan
Ban
k
DC
B B
ank
Axi
s B
ank
Indu
sInd
Ban
k
City
Uni
on B
ank
Kot
ak M
ahin
dra
Ban
k
HD
FC
Ban
k
ICIC
I Ban
k
Ban
k O
f Bar
oda
Pun
jab
Nat
iona
l Ban
k
Yes
Ban
k
RB
L B
ank
Fed
eral
Ban
k
Sta
te B
ank
Of I
ndia
FY19 FY20
0.0
1.0
2.0
3.0
4.0
5.0
6.0
7.0
Ban
dhan
Ban
k
Pun
jab
Nat
iona
l Ban
k
Indu
sInd
Ban
k
Fed
eral
Ban
k
ICIC
I Ban
k
Sta
te B
ank
Of I
ndia
Axi
s B
ank
DC
B B
ank
Ban
k O
f Bar
oda
HD
FC
Ban
k
Yes
Ban
k
RB
L B
ank
Kot
ak M
ahin
dra
Ban
k
City
Uni
on B
ank
FY19 FY20
0.0
5.0
10.0
15.0
20.0
25.0
30.0
35.0
40.0
Kot
ak M
ahin
dra
Ban
k
HD
FC
Ban
k
RB
L B
ank
Yes
Ban
k
DC
B B
ank
ICIC
I Ban
k
Axi
s B
ank
Sta
te B
ank
Of I
ndia
Indu
sInd
Ban
k
Pun
jab
Nat
iona
l Ban
k
Fed
eral
Ban
k
Ban
k O
f Bar
oda
Ban
dhan
Ban
k
City
Uni
on B
ank
FY19 FY20
0.0%
5.0%
10.0%
15.0%
20.0%
25.0%
30.0%
35.0%
40.0% In
dusI
nd B
ank
HD
FC
Ban
k
Axi
s B
ank
RB
L B
ank
Yes
Ban
k
ICIC
I Ban
k
Ban
dhan
Ban
k
City
Uni
on B
ank
Kot
ak M
ahin
dra
Ban
k
Ban
k O
f Bar
oda
Pun
jab
Nat
iona
l Ban
k
Fed
eral
Ban
k
DC
B B
ank
Sta
te B
ank
Of I
ndia
FY19 FY20
0.0%
10.0%
20.0%
30.0%
40.0%
50.0%
60.0%
Ban
dhan
Ban
k
Yes
Ban
k
HD
FC
Ban
k
Axi
s B
ank
City
Uni
on B
ank
Indu
sInd
Ban
k
ICIC
I Ban
k
Pun
jab
Nat
iona
l Ban
k
Kot
ak M
ahin
dra
Ban
k
Ban
k O
f Bar
oda
RB
L B
ank
Fed
eral
Ban
k
DC
B B
ank
Sta
te B
ank
Of I
ndia
FY19 FY20
0.0%
10.0%
20.0%
30.0%
40.0%
50.0%
60.0%
70.0%
Indu
sInd
Ban
k
RB
L B
ank
Axi
s B
ank
HD
FC
Ban
k
ICIC
I Ban
k
Yes
Ban
k
City
Uni
on B
ank
Kot
ak M
ahin
dra
Ban
k
Ban
k O
f Bar
oda
DC
B B
ank
Fed
eral
Ban
k
Ban
dhan
Ban
k
Pun
jab
Nat
iona
l Ban
k
Sta
te B
ank
Of I
ndia
FY19 FY20
In s t itu tio n a l E q u it ie s
Bandhan Bank 31
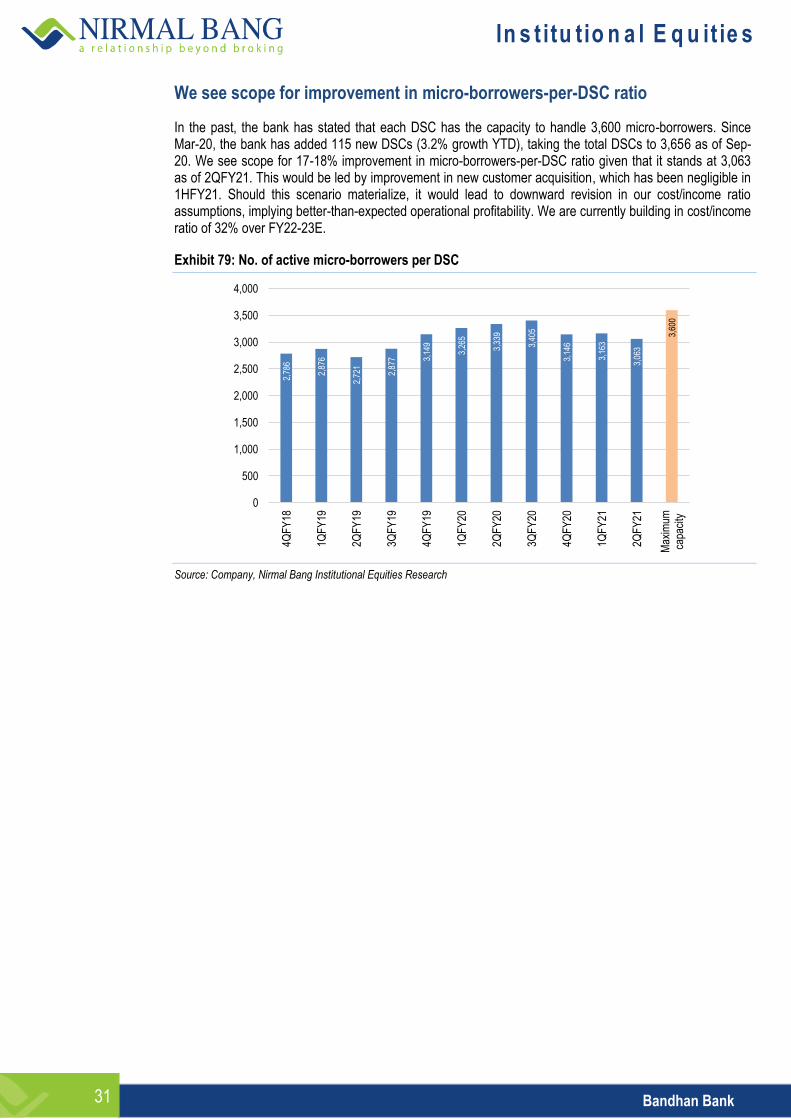
We see scope for improvement in micro-borrowers-per-DSC ratio
In the past, the bank has stated that each DSC has the capacity to handle 3,600 micro-borrowers. Since Mar-20, the bank has added 115 new DSCs (3.2% growth YTD), taking the total DSCs to 3,656 as of Sep-20. We see scope for 17-18% improvement in micro-borrowers-per-DSC ratio given that it stands at 3,063 as of 2QFY21. This would be led by improvement in new customer acquisition, which has been negligible in 1HFY21. Should this scenario materialize, it would lead to downward revision in our cost/income ratio assumptions, implying better-than-expected operational profitability. We are currently building in cost/income ratio of 32% over FY22-23E.
Exhibit 79: No. of active micro-borrowers per DSC
Source: Company, Nirmal Bang Institutional Equities Research
2,78
6
2,87
6
2,72
1
2,87
7 3,14
9
3,26
5
3,33
9
3,40
5
3,14
6
3,16
3
3,06
3
3,60
0
0
500
1,000
1,500
2,000
2,500
3,000
3,500
4,000 4Q
FY
18
1QF
Y19
2QF
Y19
3QF
Y19
4QF
Y19
1QF
Y20
2QF
Y20
3QF
Y20
4QF
Y20
1QF
Y21
2QF
Y21
Max
imum
ca
paci
ty
In s t itu tio n a l E q u it ie s
Bandhan Bank 32
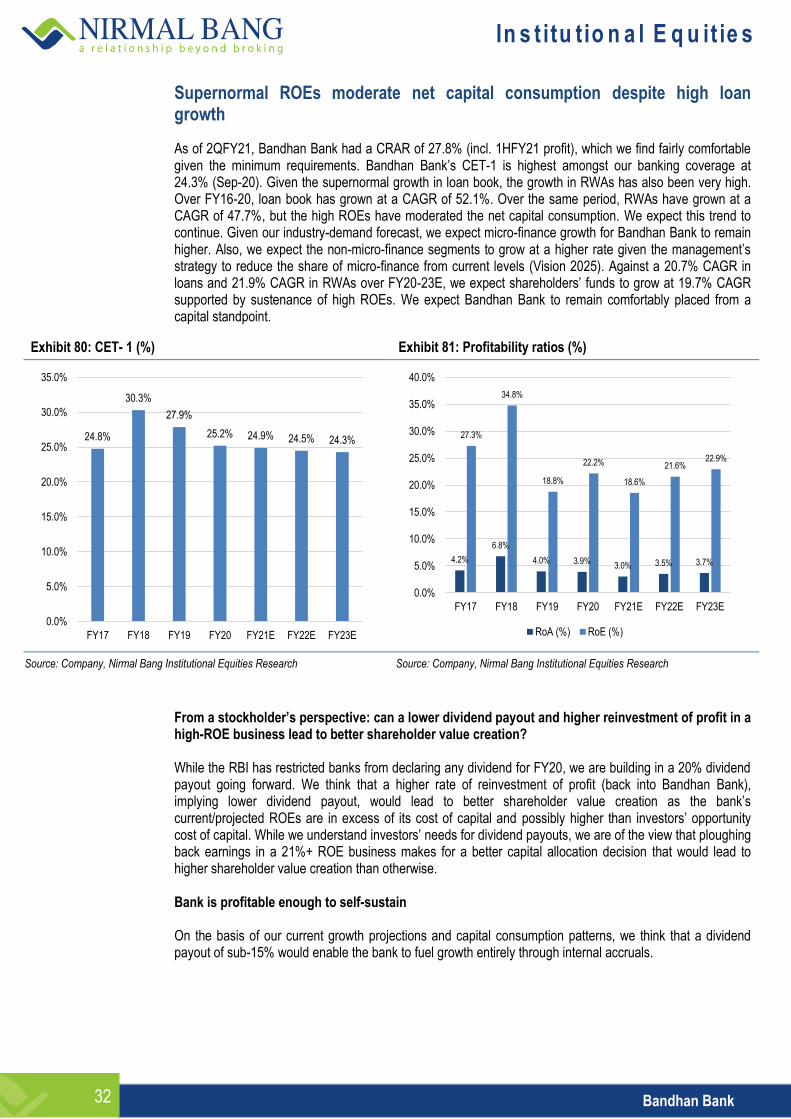
Supernormal ROEs moderate net capital consumption despite high loan growth
As of 2QFY21, Bandhan Bank had a CRAR of 27.8% (incl. 1HFY21 profit), which we find fairly comfortable given the minimum requirements. Bandhan Bank’s CET-1 is highest amongst our banking coverage at 24.3% (Sep-20). Given the supernormal growth in loan book, the growth in RWAs has also been very high. Over FY16-20, loan book has grown at a CAGR of 52.1%. Over the same period, RWAs have grown at a CAGR of 47.7%, but the high ROEs have moderated the net capital consumption. We expect this trend to continue. Given our industry-demand forecast, we expect micro-finance growth for Bandhan Bank to remain higher. Also, we expect the non-micro-finance segments to grow at a higher rate given the management’s strategy to reduce the share of micro-finance from current levels (Vision 2025). Against a 20.7% CAGR in loans and 21.9% CAGR in RWAs over FY20-23E, we expect shareholders’ funds to grow at 19.7% CAGR supported by sustenance of high ROEs. We expect Bandhan Bank to remain comfortably placed from a capital standpoint.
Exhibit 80: CET- 1 (%) Exhibit 81: Profitability ratios (%)
Source: Company, Nirmal Bang Institutional Equities Research Source: Company, Nirmal Bang Institutional Equities Research
From a stockholder’s perspective: can a lower dividend payout and higher reinvestment of profit in a high-ROE business lead to better shareholder value creation? While the RBI has restricted banks from declaring any dividend for FY20, we are building in a 20% dividend payout going forward. We think that a higher rate of reinvestment of profit (back into Bandhan Bank), implying lower dividend payout, would lead to better shareholder value creation as the bank’s current/projected ROEs are in excess of its cost of capital and possibly higher than investors’ opportunity cost of capital. While we understand investors’ needs for dividend payouts, we are of the view that ploughing back earnings in a 21%+ ROE business makes for a better capital allocation decision that would lead to higher shareholder value creation than otherwise. Bank is profitable enough to self-sustain On the basis of our current growth projections and capital consumption patterns, we think that a dividend payout of sub-15% would enable the bank to fuel growth entirely through internal accruals.
24.8%
30.3%
27.9%
25.2% 24.9% 24.5% 24.3%
0.0%
5.0%
10.0%
15.0%
20.0%
25.0%
30.0%
35.0%
FY17 FY18 FY19 FY20 FY21E FY22E FY23E
4.2%
6.8%
4.0% 3.9% 3.0% 3.5% 3.7%
27.3%
34.8%
18.8%
22.2%
18.6%
21.6% 22.9%
0.0%
5.0%
10.0%
15.0%
20.0%
25.0%
30.0%
35.0%
40.0%
FY17 FY18 FY19 FY20 FY21E FY22E FY23E
RoA (%) RoE (%)
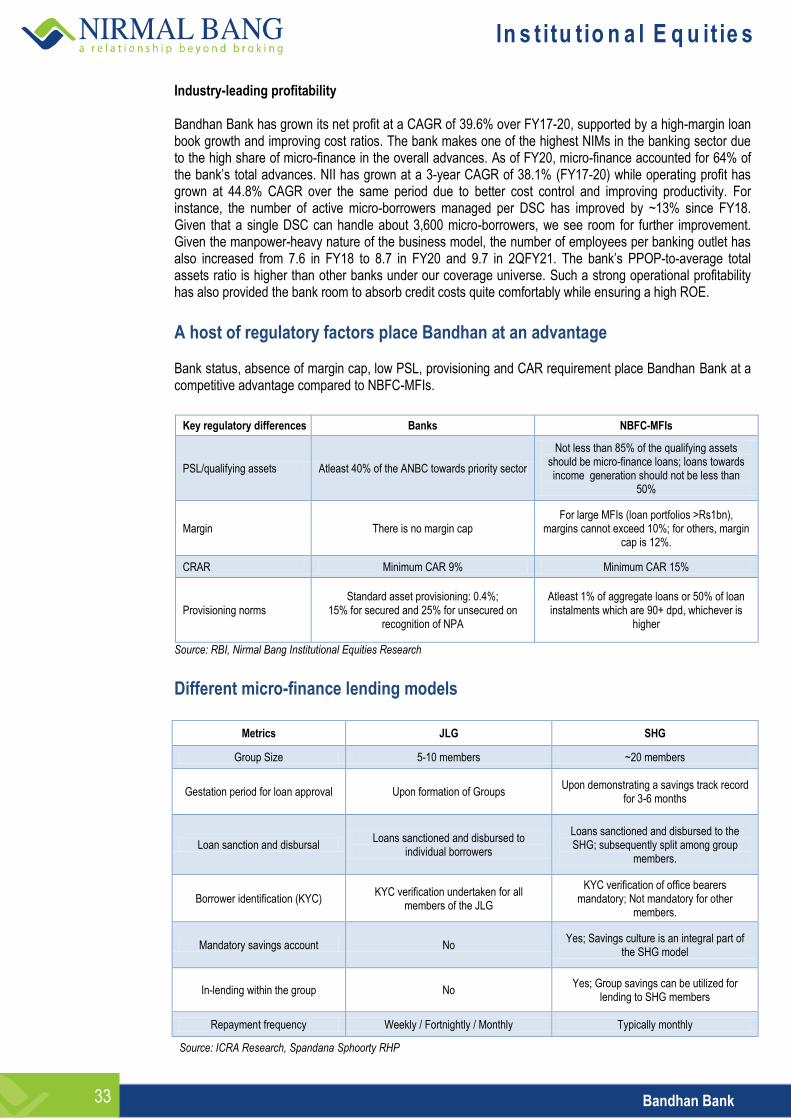
In s t itu tio n a l E q u it ie s
Bandhan Bank 33
Industry-leading profitability Bandhan Bank has grown its net profit at a CAGR of 39.6% over FY17-20, supported by a high-margin loan book growth and improving cost ratios. The bank makes one of the highest NIMs in the banking sector due to the high share of micro-finance in the overall advances. As of FY20, micro-finance accounted for 64% of the bank’s total advances. NII has grown at a 3-year CAGR of 38.1% (FY17-20) while operating profit has grown at 44.8% CAGR over the same period due to better cost control and improving productivity. For instance, the number of active micro-borrowers managed per DSC has improved by ~13% since FY18. Given that a single DSC can handle about 3,600 micro-borrowers, we see room for further improvement. Given the manpower-heavy nature of the business model, the number of employees per banking outlet has also increased from 7.6 in FY18 to 8.7 in FY20 and 9.7 in 2QFY21. The bank’s PPOP-to-average total assets ratio is higher than other banks under our coverage universe. Such a strong operational profitability has also provided the bank room to absorb credit costs quite comfortably while ensuring a high ROE.
A host of regulatory factors place Bandhan at an advantage
Bank status, absence of margin cap, low PSL, provisioning and CAR requirement place Bandhan Bank at a competitive advantage compared to NBFC-MFIs.
Key regulatory differences Banks NBFC-MFIs
PSL/qualifying assets Atleast 40% of the ANBC towards priority sector
Not less than 85% of the qualifying assets should be micro-finance loans; loans towards income generation should not be less than
50%
Margin There is no margin cap For large MFIs (loan portfolios >Rs1bn),
margins cannot exceed 10%; for others, margin cap is 12%.
CRAR Minimum CAR 9% Minimum CAR 15%
Provisioning norms Standard asset provisioning: 0.4%;
15% for secured and 25% for unsecured on recognition of NPA
Atleast 1% of aggregate loans or 50% of loan instalments which are 90+ dpd, whichever is
higher
Source: RBI, Nirmal Bang Institutional Equities Research
Different micro-finance lending models
Metrics JLG SHG
Group Size 5-10 members ~20 members
Gestation period for loan approval Upon formation of Groups Upon demonstrating a savings track record
for 3-6 months
Loan sanction and disbursal Loans sanctioned and disbursed to
individual borrowers
Loans sanctioned and disbursed to the SHG; subsequently split among group
members.
Borrower identification (KYC) KYC verification undertaken for all
members of the JLG
KYC verification of office bearers mandatory; Not mandatory for other
members.
Mandatory savings account No Yes; Savings culture is an integral part of
the SHG model
In-lending within the group No Yes; Group savings can be utilized for
lending to SHG members
Repayment frequency Weekly / Fortnightly / Monthly Typically monthly
Source: ICRA Research, Spandana Sphoorty RHP
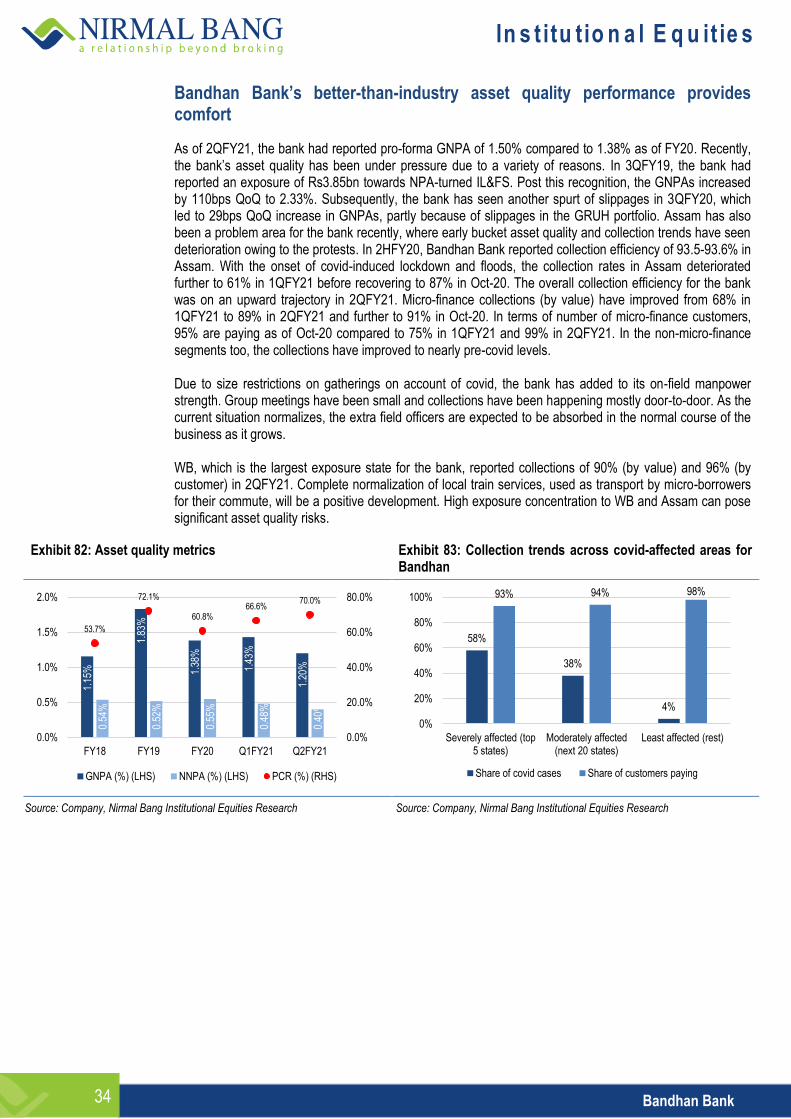
In s t itu tio n a l E q u it ie s
Bandhan Bank 34
Bandhan Bank’s better-than-industry asset quality performance provides comfort
As of 2QFY21, the bank had reported pro-forma GNPA of 1.50% compared to 1.38% as of FY20. Recently, the bank’s asset quality has been under pressure due to a variety of reasons. In 3QFY19, the bank had reported an exposure of Rs3.85bn towards NPA-turned IL&FS. Post this recognition, the GNPAs increased by 110bps QoQ to 2.33%. Subsequently, the bank has seen another spurt of slippages in 3QFY20, which led to 29bps QoQ increase in GNPAs, partly because of slippages in the GRUH portfolio. Assam has also been a problem area for the bank recently, where early bucket asset quality and collection trends have seen deterioration owing to the protests. In 2HFY20, Bandhan Bank reported collection efficiency of 93.5-93.6% in Assam. With the onset of covid-induced lockdown and floods, the collection rates in Assam deteriorated further to 61% in 1QFY21 before recovering to 87% in Oct-20. The overall collection efficiency for the bank was on an upward trajectory in 2QFY21. Micro-finance collections (by value) have improved from 68% in 1QFY21 to 89% in 2QFY21 and further to 91% in Oct-20. In terms of number of micro-finance customers, 95% are paying as of Oct-20 compared to 75% in 1QFY21 and 99% in 2QFY21. In the non-micro-finance segments too, the collections have improved to nearly pre-covid levels. Due to size restrictions on gatherings on account of covid, the bank has added to its on-field manpower strength. Group meetings have been small and collections have been happening mostly door-to-door. As the current situation normalizes, the extra field officers are expected to be absorbed in the normal course of the business as it grows. WB, which is the largest exposure state for the bank, reported collections of 90% (by value) and 96% (by customer) in 2QFY21. Complete normalization of local train services, used as transport by micro-borrowers for their commute, will be a positive development. High exposure concentration to WB and Assam can pose significant asset quality risks.
Exhibit 82: Asset quality metrics Exhibit 83: Collection trends across covid-affected areas for Bandhan
Source: Company, Nirmal Bang Institutional Equities Research Source: Company, Nirmal Bang Institutional Equities Research
1.15
%
1.83
%
1.38
%
1.43
%
1.20
%
0.54
%
0.52
%
0.55
%
0.48
%
0.40
%
53.7%
72.1%
60.8% 66.6%
70.0%
0.0%
20.0%
40.0%
60.0%
80.0%
0.0%
0.5%
1.0%
1.5%
2.0%
FY18 FY19 FY20 Q1FY21 Q2FY21
GNPA (%) (LHS) NNPA (%) (LHS) PCR (%) (RHS)
58%
38%
4%
93% 94% 98%
0%
20%
40%
60%
80%
100%
Severely affected (top 5 states)
Moderately affected (next 20 states)
Least affected (rest)
Share of covid cases Share of customers paying
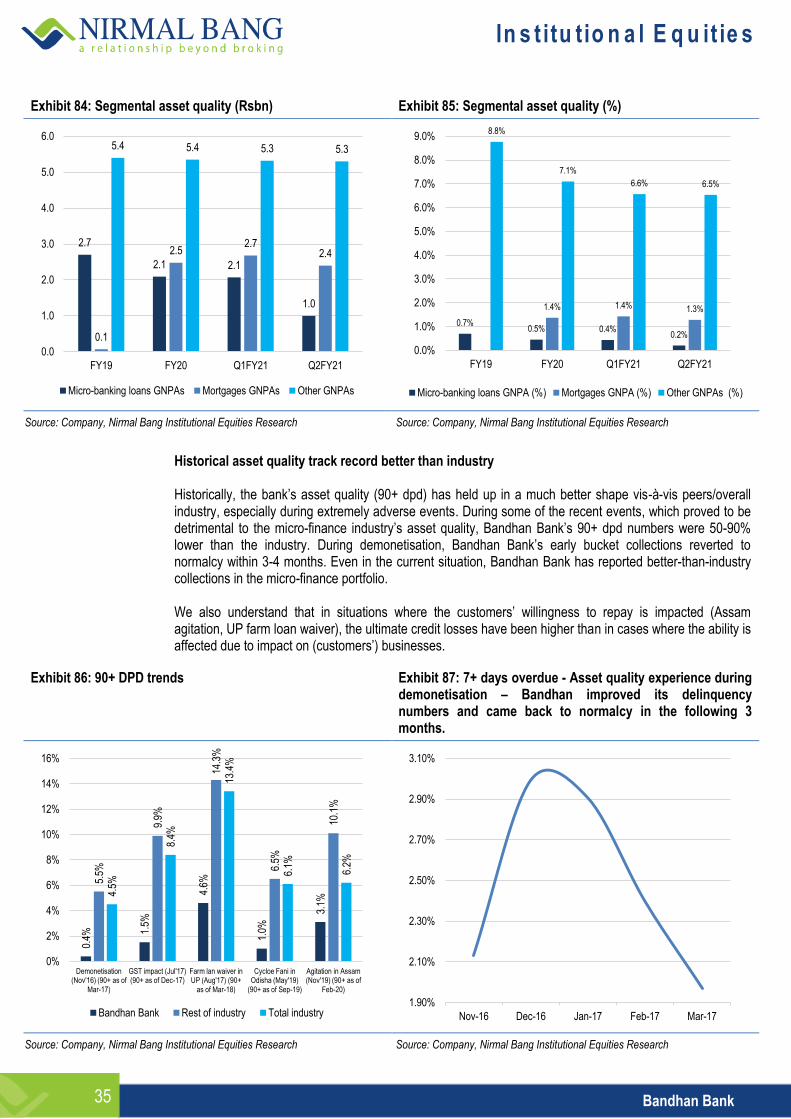
In s t itu tio n a l E q u it ie s
Bandhan Bank 35
Exhibit 84: Segmental asset quality (Rsbn) Exhibit 85: Segmental asset quality (%)
Source: Company, Nirmal Bang Institutional Equities Research Source: Company, Nirmal Bang Institutional Equities Research
Historical asset quality track record better than industry Historically, the bank’s asset quality (90+ dpd) has held up in a much better shape vis-à-vis peers/overall industry, especially during extremely adverse events. During some of the recent events, which proved to be detrimental to the micro-finance industry’s asset quality, Bandhan Bank’s 90+ dpd numbers were 50-90% lower than the industry. During demonetisation, Bandhan Bank’s early bucket collections reverted to normalcy within 3-4 months. Even in the current situation, Bandhan Bank has reported better-than-industry collections in the micro-finance portfolio. We also understand that in situations where the customers’ willingness to repay is impacted (Assam agitation, UP farm loan waiver), the ultimate credit losses have been higher than in cases where the ability is affected due to impact on (customers’) businesses.
Exhibit 86: 90+ DPD trends Exhibit 87: 7+ days overdue - Asset quality experience during demonetisation – Bandhan improved its delinquency numbers and came back to normalcy in the following 3 months.
Source: Company, Nirmal Bang Institutional Equities Research Source: Company, Nirmal Bang Institutional Equities Research
2.7
2.1 2.1
1.0
0.1
2.5 2.7
2.4
5.4 5.4 5.3 5.3
0.0
1.0
2.0
3.0
4.0
5.0
6.0
FY19 FY20 Q1FY21 Q2FY21
Micro-banking loans GNPAs Mortgages GNPAs Other GNPAs
0.7% 0.5% 0.4%
0.2%
1.4% 1.4% 1.3%
8.8%
7.1%
6.6% 6.5%
0.0%
1.0%
2.0%
3.0%
4.0%
5.0%
6.0%
7.0%
8.0%
9.0%
FY19 FY20 Q1FY21 Q2FY21
Micro-banking loans GNPA (%) Mortgages GNPA (%) Other GNPAs (%)
0.4%
1.5%
4.6%
1.0%
3.1%
5.5%
9.9%
14.3
%
6.5%
10.1
%
4.5%
8.4%
13.4
%
6.1%
6.2%
0%
2%
4%
6%
8%
10%
12%
14%
16%
Demonetisation (Nov'16) (90+ as of
Mar-17)
GST impact (Jul'17) (90+ as of Dec-17)
Farm lan waiver in UP (Aug'17) (90+
as of Mar-18)
Cycloe Fani in Odisha (May'19)
(90+ as of Sep-19)
Agitation in Assam (Nov'19) (90+ as of
Feb-20)
Bandhan Bank Rest of industry Total industry 1.90%
2.10%
2.30%
2.50%
2.70%
2.90%
3.10%
Nov-16 Dec-16 Jan-17 Feb-17 Mar-17
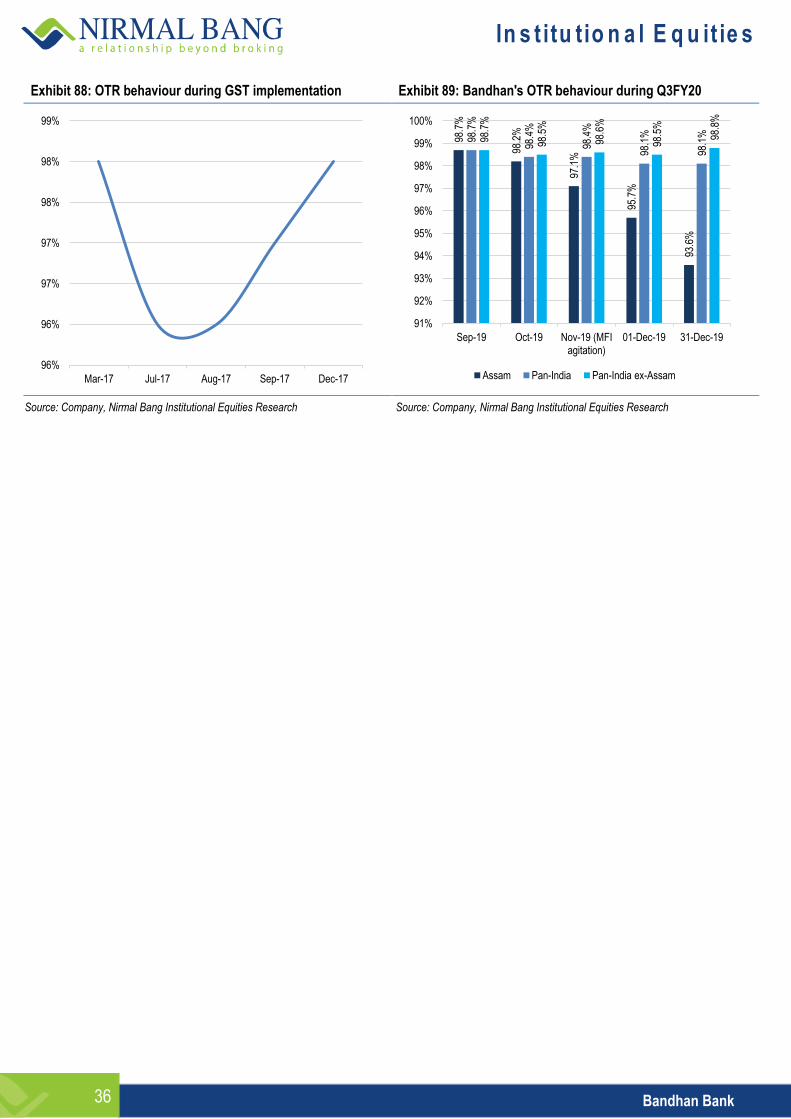
In s t itu tio n a l E q u it ie s
Bandhan Bank 36
Exhibit 88: OTR behaviour during GST implementation Exhibit 89: Bandhan's OTR behaviour during Q3FY20
Source: Company, Nirmal Bang Institutional Equities Research Source: Company, Nirmal Bang Institutional Equities Research
96%
96%
97%
97%
98%
98%
99%
Mar-17 Jul-17 Aug-17 Sep-17 Dec-17
98.7
%
98.2
%
97.1
%
95.7
%
93.6
%
98.7
%
98.4
%
98.4
%
98.1
%
98.1
%
98.7
%
98.5
%
98.6
%
98.5
%
98.8
%
91%
92%
93%
94%
95%
96%
97%
98%
99%
100%
Sep-19 Oct-19 Nov-19 (MFI agitation)
01-Dec-19 31-Dec-19
Assam Pan-India Pan-India ex-Assam
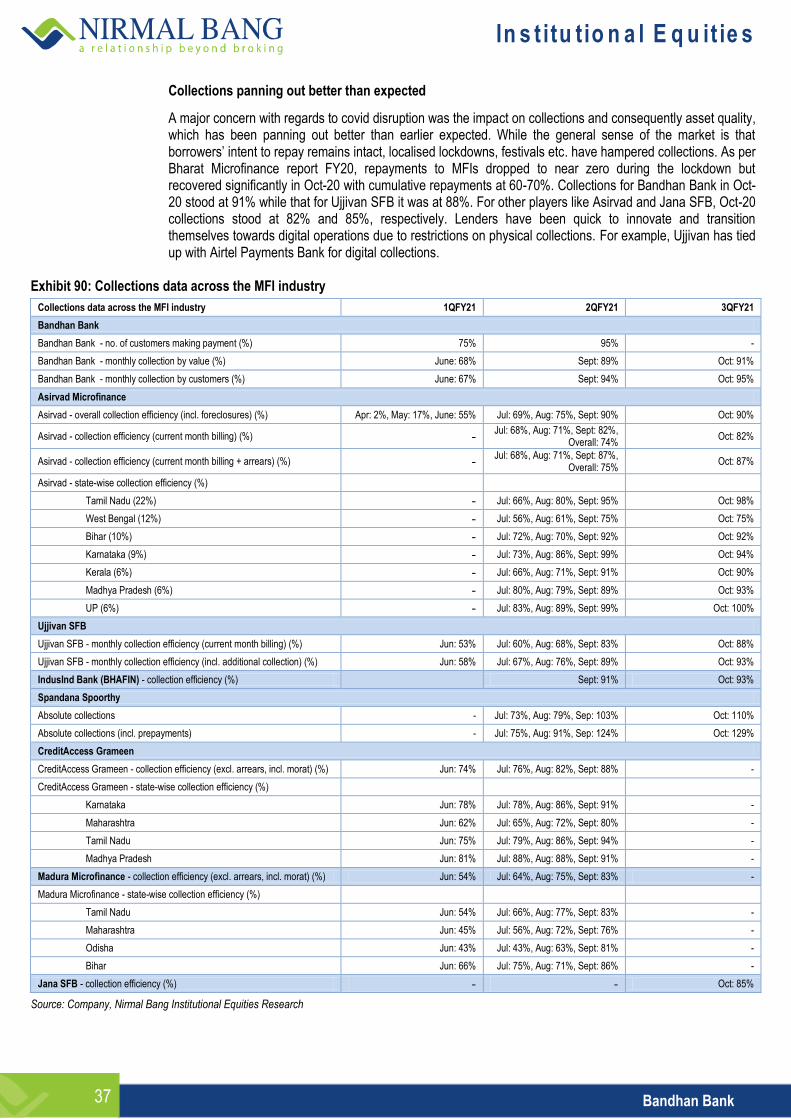
In s t itu tio n a l E q u it ie s
Bandhan Bank 37
Collections panning out better than expected
A major concern with regards to covid disruption was the impact on collections and consequently asset quality, which has been panning out better than earlier expected. While the general sense of the market is that borrowers’ intent to repay remains intact, localised lockdowns, festivals etc. have hampered collections. As per Bharat Microfinance report FY20, repayments to MFIs dropped to near zero during the lockdown but recovered significantly in Oct-20 with cumulative repayments at 60-70%. Collections for Bandhan Bank in Oct-20 stood at 91% while that for Ujjivan SFB it was at 88%. For other players like Asirvad and Jana SFB, Oct-20 collections stood at 82% and 85%, respectively. Lenders have been quick to innovate and transition themselves towards digital operations due to restrictions on physical collections. For example, Ujjivan has tied up with Airtel Payments Bank for digital collections.
Exhibit 90: Collections data across the MFI industry
Collections data across the MFI industry 1QFY21 2QFY21 3QFY21
Bandhan Bank
Bandhan Bank - no. of customers making payment (%) 75% 95% -
Bandhan Bank - monthly collection by value (%) June: 68% Sept: 89% Oct: 91%
Bandhan Bank - monthly collection by customers (%) June: 67% Sept: 94% Oct: 95%
Asirvad Microfinance
Asirvad - overall collection efficiency (incl. foreclosures) (%) Apr: 2%, May: 17%, June: 55% Jul: 69%, Aug: 75%, Sept: 90% Oct: 90%
Asirvad - collection efficiency (current month billing) (%) - Jul: 68%, Aug: 71%, Sept: 82%,
Overall: 74% Oct: 82%
Asirvad - collection efficiency (current month billing + arrears) (%) - Jul: 68%, Aug: 71%, Sept: 87%,
Overall: 75% Oct: 87%
Asirvad - state-wise collection efficiency (%)
Tamil Nadu (22%) - Jul: 66%, Aug: 80%, Sept: 95% Oct: 98%
West Bengal (12%) - Jul: 56%, Aug: 61%, Sept: 75% Oct: 75%
Bihar (10%) - Jul: 72%, Aug: 70%, Sept: 92% Oct: 92%
Karnataka (9%) - Jul: 73%, Aug: 86%, Sept: 99% Oct: 94%
Kerala (6%) - Jul: 66%, Aug: 71%, Sept: 91% Oct: 90%
Madhya Pradesh (6%) - Jul: 80%, Aug: 79%, Sept: 89% Oct: 93%
UP (6%) - Jul: 83%, Aug: 89%, Sept: 99% Oct: 100%
Ujjivan SFB
Ujjivan SFB - monthly collection efficiency (current month billing) (%) Jun: 53% Jul: 60%, Aug: 68%, Sept: 83% Oct: 88%
Ujjivan SFB - monthly collection efficiency (incl. additional collection) (%) Jun: 58% Jul: 67%, Aug: 76%, Sept: 89% Oct: 93%
IndusInd Bank (BHAFIN) - collection efficiency (%)
Sept: 91% Oct: 93%
Spandana Spoorthy
Absolute collections - Jul: 73%, Aug: 79%, Sep: 103% Oct: 110%
Absolute collections (incl. prepayments) - Jul: 75%, Aug: 91%, Sep: 124% Oct: 129%
CreditAccess Grameen
CreditAccess Grameen - collection efficiency (excl. arrears, incl. morat) (%) Jun: 74% Jul: 76%, Aug: 82%, Sept: 88% -
CreditAccess Grameen - state-wise collection efficiency (%)
Karnataka Jun: 78% Jul: 78%, Aug: 86%, Sept: 91% -
Maharashtra Jun: 62% Jul: 65%, Aug: 72%, Sept: 80% -
Tamil Nadu Jun: 75% Jul: 79%, Aug: 86%, Sept: 94% -
Madhya Pradesh Jun: 81% Jul: 88%, Aug: 88%, Sept: 91% -
Madura Microfinance - collection efficiency (excl. arrears, incl. morat) (%) Jun: 54% Jul: 64%, Aug: 75%, Sept: 83% -
Madura Microfinance - state-wise collection efficiency (%)
Tamil Nadu Jun: 54% Jul: 66%, Aug: 77%, Sept: 83% -
Maharashtra Jun: 45% Jul: 56%, Aug: 72%, Sept: 76% -
Odisha Jun: 43% Jul: 43%, Aug: 63%, Sept: 81% -
Bihar Jun: 66% Jul: 75%, Aug: 71%, Sept: 86% -
Jana SFB - collection efficiency (%) - - Oct: 85%
Source: Company, Nirmal Bang Institutional Equities Research
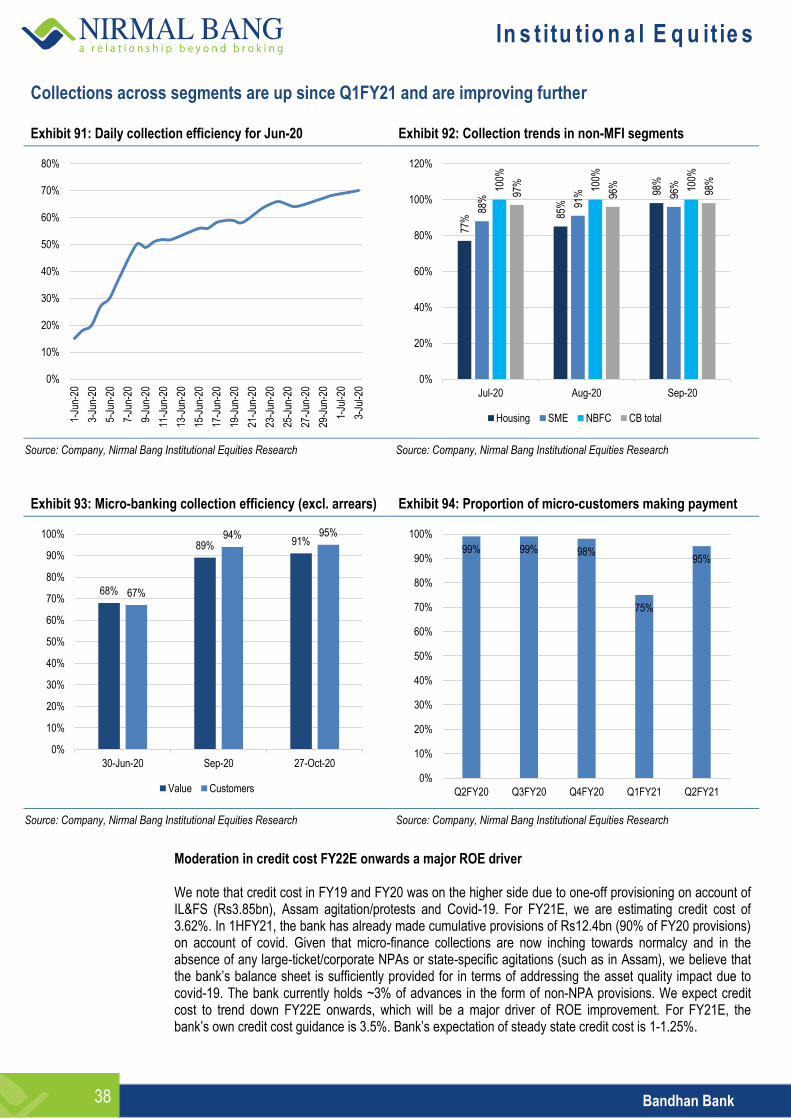
In s t itu tio n a l E q u it ie s
Bandhan Bank 38
Collections across segments are up since Q1FY21 and are improving further Exhibit 91: Daily collection efficiency for Jun-20 Exhibit 92: Collection trends in non-MFI segments
Source: Company, Nirmal Bang Institutional Equities Research Source: Company, Nirmal Bang Institutional Equities Research
Exhibit 93: Micro-banking collection efficiency (excl. arrears) Exhibit 94: Proportion of micro-customers making payment
Source: Company, Nirmal Bang Institutional Equities Research Source: Company, Nirmal Bang Institutional Equities Research
Moderation in credit cost FY22E onwards a major ROE driver We note that credit cost in FY19 and FY20 was on the higher side due to one-off provisioning on account of IL&FS (Rs3.85bn), Assam agitation/protests and Covid-19. For FY21E, we are estimating credit cost of 3.62%. In 1HFY21, the bank has already made cumulative provisions of Rs12.4bn (90% of FY20 provisions) on account of covid. Given that micro-finance collections are now inching towards normalcy and in the absence of any large-ticket/corporate NPAs or state-specific agitations (such as in Assam), we believe that the bank’s balance sheet is sufficiently provided for in terms of addressing the asset quality impact due to covid-19. The bank currently holds ~3% of advances in the form of non-NPA provisions. We expect credit cost to trend down FY22E onwards, which will be a major driver of ROE improvement. For FY21E, the bank’s own credit cost guidance is 3.5%. Bank’s expectation of steady state credit cost is 1-1.25%.
0%
10%
20%
30%
40%
50%
60%
70%
80%
1-Ju
n-20
3-Ju
n-20
5-Ju
n-20
7-Ju
n-20
9-Ju
n-20
11-J
un-2
0
13-J
un-2
0
15-J
un-2
0
17-J
un-2
0
19-J
un-2
0
21-J
un-2
0
23-J
un-2
0
25-J
un-2
0
27-J
un-2
0
29-J
un-2
0
1-Ju
l-20
3-Ju
l-20
77%
85%
98%
88%
91%
96%
100%
100%
100%
97%
96%
98%
0%
20%
40%
60%
80%
100%
120%
Jul-20 Aug-20 Sep-20
Housing SME NBFC CB total
68%
89% 91%
67%
94% 95%
0%
10%
20%
30%
40%
50%
60%
70%
80%
90%
100%
30-Jun-20 Sep-20 27-Oct-20
Value Customers
99% 99% 98%
75%
95%
0%
10%
20%
30%
40%
50%
60%
70%
80%
90%
100%
Q2FY20 Q3FY20 Q4FY20 Q1FY21 Q2FY21

In s t itu tio n a l E q u it ie s
Bandhan Bank 39
Higher customer engagement a key reason for better asset quality
Bandhan Bank follows a 7-day collection cycle, which means that the bank officer meets customers 52 times in a year. Compared to peers (Spandana and Equitas), Bandhan Bank’s collection cycle indicates a higher degree/frequency of customer engagement. We believe this plays out favorably from an asset quality standpoint. A shorter EMI-collection cycle not only ensures more frequent interaction and relationship building opportunity with the customers but also helps the bank to monitor the repayment behaviour and credit default risk more closely. More frequent interactions reduce the chances of information asymmetry, especially in cases of adverse developments (at the borrowers’ end). For CreditAccess Grameen, majority of the customers are on a 7-day collection policy. We also understand that Spandana used to follow a monthly collection model earlier.
Exhibit 95: Collection policy (days) - shorter is better
Source: Company, Nirmal Bang Institutional Equities Research Industry wide, nearly half of the loans are collected on a monthly basis (least preferred mode in our view) whereas weekly collections are 26%. Given this data, coupled with Bandhan Bank’s strong asset quality performance relative to the broader MFI space, we believe that the bank’s collection policies and systems are superior.
Exhibit 96: GLP composition in terms of collection mode (%) (FY20)
Source: Company, Nirmal Bang Institutional Equities Research
7 7
14
28
0
5
10
15
20
25
30
Bandhan Bank CreditAccess Grameen
Spandana Spoorthy Equitas SFB
25% 26%
49%
0%
10%
20%
30%
40%
50%
60%
Fortnightly collection Weekly collection Monthly collection
In s t itu tio n a l E q u it ie s
Bandhan Bank 40
Loan appraisal process
Microloans For microloans, bank’s doorstep banking officers (DBOs) source loan applications, conduct the primary appraisal and customer visits and make loan recommendations to the head of the applicable DSC. The head of the DSC then visits the customer’s house and checks the details entered in the loan applications and, if satisfied, sanctions the loan. The appraisal criteria for microloans are primarily qualitative, and include factors such as customer profile, age, current enterprise, income, surplus income and Credit Bureau report on past performance. Retail loans Personal loans are sourced by branch officials and are sanctioned by respective branch heads. Other retail loans are sourced by dedicated relationship managers, with loans up to Rs1mn sanctioned by the credit team and loans above Rs1mnn sanctioned by credit committees at the head office. Bank follows standard loan application and appraisal formats covering both qualitative as well as quantitative parameters. SME loans Bank sources SME loan proposals through bank branches and SME hubs, which are hubs with dedicated relationship managers that have been created within select branches with potential for SME business. The SME hubs also house SME credit managers who assess the creditworthiness of business proposals. This is to ensure close client interaction and timely service to customers. The appraisal is carried out by the credit team and sanctioning of all loans under SME is centralized and sanctioned by designated head office credit committees. There is a separate credit operations department to monitor and control post-sanction documentation and operations. Small enterprise loans Bank has a dedicated team of relationship managers who source and service the customers. The credit team for small enterprise loans has sanctioning powers and is independent of the small enterprise loan sourcing team. Bank uses a combined application-cum-appraisal form, with due diligence carried out by the credit managers based on the qualitative information available.

In s t itu tio n a l E q u it ie s
Bandhan Bank 41
Brief on AP micro-finance crisis In FY10, Andhra Pradesh was the largest MFI market with a share of ~28% (loans outstanding) and ~23% (client outreach). After multiple suicides by farmers due to pressure from MFI collection agents, the AP government, in Oct-10, passed the AP Microfinance Ordinance to put in place extremely strict operating guidelines. This resulted in a sharp drop in collection efficiencies of the AP based MFI portfolios (from ~99% to almost nil). This affected AP-based MFIs severely and out of the 7 MFIs with high concentration in AP, 6 were admitted to CDR. This resulted in a domino effect adversely affecting not just AP focussed MFIs, but other MFIs as well. AP focussed MFIs were affected due to adverse collection rates and other MFIs were impacted due to lack of fresh credit lines. The crisis led to a drop in investor confidence on the sector.
In s t itu tio n a l E q u it ie s
Bandhan Bank 42
Bandhan Bank’s ownership dilution
Bandhan Bank’s IPO in Mar-18 resulted in Bandhan Financial Holding Limited’s (BFHL) shareholding reducing to 82.28%. By regulation, BFHL was required to reduce its share to 40% by Aug-18. However, being unable to do so, the RBI, in Sep-18, froze the remuneration of MD and CEO Mr. Chandra Shekhar Ghosh and halted the bank’s branch expansion. In Oct-19, post the successful merger with GRUH Finance, promoter shareholding in Bandhan Bank was brought down to 61%. This merger not only helped to address the stake dilution issue but also helped Bandhan Bank pursue high quality diversification. The second stage of stake dilution happened more recently (Aug-20) when Bandhan Bank’s promoter entity sold its stake via block trade, which brought down promoter ownership to 40%. Going forward, as per regulatory guidelines, Bandhan Bank needs to further reduce promoter share to 15% by Aug-27 (12 years from commencement of operations). Despite the IWG’s recommendations providing for relaxation of long-term ownership stakes in banks and collapse of NOFHCs (wherein banking is the only business), Bandhan Bank is likely to continue with the holdco structure given that it wants to be a full-service institution, providing customers other financial products such as insurance and mutual funds. We believe that the current holdco structure would be best suited in order to pursue a para-banking strategy. The bank plans to take the subsidiary route for its proposed insurance and mutual fund foray.
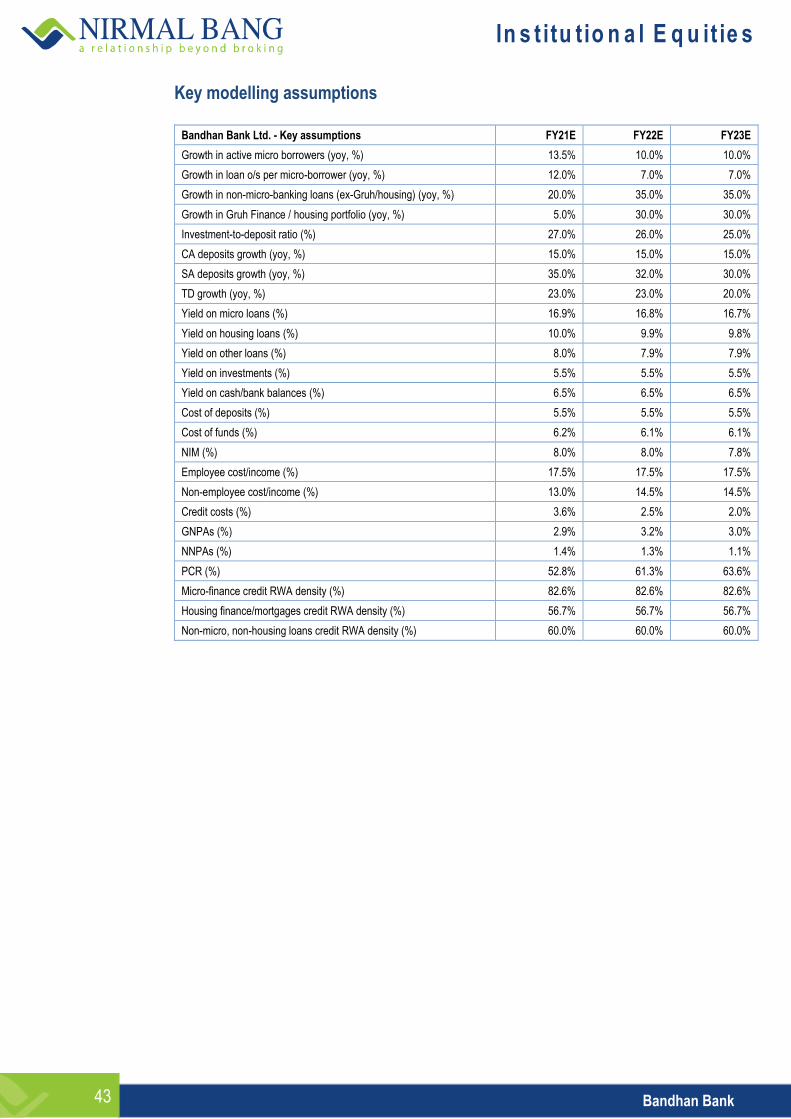
In s t itu tio n a l E q u it ie s
Bandhan Bank 43
Key modelling assumptions
Bandhan Bank Ltd. - Key assumptions FY21E FY22E FY23E
Growth in active micro borrowers (yoy, %) 13.5% 10.0% 10.0%
Growth in loan o/s per micro-borrower (yoy, %) 12.0% 7.0% 7.0%
Growth in non-micro-banking loans (ex-Gruh/housing) (yoy, %) 20.0% 35.0% 35.0%
Growth in Gruh Finance / housing portfolio (yoy, %) 5.0% 30.0% 30.0%
Investment-to-deposit ratio (%) 27.0% 26.0% 25.0%
CA deposits growth (yoy, %) 15.0% 15.0% 15.0%
SA deposits growth (yoy, %) 35.0% 32.0% 30.0%
TD growth (yoy, %) 23.0% 23.0% 20.0%
Yield on micro loans (%) 16.9% 16.8% 16.7%
Yield on housing loans (%) 10.0% 9.9% 9.8%
Yield on other loans (%) 8.0% 7.9% 7.9%
Yield on investments (%) 5.5% 5.5% 5.5%
Yield on cash/bank balances (%) 6.5% 6.5% 6.5%
Cost of deposits (%) 5.5% 5.5% 5.5%
Cost of funds (%) 6.2% 6.1% 6.1%
NIM (%) 8.0% 8.0% 7.8%
Employee cost/income (%) 17.5% 17.5% 17.5%
Non-employee cost/income (%) 13.0% 14.5% 14.5%
Credit costs (%) 3.6% 2.5% 2.0%
GNPAs (%) 2.9% 3.2% 3.0%
NNPAs (%) 1.4% 1.3% 1.1%
PCR (%) 52.8% 61.3% 63.6%
Micro-finance credit RWA density (%) 82.6% 82.6% 82.6%
Housing finance/mortgages credit RWA density (%) 56.7% 56.7% 56.7%
Non-micro, non-housing loans credit RWA density (%) 60.0% 60.0% 60.0%
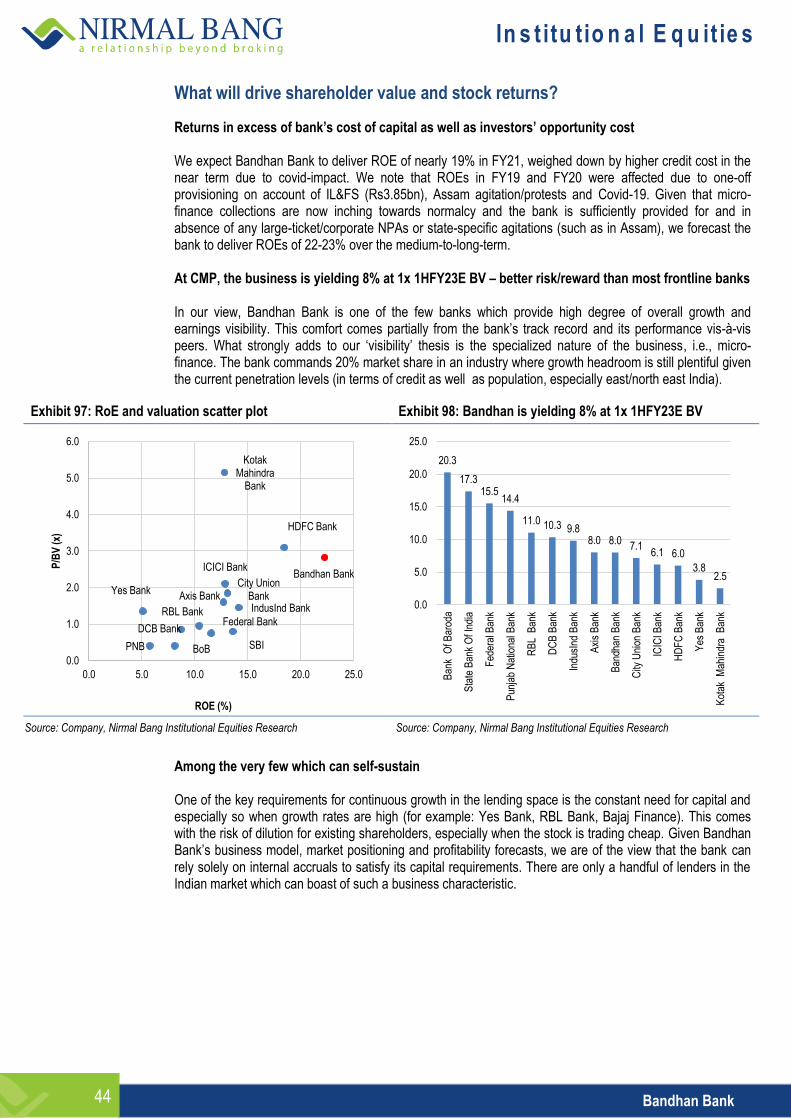
In s t itu tio n a l E q u it ie s
Bandhan Bank 44
What will drive shareholder value and stock returns?
Returns in excess of bank’s cost of capital as well as investors’ opportunity cost We expect Bandhan Bank to deliver ROE of nearly 19% in FY21, weighed down by higher credit cost in the near term due to covid-impact. We note that ROEs in FY19 and FY20 were affected due to one-off provisioning on account of IL&FS (Rs3.85bn), Assam agitation/protests and Covid-19. Given that micro-finance collections are now inching towards normalcy and the bank is sufficiently provided for and in absence of any large-ticket/corporate NPAs or state-specific agitations (such as in Assam), we forecast the bank to deliver ROEs of 22-23% over the medium-to-long-term. At CMP, the business is yielding 8% at 1x 1HFY23E BV – better risk/reward than most frontline banks In our view, Bandhan Bank is one of the few banks which provide high degree of overall growth and earnings visibility. This comfort comes partially from the bank’s track record and its performance vis-à-vis peers. What strongly adds to our ‘visibility’ thesis is the specialized nature of the business, i.e., micro-finance. The bank commands 20% market share in an industry where growth headroom is still plentiful given the current penetration levels (in terms of credit as well as population, especially east/north east India).
Exhibit 97: RoE and valuation scatter plot Exhibit 98: Bandhan is yielding 8% at 1x 1HFY23E BV
Source: Company, Nirmal Bang Institutional Equities Research Source: Company, Nirmal Bang Institutional Equities Research
Among the very few which can self-sustain One of the key requirements for continuous growth in the lending space is the constant need for capital and especially so when growth rates are high (for example: Yes Bank, RBL Bank, Bajaj Finance). This comes with the risk of dilution for existing shareholders, especially when the stock is trading cheap. Given Bandhan Bank’s business model, market positioning and profitability forecasts, we are of the view that the bank can rely solely on internal accruals to satisfy its capital requirements. There are only a handful of lenders in the Indian market which can boast of such a business characteristic.
BoB SBI
Federal Bank
PNB
RBL Bank
DCB Bank
Bandhan Bank
IndusInd Bank Axis Bank
City Union Bank
ICICI Bank
HDFC Bank
Yes Bank
Kotak Mahindra
Bank
0.0
1.0
2.0
3.0
4.0
5.0
6.0
0.0 5.0 10.0 15.0 20.0 25.0
P/B
V (
x)
ROE (%)
20.3
17.3 15.5
14.4
11.0 10.3 9.8 8.0 8.0
7.1 6.1 6.0
3.8 2.5
0.0
5.0
10.0
15.0
20.0
25.0 B
ank
Of B
arod
a
Sta
te B
ank
Of I
ndia
Fed
eral
Ban
k
Pun
jab
Nat
iona
l Ban
k
RB
L B
ank
DC
B B
ank
Indu
sInd
Ban
k
Axi
s B
ank
Ban
dhan
Ban
k
City
Uni
on B
ank
ICIC
I Ban
k
HD
FC
Ban
k
Yes
Ban
k
Kot
ak M
ahin
dra
Ban
k
In s t itu tio n a l E q u it ie s
Bandhan Bank 45
From a stockholder’s perspective: can a lower dividend payout and higher reinvestment of profit in a high-ROE business lead to better shareholder value creation? While the RBI has restricted banks from declaring any dividend for FY20, we are building in a 20% dividend payout going forward. We think that a higher rate of reinvestment of profit (back into Bandhan Bank), implying lower dividend payout, would lead to better shareholder value creation as the bank’s current/projected ROEs are in excess of its cost of capital and possibly higher than investors’ opportunity cost of capital. While we understand investors’ needs for dividend payouts, we are of the view that ploughing back earnings in a 21%+ ROE business makes for a better capital allocation decision that would lead to higher shareholder value creation than otherwise. Bank is profitable enough to self-sustain
On the basis of our current growth projections and capital consumption patterns, we think that a dividend payout of sub-15% would enable the bank to fuel growth entirely through internal accruals.
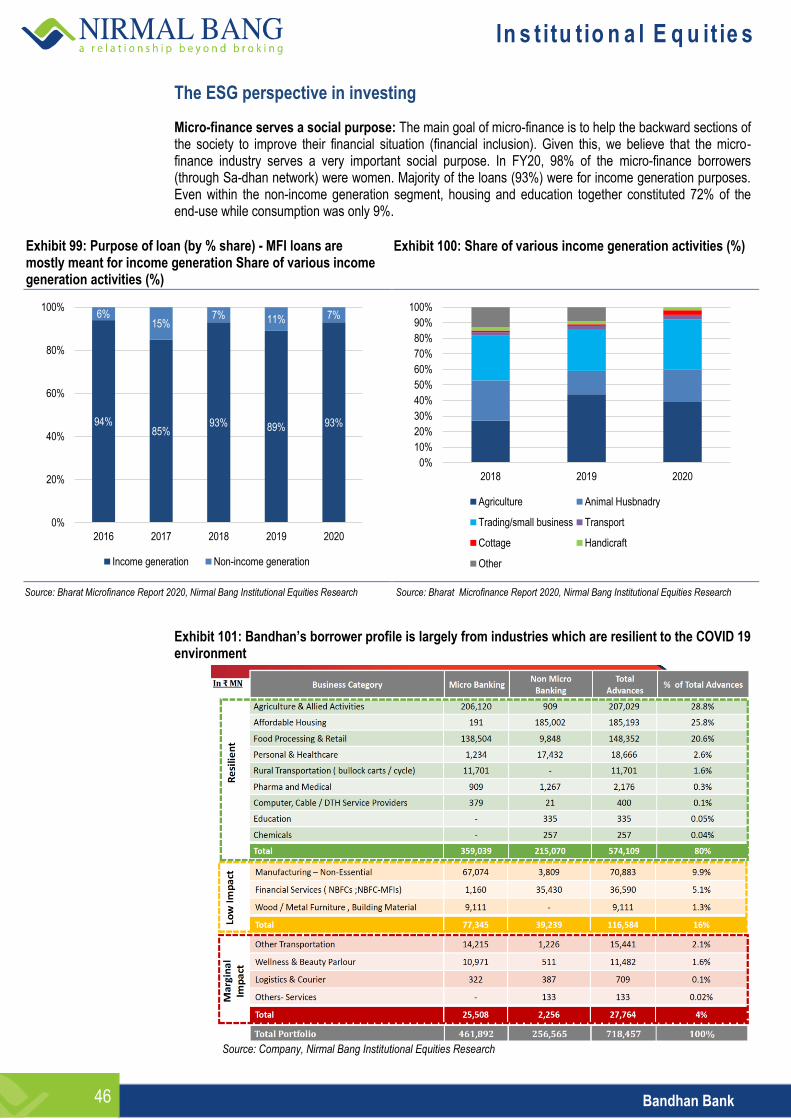
In s t itu tio n a l E q u it ie s
Bandhan Bank 46
The ESG perspective in investing
Micro-finance serves a social purpose: The main goal of micro-finance is to help the backward sections of the society to improve their financial situation (financial inclusion). Given this, we believe that the micro-finance industry serves a very important social purpose. In FY20, 98% of the micro-finance borrowers (through Sa-dhan network) were women. Majority of the loans (93%) were for income generation purposes. Even within the non-income generation segment, housing and education together constituted 72% of the end-use while consumption was only 9%.
Exhibit 99: Purpose of loan (by % share) - MFI loans are mostly meant for income generation Share of various income generation activities (%)
Exhibit 100: Share of various income generation activities (%)
Source: Bharat Microfinance Report 2020, Nirmal Bang Institutional Equities Research Source: Bharat Microfinance Report 2020, Nirmal Bang Institutional Equities Research
Exhibit 101: Bandhan’s borrower profile is largely from industries which are resilient to the COVID 19 environment
Source: Company, Nirmal Bang Institutional Equities Research
94% 85%
93% 89% 93%
6% 15%
7% 11% 7%
0%
20%
40%
60%
80%
100%
2016 2017 2018 2019 2020
Income generation Non-income generation
0%
10%
20%
30%
40%
50%
60%
70%
80%
90%
100%
2018 2019 2020
Agriculture Animal Husbnadry
Trading/small business Transport
Cottage Handicraft
Other
In s t itu tio n a l E q u it ie s
Bandhan Bank 47
Key risks
Geographic concentration: >40% of Bandhan Bank’s business comes from WB. Any major adverse development or disruption in the state could have negative implications for Bandhan Bank. Higher sensitivity to political commentary & campaigns and natural calamities: Over the years, farm loan waivers, which have become more frequent, have started to have knee-jerk reaction on micro-borrowers. The repayment culture in the micro-finance industry has become highly sensitive to political commentary (especially regarding poor/backward classes). Going forward, we expect such political announcements to recur but the asset quality impact will be short-lived. We also believe that large natural calamities tend to impact micro-borrowers more. Non-MFI not seasoned enough: Bandhan Bank has articulated its vision to increase the share of non-micro-finance considerably by 2025. We have known Bandhan Bank for its dominance in the micro-finance industry. Foraying into untested waters (housing, SME, personal/retail loans) could prove to be disastrous if not executed properly (especially underwriting). Deposit stickiness: Bandhan Bank currently offers higher rates than frontline large banks as a key strategy to acquire the liability business. Any reduction in deposit rates may lead to outflows. Growth opex can hurt outside home markets: Bandhan Bank’s current cost ratios are low due to majority of the business coming from east/NE. Aggressive growth in non-east/NE India, where costs are higher, could hurt cost ratios. Key risk to profit forecast is credit cost: Higher than expected NPAs would result in higher credit cost, impacting profitability.
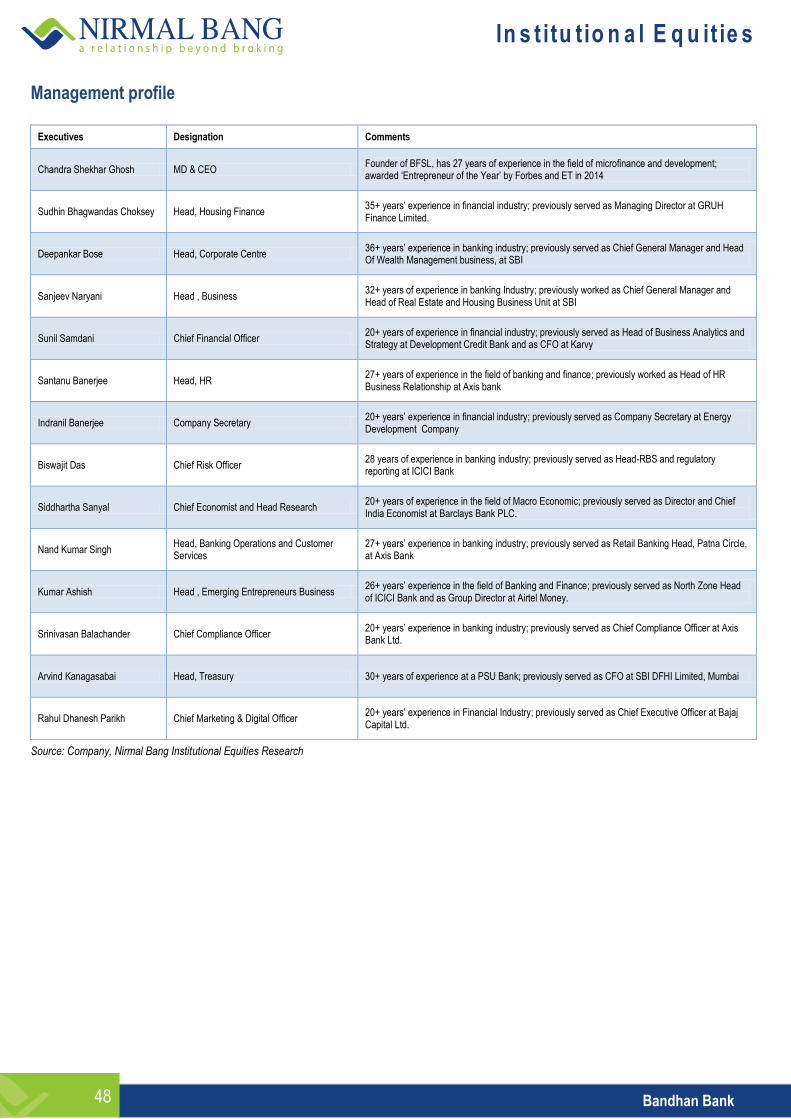
In s t itu tio n a l E q u it ie s
Bandhan Bank 48
Management profile
Executives Designation Comments
Chandra Shekhar Ghosh MD & CEO Founder of BFSL, has 27 years of experience in the field of microfinance and development; awarded ‘Entrepreneur of the Year’ by Forbes and ET in 2014
Sudhin Bhagwandas Choksey Head, Housing Finance 35+ years’ experience in financial industry; previously served as Managing Director at GRUH Finance Limited.
Deepankar Bose Head, Corporate Centre 36+ years’ experience in banking industry; previously served as Chief General Manager and Head Of Wealth Management business, at SBI
Sanjeev Naryani Head , Business 32+ years of experience in banking Industry; previously worked as Chief General Manager and Head of Real Estate and Housing Business Unit at SBI
Sunil Samdani Chief Financial Officer 20+ years of experience in financial industry; previously served as Head of Business Analytics and Strategy at Development Credit Bank and as CFO at Karvy
Santanu Banerjee Head, HR 27+ years of experience in the field of banking and finance; previously worked as Head of HR Business Relationship at Axis bank
Indranil Banerjee Company Secretary 20+ years’ experience in financial industry; previously served as Company Secretary at Energy Development Company
Biswajit Das Chief Risk Officer 28 years of experience in banking industry; previously served as Head-RBS and regulatory reporting at ICICI Bank
Siddhartha Sanyal Chief Economist and Head Research 20+ years of experience in the field of Macro Economic; previously served as Director and Chief India Economist at Barclays Bank PLC.
Nand Kumar Singh Head, Banking Operations and Customer Services
27+ years’ experience in banking industry; previously served as Retail Banking Head, Patna Circle, at Axis Bank
Kumar Ashish Head , Emerging Entrepreneurs Business 26+ years’ experience in the field of Banking and Finance; previously served as North Zone Head of ICICI Bank and as Group Director at Airtel Money.
Srinivasan Balachander Chief Compliance Officer 20+ years’ experience in banking industry; previously served as Chief Compliance Officer at Axis Bank Ltd.
Arvind Kanagasabai Head, Treasury 30+ years of experience at a PSU Bank; previously served as CFO at SBI DFHI Limited, Mumbai
Rahul Dhanesh Parikh Chief Marketing & Digital Officer 20+ years’ experience in Financial Industry; previously served as Chief Executive Officer at Bajaj Capital Ltd.
Source: Company, Nirmal Bang Institutional Equities Research

In s t itu tio n a l E q u it ie s
Bandhan Bank 49
Board profile
Executives Designation Comments
Dr. Anup Kumar Sinha Non-executive Chairman Economist with Ph.D from University of Southern California Served as Professor of Economics at IIM Calcutta for 25 years
Chandra Shekhar Ghosh MD & CEO Has significant experience in the field of microfinance Awarded ‘Outstanding Leadership Award’ by Dhaka University Having more than 30 years of experience in microfinance & development terrain
Bhaskar Sen Director Retired as Chairman & MD of United Bank of India Previously, Executive Director of Dena Bank Having significant experience in Banking.
Snehomoy Bhattacharya Director Significant experience in public and private banking sector Previously worked as Executive Director – Corporate Affairs Axis Bank
Sisir Kumar Chakrabarti Director Significant experience in public and private banking sector Previously worked as Executive Director – Corporate Affairs Axis Bank
T. S. Raji Gain Director Significant experience in the field of agricultural and rural development, Previously, she has worked with BIRD Currently, CCM & State in Charge – MP - NABARD
Ranodeb Roy Non-Executive Director Founder of RV Capital Management Private Limited, Singapore, he was earlier heading Fixed Income Asia Pacific in Morgan Stanley Asia) Singapore
Santanu Mukherjee Director Significant experience in Banking at various capacities in SBI Group Former MD of State Bank of Hyderabad
Dr. A S Ramasastri Director Director, Institute for Development & Research of Banking Technology; Chairman of IFTAS; company promoted by IDRBT to provide technology services in Banking & financial sectors
Harun Rashid Khan Director Retired as Deputy Governor of Reserve Bank of India Instrumental in formulation of Payments system Vision 2018 of RBI
Dr. Holger Dirk Michaelis Nominee Director Significant experience in private equity and as strategic advisor to financial services companies Currently, he is working with GIC
Vijay N Bhatt Director Significant experience in accounting, audit and assurance Former Sr. Independent Director of BSR & Co., Chartered Accountants
N V P Tendulkar Director Significant experience in finance, accounts and management Former Whole time Director – Finance of Hewlett Packard (India)
Source: Company, Nirmal Bang Institutional Equities Research
In s t itu tio n a l E q u it ie s
Bandhan Bank 50
About Bandhan Bank Bandhan Bank was incorporated on 23rd December 2014 and began operations on 23rd August 2015 when Bandhan Financial Services Limited, the ultimate parent company, transferred its entire microfinance business to Bandhan Bank. The institution started its journey as Bandhan Konnagar in 2001 as an NGO providing microfinance services to socially and economically disadvantaged women in rural West Bengal. Bandhan Bank received its banking license from the RBI on 17th June 2015. The bank is primarily focused on serving the underbanked and underpenetrated markets in India. Its strength lies in microfinance (65% of advances) which it conducts through a network of 3,656 DSCs. Bandhan currently has 11.2mn active micro-borrowers (Sep-20). Along with microfinance, the bank has also focused on creating strong general banking business. As of Sep-20, the bank had 5.05mn general banking customers and 1,045 general banking branches.
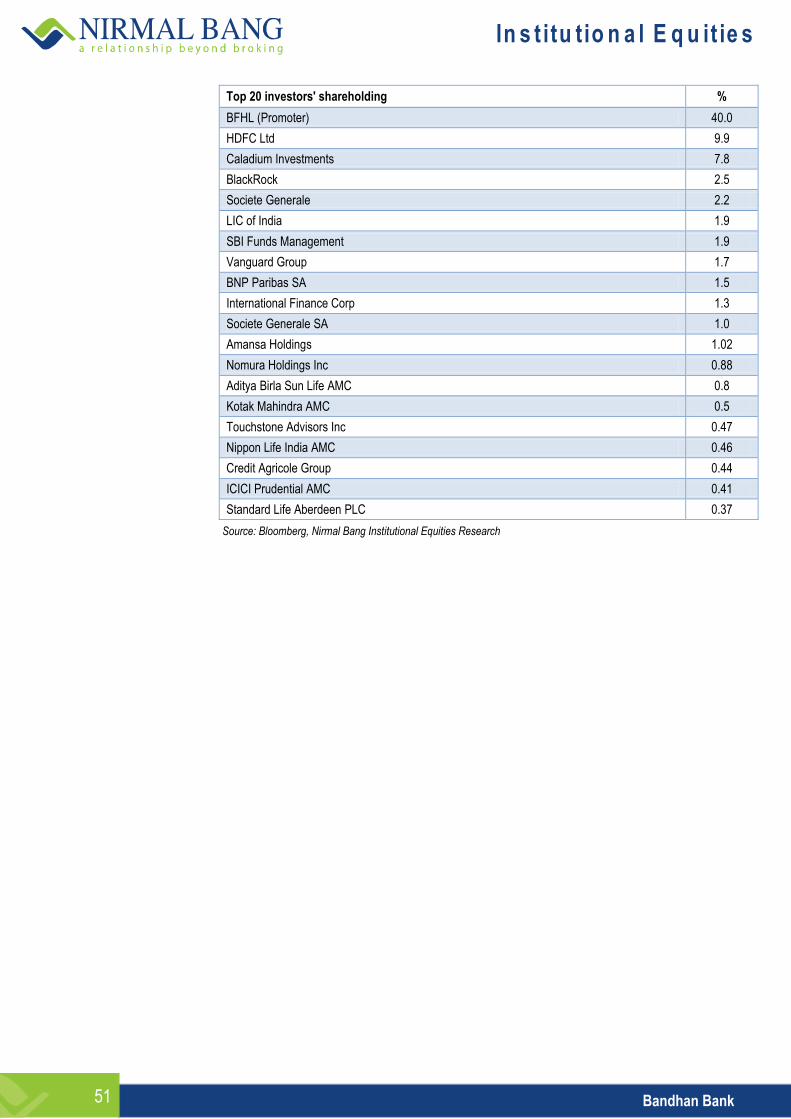
In s t itu tio n a l E q u it ie s
Bandhan Bank 51
Top 20 investors' shareholding %
BFHL (Promoter) 40.0
HDFC Ltd 9.9
Caladium Investments 7.8
BlackRock 2.5
Societe Generale 2.2
LIC of India 1.9
SBI Funds Management 1.9
Vanguard Group 1.7
BNP Paribas SA 1.5
International Finance Corp 1.3
Societe Generale SA 1.0
Amansa Holdings 1.02
Nomura Holdings Inc 0.88
Aditya Birla Sun Life AMC 0.8
Kotak Mahindra AMC 0.5
Touchstone Advisors Inc 0.47
Nippon Life India AMC 0.46
Credit Agricole Group 0.44
ICICI Prudential AMC 0.41
Standard Life Aberdeen PLC 0.37
Source: Bloomberg, Nirmal Bang Institutional Equities Research
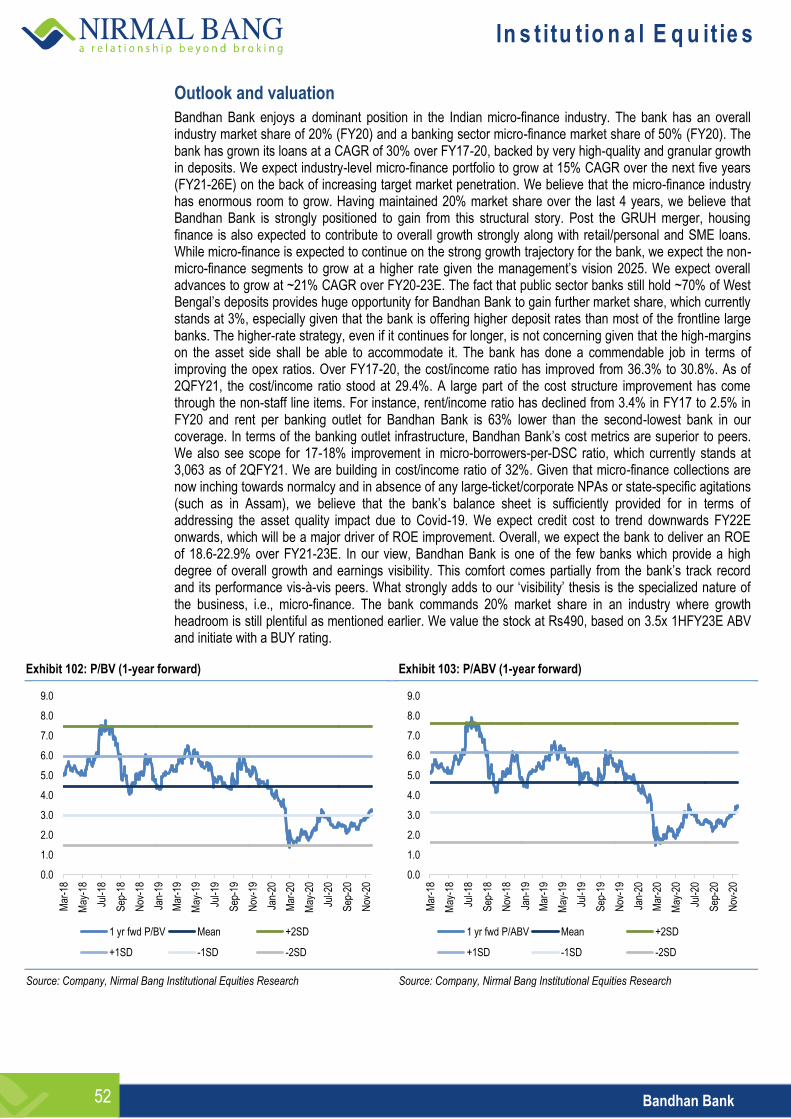
In s t itu tio n a l E q u it ie s
Bandhan Bank 52
Outlook and valuation
Bandhan Bank enjoys a dominant position in the Indian micro-finance industry. The bank has an overall industry market share of 20% (FY20) and a banking sector micro-finance market share of 50% (FY20). The bank has grown its loans at a CAGR of 30% over FY17-20, backed by very high-quality and granular growth in deposits. We expect industry-level micro-finance portfolio to grow at 15% CAGR over the next five years (FY21-26E) on the back of increasing target market penetration. We believe that the micro-finance industry has enormous room to grow. Having maintained 20% market share over the last 4 years, we believe that Bandhan Bank is strongly positioned to gain from this structural story. Post the GRUH merger, housing finance is also expected to contribute to overall growth strongly along with retail/personal and SME loans. While micro-finance is expected to continue on the strong growth trajectory for the bank, we expect the non-micro-finance segments to grow at a higher rate given the management’s vision 2025. We expect overall advances to grow at ~21% CAGR over FY20-23E. The fact that public sector banks still hold ~70% of West Bengal’s deposits provides huge opportunity for Bandhan Bank to gain further market share, which currently stands at 3%, especially given that the bank is offering higher deposit rates than most of the frontline large banks. The higher-rate strategy, even if it continues for longer, is not concerning given that the high-margins on the asset side shall be able to accommodate it. The bank has done a commendable job in terms of improving the opex ratios. Over FY17-20, the cost/income ratio has improved from 36.3% to 30.8%. As of 2QFY21, the cost/income ratio stood at 29.4%. A large part of the cost structure improvement has come through the non-staff line items. For instance, rent/income ratio has declined from 3.4% in FY17 to 2.5% in FY20 and rent per banking outlet for Bandhan Bank is 63% lower than the second-lowest bank in our coverage. In terms of the banking outlet infrastructure, Bandhan Bank’s cost metrics are superior to peers. We also see scope for 17-18% improvement in micro-borrowers-per-DSC ratio, which currently stands at 3,063 as of 2QFY21. We are building in cost/income ratio of 32%. Given that micro-finance collections are now inching towards normalcy and in absence of any large-ticket/corporate NPAs or state-specific agitations (such as in Assam), we believe that the bank’s balance sheet is sufficiently provided for in terms of addressing the asset quality impact due to Covid-19. We expect credit cost to trend downwards FY22E onwards, which will be a major driver of ROE improvement. Overall, we expect the bank to deliver an ROE of 18.6-22.9% over FY21-23E. In our view, Bandhan Bank is one of the few banks which provide a high degree of overall growth and earnings visibility. This comfort comes partially from the bank’s track record and its performance vis-à-vis peers. What strongly adds to our ‘visibility’ thesis is the specialized nature of the business, i.e., micro-finance. The bank commands 20% market share in an industry where growth headroom is still plentiful as mentioned earlier. We value the stock at Rs490, based on 3.5x 1HFY23E ABV and initiate with a BUY rating.
Exhibit 102: P/BV (1-year forward) Exhibit 103: P/ABV (1-year forward)
Source: Company, Nirmal Bang Institutional Equities Research Source: Company, Nirmal Bang Institutional Equities Research
0.0
1.0
2.0
3.0
4.0
5.0
6.0
7.0
8.0
9.0
Mar
-18
May
-18
Jul-1
8
Sep
-18
Nov
-18
Jan-
19
Mar
-19
May
-19
Jul-1
9
Sep
-19
Nov
-19
Jan-
20
Mar
-20
May
-20
Jul-2
0
Sep
-20
Nov
-20
1 yr fwd P/BV Mean +2SD
+1SD -1SD -2SD
0.0
1.0
2.0
3.0
4.0
5.0
6.0
7.0
8.0
9.0
Mar
-18
May
-18
Jul-1
8
Sep
-18
Nov
-18
Jan-
19
Mar
-19
May
-19
Jul-1
9
Sep
-19
Nov
-19
Jan-
20
Mar
-20
May
-20
Jul-2
0
Sep
-20
Nov
-20
1 yr fwd P/ABV Mean +2SD
+1SD -1SD -2SD
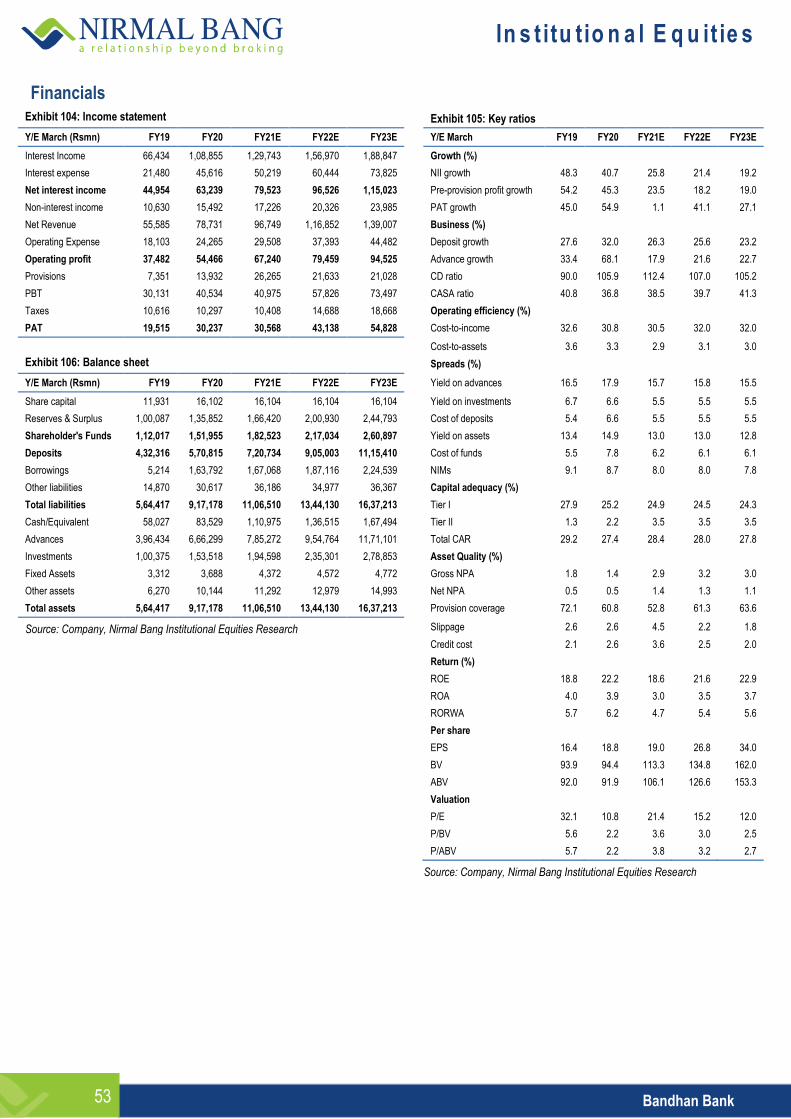
In s t itu tio n a l E q u it ie s
Bandhan Bank 53
Financials
Exhibit 104: Income statement
Exhibit 105: Key ratios
Y/E March (Rsmn) FY19 FY20 FY21E FY22E FY23E
Y/E March FY19 FY20 FY21E FY22E FY23E
Interest Income 66,434 1,08,855 1,29,743 1,56,970 1,88,847
Growth (%)
Interest expense 21,480 45,616 50,219 60,444 73,825
NII growth 48.3 40.7 25.8 21.4 19.2
Net interest income 44,954 63,239 79,523 96,526 1,15,023
Pre-provision profit growth 54.2 45.3 23.5 18.2 19.0
Non-interest income 10,630 15,492 17,226 20,326 23,985
PAT growth 45.0 54.9 1.1 41.1 27.1
Net Revenue 55,585 78,731 96,749 1,16,852 1,39,007
Business (%)
Operating Expense 18,103 24,265 29,508 37,393 44,482
Deposit growth 27.6 32.0 26.3 25.6 23.2
Operating profit 37,482 54,466 67,240 79,459 94,525
Advance growth 33.4 68.1 17.9 21.6 22.7
Provisions 7,351 13,932 26,265 21,633 21,028
CD ratio 90.0 105.9 112.4 107.0 105.2
PBT 30,131 40,534 40,975 57,826 73,497
CASA ratio 40.8 36.8 38.5 39.7 41.3
Taxes 10,616 10,297 10,408 14,688 18,668
Operating efficiency (%)
PAT 19,515 30,237 30,568 43,138 54,828
Cost-to-income 32.6 30.8 30.5 32.0 32.0
Cost-to-assets 3.6 3.3 2.9 3.1 3.0
Exhibit 106: Balance sheet
Spreads (%)
Y/E March (Rsmn) FY19 FY20 FY21E FY22E FY23E
Yield on advances 16.5 17.9 15.7 15.8 15.5
Share capital 11,931 16,102 16,104 16,104 16,104
Yield on investments 6.7 6.6 5.5 5.5 5.5
Reserves & Surplus 1,00,087 1,35,852 1,66,420 2,00,930 2,44,793
Cost of deposits 5.4 6.6 5.5 5.5 5.5
Shareholder's Funds 1,12,017 1,51,955 1,82,523 2,17,034 2,60,897
Yield on assets 13.4 14.9 13.0 13.0 12.8
Deposits 4,32,316 5,70,815 7,20,734 9,05,003 11,15,410
Cost of funds 5.5 7.8 6.2 6.1 6.1
Borrowings 5,214 1,63,792 1,67,068 1,87,116 2,24,539
NIMs 9.1 8.7 8.0 8.0 7.8
Other liabilities 14,870 30,617 36,186 34,977 36,367
Capital adequacy (%)
Total liabilities 5,64,417 9,17,178 11,06,510 13,44,130 16,37,213
Tier I 27.9 25.2 24.9 24.5 24.3
Cash/Equivalent 58,027 83,529 1,10,975 1,36,515 1,67,494
Tier II 1.3 2.2 3.5 3.5 3.5
Advances 3,96,434 6,66,299 7,85,272 9,54,764 11,71,101
Total CAR 29.2 27.4 28.4 28.0 27.8
Investments 1,00,375 1,53,518 1,94,598 2,35,301 2,78,853
Asset Quality (%)
Fixed Assets 3,312 3,688 4,372 4,572 4,772
Gross NPA 1.8 1.4 2.9 3.2 3.0
Other assets 6,270 10,144 11,292 12,979 14,993
Net NPA 0.5 0.5 1.4 1.3 1.1
Total assets 5,64,417 9,17,178 11,06,510 13,44,130 16,37,213
Provision coverage 72.1 60.8 52.8 61.3 63.6
Source: Company, Nirmal Bang Institutional Equities Research
Slippage 2.6 2.6 4.5 2.2 1.8
Credit cost 2.1 2.6 3.6 2.5 2.0
Return (%)
ROE 18.8 22.2 18.6 21.6 22.9
ROA 4.0 3.9 3.0 3.5 3.7
RORWA 5.7 6.2 4.7 5.4 5.6
Per share
EPS 16.4 18.8 19.0 26.8 34.0
BV 93.9 94.4 113.3 134.8 162.0
ABV 92.0 91.9 106.1 126.6 153.3
Valuation
P/E 32.1 10.8 21.4 15.2 12.0
P/BV 5.6 2.2 3.6 3.0 2.5
P/ABV 5.7 2.2 3.8 3.2 2.7
Source: Company, Nirmal Bang Institutional Equities Research
In s t itu tio n a l E q u it ie s
Bandhan Bank 54
DISCLOSURES
This Report is published by Nirmal Bang Equities Private Limited (hereinafter referred to as “NBEPL”) for private circulation. NBEPL is a registered Research Analyst under SEBI (Research Analyst) Regulations, 2014 having Registration no. INH000001436. NBEPL is also a registered Stock Broker with National Stock Exchange of India Limited and BSE Limited in cash and derivatives segments. NBEPL has other business divisions with independent research teams separated by Chinese walls, and therefore may, at times, have different or contrary views on stocks and markets. NBEPL or its associates have not been debarred / suspended by SEBI or any other regulatory authority for accessing / dealing in securities Market. NBEPL, its associates or analyst or his relatives do not hold any financial interest in the subject company. NBEPL or its associates or Analyst do not have any conflict or material conflict of interest at the time of publication of the research report with the subject company. NBEPL or its associates or Analyst or his relatives do not hold beneficial ownership of 1% or more in the subject company at the end of the month immediately preceding the date of publication of this research report. NBEPL or its associates / analyst has not received any compensation / managed or co-managed public offering of securities of the company covered by Analyst during the past twelve months. NBEPL or its associates have not received any compensation or other benefits from the company covered by Analyst or third party in connection with the research report. Analyst has not served as an officer, director or employee of Subject Company and NBEPL / analyst has not been engaged in market making activity of the subject company. Analyst Certification: We, Raghav Garg, research analyst and Arjun Bagga, research associate and the authors of this report, hereby certify that the views expressed in this research report accurately reflects our personal views about the subject securities, issuers, products, sectors or industries. It is also certified that no part of the compensation of the analysts was, is, or will be directly or indirectly related to the inclusion of specific recommendations or views in this research. The analysts are principally responsible for the preparation of this research report and have taken reasonable care to achieve and maintain independence and objectivity in making any recommendations.
In s t itu tio n a l E q u it ie s
Bandhan Bank 55
Disclaimer
Stock Ratings Absolute Returns
BUY > 15%
ACCUMULATE -5% to15%
SELL < -5%
This report is for the personal information of the authorized recipient and does not construe to be any investment, legal or taxation advice to you. NBEPL is not soliciting any action based upon it. Nothing in this research shall be construed as a solicitation to buy or sell any security or product, or to engage in or refrain from engaging in any such transaction. In preparing this research, we did not take into account the investment objectives, financial situation and particular needs of the reader.
This research has been prepared for the general use of the clients of NBEPL and must not be copied, either in whole or in part, or distributed or redistributed to any other person in any form. If you are not the intended recipient you must not use or disclose the information in this research in any way. Though disseminated to all the customers simultaneously, not all customers may receive this report at the same time. NBEPL will not treat recipients as customers by virtue of their receiving this report. This report is not directed or intended for distribution to or use by any person or entity resident in a state, country or any jurisdiction, where such distribution, publication, availability or use would be contrary to law, regulation or which would subject NBEPL & its group companies to registration or licensing requirements within such jurisdictions.
The report is based on the information obtained from sources believed to be reliable, but we do not make any representation or warranty that it is accurate, complete or up-to-date and it should not be relied upon as such. We accept no obligation to correct or update the information or opinions in it. NBEPL or any of its affiliates or employees shall not be in any way responsible for any loss or damage that may arise to any person from any inadvertent error in the information contained in this report. NBEPL or any of its affiliates or employees do not provide, at any time, any express or implied warranty of any kind, regarding any matter pertaining to this report, including without limitation the implied warranties of merchantability, fitness for a particular purpose, and non-infringement. The recipients of this report should rely on their own investigations.
This information is subject to change without any prior notice. NBEPL reserves its absolute discretion and right to make or refrain from making modifications and alterations to this statement from time to time. Nevertheless, NBEPL is committed to providing independent and transparent recommendations to its clients, and would be happy to provide information in response to specific client queries.
Before making an investment decision on the basis of this research, the reader needs to consider, with or without the assistance of an adviser, whether the advice is appropriate in light of their particular investment needs, objectives and financial circumstances. There are risks involved in securities trading. The price of securities can and does fluctuate, and an individual security may even become valueless. International investors are reminded of the additional risks inherent in international investments, such as currency fluctuations and international stock market or economic conditions, which may adversely affect the value of the investment. Opinions expressed are subject to change without any notice. Neither the company nor the director or the employees of NBEPL accept any liability whatsoever for any direct, indirect, consequential or other loss arising from any use of this research and/or further communication in relation to this research. Here it may be noted that neither NBEPL, nor its directors, employees, agents or representatives shall be liable for any damages whether direct or indirect, incidental, special or consequential including lost revenue or lost profit that may arise from or in connection with the use of the information contained in this report.
Copyright of this document vests exclusively with NBEPL.
Our reports are also available on our website www.nirmalbang.com
Access all our reports on Bloomberg, Thomson Reuters and Factset.
Team Details:
Name Email Id Direct Line
Rahul Arora CEO [email protected] -
Girish Pai Head of Research [email protected] +91 22 6273 8017 / 18
Dealing
Ravi Jagtiani Dealing Desk [email protected] +91 22 6273 8230, +91 22 6636 8833
Michael Pillai Dealing Desk [email protected] +91 22 6273 8102/8103, +91 22 6636 8830
Nirmal Bang Equities Pvt. Ltd.
Correspondence Address
B-2, 301/302, Marathon Innova,
Nr. Peninsula Corporate Park,
Lower Parel (W), Mumbai-400013.
Board No. : 91 22 6273 8000/1; Fax. : 022 6273 8010