Embed Size (px)
Citation preview

ED 245.680
-AUTHOR Wallace; Danny P.; And OthersTITLE Illinois Library Statistical Report No 13.INSTITUTION/ Illinois Univ., Urbana. Library Research Center.SPONS AGEN27. Illinois .State Library, Springfield.PUB DATE May 84 .
63p.;* Portions may be'marginally legible.'Statistical Data (110) -- Reports -Research/Technical (143) -- Tests/Evaluation
(160)
NOTE,4 TUB TYPE
EDRS PRICE MF01/PC03 Plus Postage..DESCRtPTORS Librarians; *Library Expenditures; *Library
Personnel;\*LibMy Research; Library Survey's; -,
*Public Libraries; Questionnaires; *Salaries; SalaryWage Differentials; *Special Libraries; StatistiCalAnalysis
IDENTIFIERS *Illinois`.9P6- A0/9,
ABSTRACTThe main article in this 3ssue it a repor
e 't"Salaries and Expenditures of Illinois Special Libraries, 1983," -, \
based on 366 usable responses to amail questionnaire. data Onvariables (including 4 aspects, of salaries) are cross-analyad by k,factors: geographical area, person to whom head librarian orts,tsalt of head librarian, size of primary clientele, medical/n
iOAmedical
library, and status of organization. The -results of the study indicate that expenditures and head librarians!salaries are: (1) 'greater for libraries in the Chicago area-than forlibraries elsewhere-in the state; (2) greater for libraries servinglarger clienteles than for those serving smaller clienteles; (3)greater for nonmedical libraries than for medical libraries; (4)greater for libraries serving profit-Seeking organizations than forthose in not-for-profit organizations; and (5) greater for librarieswith male head librarians than for libraries with female head:.librarians. Additionally, older head librarians earn greater salariesthan younger head librarians. Other shorter articles deal with the
the hours of opening of Illinois public libraries in October 1982,/turnover of head librarians in Illinois public libraries in 1982/83,
i
, .
and 'effort vs.' ability to pay for local public library Service inIllinois. (Author/DMC)
,-
.y :-
1
* Reproductions supplied by EDRS are the best that can be inadf* from the original document.********i***************************t**********************************

rq
Nry
AETMENT,OF EDUCATIONINs.nturmr EDUCATIONL RESOURCES INFORMATIONCENTER (ERIC)
t has been reproduced as1 from the person or orEtatization
fl
have been made to improveIt,.
Po' ',lions stated in this docu-resent official NIE
Illinois
Danny P.. Wallac., xpendit. Special Li- . : . 4
. .
, -Timothy WHanlon,
Public Librar
Herbert,Goldhor,-: October
.;
Herbert GoldHor, Effo-Public Library Se
ad Liik
nal Pub).. .. . .
''.0.14-ity to P
70f!',..474:
A Ccmplete List of Titles Published in theLibrary Sttistical Repor Seaes
Library Research Center .
Graduate School.of Library and Information Science
University ofIllinois at U0ana-Chempaign
Jim Edgar4
' Secretary of Stateand State Librarian
s
Funded byC
Illinois State Library .
Springfield, Illinois!.May 1984
r4Fes and 10 REPRODUCE THISGadt Ur, \ 1F1/46 BEEN GRANTED BY
1, Rostian
TO THE EDUCATIONAL. RESOURCESINFORMATION CENTER (ERIC)."
441
co
SALARIES AND EXPENDITURES OP ILLINOIS SPX AL LISRARINS, 1983
Introduction.
Methodology
°
by
Danny P. Wallace'Assistant DirectOr-,
Library Research CenterUniversity of. Illinois
CONTENTS .0
Statistical Tests
1
s. 2
3
Representativeness o f the `Study Group 4
Size of Library s -
!-
Operating Expenditures
Characteristics of t
Salaries
-ConclUsions
Tables
Appendix_
Appendix 2: The ese of MaChine-Scored Answer Sheetsin Library Surveys
. .
Head Librarian ....
17
io
Cover Letter and Questionlnaire 35
ct.
. . 39
4
The author would like to thank the.following.people.:.Kohen and the staff of the Measdretnt and Res*rct!_ 4111:4iione:Of
the University ofIllAnotsfs Office-of Ihstruttional-4RepUrOesIDiane Forster, Dave.Conboy and-tHerbert GOldhor, all oC'the,hraryResearch Center; Judy' Genesen and. the other members_ of theApecial_Libraries Association-,.Illinois Chapter AdviAiory .COMmittee "on
Illinois _,State Library SurVeys of. Special Libraries and
Information Centers; ,/and the Executive Committee of the IllinotsChapter of the -SpAcial .Libraries Assoc,iegtion who generouslyagreed to help defray-the costs of. return postage. A Preliiimaryversion &(.this report appeared in the May. 1.983 issue of the. :TheInformant, the newsletter of the Illinois SLA Chapter.
0
N.
4;

:..0ALART0 ANDogisorioRsA,or I,LLINOhS svicx4L/LzsomaxEs;-100
i
Tbe- study of salariee of librari-AndH information, center*employees has
Iteen of interest for-Amite . some ti cUrrent.-
surVeye:have fieen-conducte4:by the. Special Libraries ation,--.-4 -the Association of Research Librariee',.the American Association of
Law Librarles, .the MeditalL4brary Association and.the- AmericanLiiiiaryAesociation. Additionally, there have.been several onerH.time or 'special purpose surveys, andarecent periodicai,'Librery'ComkenAation .Review,.--deels entirely, .;with matters related tosalaries of librarians. Salary eUrveyeiprOvidedata that can be
ueed'in a number of waya.._Data On_thepreeenr salaries'ofemployeeein various types of poeitioneend -institutions can. help'employers seeking to fill similar poeitlons decide What ealsries,should be offered, and- can, help applicants for such positions teet
salOry. requirements- Such data 'can also be used in comparing'
"salaries accord'in'g to,type of position -, type of organization,geograpPiit region, or other demographit characteristics.- ,
0%° frequent conclusion of salary surveys- is:_that 'the
.characteristics :of4ariicular employees are more 'significantly
related to compensation than are the charatteristics of epetificpositions .or organizations. ,aCarpenter and Shearer, repo-rting on astudy of salaries ;of diTectdra ,Of' large public libraries-,
suggested that "there, is recent :evidence that females are , leas
likely than males to direct ,libraries, that they hre paid less,
when ,they ao; and that they are eVenless likely.ti?manfage,largeskstems than small onee.", Other' surveys have confi med'CarOenter,and Shearer's conclusions regarding the role. of sex i determiningsalaries of librarians.
:Salery survey data can also be used in comparing the salaries
4 of %library. personnel to those of employees in. other , Such
comparisons can be Of'partioufar interest in the light"'
developments related-to the concept .of equal pay for eSituations such as' those leading tiD; the strike o
employees in San Jose suggest'that the status ofe libraryiemp oyeesin relation to the status of other employeesimay be an infruentialfactor in dete'rmining Salaries.3
*For the sake of simplicity, throughout the remainder of this
reporty the generic term 'library" will be used to refer to
speCAollibrariesand information centers of all varieties. It
istrra6AUIVnized that the term falls short of ful describing- thefwnCtIOns of many of the information teeter- YJO4 'Statilary,
the t "MIS" will be used to refer to s er's grees in
library- and /or information science.
1 .
The 198-1 Irlotali!, State /.ibrizry sarlzey of Illinois speedial-
.' libraries-dealt with valarieS:and otheirpersonnel dhat.acteristles4and' With the eXpenditures, :Of special libraries.. The datacollected can-be. usecr,to bOld profiles of. the various type-s of
libraries involved the survey and of the persons employed inthose libraries.
.011THODOLliGi
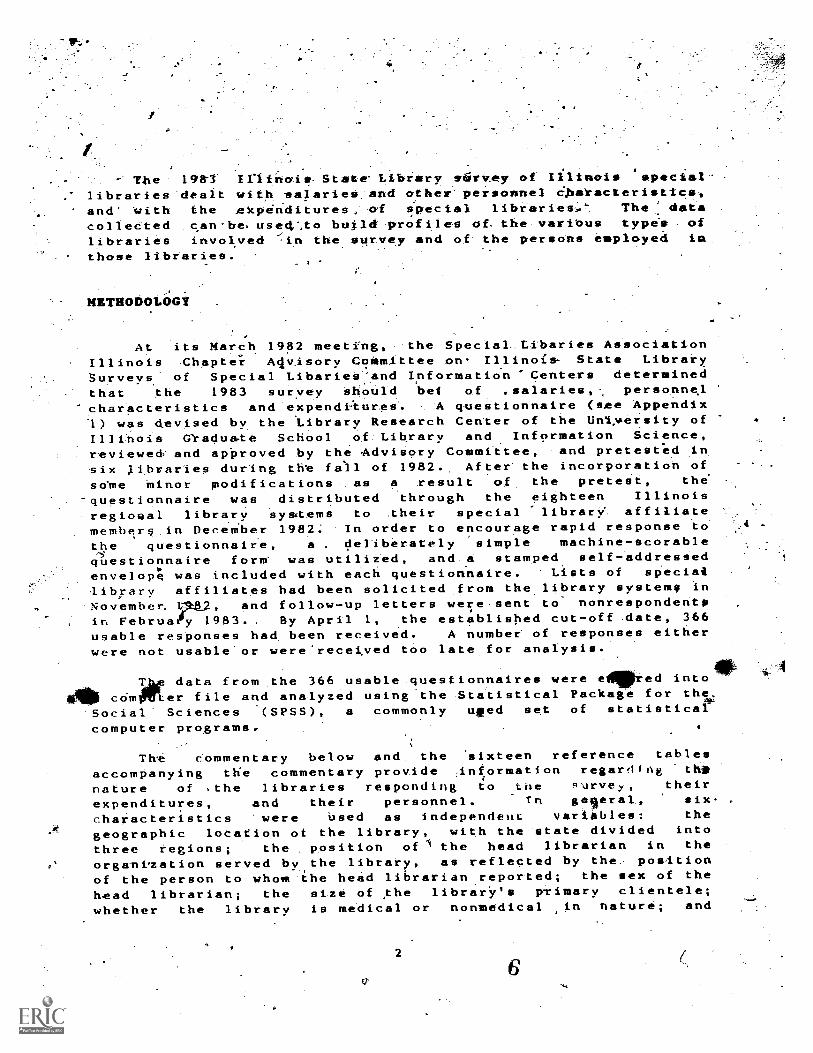
At its March 1982 meeting,' the Special_Ltbaries AssociationIllinois -Chapter A4v_isory CoMmittee on' Illinois- State LibrarySurveys: of Special Libarieig:and Information "Centers determinedthat the 1983 survey ahould be of .salaries, personnelcharacteristics and expendFiureS. A questionnaire (see Appendix`1) was devised by the 'Library Research Center of the University of *
Illinois Graduate School of .Library and Information Science,reviewed and approved by the Advisory Committee, and pretested insix ibraries during the fall of 1982., After the incorporation of
some minor modifications as a result of the pretest, the.
'questionnaire was distributed through the eighteen Illinoisregional library systems to their special library. affiliatemembers in December 1982. In order to encourage rapid response tothe questionnaire, a , deliberately 'simple machine-scorablequestionnaire form' was utilized, and-a stamped self-addresiedenvelop; was included with each questionnaire. Lists of specia4library affiliates had been solicited from the library systems in
November. 182, and follow-up letters were sent to nonrespondentsin FebruaOy 1983. . By April 1, the established cut-off -date, 366usable responses had been received. A number of responses eitherwere not usable'or were received too late for analysis.
T data from the 366 usable questionnaires were e ed intocoMOWler file and analyzed using the :Statistical Package for the,
Social' Sciences '(SPSS), a commonly timed set of statisticalcomputer programs.
The commentary below and. the 'sixteen reference tables
accompanying the commentary provide ;information regarding thi
nature of the libraries responding to the q'arvey, their
expenditures, and their personnel. Th gegeral, six.
characteristics 'were Used as independent variables: the
geographic location of the library, with the state divided into
three regions; the position of 1 the head librarian in the
organization served by, positionlibrary, as reflected by the.. postiontof the person to whom the head librarian reported; the sex of the
head librarian; the size of the library's primary clientele;whether the library is medical or nonmedical in nature; and
2
$
whether the organization served by the library is for-profit or
,not-forlprofft. In some cases, other relationships were tested as
well.
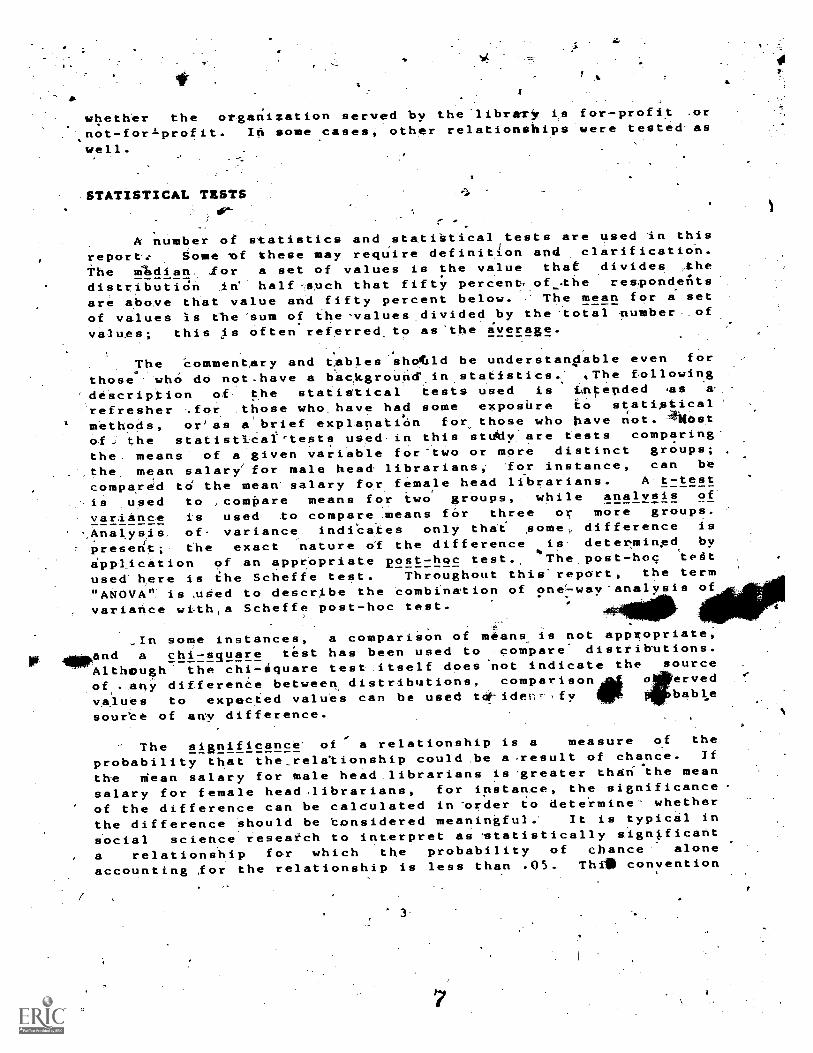
STATISTICAL TESTSOF"
Pc number of statistics and statistical tests are used in this
report: Some ef these may require definition and. clarification.
The median. ,for a set of values is the value that divides the
distributiOn in half such that fifty percent, of the respondentsare above that value and fifty percent below. The mean for a setof values is the 'sum of the-values.divided by the-total number..ofvalues; this is often referred, to as 'the average.
The commentary and tables shofild be understan#able even for
those who do not-have a bac,kgrouneinstatistics." ,The following
' description of the statistical tests used is *attended es s
refresher ..for those who. have had some exposure to statistical'
methods, or'as esbrief explsnatiOn for those who have not. Sliest
Ofj the statistICaf-tests used in this stuitly. are tests comparing-
the means of a given variable for-two or more distinct groups;
the mean salary'for male head librarians; for instance, can be
compared to the mean- salary for female head librarians. A't-test
-is used to ,compare means for two groups, while analysis of
variance is used to comparemeans for three or more groups.
Analssis, of- variance, indiCates only that some difference is
present; the exact nature of the difference is determined by
application of an appropriate post-ho6 test., Thepost-hoc teatused here is the Scheffe test. Throughout thie'report, the term
"ikt4OVA"' is uSed to describe the combination of one-way-analysis ofvariance wiAh,a Scheffe post-hoc test.
,In some instances, a comparison of means is not appropriate,
and a chi-square test has been used to compare disttitrutions.
Although the chi-iquare test .itself does not indicate the source
of any differenCe between distributions, comparison o erved
values to expected values can be used toie-iden.fy bable
source of any difference.
The significance' of a relationship is a measure of the
probability that the_reletionship could be a .result of chance. If
the mean salary for male head, librarians is 'greater than- 'the mean
salary for female head librarians, for instance, the significanceof the difference can be calculated in -order to deteZmine whetherthe difference should be Considered meaningful. It is typical in
social science research to interpret as statistically signtficant
a relationship for which the probability of chance alone
accounting for the relationship is less than .05. Thil, convention
3.
4144.-111111
4

6 .96
has been obSerVed here& It - hould- be .noted'-thatbetween Agroups'.can.be statistically signifi.Cant_
part- iculariy large, - and a- large differencestatistically significant.-. *5-
4,
4'
REPRESENTATIVENESS OF THE STUDY GROUP
a dffferencwiChbut beingmay, not be.
Since' the rekspondents to thejueEitionnaire form -a self-
selected group, and were not chosen in any random-or - scientificmanner, ,the_stndy group canAot:sutamstAcally be - considered a validsample of the entire group of'LLLINET SpeCial library afflIiates.,;
'As mentioned earlier, the eighteen librarysystems were asked inNovember 1982 for lists of their 'special library_ affiliate
members';' all but one of the systems 'provided such,l,ists. Theslists .identified 470 affiliated special librSrfes; -A 'listing .
provided by the Illinois State_. Library In late 1982 showed a.totalof 503 special libr4ry affiliate members. -The 366 respondents tothe surveye.n, represent, about seventy-three percent of the 503special libraries which were ILLINET affiliates "in late 1982.
Table 1 provides a system-by-system co rison, divided intomedical and nonmeidica ies,. of the .libraries listed. by thesystems in No'veliber and the respondents to the 1983 survey.;Examination o.f this ble suggests that 'the study group is
reasonably, represents ive of the total group of ILLINET
affiliates. Table 2 shows the distribution of special librariesin the, state by three geographic regions, comparing.' the
respondents of the 1983 survey to the 503 special libraries known
to haye been affiliated with ILLINET -late inn 1982.* A chi-squaretest shows that there is no statistically significant differencebetty en the two groups with regard to geographic distribution. It
seems safe to assume, then, that the survey "group is
representative of the ILLINET affiliates as*a whole. It should benoted that this does not necessarily mean that the survey group isrepresentative of all :Illinois special libraries.' Not:all such
librAties are members, of'ILLPNET, and it seems likely that thereis some set of,important characteristics distinguishing speciallibraries tl\at are members of TLLINET from nonmembers. I, That set
1
of characterisitics is-unknown at this time,' and its delineationis beyond the 'scope of this report.
1
- '
*The. December 1982 listing uselein Table 2 is more complete than
the November 1982 1 listing used in ,Table. 1, -btit\ 1:toes- not
distinguish between medical and nonmedical libraries. 1*,
''.-
4
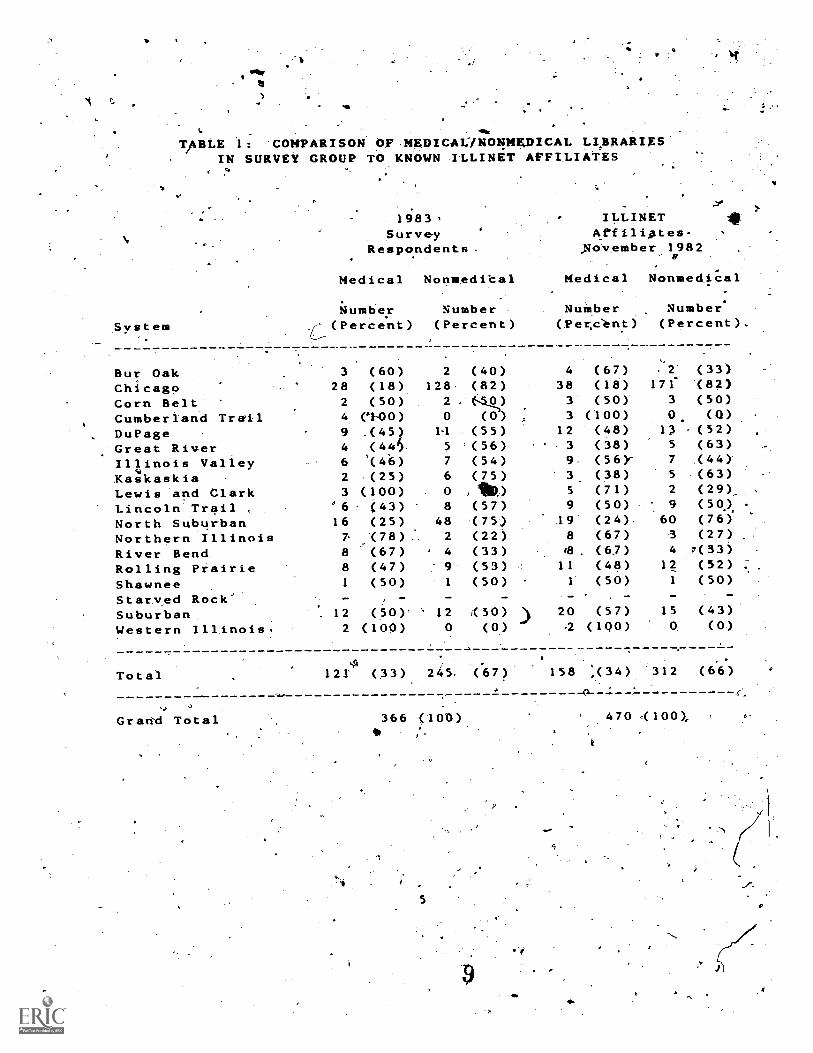
TABLE 1: COMPARISON OF MEDICAL /NONMEDICAL LIBRARIESIN SURVEY GROUP TO KNOWN ILLINET AFFILIATESo
System
1483.Survey
Respondents.
Medical Nonmedical
Number Number(Percent) (Percent)
ILLINETAtfiliptes-
NoVember 1982
Medical NonmediCal
Number Number(Per,cnt) (Percent) .
Bur Oak 3 (60) 2 (40) 4 (67) .2 (33)
Chicago 28 (18) 128, (82) 38 (18) 171 (82)Corn Belt 2 (50) 2 (50) 3 (50)
Cumberland Trail 4 (°l-00) 0 (0) 3 (.100) O. (0)
Du Page 9 .(45) 1.1 (55) 12 (48) 13 (52)Great River 4 (446. 5 '(56) 3 (38) 5 (63)
Illinois Valley 6 '(46) 7 (54) 9. (56)r 7 (44)
Kaskaskia 2 (25) 6 (75) 3 (38) 5 (63)
Lewis and Clark 3 (100) . 0 , 5 (71) 2 (29)_ .
Lincoln Trail , '6- (43) 8 (57) 9 (50) 9 (50),
North Suburban 16 (25) 48 .(75) 19' (24). 60 (76)
Northern Illinois (78) 2 (22) 8 (67) 3 (27)
River Bend 8 (67) ' 4 (33) 4. (6.7) 4 :(33)
Rolling Prairie 8 (47) 9 (53) 11 (48) 12 (52)
Shawnee 1 (50) 1 (50) 1 (50) 1 (50)
Starved Rock' . -
Suburban . 12 (soy 12 i-(50) 20 (57) 15 (43)
Western Illinois, 2 (100) 0 (0) 2 (100) 0. (0.)
tia
Total 121 (33) 245. (67) 158 :(34) '312 (66)
IL"
0
Grawd Total 366 (100). ° 470 4100) 0
5

. TABLE 2 : COMPARISON .OF GEOOWAPHICAL. DIgTRIBUTION OP LIBRARIESIN SURVEY GROUP'TO KNOWN ILLINiT AFFILIATES
7
cago area[hero and Central-IIlinoisthern Illinois
1983 Survey ILLINET AffiliatesRespondents /December 1982
NuMber Number(Percent,) a (Percent) .
269 (73)54 (15)43 (1.2) ..
.
Total 366 (100) 503 (100)
367' (73)--82 (16)54 (11)
LSV, E OF LI111tARY..
Data concerning the size of the library's primary .clientelewe e gathered as an indicator-of size. ,These data are summarizedin Table 3 (page 20). The overall mean number-ol persons ser'A,ed
,is 766... while the median is 376:' This is substantially largerthan,the median of 250 reported in both 1981 and 1982. he reasonfor this .increase in the median is unknowd:.._. it is PP ble that
the group of respondents in 1983 was somewhat different.
from the
1981 and' 1982 respondents or that the .primar.y clienteles of
affiliated special libraries have indeed grown since ,1982. It is
also known that the data reported for size of primary clienteleare not always consistent: some respondents report the number ofpersons_ why ha4e actual y used the library during a particularperiod of-time, while of ersr'eport the nuMber of persons eligibletd use the library. I may be valid to assume that this problemdoes not greatly affect the analysis presented here, but theinconsistency should; be taken into account when evaluating data
regarding sizeiol priMary clientele-throughout this report. The-mse--inis greatest for the. Southern Illinois area told least for the
Northern and central Illinois area; ANOVA, heiteveri shows that the
differences in the means are not statistically sighlficant.Primary- clienteles were greatest for libraries in which the h'ead
6.
1

/librarian reported directly to upper management, and least ire
those in which the head librarian reported neither uppermanagement nor- to middle managemenit. . ANOVA shows '---that the
difference in the means for these three groups'is' statisticallysignificant (p < :01).
...-
Both the median and mean size of primary clientele are b-
stantially greater -Ivor libraries in not-for-profit ,organizatiedsthan for
et
Hose
in profit-seeking organizations.' Themeanofor not-,
.- _-Li)foe mean lor preIit-seekingorganizations is 594; ,a t-test shows that this difference between '
the means is statistically signficant jp < .01). Thirty -two- percent of the libraries in not-for-profit ganizations servedprimary clienteles of 1,000 or more, while ly seventeen percentof those in profit - seeking organizations served.primary'clientelesof 1,000 or'more. The median size-of primary clientele is 609 formedical libraries, and only 252 for nonmedical libraries, whilethe means are852 and 723,. respectively (the difference betweenthe means' is'not statistically significant). There were many more
° relatively ,small nonmedical libraries than there were medicallibraries; forty -four' percent of the libraries in the nonmedicalcategory served primar'y clienteles of less than two hundred people,as opposed to only eighteen percent of the medical libraries.
. `...,\ 4
\0
OPERATING EXPENDITURES
Respondents were asked to provide, data regarding their.
operating ex'penditures for their- most recent fiecal., year.
Expenditures, were recorded in each of three categoriesexpenditures for salaries, expenditure -s for materials, and all
other operating expenditures. The sum of these specificcategories of 1,Apenditures was used in calculating total operating
penditures for each library...
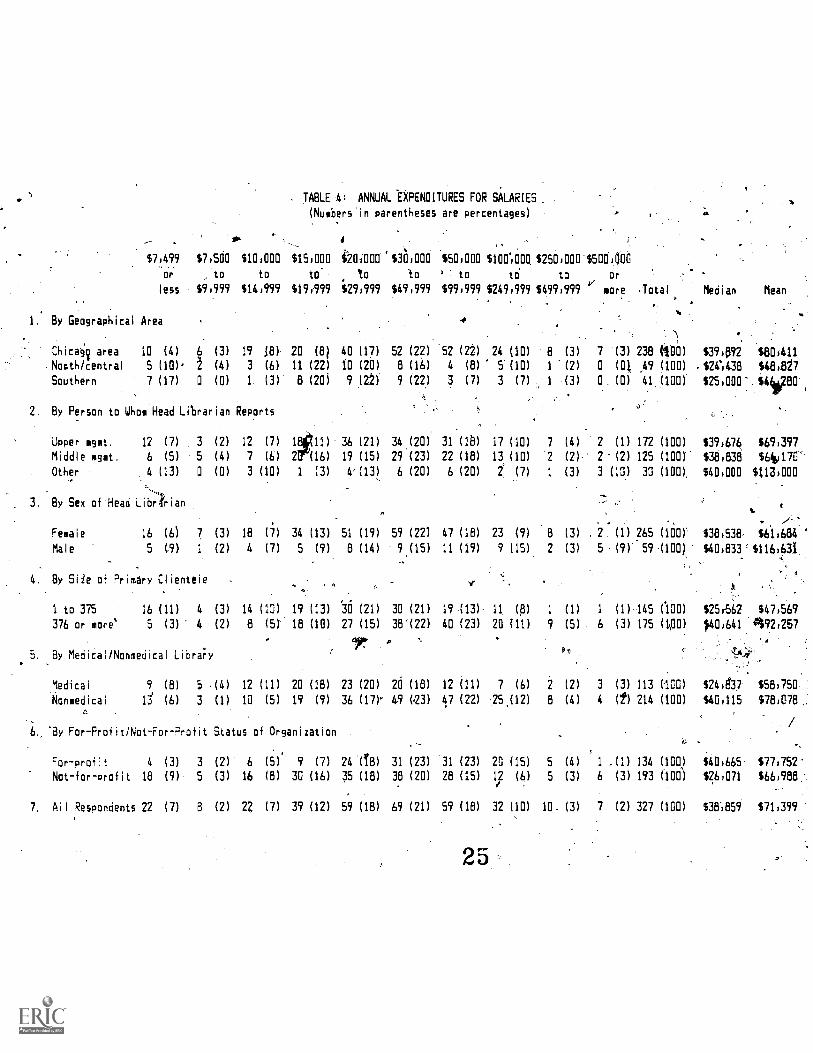
The median expenditure for salaries is S38,859, while the
-mean is S71,399 (Table 4,,w page 21) . Eighty- f'iv'e percent of therespondents reported that their expenditures for salaries totalledless' than S100,000. As might be expected, both the median and themean for the Chicago area are Substantliiarly .greater' than the-medians and means for the Northern and.cJntral Illinois and South-ern Lllinois regions. ANOVA,sphows that-there is no statisticallysignificant difference between the means for the Northern andcentral' Illinois and Southern Illinois areas, but that both aresignificantly less than the mean for the Chicago area (p < .059.
Sixty percent of-the libraries in the-Chicago area reported total
salary -expenditures of $30,000 or more, 'while- only thirtrsix
7
.
stv
e), ''r-
t
'percent of the.14braries i'n the Nortlexn.And-oentral Illinoia.areg_:._...
Agend .thirty-nine Percnt of .those in tfie Soathern, X.3.1.rnbis area - -.',
. . ._ .
repoxt.ed total salary expenditures of $:16'031).0 -or. more.* 1 -
. s
4-'1-7Vxpenditures for. salaries varied according to the.positien of
',:' .ttie head librarian in-, the:Organizational-structqre, with both. themediten 'and. mean being greatest for lihraries_in which* the head,v. .
librarAan reports', to Upper:',Managemen't -,nor 'to middlemanagement -and least for thoseln which the head -librarian repOitato middle management'. 'ANOVA shows that the difference-between the,means foe libraxies-in .which the bea4,..Aibraxian reports to upper
,management'and,those in whlch,ifie head 1,1brati,gxe reports to, middlemanagement- is,'not significantly different, but that both are.SignificantlyYdifferenCfrom the mearr'forOibraiieiin the "other".category. It should: noted, . how'ever,:thit the statiefice.
, .
aibraries in the.uother" category -art based on datafrom onlythirty respondent's. This means.- that, for the vast'inajority
expenditures for salaries do 'not vary wignificadtly'accerding- 't9.% inety-one percent). of the librariee included in ';the suryey,_...
,- .
the position of the bead librarterliwthe stru'c'ture of...the-Organ-
:./.''. .-: , ..
.
ization.0
/ ' , ,Tablk 4 also compares total expenditures for -.salaries for
libraries .with female head librarians to those- for ltbraries'wtth.male-head li-brarians. Although the medians are 0i:substantiallydifferent($38,538 for ltbrarfes:with `female headllibrariansversus $40,833 fox libraries witPi:male head 1ibrarian.S); the-meateare vastly' different. The.mean.expLyitture -fox'
-salaries,- kor.libraries with male head librarians ts nearly, twice the men. 'fox
...
libraries, with female head librarianav .A t--'test shows that thisdifference is statistically -significant(p < ':02)... '.(inli., thirteen,_
. .-
percent of the -libraries.with female head. librarians reported- ---,salary expenditures ofs$1,00,000-or more, .compered'to-twenty7sevenpercent of the libraries with Male head librarians. .. .:
- ...
Not unexpectedly, libraries wi-th-l:arger'primarx'. clienteles-. .
also spent more for salaries than did,'Iibreries.. with smallerprimary clientelei. The mean expenditure for salaries is_ nearMili&
. .
twice as great for libraries. s_erviligprimary- clienteles of 376, or ;,
more than, for those serving-3175'or fewer. A t-.test:in4icaXes thatthis difference is statisticell.y..al,gnificaht.<-11)', Forty-twopercent of, the libraries with primet.y clienteles of,1761Ox moxe..,reported '.total expenditures 'fo-salaries 'of .$50,0150 or more;comparedtotwenev,three'percent-Of_the.rlibrari-easeriiingprimary
.
,
.4glienteIes of-375 or feWer. . .
.. ,,,- . .
Although,bo.th the 'median and mean are &reetet:for nonmedicalv
libraries i'than for medical Aibrarie.4, a t-test .shows that :-thedifference in means, Is ilotitetieiically.fsignificent. 'Similarly,
iiih-.although the medied and mean are greaterAor pries in profit- .
. .!

-seekiAtz AOrganitations than.for libraries in not-for-profit. organ-.fzatiOns, the. difference in means is not significant:
The mean expenditure.fOr materials for all respondents$38,550, and the--median is .$21,641 (Table 5., page 22)., Eighty-.
'seven . percent, of the respondents reported materials expendituresof less than $100,000; only threepercent reported annual expend-itures formaterials.totalling less than $.1,000,-- Both-the meanand the med,kan are greatest for the chicago area and71.east ..for the
Southern Iftinois.'region. AgOVA indiay)!.s that the dilferenCesamong the mearisAre:statiatical,7y significant (p:< .00.. Thirtypercent of the` sposidents Chicago; area reported expend-
? r:..for Mate.rNtlof$50,000 or more, compared to_ twenty -threepercent for th.e.'4'rthernand central jllsinois area and only twelvepercent f'pr the Southern Illinois area.,
As was true of expenditures farsalaries,. expe ditures forMaterials were greatest for libraries'in which the he d librarianrepOrted neither to upper nor to middle management. The medianexpenditure for material's is 8;74,036. for libraries in thie.',
category, compAxed, to '$17,982 f101ibrariesin;which the head
Librarian reported ,to upper:management and:518,452cfor librarie;Ai
in which the head librarian reported:to middle management.- The'
.mearCis'S62,363%fo'r libraries in the "other"'category, compared$3,5,.447 for Libraries in which the head librarian reported..to':upper management and $36,898 for those to which the head librarianreported- to middle management., ANOVA shows that the mean: for.14braries in the ."other" category is significantly greater than
the means for 'the other two categories (p- < -.01). ,lifty-two:
percent 'of the 'respondents in the "other"- category . reportedmaterials expenditures of $,50,000 or more, compared to°. twenty-four,percent of the libraries in which the head librarian reported
upper management and twenty-five 'percent of the libraries in
which the head 14brariaftreported to middle management s.
AlthoUgh 4oth the, mean and medianfor materials expendituresare- Greater for libraries in which the head librarian was ..male
.4tlian':for those Am which the Ahead librarian, was female, the differ-ence bet\ween :the meane'is not significant. The mean for librarieswith relatively larger primary clienteles .($45,205) is
signifiCdmtly greater than.ihe mean for' libraries serving fewer,
than* 376 people ($31,314),' according. 'to a t-test (p < .01),
Thirty percent :of- the libraries"serving 376 or more people spent$5.003.00. or more on: materials, compared' -to twenty-three percent ofthe libraries with primary clienteles of 375 or -fewer. The-meanis -alsO,aignificantly greater for nonmedical libraries- than for
medical 'liharies,-($45",066 vs. $26,3245, p < .01). Thirty-fivepercent ofi,>'thenonmedical libraries reported materials. expend-itures of $50,000or more, compared,to onfy thirteen.percent.the medical libraries. The mean for libraries in Profit-seeking

-organizations, is $53;233, significantly greater than phe meangf'.$28,249 fOr - libraries in', not-for-profit organizations (t-test,
p Forty -three petcent of the libraries in profit -seeking,.,-corianfzationS reportedmaterials, expenditures.of 450o000 corJTIOre,''
while only sixteen percent,of the libraries -in_ not- for -pr fitorganizations spent $50,000 or more on materials.
The distribution of operating expenditures other tha .exikend-.
itures for materials and s4laries is quite skewed (Table 6, page23). The median is only $6,956, and fifty-nine 4rcent of' therespondents reported expenditures. of less than ten thousanddollars., The meanis $24,442, reflecting the influence of a'veryfew libraries whose expenditure's in this categOry were quitelarge. This ''difference -between the median and the mean is
repeated for each of the three geographic _areas; as with.eXPenditursee for° materials and for salaries; both the. median' andthe.mean are greittest for libraries in the ChiCago area. 'However,the differences - among the means for the three geographic areas arenot statistically significant. The' means also do not vary
according to the pOsition of the ..head librarianxwithin the organizational structure Or the the sex ol the head
librariah. The mean for libraries serving Larger primaryclienteles is significantly. greater than for libraries servingsmaller primary clienteles(p .< .01), .'and is signifcantly greaterfor nonmedical librariesthan for medical libraries (p < .02).Although. the'median and the pieaniare both greater for libraries infor-profit 'organizations XhanYfor libraries in not-fdr-profitorganizations, the difference between the -means is not
significant.
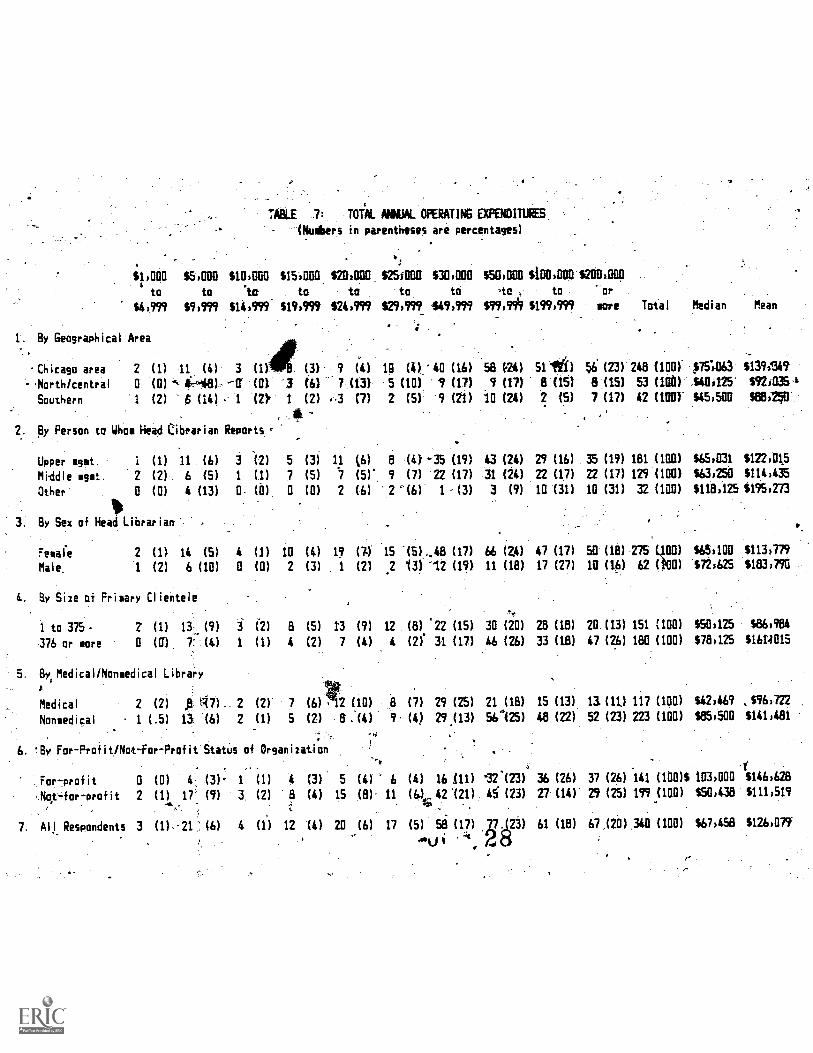
Figures for total operating expenditures were calculated by
adding.the figures for expenditures for salaries, eXpenditures for
materials and "other" operating expenditures. The median figurefor total operating.expenditures for all'respondents is $67,458,,
while the mean is $126,079 (Table 7; page 24). More than one-third (387.) of the respondents reported total operating expend-itures of $100,000 or more, and only seven percent reported totalannual,- operating expenditures. of lesi than $10,000.
TT
Both the mean an4 the median are greatest for 'libraries ih
the Chicago area. The median is least for', libraries :in the
Northern and central_Illinoid region, while the mean is least forthe Southern Illino..s area. ANOVA shows that the means for the
Northern and. central Illinois and Southern Illinois areas are notsignificantly different ErOM each-'ot'her, but that both are signif.icantly smaller than.the mean'for the Chicago area (p'< .04),
Forty-four percent of t,he librarfes in the Chicago area reported
total Operating expenditures-of SIG0',000 or. more, compared to
thirty percent of the libraries in they Northern and central
Illinois area and 'twenty-tmo percent of the ''libraries in the
1 0 4
t.

1
Southern Illinois area.
median total operating "expenditurejor \libriries in which-.-.
the heted.:.librarian reported to neitlier upper nor middle managementis Sl18,1,25, nearly twice the medians for librarieS in which thehead-librarian reported to upper management ($65,031).or to middle 4
management ($63,250). The -mean Js also greate4t:'. for thoseibraries in the "other" category,,;. ANOVA indicates that the mean'for libraries in which.the head librarian reported to uppermanagement ($122,015) is not significantly different from the meanfor libraries in whiCh the head librarian reported to' middlemanagement -.($114,435), but that both are significantly' Smiallerthan the *Mean Por. Libraries in which the librarian ,reported to
neither upper nor middle management ($195,273, p <
Total operating expenditures were .relatively geeater forlibraries with male head librarians than for for those with femalehead libnarians., Tho means are $183,790 for libraries-with malehead librarians and $113,779 for libraries 'with. female ; head,librarians. A t-test shows that this difference is significant.(p <!.03)".: Forty-three _percent of the libraries with 04. he -ad
librarians reported total operating expenditures of $100,000' or'more, compared to thirty -five percent pf those with female headlibrarians. At the other extreme, bowever, _twelve percent of thelibraries with male head librarians had total operating expend -
itures of S10,000 or less, as opposed to six percent of the
libraries with female'head librarians.
As would be expected,, libraries serving larger primaryclienteles reported relatively larger total Operating expemd-..
itures. The mean for libraries serving primary clienteles of 376
or more ($161,00) is nearly ti`ce that for libraries servingsmaller. primary clienteles ($8C984): This difference in means .
wae.fpun to be statistically significant (p < .01). The mean isalso significantly greater for nonmedical libraries than for med-'ical libraries (p\V .132)i and Sighifican.tly greater for librariesin for7profit organizations than for libraries in 'not-for-profitlibraries (pi < .04). , ?
CHARACTERISTICS OF THE HEAD LIBRARIAN
Several items of data were.-gathered concerning head
librarians. These include the position of the head librarianwithin the organizational structure (as reflected by the person'towhom the head librarian reports), age, sex, educational level,the number of years spent in his or her position at the time of
the survey, the number of years spent as a professional,librarian
.11
15
''' ,e
in the oeganizalion,in which he or sheHwas,';e:mpl'oYed:;at4.the-time. ofsurvey, aryl total yelzs of experience as a, pre,feaSional
librarian. . .
More than halt the respondents:(53%) indicated,.that the headlibrarian.o+epokted to upper' ma AnYapement, while thirty- eight percent.reported to middle management, two.pIrcent_reportedio a board,four .percene..reported.to, a committee, and three percent indlcitPdother arrangements -(Tabid.8,,page ,4
:..
The greatest .numbe' ..ofretpondents in each of the three -
geographic areas indicated tJlat''4 the head'librarianH reported to "...,k,.
,,
upper management. The.proportion of 'IL-espoildents so indicating,however, varied from forty -eight per'cen't for the Chicago area to '44
...4._
seventy percent for' the Southern'IllinoiS, area. A chi-square testindicates that the .variation among the three geographiC regions inthe prOpOrtion of responses in each categbry . is statistically.'
' significant (p < .05). Female librarians'. appear .6-have_been morelikely than male librarians to, report'to middle management, but
the differences .between male and female head librarians are nvt.
significant. The difference between ilefiieal and -nOnmedicalAibraries-was algo not significant. .
H.i'I a librarians in llbraries with primary clienteles of 376or more ere somewhat more likely to. report to upper managemeot -
and much ess likely to have "other" reporting arrangements thanwere head librarians in libraries serving smaller. primary.client-eles, A chi-square test indicates that the difference between the
two disteibutiohs is statistically significant (p < .0,2). Headlibrarians were more Likel/ to report to upper management in not-
,
for-profit organizat s-than in profit-seeki-ng organizations, andless likely to report a committee or,-to "other." A phi-squaretest shOWs that the twOdistribution4 are significantly different,(p < .01),
:.The median age for all head librarianS is thirty -nine years,
and the mean is forty-one years (Table 9, page 26). Very few-
respondents indicated that the head librarian was younger- than'twenty-six (3%) or older than sixty (6%). Although the median andmean are both, greatpr.for head librarians in the Southern IllinoAsarea than''fOc, the other two geographic areas, to difference in
me n's is not statistically significant. The 'means do' Varys nificantly according to the position of the hesad librarian in
e_arganizationl however: the mean age of head librarians whoeported tomiddle.management (forty-three years) is significantly
greater than thejipean age of head librarians who .reported neitherto, middle Managemeot, nor to upper management (ttiirty-eight. :years',
.p < .02).
None Of thmale head librarian& w
12
rQsponded -to the survey_
16
_,
4

was under age twenty-six,, althOughfourperceni of the female headlibrarians were aged twenty-five'Or under; -there. is no.!ignifiCant
.difference,.. in .the mean ages of mileand female teead librarians.
.Had librarians .tended to he.older*.when the library' served ,a
,. relatively -ladge primary clientele ,than when the. primary clientele'.was le41'than376, Theamean'age. for head. librarians inthelarger
_primary clie4ele group, 'is' .forty-three'Years, ..signIficeintly
go Niieater than the mean foi head 'librarians in the AMaller.. prmarys,.,Oientele. zioup,..Which-ia forty years (t -.test, p<.00. ..Thirty-
t'o'ur percetkt of the head librarians in libiaries serving 376 'TotMore -people Were over age fifty, compared.to twenty,-one,Percent of
, . .f.-
the headlibrarrans in libraries peeling 'smalleNrprimary client-.
ftel.es.". The, age -of the head librarian did' not vary' aignficantlyaccording to whether- the library was meclicalior.nonmedical or
according'. th whether the Organization was for- profit: oe'rnot-for-
profit.,,, e
'
Data regarding the eduCational level.of the head librarian
' for allr0%
,r*OpOndenta are given in Table 10 (page 27):. Only twelve
,,percent,Lofie headlibiarians did not have at least a bacheTor'sdegree,AU4le ackty-four percent .had an 'MLS,. fifteenjiercent hadonly ..a,baOkelor's degree and eight percent had'an advanced' degree
in. a .Cteitd,hther than library science buL not an MLS. Tworespondentindicated the "other"' category, but didThot specify
?tl.....,.. thip:educatnal levels.,:..
v,, ,t,':,- . . -0I ).
,
,t;; 1j
'I' The proportion' of librarians.with at. least an MLS is greatestLt- :.
-1
k,,t;, 4toe-HtAe.0hicago area -(71%), and least for the Southern Illinois
,-;.,;*&ee'ao:(387.).,- with the Northern and. central Illinois area in between
.., (5274). Archisquare.test shows that the differences among the
'thi* distributions- are statistically significant (p < .01). The
.diets itutions do not vary significantly, however, according to the
poi:, Izii of the heax1:.libraeian in the organization. .- -.
.' 1 head librarians appear to have been. more' . likely to
;,1 .i-,sse as' an advanced degree in a field other than library science,an
..
MLS and an advanced degree in another area, than female
,.r.I.T..- Acans. Additiohally, ,all of the head librariana- with
1-01gh school degree or a two-7year , college degree were;.%*'
,,andif. d eight percent of the female libraeians reported "some 7
:';:'-4-",-as opposed to three percent of the'male head ribrarians./11-.dluare test indicates that the differences are statistically.
nific`s--ant .(p ,< .01). The educational level of the head-1Abrarian'did not vary significantly according'to the size of the
- 1Theary'a primary clientele, whether the library was medical or
nonmedicalOr whether the organization was for- profit or nOt-fo-p-.,( -. ,7- 0
L4 profit.
e
The mean number of years that the,head librarian had been in
hidkor her present position is'6.7 years,. while the median is 4.8
et
13
1'

,years (Table. 11, page 28)-ITWenty-foOr percent of :.1411e head
librarians had occupied' their present Positiona.for ten yearslonger. The meam number of years the head.lihrarianhadbeenlnhis ,ox her present' position aoea-m t vary significantly from one
geographic. regron to another, T by the person to. whom the -WeAdLibrarian reparted;' by'thl'e sex of the head librarian,' :!iy whetherthe library was medical or nonmedical, or by whether theorganization: was profit-seeking or not- for - profit. The'mean forlibraries se.rving larger primary clienteles, :,hoWever, issignif-
..icantly greater than:fhe mean for. libraries serving feWei than 376persons' (7,4,yeare vs..5-.1 Years', p < .1)1). Thirty percent of thehead librarians in libraties!serving larger primary clienteles had'.occupied their present.,positicnstOr tenyears or longer, comparedto eighteen percent of the head librarians in libraries servingsmaller primary clienteles.
,
The;, mean number of years, the head' librarian had spent as a
professional librarian in hiaor heT.,preseit organization is 7.4,and the median is 5.3 (Table 1.2, 1 page 29)-, indicating that manyhad been employed hy'"thae orOniiation before becoming headlibrarian. Twenty-six percent.-of the head librarians had' been
with their present organrzation lor ten years or'longer.. As wastrue of the number of years the head librarian had spent in his or
41(,
her present position, the number of years spent in' the :organ- .
, .
ization was found to-, e unrelaCed to any of the independent !.
variables examined except size c..\t primary clientele. The meannumber of years spent as a professional librarian in the present
organization 1.4 8.5 for librarles serving larger primary client-eles and 6.0 for libraries serving smaller primary clieL-*i^s; ..a
t-test 'shows that this difference is significant .p < .01).
Thirty-one perCent of the head libr1arians in:. l,ibraries servingmore thein 375 persons had been with their present` organizationsten years or longer,i compared to nineteen percent of .,the headlibrarians in libraries rving smaller primary clienteles.
Data on the hezkiksibrariOans' years of experience in libraries'are given in Table 13 (page 30). The overall mean is 11.2 years, -
and the'overall median 'i. 9.6 years, indicating that many of thehead librarians had previously worked for organizations other thanthe one for which they worked at the time of the survey. Forty-seven percent 'of the respondenta indicated'that they had.Werked inlibraries for ten or more-years. Once again, the only.significantvariation was between libraries serving larger primary clientelesand those serving smaller primary clienteles. The. mean for 1,
libraries serving larger primary clienteles is significantlygreater than the mean for libraries serving smaller primaryclienteles (12..6 years vs,. 9:5 years, p < .01).
14 18'

SALARIES
.
,.
Data were gathered regarSding the head librarian's salary,.thetotal salaries for'. profebaional: staff 'other than the head
1i6rariah, the number of professional staff other than the head- ,
.librarian (expressed in full- time - equivalence), the total
salaries for nonprofessional staff, and the number of
nonporl (essional staff (expressed in RTE). The total salaries and
,.FTE for professional staff other than the head librarian and for
nonprofessional staff were used to'ocalculate the-average salaries.
for each library.
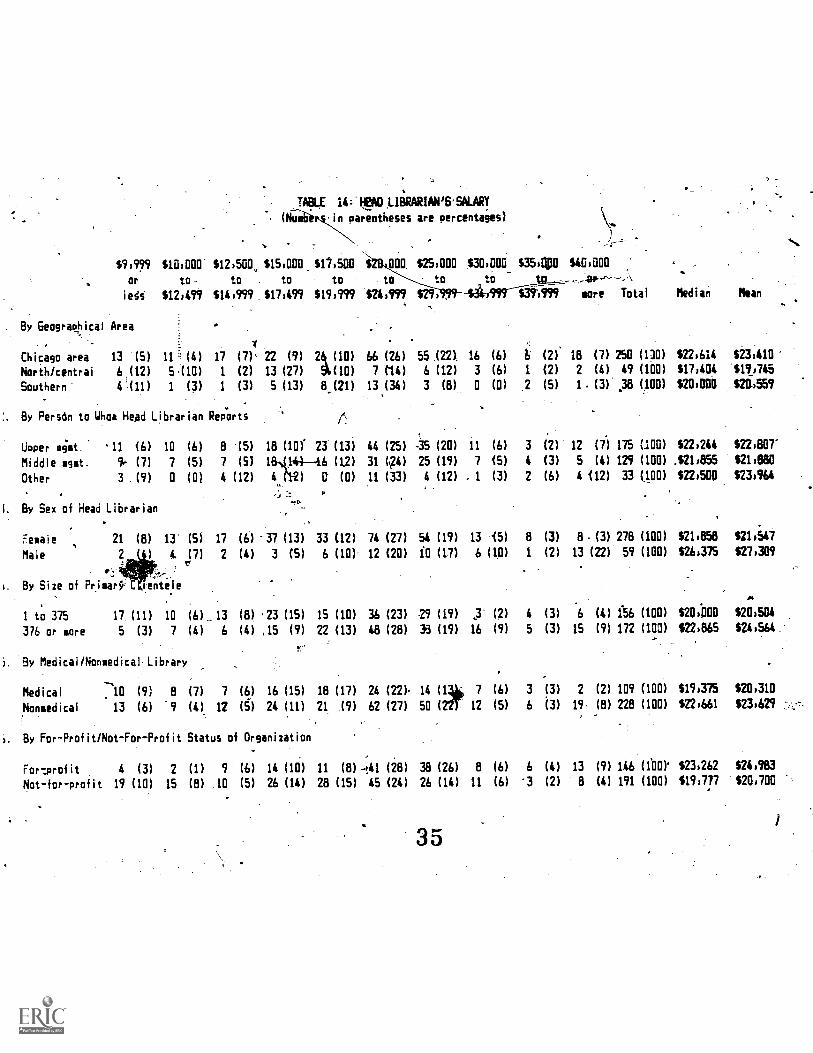
Data on the salaries of, head librarians are given in Table
14 (page 31). The dis.tribution of salaries was Ouite regular,with a median of $22,137 and a mean of $22,556. Only seven' per-cent of the respondents reported head librarian's salaries of lessthan $10,000,and only six percent reported salaries of $40,000 ormore.
The median and mean ate'both. greatest for libraries in the
Chicago area, and Aeast for libraries in the Northern and central
Illinois' area. ANOVA shows that the variation in means is
st4tistially aignifAcant (p < .01). It is interesting to note
that, while the mean expenditure for salar is least for the
Southern Illinois area (Table 4, the mean head
librarian's salary is least f(1 !_1%e Nutthe- 41trld central Illinois /
Only five percent of the respondents in the Chicago area
reported head' librarian's salaries of less than $10,q000,' comparedEo eleven percent of the respondents in the Southern Illinois areaand twelve percent of the respondents in the Northern and 'centralIllinois area.
The mean head librarian's salary also' varies significantly,
(p < .05) according to the position of the head librarian'in the
organization, being greatest for those librarians' who.reportedtoneither upper nor middle management and leaSt for ,those who
reported to middle management. TwelVe percent of the respondent's
in the "other" ca5egory,report'ed'head librarian's salaries of
$40,000 or more, compared to seven percent of the respondents whoindicated that the head librarian reported to upper management and,
four percent of those who indicated that the' head librarianreported to middle management.
-
Male 'head librarians appear to have been, On the average,
paid substantially more than female'head librarians. The med ansalary is $26,375 for male head librarians and $21,858 for feehead librarlltna,..,;while the mean salary is 527,309 for male head
librarians and.' $21,547 for female head librarians. A t-lest
indicates that the difference in means is significant (p < .01).
15°
19
,
'Twenty-two 'percent of 'the. male head librarians earned $40,000 ormore per year, compared to thre. percent of the female headlibrariahs,' Thirty percent of th male head librarians earnedless than 420,000 per year, compar d to forty-four percent of thefemale head librarians..
'There is also a sisnificant reLatiOnship between the, headlibrarian's salary and tis,orher age: older librarianswere paidsignificantly more than younger librarians (t-,test, p < .01).EduCation also shows a very strong relationship\ to salary. :.,The
mean salary for head 'librarians with advanced degrees in field'sother than librarianship is more than $10,000 greater than themean for head librarians with,a two-year degree. Interestingly,the mean for head librarians with a library degree and an advanced'degree in another field id somewhat less 'than the mean'.,fqj headlibrarians with only an a
Wvanced degree in a nonlibrary field.
*1\0Siilarly, the mean for hes ,hibrarians with a high.schOol ,egree. -
is greater than the means for head librarians with elhelli, somecollege but no college degree or a two- year c grt,I. ANOVA shoWsthat the differences am g the means for the various educationallevels is statistically significan (p < .01)..
Head librarians in libraries serving larger primaryclienteles were,, on the average., paid more than head librarians inlibraries serving 375 or fewer people (p -< .61). The-mean headlibrarian's salary for nonmedical libraries is significantly
'greater than the mean fcir medi,cal libraries ( p < :01), and themean for libraries serving for - profit organiz greaterthan the mean for libraries serving not- for-profit Agaktizations(p < .01).
The overall mean salary for professional staff other than the.head librarian is $14,168 and the median is $11,675 (Table 15,page 33). Only twelve percent of the'Itaff in this categoryearned $20,600 or more a year. None of the independent variablesanalyzed was,significantly related to the salaries of professionalStaff other than the head librarian. a
. .
The overall mean salary for nonprofessional staff is $11,002and the median'is $9;993 (Table. 16, page 34). Only fourteenpercent of the nonprofessional.staff earned $15,000 or more peryear. Nonprofessional salaries' were significantly related to noneof the'independent variables except the for- rofit/not-for-profitstatus of the organization. The mean nonpro essional salary-- forlibraries in profit-seeking organizations is $11,903, while the
A
mean for libraries in ,not-for-profit organizations is $10,243(p < .01).
16
20
CONCLUSIONS
A .number of conclusions can be drawn4iom .the data gathered J.
for this survey. The moat interesting relationships found seem toobe those concerning, 'expenditures and the' salaries of- 'headlibrarians, which were from the outset the, focus of the 'study.These relationships can be, summarized as follows:
ExpenOitUres and head.librartans'. salaries:
1. are greater for libfaries in the. Chicago area than fort'libraries elsewhere- in the state;
2. are greater for ibriles servillg larger clienteles thanfor those sc., Jing smaller cli,nteles;
3. are greater for nonmedical libraries than for medical,libraries;
are greater for libraries' serving profit'- seekingorganizations than for those in not-for-profit organ -
izations; '
b
5. are greater for li,brarieslw.ith 'male head librarians thanfor libraries with female head librarians.
Additionally, older head lie brarians earn greater salaries Thadyounger head librarians. Most of these findings can be explainedrather readily'. The greater cost of living' in the Chicago areaeasily accounts for the higher expenditures and salaries in thatarea. It can be assumed that a larger -prima.), clientele is
accompanied by ,greater, demands for library 'service and ,thatgreater expenditures are required to meet those ' demands;furthermore; larger organizations may generally be wealthier andtheFe',4 ore le to offer better 'salaries. . Profit-seekingorganization are generally by. their very nature wealthien-Ahannot-for-profit organ- ization, and may also be more _willin, to
commit funds to 1f rary services and salaries in order to benefit4,.organizational go s. Nonmedical. libraries are in general larger
k.than medical. libraries, astd are more likely to be attached to
profit-seeking or anizatiorxs than are medical. libraries. Olderlibrarians presumably earn more primarily becaUse they have- beenworking in libraries in general and in their Present organizationsAonger than their ounger colleagues.
1.
The relationships that. cannot'be so easily explained arethose between expenditures and thA se,x, of'the head librarian and
between the sex of the,. head librarian and his or her sslary- .
Evidence that head librarians wetA Jnore 'likely to..,,be male than
17
21

female forrgrofit organizliCionS, in nonmedical libraries, an
An libraiies: 'serving largef.'pfimaiy clienteles off*r ,a ' partia
explanation, but none of these ,relationships is, substantial enoughto constitute, a full explanation. it is. also, the case that malebead_ Ifbxaxians tended,t'o be slightly 'better educated than female
hepd libiarians, but again the differences. are small. Thesimilarities between' the, findings of this study and those of other
studies of li-br4riav,J. salaries are toogreat-to he a result of
coin\idefice. The inevitable Oilatpay%equIty for
women` has lagged - in special libraries just in other
occupations, land that the status of.female; heads of special
libraries is such that they are not able to command the budgetsavailable to their male counterparts.
18 22

REFERENCES
1. Raymond L. Carpenter and Kenneth U. Shearer, "Sex anc(SalatySurvey: Selected S'Latistics of Large Public' Libraries in theUnited States and Canada" Library Journal 97 (November1972): 3682. ,
2. Raymond L.. Carpenter aria KennetHIY: Eheirer"SeX., and Sllary-Update," Library Journal X99 ..(January 15 1974): 101-107;Raymond L. Carpenter and 'Kenneth D. Shearer, :"P4ablic Librarypipport.and Salaries In the Seventles," Library Journal 101( plarch 15,1976): 777-783; Kathleen'il. Heim-and Carolynkacenca, "Sex, Salaries. and. Library Support," Library
'Journal 104' (March 15 1979),: 6757,680; Kathleen M. ,Heim andCarolyn Kacena,, "Sex, Salarlies, and Library .SUpport--1979,"Library Journal 105 (January 1 1980): 17-22; Kathleen M.Heim and CarolynKacena,"Sex, Salaries; And Library. ,Support--,1981," Library Journal 106 (September 15-1981):1692 -1699.
3. Russell 9., Fischer, "Pay Equity and the SAn Jose Strike: "-An'Interview with PattsCaria',"' Llbrary Journal 106.(November1981): 2079-2085; "Libraty Workers Lead StrIkers.in.Comparable-Pay Fight," American,Libraries 12 (July(August1981): 397.
19
23

TABLE 3: SIZE OF PRIMARY CLIENTELE
(Numbers in parentheses are percentages).
1 100 200 300 500 . 700 1,000/1,500 - 2,000
to to to Id. to to to to or. 1
19. 199 299 499. f99 999 19499 19999 more Total
By SeograPhical- Region*
.Cicago area 55 (21) 43 (16)' 27(10)
North/central 7 (14) :79 (17) 9,(17),
Smithein 11 (26) 2' (5) '6 (14)
By Person to AO. d Llbrapian Reptr.4.,
Upper mgmt. 39.(21) 25 (13) 20 (11)
Middle mgit. 22 (16) 25 (19) 17 (13)
Ether - 12 (35) 4 (12) .5 (15)
32 (12) 19 (7) 20 (8)
3 (6) 4 18) 5 (10)
2 (5) 5 (12) 5-(12)
18 (10(
16(12)
'3 (9)
16 (9) 17
9 (7) 12
3 (9) 1
By For - Profit /Not - For Profit Status of Organization Ae.
Fpr-profit 44(28) 35 (23) 17 (11) 17
Not-for=profit 29 (14) 19 (9) 25 (12) 20
By Medicai/Nonmedical Library..:
Medical 10 (9) , 11 (9) 16 (14). 12
Nonmedical 62126) 44 18), 26 (11) 25
All Respondents 73 (20) 54 (15) 42 (12) 37
(9)
(9)
(3)
15 (6) 41 '(4) 40.(15) 262 (100)
5 (10 2 (4) 8 (15) 52 (100)
3 (7) '0 (0) 9 (21) 43 (100)
13 (7)
9 (7)
1 (3)
9 (5) 32 (17),189 (100)
4 (3) 20 (15) 134 (100)
0 (0) 5 (15) 34 (100)
Median Mean
369
383
560
408
369
228
815
799
852
815.
741
590
(11) 8 (5) 7 (5) 2 (1) 3 (2) 22 (14) 155 (100) 196 594
(10) 20 (10) 23 (11) 21 (10)'.. 10 (5) 35 (17) 202 (100) 590 898
(-10)
(11)
(10)
17114) 17 (14) 15 (13) 5 (4) 15 (13) 118 (100)
11 (5) 13 (5) 8 (3) .8 (3) 42 118) 239 (100)
28 (B) 30 (8) 23 (6) 13 (4) 57 (16). 357 (100)
The Chicago area includes the BUr Oak Chicago, DuPage, North Suburban and Suburban library systems. The Northern
and central Illinois region includes the Corn Belt, Illinois Valley, Lincoln.Traal,' Northern'Illinois, River aend,
Starved Rock,' and Western Illinois library systems. The Southern Illinois region includes the Cumberland trail,
Great River, Kaskaskia, Lewis and Clark, Rolling Prairie and Shawnee library systems.
609 852
252 723
376 766
24'IEST COPY AVAILAIILE
I
411,
.
.
$7,499 $7,500 410,000
or to to
less $9,999 $14,999
1. By Geographical Area
Chicaliii area 10 (4) 6 (3) 19 0)Noeth/central 5 (10) 2 (4) 3 (6)
Southern 7 (17) 0 (0) 1. (3)
2. By Person to Whom Head Librarian Reports
6.,
Upper mgmt. 12 (7) 3 (2) 12 (7)
Middle mgmt. 6 (5) 5 (4) 7 (6)
Other 4 (13) 0 (0) 3 (10)
3. By Sex of Head LibrIrian
Female 16 (6) 7 (3) 18 (7)
Male 5 (9) 1 (2) 4 (7)
4. By Side of Primary Clientele
1 to 375 16 (11) 4 (3) 14 (13)
376 or more' 5 (3) 4 (2) 8 (5)
5. By Medical /Nonmedical Libra;y
Medical 9 (8) 5 14) 12 (11)
Nonmedical 13 (6) 3 (1) 10 (5)
TABLE 4: ANNUAL EXPENOITURES FOR SALARIES
(Numbers'in parentheses are percentages)
4
$15,000 i201000 '$36,000 $50,000 $10M000 $250,0001500,00G
to to lo ' to to 1.0 Dr
$19,999 $29,999 $49,999 $99,999 $249,999 $4991999 ' more
20 (8)
11 (22)
8 (20)
4(11)2 (16)
1 (3)
34 (13)
5 (9)
19 (13)
18 (10)
20 (18)
19 (9)
By For-Profit/Not-For-Profit Status of Organization
For-prof:t 4 (3) 3 (2) 6 (5) 9 (7)
Not-for-profit 18 (9) 5 (3) 16 (8) 30 (16)
7. Ail Respondents 22 (7) 8 (2) 22 (7) 39 (12)
4
40 (17) 52 (22) 52 (22) 24 (10) 8 (3)
10 (20) 8 (16) 4 (8) 5'(10) 1 (2)
9 (22) 9 (22) 3 (7) 3 (7) 1 (3)
36 (21) 34 (20) 31 (18) 17 (10) 7 (4)
19 (15) 29 (23) 22 (18) 13 (10) 2 (2)
4113) 6 (20) 6 (20) 2' (7) : (3)
Fl
51 (19) 59 (22) 47 (18) 23 (9) 8 (3) .
8 (14) 9 (15) 11 (19) 9 (15) 2 (3)
,'
36 (21) 30 (21) 19 (13) 11 (0) 1 (1)
27 (15) 38'(22) 40 (23) 20 (11) 9 (5)
1P('
23 (20) 20 (18) 12 (11) 7 (6) 2 (2)
36 (17) 49 23) 47 (22) .25(12) 8 (4)
24 (18) 31 (23) 31 (23) 20 (15) 5 (4)
35 (18) 38 (20) 28 (15) 1.7 (6) 5 (3)
59 (18) 69 (21) 59 (18) 32 (10) 10. (3)
25
7 (3)
0 (0),
O. (0)
2 (1)
2 (2)
3 (10)
.
.
'Total Median Mean
238 (4100) $39,092 380,411
49 (100) 424'1438 $48,827
41,(100) $25,000'. $40280'
172 (100) $39,676 $691397
125 (100)' $38,838 $64p170'
30 (100) $40,000 $413,000
t
265 (1001' $38,538 $61,684 '
59 (100) $40,833=$116,631.
1 (1) 445 (ibO)
6 (3) 175 (1410)
$25r562 $47,569
)40,641 492,257
3 (3) 113 (100) $24,637. $58,750
4 (t) 214 (100) $40,115 $78,078
1 -(1) 134 (100) $40,665 $77,752'
6 (3) 193 (100) $26,071 $66,9138
7 (2) 327 (100) $38,859 $71,399

TABLE 5: ANNUAL EXPENOrTURES FOR MATERIALS
(Numbers in narenthitel are periertages)$..
$999 114100 $5,000' $10,000' $15,000 $20)000.425000 $30,000or to to to to to . -to 6 toless $4,999 $9;999 $141999 ,S19099 $241919 1,0,979 - $49,999
By GeOgrapKical Area
."..hicago area 7 (3)Northlcentrai 1 (2)Sodthern 3 (7)
30 (1) 22 (9) 20 (9) 14 (6) 16 17) 31(13)8 (`17) 7 (15) 7 (15) 2 (4) 5 (11) 3 (6) 3 (6)
13 (31) 5 (12) 4 (9) 6 (14) 2 (5) 2 (5) 2 (5)
2. By Person to Whom Head Librarian Reports0,:.
28,(16) 74 (14) 20 (12) 14 (8)1 4 4 1 ; ;; . : 1 2 ( q-_ 12 (10) 13 (a)
'1.1,447 pr 1 (3) .1 (3)
Lippir mgit: 5 -3)
Middle c o g i l l t. . 3 ( 3 )
Other. 3 ',(10)
3. By Sex of head Librio; ',.11.ii.WI. )4-'
Female 7 -i3C,11c.c.,35: (1,34, 15)
Male 4 (5t;:iik.:(1.7)*A (5)
49..e,
4: By Size oi ilt.aiy4,1..1 to le
335 8 (6)v 29 12,pa1' ".27, (19) 12 (8) 11 '(el)376 or mope .3 (2)`.16 (91 (8) 20 (12) 15 (9)
5. By Medical
12
8
'27 (30) 22 (8) *17
6 (10)' 6 OR 4
(7)(7)'(3.1
10
'92.
(6)(8)(7)
(7)(2)
7 (5) 8 (6)14 (8) f3 (8)
27 (10)9 (15)
10 (7)24 (14)
'Medical rrartar,tp),t.'-,, (18) 17 (15) 13 (12) 8 (7) '5 14) (11)Nonmedical .8 (41 26:111)12110) 16. (8) 15 (7) 13 (6) 16 (8) 24 (11)
slBy 'Far*Of t/NOt-For-Prof it .Stiius of Organization
For-orof it .3 .(2) 12 (9)' 11 (8) >7 (5)' 9 (7) 9 (7) 12 (9) 14 (H)Kat-for-profit 8. 34 (18) 31 (16) 26 (14) 19 (10) 12 (6) 9 (5)_ 22 (12)
I Respondent'll .0) 46 ,(14) 42 (13) '33 (10) 28 (9)
.42i.!'''
21 (7), 21 (7) 36 (11)
.2 6
$5 0,000,$100,000
to$19)999
,ormare Total Median Mean
35.(15) .36 (15) 234 (100) $23,625 $42,5868 (17) 3 (6) 47(100) .$16,938 $3116971 (2) 4 -(10) 42'(100) 38,625 $23,542
23 (13) 19 (11) 174 (:00) $17,982 $35;44714 (12) 15 (13)' 120 (100) $18,452 $36,898,7 (23) 9 (29) 31 (100) 074436 $62,363
38 (15) 31 (12) 262 (100) $21,507 $37,5396 (10) 12 (a) 6g (1M) $22,500' $44i,3,1
20 (14) 13 (9) 145 (100) $12,969 $31,314
23 (13) 30 (17) 172 (100) $27,1167 S45,205
7 (6) 8 (7) 113 (100) $13,162 $26)375
37 (18) -35 (17) 212 (100) $27,219 $45466
29 (22) 28 (21) 134* (100). $39,518 $53,23315 (8) 15 (8) 191 (100) $13,322 .$28,249 'rf.
44 (14) 43 (13) 325 (100) .$21,643 $38,550

TABLE ,. EXPENDITURES,
OTHER THAN-EXPENDITURES-FOR SAL ANDOTERIALS
m.
.
umbers in.,'.parentneSes are percentages)
111000' S5,000a Si0,000 $1B4O01Y120410 $25,000 f30,000 i50,1i011 $100,000.t -
Or ' to to to to to: .
,
to 10 to Or
less. $4,999 $9,999 $14,999 $19,999 $24,999 $29,999 49,995. $99,99, sore
BYGiagraphical.krta
Chicago area
NNorth /central5641.hern- °
_ .
.37 (18)
12(29)
13 137)
56127).11
/I (27) 5
6-117)
(10)
21(121
(14)
By perion-to Whom Had Librarian Reports.
. ..
12 2(6) 14-;17) 8 (4) 9 (4) 20 (10) 13 ,16) 20'(10) 210 (100) $7,661 125,9560
. 3' (7) 1 13) .3 17) 1 (2)'' 1 (2)., 1 (2) 3. (7) 41 (100) $3,614 $17,549
D (0) 3 191 0 (0) V (3) .0 (0) 4 411) 3 (9) 35 (100)-:$3,563 $23,436
Total, Me'diin
,Upper'sget, 29120) 38 (26) .15.(14)) 8 45) 9 (6) 7 15) -5 .(3) 12 (8) 11 (7) 1511M:149 (100) -47,500 $26,716
Middle 4t: .27 (25).28 (26) 13 (12) 7 -16) 6 16Y: 3 (3) 5 (5) 9 (8) 5 (5) 6 16) 109 (100) 14,085 $19,122
1101er 6 (21) .7 (25) 3 (11) 0 10) .3.:(11) 1 (4) -.1 (4) B (0) 2 (7) 5 118) 28 (100) $7,125 $33,144
ei Head Libririan
+.
Fesale.
. .
49 (21)_62 (27) '27 112) 11: (5) 15 (7) 7 (3) 10. (4) 20 (9) 14 (6) 16 (7) 231 (100) $6,750 1224111.
Meie 12123r 10 (19) 4 (8) 4 (8) 3 (6) 4 (8) 0 (0) .1 (2) 4 (8) 10 iro'. 5z (100) 18,625 $35,606
By Si:e of Prima.ry Clientele
i to 375 -44.1351. 26 (21 If 19) 7 (6) , 9 (7) 6 (5) i2 (2) 12 (1D) 4 (3) . 3 (2) 124 (100) $3,433. $14,383
376 or sore. T 16 110): 46 (30) 18 (12) 8 (5) 1 (6)- 5 '(3) 9-, (6) 9 (6), 14 (9) 22 (14) 156 (100) $8,375 $32,452
. , .
By MedTcal/Nontedicai Librar
Medial -' 28 (28) 34 ( 13.(13) 3' (3) 4 (4) 3..(3) 1 (1). 2 (2) ' 6 (6) 6 (6).100 (100) 53,331: $17,030
Nonmedical 34 (18) 39 (2 ,18 110) 12. (7) 14 '(8) 8 .(4). 10 (5) 19 (10) 12 (7) 20 (11) 186 (100).$11,750 $28,427
6y_ For-Profit /Not-For-Profit Status of Organization
7.
For-profit 18 (16)
Not7fOr-,profi 44 (26)
Alt Respondents 62 (22)
28
45
73
(24)
(26)
(26)
14
'17
31
12)
(10.)
(11)
7 (6) S 141,- 8 (7)
8 (5) 13 . (8) :3. (2)
,
4 (4) '12 (ID) 8 (7) 11 (10) 115 (100x8,223 $27,152
7 T4Y- .9 (5) 10 .6) 415 (9) 17.1 (100) $3,950 $22,620
15 (5) '18' (6) 11 (4)- 11 -(4) .21 (7) 18 (6)1 26 (9) 286 (100) $6,956 .$244442
27
TAME :7: TOTAL ANNUAL OPERATING EXPEWITURE5
Umbers in parentheses are percentages)
$1,000 s5,000 nom mum $ezamo $25i000 $30,000 $50,000 $100,000 $2160011
to to "to _ to to to ta- 'to to or
$4)999 $9,999 $14,999 $19,999 $24,999 $29,999 449,999 $99,999 $199,999 more Total Median Mean
1. By Geographical Area
Chicago area 2 (1) 11 (4). 3 (1) (3) 9 (4) 111 (4).' 40 (16) 58 (24) 51 it) $1; (23) 248 (100i P5,063
'North /central 0 (0) *-:"*.481,- (0) 3 (6) 7 (13) 5 (10) 9 (17) 9 (171 8 (15) 8 (15) 53 (1081 140.125'
Southern 1 (2) $ (141 . 1 (2)' 1 (2) -3 (7) 2 (5) 9 (n) '10 (24) 2 (5) 7 (17) 42 (1110)- $45;500
,lk
2. By Person to WhowHeatl Librarian Reports
Upper mgmt. 1 (1) 11 (6) 3 (2) 5 (3) 11 (6) 8 (4) .35 (19) 43 (24) 29 (16) 35 (19) 181 (100) $65,031
Middle lige. 2 (2). 6 (5) 1 (1) 7 (5) 7 (5)' 9 (7) 22 (17) 31 (24) 22 (17) 22 (17) 129 (100) $63,250
Other 0 (0) 4 (13) 0. (0) 0 (0) 2 (6) '2 '(6) 1-(3) 3 (9) 10(311 10 (31) 32 (100) $118,125
10
3. By Sex of Head Librarian
Feale 2 (1) 14 (5) 4 (1) 10 (4) 19 (74 15 (5)..48 (17) 66 (24) 47 (17) 50 (18) 275 (100) $65,100
Male. 1 (2) 6 (10) 0 (0) 2 (3) 1 (2) 2 13) 12 (19) 11 (18) 17 (27) 10 (16) 62 (P00) $72,625
4. By Size of Primary Clientele
1 to 375- 2 (1) 13 (9) 3 (2) 8 (5) 13 (9) 12 (8) '22 (15) 30 (20) 28 (18) 20.(13) 151 (100) $50,125
376 or mare 0 (00. 7:-(4) 1 (1) 4 (2) 7 (4) (2) 31 (17) 46 (26) 33 (18) 47 (26) 180 (100) $78,125
5. Medical/Nonmedical Library
Medical 2 (2) A 501_ .2 (2) 7 (6)t (10) 8 (7) 29.(25) 21 (18) 15 (13) 13(11) 117 (1110) $42,469
Nonmedical 1 (.5) 13 (6) 2 (1) 5 (2) 6 :(4) 9 (4) 29,(13) 56I425) 48 (22) 52 (23) 223 (100) $85,500
-.;
6. 'By For-Profit/Not-For-Profit StatUs of Organization
jor7profit 0 (0) (31- 1 (1) 4 (3) 5 (4) 6 (4) 16 111) 32'(23) 36 (26) 37 (26) 141 (100)$ 103,000
440p:for-profit 2 (1) 17' (9) 3. (2) 8 (4) 15 (8)-,
11 (4J .42 121). 45 (23) 27 (14) 29 (25) 149 (100) $50,438
7. All Respondents 3 (1),-21:.. (6) 4 (1) 12 (4) 20 (6) 17 (5) 58 (17) .17123) 61 (18) 67420).340 (100) 567,458
U
$139,549
$92i3354
$88.250-
$122,015
$114,435
$195,273
$113)779
$183,790
$66,984
$1614015
$96,722
$141,481
($146,628
$111,519
$126,079
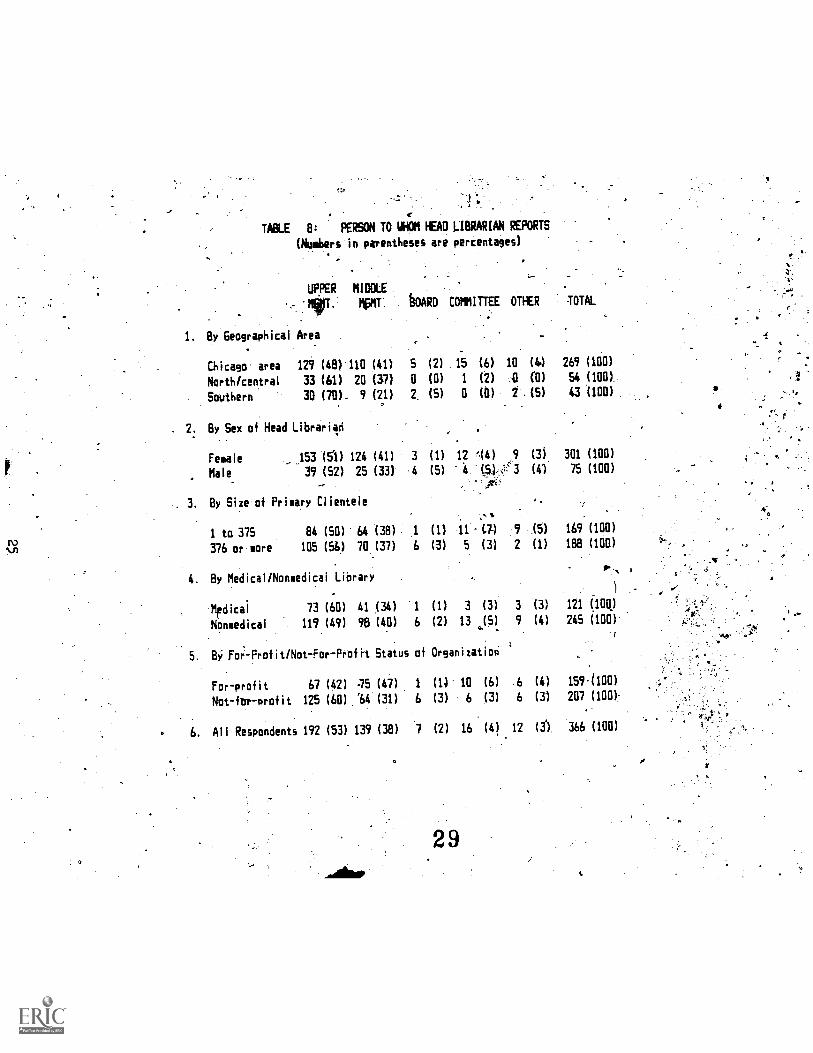
TABLE 8: PERSON TO UHOM HEAD LIBRARIAN REPORTS
(Numbers in parentheses are percentages)
1.
.UPPER
By Geographical Area
MIDDLE
mpir. tIOARD COMMITTEE OTHER TOTAL
Chicago' area 129 (48) 110 (41) 5 (2) 15 (6) 10 (6) 269 (100)
North/central 33 (61) 20 (37) 0 (0) 1. (2) .O (0) 54 (100)
Southern 30 (70)- 9 (21) 2. (5) 0 (0) 2 .(5) 43 (100)
2 By Sex of Head Librarian
Female 153 (51) 124 (41) 3 (1) 12 4) 9 (31 301 (100)
Male 39 (52) 25 (33) -4 (5) 4. (.5)43 (4, 75 (100)
3. By Size of Primary Clientele
1 to 375 84 (50) 64 (38) 1 (1) 11 C7I 9 IS) 169 (100)
376 or more 105 (56) 70. (37) 6 (3) 5 (3) 2 (1) 188 (loa)
4. By Medical/Nonmedical Library)
11!clicai 73 (60) 41 (34) 1 (1) 3 (3) 3 (3) 121 (IR)
Nonmedical 119 (49) 98 (40) 6 (2) 13 (5) 9 (4) 245 (100):
By For-Profit/Not-For-Profit Status of Organization
For-profit 67 (42) 75 (47) 1 (1) 10 (6) 6 (4) 159.(100)
Not-for-profit 125 (60) '64 (31) 6 (3) 6 (3) 6 (3) 207 (100)-
6. All Respondents 192 (53) 139 (38) '7 (2) 16 (4) 12 (1) 366 (100)
29

TABLE 9; ABE OF flin0BLORAROW
(N6mbersrim pare:MI*5es are percentages)
. 25 26. 31 36 41 46 51 56
or to to to to to to to
younger 30 35 40 45 50 55 61 older
61
1. By Geographical Area
Chicago area 8'. (3).-39 (15) 58 (22)- 46.(18) .20 gilt 20 18) 35 (13)' 24 (9) 12 (5)
"North/Central 3 (6) 7 (13) 10. (19) 9-(17) 7 ( 5 .19) 4 (8) 4 (8) 4 (8)
. Southern .. 1 (2) 2 (5) 10 (23) 6114) 7 40;;;;IrTio 3 (7) 7fi6) 4 (9)
2: By Person to Whom Head Librarian Reports
. .
Upper mlmt. 7 (4) 31-(17) 36 (19) 31 (17) if (11) 15 (8) 23 (12) 13 (7) 10 ,(5)
Middle mgmt. 3 (2) 11 (8) 32 (24)- 21 (15) 12 (9) 11 (8) 19 (14) 19 4) 8 (6)
Other Z 16) 6 117)" 10 (29) 9426) 1 (3) -2 (6) 0 .:(q) 3 9) 2 (6)
3. By 'Sex of Head Librarian
Nikb
Female 12 (4) 41 (14) 61 (21) 48 (16) 27 (9) 25 (9) 35 (12) 30 (10) 14 (5)
Male 0 (0) '7 (11) 17 (26) 13 (20) 7 (11) 3 (5) 7 (11) 5 (8) 6 (9)
4. By Siie of Primary Clientele
1 to 375 5 (3) 30 118) 42 (25) 28 (17) 13. (8) 15 (9) 14 (7) 12 '(7) 11 (7)
376 or more 7 (4) 17 (9) 34 (19) 32 (18) 10*(11) 11 (6) 30 (17) 22 (12) 9 (5)
5. By Medical/NonmedicalLibrary
Medical 4 (3) 11 (10)- 19 (16) 22 (19) 16 (14) 7 (6) 17 (15) 11(10) 9 (8)
Nonmedical 8 (3) 37 (15) 59 (24) 39 (16) 18 (7) 21 (9) 25 (10) 24 (10) 11 (5)
.
6. By.For-Profit/Not-For-Profit Status of Prganlzation
For-profit 5 (3)- 27 (17) 37 (24) 25 (16) 10 (6) 14 (9) 17 (111 -16 (10) 5 (3)'
Not-for-profit 7 (4) 21 (10) 41 (20). 36 (18) 24 (12) 14 (7) 25 (12) -19 (9) 15 (7)
7. All Respondents 12 (3) 48 (14) 78 (22) 61' (17) (10) 28 (8) 42 (12) 35 (10) 20 (6)
30
Total-. Median
262 (AD)
53 (100)
43 (141)
187 (100)
136 (100)
35 (100)
38 41
39 41
42 44
'39 . 41
41 43
35 38
293 (100) 39
5 (10
167
182
116
242
156
202
358
(100) 37 40
(100) 41 43
(100) 41 43
(100) 38 41
(100) 37 40
(100) 40 42
(100) 39 . 41
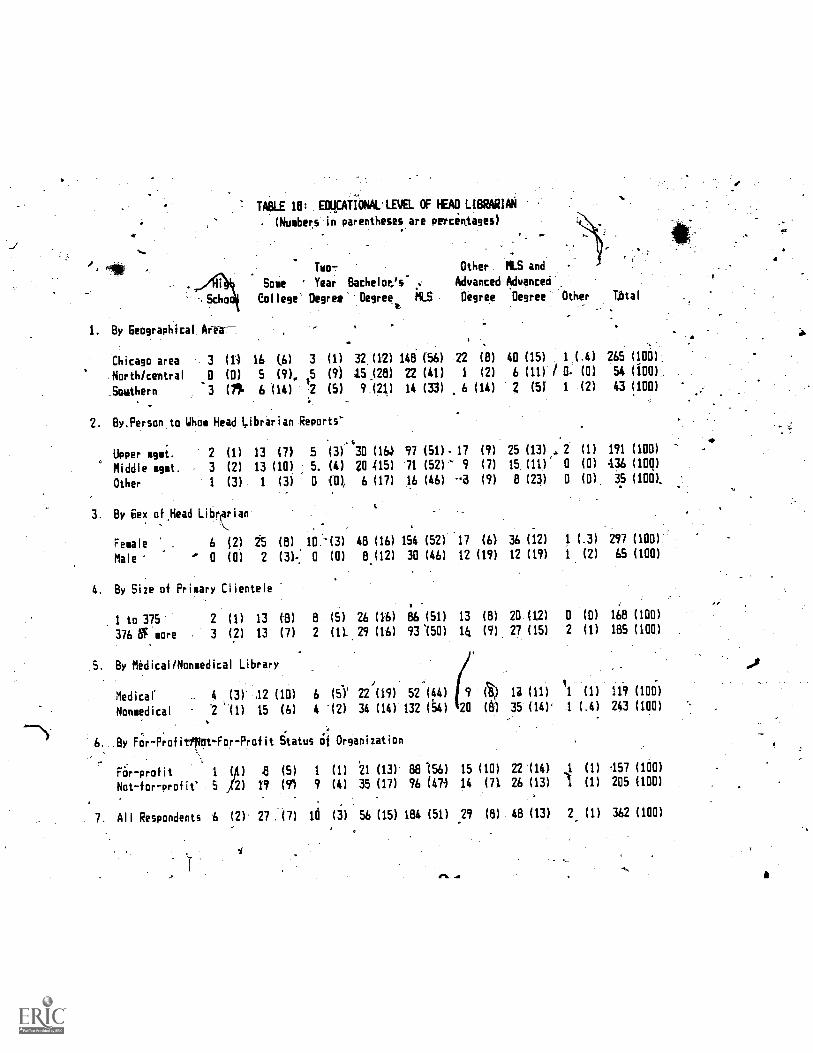
TABLE le:. .011CATiONALLEVEL OF HEAD LIBRARIAN
(Nu.bers in parentheses are percen.tages)
Two- Other. MLS and.
Some ' Year Bacheloes" , Advanced Advanced
.Scho College' Degree Degree MLS
1. By Geographical Arra--
Chicago area 3 (14
.North/central 0 (0)
_Southern 3 (7%
16 (6) 3 (1) 32.(12) 148 (56)
5 (9). 5 (9) 45 .(28) 22 (41)
6 (14) 2 (5) 9121) 14 (33)
2. By.Person to Whom Head Librarian-Reports'
Upper gmt. 2 (1) 13 (7) 5 (3) 30 (164 97 (51).
Middle gt. 3 (2) 13 (10) 5. (4) 20 415) 71 (52)-
Other 1 (3). 1 (3) 0 101 6 (17) 16 (46)
3. By hex of.Head LibTian
Female '.. . 6 (2) 25 (8) 10.13) 48 (16) 154 (52)
Male ° 0 (0) 2 (317: 0 (0) 8 (12) 30 (46)
4. By Size of Primary Clientele
1 to 375 2 (1) 13 (8) 8 (5) 26 (16) 86 (51)
376 fiT more . 3 (2) 13 (7) 2 (1). 29 (16) 93 150)
5. By Midical/Nonmedical Library
Medical. 4 (3) .12 (10) 6 (5)) 22(19) 52(44)
Nonmedical 2 '(1) 15 (6) 4 -(2) 34 (14) 132 (54)
By For-Profillpqt-For-Profit Status of Organization
Far-profit 1 (Al) 8 (5) 1 (1) 21 (13) 88 156)
Not-for-profit' 5 J(2) 19 (91 9 (4) 35 (17) 96 (414
7. All Respondents 6 (2)- 27.(7) Id (3) 56 (15) 184 (51)
Degree Degree Other Tjital
22 (8) 40 (15) . 1 J.4) 265 (100):
1 (2) 6 (11) / O. (0) 54 (100)..
6 (14) 2 (51 1 (2) 43 (100)
17 (9) 25 (13) 2 (1) 191 (100)
9 (7) 15 (11)' 0 (0) 436 (100)
-3 (9) 8 (23) 0 (0). 35 (100).
17 (6) 36 (12) 1 (.3) 297 (100).
12 (19) 12 (19) 1 (2) 65 (100)
13 (8) 20 (12) 0 (0) 141 (100)
14 (9) 27 (15) 2 (1) 185 (100)
9 13 (11) 1 (1) 119 (100)
20 (6 35 (14)' 1 (.4) 243 (100)
15 (10) 22(14) ,1 (1) 157 (100)
14 (71 26 (13) (1) 205 (100)
29 (8) 48 (13) 2 (1) 362 (100)

'ABLE 118114/AN'S YENS Of BIPEIIIENEE
IN PRE a. P0511i011 -
(164sts in,ParentheSes are perimatagmi)
Less
than
2 4
to to
6
to
el
to
'JO
to
14
to
- 21
to
26
Alr
2 4 6 8 la 16 21. 26 more Total Median Mean
1. By Geographical Region
Chicago area - b4 (24) 59 (22) 39 115) 28 (11) 19 (7) 36 (14) 11 (4) 8 (3) 1 (.4) 265 (100) 4.5 6.4
North/central 8 (15) 13 (24) ta (19) 4. .(7) a (0) 42 (22)- 6 (11) (0) t2) .54 (IQ) 5.2 7.8
Southern 6 (14) 10 (n) 6 (141.. (16) 3 (7) -8 (19) 2 (5) 0 10) 1 (2) 43 (1110) 5.8% 7.3
2. 8y Person to Whoa Head Librarian Repent;
Upper mgmt. 37 (15) 43 (23) 36-(191' 24 (13) 9 (5) 28 (15) 7 (4) 4 (21 2 (1) 190 (IOC) 4.8 6.5Middle .get. 33 (24) 26 (19). 17(12) 13(10) 10 (7) 26 (19). 9 (7) 2 (1) 1 (11 137 (IGO) 5.1 7.0
Other 8 (23) 13 437) . 2 (6) 2 -(6) 3- (9) 2 (6) 3 1?) ".2 16) a (i/ 35 (/130) 3:5 6.5
.)
,3: By Sex of -Head Librarian
Feiale 67 (23) 63 (21) 48 (16) 31 UM 22 (71 45 (15) 15 (5) 3 (1) 3 (1) 297 (101) S.1) 7.0Male 11 (17) 1* (29) 7 (111 8 (12) 0 (0) 11 (17) 4 (6) 5 (3) 8 (0) 45 (IGO) 5.8 8.0
4. By Size of Primary Clientele
375 or less 40 (24) 44 (26) 25 (15) 23 (14) 6 (4) 2b (12) 5 (3) 5 (3) 0 (0) /68 (100) 4.0 5.8376 or more 36 (20) 35 (19) 30 (16) 15 (8) 16 (9) 35 (1?) 12 (7) 3 (21 3 (2) 185 (leo 5.4 7.4
5. By Medical/Nonmedical Library
Medical 17 (141 17 (14) 24 (201 18 (15) 13 (111 22 (19) 4 (3) 2 (2) 1 (11 III (100) 6.1 7.3
Nonmedical 61 (25) 65 (27) 31 (13) 21 (9) 9 (4) 34 (14) 15 (6) 6 (3) 2 (11 244 (100) 3.4 6.4
6. By For - Profit /Not - Foe - Profit Status of Organization
For-profit 41 (261 38 (24) 21 (131 14 491 1 (4) 25 (16) 6 (4) 5 (31 1 (11 155 (1001 4.0 6,4
Not-for-profit 37 (18) 44 (22) 34 (17) 25 ( 5 (7) 31 (15) 13 (61 3 (2) 2 (I) 204 (100) 5.2 7.0
7. All Respondents 78 (22) 82 (23) 55 (15) 39 1111 22 (6) 54 (14) 19 (5) 8 (2) 3' (1) 362 (100) 4.5 6.7
'44 32
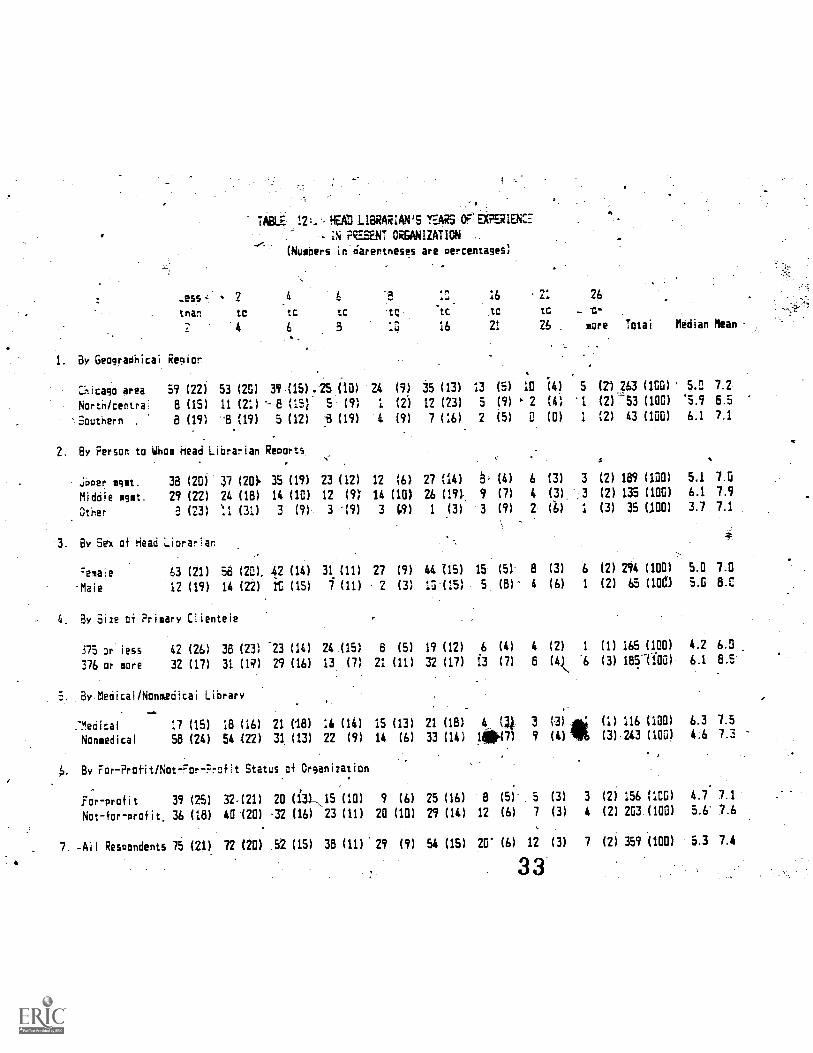
TABLE HEAD LIBRARIAN'S YEARS OF' EXPERIENCE
- IN PRSSENT ORGANIZATION
(Numbers in4arentneses are percentages)
_ess-i 2 4 t
tnar tc to tc
-5
-to-
12-
'to
16
tc
21
to
76
---o .
2 4 6 5.,4 16 21 26 . more Total Median Mean
1. By Geogracinicai egior.
Chicago area 59 (22) 53 (20) 39415) .25 (10) 24 (9) 35 (13) 13 (5) 10 (4) 5 (21 263 (100) ' 5.2 7.2
Nortn/centra: 8 (15) 11 (21) (15) S (9) 1 (2) 12 (23) 5 (9) ' 2 (4) I (2)-',53 (100) '5.9 6.5
Southern , 8 (19) -4 (19) 5 (12) 'B (19) :4 (9) 7 (1.6) 2 (5) 0 (0) 1 (2) 43 (100) 6.1 7.1
2. By Person to Wnom Head Librarian Reports
'
a
,Toper eget. 38 (20) 37 (201. 35 (19) 23 (12) 12 (6) 27 (14) B; (4) 6 (3) 3 (2) 189 (100) 5.1 7.0
Middle mgmt. 29 (22) 24 (18) 14 (10) 12 (9) 14 (101 26 (19) 9 (7) 4 (3). ', 3 (2) 135 (100) 6.1 7.9
Other 5 (23) :1 (31) 3 (9) 3 -(9) 3 (.9) 1 (3) 3 (9) 2 a) 1 (3) 35 (100) 3.7 7.1
3. By Sex of Head Librarian
enaie 63 (21) 58 (20). 42 (14) 31 (11) 27 (9) 44 115) 15 (51- 8 (3) 6 (2) 294 (100) 5.0 7.0
-Male 12 (19) 14 (22) rc (15) i (11) 2 (3) 121151 5 (8)' 4 (6) 1 (2) 65 (10e1 .5.0 8.0
4. By Size of Primary Clientele
375 or iess 42 (26) 38 (23) 23 (14) 24 (15) 8 (5) 19 (12) 6 (4) 4 (2) 1 (1) 165 (100) 4.2 6.0
376 or more 32 (17) 31 (1q) Z9 (16) 13. (7) 21 (11) 32 (17) 13 (7) 8 (4 '6 (3) 1851100) 6.1 8.5
5. Byledical/Nonmedicai Library
*:Medical 17 (15) 18 (16) 21 (18) :6 (16) 15 (13) 21 (18) 4 (li 3 (3) (1) 116 (100) 6.3 7.5
Nonmedical 58 (24) 54 (22) 31 (13) 22 (9) 14 (6) 33 (14) 1 (7) 9 (4) (3)243 (100) 4:6 7.3
By For-Profit/Not-For-Profit States of Organization
For-Profit 39 (25) 32-(21) 20 1- 131-i5 (10) 9 (6) 25 (16) 8 (5) 5 (3) 3 (2) 156 (100) 4.7 .7.1
Not for-profit. 36 (18) 40(20) -32 (16) 23 (11) 20 (10) 29 (14) 12 (6) 7 (3) 4 (2) 203.(100) 5.6' 7.6
7. -Ail Respondents 75 (21) 72 (20) 52 (15) 38 (11) 29 (9) 54 (15) 20' (6) 12 (3) 7 (2) 359 (100) 5.3 7.4
33

Less
than
2
TABLE 13: HEAD LIBRARIAN'S YEARS OF EXPERIENCE.
IN LIBRARIES
(Numbers in parentheses are merct:Mtages)
2 4 6: 8 16
to to to to to
4 6 8 10. 16 21
1. By Geographical Region
Chicago area 16 (6) 22. (8) 44 (17)
North/central 5 (9) 8 (15) 1 (2)
Southern 7 (17) 3 (7) 4 (10)
2. By Person to Whoa ead Librarian Reports
upper mgmt. 15 (8) 15 (8) 31 (17)
Middle,igat. 11 (8) 11 (8) 14 (10)
Other 2 (6) 7 (20) 4 (11)
3. By Sex of Head Librarian
Female
Male
19 (7) 32 111)
9 (14) 1 °(2)
22 (8)
8 (15)
4 (10)
39 (15) 62 (24)
1 (2) 19 (36)
2 15) .12 (29)
21 (8) 15
6 (11) i
5 (12) 2
22(12) 22 u2r 39 (21) 21 (11)
8 (6) 13 (10) 49 (37) 8 (6)
4 (11) 7 (20) 5 (14) 3 (9)
11
8n-
44 (15) 25 (9) 31 (11) 81 (28) 25 (91' 15
5 (8) 9 (14) 11..(17) 12 (19) 7 1I1) 4
4. 3y Si-ze of Primary Clientele
375 or less 19 (12) 17 (11)
376 avow 9 (5) 16 (9)
5. By Medicai/NonsediCal Library
Medical 8. (7) :1 (10)
Nonmedical. 20 (8) 22 (9)
28 (17)
20 (11)
a
19 (12) 20 (12) 35 (22) 10 '(6)' 7
14 (8) (11) 56 (30) 19 (10) '11
8 (7) 12 (10) :6 (14) 43 (37) 7 (6) 4
41 (17) 22 (9) 26 (111 50 (21) 25 (IC) . 15
6.. By For-Orofit/Not4or-Profit Status of Organization
For-profit 10 (7) 14 (9) 27 (18) 19 (12) 13 (8).
Not-for-profit 18 (9) 19 (10) 22 (11) 15 (8) 29 (14)
All Ihmanarlon44 2A 1111 33 (9) A9 11AI Ai (in) 42 412)
reu 3436 (23) 17 (11) 8
57 (28) 15. (8) :1
i1.126) 32 t91 19 ,
21
7.13
26
26
or_
more Total
(6) 20 (7) 261,(108)
(4) 3 (6) '53 (100)-
(5) 2 (5) 41 (100)
(6) 10. (5).186 (100)
(6) 12 (9) 134 (100)
(0) 3 (9) 35 (100).
(5) 18 (6)190 (1011)
(6) 7 (11) 65 (100)
(4) 7 (4) 162 (100)
(6) 18 (10) 184 (100)
(3) 6 (5) 115 (100)
(6) 19 (8) 240 (100)
(5) 10 (7) 154,(100)
(6) 15 (8) 201' (100)
(5) .25 (7) 355.110111
Median Mean
, 09.4 11,3
12.4-12.1
12.1 10.7
8.940.9
12:4 12.:
8.1 9.8
-111.0 11.0a,
10.0 12.0
7.8 9512.4 12.6
12.1 11.1
9.2 11.3
9.1 11.1
9.8.11.3
9.6 11.2
. By Geographical Area
, -
Chicago area 13 (5) 11 (4)
North/central 6 (12) 510)Southern (11) 1 (3)
$9,999 $10,000"
or to -le4 $12,499
TABLE 14:11040 LI8RARIAN'S.SALARY
no in parentheses are percentages)
"$12,500 $15,000 soap $to to to to
S14,999.$17,499 $19'999 $24,999 $29,
000. $25,000 $30,000 $35,40 $0,000 :
to to
17 (7)' 22 (9) vk (10) 66 (26)
1 (2) 13 (27) 91(10) 7 t14
1 (3) 5 (13) 8.(21) 13 (34)
By Person to Whoa Head Librarian Rep*orts
Uoper agat. '11 (6)
Middle 'Iva. 9' (7)
Other 3 (9)
I. By Sex of Head Librarian
Female
Male
10 (6)
7 (5)
0 (0)
21 (8) 13 (5)
)2 ) 4. (7)
... .,......lL BY Size of Prinar9r 1:entele
1 to 375 17 (11) 10 (6)_
376 or more 5 (3) 7 (4)
i. By Medical/Nonnedical Library
Medical 10 (9) B (7)
Nonnedical 13 (6) '9 (4)
8 -(5)
7 (5)
4 (12)
/`
18 (10 23 "(13) 44 (25)
18-414}-46 (12) 31 q4)
4 ea) (0) 11 (33)
17 (6) -37 (13) 33 (12) 74 (27)
2 (4) 3 (5) 6 (10) 12 (20)
13
6
(8) 23 (15) 15 (10) 36
(4) ,15 (9) 22 (13) 48
(23)
(28)
7 (6) 16 (15) 18 (17) 24 (22).
12 (5) 24 (11) 21 19) 62 (27)
). By For-Profit/Not-For-Profit Status of Organization
ForT.profit 4 (3) 2 (1)
Not-for-profit 19 (10) 15 (8)
9 (6) 14 (10) 11 (8)-1:0
10 (5) 26 (14) 28 (15) 45 (24)
(28)
$39499 more Total Median Mean
55 1221
6 (12)
3 (8),_
-35 (20) 11
25 (19) 7
4 (12) - 1
16 (6)
3 (6)
0 (0)
(6)
(5)
(3)
6. (2)'1 (2)
2 (5)
oD
54 (19) 13 -(5) B (3) 8. (3) 278 (100) $21,858
10 (17) 6 (10) 1 (2) 13 (22) 59 (100) $26,375
/9 (19) :5' (2) 4 (3) 6 (4) 156
33 (19) 16 (9) 5 (3) 15 (9)172
14 (1 7 (6) 3 (3) 2 (2) 109 (100) $19,375
50 (22T 12 (5) 6 (3) 19, (8) 228 (100) $22,661
26 (14) 11 (6) '3 (2)
I '
18 (7) 250 (1]0) $22,614
2 (4) 49 (100) $17,404
1. (3) .38 (100) $20,000
3 (2) 12 (7) 175 (.100) $22,244
4 (3) 5 (4) 129 (100) 1212855
2 (6) 4 (12) 33 (00) $22)500
(100) $20:000
(100) $221865
38 (26) 8 (6) 6 (4) 13 (9) 146 (100 $23,262
8 (4) 191 (100) $19,777
35
$23,410
119,745
$20,559
$22,807"
$21,880
$23,964
$211547
$27,309
$201504
$24,544.
$20,310
$23,629
$24,983
$20,700

TMLE HBO LI SALARY- (Continued)
(Numbers in- are porciata9es)
. ,
59)949 *OM %MOIL Wall $171511a 1211,01111 $25101111.- $311,0110- MDR UMWar - to to ur r
to to to to. .. to ar c
less .. 62,499, $144999 $17,495 $191999 $24,999 $2999't $34,999 $3%999 sore Total Median Mean
r. Iliv, Age. r .
1
. 39 or raungir 11- 112) 111 .(5) 12' (6) 7.&(1.4) Z0: (1/) 55. (29) la (ai) a (6) 2: (1) 6-.. (3) 193 (1W)) Rum: $21,70'. 4(1 ar alder 1Z (6) 7 (S) 7 (5) ri, (.4) 19 (a): 31 (72) ZA. (17) if (it) ;7 (5) 15:.(10)W_1.44. (1110) =O8: laia
L By Educational Level
High school. a (a) a (a) 1 (14) 1 (14) 21 (29) 3 (43) II IC) . 0 (D) a (0) 0 (0) 7 (10)) $19-)175: St91286,
Sase cal lege 1 (4) 1 (4) 8 (33) 5 (a) 5 (21) C (17) 11 (0) 0 (11)" 0 (0) Q (a) 24 -(100) $116,0(111. $16_0406
Tor-year degree 3 (33) 1 (11) 0 (a) 3 (33) 1. (11) a (a) 1 (u) a- (a) U: (0) a (0). 9 (109) $15,417 VA-MkBachelor's 4 (7) 6 (11) 3 (6). a (15) 7 (13) 12 (72) 11 (22) a (a) 1 (2) 7 (4) 54 (100) $191443.:, WaltItS 12 (7) 5 (3) it (4) 17 (1a) 17 (10) 44 (27) 41 (75) 10 (6) 4 (2). 10 (6) 170:(10p_) $22077 fallja:Other advanced - -
degree 0 (B) 3 (11) 1 (4) 3 (11) 5 (19) 3 (11) 3 (11). a (0) 3. (11)- 6 (22) 27 (11111)°122taa 14171Eit
MLS + advanced-
%dawn 3 (7) 1 (7) 0 (D) 3 (7) 2 (4) 18 (CD' 6 (13) 9 (20) f (2) 2 (44 45 (100) $2...3,12$ $2,u667
9. AI I Respondents 23 (7) 17 (5) 19 (6)- 40 (12) 49 (14) 86 (25) 64 (18) 19 (5) 9 (3) 21 (6) 347 (1(10) S22)137 .$22)556
ti
§ 36-

TABLE 15: SALARIES OF PROFESSSIONAL STMT,
NOT INCLUDING HEM LIBRARIAN
(Numbers in parentheses are percenta;es)
39,999 $10,000, $12,500 $15,000
Or LG_ LO
255 $12,499 1114,399 $17,499
By Geographicai Aria
2hicago area
North /central
3out'ern
(24)
4 (29)
1 (11)
3,(32)
3 (21)
3 (33)
By Ferson to Whom Head Librarian Reports.
jpper mgmt. 11 (17)
Middie 'gat. 7 (17)
3ther :0 (77)
20
15
1
(32)
(36)
(8)
11
'2
1
(17)
(5)
(8)
!. By Sex of Head Librarian
:emaie 17 (18) 33 (35) '9 (13)
Male 10 (50) 3 (15) 1 (5)
i. By Size of 'Primary Clientele
1 to 375 9 (24) :3 (34) 2 (5)
376 or more 19 (25). 21 (27) 12 (16)
Bv Medical /Nonmedical Library
Medicai 4 (15) 9 (33(.7\3-(11)
Nonmedical 24 (27) 27 (31) 8 (9)
6 (6)
0 (C)
1 (11)
3 (5)
3 (7)
1 (8)
6-, 16)
1 (5)
3
4
(84
(5)
1 '(4),
6 (7)
6. By For-Profit/Not-For-Profit Status of Organization
For-profit . 16 (27)
Not-for-profit 13 (22)
7. 'AIIResnondents 28 (24)
18 (39) 5- (8) 5 (8)
15 (31) 9 (15) 2 (3)
36 (31) 14 (12) 7 (6)
$17,500 $20,00V325,000
to to
$30,000
t:
$19,999 $24,999 $29,999 $34,999
16 (17) 1 (1) 2 ur 2 (2)
2 (14) 1 (7) C (0) 1' (7)
3 (33) 0 (3) 0 (0) 0 (0)
12 (19) (2) (3) 1 (2)
9 (21) .1 (2) 2 (5) 2 (5)
0 (2) fl (0) 0 (0) (0)
17 (18) 2 (2) 2 (2) 3 (3)
4 (20) 0 (0) 0 (0) 0 (0),
7 (15) 0 (0) : (3) 0 (0)
13 (17) 2 (3) 1 (1) 3 (4)
7 (26) 0 (0) 0 (0) 1 (4)
'14 (16) 2 (2) 2 (2) 2 (2)
9 (15) 1 (2) 2 (3) 2 (3)
12 in) 1 (2) 0 (0) 1 (2)
21 (18) 2' (2) 2 (2) 3 (3)
- 37
%ID
$351000 $4C1000
tO 0?
339,999 -more
3 (3) 2
1
1
(2)
(2)
(0)
3
0
3
-1 (1) 3
1 (5) 0
2 (0)
2 (3)
3
0
(4) 1
1 (1) 2
0 (0) 2
2 (3) 1
2 (2) 3
Tcta! Median Mean
(2) 95 (100) $11,677 $13,9,35
(71. 14 (100) $13)991 $16,106
(0) 9 (100) $14,006 313,693
(5) 63 (mg $13,967 $14)891
(0) 42 (100) $111696 $14,75C
(0) 13 (100). $8,16& $8,780
(3) 93 (100) $11,677 $16096
(0) 20 (100) $11)611 $12,104.
(8) 3i(150) $11)676 $15,148
(0) ri (100) $11,680 $13,758
(4) 27 (100) $14)013 $15)453
(2) 88 (100) $11)667 $13029
(3) 60 (.00) $11.672' $14,351
(2) 59 (100) $11,693 $13,984
(3) 118 (100) $11,675 314,168
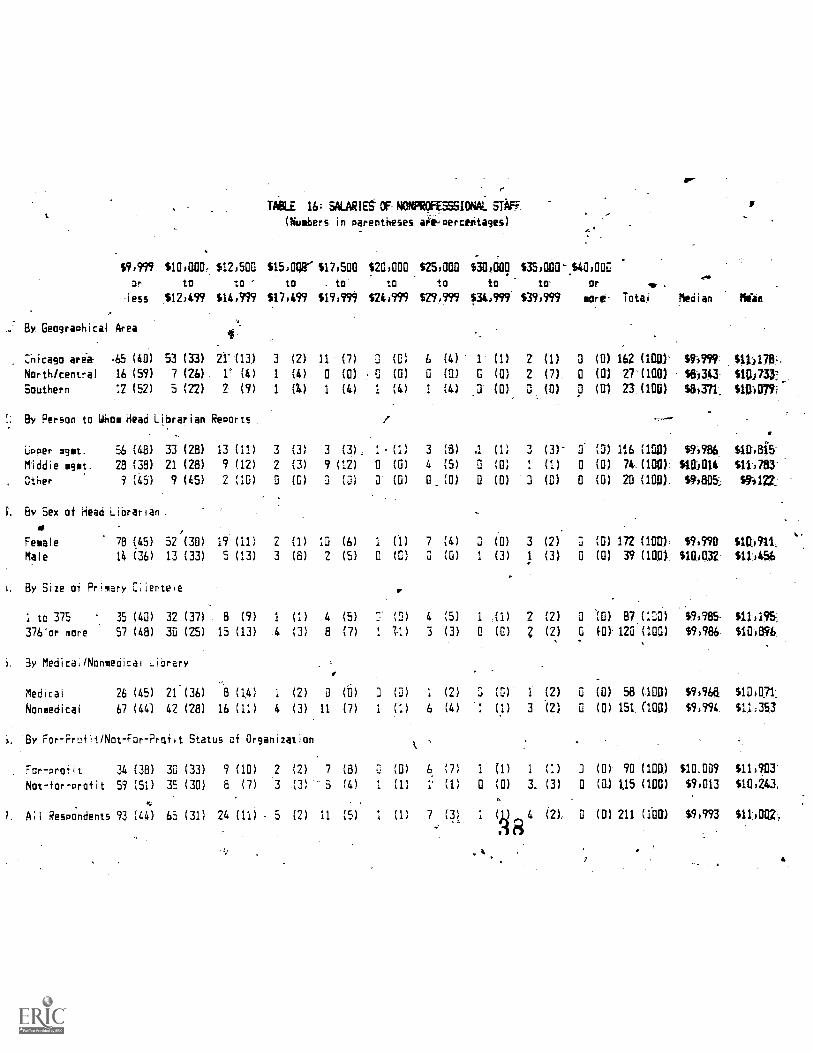
i.
t
TABLE 16; SALARIESAF-NOMPROFESSSIONNL STAFF
(Numbers in parentheses -ail.oercentages)
$9,999 $10,000, $12,500 $152000'
or to to to
Hess $12,499 $14,999 $17,499
By Geographical Area4
$17,500
. to
$19,999
$20,000
to
$241999
$25,000
to
529,999
$30,000
to
94,999
$35,000'
to-
$39,999
$41,00E
or .
more, Totaj Median Mika
:-..nicago area- 65 (40) 53 (33) 21'(13) 3 (2) 11 (7) 0 (C) 6 (4) 1 (1) 2 (1) 0 (0) 162 (100)' $9-1999 1414170-
North/central 16 (59) 7 (26) . 1' (4) 1 (4) 0 (0) G (0) 0 (0) G (0) 2 (7). 0 (0) 27'(100) $0-1343: $10J7337
Southern :7 (52) 5 (22) 2 (9) 1 (4) 1 (4) I (4) (4) .0 (0) 0 (0) p (01 23 (100) %Alt $10i0.79;'
By Person to Whom Head Librarian Reoorts p
'doper mgmt. 56 (48) 33 (28) 13 (11) 3 (3) 3 (3), 1 (1) 3 (3) .1 (1). 3 (3)- 0 (0) 116 (100) $9,986 $10,815
Middle gmt. 28 (38) 21 (28) 9 (12) 2 (3) 9 (12) 0 (0) 4 (5) 0 (0) 1 (1) 0 (0) 74-(100): $10)014 $11-1783'
Other 9 (45) 9 (45) 2 (10) 0 (G) 0 (0) 0- (0) 0_ (0) 0 (0) 0 (C) 0 (0) 21 (100). $94005:.: $9.3122z
By Sex of Head Librarian .
Female 78 (45) 52 (30) 19 (11) 2 (1) ID (6) 1 (1) 7 (4) 3 (0) 3 (2) (0) 172 UMW $9,990 $10,911,
Male 14 (36) 13 (33) 5 (13) 3 (8) 2 (5) 0 (C) O (0) 1 (3) 1 (3) 0 (0) 39- (100). $1040.32.' $11)456
By Size of Primary C;ierte,e
I to 375 35 (40) 32 (37) . E3 (9) 1 (1) 4 (5) 5' (0) 4 (5) I (1) 2 (2) 0 '(0) 87.(100) $91985- $11.,195:
376'or more 57 (48) 30 (25) 15 (13) .4 (3) 8 (7) 1 1-1) 3 (3) 0 (0) Z (2) 0 f(1) 120 (100) $91986- $10-,896
3y Medica;/Nonmedicai Library
Medicai 26 (45) 21 (36) 8 (14) 1 (2) 0 (1) 0 (0) I (2) 5 -(0). 1 (2) 0 (0). 58 (110) $7,968: $10.an
Nonmedical 67 (44) 42 (28) 16 (11) 4 (3) 11 (7) 1 (:) 6 (4) : (1) 3 (2) 0 (0) 151. (100). $9)99 $1.1:353.
By For-Profit/Not-For-Profit Status of Organization
For-profit 34 (38) 30 (33) 9 (10) 2 (2) 7 18) C (0) 6 (7) 1 (1) 1 (:) 0 (0) 90 (100) $10.009 $11)903'
Not-for- orofit 59 (51) 35 (30) 8 (7) 3 (3) 5 (4) 1 (1) . (1) 0 (0) 3. (3) 0 (011 1.15 (100) $9,013 $10,243,
A;I Respondents 93 (44) 65 (31) 24 (11) 5 (2) 11 (5) 1 (1) 7',(31 1 4 (2), 0 (0) 211 (100) $9,993 $11402.,

JIM. EDGAR,SECRET Art, or STATIg
.
APPENDIX 1: COVER LETTER A QUESTIONNAIRE
a
OFFICE OF THE SECRETARY OF STATESPRINGFIELD, ILLINOIS 62756
October 12, 1982
To the person in charge of this library:
The Illinois State Library is concerned with all types of libraries,and since 1981 has been gathering data on the resources; services and:Yethods of special libraries. The Library Research Center of the Universityof Illinois has been co=nissicned to ca.ry out this and other related surveys.The Library. Research Center; working with an adVisory oc=ittee of the-
1111nis C1.apter of the Special Libraries Association, has recc=7.ended thatthe 1;83 survey of Illinois special libraries which are affiliate nerbers of
ILT_IS:ET be en personnel and staff characteristics.
A copy of the quesionnaire is enclosed. Please answer the questionnaire
as soon as possible, and return it to the Library Research Center using the
envelope provided. Since the data requestedbec =e dated very quickly, youare encouraged to respond as soon as possible. A brief report on the results
of the survey will be published by the Illjnois Chapter of the Special
Libraries .ssociation; to facilitate the pronpt publication of this report
we are using a rn achine scored questionnaire form. A fuller,report will
a,--pear as an issue of the Illinois State Library's Illinols=libary Statistical1,..ports; you will autc=atically be sent a copy of the complete report when
it is published. All reuones will be heleconfidenflar4 and under nocirc=etarxes will data for any ;articular organization or individual berelished or otl:eriie disclosed.
This questionnaire has been reviewed by the advisory cormittee.and was
pretested in a group of Illinois special libraries. If you hale any questions
or Oor..-.ents about the survey form, .call or write Danny Vallace or HerbertOnldhor, Library Research Center, 410 David Kinley Hall, University of Illinois.
1407 W. Gregory DriV.6 Urbana, IL 61801 (217/333-1980).
The subject of this survey is of great potential value tb all special
librarians. Pl.ase.help us serve you better by answering this questionnaire
cczpletely, carefully and prc:-...ptly,
K3P:sae
35
Sincerely yours,
C14-: J q1414-imKathryn J. desterfield---.Director
Cir
J

itfllinols State Libraty$ Springfield, IL 62756
PERSOtiNEL SURVEY: OURACTERISTICS OF STAFFS OF SPECIAL LIBRARIES AND
m. INFORMATION CENTERS 1:HICH ARE .AFFILIATE M.-EMBERS OF LIBRARY SYSTEMS
WW1
..Please corpletz this suruey and return it in the enclosed envelope
.. by February 10 1983. Data should be based on the fiscal year ending
anytime in 1982. Answer tines are numbered to correspond to question
nuriSersianswers sFfd be rarked-wPith a.number two pencil. Do
.* star1eArwer sheets to,qather..
Na-e of organization
vi
ger ,i,
WV
POWal
114
W
Tall ajd.ress
!:E.7.2 of library system_
2.
r
og00000ceooeop00000000eopoosogipeoeoet4ooec000pee0e006000ti
ope000000eoc00000ee
00'0'00000'0©oboeo0060ec00000000ecooet00000e000ocx-xpop0000000.008600000000600000000063ocx)e00000s00000d00060000000000ocpoor.D.-Do®o
ooeoo®oc,os00000000030,000000000
0 0 q® Op 00
Is the orsi-nization (1)for profit, or (2) not for profit?
Size of libtary/info:=4tiOncenter's primary cliencele (th,pse
the library/infor:-.ation centeris primarily intend-
ed to ser-:e): (1) 1 to 99 (4) 300 to 499 (7) 1000 to 1499
'(2) 100 to 199 (5) 500 to 699 (8) 1500 to 1999.
(3) 200 to 299 (6) 700 to 999 (9) 2000' or
Do,:s .f::e head librarian/infortationcenter manager report to
(1) u.7.,-.-er .7..anaLe7ent,(2) middle n.anaL-eent, () board,
(4) or (5) ;
cEe2 exp_;:.2:tures
llr?e h-27d ccnf-Z: arc' un:.71r no will
o: or;_zrz:7::n be dis:,!cs,,d. If you are-
c7atc,,,rio,?17,3 to c:Est:cr 21
fol ezt./ for the librar--7:7V-7=-1,-
Educacion Flf.e school diploma, (2) Sc7.a. college but
no .deLne, (3),AsSOCiate's or other two-year degree, ,(4) Bache-
lor's degree only, (5) Master's or other fifth-year degree in
library science, (6)Advanced degree in field other than library
Master's degree in library science and adva:ced
drgcez in another field, or (8) other.(specify)___
5: Years of experience in.present position:
(1) Less than 2.0 (4) 6.0 to 7.9 (7) 16.0 to 20.9
(2) 2.0 to 3.9 (5) 7.0 Id 9.9 (8) 21.0 to 25.9
(3) L 0 to 5.9 (6) 10.0 to 15.9 (9) 26.0 or more
Yearl of eAperience as profestional librarian/information
specialist in present organization:. .
(1) Less than 2.0 (4) 6.0 to 7.9 (7) 16.0 to 20.9
(2) 2.0 to 3.9 (5) 7.0 to 9.9 (8) 21.0 to 25.9
(3) 4.0 to 5.9 (6), 10.0 to 15.9 (9) 26.0 or more
6.
r.
lira
40,
FOR MARKINGINSTRUCTIONS,
SEE OTHER SIDE.DO NOT MARKIN THIS AREA.
SINE I
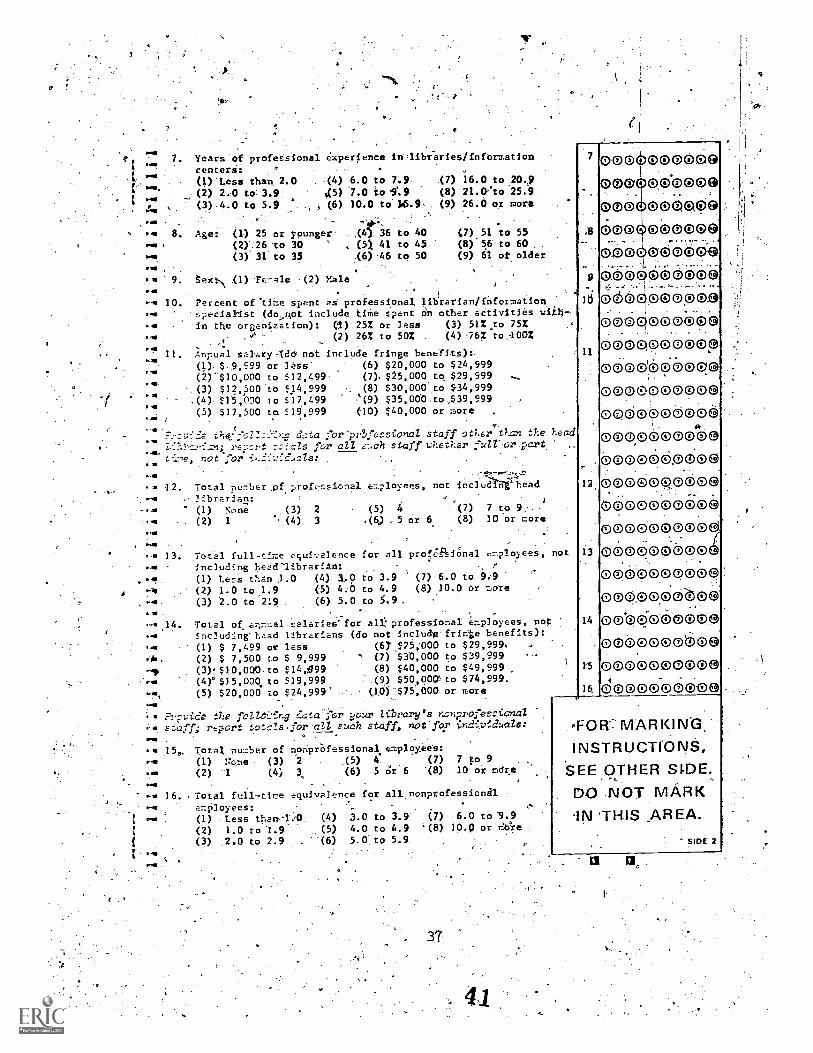
00000000900C) 00.0009
000 000009000 0000090008.00000®0.00e0 6660e
coe0000pooocYog0000esGoo6p0000p000e00eo800000000esoebeb000es000000000®000e00.060e000eowoes06GeoaDio600000000ed000ci00000ooh' eDpapee
000,00.0000ocbcio600tpe
oobe000txxo000000000®000000000®
,I1
99919
1.11
r.11
7. Years.of profetisional -..iperience inlibraries/fnformatioa
centeri: °
(4)"Less than 2.0 : '(4) 6.0 to 7.9 (7) 16.0 to 2041
(2) 2:0 to 3.9 '45) '1.0 to 4.9 (8) `21.O-.to 2$.9 .
(3).4.0 to 5.9 4 , :, (6) )0.0 to 116.9 (9) 26;0 or more
8, Age: (1) 25 or younger ,(41 36 to 40
(2)26 to 30 ' , (5) 41 to 45
w (3) 31 to 35 (6) 46 to 50
,*--.1 9. ex:-..\ (1) Ti -ale .(2) Male.. .
1
-0 10, Percent of-ti r..-,e spent as professional, librarian/frifotmation9 9.111 -specialist (do,Rot include time spent on other activities wifh-,
4 in the org-enization): (I) 25Z or lesi (3) 51Z,to 75Z , ..
-. ;.' (2) 26Z to 50Z (4) 76Z to,100%,
,..
(7) 51 to S5(8). 56 to 60(9) 61 of older
11, Annual salary,(da not include fringe benefits)(1).$.9,999 or less'. (6) $20,000 to $24,999(2)$10,000 to $12,499 (7). $25,000 to $29,999
(3) $12,500 to $14,999 (8) $30,000 to $34,999,(4)- $15,000 to $17,499 .`(0) $35,000.to,$39,999(5) $17,500 ta $10,999 (10) $40,000 or more
411
91e
9
data or pr3,esstonal staff otl.er than the head2,,n-zt --gals for all el.ah staff.w4ther fulr.or.part
at for. .
,. .
.. 12. Total 1112:713er :of 1,rofssional e7.ployees, not inCiuZtilfilead
..-.1 .,' librarian: w
--..A " (1) None ,(3) 2 (5) 4.
(7) 7 to 9, .l
. (2) 1 (4) 3 :(6) _5 or 6 (8) 10 or more
13. Total full-ti=e equivalence for all profAianal e.7.pinyees4 not
Including head librarian: .
. '1 (1) Less than J.0 (4) 3,0 to 3.9 '.(7) 6.0 to
(2), 1.0 to 1.9 (5) 4.0 to 4.9 (8) 10.0 Or Ildre
(3) '2.0 to 2:9 (6) 5.0 to 5.9 .
. Total of arinual salaries' for all;professionai employees, notincluding -hand librarians (do not include frinte benefits):(1), $ 7,499 or less (67,$.25;000 to $29,999.
(2) $ 7,500 to $ 9,999 (7) $30,000 to. $39,999
(3)!$10,010 to $14,099 (8) $40,000 to 449,999
(4)°$15,000 to $19,999 .(9) $50,000"- to $74,999.
(5) $20,000 to $24,999' .(1()-$75;600. or more
the follt1:....ng cta fir ijoUr Zibrary's ncnprofessicmalstaff; rt-,.isort tot:13s.for aZZ such staff; not for
..I 15,. Total n=ber of nonprOfessional employias:(1) 1:cne (3) 2 .(5) 4. 7 (7) 7 p:1 9 -.
(2) -1 (4) 3 (6) 5 8.1-'6 (8) 10 or ndr,e. ,
16. ,Total full-time equivalence for all nonprofessionilezployees:(1) Less than.1.13
(2) 1.0 to 1.9(3) 2.0 to 2.9
9 AB
(4) 3.0 to 3.9 (7) 6.0 to'0.9
(5) 4.0 to 4.9 '(8) 10.9 or dthe
(6) 5.0.to 5.9
9
11
13.
13
14
1'5
16
.FOR- MARKIN-GINSTRUCTIONS,
SEE OTHER SIDE.DO NOT MARKIN 'THIS AREA.
Ul
` SIDE 2
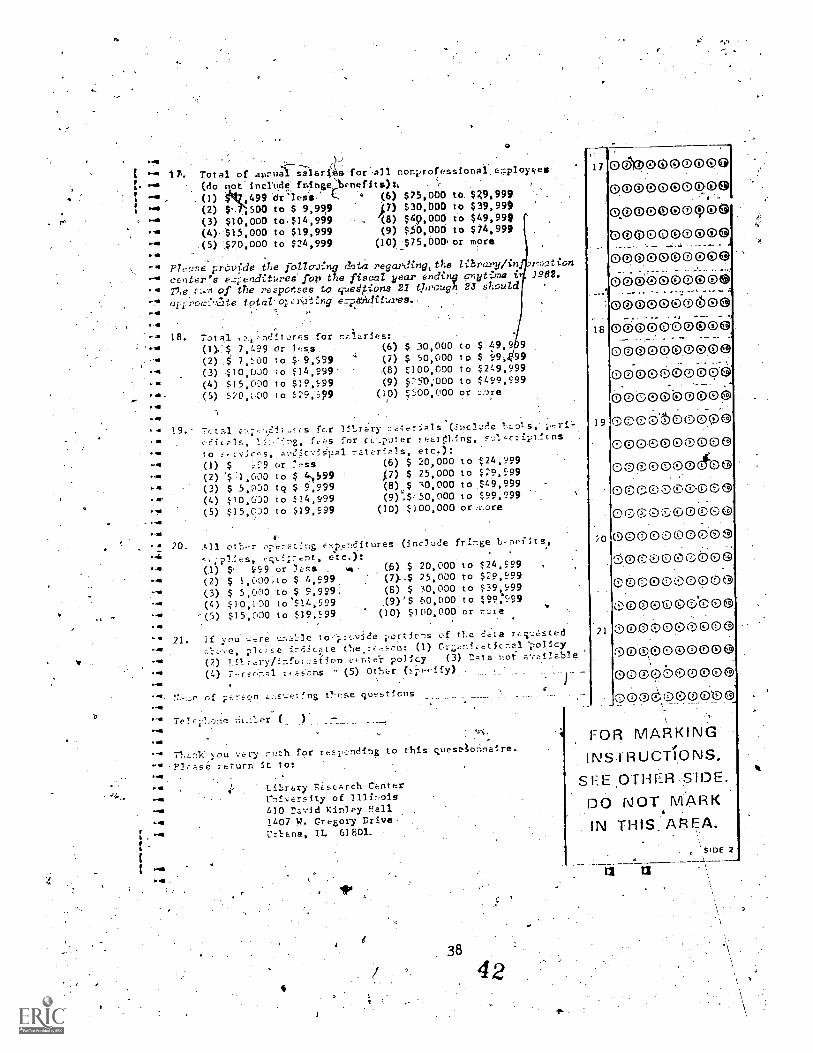
It&NO
le
O
(,)-
Al. Total of anrmal salaries for All nonprofessionat.e:r.ployeee
(do not'incrude fr.inge,:laoenefits)4 .
. (1) .499 driesi.. t. 4 (6) $25,000 to. $Z9,999
(2) $s SOO to $ 9,999 0) $30,000 to $39,999
(3) $10,000 to$14,999 (8) $49,900. t'o $49,999
(4) $15,000 to $19,999 (9) $50,000 to $74,999
(5) '$20,000 to $24,999 (10) $75 000or more.
" Please ppOoide the following regarding, the library/in :Nation
- center's e..:T.enditures'Ar,the fiscal year ending cnyti.me i 3982.
" ??,e ::..'n of ihe respotses to que4 ions 21 through 23 should
tptatozng-...;..-fp
/8. Total ,:,,,71d!turf?s for f.,:laries:
(1).:$ 7,499 or (6) $ 30,000 to $ 49,9 9
(2) .$ 7,500 to $ 9,999 " (7) $ 50,000 to $ 99, 9
(3) $10,030 :o $14,999 (8) $100,000 to $249,999
(4) $15,000 to $19,999 (9) F50;000 to $499,999
(5) $:'0,000 to $29;999 .(10) $1:00,000 or :Lore
fc.r 111-,rry
fees for cc..puler .5earlAng,
to
(1) $ or :ess (6) $ 20,000 .to $24,999S7) $ 25,000 to $29,599(8) 30,000 to $49,999(9).$,'50,000 to $99,999
(10) $100,000 or,-....ore
(2) .$:1,000 to $ 4.999(3) $ 5,030 tq $ 9,999(4) $10,00 to $14,999(5) $15,0D0 to $19,999
20. All othrr expei tures
i-:ie1t, etc.):(A) $' 999 or 1ss $ 20,000 to $24,999
(2) $ 1,000,to $ 4,999 (7).-$ 25,030 to $29,999
(3) $ 5,000 to $ 9,999: (8) $.30,000 to $39,599
(4) $10,430 to'$14,999 .(9)'S .50,000 to $99:599
(5) $15,000 to $19,999 (10) $100,000'or r:;re
(include fringe bnefits,
21. If you to.,111c.,vide i,orticms of tLe eata
Oterea5.ou: (1) Cle!yfr.etic:-..11
(2) 1.11tary/fnfor7aiion ci-nte'r policy (3) 2Ata rot.
(4) ..7,-rsc,n.71 rcaScns - (5) Other
of qusticns
T.1.7,.k you :cry for responding to this queselo:inire.
Plcase return it to:,
library 7es'carch Centernicrilty of Illinois410 raid 1,:inley Hall1407 W. Gregory Drive.'1.71-lana, 1L 61601. -.
38
42
17 00)2)0000000
00000000.000,00000090ED
00000000100000000000p666000- 6606i000000060®
18 060000000®0000000000060006060-60000000006
190000N30000C000000000000(D000Cif00OCC)000C.C1303
0000,0000600'2o0000000000
000'0C:00000C0000000000000000(1)00
2100000060000000000000000b0000000 (D,00000C1.,
FOR MARKINGINSTRUCTIIONS,
SEE OTHERDO NOT MARK
. IN THIS. AREA.SIDE 2

APPENDIX 2: THE USE OP,HACHINE-SCORED ANSWER SHEETSIN LIBRARY SURVEYS
As mentioned earlier, this survey ma4e us,e .of madhine7scoredanswer sheets (see Appendix,:LffOr a copy of the "questionnaire),'.the ,first'timeSuch a devige had-been used by the Library .ResearchCenter of the.-UniVersity of The use of the answerSheets was moilySied-by0a'desire to speed up the processing ofresponse's andt to determine whether. such answer sheets ,eould be
used as a cost-effective 'alternative- to the methods usuallyemployed by the Library Research Center:4' The results: of thisexperiment witii.machine-scored answer sheets are somewhat' mixed.
The Library Research Center has used computers to assist in
the processing of survey data for quite Some time. The usualprocedure begins with the design ,of a questionnaire thatfapilitate0 computer inputs When,the questionnaires are received,they are carefully coded, and the respOnses are entered into a
computer file by aninputter working at a computer terminal in anonline mode. 'Over the .years input programs of 'increasingsophisticatiop have been-developed., but Inputters,stilL make typo-
-. graphical errors, so the standard praCtice st the Library ResearchCenter is to have each questionnafre entered in duplicate files byseparate inputters. The two files are then compared using another
''computer program, and the differences are reconciled by referralto the original questionnaire, Data can then be analyzed throughuse of SPSS or some Other appropriate set of computer programs.This proceSs results .in'a very "clean" final product--a computerdata file virtually free of input errors--but is -very labor
!".intensive..
It was, hoped that the use of machine-scored answer sheetswould eliminate some 'of the labor requirements of the process. If
a method utilizing these answer sbeets,could be' perfected, theneed for coding of, response4-could lie minimized and the process of
,
entering data at akeyboard'eliminated altogether.
The questionnaires and - answer sheets were develobed in
consultation with the Measurement and Research Division44MAAD) of
the University's Office of Initructional.Resources. MARD has hadconsiderable experience, with the use of machine-scored answersheets, mostly. in the context of examinations and instructorevaluation forms, and has had some experience with the use of such°answer ,sheets for questionnaires: ,For financial reasons, the .
decison was made 'toe. work with' tile preprinted. answer sheets
. available from' MARD rather than _printing totally new answersheets. The preprinted form has two sides, one allowing for fivealternative responseato each question and the otheigpsallowing for
39 ^
.4

ti
1
ten. Sihce nearly all of the questions to be asked required moretthan- five choices, only one side of the answer sheet could be
'used." The4uestions were printed on-the preprinted answer.Sheetsusing normal photoreproduction processes.' Itwas decided to'usetwo versions.of the questionnaire for comps ative, purposes: one
version had the qugstiOns and anSwer'cate ries printed directly
on the machine-scored answer sheets;. the second version had _thequest4ons and answer categories- printed on plain paper and had a
separate machine-scored ansWer-'sheet witth the numbers of the
questions..
It was assumed that most respondents would, be familiar with .
machine-scored answer sheets from experienCe with standardizedtests, forms used by government agencies, etc. Although this
appears to have been generallytrue, it was obvious : that manyrespondents either did not underStand the use of the arnsWer- sheets
Or failed to follow instructions (one respondent appended a note
critical of the answer sheets as dehumanizing). . A fair. humber of.respondents used ballpoint rather than pencil. Others circled theanswers on the question sheet rather, than mar_king the answers on
the answer sheet or used a checkmark rather thanfilling in the'
answer circle.' Some answer Sheets were. stapled together.prior to,being returned, despite instructions not to, while others were sofolded and mangled by the respondents that they could not be read
by the 'scoring machine.' Some reSondentS were apparently confused; by the message on the 'an- .5heet regarding marking i struct ions,
and attempted to fit the .- responses, into the five-choice area onthe i wrong side of the a,. 'r . sheet. All of `these problemsrequi.red that the affected answer sheets be completely recopied by
Lib-rary esearch Center personnel.
Additionally, some respondents marked their answers on the
wrong' lines of the ansWer. sheets, masked more than one answer fox
a single question, or 'marked answers.that were out of range (a
response of "10", for instance, to a queStion with only nine
choices). ,These responses had to be edited, and in. some cases it
was'.,neessary to contact the respondent in order to be sure of the
intended answer. Additional information,' including a unique
librarylidentification number, page numbers for the multiple pagequestionnaires, and some data carried from the -previous year's
survey -,were added to questionnaires after they arr.'ived,at the'Library Research Cente
then, the time spent handling the questionnairesfor purposes_ of coding and editing was not any less than usual,
and may have been greater. The time spent in keybOara. input was
eliminated, but.the per - questionnaire cost op scanning each ansezer
sheet' was. estimated to be' epprokismiateisi equal to the labor cost bf
keyboard input. .
There was no need to develop the usual input -Orcomparison prOgrams, but the prOcess of retrieving the data from..
44
the tape supplied by MARD and reformatting them for analysis wasabout equal in time and cost to the creation of input andcomparison programs.
4
The Use of machine-scored answer sheet's, then, was not at alla failure, but was not greatly advantaghous either., .Coats wereaboVt the same, but considerable staff time was Waved. The use ofthe preprinted answer sheets rather thaansw'er sheets speciallyprinted for the survey was a mistake, and the.daeof tailor -madeanswer sheets would probably have lessened'some of the problemsencountered. The assumptionthat virtually all of the respondentswould ..be familiar with machine-scored answer sheets appears tohave been invalid, and more complete, instructions in 'Erie use oftfe answer sheets should have been supplied.
The use of machine-score1:1 answer sheets requires that thequestions asked be of a closed- ended, multiple choice nature. A
minimum of open-ended questions were asked in this survey, and.
they were designed -such that responses could be. asily convertednumeric form. It would-not be possible to use machine-scored
answer sheets for a survey requiring lengthy analytical answers.It can be convincingly argued,- however, that only closed-endedquestions' should be "asked in any mail survey, regardless of theformat. of the questionnaire.
Machinecbred° answer sheets are possibly best used insituations in which' the sponsor of the survey does not havelocally avai )1e 'facilities for computer processing of survey'results. of various stAtistical packages sUch'as-SPSS m he manual tabulation of survey results an anachronism,but. su.i, packages may not be available to everyone. In suchcases, a.survey using machinescored answer sheets could be used.The manual processes of editing and clean-up ofthe answer sheetscould be done locally, and the answer sheets could then.be sent tosome remote facility,for processing and analysis according tO thedesires of the survey's sponsor.
41
45
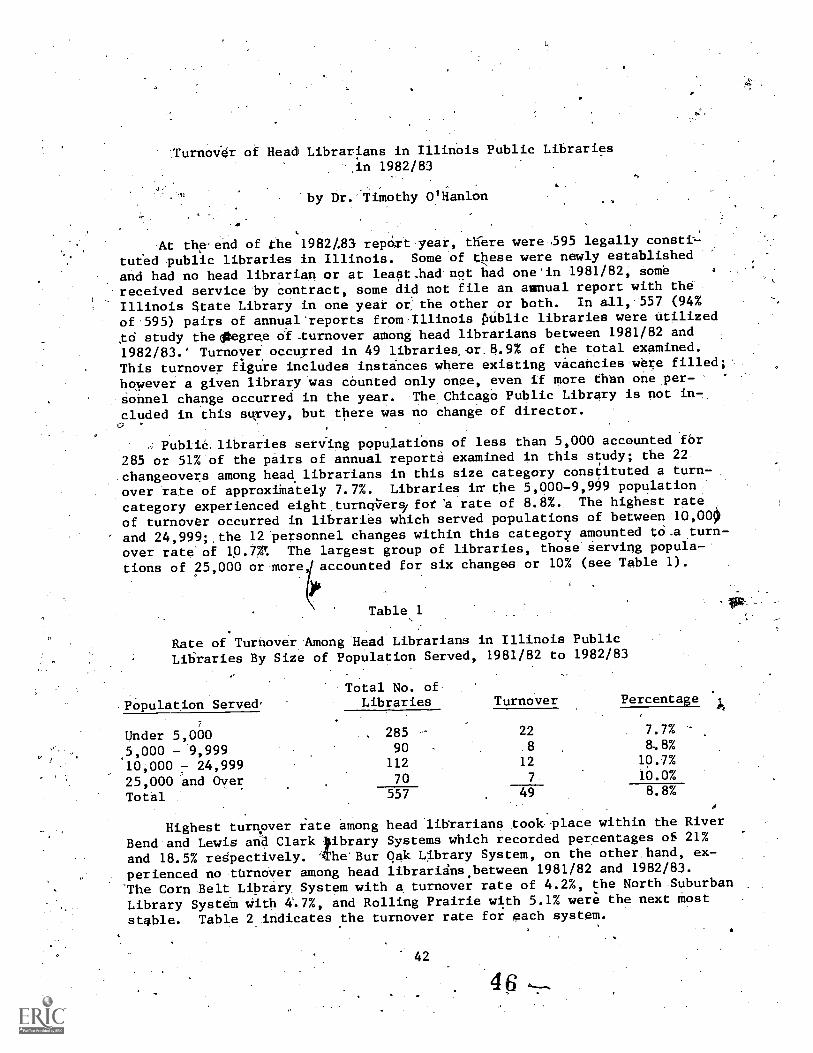
Turnover of Head Librarians in Illinois Public Libraries.in 1982/83
by Dr. Timothy O'Hanlon
.,
At the end of the 19821,83 report.year, there were 595 legally consti--
tueed public libraries in Illinois. Some of these were newly established
and had no head librarian or at least had not had one'in 1981/82, some
received service by contract, some did not file an annual report with the
Illinois State Library in one year or the other or both. In all, 557 (94%
of'595) pairs of annual'reports from,Illinois pUblic libraries were utilized
pi' study the *agree Otxurnover among head librarians between 1981/82 and
1982/$3.' Turnover, occuyred in 49 libraries,or.8.9% of the total examined.
This turnover figure includes instances where existing vacancies were filled;'
however a giyen library was counted only onee, even if more than one per
aonnel change occurred in the year. .The..ChicagO Public Library is not in
cluded in this survey, but there was no change of. director.C?
.
.
PubliC.libraries serving populatiOns of less than 5,000 accounted fbr
285 or 51% of the pairs of annual reports examined in this study; the 22
.changeovers among head librarians in this size category constituted a turn
over rate of approxiMately 7.7%. Libraries in the 5,000-9,999 population
category experienced eight turno'versifor'a rate of 8.8%. The highest rate
of turnover occurred in libraries which served populations of between 10,000
and 24,999;, the 12 personnel changes within this category amounted tO,a turn-,
over rate of 10.77. The largest group of libraries, those serving popula-.
tions of 25,000 or more accounted for six changes or 10% (see Table 1).
Table 1
Rate of Turnover Among Head Librarians in Illinois Public
Libraries By Size of Population Served, 1981/82 to 1982/83
Total No. of
Population Served, Libraries Turnover
Under 5,000 285 - 22
5,000 - 9,999 90 .8
10,000 - 24,999 112 12
25,000 and Over 70 7
Total 557 49
Percentage 'A
7.7%8,8%10.7%10.0%8.8%
0
Highest turnover rate among head librarians rook-place within the River
Bend:and Lewis and Clark 'ibrary Systems which recorded percentages of 21%
and 18.5% respectively. Arhe'Bur oak Library System, on the other.hand, ex-
.perienced no turnover among head librarigns.between 1981/82 and 1982/83.
The Corn Belt Library System with a turnover rate of 4.2%, the North-Suburban
Library Systet with 4.7%, and Rolling Prairie with 5.1% were the next most
stable. Table 2 indicates the turnover rate for each system.
42

Table 2
Turnover of Head Librarians in Iliinois"Public LibrarfsWLibtary,System, 1981/82 to 1982/83
No. of Total No. ofSystem Changes Libraries
Rate ofTurnover
,
Bur Oak 0 22 0%Corn Belt 1 , 24 ' 4.2%Cumberland Trail 1 18 5.6%DuPage 2 28 7.0%Great River 3 22 13.6%Illinois Valley 3 33 9.0%Kaskaskia 1 17 5.8%Lewis and Clark 5 27 18.5%Lincoln Trail 6 46 13.0%North Suburban. 42 4.7%NortLarn Illinois 56 7.1%River Bend 4 19 21.0%Rolling Prairie 2 39 5.1%Shawnee 35 5.7%Starvd Rock' 3 26 11.5%Suburban 7 76 9.2%Western Illinois 3 27 11.1%Total 49 557 8.8%
For the_most part; teN4les-,succeedcd.4eidale,head librarians and malesfollowed malesITWOUghthere was some slight trend in the direction ofmales succeeding females rather than vice versa. Males succeeded males infive out of six instances or 83% of the time. In:the remaining 43,cases,females followed females in 38 institutions or 88% of the time; this includestwo libraries in which the poSition of head'Iibrarian-was vacant In 1981/82and for which we compared 1980/81 and 1982/83 data.Alligawiely one malewas replaced by a female, while four male librarianrigb-eedllmtemale heads,there was a net gain among the institutions in this survey of three malelibrarians between 1981/82 and 1982/83.
Turnover involving male librarians was concentrated among the largestlibraries in terms of population served. The opposite was the case forfemales as Table indicates.
43
47

1
Table 3
Turnover of Head Librarian By Sex andBy Size of. Population Served
Female. Male . Female Male
Poput'ation Replaced Replace Replaced Replaced
Served by Female b Male ' by Male by Female Total
Under 5,000 19 3 0 22
5,000 - 9,999 7 0 1 ..0,
10,000 - 24;999 11 1 - 0 12
25,000 & Over 1 4
,01 1-- '7
Total 38 5 5 1 A9
Internal promotions, or cases where a librarian moved from a subordi-nate to the head position in the same institution, occurred in 20 cases or43% excluding the two instances where the head librarian's position wasvacant in 1981/82. Eleven of 22 or half the libraries serving populationsof less than 5,000, made internal promotions. In the next largest category,5,000 to 9,999 population, internal promotions took place in five of eightcases or 62% of the time. Of 10 libraries serving-populations of 10,000 to-24,999 only two made internal promotions (206), as did two of the seven iii
population areas exceeding 25,000 for a rate of 29%. F6r 1981/82 to 1482[83,'smaller libraries were much more likely than larger ones to promote from
within. Of all 20 promotions, 19.were in libraries were a woman was succeed-
ed bY'ewoman.
4 Patterns ofAEducation and Salaries
The educational background-of the 1981/82.head librarians and their
1982/83 successors was known in 40 of the 49 cases of turnover. In severalother instances, the new head came on the scene too late to be included in
the statistical breakdown of the library staff in the annual report. Thelibrarian successors possessed the saTe level of formal education in.23 (58%)
of the 40 instances under consideration.
Ten libraries (25%) hired new heads whose formal credentials exCeededthose of their predecessors. Of these, the local librarian's credentialsrose from less than a bachelor's degree to a bachelor's degree in.six cases,
and from less than a bachelor's to MLS (Master of Library Science). Here-,-
after in this report, MLS means a graduate degree in librarianship, inf-6ima-
tion science, instructional technology, or educational media. The remaining
two instances saw the formal educational level of the head librarian increase
from a bachelor's to an MLS and from less than a bachelor's to a graduate
degree in a subject field.
44
4.8

The educational level of,the head librarian declined in seven cases(17% of '40). Formal credentials, in three of those instances, fell from abachelor-'s degree to less than a bachelor"s degree. In three additional'cases, head librairians holding the MLS were succeeded retipectively by librar-ians with less than a bachelor's degree, a graduate degree in a subject field,and bachelor's degree; In'the seventh case, a librarian with less.than abaohelor's replaced one with a non-library grippate degree.
Of the 40 public libraries experiencing turnover and' for'which informa-tion on educatiOnal credentials are available, 13 (32%) are in the two'larg-.est categories in terms of population served, i.e., 10,000 or more. In 12 ofthese 13 libraries (92%), the head librarians had the MLSydegrees by the endof 1982/83 vs. 9 (76%) in 1981/82. Of 27 libraries serving fewer than 10,000 -
persons each, only 3 (11%) had the MLS by 1982/83, vs. 6 (22%) in 1981/82.
Male head librarians were more.likely than females to poseessa graduatedegree in library science. Males are mare likely to become heads of largerlibraries than of smaller ones', and larger libraries are more likely torequire the MLS. Females with bachelor's degrees or. less were concentratedin smaller libraries, particularly those serving less than 5,000 persons.
Using 35 hours per week as the minimum for full-time work, 25 of the 49librariee- experiencing turnover (or 51%) employed full-time head librariansby the end of 1981/82. This figure includes two libraries which ed
part=time heads with full-time heads and two otheF librarLes where : i-time
positions,vacant.in 1981/82, were both filled by full-Lime head lib,ariansin 1982/83
,
Six of the seven libraries in the largest pop:' ion t e ,ind all 12
libraries in the next - ip employed full-Lime head libikrians bythe'end of 1982/83. Among libraries serving-populations of 5,000-9,999, fiveout of eight hacifull-time heads in 1982/83. By contrast, in the smallestpopulation category, .only two of 22 libraries or 9% employed head librarianswho were expected to work 35 hours peryeek or more.
op
Work experience (and other factors) often have sdich a-marked effect onsalaries that" comparisons between 1981/82 salaries and those of 1982/83 insuch a-small sample are inconclusive. 'For all 22 libraries experiencingchanges in full-time head librarians, and for which data.are available, theaverage increase was only 3%, and the average decreased- for the14 libraries
serving from.'5,000 to 24,999 persons (see Table 4). For 20 libraries forwhich we,have salaries fot both years, 9 (45%) increased, 8 (40%)'declined,and 3,(15%) stayed the same.
45

Annual
Table 4
Salaries of Full -Time Head 'Librarians in,1981/82 andof pose Public Libraries ExperiAncing Turnover
1982/83
'(a) (b) (.c) (d) Ali (e) (f)
Population1981/82 , 82/is % Increase
(Decrease)No. of Average ' No.'of Average
° Size Libraries Salary Libraries ,Salary col. e col. c
Upo 5,000 2 $10,839 2 $13,750 27%
5,000 - 9,999 5 16,339 ,41 14,875 (9%)
10,000 - 24,999 9 16,667 10 16,250 (3%)
25,000 + 6 25,587 6 27,958 9i
- Total 22 $14005 22, $18,966 3%
46
50
4

Hours.Of Illinois Public Libraries in October 1982
by Herbert Goldhor
For many years, tile 'Illinois Pudlic Library Annual Report form has'.asked for the number of hours each library was Open in a typical Week inthe preyious October. In 1981482 this question was rephrased to get thehours open on each day of the week,. and even then many libraries gave thenumber of hours open each day 'rather than the opening and closing hours.For 1982/83 the question wasreworded'to ask for the opening and closinghours of the central library on each day of,a typical week in October:This report summarizes the responses to this question for October 1982,and is based on Table 2 herewith..
Data are available for 5.74 publiC libraries (96.5% of all 595 legallyestablished public libraries); the non-respondents include libraries whichget service by contract, which were newly established and not yet fullyoperating, and which did not file an annual report. The one measure wewill.use here is the median; it divides a series of values in half so thatan equal number of librarieseis aboveand below the median. 'Table 2 shows '
in addition the first and third quartiles and the mean; these are explainedin the notes to Table 2.
In general these 574 Illinois public librariesvere open 39'hours-aweek in October 1982 (section 8 of Table 2 and column , and Figure 1).Libraries in towns of under 5,-000'people were open only 24 hours a week,.while all others were open more than the state-Wide.average-48 hours per ,
week for places of 5-10,000 people, 59 for place 'of 10-25,000, and 68 for
places of 25,000 and over. When we look at the three main geographic areasof the state (columns f -h), public libraries in Chicago anethe suburbswere open an average of 60 hours per week, while those in north and central,
Illinois were Open only 26 hours per *eek, and those in southern Illidbis32 hours per week.' Many, smaller libraries reported split schedules.(gg.,10 AM Eo noon and 2 to 5 PM); we simply counted the total number of hoursper day and did not record that they were split.
4.
The total'average number.of hours per week conceals a lot of variation.-, NThus only 12% of all 574. libraries were Open on Sunday, and some libraries
were closed on every,other day toofrom' low of 4% on Saturday to a high4of 14% on,,J.riday_ (12% on Monday, 9% on TueSday', 6% on WednesdaY, and 1`3% on
Thursday): Libraries in the smallest population size sroup were closedmostoften (99% on Sunday to 6% on Saturday), whilekthnse in the largestwere open most often (492 on Sunday,,97% on Friday, 99% on Monday,, and 100% .-
on the four other days). LibrarieS_in the epicago area'were open most often,of the three geographical regions,,And those in north and central Illinoisthe least often (see Table 1).
6
47
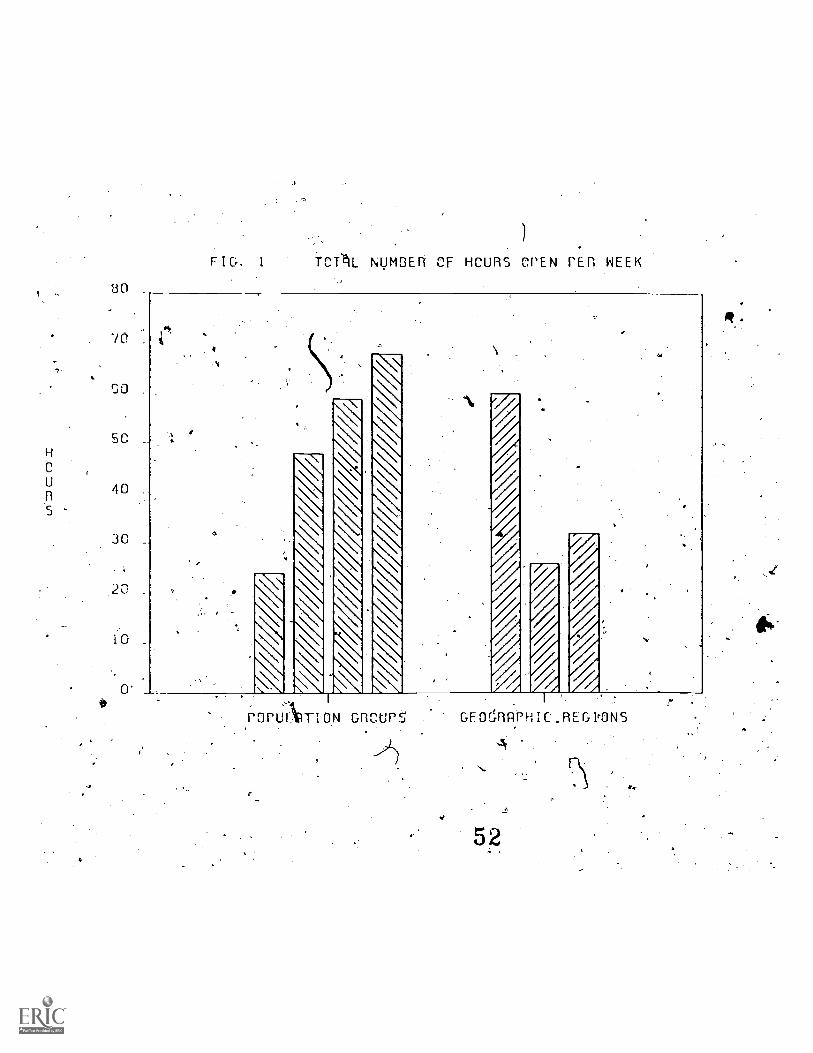
FIG. 1 TCTL NUMBER CF HCURS OPEN pER WEEK
H
U
5
.
GO .
5C _
40
3C
20 .
10 _
0co. r
POPUIRTION GROUPS GFOr.;RAPHIC.REGpONs
52
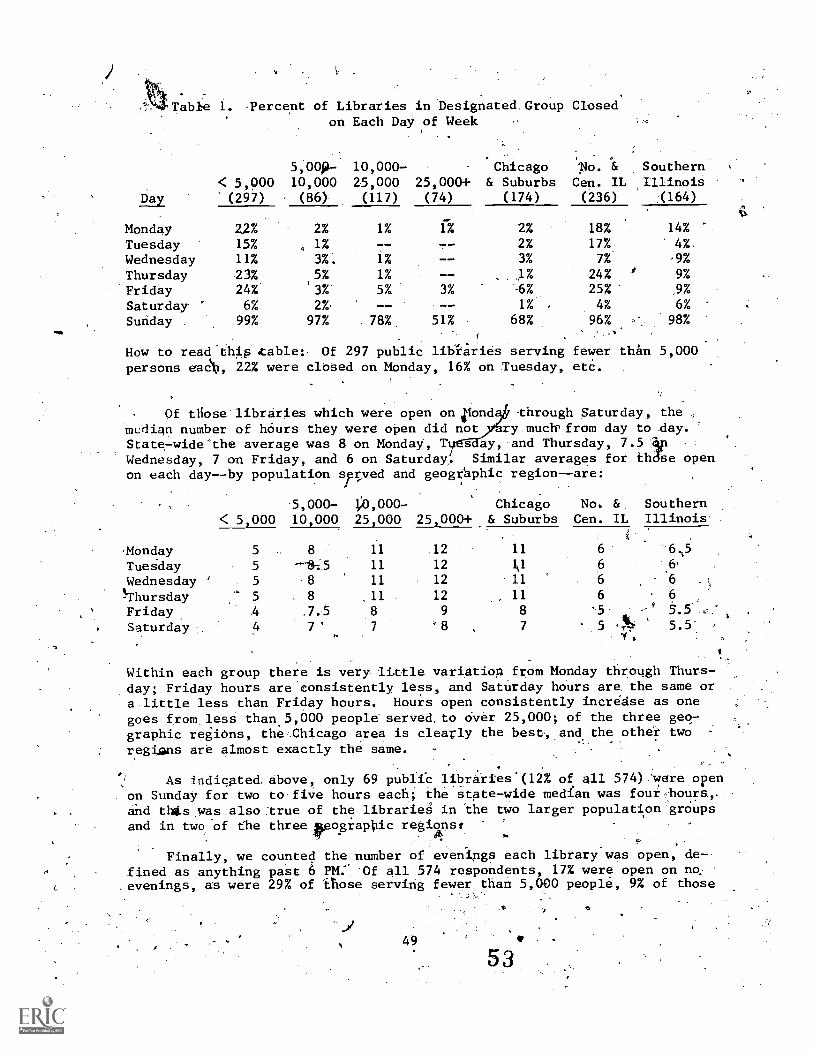
Table 1. Percent of Libraries in Designated. Group Closedon Each Day of Week
< 5,0005,00p-10,000
10,000-25,000
.
25,000+Chicago
& SuburbsNo. & SouthernCen. IL ,Illinois
Day (297) (86), (117) (74) (174) (236) :(164)
Monday 22% 2% 1% 1% 2% 18% 14%
Tuesday 15% 1% -- 2% 17% 4 %.
Wednesday 11% 3%. 1% 3% 7% '9%
Thursday 23% 5% 1% 24% ' 9%
Friday 24% '3%. 5% 3% -6% 25% ,9%
Saturday ° 6% 2 %- 1% 4% 6%
Sunday 99% 97 78% 51% 68% 96% 98%
How to read this .table: Of 297 public libi'aries serving fewer thAn 5,000persons eaCkl, 22% were closed on Monday, 16% on Tuesday, etc. .
Of those libraries which were open on ifond through Saturday, themudign number of hours they were open did not ry.muclrfrom day to day.State-wide'the average was 8 on Monday, T s ay, and Thursday, 7.5 'Wednesday, 7 on Friday, and 6 on Saturday,. Similar averages for th se openon each day--by population served and geographic region--are:
< 5,000.5,000-10,000
1;0,000-
25,000 25,000+Chicago
& SuburbsNoCen.
&
ILSouthernIllinois.
-Monday 5 8 11 12 11 6
Tueiday 5 11 12 it 6 6'
'6Wednesday ' 5 8 11 12 6
Thursday 5 8 11 12 11 6 6
Friday 4 ,7.5 8 9 8 '5 5.5
Saturday 4 7 7 7 5 'AS' 5.5-.
Within each group there is very-little variation from Monday through Thurs-.day; Friday hours are 'consistently less, and Saturday hours are, the same ora.little less than Friday hours. Hours open consistently increase as onegoes from,less than 5,000 people' served. to over 25,000; of the three geo-graphic regions, the .Chicago area is clearly the best-, and the other tworegions are almost exactly the same.
As indicated,on Sunday for twoand tilts was alsoand in two of fhe
above, only 69' publiC libraries (12% of all 574):were opento'five hours each; the state-wide median was fourhours,..true of the libraries in the two larger populationfgrOupsthree rograpOic regionst
Finally, we counted the number of evenings each library was open, de-fined as anything past 6 PM: Of all 574 respondents, 17% were open on no.evenings, as were 29% of hose serving fewer than 5,000 people, 9% of those
-.
-,149
53
serving 5,000 to 10,000.people, and 1% of those serving 10;000 to 25,000.
By geographic region, 2% of.those in the Chicago area Were 'open on no even-
ings, 21% of those in north and central Illinois, and 26% of those in
southern Illinois. The state-wide median is 4 evenings per week, of all
those open one or more. And 4 evenings is the median for all the threelarger population' size groups and for the Chicago area. and southern Illinois.
Libraries serving fewer than 5,000 people--and open any evenings-'7have a
median of 2, and those in north and central Illinois a median of 3. Inci-
dentally, the two libraries open 6 evenings a week were both in Shawnee
LiBrary System.
By and large,' Illinois public libraries have a good record of hours.
open in 1982, including Sunday and evening hours. 'Every few,yetiiii, each
public libiary ought to. review its schedule,or..hoursk.ope, and base any
'changes made on expressed desires of the Whole-tommunity7-not just of the
present users. If in doubt, try a revised schedUle for at *least three
months and give adequate. publicity to the riJ6 hours.,
50
ti
a

.o
d1
Table 2. Number of Hours Which Illinois PubliC Libraries Were Open on Each Day of aTypical Week in October 1982.
..-. .
(a) '. (b) ' (c) - ' (d) (e) , . (f) (g) OS, .(1),Population Served ,Geographic Region .
(F)-MONDAYNone
42
Me
Chicago 6_ < 5000 5-10,000 10-25,000 25,0041- Suburbs
(297) (86) -(117). (74) (474)_ ___,______
.
,(65) (2) (1) U) (3)4.0 7.0 10.0 ' 11.5 10.0,5.0 8.0 11,:0 12.0 '11.0 ',
7.0' 10.0 11.5' 4 12.0 12.05.3 : y 8,4 10.6 11.5 10.4
. .
(2) TUESDAY --
None . (49) - (1) --.-r
(3)Q1 %- ' 4.0 7.0 10..Q.,' 11:5 10.0Q2 11.0 12.0 11.0
. ,
Q3 7.0 10.5 11.5 12.0- -12:0' Mean, 5.2' .. 8.7 '10.6 11.6 10.5
(3) WEDNESDAYNone (32)Ql '4.0.Q2 16 5.0
Q3 7.0Mean 5.4
(4) THURSDAYNoSe (67), . N0(4)Ql 3.5. -";7.0q2 5.0 8.0
Q3 6.5 10.5Mean 5.1 8.6
(3) (1) (5)7.0 10.0 12.0 10.08.0 11.0 .2.0 11.010.0 -11.5 '12.0 12.08.4 10.3 11.7. 10.2
7.-
11.5 10.012.012.011.6 10.4
(1)
10.0.11:011.510.7
No. gad 'Southern StateCen.IRL Illinois Total(236) (164) (574)
.(43) (23) (69)4.0 4.0 5.06.0 '6.5 8.08.5 9.0 11.06.4 6.7 7.9 .
(40) (7) (50)4.0 4.0 5.0,6.0 8:09.0, 8.5 S . 11.06.5 6.5 7.9
(17) (14) (36)4.0 4.0 5.06.0 6.0 7.58,5 8.0 ' 11.06.6 6.44* 7.8
,(56) (14) . (72)4.0 . 4.0 5.06.0 6.0 8.0
10.0', ° 81.0 ..11.0
9'6 6.a '- 7.9
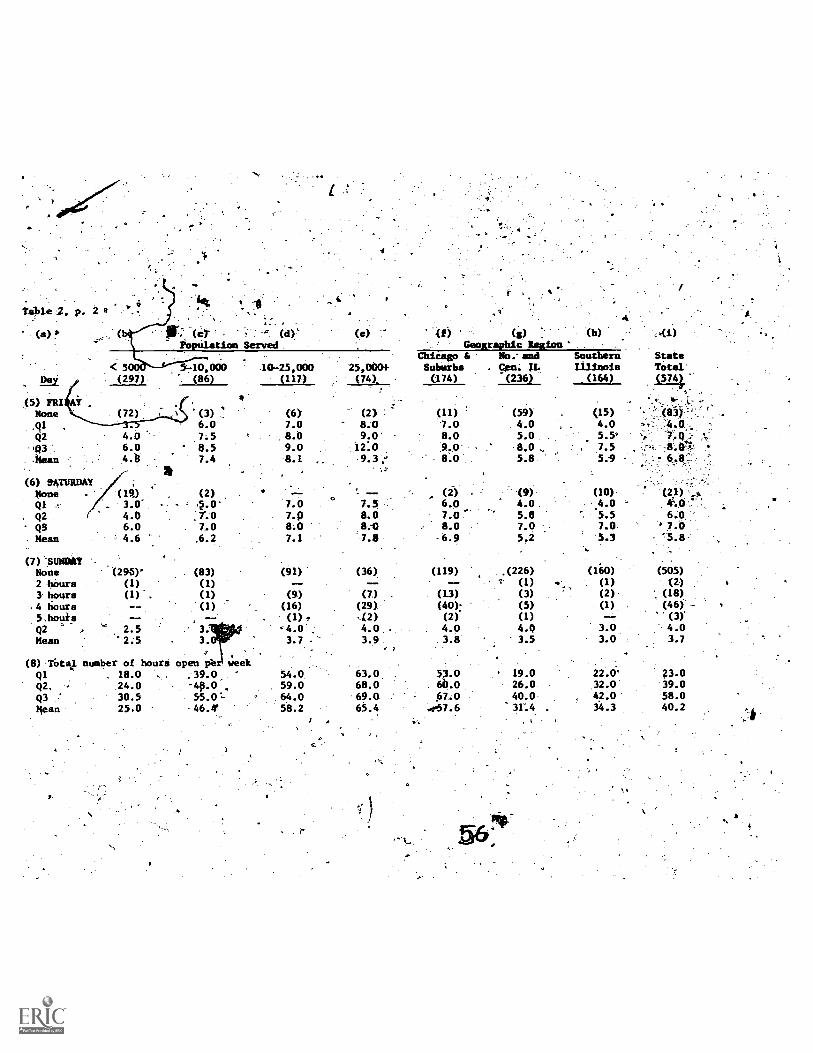
'able 2, p. 2 a
( 5 ) FRI
None
.QI02
113;Mean
(6) SATURDAYNoneQIQ2
Mean
(7) -SUNDAYNone2-hours3 hours
-.4 hours5.hours02 ° ,
Mean
. (d)`
Po ation Served
5 5740,000 .1025,000(297) ". (86) (117)
4.06.04.13
(3)6.0
7.58.57.4
(1%) (2)
4.0 .7%06.0 7.04.6 .6.2
(295)' (83)
(1) (1)(1) . (1)
(1)--
2.52.5
(8) 'DAV. number of hours
QI 18.0
Q2. - 24.0
Q3 '30.5
Mean 25.0
open perk week
39.0 '
'48.0 ,
(6)7.08.09.08.1 ,.
(e) (h)
Geographic Region -Chicago 6 No.and Southern
254000+ Suburbs Can IL Illinois
(74) (174) (236) (164)
(2)
8:09.0'
.2.o.
-9.3;
--7.0 7.5
7P 8.08.07.1 7.8
(91) (36)
(9) (7)
(16) (29)
( 1 ) r .(2)
4.0.3.7 3.9
54.059.064.058.2
63.068.069.065.4
(11)
7.08.09.0
(2)6.07.08.0-6.9
(40):
(2)
4.03.8
53.06b.007.0
4°57.6
- .
(59)
4.05.08.0 ,
5.8
(9)4.0.5.07.05.2
(226)(1)
(3)
(5)
(1)
4.Q3.5
19.026.0.
40.0
'31:4
StateTotal(574)
r. L
(15) (95)."4.0 " 4.0,0 s
5.5° 7Q. `.
7.5 8.(0'
5.1 6.81 4
(10) (2.1) .4,
.4.0 - Co5.5 6.07.0. ' 7.0
5.3 '5.8
(160) (505)
(1) (2)
(2) (18)(1) (46)' -
-- (3)'
3.0 4.03.0 3.7
22.0'32.042.034.3
23.039.058.040.2

Ta615,-.2,1).-3
(b)Population
< 5000 5-10,000Day
.
(297) (86)
(9) litimber of evenings open per week0 (86). D (8)
1 (65) (3)2 (66) (7)
3 (25) (9) .
4 (38) (3i)
5 ° (17) ( ) -
.6 -- (1)Q2 2.o 4.0
Mean 2.4 3.9
(d)
Setveds. 4
1025,-000-(117)
".
(e) (f) Chi % (i)
4 --ft. and Sbuthern State25,000f' Suburbs _ Gen. IL Illinois. Total
(74) (174) (236) (164) > (574)
(1) -. (4) , - (49) (42) ''(95)-
(2) \--- (2) , (46) (22) (70)°
-- (14) 4415) (20) -. (79) .
(7) (1) (11) . (24).
(8) (43)
(72) (45) 197) (53) (42) (192)
(28) (27). (46) (19) (28) (93)
(1) -- -- (2) (2)
4.0 4.0 4.0 3.0 '-' 4.0 4.0
4.0 4.3 4.0 2.8 3.3 3.3
,
Notes:. Figures in psrmitheses are numbers of libraries; figures not in parentheses are numbers of hours.
Qi the first quartile below. which are found one- quarter of all the libraries in this group; Q2 the'tecond
quartile or median on either side of whiCh are half the libraries; .Q3 the third quartile above which are found
one,quarter of all the libraries in this group.. The mean or arithmetic average is in all cases calculated only
for those libraries in each group which were open at least some.hoori. - : t
"Chidago & Suburbs" (col. 0 include Mir Oak, Chicago, DuPage, North Suburban, end Stbutban Library Systems.
"NC. .and Cen. IL" (North and'Central Corn Belt, IllinoisrValley, Lincoln Trail,'Northern-Illinois,
River Bend, Starved Rock, and-WestatnrIrlinois Library Sysiebe.--Sootherb.Illinois inqludes Cuiberland, Great River,
Kaskaskia, Lewis and Clark, Rolling Prairie and Shawnee Library Systems.: Three new libraries not. members of a .
-system are included with the systems in whose area tksy are located.

Effort vs/Ability to Pay for Local Public LibtaiyService in Illinois '
4o
by Herbertdoldhot
In 1982/83, 81% of Illinois, public library total came ftomlocal government taxes on property'(1). -POT each library, such revenue'is,a. function of tWo variables--the tax. rate (or t4g effort made to fundlibrary service) and'the assessed valuation (or the base to which the rateis appliedin effect thenthe ability to-pay). This report describethe'relationship between effort and ability to-pay, in Illinois public librar-ies in 1982/83.
One might expect that as the assessed valuation'iricreases: the tax ratewould decline, but wealthy communities '(with high assessed V4rUatione) tend-
to have high expectations as to the acceptable level of library Service and
- are usually wiling to make a more thawaverage effort (i.e., to have ahigher than average tax rate) to pay ft:t that s6vice.- And unfortunatelymany communities with low assessed valuations tend not to have more than4aminimum level of library service and are often unwilling to make more than
a minimum--or at best--average effort to:paY for that service. As a matter .
of fact, of 570 Illinois public libraries in 1982/8the 'coefficient of
correlationbetween their assessed valuatidfis'Oer capita and their real
property tax rates -is -.10. When we calculated the dame correlation forVarioue_sub-groups4 we'gotthe following results:
A. Bliksize Of population servedP to 5000 -.135000-9999- -.17
10,000-24,999 .0945,000+ -.12
B. By geographic region (2)Chicago.and suburbs -.12
Northern and central Illinois -.12Southern Illinols -.20
4 jj
C. By type of library (omittihg'2 county libraries)..City .02
District -.45Township, r.,
Town or village -.41
D. By education of the head librarianWith MLSWithout MLS,
If we think of assessed valuation as the, independent variable'in tlikesec'correlationsand the tax rate 'as the dependent variable, we can get someidea as to the meaning of the above coefficients `by the following rule. The
square of the correlation coefficientAs the percent of variation in the dew',pendent factor'Which is accounted for by the fluctuationa in the independent
54 58

Avariable.- 'Thus the etate wide total correlation of -.10 when squared.is .01
of the variation in tax rates. A correlation of -.20 (as r libraries-inor 1%, and variations in asseesed valuation explain or acct for about 1%
Southern Illinois) when squared is only 4%. The largest correlation' found
is -.45 (for township libraries); when squared this is, 20%. In general there
is a slight tendency for tax rates to move inversely to assessed valuation--.i.e., for effort to decltge'as ability to pay increases, and to rise as
ability to pay decreases. This is particularly.trge of township libraries.
To probe further; we compared the 57 libraries having the'lowest tax,
rate (8c or less), which we will call Group 1, with the 57 libraries having
the highest tax rate (22c or more), here called Group 2. The resultA of
-this comparison on nine different measures far 1982/83 are shown in Fig. 1.
Fig. Comparisons Between Libraries with the Lowetand Highest Tax Rates in. 1982/83.
Basis of Comparison.
1. Average population served
2. Average assessed valuationper capita
. .43. Number of evenings open per week
4. Number of hours. open. per week
5. Average number of books addedper capita
4_0
'erage amount spent per capitcapita.
,101 'for all printed,materials. -...
7., Distributiou by geographic region (2),
'Chicago and-suburbsNorthern and central IllinoisSouthern IllinoisTotal
0
8. Distributidn by type otklibraryCityDistrictTown or villageTownshipTotal
Group 1 Group 2
(lowest (highest Significanttax rate) tax rate) Difference?
8,663. ' 21,705 Yes
$13,163 $ 6,815 Yes
1.1 3.5 Yes.
21.7 51.9 Yes
0.24 0.26 No
. W42 $2.50 Yes
Yes.9/16% 23/40%
31/54% .25/44%17/30% '9/16%
57/100% 57/100%
(omitting 2 county libraries)11/20%8/15%5/9%
31/56%.55/100%
. DistrAution by education of headIlssthan a BA .
A or. subject graduaie degreeMLSFTotal
55
librarian38/74%5/10%8/16%
51/100%
59
20/35%12/21%23/40%2/4%
57/100%
17/30%4/7%35/63%56/100%
Yes
Yes

. .
The I0% of all public4librariee with the lowest,tax rate (the les$t
effort) .re different fratof the 10% with the highest. tax rate (the mosteffort) on 8 of these 9 measures by more thah could be expected from chancealone (at.the 5% level) aE(a result of sampling. Note (from line-2) that
the libraries.in- Group a had a significantly_ higher asseased"valuationpercapita-than the libraries in Group.2; in other words, the librariesGroup 2 aremaking more effort'when,they actually had a lesser ability topay. As might be expected, Group 1 libraries served fewer people, Were openfew evenings and fewer hoUrs per week, and spent less per capita on printed
clmaterials thsp.diGroup 2 libraries. Group 1 libraries weredigiproporton-atel/ located.in downstate Illinois, Were characteristically-more oftentownship libraries, and typically had ahead librarian who was not a collegegraduate.
As a'finai measure,-We.compared two other extreme groups of libraries.This time Group 1 .consisted of the 10% of all libraries with the lowestassessed valuation per capita ($2940 or less), and -Group 2 the 10% with thehighest assessed valuation ($12,033 or More),
Fig. 2. Comparisons Between Libraries with the Lowestand 'Highest Assessed Valuation Per Capita in1982/£0.
Significant
Basis of Comparison ) Group 1 Group 2 Difference?
.1. -Average population. served 5,689 6,827 No
2. Average tax rate levied 0:15 0'.11 Yes
3. Number of evenings open per week 1.9 :2.5 No
4. Number of hours open per week 29.1 37.9 Yes
5. Average number of books addedper capita, 0.23 0.44 1 Yes
6. Average amount spent per capitafor all printed materials- $1.46 , $4.61 Yes
. -Distribution by geographic region (2)Chicago.and suburbs 5/8%Northern and.central Illinois 13/22%
Southern Illinois 41/70%
Total
Yea
8: Distribution by type of libraryCityDistrict
villageTown orTownship-.Total
18/31%34/59%6/10%
59/100% 58/100%
omitting 2 county libraries). -yes37/63% 3/5%3/5% 19/33%19/32% 14/25%0/0 21/37%
59/100% 57/100%
9. Distribution by edUcation of the head librarianLess than a, BABA or subject graduate degreeMLS.Total
7
42/74%6/10%.9/16% .
57/100%
56 ,
60
25/46%5/9%25/46%55/100%
Yes
The .most important point in this set of comparisons (line 2) is that
the libraries With the lowest assessed valuation Per.capita had a signifi-
. cantly higher tax rate than did the libraries With the highest assessedvaluation.- In other'words, the former group made.a greater effort in the
face of a lesser ability to pay, while the group with greater'ability to
pay made a lesser effort. Even so, Group 1 liblaries with lower assessedvaluation (and higher tax rates) were, open significantly fewer'hours per _
week, added significantly fewer books, and spent significantiy'leas money
per capita for print material4 than'did the Group 2 libraries withligherassessed valuation (and lower tax rates). Libraries in Group 1 weretypically found in southern Illinois cities, towns or villages, and had'
head librarians who were not college graduates.
In summary, when we considered all Illinois public librariegithere
was only a slight tendency for local property tax rates to go down as.
.assessed valuation went up--or up as assessed valuation went down, However,
when we'campared the 10% of all libraries with the lowest and highest tax
ratea, and the 10% with the lowest and highest assessed valuation per capita,
.we find clear evidence of the inverse relationship between effort. and hbility
to pay. Those libraries making the least effort did have the ability to pay,
but those with the lowest ability to pay,were making a great effort and
still needed help. Those libraries with the highest effort or with the high-
est ability to pay seemed to have better library service (in hours open,
amount -spent for printed materials, and head librarians who are library
schoolgradnates).411k
Notes
(1) "IllinoisTublic Library Statistics, 1982 /1983," Illinois Libraries
65 (November 1983) p. 557.-
(2) "Chicago and suburbs" includes Bur Oak, Chicago, 'DuPage, North
Suburban, and Suburban Library Systems; "Northern anth-central Illinois"
Corn Belt, Illinois Valley, Lincoln Trail, Northern Illinois, River Bend,
Starved Rock, and Western Illinois Library Systems; and "Southern Illinois"
Cumberland Trail, Great River, Kaskaskia, -Lewis & Clark, Rolling Prairie;
and Shawnee Library Systems. /
57
7
A CoMplete List of;Titles-Published-in.theIllinois Library Statistical Report,Series
I
Studies of Illinois Public Libraries Using1979-80.(AUgust 1981) 92p.
Herbert Goldhor and Kaihryn A. Piichard,Illinois Public Libraries in 1980: The Report
. 1-63.
Dateefrom /978-79 and
"The Resqueces ofof a Sample Survey,"
Stephen M. Zumbo, "Volunteers in Illinois Public Libraries,"
p. 64-68..
4
Susan Bonzi, "Nonresident Fees in Illinois Public Libraries,"
p. 69 -75. . .
Herbert Goldhor and James TuShinsky, "All Other Data From IPLAR,"
p. 76-85.4Herbert Goldhor; "Trends in Illinois Public Library,ptatisticsr
-.
1960-19014" p.-86-92.--.
No. 2. Danny P. Wallace, 1981 Suryey of Illinois Special Libraries (April
1982) 125p.
N . 3. Studies of Illinois Public Librlitiea Using Data from 1980-81
(June 1982) 57p.Judith Bessai and Herbert Goldhor, "Fringe Benefits of Illinois
Public Library Employees," .1). 1 -43..
Susan Bonzi and Herbert Goldhor, "Head Librarians in Illinois
Public Libraries," p. 44-51.Herbert Goldhor, "Lnterlibrary Loans of Illinois'Public Libraries,
p. 52-57.
No. 4. Herbert Goldhor, Analysis of Responses to the.Public Library Supple-
mental Anh4.111 Report for 1980/81 ,(July 1982) 39I;
5. Herbert Goldhor, Results of a Survey of Illinois Academic Libraries'Affiliated w4ph ILLINET (August 1981) ,Z0p.
No.
No. 6. Herbert Goldhor and Cora Thomassen, The 1981 Survey of Illinois Public
School Library Medie Centers (January 1983) 73p.
No. 7. Sharon L. Baker, Two Studies of Illinois Publis Libraries: An Adult
User Survey; and Fines, Fees and Charges Levied (May 1983) 73p.
No. 8. Danny P. Wallace,. Performance Measures in Illinois Special Libraries
(July 1983) 49p.
No.. 9. Katharine Phenix;, Analysis of the 1981/82 HEGIS/LIBGIS Responses of
Illinois Academic Libraries (August 1983)-65p.
71No.. 10. Danny P. Wallace, An Index of Quality of Illinois Public Library
Service; and Herbert Goldhor, The Comparative Performance of'Illinois
Public Lt: cries (June 1983) 54p.
No. 11. Robert Daugherty and Lois Pausch, Bibliographic Instruction in
Illinois Academic Libraries: A Survey Report (October 1983) 86p.
44
5862-

No. 12. Herbert Goldhor, Report of an Adult Patron Survey,in a Sample ofIllinois Public Libraries in Spring 1983;_and Christopher R. Jocius;Subject Index to Il4nois Library Statistical Report Nos. 1-12
(December 1983) 32p,/
As long all-they are in print, Copies of these reports,are. availablewithout charge, upon request to the Publications Unit, Illinois StateLibrary, Centennial Building, Springfield, IL,62756.
, .
59
63