Embed Size (px)
Citation preview

Institutional Barriers to
Co-digestion Case Studies of the East Bay Municipal Utility District and Des
Moines Wastewater Reclamation Authority’s Co-digestion
Efforts
Casey Hanson June 2014
Terminal Project
Submitted in partial fulfillment of the requirements for the degree of Master of Community
and Regional Planning
Department of Planning, Public Policy, and Management, University of Oregon
Acknowledgements
To my committee, Vicki Elmer, Ph.D. and Rebecca Lewis, Ph.D.:
Your feedback, enthusiasm and faith in this project have always been my form of
renewable energy. I hope this project has been able to return the favor to you.
To every professional and academic mentor of mine, from high school to my
undergraduate civil and environmental engineering and graduate planning days:
You have been guiding lights as I’ve taken this journey. Thank you for your open
minds, understanding, and positive encouragement. You’ve challenged and
influenced my way of thinking. Without it, I may not have reached the point I’m
at today.
To my husband, Kevin:
I dedicate this to you, for every sacrifice you’ve made over the last two years, so
I can be where I am today. You’ve learned more about waste than you ever
cared to know, but without you, your opinions, editing, and cheerleading, this
would not mean anything.
Cover Photo
Credit: King County

Acronyms
AD Anaerobic digestion
CCCSWA Contra Costa County Solid Waste Authority
EBMUD East Bay Municipal Utility District
EPA Environmental Protection Agency
FOG Fats, oils, grease
FSE Food service establishment
FY Fiscal year
GHG Greenhouse gases
PG&E Pacific Gas & Electric
POTW Publicly owned treatment works
PPA power purchase agreement
REC Renewable energy credit
WRA Wastewater Reclamation Authority
WEF Water Environment Federation
WERF Water Environment Research Foundation
WRF Wastewater reclamation facility
WWTP Wastewater treatment plant
Unit Abbreviations
GPD Gallons per day
MW Megawatt
MGD Million gallons per day
MWh Megawatt-hour
tpd Tons per day
cf Cubic feet

Table of Contents Executive Summary ........................................................................................................................ i
Chapter 1: Introduction ............................................................................................................... 1
Why Co-digestion? ................................................................................................................... 4
Project Purpose ......................................................................................................................... 6
Problem Statement ................................................................................................................... 7
Organization of this Report ...................................................................................................... 8
Chapter 2: Institutional Barriers Context and Overview .......................................................... 9
Cultural ................................................................................................................................. 10
Social ..................................................................................................................................... 11
Economic ............................................................................................................................. 13
Political /Regulatory ............................................................................................................ 14
Chapter 3: Methods ................................................................................................................... 15
Case Study Selection ............................................................................................................. 15
Case Study Research ............................................................................................................. 15
Chapter 4: Case Study Summaries .......................................................................................... 17
East Bay Municipal Utility District (EBMUD) – San Francisco, CA ....................................... 18
Des Moines Metro Wastewater Reclamation Authority (WRA) – Des Moines, IA........... 28
Comparison of EBMUD and WRA ......................................................................................... 33
Chapter 5: Case Study Findings ............................................................................................... 34
Economic ................................................................................................................................. 34
Regulatory/Political ................................................................................................................ 37
Cultural ..................................................................................................................................... 41
Social ........................................................................................................................................ 43
The Role of Cities ..................................................................................................................... 45
Chapter 6: Recommendations ................................................................................................. 47
Bibliography................................................................................................................................. 52
Photo Credits ............................................................................................................................... 57
Appendix A ................................................................................................................................. 58
Appendix B .................................................................................................................................. 58

i Executive Summary
Executive Summary
Waste is a wondrous treasure that provides a source of energy and can easily be
incorporated into a practice that’s already happening, co-digestion. Co-digestion is a
process where wastewater facilities incorporate other forms of organic waste into the
anaerobic digestion process they use to treat solids that are generated from the
wastewater treatment process. The solids and other organic waste is decomposed to
produce biogas which is typically used to heat and power the facility and can be sold
to willing buyers. Using co-digestion can address concerns of energy supply,
sustainability, and economic efficiency (Hussey & Pittock, 2012). Similarly, regulatory
drivers will make co-digestion seem favorable when states aim to divert materials from
landfills.
Barriers exist that inhibit innovative projects, co-digestion in this particular situation, and
“Numerous methods and technologies for solving water problems seem to be at hand,
but at the same time the capacity (for example; skills, experience, financial resources,
etc.) to implement these methods and technologies seem to be lacking” (Edelenbos,
Bressers, & Scholten, 2013). To better understand these barriers, research is needed on
how organizations that use co-digestion have overcome them.
The study analyzed two successful examples of wastewater utilities that are using co-
digestion and their relationship with partners and cities, the East Bay Municipal Utility
District (EBMUD) in San Francisco, California and the Des Moines Metropolitan Water
Reclamation Authority (WRA) in Iowa. Research focused on four institutional barriers,
how actors were able to overcome them, and what cities’ roles could be in
contributing to co-digestion.
Institutional Barriers
Traditional examples of institutions range from administrative structures to customs and
practices. This research encapsulates those examples by using four institutional barriers
as an evaluation framework: cultural, social, economic, and regulatory/political.
Although there is an overall lack of research on institutional barriers for co-digestion, the
following are common examples of barriers as indicated by academic and grey
literature.
Cultural
Cultural barriers develop externally and internally. External refers to the inter-cultural
environment among different professions and governments. Internal refers to the intra-
cultural environment that a particular organization/agency has.

ii Executive Summary
External
Systems thinking and integration of different schools of thought are lacking.
Networks between different professions and sectors are not fully established, for
example, planning and engineering.
Overlapping responsibilities create administrative inertia as the waste and
wastewater regulatory agencies determine pathways that minimize duplicative
oversight.
Internal
A lack of organized leadership inhibits ideas that break from tradition. For
example, operators are wary to experiment with new forms of waste.
Social
Social barriers embody the general public and their concerns and awareness about
the topic.
The public lacks complete understanding of infrastructure needs and operations.
Attention on a topic indicates a problem with the current service due to
traditional out-of-sight-out-of-mind public mentalities.
A lack of open discourse makes the public mistrustful of agencies and
government.
Insufficient communication and outreach can make it difficult to gather
community support, especially in regional areas and when renewable energy
projects are voluntary and not required and make the public unaware of their
role in the project (e.g., proper disposal to avoid contamination)
Concern for odor and noise can make the public wary of these projects.
Economic
Economic refers to funding, costs, and acquiring revenue for projects.
Uncertainty and risks outweigh the costs needed to invest in projects.
Lack of funding, financing, and slow return on investments deters utilities from
investing in new projects.
Available monetary resources need to be invested in projects aimed to address
existing regulatory or permit requirements.
Operation and maintenance can be costly.
Markets constrict how utilities can sell excess biogas.
Regulatory/political
Regulatory/political represents the regulations and frameworks that impede
collaboration between different organizations.
iii Executive Summary
Policies and regulations fragment and separate resources which doesn’t always
encourage cross-sector collaborations.
Permitting processes can be lengthy and complicated which impedes or slows
cooperation and partnerships between the waste and wastewater sector.
Overlapping political and jurisdictional boundaries impede projects and efficient
regulatory action.
Environmental regulations may inhibit new renewable energy projects.
Findings
Through synthesizing the document review and interviews, findings reveal that
economic and regulatory/political barriers appear to cause the most prevalent issues
to co-digestion efforts. Cultural and social barriers, on the other hand, do not appear to
impede efforts as much. The following sections describe these issues in more detail.
Table i summarizes these findings and provides some strategies for how to overcome
these challenges.
Economic
Consistent with the literature, findings show economics as both an opportunity and a
constraint. The potential revenue from taking in feedstock and saving money on
electricity costs makes it an opportunity. To elaborate, the facility typically uses tipping
fees from hauled waste to maintain the program, and if it produces enough biogas to
sell to a willing buyer, the utility generates more revenue. Utilities save on electricity
costs by using the biogas with a combined heat and power system at the plant to
satisfy the plant’s energy demand. Despite these opportunities, several issues still cause
economic worries for utilities and their partners, like not having a steady stream of
feedstock, dealing with contamination, increased competition for feedstock, and the
role of the market for selling excess biogas.
Regulatory/Political
Many actors involved in both case studies experienced regulatory/political barriers
during all stages of the co-digestion process. In some cases the barriers impeded the
progress of actors when they tried to build new pre-processing facilities, whereas other
times they affected utilities’ opportunities to sell excess biogas. Local regulations also
play a key role in supporting co-digestion efforts, but lack of proper planning or
collaboration can undermine efforts. The main regulatory/political barriers discovered in
these case studies include, sale of renewable electricity due to state regulations, lack of
state/federal funding and tax credits, duplicative permitting processes, and effective
fats, oils, and grease (FOG) ordinances.
Cultural
Compared to regulatory and economic issues, cultural barriers do not play an inhibitory
role for co-digestion. Findings suggest that utilities do not experience many cross sector

iv Executive Summary
(e.g., waste and water) barriers in terms of developing partnerships. The existing
regulatory solid waste framework in California is likely instrumental in allowing these
cultural relationships to flourish. Instead, most barriers are internal for utilities, such as
getting used to a new way of doing things. However, the biggest cultural issue is
external: fragmentation between cities and utilities. Cities’ involvement in this process
has not reached its potential, and their role is still not fully understood. This issue is further
discussed in the Role of Cities section below.
Social
Like cultural barriers, social barriers do not readily impede co-digestion efforts. The most
prevalent social concern is the odor associated with incorporating the different forms of
waste into the digestion process. Odor concerns are present throughout the entire
process (i.e., collection through digestion). The most notable barrier is the lack of public
involvement or awareness. Perhaps it is not a barrier in itself, but minimal public
awareness blankets other public concerns and suppresses the opportunity to gather
public support and participation (e.g., food scrap recycling).
The Role of Cities
Cities’ key roles center on two main topics: FOG and food waste management. They
have the influence to control what happens to both FOG and food waste which have
monumental benefits to co-digestion and renewable energy efforts.
FOG
Cities are responsible for their own sewer maintenance before it enters the larger
collection system, as is the case for EBMUD and the Des Moines WRA. Any city naturally
wants to preserve its sewer system; by prohibiting FOG from entering the system, they
have generated a feedstock for their local or regional wastewater utility. Even though
several other forms of organic waste also serve as feedstock, FOG is a highly desirable
commodity since almost all of it is converted to biogas when digested. Not all organic
wastes produce the same amount of biogas, some produce more biosolids than biogas
and some produce more biogas than biosolids (Burger, 2003).
Food Waste Management
Cities provide or contract out services to handle municipal solid waste. They also set
waste management strategies and policies and therefore, influence how food waste is
handled. Research has shown that using food waste for co-digestion has a smaller
carbon footprint than other treatment methods cities might use (Parry, 2013b). Not only
does using collected food waste for direct anaerobic digestion through co-digestion
have a lower carbon dioxide value than other food waste disposal methods, it actually
has negative carbon dioxide emissions due to its potential to generate electricity (Parry,
2013b). If cities are looking at ways to reduce greenhouse gas emissions, using co-
digestion can be an excellent strategy to consider.

v Executive Summary
Recommendations
The analysis of the EBMUD and the Des Moines WRA cases is just the start of a
conversation about what types of institutional barriers co-digestion projects encounter.
This research intended to identify a few aspects of how co-digestion efforts and
challenges can be approached when cities, partners, and utilities are considering or
are in the early stages of co-digestion projects as well as create an awareness of cities’
potential roles. Below are some key recommendations to help facilitate co-digestion
efforts.
Develop market assessments of organic waste and training programs for appropriate
staff. This helps utilities understand what value they might get from using different types
of waste and helps them identify the most beneficial potential partners if competition
for feedstock might increase. Apprenticeship programs and hands on training can help
operators become more comfortable with co-digestion.
Establish and strengthen communication pathways and collaborative networks
between cities and utilities. Cities control valuable resources for co-digestion (i.e., FOG
and food scraps) and collaborating with utilities results in a win-win situation. Utilities get
prime resources for generating electricity, and cities can reduce GHG emissions and
divert waste from landfills. Having champions for both utilities and cities should be a
starting point.
Cultivate a strategic public outreach process for the development of a FOG ordinance
in collaboration with the wastewater facility. This can address cost and maintenance
concerns by involving food service establishments in the process. Compromises such as
offering tax-credits, rebates, or flexible design requirements could help both parties
reach common ground.
Take a top-down and bottom-up approach to encourage co-digestion efforts. A top-
down approach will help iron out regulatory pathways that partners seem to
experience during permitting processes and develop a framework to encourage these
types of projects. A bottom-up approach is necessary for utilities to implement creative
ideas and help strengthen relationships between cities and utilities.
Use creative sources to finance co-digestion efforts when funding lacks. Utilities can
consider power purchase agreements to have reassurance that they can generate
revenue outside of tipping fees when funding lacks.
Further Research
Literature identified certain barriers that were not present in the two case studies. This
does not mean they do not exist, but perhaps they were not a large factor given other
variables. For example, literature suggests that air quality regulations can play an
impeding role in co-digestion efforts (Parry, 2013a; Willis et al., 2012), but in these case

vi Executive Summary
studies air quality issues have not surfaced as a vital roadblock from a social or
regulatory perspective.
In the EBMUD case study, the setup of California’s and its cities’ existing solid waste
goals and regulations to achieve zero waste and divert organics from landfills was
instrumental in cultivating an environment for successful relationships between the solid
waste and wastewater sectors. This is not the case for every state; therefore, further
research on how partnerships develop with utilities that receive solid organic waste in
other states should be explored. This will provide more information on whether or not the
cultural barriers differ from this research’s findings.

vii Executive Summary
Challenge Strategy
State regulations constrict renewable energy revenue. Develop new partnership contracts that satisfy regulations.
Funding and tax credits lack. Educate higher government.
Waste and water sector oversee permitting processes. Give jurisdiction to waste or water agencies, not both.
Maintenance and cost for FOG ordinances. Include maintenance schedule in ordinance. Cost not
addressed.
Fluctuating feedstock amounts make it hard to generate steady
energy supply.
Build storage tanks. Keep receiving stations open 24/7.
Contamination raises maintenance costs. Develop education programs to teach proper disposal.
Increased competition for feedstock detracts revenue and
clients.
Acquire long-term contracts and partners within service
area.
Regional energy markets can limit revenue options for utilities. Sell biogas, if demand for cheaper electricity lacks.
Not as prevalent because regulatory framework (e.g., landfill diversion) encourages collaborative partnerships across sectors.
Operators are cautious about change. Create training programs.
Cities and utilities don’t collaborate. Have champions for each entity.
Not as prevalent because the public isn’t aware of co-digestion efforts. However, this isn’t a good thing because if cities
decide to use food waste for co-digestion, proper education for disposal methods is important to avoid contamination.
Residents nearby have odor concerns. Update infrastructure.
Table i: Summary of Challenges and Strategies Categorized by Institutional Barriers.

p. 1 Chapter 1: Introduction
Chapter 1: Introduction
Seldom does the average person think twice about where any of their waste goes. The
way we handle it is somewhat ironic since,
“The advent of modern sewage systems, for example, has given us the luxury of
flushing away our waste with clean water, but it doesn’t transform the waste into
something useful; it simply transports it away from us. We then expend
considerable financial and energy resources to treat that water before
discharging it back into the same rivers, oceans, and water tables that we
gather our fresh water from” (Sarte, 2010)
Unbeknownst to the average person, perceived waste is a wondrous treasure that
provides a source of energy and can easily be incorporated into a practice that’s
already happening, co-digestion.
It’s time for everyone to start viewing one man’s trash as that man’s treasure because
as the story is told, the world is undergoing exponential population growth
supplemented by rapid urbanization and climate change. Countries and cities have
What is Co-digestion?
Co-digestion is a way to treat multiple types of waste at one facility. The wastes must be
organic and treatment typically occurs at wastewater treatment plants (WWTP). The EPA
defines co-digestion as, “a process whereby energy-rich organic waste materials (e.g.
Fats, Oils, and Grease (FOG) and/or food scraps) are added to dairy or wastewater
digesters with excess capacity.” Figure 1 provides a visual of the inputs and outputs. During
the wastewater treatment process, sludge (i.e. residual solids or semi-solids that settle out
of the water) remains and needs further treatment since it can contain pathogens or other
contaminants. Anaerobic digestion (AD) is the process that treats the sludge. AD helps
accelerate the natural decomposition process where microbes break down organic
matter in the absence of oxygen, ultimately producing methane, carbon dioxide, and
useable nutrient-rich matter referred to as biosolids. The facility combusts the biogas (i.e.
the methane produced) to generate steam that powers a turbine which generates
energy. The utility can then use it to power the facility and even become a net producer
where it can sell extra biogas or electricity to a willing buyer. Often in this process the
digester has extra capacity, so other high strength organic matter can be used to
generate larger volumes of biogas which is when co-digestion comes into play.

p. 2 Chapter 1: Introduction
used resources at a rate and we now are becoming aware of the impacts. With more
mouths to feed and public services to provide, growing cities grapple with how to
maintain infrastructure and services that not only maintain quality of life and are
affordable, but also reduce environmental impact. These challenges require more
efficient urban infrastructure that manages resources more sustainably, especially since
cities have required considerable resource consumption (Schuetze, Lee, & Lee, 2013).
Historically, large, fragmented, centralized systems provided services and developed
solutions through a technocratic approach, with little concern for the resource
problems we’re facing today. This has largely led to siloed practices and resource
management, but these growing concerns are encouraging a mindset of integrated
resource management that seeks out new innovative solutions and progressive
interdisciplinary thinking. One focal point is integration of energy, organic waste, and
water. Co-digestion is at this focal point.
Co-digestion is one way to manage multiple resources and address multiple concerns
in a productive way by leveraging existing infrastructure. It can reduce non-renewable
energy consumption and increase renewable energy production by utilizing waste
which people have traditionally viewed as something ‘icky’ and requiring out-of-sight
out-of-mind disposal. Some have concerns about focusing too much on the water-
energy relationship, in particular, because each one is vulnerable to the others’ failures
(Hightower, Reible, & Webber, 2013). However, these concerns largely seem to focus on
Figure 1: Anaerobic digestion Process Credit: CABI Blogs

p. 3 Chapter 1: Introduction
Food for thought
What is the difference between power
and energy?
Energy is used to do something, in other
words the ability to do work. In this paper
it is signified by the unit MWh. The
amount of energy produced or used
can vary at any time.
Power is the rate at which energy is
produced or consumed. In this paper it is
signified by the unit MW.
more water-intensive energy or more energy-intensive water uses. In contrast, co-
digestion at treatment plants, is largely recovering existing or untapped resources in the
wastewater treatment process, in addition to other waste streams. Others may think this
undermines efforts to push for more decentralized systems; however, cities will still need
some level of reliance on centralized systems and
the transition to decentralized systems can take
decades. Therefore, co-digestion requires thoughtful
consideration. Given the incalculable list of resource
concerns, there is a need for greater integration
and collaboration among different sectors to
provide flexible solutions and new innovations
(Böhm et al., 2011). Overall, such collaboration
between sectors can increase resource efficiency
and reduce costs associated with maintaining and
expanding infrastructure systems; however, there
needs to be an awareness of non-technical barriers
associated with technological advances that can
facilitate this integration and innovation.

p. 4 Chapter 1: Introduction
Why Co-digestion?
1. It reduces dependence on other energy sources. Wastewater treatment processes heavily rely on
energy. Producing their own energy by using biogas and converting it to heat and power gives
WWTPs an opportunity to become self-sufficient or net producers of energy. Furthermore, if a utility
can generate a surplus, it allows the utilities to sell the biogas or electricity (if they convert the
biogas to electricity). Overall, this reduces dependence on other unsustainable methods of
generating electricity.
2. It can help reduce sensitivity to electricity price increases. In 2002 an EPRI report estimated that
water and wastewater utilities use almost 4% of the nation’s electricity. Of that 4%, utilities use
almost 80% of the electricity to treat the water and wastewater (Goldstein & Smith, 2002).1 This
lofty demand can comprise almost 30 to 50% of a municipality’s energy bill (Office, 2011)
ultimately costing an estimated $7.5 billion per year (Goldstein & Smith, 2002). With stricter
regulations for treatment, increasing electricity rates, and aging infrastructures systems, this
provides a concerning outlook for cities as the cost of energy rises for utilities (Goldstein & Smith,
2002). In sum, utilities depend on an external source of energy to power treatment processes
which is sensitive to increasing prices. Without a change, residents might absorb the increased
cost of treating water in their water bills.
3. It helps reduce concerns about rising energy consumption for the treatment process. Energy use
for treating wastewater has increased 74% since 1996 (Pabi, Amarnath, Goldstein, & Reekie, n.d.)
and is expected to increase for a variety of reasons. The increase is due to a growing population
and widespread adoption of secondary treatment. If future regulations require more stringent
effluent standards, this will likely require more energy during the treatment process. Similarly,
newer treatment methods, like replacing chlorine disinfection with ultraviolet systems, require
more energy (Hightower et al., 2013).
1 These estimates are over a decade old and technology has evolved, the energy needed to treat the water has most likely increased (Office, 2011).

p. 5 Chapter 1: Introduction
4. It helps close urban metabolic loops. The United States produced 250 million tons of municipal
solid waste in 2011, and out of all that, food waste is the second largest component at 14.5%
and only 1.6% of that food waste is recycled, mostly through composting (EPA, 2013). Even
after accounting for recycling and composting, food waste is still the largest category of
waste discarded at 21.3%. That represents a large amount of waste that could be diverted
from landfills. Luckily, it can become an input to an already existing process while closing its
loop. Opponents would argue that composting is closing the loop and while that is true,
composting requires land and produces uncaptured emissions like methane and volatile
organic compounds. AD can use those emissions to generate electricity from the
decomposition process and still produce a fertilizer. The EPA partnered with the East Bay
Municipal Utility District to study this and found that food waste in an AD process can produce
almost three times more methane than wastewater solids (Gray, Suto, & Peck, 2008).
5. It creates mutually enforcing relationships. Some states have and are starting to ban organics
from landfills which means cities need to find a use for them. Utilities are looking at ways to
reduce greenhouse gas emissions and vulnerabilities to climate change. This creates an
opportunity to build off of existing infrastructure and help satisfy concerns while creating a
central community resource for waste management (Sierral, 2012).
6. It gives planners a role in resource management. Utilities are looking for more ways to meet
sustainability goals and collaboration with cities will maximize success. Cities can provide
financial incentives for utilities, set up organic waste programs, market and gather public
support, incorporate utilities in the decision making process, encourage multi-sector or service
provider collaboration (e.g. food, energy, water), and provide leadership for co-digestion
projects.

p. 6 Chapter 1: Introduction
Even with the benefits described in the Why Co-Digestion? section, co-digestion let
alone biogas use is still not prevalent in WWTPs. According to Mo & Zhang (2012), less
than 0.6% of WWTPs use biogas for electricity generation, which is typically because
facilities require flows greater than five million gallons per day (MGD) to produce a
volume of biogas that is cost effective. The threshold originally used to be 10 MGD.
However, with treatment plants using alternative feedstock like FOG in their anaerobic
digesters it has made combined heat and power (CHP) more cost-effective (Wiser,
Schettler, & Willis, 2012). This indicates that co-digestion is slowly being adopted, but the
fact that so few have implemented this process suggests barriers to successfully utilizing
it may prohibit widespread adoption.
Project Purpose
The water sector has come a long way in technological advancements, which is
supported by literature. However, a “valley of death” exists between invention and
innovation when it comes to technology (Raven & Geels, 2010). Most often this is
because research heavily focuses on technical advancements and not how
institutional dimensions could assist in implementing those advancements and facilitate
change (Brown, 2008; Saleth & Dinar, 2005; Wong, 2006). Furthermore, cities typically
categorize infrastructure into special disciplines that inhibit concepts and actions to
integrate systems that can close material or energy groups (Neuman, 2009). With that
said, literature has acknowledged the slow pace of change in managing water
sustainably due to institutional issues, but not much literature exists on how to overcome
these issues because the main effort has been to document the barriers (Brown &
Farrelly, 2009; Wong, 2006). A need exists to investigate how perceptions, information,
learning, and adaption play out in the process of institutional change for overcoming
barriers and facilitating change (Saleth & Dinar, 2005). Raven & Geels (2010) argue that
experimental pilot projects in real-life allow for a mutual learning process among
stakeholders and the chance for experiences and outcomes to be translated to lessons
that can be infused into institutions. In other words, change can’t be autonomous but it
requires purposeful interventions (Saleth & Dinar, 2005).
It’s not only a lack of literature that compels further research, but cities and water
utilities are facing practical needs for it. There is more attention on water and energy
sectors because of security of supply, sustainability, and economic efficiency (Hussey &
Pittock, 2012). Similarly, regulatory drivers will make co-digestion seem favorable. For
instance, some states, like California, mandate that municipalities divert organic
materials from landfills. Other states are also considering similar mandates, like
Massachusetts and Vermont. As cities start to mandate source-separated wastes and
require more renewable energy, interest in diverting waste from landfills will grow. Cities
and planners might look to AD as an option since as previously discussed it is a method
to handle organic wastes while recouping benefits (e.g. soil amendment and energy).
However, planners don’t have to necessarily consider a full scale launch of AD systems

p. 7 Chapter 1: Introduction
for waste when they can integrate with existing systems that already use anaerobic
digestion for waste management (Rapport, Zhang, Jenkins, & Williams, 2008).
Problem Statement
Barriers exist that inhibit innovative projects, co-digestion of sewage and organic matter
in this particular situation, and “Numerous methods and technologies for solving water
problems seem to be at hand, but at the same time the capacity (for example; skills,
experience, financial resources, etc.) to implement these methods and technologies
seem to be lacking” (Edelenbos et al., 2013). To better understand these barriers,
research needs to address how organizations that have participated in co-digestion
projects have overcome these barriers.
The study will analyze successful examples of wastewater utilities that are using co-
digestion and their relationship with partners and cities. The two particular cases this
research will focus on are the East Bay Municipal Utility District (EBMUD) in San Francisco,
California and the Des Moines Metropolitan Water Reclamation Authority (WRA) in
Iowa. Research will investigate what institutional barriers each case encountered, if
any, and how actors were able to overcome them. By doing so, it may shed light on
how these kinds of projects can truly become innovations in sustainable development.
This research specifically aims to answer
What institutional barriers have successful cases of co-digestion at wastewater facilities
encountered and how were they overcome?
Do these barriers create a role for planners in co-digestion efforts?
The following questions will help guide in answering the previous question:
How did the actors involved get this project started? What were strengths and
weaknesses of the project?
What were the political/regulatory, social, economic, and cultural barriers they
encountered, and how did they overcome them?
The scope of this paper is to look at larger cities that are using co-digestion and how
they are overcoming institutional barriers throughout the process. It is outside the scope
of this paper to assess the health or environmental impacts that may be associated with
co-digestion although it may overlap with barriers.

p. 8 Chapter 1: Introduction
Organization of this Report
The report has six chapters. Below is a description of the remaining chapters.
Chapter 2: Institutional Barriers Context and Overview – The following chapter explains
what institutional barriers are and expands upon four types of barriers that water utilities
or cities may face when implementing a co-digestion project. It pulls from academic
literature and grey literature.
Chapter 3: Methods – This chapter provides an overview of the research methods
employed to evaluate what barriers were present in each case study.
Chapter 4: Case Study Summaries – Chapter four summarizes the organizational
characteristics of each utility and actor involved and the general background and
history of the co-digestion efforts.
Chapter 5: Case Study Findings – This chapter builds off the case study summaries and
delves into further detail about the barriers discussed in chapter two as they relate to
the case studies. It also expands upon the cities’ role in this process.
Chapter 6: Recommendations – The final chapter provides recommendations to help
facilitate co-digestion efforts and discusses further research opportunities.

p. 9 Chapter 2: Institutional Barriers Overview & Context
Chapter 2: Institutional Barriers
Overview & Context
Change is inevitable; it challenges and often breaks from tradition which requires a new
form of management and set of values. When new ideas come along and cause this to
happen, it means the conventional practices and values that have shaped the
institutions of the present have outlived their intended mission and objectives (Cortner,
Wallace, Burke, & Moote, 1998). However, because these institutions have not yet been
replaced, barriers arise that prohibit innovation from flourishing. Therefore, it is important
to look at the institutions that have shaped our values in the past and how they will help
or hinder transformations. This section highlights and discusses these barriers to provide
more contexts on what they entail.
In general, not much literature exists that discusses institutional barriers specific to co-
digestion for wastewater. Outside of academic literature, there is a growing trend in
gray literature/working papers to document barriers for biogas and energy projects for
facilities. Therefore, each barrier is generally discussed using academic literature
pertaining to institutional barriers in the water sector followed by subsequent
information obtained from the gray literature. Ultimately, this report will help narrow this
research gap.
What is an institutional barrier?
Institutions are the expressions of the terms of collective human experience.
Institutions reflect the ways people interact with one another and the ways they
interact with their environment. Further, they are the means people use to solve
social problems. The term institution has been defined in various ways; however,
the broadest definitions include both formal institutions, such as administrative
structures, and also informal institutions, such as customs and practices. (Cortner et
al., 1998, p. 160)

p. 10 Chapter 2: Institutional Barriers Overview & Context
In the water sector, institutions are nested in cultural, social, economic, and political
contexts (Saleth & Dinar, 2005). Although literature for integrated water management
has identified several types of barriers within these overarching contexts, this research
will distinguish them in the larger cultural, social, economic, and political framework. For
the purpose of this research, political barriers will include legislative and regulatory
barriers since politics can heavily influence those topics. This research also focuses on all
four barriers because they are intertwined and mutually reinforce each other.
Cultural
Achieving sustainable water development will require
significant cultural change not only for utilities, but for
governments and society (Herrick et al., 2013). New solutions
require thinking that expands beyond the technical thought
process and integrates social and ecological systems.
Juggling these different systems and schools of thought
necessitates interdisciplinary collaborations and approaches
to new solutions which will give birth to a new culture in the water sector. Culture is
developed both externally (i.e. relationships outside of an organization) and internally
(i.e. organizational culture) which means cultural barriers can be multifaceted.
External
Holistic approaches require the integration of distinct rules of thought, which means
social and natural sciences must be combined to overcome fragmentation, (Brewer,
1999) or at least communicate with one another. Communication and network
impasses and lack of strong relationships with external stakeholders, like state and local
departments or planners and engineers, can be a barrier to implementing projects
(Herrick et al., 2013). Traditionally, the water sector has minimal interaction outside the
technical world, which means these network and communication paths are not fully
established. This has resulted in a lack of systems thinking for developing integrated
solutions and collaborations of all disciplines, which is why decisions and efforts have
been focused on one discipline more than others (Healy, 2003). Design of water systems
has reduced uncertainty, therefore, avoiding radical alternatives (Ferguson,
Frantzeskaki, & Brown, 2013). Furthermore, in other water-related discourses, like
stormwater sustainability, research has shown that implementation is problematic due
to administrative inertia because of overlapping responsibilities between local
governments, state governments, and various other organizations (Brown, 2005). This
indicates that co-digestion for sustainable wastewater management practices
experiences similar barriers. Issues also arise when dealing with interdisciplinary
collaboration and energy. The water sector has not had significant coordination with
other resource sectors (e.g., waste) (Grigg, 2008), and historically, energy has not been
a performance metric, which does not incentivize renewable energy generation at
wastewater treatment plants (Willis et al., 2012).

p. 11 Chapter 2: Institutional Barriers Overview & Context
Internal
Organizational culture refers to mental assumptions in an organization that influences
how it thinks, acts, and behaves. When utilities or local governments fragment
departments, it can hinder innovations and cross-disciplinary problem solving.
Therefore, when new initiatives are brought up, the lack of support from staff or
leadership can dampen the progress (Willis et al., 2012). Stagnation occurs because
holistic initiatives are new and carry a great deal of uncertainty with them. To move
forward in the face of uncertainty, organizations need to have a flexible decision
making processes and strong leadership and coordination. Groups or agencies may
struggle with this since it often requires them to break away from traditional values
(Cortner et al., 1998). Historically, water facilities are conservative and lack strong
champions for these new initiatives, which makes breaking away from traditional values
difficult (Herrick et al., 2013). Reluctance to deviate from the status-quo has proven to
be a barrier for many wastewater treatment plants (WWTPs) when they consider using
biogas for renewable energy (Willis et al., 2012).
Social
Over the years, the public has developed certain
expectations for the provision of water services. Little
awareness exists as to what the behind the scenes operations
are, which has cultivated a take-for-granted attitude.
Because of this, consumers expect trouble-free delivery of
services (Marks & Zadoroznyj, 2005). Likewise, utilities perceive
success based on whether or not there is political debate or
public attention regarding the services they provide (Gober et al., 2013). Basically,
these perceptions and expectations have reinforced the out-of-sight-out-of-mind
mentality, and the lack of conversations has led the general public to have minimal
understanding of infrastructure needs and operations. This means when conversation
does take place, it is about an issue like contamination or raising rates which enables
the public to associate any conversation as a problem with the current situation.
Unfortunately, this history can make it difficult for new efforts and initiatives to come to
fruition.
Along those same lines, the public has developed a lack of trust with agencies over the
years in part due to lack of open discourse (Cortner et al., 1998). Minimal discourse
makes it hard for the public to understand the need for change. Academic literature in
water reuse has shown that trust is based off of structural components, like awareness of
regulations and rules, transparency of governance, and accountability supplemented
with informal structures like personal and collective characteristics (Marks & Zadoroznyj,
2005). Typically cities and states need strong established regulatory structures to help
influence the informal structures associated with trust so when there is a flow of
p. 12 Chapter 2: Institutional Barriers Overview & Context
information generated by the public, a false sense of confidence is not established if
they misunderstand or misperceive the effort. Basically, “trust has to be actively
reproduced and renegotiated in the case of new alternatives for taken-for granted
abstract systems” (Van Vliet & Stein, 2004).
Although the barriers discussed above aren’t specifically in reference to the water-
energy-waste nexus, gray literature has suggested co-digestion initiatives face similar
barriers. For example, the Water Environment Federation (WEF) Energy Roadmap report
stressed the importance of communication and outreach for new collaborative efforts
between energy and water to be successful. Another research report sponsored by the
Water Environment Research Foundation (WERF), Barriers to Biogas, indicated that
when utilities have tried to use biogas for renewable energy, lack of community interest
or support has been problematic (Willis et al., 2012). Currently, co-digestion and using
biogas for renewable energy isn’t necessarily required for facilities and is considered
voluntary. Voluntary initiatives compared to required initiatives can require lengthy
public outreach campaigns, especially when there is concern about odor and noise
(Willis et al., 2012). It is especially difficult to get public support for regional plants with
multiple jurisdictions.
While out-of-sight out-of-mind mentalities and trust represent barriers to project and
policy innovations, behavioral barriers also affect the performance of a project. When
the public uses water services, they are in fact participating in the effort because any
change in the system may require adjustments of their behaviors. However, behaviors
can be difficult to change when the public has developed traditional expectations of
their role. A co-digestion project can require multiple actors, like households,
restaurants, industries, etc. if proper disposal and collection methods of organic waste
are required to provide smooth operations at the treatment facility. Incorrect disposal
can require significantly more resources in operations and maintenance due to
clogging machinery and undesired contaminants. Therefore, successful efforts require
public support and understanding, because without their participation the program will
not produce the intended results.
Given these issues, public relationships should be strengthened in the decision making
process. The public not only needs to have a say early in the process, but should also
have an awareness of what their role would be and a better understanding and
appreciation for the services and the challenges utilities and cities face.
p. 13 Chapter 2: Institutional Barriers Overview & Context
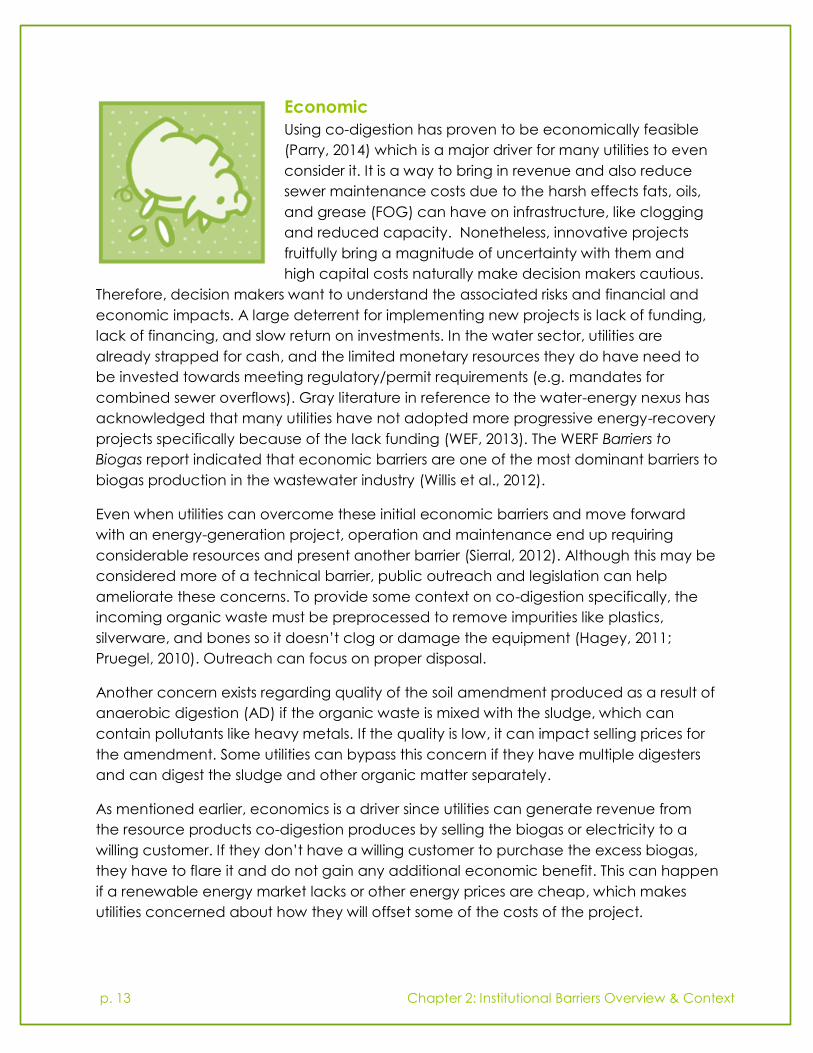
Economic
Using co-digestion has proven to be economically feasible
(Parry, 2014) which is a major driver for many utilities to even
consider it. It is a way to bring in revenue and also reduce
sewer maintenance costs due to the harsh effects fats, oils,
and grease (FOG) can have on infrastructure, like clogging
and reduced capacity. Nonetheless, innovative projects
fruitfully bring a magnitude of uncertainty with them and
high capital costs naturally make decision makers cautious.
Therefore, decision makers want to understand the associated risks and financial and
economic impacts. A large deterrent for implementing new projects is lack of funding,
lack of financing, and slow return on investments. In the water sector, utilities are
already strapped for cash, and the limited monetary resources they do have need to
be invested towards meeting regulatory/permit requirements (e.g. mandates for
combined sewer overflows). Gray literature in reference to the water-energy nexus has
acknowledged that many utilities have not adopted more progressive energy-recovery
projects specifically because of the lack funding (WEF, 2013). The WERF Barriers to
Biogas report indicated that economic barriers are one of the most dominant barriers to
biogas production in the wastewater industry (Willis et al., 2012).
Even when utilities can overcome these initial economic barriers and move forward
with an energy-generation project, operation and maintenance end up requiring
considerable resources and present another barrier (Sierral, 2012). Although this may be
considered more of a technical barrier, public outreach and legislation can help
ameliorate these concerns. To provide some context on co-digestion specifically, the
incoming organic waste must be preprocessed to remove impurities like plastics,
silverware, and bones so it doesn’t clog or damage the equipment (Hagey, 2011;
Pruegel, 2010). Outreach can focus on proper disposal.
Another concern exists regarding quality of the soil amendment produced as a result of
anaerobic digestion (AD) if the organic waste is mixed with the sludge, which can
contain pollutants like heavy metals. If the quality is low, it can impact selling prices for
the amendment. Some utilities can bypass this concern if they have multiple digesters
and can digest the sludge and other organic matter separately.
As mentioned earlier, economics is a driver since utilities can generate revenue from
the resource products co-digestion produces by selling the biogas or electricity to a
willing customer. If they don’t have a willing customer to purchase the excess biogas,
they have to flare it and do not gain any additional economic benefit. This can happen
if a renewable energy market lacks or other energy prices are cheap, which makes
utilities concerned about how they will offset some of the costs of the project.

p. 14 Chapter 2: Institutional Barriers Overview & Context
Political /Regulatory
Historically, formal institutions have separated resources into
single resource categories when creating policies (Hussey &
Pittock, 2012). Because of this, existing laws, policies, and
regulations may be fragmented and end up constraining or
aiding in the development and implementation of new
management strategies or ideas.
Again, gray literature supports this. For wastewater facilities,
regulations in general have severely limited utilities’ ability to generate renewable
electricity (WEF, 2013). This is in part due to the permitting process of energy generation
in general (Sierral, 2012). Because wastewater facilities already use AD, adding organic
waste to the mix might make permitting easier than proposing a new separate AD
facility. However, piggybacking off of wastewater facilities is not devoid of barriers
because co-digestion is a process that requires new inputs and outputs that weren’t
previously included in permits.
Aside from energy generation concerns, these different sectors may face
inconsistencies and overlapping political and jurisdictional boundaries. These regulatory
regimes bound organizational change because so many agencies and authorities
might be impacted by one initiative, and that has given utilities problems with
sustainable initiatives (Herrick et al., 2013). The water-waste-energy nexus for co-
digestion requires cross-coordination for resource and land management strategies.
Aside from the general messiness and administrative inertia that might result,
environmental regulations also pose an obstacle to utilities seeking renewable energy
projects at treatment facilities. For example, the WERF Barriers to Biogas report indicated
that air regulations can be an issue because there is general opposition to new
pollution sources (Willis et al., 2012).

p. 15 Chapter 3: Methods
Chapter 3: Methods
This research used a qualitative approach to identify barriers and strategies for
demolishing them. The following chapter explains the reasoning for choosing the East
Bay Municipal Utility District (EBMUD) and the Des Moines Metropolitan Wastewater
Reclamation Authority (WRA) and the methods used to obtain information for each
case study.
Case Study Selection The research process started with the identification of large-sized (>10MGD) publicly
owned treatment works (POTW)2 that have a history of embarking on co-digestion. The
two cases selected, EBMUD in Oakland, California and Des Moines WRA in Des Moines,
Iowa, were selected based on national recognition and awards for leadership in co-
digestion. Both examples have a long standing history of co-digestion and are viewed
as exemplars by the field.
East Bay Municipal Utility District (EBMUD)
EBMUD, located in Oakland, California, became the first wastewater treatment plant in
North America to become a net producer or energy in 2012. It also received a 2013
National Association of Clean Water Agencies Operations and Environmental
Performance Award for the Renewable Energy Program. Aside from its success in
pioneering co-digestion, it is one of the few large scale utilities that utilize food waste in
the co-digestion process.
Des Moines Metropolitan Wastewater Reclamation Authority (WRA)
WRA, located in Des Moines, Iowa, has received acknowledgement for its co-digestion
efforts and ability to overcome a variety of barriers as indicated in the Water
Environment Research Foundation (WERF) Barriers to Biogas study. In 2010 it received
special recognition in the Governor’s Iowa Environmental Excellence Award for Energy
Efficiency/Renewable Energy. Aside from its recognition, WRA has decades of
experience using co-digestion and has actively sought partnerships to sell excess
biogas.
Case Study Research
Research areas focused on document review and stakeholder interviews.
2 The EPA breaks POTWs down into three sizes, small, medium, and large. Small-sized POTWs have flows less than 1 MGD. Medium sizes have between 1 and 10 MGD and large sizes have flows greater than 10 MGD.

p. 16 Chapter 3: Methods
Document Review
To gather background information on the utilities, the process of the co-digestion
projects, and the key actors involved I reviewed the utilities’ websites, working papers,
public reports, and documents. This information was used to document potential
barriers, gather contact information, and discern remedial steps to these barriers. After
conducting interviews, the information was also used to help corroborate findings or
identify contradictory information.
Document review for the EBMUD case study included the following sources:
o Sustainability/Energy Committee Agenda and Meeting Minutes
o Project Memorandums
o Biosolids Performance Reports
o News and Journal Articles
Document review for the WRA included the following sources:
o News and Journal Articles
o WRA Technical Committee Meeting Minutes
Semi-structured Stakeholder Interviews
The purpose of interviews was to gather additional information on the project barriers,
the actor/group’s perception of each barrier, the prominence of one type of barrier
over the others, and the methods used to overcome the barriers. A list of potential
interviewees was developed through document review and the snowball method led
to the identification of additional interviewees. Contacted participants received an
informed consent document and all participants were engaged in one-on-one
interviews over the phone. During the phone interviews, informed consent was
reviewed again before discussing the barriers. The duration of interviews lasted 20 to 40
minutes.
Nineteen people were contacted for interviews. A total of six people were interviewed;
three for the WRA case study and three for EBMUD. During the interview, questions were
based on the four identified barriers (i.e., regulatory/political, cultural, social, and
economic) and were documented through note taking. Audio recording was used to
verify notes. Key themes for each specific barrier were identified during analysis.

p. 17 Chapter 4: Case Study Summaries
Chapter 4: Case Study Summaries
Both the East Bay Municipal District (EBMUD) and Des Moines Wastewater Reclamation
Authority (WRA) have more than a decade of experience in starting and fine tuning
successful co-digestion programs. To identify and narrate the main actors involved, the
following chapter portrays the characteristics of each utility and its historical progression
of co-digestion efforts.
p. 18 Chapter 4: Case Study Summaries
East Bay Municipal Utility District (EBMUD) –
San Francisco, CA
Organization’s History & Background
EBMUD’s roots run almost a century deep in the San
Francisco Bay area. In 1921 California passed the
Municipal Utility District Act to ensure the provision of
water services to a growing California, which ultimately
gave birth to the publicly owned utility, EBMUD, in 1923.
However, it wasn’t until 1944 that EBMUD added
wastewater services to its regime. It started with
collection in a subsidiary district and later added
wastewater treatment in 1951. Since then, it has provided
both drinking water and wastewater services to the
eastern San Francisco Bay area, particularly Alameda
and Contra Costa counties which include two major
cities in the Bay area, Oakland and Berkeley.
Governing Characteristics
Board of Directors EBMUD has a publicly elected Board of Directors that
consists of seven members who serve four-year terms. The
board’s tasks are to determine overall policies and work
with the General Manager to implement them. In
addition to policy making, the board is involved in
planning, legislative/human resources, and
finance/administrative activities.
Departments
The General Manager oversees six departments in
EBMUD: water & natural resources, operations &
maintenance, engineering and construction,
wastewater, finance, and administration. Each of these
departments has several divisions. Naturally, the
wastewater services fall under the wastewater
department. In terms of finance, EBMUD has a bi-annual
budget for both the water and wastewater system since
they are treated as separate entities (Dudek, 2008).
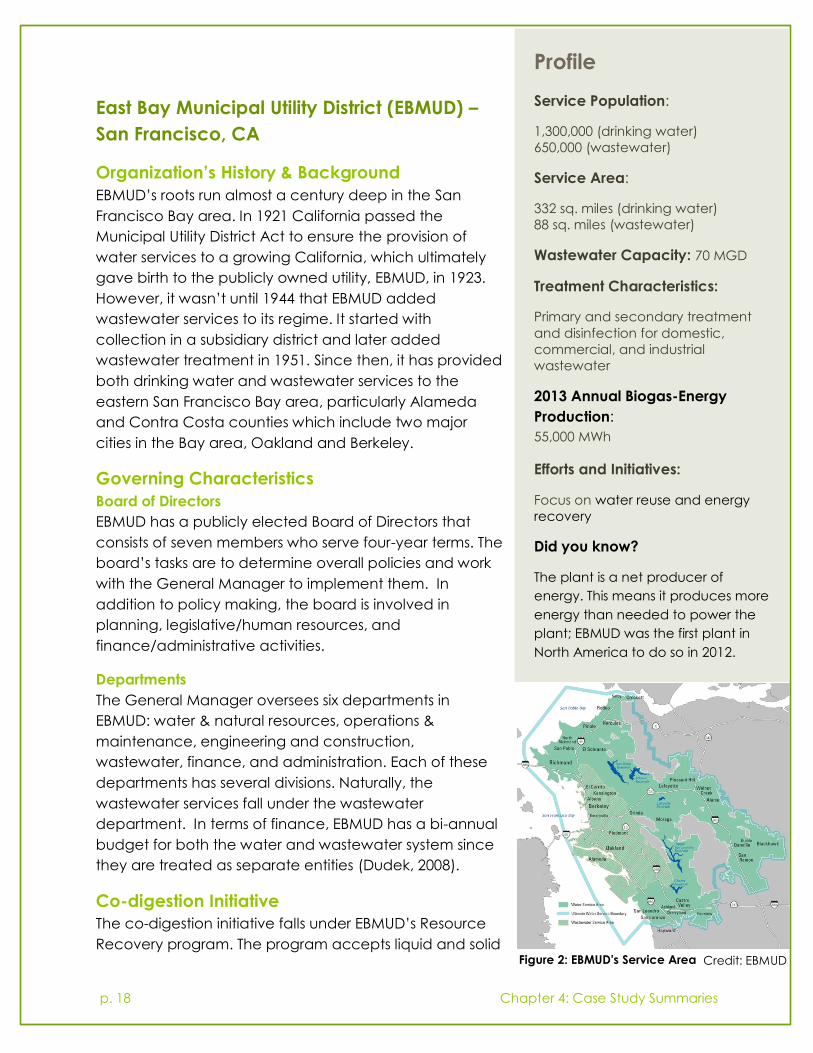
Co-digestion Initiative
The co-digestion initiative falls under EBMUD’s Resource
Recovery program. The program accepts liquid and solid Credit: EBMUD Figure 2: EBMUD's Service Area
Profile
Service Population:
1,300,000 (drinking water)
650,000 (wastewater)
Service Area:
332 sq. miles (drinking water)
88 sq. miles (wastewater)
Wastewater Capacity: 70 MGD
Treatment Characteristics:
Primary and secondary treatment
and disinfection for domestic,
commercial, and industrial
wastewater
2013 Annual Biogas-Energy
Production:
55,000 MWh
Efforts and Initiatives:
Focus on water reuse and energy
recovery
Did you know?
The plant is a net producer of
energy. This means it produces more
energy than needed to power the
plant; EBMUD was the first plant in
North America to do so in 2012.

p. 19 Chapter 4: Case Study Summaries
waste, such as fats, oils, and grease (FOG), food scraps, and winery wastes. In 2013
EBMUD received a National Association of Clean Water Agencies Operations and
Environmental Performance Award for its renewable energy program. In 2011, 5% of the
food waste from restaurants and grocery stores in the Bay Area was part of the
program.
History of the Program
The following timeline is a summary of the activities that took place throughout the
years as EBMUD has worked to develop its co-digestion efforts. The subsequent section,
Actors, elaborates on the issues and challenges of the activities themselves.
1951 EBMUD builds a wastewater treatment plant in Oakland. It includes 12
anaerobic digesters, because the local canning industry is in its prime,
and produces an abundance of organic waste.
1986 EBMUD begins power generation and starts a purchase power agreement
(PPA) with Pacific Gas & Electric (PG&E) and sells PG&E power on an as-
needed basis.
1992 The last cannery in the area finally closes, as the industry declined over
the years (Hagey, 2011). This decline in supply leaves EBMUD with extra
capacity in the digesters and decreases EBMUD’s amount of wastewater
needing treatment by a third. Due to the loss of the canning industry,
EBMUD no longer uses some of the infrastructure (e.g., digester, flow
tanks), but it still needs maintenance, which costs money. Options include
raising customer rates or coming up with another solution (Kerr, 2010).
2000 The California electricity crisis hits Oakland. Electricity prices are
increasing and EBMUD needs a way to control rates for their customers
(WEF, 2013). EBMUD looks for ways to utilize the digesters and starts using
processed waste (e.g. oils, portable toilet liquid, and greases from
restaurants) for digestion.
2004 EBMUD experiments with food waste during anaerobic digestion (AD) and
starts collaborating with Recology in May. Recology brings about 40 tons
per day (tpd) of food waste for EBMUD to use (Gray, Suto, & Chien, 2008).
2007 The Environmental Protection Agency (EPA) funds a bench-scale study to
learn more about co-digestion, such as figuring out how much energy
food waste generates. The results indicate that food waste generates
about three times more biomethane than municipal sludge during
anaerobic digestion. Results indicate a promising future for co-digestion.
p. 20 Chapter 4: Case Study Summaries
2008 EBMUD begins a pilot project with Central Contra Costa Solid Waste
Authority (CCCSWA) and its waste hauler Allied Waste Services. CCCSWA
starts bringing commercial food waste to EBMUD in November, and the
project starts to deliver 30 tons/week (Pruegel, 2010).
2010 The CCCSWA-Allied Partnership project is supposed to be available to all
commercial customers, and Allied is supposed to build a new solid waste
facility (Pruegel, 2010).
2011 EBMUD is processing 40 tons of commercial postconsumer food waste
every weekday, and receives 240,000 gallons per day (gpd) in food
processing waste. EBMUD is generating 90% of its demand. In July EBMUD
and Recology form an agreement to develop a pre-processing facility on
site, which will also provide EBMUD with 120 tpd of food waste.
2012 2012 is a year full of accomplishments and milestones for EBMUD.
EBMUD completes an Energy System Master Plan in October.
EBMUD looks for ways to increase the power
generation capacity of its 6.3 megawatt
(MW) power generation station (PGS). After
research it decides to install a 4.6 MW
turbine. Once the new PGS is fully
operational, EBMUD averages 1 MW to the
grid within the first two weeks (Williams,
2012a). EBMUD becomes a net producer of
energy because of this new addition and
receives CASA’s 2012 Outstanding Capital
Project Award for the Power Generation
Station Renewable Energy Expansion Project.
EBMUD ends its PPA with PG&E and starts a new PPA with the Port of
Oakland.
EBMUD and Recology face permitting issues for the pre-processing
facility.
2013 In this fiscal year (FY), EBMUD experiences a slight increase in revenues
from 2012. Organic waste creates $2M in energy value (Horenstein, 2013)
and EBMUD generates 126% of its own demand.
Food for thought
A Megawatt-hour (MWh) is a way to
measure the amount of electricity used
over time.
1MWh = The amount of electricity one
100W light bulb turned on for 10,000
hours (~1 year 2 months) uses.

p. 21 Chapter 4: Case Study Summaries
With all of its success gaining attention, EBMUD starts to see an increase in
competition for feedstock (Williams, 2012a).
2014 EBMUD anticipates biogas to meet 130% of demand in FY 14.
Actors
As indicated in the timeline above, several actors have been pivotal in allowing EBMUD
to attain the success it has reached today.
The following section provides more characteristics on these organizations, details their
involvement, and highlights challenges.3 See Figure 6 for a diagram illustrating the
actors’ involvement and roles.
East Bay Municipal Utility District (EBMUD)
EBMUD is the utility that produces the biogas and collects the
organic waste from companies, industries and agencies, like
Recology and CCCSWA and its partnered waste haulers. Over
the years several drivers spurred EBMUD’s interest in co-
digestion. More recently, energy prices and greenhouse gases
(GHG) have been the primary motivator as EBMUD tries to
reduce its GHG emissions; co-digestion significantly helps due
to energy generation. A series of plans EBMUD has developed
supports these efforts, such as its Strategic Plan and Energy
System Master Plan. The Strategic Plan, first developed in 2004, contains several
strategies to support co-digestion, like, “Minimize impacts to the environment by
reducing, recycling, reusing and reclaiming waste, and by conserving natural
resources.” Similarly, the Energy System Master Plan outlines energy conservation
measures, management practices, and ways to increase energy production.
3 This is not meant to be an all-inclusive list of partners; it is a list of actors that appeared to have a large role in the process.
Credit: Alliance for Water
Efficiency
Figure 3: Pictures of the co-digestion process at EBMUD
(left) Commercial food waste being dumped at EBMUD Credit: Image Slides (center) EBMUD’s anaerobic digesters
Credit: EBMUD (right) EBMUD’s co-generation engines where biogas is turned into electricity Credit: Image Slides

p. 22 Chapter 4: Case Study Summaries
As indicated in the timeline above, EBMUD has seen an increase in competition, which
is one of their biggest current concerns. Between FY12 and FY13, it lost 11% of its
revenue from businesses. Nonetheless, the utility views the competition as a good thing
because it corroborates EBMUD’s success. The competition has increased due to two
main reasons. First, neighboring locations have also started to accept items like FOG
and winery waste (EBMUD, 2013). Second, other facilities, like Hilmar Cheese, want to
construct their own digesters. Naturally, this detracts existing or potential revenue from
EBMUD. Growing pains and steep learning curves still give EBMUD an advantage. As
these companies/facilities work through these displeasures, EBMUD still receives waste
from those sources.
Pacific Gas & Electricity (PG&E)
PG&E is a natural gas and electric utility in California that has been
in operation since 1905. It provides services to northern and central
California, and EBMUD sold energy to PG&E on an as-needed basis
for 16 years.
Although this company no longer has a role in the process, the
main issues it encountered involved scheduling energy exports
between EBMUD and PG&E. This is because electricity exports
require a schedule, and at the time EBMUD struggled with creating a steady stream of
energy from the co-digestion process.
Port of Oakland
Port of Oakland is a public agency within the City of
Oakland. A board of commissioners governs it and it
funds its own operations. Since November 2012 it has
been an entity willing to purchase the renewable energy
EBMUD produces, through a PPA.
Port of Oakland entered the picture as PG&E was leaving it. The main reason for this
change was because EBMUD wanted to be able to sell renewable energy credits
(RECs) and existing regulations prohibited that from occurring with EBMUD and PG&E’s
long-standing PPA. Therefore, EBMUD, in search of a new PPA, submitted a request for
expressions of interest and moved forward with Port of Oakland since it had an
attractive pricing proposal (Williams, 2012b). The arrangement ended up being a five-
year contract where the Port of Oakland pays EBMUD $71/MWh (bundled with REC)
when power is available (EBMUD, 2012). Because EBMUD could sell the RECs, this
accrued a payment over twice as much as what PG&E paid them ($34/MWh). During
the first year of the PPA with Port of Oakland (Nov 2012 –Oct 2013) EBMUD sold a total
of 12,465 MWh, generating a revenue of $908,000.
Credit: PG&E
Credit: Port of Oakland
p. 23 Chapter 4: Case Study Summaries
Recology
Recology is an employee-owned company that has provided
resource recovery services (e.g., collection, sorting, transfer, recovery)
in California since 1920. To provide services, it enters into franchise
agreements with agencies (e.g., cities). Throughout the co-digestion
efforts, Recology has been a willing partner wanting to bring organic
waste to EBMUD.
When Recology started to bring food waste to EBMUD in 2004, Recology needed to
pretreat the food to avoid contamination. Contamination could be things like metals or
bones that can clog the system. When the system was impacted by contaminants it
required regular cleaning and caused alarm for what types of materials were actually
being sent to the digester. Pretreatment has been an ongoing issue for the
organization. Even in FY 13, EBMUD mentioned in a committee update that Recology
was bringing in 15 tpd of San Francisco multi-family organic waste, among other
sources, but contamination was still a hurdle. It was difficult to obtain information on
how Recology is handling this based on lack of interviews from the Organization and
documents accessible for review. In January, 2014 Recology was supplying 120-200 tpd
to EBMUD.
Years later, in 2011, Recology approached EBMUD with a proposition to bring
preprocessing closer to the facility. The idea was that EBMUD would lease some of its
land so Recology could construct and operate a pilot-scale pre-processing site for two
years and provide additional food waste (Horenstein, 2013). Both parties liked the idea,
since it could be an opportunity to attract new materials, like ones that need
depackaging. Recology would pay a $37/ton tip fee associated with the proposed
pilot. However, this process has required an exhausting regulatory marathon for
Recology and EBMUD and has pushed back the project. This is because solid waste
agencies still have jurisdiction over the waste being used for co-digestion. To get
approval to move forward with the pre-processing facility, Recology needed to go
through three steps.
1. List the preprocessing facility on EBMUD’s City of Oakland’s Nondisposal Facility
Element (NDFE)
2. Have StopWaste amend the Alameda County’s Integrated Waste Management
Plan (ColWMP)
3. Submit application for a solid waste facilities permit to CalRecycle, the state of
California’s solid waste management authority, which can take a year to
process.
Credit: Recology

p. 24 Chapter 4: Case Study Summaries
To date, the City of Oakland and StopWaste have approved both of Recology’s
requests to allow for full-scale facility construction. More information can be found
about the timeline in Appendix A (p. 58).
Central Contra Costa Solid Waste Authority (CCCSWA)
CCCSWA is an authority created in 1990 that is dedicated to
providing solid waste and residential recycling services to its member
cities in Contra Costa County. A board of directors (i.e.,
representatives from member agencies and county authorities)
governs the authority. Anyone in the county who has authority to
franchise solid waste collection is eligible to become a member. Part
of CCCSWA’s responsibility is to develop franchise agreements with
waste haulers and recycling companies. It currently holds franchise agreements with
Allied Waste Services and Valley Waste Management.
Like Recology, CCCSWA and its franchised hauler, Allied
Waste Services, have collaborated with EBMUD to bring
organic waste to EBMUD’s facility for co-digestion.
CCCSWA initially obtained the idea to develop a
commercial food waste pilot project in 2007 after it
conducted a waste characterization study in 2007. The
results indicated organic waste composed a large portion
of the waste stream. Aside from the amount of organic
waste generated, CCCSWA was looking for ways to
reduce GHGs and also received requests to initiate a
food waste recycling program. CCCSWA kicked off the program in 2008 and funded it
through a Diversion Incentive Fund which consists of commodity sales. For their pilot
they recruited100 accounts that regularly generated food waste. Allied Waste Services
would collect the food waste and take it to a grinding facility in Milpitas (~40 miles
away) before bringing it to EBMUD. With the pilot’s success, two years after the project
CCCSWA passed the operational costs to the entire commercial base rate (Food
Recycling Project, 2011). Four years after the project kickoff, CCCSWA had acquired
140 participants. Figure 5 provides a brief timeline of the project. Participants of the
program include grocery stores, schools, assisted living facilities, and hotels. The
successful program receives national and international attention. This collaboration has
been so successful that it won the 2013
Contra Costa Leadership in Sustainability
Award.
It receives much attention because it is a
unique program; CCCSWA-Allied train the
generators how to properly dispose of the
Credit: CCCSWA
Table 1: Food waste generated via recycling project
Year Amount of waste
brought to EBMUD
Percent
Increase
2011 40 tons per week -
2013 10 tons per day 175%
2014 20 tons per day 200%
Credit: CCCSWA
Figure 4: CCCSWA's Logo for Program

p. 25 Chapter 4: Case Study Summaries
food so it has little to no contamination, which bypasses the pre-processing step before
entering the digesters. The only action taken before it goes to EBMUD is to grind the
material to be less than two inches in size. Over the years the program has drastically
increased the amount of waste collected and brought to EBMUD as shown in Table 1.
CCCSWA has reported positive responses from participants and has saved on tipping
fees. When it initiated the pilot, it cost $52/ton to bring the material to a landfill
compared to only $45/ton to tip it at EBMUD. Over time, the cost has increased; in
March 2014 it was about $55/ton. The one notable concern has been the odor
because Allied Waste does not collect food waste daily. Generators use plastic bags to
help control odor in addition to retaining liquids. However, plastic bags can get stuck in
the equipment at EBMUD. CCCSWA investigated the use of paper bags during a trial
run in 2011. Paper bags worked well in the process but they are more expensive;
nonetheless, participants have the option of using the paper bags. Allied Waste,
CCCSWA’s franchised waste hauler, also can switch out bins and steam clean them to
address residue or odor.
As CCCSWA considers expanding the program to participants and new materials,
EBMUD collaborates with CCCSWA to provide in-kind services for technical inspection
to ensure contamination remains low and participation continues to grow (Morsen &
Carr, 2014). The franchise agreement with EBMUD will end in 2015, and CCCSWA wants
to have a competitive RFP process. Contracts will entail 10-12 years of material
collection and processing services.
Figure 5: History of Food Recycling Project
City of Oakland
The City of Oakland is in Alameda County and franchises out its waste and recycling
services. The City of Oakland is currently working out a new recycling contract, and the
City Council has reflected great interest in taking organic waste to EBMUD for energy
generation. In September 2012 it put out an RFP for zero waste services. As of May 2014,
the City of Oakland is still in the process of selecting a contractor. The City Council
expressed interest in collaborating with EBMUD and asked city staff to return to council
Source: (Food Recycling Project, 2011)

p. 26 Chapter 4: Case Study Summaries
with more information. To help the Council gather more information about this process,
EBMUD has been working with the city and giving them tours of the site.
The partnership between the Oakland and EBMUD could allow the City Council to
include a requirement for the contractor to consider bringing some of the food scraps
to EBMUD for energy generation. Such an arrangement could potentially bring in 100
tpd of commercial waste and 50 tpd of family food waste. If this came to fruition, the
collection would start in 2015.
The City of Oakland has several factors that give the Council reason to take interest in
co-digestion. First and foremost, the city has an Energy and Climate Action Plan from
2012 that aims to restructure solid waste management and reduce greenhouse gas
emissions. This builds off of the city’s 2006 adopted goal to achieve zero waste. The goal
requires a 90% reduction in waste sent to landfills by 2020. In addition to the Energy and
Climate Action Plan the city has a zero waste strategic plan. These initiatives call on the
council to make decisions that support efforts like co-digestion.
However, based on an interview with a City of Oakland staff member, during this
contract renewal, recycling contractors have expressed concern about the economic
costs of current options and bringing food waste to EBMUD. Their arguments are based
on the claim that current arrangements are losing them money with the contract. If
Oakland brought food waste to EBMUD they would need to pre-process it, just like
Recology and CCCSWA. The city expects it to cost about $3M. StopWaste could
provide $1M but that leaves $2M remaining and the City would need to find someone
or a way to pay for it. The economic concerns of this issue make City Council cautious
in moving forward.
Despite the economic concerns, the council has adopted a resolution to take effect
July 1, 2014. The resolution has four standards for the new recycling contract, one is a
requirement that the contractor must consider, “sending some of the food scraps to a
biowaste-to-energy facility where waste would be used to generate electricity”
(Oakland, 2014). To address the economic concerns and the potential extra raise in
rates, the City Council would like a cost analysis on this option before they decide to
require this method of disposal.
City of Sunnyvale
The City of Sunnyvale is about 40 miles south of EBMUD. However, Sunnyvale has
discussed the potential of bringing some organic waste to EBMUD. A potential
partnership is still budding and requires future monitoring for opportunities and
challenges. If Sunnyvale decides to bring organic material to EBMUD, it could be
around 120 tpd (Horenstein, 2014).

p. 27 Chapter 4: Case Study Summaries
Collection/ Pre-Processing
Digestion Resource Products
Recology
Helped experiment with
performance organic wastes in
digestion process; brings in food
waste; proposed; operating a pre-
processing facility
Central Contra County
Solid Waste Authority
Brings in food waste; created
collection program to remove
contamination at the source
Companies
(e.g., wineries, foster farms) Bring in multiple forms of organic
waste
EBMUD
Takes material and uses it in the
anaerobic digesters; biogas is used
to heat and power the plant to
generate electricity
City of Oakland
Renewing waste hauler and
recycler contract and will
potentially ask service provider to
bring organics to EBMUD
City of Sunnyvale
Has potential interest in trucking
some feedstock to EBMUD
Port of Oakland
Purchases excess electricity from
EBMUD
Pacific Gas & Electric
Purchased excess electricity from
EBMUD for 16 years
Figure 6: Snapshot of Actors Involved in EBMUD Co-Digestion

p. 28 Chapter 4: Case Study Summaries
Des Moines Metro Wastewater Reclamation
Authority (WRA) – Des Moines, IA
Organizational History & Background
The WRA originated from the Federal Water Pollution
Control Act Amendments of 1972 (also known as the
Clean Water Act). Because the law emphasized clean
up in areas that struggled with water quality, the EPA
gave funding to the Central Iowa Regional Association
of Governments to conduct a waste treatment
management study. The study resulted in the formation
of the Des Moines Integrated Community Area which
consisted of 12 local governments and two sewer
districts. In 1995 ICA was renamed as the WRA. It wasn’t
until 2004 that WRA became a legal entity and had an
organized board along with a budget. At the same time,
the City of Des Moines also became the operating
contractor for the WRA. Today, WRA consists of 17 metro
area municipalities, counties, and sewer districts.
Governing Characteristics
Board of Directors
WRA has a Board of Representatives that comprises one
representative from each community. Each community
appoints its own member and memberships last for one
year terms. An additional member is allowed for every
25,000 people. The board has the responsibility to jointly
finance acquisitions and construction improvements to
expand, extend, and upgrade the WRA, approve its
budget and capital improvement program, contract
services, define parameters and benchmarks for
services; and employ staff.
Services
The WRA contains a conveyance system which connects
each community to the conveyance system that leads
to the treatment facility. Additionally, WRA provides
finance support, legal support, human resource support,
procurement and purchasing, risk management,
information technology, and engineering services.
Profile
Service Population:
500,000 people
Service Area:
88 sq. miles
Wastewater Capacity: 59 MGD
Treatment Characteristics:
Primary and secondary
treatment, disinfection, solids
treatment and biosolids disposal.
WRA feeds water back to Des
Moines River
2013 Annual Biogas Production:
458,000,000 cubic feet
Efforts and Initiatives: Energy
recovery, hauled waste, and
FOG program
Did you know?
The plant produces 75% of its
own power and uses the treated
biosolids from the AD process as
soil amendment for farms.
Figure 7: WRA's Service Area Credit: WRA

p. 29 Chapter 4: Case Study Summaries
Co-digestion Initiative
The co-digestion initiative is supported by the FOG and hauled waste program. The Des
Moines WRA wastewater reclamation facility (WRF) collects tipping fees for hauled
liquid wastes. Tipping fees range from 1.5 to 6 cents/gallon which gave them annual
revenues of $337,000 and $200,000 in 2008 and 2009, respectively (Greer, 2011). About
2,000 restaurants and food service establishments (FSE) in the metro area and 60
industrial producers bring waste or FOG to the facility for digestion (Greer, 2011). On an
average day, the facility receives anywhere from 25 to 60 trucks, and this hauled waste
accounts for 42% of the feedstock entering the digesters (Greer, 2011). This generates
about $1.5M annually in hauled waste tipping fees.
History of the Program
1980s The wastewater reclamation facility (WRF) is designed. The original design
has a 20 year planning timeframe and ends up overestimating the
needed capacity.
1991 A local dairy has whey waste that they want to dispose of. WRA decides
to use it for anaerobic digestion. This opens up other co-digestion
opportunities now that WRA sees the benefits (Greer, 2011).
2004 WRA becomes a legally separate entity in July. The WRF constructs a
permanent hauled waste receiving station.
2006 WRA starts to produce excess gas and must burn the excess methane
unless they find another way to use it. They look for other options, like
cleaning the biogas and selling it to a natural gas utility, but natural gas
prices are already cheap. WRA continues to look for other ways to market
the excess biogas.
The metro area adopts a FOG ordinance that requires FSEs to have grease
traps and intercepts.
2007 WRA creates a bioenergy master plan and identifies facility
improvements.
A joint partnership between WRA and Cargill occurs and construction of a
biogas delivery system between the two sites begins. Cargill will use the
biogas for its grain processing.
2008 WRA completes the Bioenergy Master Plan. WRA saves about $2.7M in
power costs by selling gas to Cargill.

p. 30 Chapter 4: Case Study Summaries
2009 WRA sells 40% of biogas to avoid flaring excess gas.
2010 WRA starts a $19 million project to upgrade the digesters and distribution
systems. This project will also add two 1.4 MW cogeneration units to
expand power generation to the current 1.8MW.
2011 WRA approaches a local natural gas utility to see if they are interested in
purchasing biogas. (Willis et al., 2012). Further analysis indicates nothing
came to fruition.
2012 CH4 Solutions expresses interest in entering a property lease agreement to
develop a compressed natural gas fueling station. The two parties are
unable to come to leasing terms for the project (Board, 2012).
2013 WRA releases a request for proposals for a biogas-based compressed
natural gas fueling station.
2014 WRA has an agreement with Iowa Utility Board to keep rates stable until
2014. WRA expects electricity rates to increase.
WRA expects to complete construction upgrades at the end of April.
Actors
As indicated in the timeline above, a variety of actors have been involved in the
process, especially in terms of finding outlets for WRA to handle excess biogas. The
following section provides more characteristics on these organizations, details on their
involvement, and the challenges they experienced throughout the process. Figure 7
provides a snapshot of the actors’ contributions and highlights their roles.
Des Moines Wastewater Reclamation Authority (WRA)
WRA is the authority that has treatment facilities to treat the
wastewater, FOG, and hauled waste to produce biogas.
Several factors influenced the WRA to reach out to industries
that were treating waste and discharging it to the facility, like
excess capacity in the digesters. With the excess capacity, the
facility looked to see what value they could get out of the
engines, especially since methane needed to be flared
occasionally. Aside from excess capacity, the WRA also formed an energy
management team in 2007 and has a champion to promote energy initiatives in the
utility.
Credit: WRA
p. 31 Chapter 4: Case Study Summaries
When the WRF initially started co-digestion, the WRA marketed the effort by attending
and speaking at several types of conferences (e.g., ethanol, biodiesel). Eventually word
of mouth became a self-sustaining market strategy. In addition to spreading the word,
the WRA looked for partners and started with local food processing industries but
quickly realized how many biodiesel and ethanol plants were sprouting up in the area.
These plants create a byproduct that can be used as feedstock for digestion. Demand
from these plants increased especially when the Iowa Department of Natural Resources
became stricter with regulations regarding land applications of high strength organic
wastes (Greer, 2011). Ultimately, this increased the amount of waste WRA received from
biofuel plants.
With growing popularity, WRA wanted to upgrade its power generation capabilities as
indicated in the timeline. This helps WRA provide more gas to Cargill and therefore
acquire more revenue and become closer to achieving a net zero facility status.
Cargill
Cargill is a private global company in the food
processing/agricultural industry with a plant in Des Moines, Iowa. The
plant produces grain and oilseed and is located adjacent to the
WRF. It has purchased the facility’s excess biogas since 2007.
The partnership between WRA and Cargill was truly a joint venture. WRA had gas to sell
and Cargill needed gas culminating to a fantastic example of being in the right place,
literally, at the right time. The two organizations split the cost of the 600 foot pipeline
that would send gas over to Cargill. The WRA spent $1.1M and Cargill spent $750,000.
Both parties expected fairly quick payback periods (WRA 3.9 years and Cargill 1.5
years) (Greer, 2011). The WRA bills Cargill monthly for the amount of biogas Cargill
consumes. In 2007 WRA made $460,000 in revenues selling biogas to Cargill.
Des Moines Metro Area / Restaurants
The Des Moines metro area consists of five counties with a population over 500,000. The
WRA developed a committee to develop a FOG ordinance that the metro area cities
adopted in 2006. The ordinance affects over 2,000 FSE (e.g., restaurants). A main driver
for the ordinance was the EPA’s mandate to decrease grease-related sewer
blockages, backups, and sanitary sewer overflows. Since its adoption, the metro area
has seen a dramatic decrease in the amount of blockages and overflows.
Credit Cargill

p. 32 Chapter 4: Case Study Summaries
Collection/ Pre-Processing
Digestion Resource Products
Des Moines Metro
Area Restaurants
Required to bring fats, oils, and
grease to the wastewater
reclamation facility
Companies
(e.g., biodiesel & ethanol plants,
animal processing plants) Brings in multiple forms of
organic waste
WRA
Takes material and uses it in the
anaerobic digesters; biogas is
used to heat and power plant
Cargill Purchases excess biogas from
WRA
Figure 8: Snapshot of Actors Involved in WRA's Co-digestion
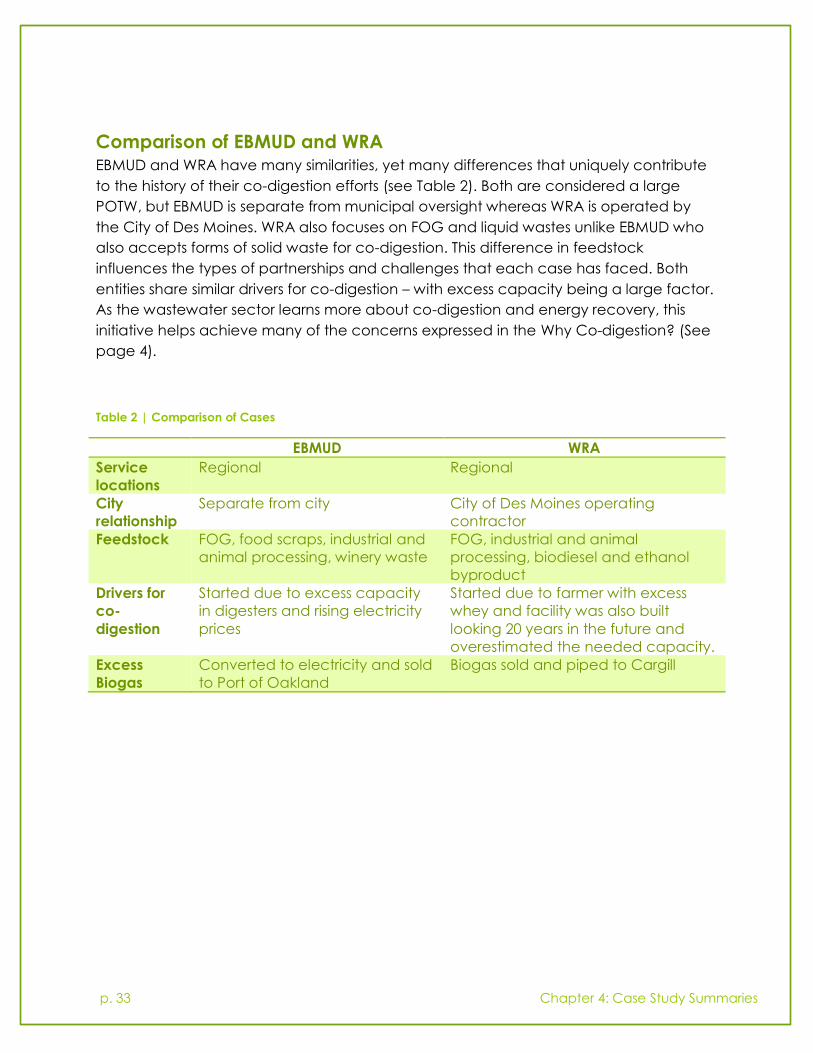
p. 33 Chapter 4: Case Study Summaries
Comparison of EBMUD and WRA EBMUD and WRA have many similarities, yet many differences that uniquely contribute
to the history of their co-digestion efforts (see Table 2). Both are considered a large
POTW, but EBMUD is separate from municipal oversight whereas WRA is operated by
the City of Des Moines. WRA also focuses on FOG and liquid wastes unlike EBMUD who
also accepts forms of solid waste for co-digestion. This difference in feedstock
influences the types of partnerships and challenges that each case has faced. Both
entities share similar drivers for co-digestion – with excess capacity being a large factor.
As the wastewater sector learns more about co-digestion and energy recovery, this
initiative helps achieve many of the concerns expressed in the Why Co-digestion? (See
page 4).
Table 2 | Comparison of Cases
EBMUD WRA
Service
locations
Regional Regional
City
relationship
Separate from city City of Des Moines operating
contractor
Feedstock FOG, food scraps, industrial and
animal processing, winery waste
FOG, industrial and animal
processing, biodiesel and ethanol
byproduct
Drivers for
co-
digestion
Started due to excess capacity
in digesters and rising electricity
prices
Started due to farmer with excess
whey and facility was also built
looking 20 years in the future and
overestimated the needed capacity.
Excess
Biogas
Converted to electricity and sold
to Port of Oakland
Biogas sold and piped to Cargill

p. 34 Chapter 5: Case Study Findings
Chapter 5: Case Study Findings
This research identified four potential institutional barriers; cultural, social, economic,
and political/regulatory (see Chapter 2, p. 9). Based on a synthesis of the document
review and interviews, only economic and regulatory/political barriers cause the most
prevalent issues to co-digestion efforts. Cultural and social barriers, on the other hand,
do not appear to impede efforts as much. The purpose of this chapter is to answer the
two main research questions by delving into further detail about those barriers as they
relate to the two case studies as well as expand upon the role the cities can have in this
process.
Economic
Consistent with the literature, findings show economics as both an
opportunity and a constraint. The potential revenue from taking in
feedstock and saving money on electricity costs makes it an
opportunity. To elaborate, the facility typically uses the tipping
fees from hauled waste to maintain the program; if co-digestion
produces enough biogas for the facility to sell to a willing buyer,
the utility generates even more revenue. Utilities save on electricity cost by using the
biogas with a combined heat and power (CHP) system at the plant to satisfy the plant’s
energy demand. Despite these opportunities, several issues still cause economic worries
for utilities and their partners, such as lacking a steady stream of feedstock, dealing with
contamination, facing an increased competition for feedstock, and the market’s role.
Lack of a Steady Stream of Feedstock
Without a steady stream of feedstock, generating a constant production of biogas is
difficult. Facilities desire a constant supply of feed for several reasons. It ensures enough
biogas will be produced to heat and power the plant throughout the week, without
needing to rely on the grid. Additionally, it increases reliability for a buyer and helps
them better anticipate when they can expect to receive the electricity or biogas. Both
case studies reveal that the facilities receive the most waste during weekdays, which
makes it difficult to generate a constant production of biogas on weekends. This
increases difficulty in scheduling exports of energy with buyers, like in the case of Pacific
Gas & Electric (PG&E) and East Bay Municipal Utility District (EBMUD).
Aside from generating a reliable supply, fluctuating amounts of feedstock makes it hard
to strategically recoup revenue. Electricity prices can fluctuate throughout the day,
week, and season, and supply and demand affect prices. If wastewater utilities cannot

p. 35 Chapter 5: Case Study Findings
control when they are able to generate the electricity to sell to electric utilities, the
wastewater utilities cannot try to sell when value is highest during the day. WRA has
addressed the issue of receiving a constant stream of feedstock by building a holding
tank which will help control the rate the feed enters the digesters. However, creating a
storage tank will not completely guarantee a steady stream. WRA also keeps its
receiving station open 24/7. Overall, utilities may need to consider extending their
receiving times, developing infrastructure to store waste, and understanding that
maximizing revenue may not always be attainable.
Contamination
Utilities accepting other forms of waste (i.e., outside of sludge) will need to address
contamination issues to preserve equipment and address environmental impacts. If
they do not, utilities may have to incur costs to fix and frequently maintain the
equipment, and partners will have to spend more money to figure out better ways to
pre-process the material. Participants, who bring the waste to the facility, are typically
responsible for pre-processing the material. As demonstrated in the EBMUD case study,
pre-processing occurs off- site and can be expensive. EBMUD’s partners, Recology and
Central Contra Costa Solid Waste Authority (CCCSWA), used different strategies to
approach pre-processing. Recology has a costlier process; they use a pre-processing
facility prior to bringing it to EBMUD. This strategy has appeared to cause operational
headaches as new materials are introduced. Recology also wanted to open a facility
on EBMUD property, and this process had resulted in a lengthy permitting process.
On the other hand, CCCSWA wanted to avoid the capital cost required to develop a
pre-processing facility, and instead developed a program where the generators (e.g.,
restaurants, grocery stores) properly dispose (i.e., pre-process) of the material.
Successful participation and disposal practices hinged on mandatory training,
monitoring, and outreach materials for prospective and current participants; they are
key components of this program (Food Recycling Project, 2011). Given the positive
responses and recognition of the program, pre-processing at the source offers a
promising way for agencies/solid-waste haulers to avoid a costly process. However,
such a program requires thoughtful and careful development and should gradually
increase its participants. If generators do not have a clear understanding of proper
disposal, why proper disposal is important, and what is done with the material, it can still
lead to contamination issues. It is not clear what steps Recology has taken with its multi-
family waste program, but, as the case study indicates, that source of feed still has
problems with contamination. The EBMUD-CCCSWA-Allied partner case study has
shown that engaging food waste generators in proper education and outreach can go
a long way in addressing contamination concerns and is a great way to increase
awareness while minimizing hefty pre-processing costs.

p. 36 Chapter 5: Case Study Findings
Competition for Feedstock
When a utility embarks on a co-digestion project they are on a path filled with
possibilities, making it seem as enticing as an insect flying into a bright light. Ultimately,
this creates an increased competition for feedstock. However, both EBMUD and the
WRA conflict each other, illustrating that this isn’t always the case. Competition is
dependent on the region and its industrial economy.
Due to its success, EBMUD has seen increased competition
for feedstock. Now that others have seen this process work,
their interest in it has grown. Former and current EBMUD
industrial customers, as well as other utilities, are starting to
embark on these efforts themselves. On the other hand,
WRA has its pick of the litter and is almost at capacity. A
likely reason for the steady demand is because Iowa is the
nation’s leading producer of ethanol and biodiesel.4 Both
ethanol and biodiesel create a byproduct that is digestible. Furthermore, a WRA
interviewee explained that when the WRA was still emerging its co-digestion efforts, the
methane produced from WRA counted toward the biodiesel tax credits for producers
who took their waste to WRA. Essentially, this demand has allowed WRA to pick and
choose which type of substrates to put in the digesters, because some wastes produce
more energy than others.
Overall, the conflicting data indicates that competition for feedstock is dependent
upon the regional industries and economy. In an area where competition is high,
EBMUD uses pragmatic thinking and planning. With awareness that they might lose a
stream of products, EBMUD constantly looks for new sources and long-term contracts.
They have already started doing this, which is a main reason why they’ve still
experienced increases in revenue, aside from the fact that some existing customers
have increased the amount of feedstock they provide.
Due to the benefits it would not be a surprise if co-digestion efforts become common
practice and naturally increased competition regardless of regional economies. Both
WRA and EBMUD have long-distance clients that continue to haul resources to them
because it is currently the best option. If this idea becomes mainstream, businesses will
likely start bringing waste to nearer facilities for economic savings and environmental
benefits of reducing greenhouse gas (GHG) emissions due to travel. An EBMUD
interviewee grounded this thought by stating if the utility is using co-digestion to help
reduce emissions and improve the environment, pragmatism makes sense and part of
the solution is took for sources closer to EBMUD.
4 Standings are according to the U.S. Energy Information Administration and Iowa Renewable Fuels Association.
Food for thought
“They say imitation is the
best form of flattery.”
- EBMUD Interviewee

p. 37 Chapter 5: Case Study Findings
Role of the Market
When utilities generate excess biogas they have two
options. They can either burn the methane or look for a
willing buyer to sell the biogas as gas or converted
electricity. The latter option is dependent on the current
energy market. For example, when the Des Moines WRF
started to produce excess biogas they considered
purchasing a generator to produce electricity with the
hopes of finding a buyer to purchase the electricity.
However, the region already had low prices which made
this option uneconomical (Greer, 2011). If market prices are low for electricity, utilities
can still attain success by looking for partners that would purchase biogas directly, like
the Des Moines WRA- Cargill partnership.
Even if low electricity prices encourage utilities to sell the biogas itself, the use of biogas
can be limited as well. Biogas cannot be a direct substitute for natural gas without
additional cleaning. Biogas is around 60% methane and 40% carbon dioxide; the
composition varies based on the type of waste used for digestion. Natural gas is mostly
methane so natural gas utilities typically require methane to make up almost all of the
gas (i.e. ~97%). They have specifications on acceptable grades, which also include
removing other constituents, especially because if the grade is not similar it can cause
corrosion in the pipe along with other issues. Because the process of cleaning and
upgrading biogas to a quality that natural gas utilities might use is cumbersome and
expensive, it is even difficult to entice natural gas utilities to become a buyer. Biogas
can also be converted to compressed natural gas and used as vehicle fuel; however,
the challenges to utilizing biogas for that market is outside of the scope of this paper
since that was not a major theme for either case study.
Regulatory/Political
Many actors involved in both case studies experienced
regulatory/political barriers during all stages of the co-digestion
process. In some cases the barriers impeded the progress of
actors when they tried to build new pre-processing facilities,
whereas other times they affected utilities’ opportunities to sell
excess biogas. Local regulations also play a key role in supporting
co-digestion efforts, but without proper planning or collaboration these regulations can
undermine efforts. The main regulatory/political barriers discovered in these case
studies include sale of renewable electricity due to state regulations, lack of
state/federal funding and tax credits, duplicative permitting processes, and effective
fats, oils, and grease (FOG) ordinances.
Food for thought
Not doing anything with excess
biogas, “is like burning a
suitcase full of money!”
-Interviewee

p. 38 Chapter 5: Case Study Findings
Sale of Renewable Electricity Due to State Regulations
Depending on states’ political environment, regulations may limit what type of benefits
utilities can recoup from selling biogas or electricity generated from biogas. For
example, utilities may be ineligible from receiving particular credits simply because they
already have a long standing power purchase agreement, like in the EBMUD case
study. In 2006, California adopted senate bill (SB) 107 which required 20% of total
electricity sold to retail customers to be from renewable energy credits (REC) by the
end of 2010. Part of the idea was to improve competition for existing in-state renewable
electricity generation facilities and accelerate California’s Renewable Portfolio
Standard (RPS). Therefore, the regulation stated that any electricity generated under a
contract prior to 2005 was not eligible to receive RECs. EBMUD ran into issues with this
contingency in 2012 when it installed the new generator and became a net producer
of energy. This was a time where RECs were worth more than energy prices in wholesale
markets,5 but because EBMUD’s power purchase agreement (PPA) with PG&E started in
1986 they could not sell RECs. Therefore, to capitalize on the RECs and their market
prices, EBMUD had to seek out a new contract which ended up being with Port of
Oakland. Overall, this decision has been a financial success for EBMUD. One year into
the PPA with the Port of Oakland, EBMUD had sold 12,465 MWh for a total revenue of
$908,000 (Horenstein, 2014), a 67% increase in sales compared to what sales would
have been with the old PG&E PPA.
This highlights the economic benefit of selling renewable energy; however, these
projects require years of evolution to produce large amounts of biogas. Utilities need to
be aware of how regulations can undervalue these efforts. Policy makers should also
understand how these processes evolve to hopefully create some flexibility in these
regulations.
Lack of State/Federal Funding and Tax Credits
Due to institutional and intergovernmental disconnect, utilities can experience a lack of
funding to support co-digestion efforts. One interviewee at WRA said that many
state/federal funds make government or municipal entities ineligible and instead focus
on private companies producing renewable energy. The interviewee suggested that
this occurs because other strategies such as methane recovery at landfills receive more
attention, and higher forms of government are unaware of what public utilities consider
new progressive ideas (i.e., utilities can create energy from waste more efficiently than
from landfills or burning it). Although EBMUD and WRA are larger utilities, interviewees
from these entities mentioned that it is likely more cumbersome for smaller utilities to
obtain monetary resources to kick off a project, especially when funding lacks. EBMUD
and WRA are large and can use other strategies, like issuing bonds. Aside from funding,
5 During this timeframe RECs were $35/MWh and regional wholesale peak power prices on the market were $24-33/MWh.

p. 39 Chapter 5: Case Study Findings
tax credits were another concern. The same WRA interviewee mentioned that it is
difficult for government agencies to get credit for reducing GHGs and producing
biofuels. Unfortunately, these issues are remote barriers that utilities cannot always
rectify with direct action. Instead, proper outreach and education to higher forms of
government and state and federal agencies will continue to be necessary.
Duplicative Permitting Processes
Contamination, as previously mentioned, can be a big issue for utilities accepting
different forms of organic waste. As solid waste partners look at developing pre-
processing facilities to treat the waste before bringing it to the plant, duplicative
regulatory oversight can slow the process. This slowing process most likely occurs
because these projects are the first of their kind in the area or region and require
agencies to work out regulatory pathways. For example, Recology has worked with
EBMUD to locate a pre-processing facility on the treatment site. In 2012 the application
process faced issues with duplicative regulatory oversight of the trucked waste program
because the material still fell under solid waste jurisdiction causing project delays. Since
Recology approached EBMUD about a pre-processing facility in 2011, it has taken three
years to obtain the necessary permits (see Recology p. 23). CCCSWA also experienced
similar issues when it wanted to locate a grinding facility6 closer to EBMUD’s facility;
additional permitting requirements delayed the process and increased project costs
because they needed to continue transporting waste to a grinding facility that was
further away.
Aside from dealing with this duplicative oversight on a case-by-case issue for pre-
processing or grinding facilities, California has been trying to address this duplicity in a
larger context. The state of California has two agencies, CalRecycle and the Regional
Water Boards, both of which have been trying to work out a regulatory pathway
outlining which agency should be responsible. The two discussed if permit operations at
POTWs that accept FOG and other waste used in digesters can be exempt from
CalRecycle permitting since the waste stream is already regulated under the
wastewater facility’s NPDES permit. The overall goal is to only have one agency
regulate this activity – preferably the Regional Water Boards (Howard, 2011). A
proposed solution that the two agencies discussed was the idea of putting a standard
provision in the NPDES permits that requires POTWs to develop and implement standard
operation procedures for waste fats, oils, and grease acceptance and digestion
operations.
California has a progressive solid waste reduction strategy as highlighted in Appendix B
(p. 59), which has caused many counties and cities to adopt zero waste goals or to
take progressive action to reduce the amount of waste going to landfills. This
6 A grinding facility grinds the material to be less than two inches in size. It is different than a pre-processing facility, which removes contaminants prior to grinding.

p. 40 Chapter 5: Case Study Findings
environment has supported and driven co-digestion partnerships as highlighted in the
EBMUD case study. However, with a lack of foresight on what strategies the solid waste
sector might take to reduce the amount of material going to landfills, agencies have
not been able to establish regulatory pathways to allow for a seamless transition when
new methods are executed, as highlighted above. Further research on this issue can
establish a better understanding of how cross-sector agency collaborations can help
facilitate and anticipate what regulatory pathways should receive attention.
Effective Fats, Oils, and Grease (FOG) Ordinances
Cities are beginning to implement FOG ordinances to prohibit the material from
entering the sewers. Sometimes cities voluntarily implement the ordinance but the
Environmental Protection Agency (EPA) can also mandate it, like in WRA’s case,
because FOG can cause blockages in the sanitary sewer system and contribute to
overflows. The increase in sanitary sewer overflows has the EPA alarmed, and the
agency estimates that almost half of overflows are due to blockages, and of these
blockages half are FOG-caused, contributing to 5,000 to 17,000 overflows annually
(Tupper & Skoda, 2008). For these reasons, agencies and cities have a growing focus
on FOG prevention.
Cities run into problems if they do not fully develop the program prior to adopting the
ordinance. One issue is the general maintenance of the grease traps and interceptors
at food service establishments (FSEs). If cities expect the FSEs to do it on their own,
maintenance may not be frequent enough to prevent FOG from entering the sewers.
However, it isn’t enough to simply require maintenance; cities need to determine a way
to monitor if the maintenance is actually occurring. In the Des Moines metro area, WRA
addressed this by requiring the FSE to have a certified hauler bring the FOG to the WRF
quarterly or when the grease interceptors reached 25% of their design capacity. This
requirement addresses both issues by allowing the WRF to track who is maintaining their
traps and interceptors while allowing the WRF to use the FOG for co-digestion. To
address political concerns with this requirement, WRA offers a discounted rate so they
do not make money off of the tipping fees. Offering a low price helps insure that FSEs
don’t have an incentive to beat the system.
Even though the Des Moines metro area implemented the ordinance in 2006, interviews
indicate that it has only been heavily regulated in the last five years or so. Many
restaurants in the Des Moines area have quarrels with the ordinance because of the
cost to install grease interceptors. If renovations are needed, some restaurants can
expect installation of a grease interceptor to cost $50,000. This has made it cost-
prohibitive for restaurants to keep certain parts of their kitchens in operation or from
opening new restaurants. Some of the strict regulations also cause restaurants owners
and chefs to have issues with the ordinance. For example, in the WRA case, one
executive chef interviewee said the ordinance required a grease interceptor at the

p. 41 Chapter 5: Case Study Findings
bar, which only drains beverages. These types of seemingly unnecessary requirements
convey inflexibility and distrust. Lastly, the interviewee thought the greater restaurant
industry in the area seems to have a loose awareness of what happens to the FOG
after it is collected (i.e., used for co-digestion). Regulations often have a negative
connotation; explaining the positive benefits of what is done with the FOG can elicit a
sense of self pride and a deeper appreciation for the positive impacts of participation.
These concerns suggests that outreach and education needs to be an ongoing
process, collaboration could be strengthened when developing and amending the
ordinance, and other benefits outside of reducing overflows and blockages can be
promoted more.
Cultural Compared to regulatory and economic issues, cultural barriers in
the co-digestion realm are not as inhibitory. Based on the research
and interviews, utilities do not experience many cross sector (e.g.,
waste and water) barriers in terms of developing partnerships. The
regulatory solid waste framework that is already in place in
California is likely instrumental in allowing these cultural
relationships to flourish. Most barriers utilities encounter are internal. Despite the positive
cultural environment, the biggest cultural issue that emerged is an external one. Cities’
involvement in this process has not reached its potential, and their role is still not fully
understood.
Internal - Utilities
Both the EBMUD and WRA case studies suggest that cultural institutions are replaced
before regulatory and economic for co-digestion. Based on an EBMUD interview,
EBMUD’s co-digestion efforts were largely staff driven; they were not something that
came from the top down. In fact, the role of the Board was to support the staff, and
EBMUD’s values and goals cultivated an environment to encourage this project. For
instance, EBMUD has plans and a sustainability and energy committee. Additionally,
when EBMUD wanted to move forward with the project, its constituents were in favor of
the idea.
Although both utilities create an open environment for new ideas, cultural barriers are
not completely absent when new ideas are developing. At EBMUD, a lot of waste
comes from different companies, like Foster Farms, who brings animal processing waste.
Early on, one staff member expressed concern about dealing with chicken blood.
Although a minor and unique instance, it is a reminder that changes in the process can
be unfamiliar and concerning for staff. For WRA, one of the biggest challenges was
getting the utility in the mindset of trying something new (Pahl, 2012). Compared to co-
digestion, the conventional way of doing things (i.e., flaring excess gas) requires less

p. 42 Chapter 5: Case Study Findings
thought and coordination. For operators in particular, this involves a change in routine
and more risk. One interviewee mentioned that operators have an increased risk
because they need to learn how to treat these new wastes and still stay in compliance
with the plant permit. Part of this requires utilities to decide what types of waste are
feasible to even accept. To address these concerns, WRA has a three-year
apprenticeship program that requires taking college credit classes and getting hands
on experience. Co-digestion is one of the areas required for hands on experience.
Operators must pass the co-digestion part of the apprenticeship program to work at the
facility.
Overall, both EBMUD and WRA recognize staff for their excellence which facilitates an
open environment for innovation. This can largely be due to the identity change
wastewater treatment plants have undergone over the past few decades. Wastewater
utilities are now more frequently thought of as a business.
External - Cities
Public utilities can be municipally owned or cooperatively owned (i.e., owned by their
customers), which usually plays into the city’s relationship and involvement in the
process. When wastewater utilities are not municipally owned, their relationship with the
city can be less intimate. For example, EBMUD is a regional utility district that is separate
from the cities it provides services for; therefore, maintaining close one-on-one working
relationships with the cities is difficult for EBMUD. The nature of the city-utility relationship
does have much crossover outside of coordinating maintenance of their systems. This
distant relationship makes it hard to develop city champions for co-digestion, more so
when cities do not have a large interest in this initiative. An EBMUD interviewee
mentioned that for the most part, cities have not expressed significant amounts of
interest in co-digestion efforts. However, the interviewee also thought that the District
has more responsibility to reach out to the city on these efforts than vice versa.
“The sewage treatment plant was where you put all the rejects, people that
didn't get along with anyone, people who didn't do any work. Today we are one
of the best paying government positions. We pay high and also have some
recruits because of that. We have great new technologies that we are working
with. Every day we work with many types of engineering firms. It's gone from
being a bad job to being a job that people are proud to work for.”
- WRA Interviewee

p. 43 Chapter 5: Case Study Findings
On the other hand, when cities have some involvement with the WWTP, like in the WRA
case, the city has greater potential for direct contact with the utility. However, this
potential is not fully developed because municipal departments, like planning or public
works, tend to rely on the wastewater organization to carry out activities, as in the case
of WRA. This dependence prohibits cities from playing a larger role in these efforts.
Throughout the research, a general disconnect or lack of understanding of the city’s
role in this process became transparent through contacting city staff and officials for
potential interviews. When reaching out to various departments in the City of Des
Moines, many recommended contacting the WRA to discuss this research. Ultimately,
this disconnect makes it hard to establish city champions. WRA has experienced
difficulty in obtaining city officials to champion the efforts even though the program has
experienced great accomplishments, like generating 75% of its own energy.
Part of the issue is that this type of activity is off of people’s radar compared to more
visible efforts (e.g., rain garden, low hanging fruit). As the literature states, “wastewater”
is a concept that receives little attention. One way WRA continues to work on building
city champions is by developing benchmarks and measures. The WRA uses these to
evaluate and compares itself to other leading utilities in the country. WRA sends these
findings to the City Manager and Mayor to increase awareness.
Although utilities and their partners have overcome several cultural barriers in co-
digestion projects, the city-utility role continues to face challenges. City involvement is
essential for proper political, economic, and regulatory support. The Role of Cities
section on page 45 elaborates on this topic.
Social
Like cultural barriers, social barriers do not readily impede co-
digestion efforts. The most prevalent social concern is the odor
associated with incorporating the different forms of waste into the
digestion process. Odor concerns are present throughout the
entire process, starting with collecting the waste all the way
through to digesting it. The most notable barrier is the lack of
public involvement or awareness. Perhaps it is not a barrier in itself, but it hides what
other concerns might be present and inhibits the public’s ability to support and
participate in this process.
Odor
Odor is the most apparent concern and both utilities and participants bringing waste to
the facilities have experienced problems with this. In the San Francisco Bay area, cities
near EBMUD are doing lots of development which has resulted in condos and
apartments in close enough vicinity for tenants/owners to give odor complaints. An
EBMUD interviewee explained that most of the time this is due to problems with the

p. 44 Chapter 5: Case Study Findings
digesters; for example, human error due to new staff or the tops of digesters failing. To
rectify the problem, EBMUD is considering installing a new system to prevent that from
happening. Similarly, when waste is trucked in everyone involved needs to develop and
learn new techniques to minimize odor. Odor is an issue that requires constant
improvement, and actors attempt to address it through different disposal methods prior
to collection and updating technology.
Public Awareness
Document review and interviews for both the EBMUD and WRA case studies indicate
that public awareness about co-digestion is minimal. Even during public review periods
for permitting processes or projects, comments were minimal to none. This corroborates
the out-of-sight-out-of-mind mentality discussed in Chapter 2: Institutional Barriers . It
makes it hard to predict the public’s feelings about co-digestion projects. However,
when asked about social barriers, several interviewees thought the public has a
growing awareness about fossil fuel prices, GHGs, and that the energy economy is in
transition, which might make them more accepting of the idea. One of the biggest
obstacles, consistent with the literature, is that most people are not technically based;
in other words they don’t have a solid understanding of how the wastewater process
works and what different strategies entail. Instead they rely on preconceived notions.
Part of that stems from the conventional way the public has been educated about the
water sector (i.e., black box). Nonetheless, it is important to engage the public early on
in these initiatives to avoid contributing to any mistrust that might develop as a result of
lack of discourse, which literature has pointed out as a social barrier for innovative
water projects.
Most importantly, a lack of awareness indicates that the public might not even be
aware of what their role in the co-digestion process could be. For example, in the City
of Oakland, residents are not required to have a green bin (i.e., yard trimmings and
food scraps). They need to contact the contracted solid waste and recycling
company to obtain one. If the city moved forward to require a contractor to bring
waste to EBMUD to generate renewable energy; the amount of material brought to the
facility would be heavily dependent on residents’ participation. These issues again stress
the importance of outreach and education and how important the role of the city can
be. To get residents engaged and aware of these efforts necessitates the city‘s
development of a marketing program for residents. The idea is similar to what the
CCCSWA did for the Food Recycling Project; participants are voluntary and are not
forced to participate in the program.

p. 45 Chapter 5: Case Study Findings
The Role of Cities
The cultural, regulatory, and social barriers mentioned above
stress the importance of cities’ involvement in co-digestion efforts.
The previous sections of this chapter focused on answering the first
research question, what are the barriers and how are they
overcome? This section focuses on answering the second
research question, based on the barriers does this give planners a
role in co-digestion? The answer is yes. Cities’ key roles center on two main topics, FOG
and food waste management. They have the influence to control what happens to
both FOG and food waste, which have monumental benefits to co-digestion and
renewable energy efforts.
FOG
Cities are responsible for their own sewer maintenance
before it enters the larger collection system, as is the case for
EBMUD and the Des Moines WRA. Any city naturally wants to
preserve its sewer system; by prohibiting FOG from entering
the system, they have generated a feedstock for their local or
regional wastewater utility. Even though several other forms of
organic waste also serve as feedstock, FOG is a highly
desirable commodity since almost all of it is converted to
biogas when digested. Not all organic wastes produce the
same amount of biogas, some produce more biosolids than
biogas and some produce more biogas than biosolids
(Burger, 2003).
Food Waste Management
Cities provide or contract out services to handle municipal
solid waste. They also set waste management strategies
and policies and therefore, influence how food waste is
handled. Research has shown that using food waste for co-
digestion has a smaller carbon footprint than other
treatment methods cities might use (Parry, 2013b). Not only
does using collected food waste for direct anaerobic
digestion (AD) through co-digestion have a lower carbon
dioxide value than other food waste disposal methods, it
actually has negative carbon dioxide emissions due to its
potential to generate electricity (Parry, 2013b). If cities are
searching for ways to reduce GHG emissions, using co-digestion can be an excellent
strategy to consider.
Figure 9: FOG in a sewer
Credit: Georgetown
Figure 10: Food waste
Credit: Letsrecycle

p. 46 Chapter 5: Case Study Findings
Considering the benefits described above, cities can leverage their position to help
catapult co-digestion. In the EBMUD case study, the City of Oakland uses a franchise
system for contracting solid waste haulers and recycling companies, which is common
in California. The city adopted a resolution for contractors to consider biowaste-to-
energy by bringing acceptable waste to EBMUD. A city pushing for their franchise
partners to do this solidifies utilities’ efforts. It is important to note, not all cities use a
franchise system. Some provide their own services, which gives them more control over
how they want to dispose of waste and expedite the process. Using the cities’ food
waste for co-digestion allows the utilities to secure feedstock closer to the plant and
opens up another avenue for utilities to obtain a stream of products as competition
increases. Obviously, the city’s involvement is more influential and beneficial if the utility
is municipally owned. However, even if the utility is cooperatively owned, cities can use
these strategies to meet landfill diversion goals, resulting in win-win benefits.
One concern that recycling contractors may have is the economic impact that
biowaste-to-energy requirements will have on their operations. Cities will need to be
patient and work through the contracting process with understanding and identify
where they can help. The City of Oakland is addressing this by requiring the potential
contractor to do a cost-analysis prior to making a decision. Similarly, if cities provide
their own services, they can develop policies and work with the utilities to implement a
collection program that will help with co-digestion. In this way cities can become
champions of the project since research indicates that cities lack champions for these
efforts.
p. 47 Chapter 6: Recommendations
Chapter 6: Recommendations
The analysis of the East Bay Municipal Utility District (EBMUD) and the Des Moines
Wastewater Reclamation Authority (WRA) cases is just the start of a conversation about
what types of institutional barriers co-digestion projects encounter. This research
intended to identify a few aspects of how co-digestion efforts and challenges can be
approached when cities, partners, and utilities are considering or are in the early stages
of co-digestion projects as well as create an awareness of the potential role cities have.
Although the previous chapter alluded to some general conclusions about the types of
barriers and suggested strategies to help ameliorate struggles, this section’s intention is
to provide key recommendations to help facilitate co-digestion efforts in a larger
context.
Develop market assessments of organic waste and training programs for appropriate
staff.
Who: Wastewater utilities
Utilities will undergo several iterations in refining a new program. Co-digestion is gaining
popularity which has increased a demand for research on this topic. Therefore,
engineering firms, the Environmental Protection Agency (EPA), and research
foundations, like the Water Environment Research Foundation, are conducting research
to better understand environmental and economic impacts of handling organic waste.
While knowledge develops on this topic, most utilities have figured out a strategy to
create a successful program on their own through trial and error and undergoing
iterations, which often contribute to operators being wary about new efforts.
Essentially this means that some of the technical details still need ironing out. For
example, the wastewater sector continues to learn about loading rates7, the amount of
methane organic substrates produce8, and greenhouse gas (GHG) emissions for co-
digestion. Since different types of organic waste produce different levels of energy,
(Parry, Vandenburgh, & Fillmore, 2012) it is important for utilities to evaluate
performance and effectiveness for different types of feedstock. While this information is
still developing, utilities can perform an analysis of potential types of waste streams in
their local and regional area. Based on what is already known about how these
different wastes perform, utilities can create a priority ranking and develop a strategy
for what type of material will be most useful for them. In turn, this might give utilities a
starting point to evaluate economic potential of customers’ waste and who they might
7 The amount of solids and liquids a digester receives each day. 8 Also referred to as the biochemical methane potential.
p. 48 Chapter 6: Recommendations
want to target as potential partners right off the bat, especially if there is a concern for
increasing competition. This not only gives utilities a better understanding of the
surrounding market, but also gives cities and companies an idea of the value of their
“stock.” Performing a preliminary analysis to help utilities develop a plan that will
provide the most profit (i.e., the most energy produced) might also give some
reassurance to help compensate for the lack of funding and economic woes.
In addition to performing an analysis, training can help ease internal worries about how
co-digestion might affect or change standard operating procedures. If more hands on
training and site visits are available for operators, like in the case of Des Moines WRA, it
will increase confidence and assurance.
Establish and strengthen communication and collaborative networks between cities
and utilities.
Who: Wastewater utilities and cities
Cities need to be a bigger promoter of and become familiar with co-digestion,
especially because research has identified fats, oils, and grease (FOG) as a desirable
source of feed for anaerobic digesters at wastewater facilities, and using food waste for
AD greatly reduces GHG emissions. For these reasons, if cities have zero waste goals or
a general desire to reduce the amount of material going to landfills, reaching out to its
local/regional wastewater utility should be the first step. To address this, cities should
dedicate a champion who stays up-to-date on what utilities are doing, identifies ways
the city can be involved, and infuses collaborative concepts to city officials and
appropriate departments.
It is also wise to have an awareness for what utilities are doing because research has
shown that co-digestion at wastewater facilities can be more economically favorable
than creating a standalone facility for anaerobic digestion(Parry, 2013a). Therefore
regardless of whether a utility is municipal or cooperative, cities should consider a
utility’s plans because if a utility currently or in the future has plans to open its doors to
co-digestion, its tipping fees will most likely be lower than a standalone facility since the
standalone would need to cover the capital costs. Infrastructure already is in place at a
WRF. Pragmatically, companies will bring their business to the most affordable option.
Cultivate a collaborative strategic public outreach process for the development of a
FOG ordinance with food service establishments.
Who: Cities and wastewater utilities
When developing a FOG ordinance, this research indicated that cost and
maintenance are two concerns that need attention. Cities need to require a
maintenance schedule to ensure that food service establishments (FSEs) do not let
grease traps and interceptors overflow, and restaurants should not feel crippled by the
cost of adding a grease trap or interceptor. A strategic public engagement process

p. 49 Chapter 6: Recommendations
with restaurant owners, chefs, managers, etc. could help address cost concerns. If
utilities, FSEs, and cities can build trust and develop proper training methods, ordinances
may not need to be so strict. Furthermore, the outreach process can continue to
increase the awareness of why there is a need for FOG ordinances while promoting the
benefits of how FOG can be used.
One potential way to address cost concerns could be giving out a tax credit or rebate
for FSEs to help offset some of the costs of installing grease traps and interceptors.
Utilities could set aside a percentage of the revenue generated from co-digestion to be
used for this purpose, and cities can also contribute a portion of their budget as well.
One example that supports this approach is the FOG program the San Francisco Public
Utilities Commission (SPUC) has developed in collaboration with restaurants. The two
groups have worked to create a program that will address restaurant needs and the
city’s concern with FOG. To help offset the cost of installing grease traps or interceptors,
the city will reduce sewer rates for the restaurants that install them for two years (Larson,
2010). SPUC suspects that will give restaurants enough time to rebound from the cost,
and even though the city may need to compromise temporary revenue, the long term
benefits of avoiding sewer repairs to due to blockages and the potential energy
generation from utilities outweighs the short term loss. Aside from helping restaurants
recoup the costs of adding necessary infrastructure, utilities, restaurants, and cities can
collaborate to develop flexible solutions for restaurants or parts of restaurants that do
not intend to generate a lot of grease. One example would be to develop a piping
system that bypasses the sanitary sewer and disposes into a grease interceptor in the
back of the building. These are just a few ideas to help facilitate a more flexible and
collaborative process.
Take a top-down and bottom-up approach to encourage co-digestion efforts.
Who: States and cities
All actors involved in co-digestion experience barriers that originate from varying levels
of government or organizations. For example, partners bringing waste to facilities seem
to experience more regulatory barriers that require top-down attention to sort out
regulatory pathways and to address overlapping jurisdictions, both geographically and
across sectors (i.e., water and waste). Ironing out these pathways can grant all parties
smoother implementation. This requires state and local agencies to be proactive and
set up these frameworks to encourage and facilitate these projects instead of waiting
for projects to become more popular.
A bottom-up approach is essential to allow these types of projects to come to fruition
as illustrated in both case studies. Utilities need to encourage an open-door policy and
creativity in their staff to develop that type of environment, and will need to continue to
reflect and improve in order to remain innovative and strategic. A bottom-up
approach will also help strengthen relationships between cities and utilities. The biggest
p. 50 Chapter 6: Recommendations
stepping stone is developing a constant flow of communication and brainstorming that
creates a mutually supportive environment. This will allow cities to be more aware of
and develop policies to support efforts like co-digestion and encourage utilities to
illustrate the benefit of city collaboration and engagement.
Use creative funding sources when funding lacks.
Who: Utilities
From a general perspective, it seems like most funding is geared toward pilot projects
and feasibility studies to build knowledge about co-digestion projects. Funding is a
remote issue that utilities have little control over; luckily EBMUD and WRA found
successful partnerships to sell biogas/energy as part of the process. If utilities are having
difficulty in obtaining funding sources, they can start conversations with potentially
interested companies or utilities in purchasing excess biogas. For example, they can
consider power purchase agreements (PPA) with local electric utilities, assuming the
market encourages this partnership, unlike the case of WRA. The EPA has created a
helpful fact sheet to explain how a PPA works and the benefits it can provide.9
Essentially this gives utilities reassurance that they can generate some revenues outside
of tipping fees. One interviewee from WRA also recommended that education
outreach to get agency buy in is crucial so those agencies can educate others and
hopefully advocate for these efforts. By starting conversations early on, it may give
utilities a better idea of what to expect.
Further Research
Again, the purpose of this research was to bridge the gap between academic
literature and grey literature on what institutional barriers co-digestion projects face.
Many of these findings are preliminary in nature and can be corroborated or
contradicted with future research. Additionally, investigating these two case studies did
not find certain barriers to be a great issue, which is opposite of what the literature
suggested. This does not mean that they do not exist, but perhaps were not a large
factor given other variables. For example, literature suggests that air quality regulations
can play an impeding role in co-digestion efforts along with the quality of soil
amendment (Parry, 2013a; Willis et al., 2012), but in these case studies, these issues have
not surfaced as a vital roadblock from a social or regulatory perspective.
In the EBMUD case study, the setup of California’s and its cities’ existing solid waste
goals and regulations to achieve zero waste and divert organics from landfills was
instrumental in cultivating an environment for successful relationships between the solid
waste and wastewater sectors. This is not the case for every state; therefore, further
research on how partnerships develop with utilities that receive solid organic waste10 in
9 For more information: http://www.epa.gov/region9/waterinfrastructure/docs/water-sector-ppa-factsheet.pdf 10 Food scraps is an example of solid organic waste compared to FOG which is a liquid organic waste.

p. 51 Chapter 6: Recommendations
other states should be explored. This will provide more information on whether or not the
cultural barriers differ from this research’s findings.

p. 52 Bibliography
Bibliography
Board, D. M. M. W. R. A. (2012). WRA Board Meeting Minues. Des Moines.
Böhm, H. R., Schramm, S., Bieker, S., Zeig, C., Anh, T. H., & Thanh, N. C. (2011). The
semicentralized approach to integrated water supply and treatment of solid waste
and wastewater—a flexible infrastructure strategy for rapidly growing urban
regions: the case of Hanoi/Vietnam. Clean Technologies and Environmental Policy,
13(4), 617–623. doi:10.1007/s10098-011-0378-9
Brewer, G. D. (1999). The challenges of interdisciplinarity. Policy Sciences, 32, 327–337.
Brown, R. R. (2005). Impediments to integrated urban stormwater management: the
need for institutional reform. Environmental Management, 36(3), 455–68.
doi:10.1007/s00267-004-0217-4
Brown, R. R. (2008). Local institutional development and organizational change for
advancing sustainable urban water futures. Environmental Management, 41(2),
221–33. doi:10.1007/s00267-007-9046-6
Brown, R. R., & Farrelly, M. A. (2009). Delivering sustainable urban water management: a
review of the hurdles we face. Water Science and Technology, 59(5), 839–846.
Burger, J. (2003). Perceptions about Environmental Use and Future Restoration of an
Urban Estuary. Journal of Environmental Planning and Management, 46(3), 399–
416.
Cortner, H. J., Wallace, M. G., Burke, S., & Moote, M. a. (1998). Institutions matter: the
need to address the institutional challenges of ecosystem management.
Landscape and Urban Planning, 40(1-3), 159–166. doi:10.1016/S0169-2046(97)00108-
4
Dudek. (2008). Contra Costa LAFCO: Water and Wastewater Municipal Services Review
for West Contra Costa County (p. Section 9 p. 1–8). Martinez. Retrieved from
http://www.contracostalafco.org/municipal_service_reviews/west_county_water_
wastewater/9.0 EBMUD Final.pdf
EBMUD. (2013, October 22). Resource Recovery Program Annual Update FY13
[Presentation]. Retrieved from
http://www.ebmud.com/sites/default/files/pdfs/102213_sustainability_presentations
EBMUD, B. of D. (2012, September 11). Power Purchase Agreement with Port of
Oakland. Oakland.

p. 53 Bibliography
Edelenbos, J., Bressers, N., & Scholten, P. (2013). Introduction : Conceptualizing
Connective Capacity in Water Governance. Burlington, VA: Ashgate.
EPA. (2013). Municipal Solid Waste Generation , Recycling , and Disposal in the United
States : Facts and Figures for 2011 Trends in Municipal Solid Waste in 2011.
Washington DC.
Ferguson, B. C., Frantzeskaki, N., & Brown, R. R. (2013). A strategic program for
transitioning to a Water Sensitive City. Landscape and Urban Planning, 117, 32–45.
doi:10.1016/j.landurbplan.2013.04.016
Food Recycling Project. (2011). The FEBS journal (Vol. 281). doi:10.1111/febs.12678
Gober, P., Larson, K. L., Quay, R., Polsky, C., Chang, H., & Shandas, V. (2013). Why Land
Planners and Water Managers Don’t Talk to One Another and Why They Should!
Society & Natural Resources, 26(3), 356–364. doi:10.1080/08941920.2012.713448
Goldstein, R., & Smith, W. (2002). Water & Sustainability (Volume 4): U.S. Electricity
Consumption for Water Supply & Treatment - The Next Half Century (Vol. 4). Palo
Alto, California.
Gray, D., Suto, P., & Chien, M. (2008, January). Green Energy From Food Wastes At
Wastewater Treatment Plant. BioCycle Energy, 53–59.
Gray, D., Suto, P., & Peck, C. (2008). “ Anaerobic Digestion of Food Waste .”
Greer, D. (2011). Codigestion and cogeneration in des moines. BioCycle Energy, 52(5),
38–40.
Grigg, N. S. (2008). Integrated water resources management, balancing views and
improving practice. Water International, 33(3), 279–292.
Hagey, P. (2011, November). Utility District Ramps Up Food Waste To Energy Program.
BioCycle Energy, pp. 39–40.
Healy, S. (2003). Epistemological pluralism and the “politics of choice.” Futures, 35(7),
689–701. doi:10.1016/S0016-3287(03)00022-3
Herrick, C., Pratt, J., Surbaugh, H., Grumbles, B., Loken, L., & Abhold, K. (2013). Changing
Organizational Culture to Promote Sustainable Water Operations: A Guidebook for
Water Utility Sustainability Champions. Denver.
Hightower, M., Reible, D., & Webber, M. (2013). Workshop Report : Developing a
Research Agenda for the Energy Water Nexus Report.
Horenstein, B. K. (2013, July 18). Food Waste Update [Memorandum]. EBMUD.

p. 54 Bibliography
Horenstein, B. K. (2014, January 23). Wastewater Energy Update [Memorandum].
EBMUD.
Howard, T. (2011, December 6). Permitting Operations at Publicly Owned Treatment
Works (POTWs) That Accept Hauled Waste Fat and Oil [Memorandum]. State Water
Resources Control Board. Sacramento.
Hussey, K., & Pittock, J. (2012). The Energy – Water Nexus : Managing the Links between
Energy and Water for a Sustainable Future. Ecology and Society, 17(1), 31.
Kerr, D. (2010, November 10). EBMUD turns food scraps into electricity. Oakland North.
Oakland. Retrieved from http://oaklandnorth.net/2010/11/10/ebmud-turns-food-
scraps-into-electricity/comment-page-1/
Larson, M. (2010, February). San Francisco Fights FOG. Municipal Sewer & Water.
Retrieved from http://www.mswmag.com/editorial/2010/02/san-francisco-fights-
fog
Marks, J. S., & Zadoroznyj, M. (2005). Managing Sustainable Urban Water Reuse:
Structural Context and Cultures of Trust. Society & Natural Resources, 18(6), 557–
572. doi:10.1080/08941920590947995
Morsen, P. E. D., & Carr, B. S. P. M. (2014). New EBMUD Contract for Commercial Food
Waste Processing [Agenda Report]. Retrieved from
http://www.wastediversion.org/files/managed/Document/1874/Item 10a.pdf
Neuman, M. (2009). Spatial Planning Leadership by Infrastructure: An American View.
International Planning Studies, 14(2), 201–217. doi:10.1080/13563470903021241
Oakland. Waste Collection Franchise Agreement Policy (2014). Oakland City Council.
Office, U. S. G. A. (2011). ENERGY-WATER NEXUS Amount of Energy Needed to Supply ,
Use , and Treat Water Is Location-Specific and Can Be Reduced by Certain
Technologies and Approaches.
Pabi, S., Amarnath, A., Goldstein, R., & Reekie, L. (n.d.). Electricity Use and Management
in the Municipal Water Supply and Wastewater Industries. Palo Alto, California.
Pahl, G. (2012). Power from the People: How to Organize, Finance, and Launch Local
Energy Projects (Google eBook) (p. 259). Chelsea Green Publishing. Retrieved from
http://books.google.com/books?id=zzqGKrthyOoC&pgis=1
Parry, D. L. (2013a, April). IMPROVING ECONOMICS. BioCycle Energy.
Parry, D. L. (2013b, June). Analyzing Food Waste Management Methods. BioCycle
Energy.

p. 55 Bibliography
Parry, D. L. (2014). Co-Digestion of Organic Waste Products with Wastewater Solids (No.
OWSO5R07). Alexandria, VA.
Parry, D. L., Vandenburgh, S., & Fillmore, L. (2012). Converting Organic Waste into
Biogas. In World Congress on Water, Climate and Energy (pp. 1–8). Dublin, Ireland:
International Water Association.
Pruegel, S. (2010, July). Pioneering Partnership Optimizes Power Production. BioCycle
Energy, pp. 50–55.
Rapport, J., Zhang, R., Jenkins, B. M., & Williams, R. B. (2008). Current Anaerobic
Digestion Technologies Used for Treatment of Municipal Organic Solid Waste.
Sacramento.
Raven, R. P. J. M., & Geels, F. W. (2010). Socio-cognitive evolution in niche
development: Comparative analysis of biogas development in Denmark and the
Netherlands (1973–2004). Technovation, 30(2), 87–99.
doi:10.1016/j.technovation.2009.08.006
Saleth, R. M., & Dinar, A. (2005). Water institutional reforms : theory and practice. Water
Policy, 7, 1–19.
Sarte, S. B. (2010). Sustainable Infrastructure: The Guide to Green Engineering and
Design. Hoboken, New Jersey: John Wiley & Sons.
Schuetze, T., Lee, J.-W., & Lee, T.-G. (2013). Sustainable Urban (re-)Development with
Building Integrated Energy, Water and Waste Systems. Sustainability, 5(3), 1114–
1127. doi:10.3390/su5031114
Sierral, N. (2012). Co-Digestion Challenges Opps.pdf. Journal of the New England Water
Environment Association, 46(3), 26–31.
Tupper, G., & Skoda, S. (2008). FOG : Collaborating to Keep the Pipes Clear. In WEFTEC
(pp. 4014–4029). Water Environment Federation.
Van Vliet, B., & Stein, N. (2004). New consumer roles in waste water management. Local
Environment, 9(4), 353–366. doi:10.1080/1354983042000246270
Waste Collection Franchise Agreement Policy (2014). Retrieved from
https://oakland.legistar.com/LegislationDetail.aspx?ID=1663526&GUID=7B5E3A47-
883F-49BF-9405-DB02AB2FDCC7&Options=&Search=
WEF. (2013). Energy roadmap : a water and wastewater utility guide to more
sustainable energy management. Alexandria, VA: Water Environment Federation.
Williams, D. R. (2012a, February 9). Power Generation Station Renewable Energy
Expansion Project Update [Memorandum]. EBMUD.

p. 56 Bibliography
Williams, D. R. (2012b, June 21). Wastewater Energy Sales Update [Memorandum].
EBMUD.
Willis, J., Stone, L., Durden, K., Beecher, N., Hemenway, C., & Greenwod, R. (2012).
Barriers to Biogas Use for Renewable Energy. Alexandria, VA: WERF & IWA.
Wiser, J., Schettler, J., & Willis, J. (2012). Evaluation of Combined Heat and Power
Technologies for Wastewater Facilities. Atlanta.
Wong, T. H. F. (2006). Water Sensitive Urban Design – the Journey Thus Far. Australian
Journal of Water Resources, 10(3), 213–221.

p. 57 Photo Credits
Photo Credits
Alliance for Water Efficiency. (2010). Retrieved from:
http://www.allianceforwaterefficiency.org/charter-sponsor-profile-EBMUD.aspx
CABI Blogs. (2010) Retrieved from:
http://cabiblog.typepad.com/hand_picked/2010/10/solving-the-uks-future-energy-
needs-with-organic-waste.html
Cargill. Retrieved from: http://www.cargill.com/
CCCSWA. Logo, Retrieved from: http://www.wastediversion.org/. Figure 4, Retrieved
from: http://www.wastediversion.org/app_pages/view/688
EBMUD. Retrieved from: https://www.ebmud.com/about/service-area-map
Georgetown. Retrieved from: https://water.georgetown.org/fog-in-our-sewers/
Image Slides. Retrieved from: http://www.imageslides.com/Technology/gallery/11167-
Photos-Turning-food-waste-into-energy
King County. Retrieved from:
http://www.kingcounty.gov/environment/wastewater/ResourceRecovery/Energy/Innov
ations.aspx
Letsrecycle. (2012). Retrieved from: http://www.letsrecycle.com/news/latest-
news/compost/londoners-challenged-to-reduce-food-waste
PG&E. Retrieved from: http://www.pge.com/
Port of Oakland. Retrieved from: http://www.portofoakland.com/
Recology. Retrieved from: http://www.recology.com/
WRA. Figure 7, Retrieved from:
http://www.dmmwra.org/aspx/servicesarea/servicesarea.aspx. Logo, Retrieved from:
http://www.dmmwra.org/

p. 58 Appendix
Appendix A
Recology’s Permit Application Timeline
2011
2012
2013
2014
StopWaste Board meets and discusses Recology’s application.
Port approves development permit for construction and operation.
City of Oakland approves amendment to Non Disposal Facility Element.
Recology submits info to amend County Wide Integrated Waste
Management Plan (COIWMP).
Recology submits application for registration permit to Department of
Health.
Recology hoped to start construction in 2012 and begin
operations between May and August.
CoIWMP is amended.
Recology seeks extension from City of Oakland for development permit.
Recology hoped to have permits by end of 2011.
June
Feb
April
May
July
Sep
Dec
Department of Health approves facility permit
2014
Jan

p. 59 Appendix
Appendix B
Legislative History on Sustainability Related Resolutions by California
and the City of Oakland
Date Legislation Outcome
1989
AB 939 “California
Integrated Waste
Management Act”
Required California jurisdictions achieve a 50% diversion
rate by 2000, and reduce reuse, recycle and compost
all discarded materials to the maximum extent feasible
before any landfilling or other destructive disposal
method is used.
1990
Ballot Measure D “The
Alameda County Waste
Reduction and Recycling
Initiative Charter
Amendment”
Set requirement for the county to reduce landfilling by
75% by 2010.
1990 Resolution #66253 C.M.S
Established solid waste reduction goals including
returning discarded materials to the local economy
through reuse and recycling; applying the waste
management hierarchy in priority order (reduce, reuse,
recycle, and compost) to the maximum extent; and
promoting recycling market development.
1992 Resolution #68780 C.M.S Authorized establishment of a state designated City
Recycling Market Development Zone.
2001
Zero Waste Goal by
California Integrated
Waste Management
Board
Zero waste goal in strategic plan for state.
2002 Resolution #77500 C.M.S
Established the goal of 75% reduction of waste disposal
by 2010 for the City of Oakland in alliance with the
countywide 75% waste reduction requirement.
Mar 7,
2006 Resolution #79774 C.M.S
Public works agency in conjunction with the Mayor’s
office to provide a Zero Waste Strategic Plan to achieve
the City’s Zero Waste Goal.
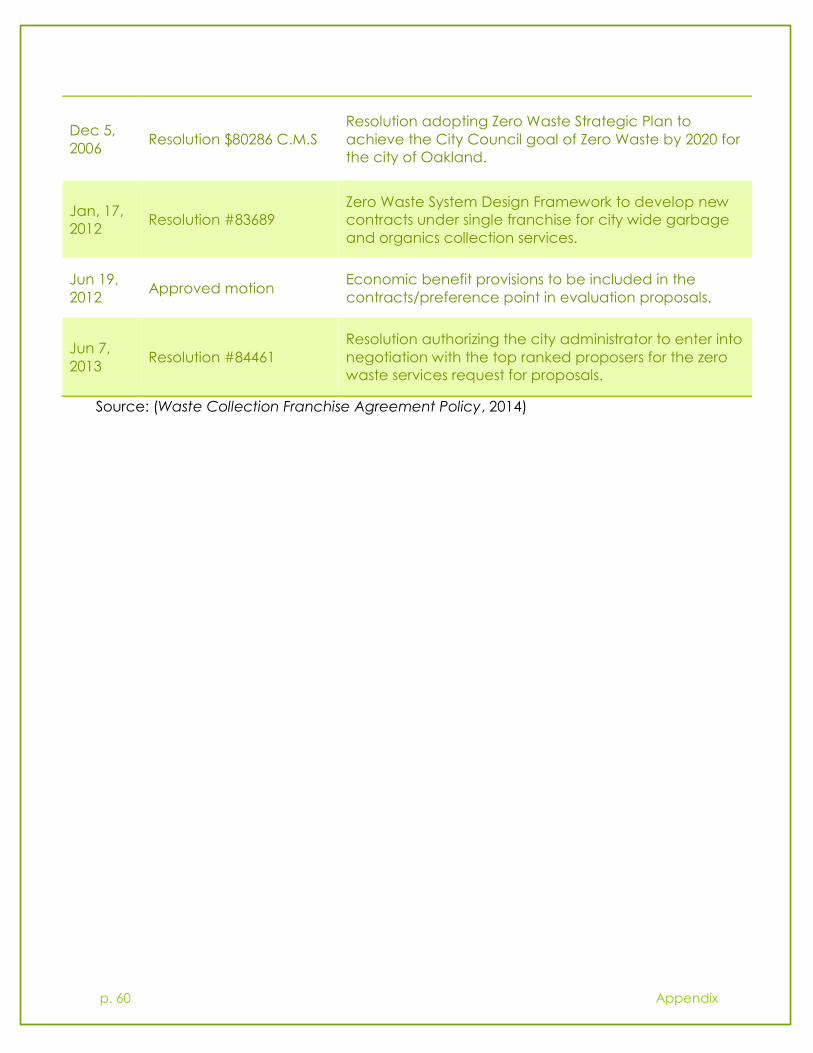
p. 60 Appendix
Source: (Waste Collection Franchise Agreement Policy, 2014)
Dec 5,
2006 Resolution $80286 C.M.S
Resolution adopting Zero Waste Strategic Plan to
achieve the City Council goal of Zero Waste by 2020 for
the city of Oakland.
Jan, 17,
2012 Resolution #83689
Zero Waste System Design Framework to develop new
contracts under single franchise for city wide garbage
and organics collection services.
Jun 19,
2012 Approved motion
Economic benefit provisions to be included in the
contracts/preference point in evaluation proposals.
Jun 7,
2013 Resolution #84461
Resolution authorizing the city administrator to enter into
negotiation with the top ranked proposers for the zero
waste services request for proposals.