Embed Size (px)
Citation preview

1
Institutional Bidding in IPO Allocation: Evidence from China
Jerry Cao
Singapore Management University
Tiecheng Leng
Singapore Management University
Bo Liu University of Electronic Science and Technology of China
William Megginson
University of Oklahoma
King Fahd University of Petroleum & Minerals
Date: July 4, 2015
Abstract
Using a proprietary bidding data of institutional investors in IPO allocations, we examine the information content of
bidding dispersion in China. IPOs with higher levels of bidding dispersion experience greater first-day return than
other IPOs, as well as greater trading volume and price volatility. Our results hold after controlling for potential
endogeneity. Dispersion of bidding prices is negatively predictive both of one-year operating performance post-IPO
and three-month stock performance. Bid characteristics, such as the timing of the bid and the frequency and of the
type of the bidder, matter in the pricing of IPOs, as does the geographic distance between bidders and the IPO firm.
Using a 2010 regulation change in the IPO share allocation rule as a natural experiment, we show that the new rule
decreases dispersion among institutional bidders but increases the effect of dispersion on first-day return. The
evidence suggests that bidding dispersion of institutional investors play an important role in IPO market
Keywords: Dispersion, divergence of opinion, Institutional investors, Book building, Initial public
offering, IPO underpricing, China, Auction
JEL classification: G20, G24
2
Institutional Bidding in IPO Allocation: Evidence from China*
Abstract
Using a proprietary bidding data of institutional investors in IPO allocations, we examine the information content of
bidding dispersion in China. IPOs with higher levels of bidding dispersion experience greater first-day return than
other IPOs, as well as greater trading volume and price volatility. Our results hold after controlling for potential
endogeneity. Dispersion of bidding prices is negatively predictive both of one-year operating performance post-IPO
and three-month stock performance. Bid characteristics, such as the timing of the bid and the frequency and of the
type of the bidder, matter in the pricing of IPOs, as does the geographic distance between bidders and the IPO firm.
Using a 2010 regulation change in the IPO share allocation rule as a natural experiment, we show that the new rule
decreases dispersion among institutional bidders but increases the effect of dispersion on first-day return. The
evidence suggests that bidding dispersion of institutional investors play an important role in IPO market.
Keywords: Dispersion, divergence of opinion, Institutional investors, Book building, Initial
public offering, IPO underpricing, China, Auction
JEL classification: G20, G24
July 4, 2015
* The authors would like to thank for suggestions from Jay Ritter and Yimin Qian.

3
Institutional Bidding in IPO Allocation: Evidence from China
Initial Public Offerings (IPOs) attracts great interests from academic community,
practitioners and policy makers. Typically IPOs experience large positive first-day return around
the world capital market (Ritter and Welch, 2002). Initial positive return of IPOs is the
underpricing phenomenon (Baron, 1982; Rock, 1986; Welch, 1989). China’s IPO market attracts
enormous attention. It has experienced a rapid development during the past two decades, with the
total market value of listed Chinese companies growing from virtually zero in the early 1990s to
62.75 trillion RMB (US$10.27 trillion) in May 2015. In 2010, there were 347 IPO listings,
including the record-breaking $22.0 billion initial offering of Agricultural Bank of China, raising
nearly 490 billion RMB (US$74.6 billion) through first-time share issues in the domestic A-share
market. It was the world’s largest IPO market that year and also in 2003 and 2014.
China’s IPO underwriting process includes an approval system, since underwriting
process is under heavy supervision and approval of the China Securities Regulatory Commission
(CSRC). CSRC regularly issue guidelines governing the listing process that have to be followed
by underwriters. Under this approval system, underwriters do not have discretion regarding share
allocations.1 In contrast, underwriters in US have full discretion of share allocations and they rely
on information acquisition mechanisms to induce institutional investors to reveal private
information about IPO firms (Benveniste and Spindt, 1989; Benveniste and Wilhelm, 1990).2
Many consider the US IPO allocation method efficient in the sense that institutional investors are
expert in producing information on the worthiness of IPO companies. Critics of the Chinese IPO
1 IPO allocation follows a pro rata allocation rule in which institutional investors that bid above the final offer price
receive shares allocated proportionally to the shares for which they bid. 2 Alternatively, Chemmanur (1993) argues that IPO firm insiders underprice their shares to induce outsiders to
produce costly information; Derrien (2005) think that initial IPO returns are due to market mispricing on the offer
price or close price of shares.

4
allocation system are concerned that institutional investors do not play any role or produce
valuable information in IPOs: they will simply inflate their bids in order to receive an allocation
of shares.
The size, growth trend, and its unique features make Chinese IPO market important. This
research empirically examines the information role of institutional investors in China’s IPO
underwriting process. The focus is on institutional investors’ dispersion of their bidding prices.
We do so by using a large proprietary data set with detailed information on institutional bids
(bidding price, bidding shares, and bidding institutions) for each IPO. Dispersion of bidding
prices by institutional investors is an appealing proxy for divergence of opinion. This is
consistent with Imhoff and Lobo (1992), Barron et al. (1998), Barron and Stuerke (1998), and
Diether, Malloy, and Scherbina (2002). They all examine analysts’ forecast dispersion and use it
as a proxy for differences in opinion. They reflect institutional investors’ valuation uncertainty
about a to-be-listed company.
Miller (1977), Varian (1985) and Merton (1987) suggest that divergence of opinion is
positively related to future asset returns. We hypothesize that institutional bidding dispersion is
positively related to IPO first-day returns and share turnover. If institutional bids carry private
information about IPO companies, dispersion in opinion will be related to short-term stock
performance in IPOs. We further hypothesize that bidding dispersion will negatively predict IPO
long-run performance, including both operating performance and stock returns post-IPO. In
testing these hypotheses, we construct several measures of each IPO’s dispersion of opinion
using institutional bidding price dispersion. In addition to opinion dispersion, we also study
attitude of institutional investors.

5
Ritter and Welch (2002) provide a comprehensive review of the IPO literature. They
consider IPO allocation an underexplored area due to the lack of data availability. Our research
fills the gap in this literature. We collect a large sample of IPO allocation data in China, and our
proprietary IPO bidding data cover 783 IPOs listed from 2009 to 2012 on the Shenzhen Stock
Exchange (SZSE). For each IPO, we construct several clean measures of opinion dispersion
using bidding prices of institutional investors. The extant literature, in contrast, has had to rely on
post-IPO market trading data to construct opinion divergence measures. Houge, Loughran,
Suchanek, and Yan (2001), for example, find that opening spread, time of first trade, and flipping
ratio are related to IPO first- day returns and long-run performance. The concern with measures
from trading data from secondary market is ex-post and do not reflect opinion dispersion ex ante.
Our measures therefore provide unbiased estimate of institutional opinion dispersion.
We find that the divergence of institutional bids is positively associated with IPO first-
day returns and trading volume but negatively predicts long-term stock returns and one year
post-IPO operating performance. We first time in the literature provide evidence that institutional
bids carry information about IPO companies. There is an endogeneity concern that unobserved
IPO firm qualities may be correlated with dispersion and IPO first-day return or post-IPO
performance. We address this problem by running instrumental variable (IV) regressions in
which the instrument is the relative underwriter valuation range deflated by the valuation price
midpoint. The rationale for the IV is that this measure is unrelated to first-day returns but related
to dispersion; that is, the narrower the range, the smaller the dispersion. The findings for our
baseline regression remain robust in the IV regressions.
To further address endogeneity problem, we take advantage of a natural experiment -- a
regulatory change in the IPO share allocation rule for institutional investors implemented by the

6
CSRC. Prior to November 5, 2010, the allocation of IPO shares in China followed a pro-rata
system in which allocations were proportional to bidding volume; after this date, the allocation
rule switched to a lottery system.3 This regulatory change means that institutional investors can
no longer simply bid a superficially high price for IPO shares in the allocation process. We find
that this regulatory change has caused institutional dispersion to drop significantly. The effect of
dispersion on IPO first-day returns, on the other hand, increases in great magnitude. This finding
suggests that institutional investors have improved their information production following the
regulatory change.
Our paper contributes to a large literature on IPOs in general and Chinese capital market
in particular. Banerjee et al. (2011) find that Chinese IPOs have high initial returns of 57.14%,
while Wei (2004) and Chi and Padgett (2005) document initial first day return averages over
100%. Chan et al. (2004), Chen et al. (2004), Chen et al. (2009), Firth et al. (2010), and Chen et
al. (2014) all study the IPO and first day returns in China. They find that institutional
environment, government and ownership all matters. Berkman et al. (2010) associate securities
market regulation and investor protection to IPOs. Dorn (2009) uses when-issue trades of IPOs
in Germany and shows that retail investor sentiment matters. None of these studies, however,
examine IPO share allocations, nor do they study the impact of opinion dispersion of institutional
investors on post-IPO performance. We research thus contributes greatly to the understanding of
institutional opinion dispersion in IPO market in general.
This paper is organized as follows: Section 2 profiles the unique institutional setting of
the IPO market in China, while section 3 describes the data and variables. Section 4 presents the
findings on the relation between IPO underpricing and the pre-market dispersion measure.
3 The qualified bids that institutional investors submit above the final offer price enter a lottery process, through
which shares are randomly allocated.

7
Section 5 examines the predictive power of the dispersion measure on firms’ post-IPO
performance, and Section 6 concludes the paper.
1. Institutional Setting
The Chinese IPO market is notorious for its high first-day returns followed by poor post-
IPO performance, such as an average first-day return of 247% or average first-day returns of 145%
in A shares traded in Shanghai and Shenzhen Stock Exchanges (Yu and Tse, 2006). Many blame
high initial returns of IPOs them on speculation or noise trades by retail investors. Ritter (2011)
provides a comprehensive summary of underpricing and development in the Chinese IPO market.
On the other hand, Ljungqvist (2004) reviews the literature on IPO underpricing.
Cornelli and Goldreich (2001, 2003) and Jenkinson and Jones (2004) use proprietary IPO
data sets to examine actual orders and allocations in the European book building process. We
concentrate on opinion divergence among institutional investors. Specifically, our proprietary
sample of institutional bids includes all IPO companies that go public on the Shenzhen ChinNext
Board and Shenzhen SME Board, both established to allow small, non-state owned enterprises or
growth firms to list shares and raise funds. The IPO process in China is always overseen by the
CSRC, which has implemented many reforms to improve the approval-based system.
Before June 2009, the CSRC implicitly put a Price-Earnings ratio cap of 30 for IPOs,
which means offering price could not be set over 30 times of the earning per share of the firm.
This obviously made IPO pricing highly inefficient. In June 2009, for purposes of further
improving the mechanisms for the issuance of new shares and enhancing the efficiency of
issuance, the CSRC has announced a landmark Guiding Opinions on Further Reforming and
Improving the Issuance System of New Shares, which are promulgated and came into force on
June 11, 2009. It removes the implicit restrictions for Price-Earnings ratio. Our sample period
8
starts right from this great reform. More importantly, during our sample period, two further
major regulatory reforms were implemented for offline institutional participants, including the
November 5, 2010, alteration that changed the offline IPO share allocation rule from a pro rata to
a lottery system. As a result, 373 IPOs in our full sample follow the pro rata system for offline
share allocation, with all institutional bidders who have a bidding price above the final offer
price receiving allocated shares from the lead underwriter proportional to their bidding volume.4
The remaining 410 IPOs follow the lottery system in which winning institutional bidders are
assigned IPO shares in random drawings. The second change occurred on May 25, 2012; the
CSRC removed the three-month lockup period provision imposed on offline institutional bidders,
which affects 65 IPOs toward the end of our sample period. Taken together, these discrete and
substantial regulatory changes constitute a near perfect natural experiment, which we exploit to
examine how information is incorporated into asset pricing.
The book building approach is associated with better information production than IPO
auctioning because the IPO offer price, rather than being pre-determined, is discovered only after
the demand information collected during the offline bidding period is seen. The typical IPO book
building process in China proceeds as follows: An IPO firm chooses an investment banker as the
lead underwriter (also known as book runner), who is responsible for pricing, selling, and
organizing the new issue. The lead underwriter will invite qualified institutional investors from a
candidate list maintained by the Securities Association of China (SAC) to bid the IPO. To
encourage participating institutional investors to bid more cautiously, the lead underwriter will
provide bidders with its IPO valuation range and a detailed IPO valuation report for the bidder’s
4 Both offline and online share allocation allows investors to buy IPO shares at the offer price; however, offline
share allocation only allows institutional investors to bid, while online share allocation mainly targets retail or
individual investors who are merely offer price takers.

9
reference.5 The underwriter allocates shares to institutional investors submitting bid prices above
the final offer price until all the shares are allocated. Because the allocation rule is set by the
CSRC, underwriters in Chinese IPOs, unlike those in U.S. IPOs, have no discretionary power in
IPO share allocation. Rather, as discussed above, allocations followed a pro-rata system
proportional to the bidding volume prior to November 5, 2010, and then switched to a lottery
system.
2. Data and Variables
Our proprietary book building data covers IPOs from the Shenzhen Stock Exchange
(SZSE), one of the two major stock exchanges in mainland China. Our primary book building
sample consists of the entire population of 783 Chinese firms listed on either the Shenzhen Small
and Medium Enterprises (SME) Board (428 listings) or the ChiNext Board (355 listings)
between July 2009 and November 2012, accounting for 88.5% by number of all IPOs listed in
China during this period.6 The time period is selected because it fully takes advantage of the
landmark reform of the new shares issuance system in China, and because the other key
regulations on IPO pricing were kept relatively stable to the extent that all IPOs within this time
window use a book building rather than an auction or fixed price approach (in which the offer
price is determined as the product of an EPS and an implicitly fixed P/E multiple).7 The cut-off
date of November 2012 takes into account that the CSRC suspended the Chinese IPO market in
November 2012 for regulatory transition, after which it reopened in January 2014. Each offer
5 The complete IPO valuation report will not be posted for public access and will only be provided to bidding
institutional investors. 6 Since our sample excludes share issuance privatizations, the fraction of total proceeds represented by our sample is
much smaller than by number. There were only 102 IPOs on the Shanghai Stock Exchange from July 2009 to
November 2012. 7 A partial book building mechanism with unique Chinese characteristics was initially introduced by the China
Securities Regulatory Commission (CSRC) in January 2005 and then subsequently altered and enforced in June
2009.

10
book contains detailed IPO bidding information, including number of bidders; bidder name, type
(e.g., stock brokerages, fund management firms or financial firms), and geographic location; date
and time of bid submission; number of shares required; and corresponding bidding price. It also
contains the final offer price and the number of actual shares allocated to each institutional
bidder after close of the bidding period. We extract the lead underwriter’s IPO valuation range
data from its private valuation report.
We obtain IPO firm financials, issue-specific characteristics, lead underwriter
information, and stock market conditions directly from the Chinese Stock Market Accounting
Research (CSMAR) and Wind databases. Whenever information is missing or incomplete in
either database, we manually search for the IPO firm registration statements from the Shenzhen
Stock Exchange online database to make these data available. To further address the robustness
of our bidding dispersion measures, we manually collect for each IPO the direct and indirect
flight distance, and the Euclidian distance between each institutional bidder and the issuing firm,
based on their geographical coordinates. These distance measures are then used in our
instrumental variable estimation to address such potential endogeneity biases as omitted
variables and reverse causality.
2.1. Dispersion Measures
Because analyst forecast dispersion is amply documented in the finance and accounting
literature as a strong negative predictor of future stock returns, it is widely used as a proxy for
differences in opinion among investors. For example, Diether et al. (2002) find that analyst
earnings forecast dispersion is very useful in formulating profitable trading strategies, since they
find that stocks with high analyst forecast dispersion are associated with a future return discount,
especially in small firms. They attribute this negative relation to market frictions resulting from a

11
lack of consensus among investors that limits the short sales of those pessimistic investors and
thus temporarily drives stocks into overpricing. Johnson (2004), however, after developing a
simple rational asset pricing model that assumes dispersion is a proxy for unpriced information
risk arising from unobservable asset valuations, argues that higher estimation risk leads to higher
stock price and subsequently lower expected returns for levered firms with risky debts.
Institutional investors are sophisticated and often have an informational advantage over
individual investors around various corporate events. Indeed, the extant literature documents that
institutional investors outperform individuals, either because institutions have some unique
private information that individuals do not have or they can better interpret readily available
public information. For example, Field and Lowry (2009) focus on institutional holdings in
newly public firms and find that firms attracting the highest levels of institutional investment
significantly outperform those with the lowest levels. They attribute institution investors’
superior returns to their ability to better interpret public data. Chemmanur, He, and Hu (2009)
and Chemmanur, Hu, and Huang (2010) focus on the role of institutional investors in equity
issuances and find that institutions systematically possess private information that enables them
to realize superior returns over individual investors in both IPOs and SEOs.
Given the popularity of analyst forecast dispersion as a proxy for risk and uncertainty in
the literature, we first construct a simple measure of institutional investors’ heterogeneous beliefs
in the pre-IPO market based on their bidding price information and then relate this variable to
subsequent IPO underpricing. Diether, et al. (2002) define the dispersion in analysts’ earnings
forecasts as the standard deviation of earnings forecasts across all analysts, scaled by the
absolute value of the mean EPS forecast. Adopting this methodology, we measure the degree of
heterogeneous beliefs among institutional investors in the offline IPO sale stage as their bidding

12
price dispersion, defined as the ratio of the cross-sectional standard deviation of institutional
investors’ bidding prices in the offline subscription process divided by the mean bidding price:
𝑆𝑇𝐷 =√∑ (𝑝𝑖 − �̅�)2𝑁
𝑖=1
𝑁 − 1�̅�
where 𝑝i is the bidding price from institutional bidder i and p̅ is the average bidding price
among all the N institutional bidders in an IPO. The dispersion in investors’ bidding prices is a
forward looking measure that takes into account institutional bidders’ heterogeneous beliefs
about the issuing firm’s quality and future profitability. We also construct two alternative
measures of dispersion, MAD, the mean absolute deviation of the bidding price surrounding the
mean bidding price scaled by the mean bidding price, and STD weighted, the bidding price
dispersion among institutional investors weighted by their bidding volume.
2.2. Summary Statistics
Following existing IPO literature, we define IPO first-day underpricing as the ratio of the
closing price of the stock on its first trading day less the offer price to its offer price. Panel A of
Table 1 reports the summary statistics of our primary analytic variables, all of which are defined
in Appendix A. As the panel shows, the average IPO first-day underpricing for the entire sample
of IPO firms is 36.84%, with a median value of 27.19%. For example, an increase in the
dispersion level of institutional IPO bidders from the 10th
percentile to the 90th
percentile almost
doubles the degree of heterogeneous beliefs among them.
In terms of general characteristics, our sample firms are on average 8.33 years old at the
time of the IPO, the average time gap between offering and listing is 16.6 days, and the average
issue size is 1,061 million RMB (170 million USD using 2010 exchange rate) with a median of
625 million RMB (101 million USD). On average, there are 71 qualified institutional bidders

13
participating in the offline share allocation process for any one IPO, with an average offline
oversubscription rate of around 107. About 50% of our sample firms receive financing from
either venture capital or private equity before going public. As noted previously, 373 IPOs
participated in the pro-rata system and 410 in a lottery system, while institutional bidders in the
718 IPOs offered before May 25, 2012 faced a three month lockup period for the offline shares
obtained during the bidding process.
**** Insert Table 1 about here ****
Panel B of Table 1 reports the Spearman correlation matrix for the primary analytic
variables. There exists insignificant correlation coefficient of -0.01 between IPO underpricing
and the dispersion measure STD. In addition, the underpricing level is significantly higher for
IPOs with a smaller offer size and a longer time gap between offering and listing, as well as for
IPOs that attract more institutional bidders.
Figure 1, which depicts the number of IPOs and average IPO underpricing on a quarterly
basis during our sample period, shows that both measures fluctuate significantly over time. The
number of IPOs ranges from 83 in 2010Q2 to only 4 in 2012Q4. IPO underpricing also fluctuates
but generally shows a decreasing trend, partly because of the CSRC’s implementation during our
sample period of various regulations aimed at improving IPO pricing efficiencies. Toward the
end of our sample period in 2012Q4, the quarterly number of IPOs drops dramatically while IPO
underpricing spikes to an extremely high level. This somewhat surprising trend is probably due
to the CSRC’s temporary ban on IPOs in the mainland China IPO market after November 2012,
just before which investor enthusiasm for the relative scarcity of new shares in the secondary
market pushed the first-day underpricing to an unreasonably new height.
**** Insert Figure 1 about here ****

14
3. Dispersion and IPO Underpricing
The first of our various multivariate analyses of the explanatory power of institutional
dispersion for IPO underpricing is a baseline regression using ordinary least squared (OLS)
regressions. To address endogeneity concerns, we run an instrumental variable estimation with
the ratio of the lead underwriter’s IPO valuation band to the midpoint of the valuation band as
the instrument. Using these estimations, we show that our findings are robust to two alternative
measures of bidder dispersion in the pre-IPO market. We also run subsample regressions based
on issuers’ pre-IPO information environments to identify how information environments amplify
the effect of institutional bidders’ heterogeneous beliefs on IPO underpricing. Finally, we use the
natural experiment of the November 2010 share allocation reform to test the robustness of our
findings.
3.1. Baseline Results
Following existing IPO literature, we control for a rich set of firm and issue
characteristics that may affect IPO underpricing. Like Ritter (1984), Beatty and Ritter (1986),
and Carter and Manaster (1990), for example, we consider firm age, offer size, underwriter
reputation, and the time gap between offering and listing as measures of the issuing firm’s ex-
ante uncertainty. To control for overall market conditions at the time of the IPO, we also include
Shenzhen A-share composite index returns over one month prior to the listing date, as in
McGuinness (1992). We capture the profitability of the issuing firm by including return on
equity (ROE) for the last fiscal year preceding the IPO, and use the offline share
oversubscription rate and number of institutional participants in the offline share subscription
stage to control for the aggregate premarket demand for the issue. Because both venture capital
(VC) and private equity (PE) are subject to reputation concerns, we include an indicator variable

15
to flag issuers backed by either VC or PE (Megginson and Weiss, 1991). We also use an
indicator variable to differentiate IPOs listed on the ChiNext Board from those listed on the SME
Board and include two separate indicator dummy variables to capture the effects of the two
major IPO regulatory reforms introduced by the CSRC during our sample period. Finally, we
include industry (based on CSRC classifications) and year fixed effects to account for potential
industry and time trends.
Our baseline OLS regression is specified as follows:
𝐼𝑃𝑂 𝐼𝑛𝑖𝑡𝑖𝑎𝑙 𝑅𝑒𝑡𝑢𝑟𝑛 = 𝛼 + 𝛽1 ∗ 𝐷𝑖𝑠𝑝𝑒𝑟𝑠𝑖𝑜𝑛 + 𝛽2𝐹𝑖𝑟𝑚 𝑎𝑔𝑒 + 𝛽3𝑂𝑓𝑓𝑒𝑟 𝑠𝑖𝑧𝑒
+𝛽4𝑇𝑖𝑚𝑒 𝑔𝑎𝑝 + 𝛽5𝑅𝑂𝐸 + 𝛽6𝐼𝑛𝑑𝑒𝑥 𝑟𝑒𝑡𝑢𝑟𝑛 + 𝛽7𝑂𝑣𝑒𝑟𝑠𝑢𝑏𝑠𝑐𝑟𝑖𝑝𝑡𝑖𝑜𝑛
+𝛽8𝐿𝑜𝑔 # 𝐼𝑛𝑠𝑡𝑖𝑡𝑢𝑡𝑖𝑜𝑛𝑠 + 𝛽9𝑉𝐶/𝑃𝐸 𝑑𝑢𝑚𝑚𝑦 + 𝛽10𝐴𝑙𝑙𝑜𝑐𝑎𝑡𝑖𝑜𝑛 𝑑𝑢𝑚𝑚𝑦
+𝛽11𝐿𝑜𝑐𝑘𝑢𝑝 𝑑𝑢𝑚𝑚𝑦 + 𝛽12𝐶ℎ𝑖𝑁𝑒𝑥𝑡 𝑑𝑢𝑚𝑚𝑦 + 𝛽13𝐿𝑒𝑎𝑑 𝑟𝑒𝑝𝑢𝑡𝑎𝑡𝑖𝑜𝑛 + 𝜀 (1)
The baseline regression results, with standard errors clustered at the industry level, are reported
in Table 2. These show a positive correlation between bidding dispersion and IPO first-day
returns across all regression specifications that is significant at the 1% level. In terms of
economic magnitude, the coefficient estimates in column (4) suggest that a one standard
deviation increase in the bidding price dispersion measure translates into a 5.28% (=1.57*0.0336)
increase in the IPO first-day return. This outcome represents an economically significant 14.33%
increase in first-day underpricing relative to the average first-day underpricing of 36.84% in our
full sample. The significant positive relation between IPO underpricing and the allocation
dummy indicates that the CSRC’s 2010 share allocation reform reduced IPO underpricing.
**** Insert Table 2 about here ****
Among the other control variables, smaller issues and those with a longer time gap
between offering and listing are associated with greater underpricing, as is a better overall pre-

16
IPO stock market performance. Consistent with Cornelli and Goldreich (2003), issues that can
attract higher premarket demand, as proxied by a higher oversubscription rate and more
institutional participants, tend to have higher underpricing. On the other hand, issues listed on the
ChiNext Board are significantly more likely to experience less underpricing. We find that VC or
PE backed IPOs do not experience significantly larger underpricing. Overall, our baseline results
suggest that IPO-related opinion divergence among institutional investors in the pre-IPO market
has strong predictive power for IPO underpricing.
3.2. Instrumental Variable Approach
The positive relation reported in the baseline regressions may reflect one or both of two
competing explanations: opinion divergence among bidders may in fact be based on some
private information about the IPOs or it may be driven purely by the endogenous matching
between institutional bidders and IPO firms. That is, if unobservable variables are
simultaneously driving the relation between bidders’ opinion divergence and IPO first-day
returns, then the observed relation reflects the endogenous nature of the bidder’s opinion
divergence rather than any private information about first-day returns, thereby biasing the OLS
estimates. We address this possible endogeneity between bidders’ premarket opinion divergence
and subsequent IPO underpricing by estimating a two-stage least square (2SLS) regression in
which the ratio of lead underwriter’s IPO valuation band to the midpoint of valuation band,
2 × (PrcH−PrcL
PrcH+PrcL), instruments for this divergence, as measured by the bidding price dispersion
STD. To be a valid instrumental variable (IV), this ratio should satisfy the following requirement:
it must be correlated with the bidding price dispersion but uncorrelated with the IPO first-day
return. We choose this instrument because a tighter valuation band leaves less room for bidding
price variation, resulting in relatively smaller bidding price dispersion. On the other hand,

17
because this relative measure contains little information on price discovery, it is unlikely to
directly influence the underpricing of a particular IPO.
**** Insert Table 3 about here ****
Panels A and B of Table 3 report the results of the first-stage and second-stage IV
regressions, respectively. In the first-stage regression, the ratio of lead underwriter’s IPO
valuation band to the midpoint of the valuation band is used as an IV for our dispersion measure
STD. In the second-stage regression, we replace the dispersion measure STD with its predicted
value from the first-stage, the Fitted STD, and reestimate the baseline regression. The first-stage
results (panel A) indicate that the proposed instrument is positively and significantly correlated
with the bidding price dispersion STD, confirming that a tight valuation range helps reduce
biding price dispersion. On the other hand, the second-stage results (panel B) show that the
instrumented bidding price dispersion Fitted STD remains positive and significant at the 1%
level, suggesting that IPOs with a higher level of premarket bidder opinion divergence
subsequently experience larger underpricing. Collectively, our 2SLS analysis confirms that the
positive relation between bidder opinion divergence and IPO first-day return is unlikely to be
driven by endogeneity.
3.3. Alternative Dispersion Measures
We further test the robustness of our main dispersion measure by constructing two
alternative measures of IPO-related bidder opinion divergence. Consistent with prior accounting
literature (Jacob, Lys, and Neale, 1999; Barniv, Myring, and Thomas, 2005), our first alternative
dispersion measure MAD is the simple average of the cross-sectional unsigned mean absolute
deviation of individual bidding price from the mean bidding price, scaled by the mean bidding
price. Specifically, we calculate MAD using the following formula in which 𝑝𝑖 is the bidding

18
price from institutional investor i and �̅� is the mean bidding price among all the N institutional
investors participating in the offline share subscription process of an IPO:
𝑀𝐴𝐷 =
1𝑁
∑ |𝑝𝑖 − �̅�|𝑁𝑖=1
�̅�
Our second alternative measure, STD weighted, takes into account the importance of
bidders’ opinions about an IPO in the whole bidder group by weighting each institutional bid
according to bidding volume. Hence, STD weighted, formulated as shown below, gives larger
bids greater weight relative to smaller bids:
𝑆𝑇𝐷 𝑤𝑒𝑖𝑔ℎ𝑡𝑒𝑑 =
√∑ 𝑤𝑖(𝑝𝑖 − �̅�𝑤)2𝑁
𝑖=1
(𝑁 − 1) ∑ 𝑤𝑖𝑁𝑖=1
𝑁
�̅�𝑤
where 𝑝𝑖 is the bidding price from institutional investor i and �̅�𝑤 is the average bidding price
weighted by corresponding bidding volume among all the N institutional investors participating
in the offline share subscription process of an IPO.
**** Insert Table 4 about here ****
Table 4 presents the regression results using the two alternative dispersion measures, with
specifications (1) and (3) including neither industry nor year fixed effects, but specifications (2)
and (4) containing both. Here, using MAD and STD weighted, we obtain quantitatively and
qualitatively similar outcomes to the baseline results shown in Table 2. Across all regression
specifications, both alternative dispersion measures are significantly and positively correlated
with IPO first-day underpricing at the 1% levels. Our main findings are thus robust to using
alternative measures of opinion divergence among bidders and remain robust when we test them
using price update, defined as the percentage difference between the midpoint of the lead

19
underwriter’s IPO valuation range and the final offer price (Aggarwal, Prabhala, and Puri, 2002),
with market-adjusted IPO first-day returns as the dependent variable. Nor do our main findings
alter when we exclude financial firms or the four IPOs with extremely high underpricing levels
in the last quarter of our sample period, either separately or simultaneously.
3.4. Cross-Sectional Analysis
In an additional analytic step, we conduct two sets of cross-sectional analyses: the first
identifies the role of information asymmetry in the relation between opinion divergence among
IPO bidders and subsequent IPO underpricing, and the second assesses the heterogeneity in the
predictive power of opinion divergence across different bidder categories given the availability
of information on institutional bidder type.
3.4.1. Impact of Information Asymmetry on the Dispersion-Underpricing Relation
Prior evidence shows that IPO underpricing increases with ex-ante uncertainty about
issue value (Beatty and Ritter, 1986; Megginson and Weiss, 1991). We expect the effect of
dispersion and IPO first-day returns varies across uncertainty levels. For example, Mok and Hui
(1998) find a lengthy time gap between the offering and listing of Chinese A-share IPOs
increases the ex-ante uncertainty of the issuer.
The cross-sectional tests are carried out in the following. We partition the full sample into
subgroups based on issuer ex-ante uncertainty as proxied by offer size, time gap between
offering and listing, and underwriter reputation, and re-estimate the baseline regression in
Equation (1) for each subgroup. The odd (even) number columns in Table 5 report the outcomes
for the subsamples with greater (smaller) ex-ante uncertainty. We first note that the forecasting
power of our dispersion measure is significant and positive across all subsamples, indicating that
our results are not subject to a sample selection bias. Consistent with our cross-sectional

20
prediction, the relation between institutional dispersion and the level of IPO underpricing is more
pronounced in smaller IPOs, IPOs with a shorter time gap between offering and listing, and IPOs
managed by less reputable underwriters. For example, in the subsample with below median time
gap (column 3), a one standard deviation increase in the dispersion measure translates into a 7.4%
(=2.273*0.0326) increase in IPO first-day returns, whereas in the subsample with above median
time gap (column 4), the increase is only 1.79% (=0.527*0.0340). Overall, these results indicate
that ex-ante issue uncertainty amplifies the effect of bidder opinion divergence on expected IPO
first-day returns.
**** Insert Table 5 about here ****
3.4.2. Heterogeneity of Investor Type
Ke and Ramalingegowda’s (2005) find that different types of institutional investors
possess different private information about firms’ future earnings and returns. We therefore
classify each institutional investor as either a domestic brokerage firm (DB), fund management
firm (FM), financial firm (FF), trust company (TC), insurance company (IC), or qualified foreign
institutional investor (QF) based on their registration type information at Securities Association
of China (SAC). We construct a dispersion measure for opinion divergence within each bidder
category and explore the heterogeneity in this divergence’s predictive power across categories.
Because brokerage firms and fund management firms have their own equity research teams and
expertise in generating IPO information, we expect divergence of DB to have the strongest
forecasting power in determining IPO underpricing, followed by divergence of FM.
Table 6 reports the regression results for the separate bidder categories, with STD_DB
representing the dispersion measure among brokerage firms, STD_FM for fund management
firms, STD_FF for financial companies, STD_TC for trust companies, STD_IC for insurance

21
companies, and STD_QF for qualified foreign institutional investors. For all regression
specifications, we include industry and year fixed effects and use the same set of control
variables. Consistent with our expectation, we find that opinion divergence within the brokerage
firm and fund management firm categories has the strongest predictive power in explaining IPO
underpricing. We find no strong relation, however, between IPO underpricing and opinion
divergence within the remaining bidder categories (financial firms, trust companies, insurance
companies, or qualified foreign institutional investors). Overall, therefore, our findings support
the existence of a considerable amount of heterogeneity in the predictive power of opinion
divergence across different bidder categories.
**** Insert Table 6 about here ****
3.5. The Importance of Share Allocation Reform
The November 2010 reform of offline share allocations represents an exogenous shock
that forced all 410 subsequent IPOs in our sample to use a lottery rather than a pro rata system.
Prior to the reform, 373 IPOs had followed the pro rata rule that all institutional bidders with a
bidding price above the offer price receive shares proportional to their bidding volume.
According to the CSRC’s guideline, this reform was supposed to enhance the role of institutional
investors in IPO price discovery by encouraging them to bid more cautiously and thus produce
less biased bidding prices in the offline share subscription process. This mandatory adoption of
the share allocation reform provides a natural experiment that allows us to investigate the
information role of institutional IPO investors. It is also important to understand the consequence
of the reform. To do so, we perform two sets of empirical analyses: the first determines whether
and how the share allocation reform has affected such bidding behaviors as dispersion among the

22
offline institutional bidders; the second assesses the impact of this exogenous regulatory shift on
the relation between the opinion divergence of institutional bidders and IPO underpricing.
Panel A of Figure 7 reports the results of a univariate test comparing IPO variables before
and after the share allocation reform. The average IPO underpricing after the change is 24.65%,
much lower than the 50.24% underpricing before it. Opinion divergence among institutional
investors, as proxied by their bidding price dispersion, also drops 6.15%. This reduction is
significant at the 1% level.
Panel B of Table 7 reports the multivariate regressions results that use opinion divergence
of each type of institutional investors, STD, as the dependent variable. The variable of interest is
the Allocation dummy, which takes a value of one for IPOs that follow a lottery allocation system
and zero for those adopting the pro-rata allocation system. We find that Allocation dummy is
negatively and significantly related to the STD dispersion measure. This suggests that CSRC’s
share allocation reform is effective in lowering dispersion of opinion among institutions.
**** Insert Table 7 about here ****
We next investigate how the new allocation rule affects the relation between investor
opinion divergence and IPO first-day returns. Specification (1) in Table 8 includes an interaction
term STD × Allocation dummy to gauge the interaction effect between share allocation reform
and the dispersion measure on IPO underpricing. The coefficient of the interaction term is
positive and significant. This finding indicates that the relation between opinion dispersion and
IPO underpricing is more pronounced after the share allocation reform. In specifications (2) and
(3), we split the sample into two groups based on the allocation rule change and run the same
regression separately on each. Comparing the outcomes for the two subgroups clearly shows that
the allocation rule change has amplified the effect of investor opinion divergence on IPO

23
underpricing. For example, after the rule change (3), a one standard deviation increase in the
dispersion measure translates into 7.7% increase in IPO underpricing versus only 3.2% increase
before the change (2). The empirical evidence from the regulatory change as a natural
experiment suggests that the relation between opinion dispersion and IPO first return is not
caused by omitted variables or endogeneity problem.
**** Insert Table 8 about here ****
4. Dispersion and Post-IPO Firm Performance
Having identified the relation between institutional bidding dispersion and IPO pricing
efficiency, we now examine whether such dispersion is predictive of subsequent IPO stock
returns and post-IPO operating performance.
4.1. Dispersion and Post-IPO Stock Performance
Our primary measures for post-issue firm stock price performance are one-, three- and
six-month post-IPO buy-and-hold returns (BHRs), which are calculated based on monthly stock
returns beginning with the first month after the IPO listing date. Cumulative abnormal returns
(CARs) are the cumulative difference between the monthly return of a particular IPO and the
monthly return of the corresponding value-weighted market index. Because institutional bidders
in the 718 IPOs listed before May 2012 are subject to a three-month lockup provision, however,
we expect that the overall predictive pattern of opinion divergence on stock performance will
differ between bidders before and after this date. Specifically, the provision will prevent the
opinions of the constrained bidders from being too quickly impounded into stock prices because
they cannot trade shares obtained offline within the lockup period, meaning that such
information can only be reflected in the stock price after the lockup provision expires to be
24
effective. In contrast, the opinion divergence among bidders who are not constrained by the
provision after May 2012 can be expected to predict one-month short-run stock performance
because their opinions can be fully revealed immediately after trading starts.
According to Panel A of Table 9, which presents the summary statistics for the post-issue
one-, three-, and six-month firm stock performance measured as BHRs and CARs, respectively,
newly listed firms on average exhibit negative BHRs over the six-month post-issue period. To
assess the predictive power of premarket bidder opinion divergence for subsequent post-issue
stock performance using full sample IPOs and IPOs with and without the three-month lockup
provision, we use the baseline regression specification but include the corresponding holding
period market index returns. We first note from Panel B of Table 9 that the association between
bidder opinion divergence and BHRs three month post IPO is negative and significant at the 1%
level but becomes insignificant for BHRs one month and six months post-IPO, seemingly
confirming our main argument.8
**** Insert Table 9 about here ****
Since many IPOs in our sample are subject to the three-month lockup provision, we also
run subsample regressions that explicitly separate out the effect of the lockup provision on the
predictive pattern of bidder opinion divergence on post-issue stock performance. Consistent with
our expectations, the estimates in columns (4) to (6) show that the opinions of bidders subject to
the three-month lockup provision can only predict stock performance beginning three months
post IPO, indicating that bidder opinion divergence contains private information about post-issue
stock performance that can only be impounded into stock price once the lockup period expires.
In terms of economic magnitude, for example, the coefficients in column (5) indicate that a one
8 We also control for firm- and issue-level characteristics but omit the coefficients here to save space.

25
standard deviation increase in the dispersion measure translates into a 44.96% decrease from the
mean value of the three-month BHRs. Finally, the results in columns (6) to (9) show that bidders’
divergent opinions can predict BHRs one-month post-issue but the effect is only marginally
significant with a t-value of -1.52, confirming that for bidders without the three-month lockup
provision, their divergent opinions can be immediately reflected in stock returns. In an
unreported analysis, we obtain similar results using CARs as measures of stock performance.
Overall, then, our results strongly suggest that the premarket divergence of bidder opinions does
indeed contains private information about post-issue stock performance that is prevented from
being quickly impounded into stock prices by the lock-up provision.
4.2. Dispersion and Post-IPO Operating Performance
We next examine whether our dispersion measure can also forecast long-run post-IPO
firm operating performance and, if so, how. Following previous studies, we proxy such
performance by one-, two-, and three-year post issue returns on equity (ROE) and operating
returns on assets (ROA). According to the descriptive statistics in panel A of Table 10, firm
operating performance declines over the three-year post-issue period, with ROE dropping from
8.21% in the one-year post-issue period to 7.68% two years post issue, a 6.46% reduction.
Consistent with Jain and Kini (1994), we also find that issuing firms exhibit a decline in post-
issue operating performance relative to their pre-issue levels. To better assess this decline and
identify the relation between it and premarket bidder opinion divergence, we use the baseline
specification to perform regressions with corresponding one-, two-, and three-year ROE and
ROA as dependent variables while controlling for the same holding period stock market index
returns. The variable of interest is the dispersion measure STD, and we also include industry and
year fixed effects for all regressions. As shown in panel B of Table 10, the coefficient estimates

26
in specifications (1) and (4) indicate a strongly significant and negative relation between the one-
year post-issue operating performance as measured by ROE and ROA and the premarket
divergence of opinions among bidders. In addition to being statistically significant, our findings
are meaningful in terms of economic magnitude. For example, the estimates for specification (1)
reveal that a one standard deviation increase in our dispersion measure translates into a 2.54%
decrease in firm operating performance relative to the average one-year post issue operating
performance measured by ROE. We also find not only that the predictive power of divergent
bidder opinions is weakened and only marginal significant for the two-year post-issue operating
performance measures but that for three-year post-issue performance, the relation totally
disappears (specifications (3) and (6)). Taken together, our results suggest that bidder opinion
divergence (as measured by their bidding price dispersion) has strong predictive power mostly
for one-year post-issue firm operating performance.
**** Insert Table 10 about here ****
4.3. Bidder Characteristics and Bid Price Accuracy
To examine whether and how institutional bidder characteristics affect bid price accuracy,
thereby identifying the informed bidders in an IPO, we measure bid price accuracy as the
percentage difference between the bid price and final offer price. The first bidder characteristic
that may influence IPO pricing is the geographical distribution of both bidders and IPO firms, as
suggested by the tendency for local investors to be better informed about a firm’s prospectus
than nonlocal investors. For example, Baik, Kang, and Kim (2010), find that local investors
outperform nonlocal investors in informed trading by exploiting their informational advantages.
On the other hand, Hong, Kubik, and Jeremy (2005) demonstrate that local investors behave
similarly toward a particular stock within the same time period, even when the company of

27
interest is located far away. This latter finding suggests that information about firm quality may
also be spread by word of mouth over a geographically interconnected investor network.
Recognizing both possibilities, we use the mean distances between the bidder and IPO firm and
between the bidder and other bidders as proxies for the extent of private information a bidder has
about the IPO. We expect that the distance measure should be positively correlated with bid price
accuracy. Following Cornelli and Goldreich (2001), we also examine other bid characteristics,
including bid size, timing, and bidder type and frequency of participation, each of which has
separate implications for IPO pricing efficiency.
According to the extant literature, large bidders are better informed and large bids are
favored by underwriters in IPO allocation (Cornelli and Goldreich, 2001). Late bids might be
more informative than early bids because of the time needed for information spillovers to
materialize. Hence, we include a dummy variable indicating whether the bid is submitted
relatively early or not. We also create a dummy variable to proxy for regular bidders who may be
better at pricing IPOs either because of greater pricing experience or more precise private
information gleaned from their close business relations with the underwriters. Additionally,
because bidders with strong in-house equity research departments (e.g., brokerage and fund
management firms) and superior information acquisition and production abilities may predict the
IPO offer price more precisely and bid more wisely, we introduce a bidder type dummy that
explicitly controls for the effect of investor type heterogeneity on IPO pricing. We then identify
the determinants of bid price accuracy by running different specifications of the following
regression:
𝐵𝑖𝑑 𝑝𝑟𝑖𝑐𝑒 𝑎𝑐𝑐𝑢𝑟𝑎𝑐𝑦 = 𝛼 + 𝛽1 ∗ 𝐷𝑖𝑠𝑡𝑎𝑛𝑐𝑒 + 𝛽2𝐿𝑎𝑟𝑔𝑒𝑠𝑡 𝑏𝑖𝑑 + 𝛽3𝑆𝑒𝑐𝑜𝑛𝑑 𝑙𝑎𝑟𝑔𝑒𝑠𝑡 𝑏𝑖𝑑
+𝛽4𝐸𝑎𝑟𝑙𝑦 𝑏𝑖𝑑 + 𝛽5𝐿𝑎𝑡𝑒 𝑏𝑖𝑑 + 𝛽6𝐻𝑖𝑔ℎ 𝑓𝑟𝑒𝑞𝑢𝑒𝑛𝑐𝑦 (2)

28
+𝛽7𝑀𝑒𝑑𝑖𝑢 � 𝑓𝑟𝑒𝑞𝑢𝑒𝑛𝑐𝑦 + 𝛽8𝐵𝑖𝑑𝑑𝑒𝑟 𝑡𝑦𝑝𝑒 + 𝜀
Here, the dependent variable is Bid price accuracy, defined as the percentage deviation between
individual bid prices and the final offer price. For invalid bids with a bid price below the offer
price, we measure bid price accuracy as the maximum price deviation among all bids within an
IPO. Several independent variables capture different bidder characteristics: Distance is
constructed as the natural logarithm of the arithmetic mean of the flight distance between the
IPO firm and the bidder and the average flight distance between the bidder and all other bidders
as a group. We also directly calculate the Euclidian distance between bidder and IPO firm and
among bidders based on their geographical coordinates besides flight distance. Largest bid
(Second largest bid) is a dummy equal to one if the bid size is in the fourth (third) size quartile
for that IPO, and early bid (late bid) is a dummy equal to one if the bid submission time falls in
the first (fourth) quartile. We also split bidders into three categories based on the frequency
distribution of their past IPO participation, with High frequency (Medium frequency) equal to
one if the total number of IPOs participated in is in the third (second) tercile during our full
sample period. Finally, Bidder type again categorizes bidders into domestic brokerage firms (BJ),
fund management firms (JJ), financial firms (CW), trust companies (XT), insurance companies
(BX), and qualified foreign institutional investors (QF). For this bid level analysis, however, we
add in two more bidder types: qualified large individual bidders (GR) and institutional bidders
(TJ) independently recommended by the lead underwriter. It should be noted that our earlier
analysis (section 4.4.2) does not assess the impact of these two groups’ divergent opinions on
IPO underpricing because dispersion measures for these categories are very rare at the IPO level.
In addition, to alleviate concerns that the above variables may not capture unique issue

29
characteristics, the regression also includes issue level fixed effects with standard errors
clustered at this level.
Panel A of Table 11 reports estimates of OLS regressions in which the dependent
variable is the continuous measure of bid price accuracy as defined earlier. Consistent with our
expectation, we first note that both primary and alternative distance measures are positively and
significantly correlated with bid price accuracy at the 1% level. This finding suggests that
geographical proximity between bidder and IPO firm, as well as between bidder and other
bidders as a group, acts to facilitate information acquisition or production by bidders, which in
turn help them to improve the efficiency of IPO pricing. In terms of economic magnitude, all else
being equal, the coefficient estimates in column (2) suggest that a one standard deviation
decrease in the distance measure leads to a 1.18% (=0.027*0.436) improvement in the accuracy
of IPO pricing. The coefficients on the two bid size variables are statistically insignificant,
confirming that bid size is not a proxy for information about IPO pricing. The coefficient of the
dummy variable for early (late) bids, however, is positive (negative) and significant, suggesting
that late bids contain more private information about IPO offer price than early bids. Both high
frequency and medium frequency bidders are better informed than infrequent bidders. We also
notice interesting differences among bidders from different industries: consistent with the
information production or business relation assumption discussed earlier, financial firms (CW),
fund management firms (JJ), trust companies (XT), and institutional investors recommended by
the lead underwriter (TJ) seem to have a considerable information advantage over insurance
companies (BX) and individual investors recommended by the lead underwriter (GR).
**** Insert Table 11 about here ****

30
We test the robustness of these results using a probit model in which the left-hand side
dependent variable is a dummy variable indicating whether the bid price is above the offer price
or not (see panel B). Interestingly, the bid characteristics that were statistically significant in the
OLS regression continue to be significant in the probit model. Their signs, however, differ. For
example, the proxies for frequent bidders have positive coefficients in Panel A but become
negative in panel B, which seems rational given that an unreasonably high bid price impairs the
efficiency of IPO pricing but increases the likelihood of a bid price above the final offer price.
Overall, then, the signs and significances of the estimated coefficients in both the OLS
regressions and probit models strongly suggest that several bidder characteristics, including bid
bidder type, and bidder participation frequency contain private information about IPO pricing.
6. Conclusions
This study explores the information content of institutional bids using a large and
proprietary sample of Chinese IPO data that contains unique and detailed information on bids
and allocations from 2009 to 2013. We find that institutional bid dispersion is positively related
to IPO first-day returns and trade turnover but is negatively predictive of IPO firm’s operating
performance one year post IPO and stock returns six months post-IPO, suggesting that the bids
of institutional investors bids carry private information about IPO valuations. The results of our
baseline regressions remain robust to using IV regressions in which we control for the
endogeneity problem by instrumenting bidder opinion divergence as the ratio of the lead
underwriter’s IPO valuation range to its midpoint and to a natural experiment caused by a
regulatory change in the share allocation process. We further find that this latter shift, in May
2012, from a pro rata to a lottery rule has a significant impact on dispersion: in the post-reform
period, institutional investors bid with more information, resulting in a stronger relation between

31
institutional dispersion and IPO underpricing. Overall, therefore, our research sheds new lights
on the efficiency of the IPO allocation process in China and highlights the importance of
institutional factors and regulatory reforms in the IPO market of the world’s largest emerging
economy.

32
References
Aggarwal, R., Prabhala, N. R., and and Puri, M., 2002, Institutional Allocation in Initial Public
Offerings: Empirical Evidence, Journal of Finance 57, 1421-1442.
Baik, B., Kang, J., and Kim, J., 2010, Local institutional investors, information asymmetries, and
equity returns, Journal of Financial Economics 97, 81-106.
Barniv, R., Myring, M. J., and Thomas, W. B., 2005, The association between the legal and
financial reporting environments and forecast performance of individual analysts,
Contemporary Accounting Research 22, 727-758.
Baron, D. P., 1982, A Model of the Demand for Investment Banking and Advising and
Distribution Services for New Issues, Journal of Finance 37, 955-976.
Barron, O., Kim, O., Lim, S., and Stevens, D., 1998, Using analysts’ forecasts to measure
properties of analysts’ information environment, The Accounting Review 73, 421– 433.
Barron, O., and Stuerke, P., 1998, Dispersion in analyst’s earnings forecasts as a measure of
uncertainty, Journal of Accounting, Auditing, and Finance 13, 243–268.
Beatty, R. and J. Ritter, 1986, Investment Banking, reputation, and the underpricing of initial
public offerings, Journal of Financial Economics 15, 213-232.
Benveniste, L. M. and Spindt, P. A., 1989, How investment bankers determine the offer price
and allocation of new issues, Journal of Financial Economics 24, 343–361.
Benveniste, L.M. and Wilhelm, W.J., 1990, A comparative analysis of IPO proceeds under
alternative regulatory environments. Journal of Financial Economics 28, 173-207.
Berkman, H., Cole, R.A., Fu, L.J. 2010, Political connections and minority-shareholder
protection: Evidence from securities-market regulation in China. Journal of Financial and
Quantitative Analysis 45, 1391-1417.
Carter, R. and S. Manaster, 1990, Initial public offerings and underwriter reputation, Journal of
Finance 45, 1045-1067.
Chan, K., J. Wang, K.C. Wei, 2004, Underpricing and long-term performance of IPOs in China,
Journal of Corporate Finance, 10 409–430.
Chen, G., M. Firth, J. B. Kim, 2004, IPO underpricing in China’s new stock markets, Journal of
Multinational Financial Management, 14, 283–302.
Chen, G., M. Firth, L.P. Xu, 2009, Does the type of ownership control matter? Evidence from
China’s listed companies, Journal of Banking and Finance, 33, 171–181.
Chen, C., H. Shi, H. Xu, 2014, The IPO underwriting market share in China: Do ownership and
quality matter? Journal of Banking and Finance 46, 177–189.
Chemmanur, T. J., 1993, The Pricing of Initial Public Offerings: A Dynamic Model with
Information Production. Journal of Finance 48, 285-304.
Chemmanur, T. J., He, S., and Hu, G., 2009, The role of institutional investors in seasoned
equity offerings, Journal of Financial Economics 94, 384-411.
Chemmanur, T. J., Hu, G., and Huang, J., 2010, The Role of Institutional Investors in Initial
Public Offerings, Review of Financial Studies 23, 4496-4540.

33
Cornelli, F., and Goldreich, D., 2001, Book Building and Strategic Allocation, The Journal of
Finance 56, 2337-2369.
Cornelli, F. and Goldreich, D., 2003, Bookbuilding: How informative is the order book? Journal
of Finance 58, 1415-1443.
Diether, K., C. Malloy, and A. Scherbina, 2002, Difference of Opinion and the Cross-Section of
Stock Returns, Journal of Finance 57, 2113-2141.
Dorn, D., 2009, Does Sentiment Drive the Retail Demand for IPOs? Journal of Financial and
Quantitative Analysis 44, 85-108. Fan, J., Wong, T., Zhang, T., 2007, Politically connected CEOs, corporate governance, and post-
IPO performance of China’s newly partially privatized firms. Journal of Financial
Economics 84, 330-357.
Field L. C., and Lowry, M., 2009, Institutional versus Individual Investment in IPOs: The
Importance of Firm Fundamentals. Journal of Financial and Quantitative Analysis 44,
489-516.
Firth, M., Lin, C., Zou, H, 2010, Friend or foe? The role of the state and mutual fund ownership
in the split shares structure reform in China. Journal of Financial and Quantitative
Analysis 45, 685-706.
Gul, F.A., Kim, J.B., Qiu, A.A., 2010, Ownership concentration, foreign shareholding, audit
quality, and stock price synchronicity: Evidence from China. Journal of Financial
Economics 95, 425-442.
Hanley, K., and Hoberg, G., 2010, The Information Content of IPO Prospectuses, Review of
Financial Studies 23, 2821-2864.
Hong, H., and J. Kubik, 2003, Analyzing the Analysts: Career Concerns and Biased Earnings
Forecasts, Journal of Finance 58, 313-351.
Hong, H., Kubik, J. D., and Jeremy, J. C., 2005, Thy Neighbor's Portfolio: Word-of-Mouth
Effects in the Holdings and Trades of Money Managers, Journal of Finance 60, 2801-
2824
Houge, T., Loughran, T., Suchanek, G., and Yan, X., 2001, Divergence of Opinion, Uncertainty
and the Quality of Initial Public Offerings, Financial Management 30, 5-23.
Imhoff, E., and Lobo, G., 1992, The effect of ex ante earnings uncertainty on earnings response
coefficients, The Accounting Review 67, 427–439.
Jackson, A., 2005, Trade Generation, Reputation and Sell-Side Analysts, Journal of Finance 60,
673-717.
Jacob, J., Lys, T. Z., and Neale, M. A., 1999, Expertise in forecasting performance of security
analysts, Journal of Accounting and Economics 28, 51-82.
Jain, B. A. and Kini, O, 1994, The post-issue operating performance of IPO firms, Journal of
Finance 49, 1699-1726.
Jenkinson, T. and H. Jones, 2004, Bids and allocations in European IPO book building, Journal
of Finance 59, 2309-2338.

34
Johnson, T. C., 2004, Forecast Dispersion and the Cross-Section of Expected Returns, Journal of
Finance 59, 1957-1978.
Ke, B., Ramalingegowda, S., 2005, Do institutional investors exploit the post-earnings
announcement drift? Journal of Accounting and Economics 39, 25-53.
Li, K., Wang, T., Cheung, Y. L., & Jiang, P. 2011, Privatization and risk sharing: Evidence from
the split share structure reform in China, Review of Financial Studies 24, 2499-2525.
Ljungqvist, A., 2004, IPO Underpricing, Handbook in Corporate Finance: Empirical Corporate
Finance edited by B. Espen Eckbo.
McGuinness, P., 1992, An examination of the underpricing of initial public offerings in Hong
Kong: 1980-1990. Journal of Business Finance and Accounting 19, 165-186.
Megginson W. L., and Weiss, K. A., 1991, Venture Capitalist Certification in Initial Public
Offerings, The Journal of Finance 46, 879-903.
Merton, R. C., 1987, A Simple Model of Capital Market Equilibrium with Incomplete
Information. The Journal of Finance 42, 483-510.
Miller E. M., 1977, Risk, Uncertainty, and Divergence of Opinion, Journal of Finance 32, 1151–
1168.
Mok, M. K., and Hui, Y. V., 1998, Underpricing and after-market performance of IPOs in
Shanghai, China. Pacific-Basin Finance Journal 6, 453–474.
Ritter, J., 1984, The ‘hot issue’ market of 1980, Journal of Business 32, 215-240.
Ritter, J., 2011, Equilibrium in the Initial Public Offerings Market, Annual Review of Financial
Economics 3, 347-374.
Ritter, J., Welch, I., 2002, A Review of IPO Activity, Pricing and Allocation, Journal of Finance
57, 1795-1828.
Rock, K., 1986, Why New Issues are Underpriced? Journal of Financial Economics 15, 187-212.
Sun, Q., Tong, W., 2003, China’s share issue privatization: The extent of its success. Journal of
Financial Economics 70, 183-222.
Varian, H. R., 1985, Divergence of Opinion in Complete Markets: A Note, Journal of Finance
40, 309-17.
Yu, T., and Tse, Y.K., 2006, An Empirical Examination of IPO Underpricing in the Chinese a-
Share Market, China Economic Review 17, 363-382.

35
Appendix A: Variable Definitions
Variables Definition
Panel A: Measure of dispersion
Dispersion Measure
(STD)
Defined as the ratio of the cross-sectional standard deviation of institutional investors’ pre-IPO bidding price to the absolute
value of the mean bidding price.
Dispersion Measure
(STD weighted)
Dispersion in institutional investors’ bidding price weighted by their bidding volumes.
Dispersion Measure
(MAD)
Defined as the mean absolute deviation of the bidding price surrounding the mean bidding price scaled by the mean bidding
price.
Panel B: IPO and firm characteristics
First-day Return Defined as the ratio of the closing price of the stock on its first trading day less the offer price to its offer price.
Turnover The proportion of trading volume to the number of IPO shares.
FBO dummy An indicator variable equal to one if the IPO first day closing price falls below the offering price.
Return Volatility Annualized 30-day volatility of market adjusted returns from the IPO listing date.
Firm age Log (# of years between founding and offering).
Firm size Log (Pre-issue book value of total assets in Millions RMB Yuan).
Offer size Log (# of shares offered times offer price in Millions RMB Yuan).
Time gap Log (1+ # of days between listing and offering).
ROE Return on equity calculated for the latest fiscal year prior to IPO.
Index return One month market return prior to IPO.
Oversubscription Log (ratio of total offline subscription from institutional investors divided by the number of shares allocated to institutional
investors).
Log # Institutions Log (1+ # of institutional participants).
VC/PE dummy An indicator variable equal to one if the firm is backed by VC or PE, and zero otherwise.
Allocation dummy An indicator variable equal to one if the IPO filing date is later than 5 November 2010 when the CSRC changed the offline
IPO share allocation rule from pro rata basis to lottery basis.
Lockup dummy An indicator variable equals to one if the IPO filing date is after 25 May 2012 when the CSRC removed the three-month
lockup period provision imposed on the institutional participants in the offline shares subscription.
ChiNext dummy An indicator variable equal to one if the firm is listed in the Shenzhen ChiNext Board and zero if it is listed in the SME Board.
Lead reputation (#) Log (1+total number of IPOs the lead underwriter has managed prior to the current IPO).
Panel C: Bidder and bid characteristics
Bid price accuracy % difference between bid price and offer price.
Distance Log (average of flight distance between bidder and IPO firm and average flight distance between bidder and all other bidders).

36
Distance (alternative) Log (average of Euclidian distance between bidder and IPO firm and average Euclidian distance between bidder and all other
bidders based on their geographical coordinates)
Largest (2nd
largest) bid A dummy variable that takes on a value of one if the bid size is in the fourth (third) size quartile within an IPO.
Early (Late) bid A dummy variable that equals to one if the bid submission time falls in the first (fourth) quartile within an IPO.
High (Medium) frequency A dummy variable set to one if total # of IPOs the bidder participated in is in the third (second) quartile during full sample
period.
Bidder type Dummy variables indicating bidder type: Brokerage firms (BJ), fund management (JJ), financial firms (CW), trust companies
(XT), insurance companies (BX), qualified foreign institutional investors (QF), individual bidders (GR) and institutional
bidders (TJ) independently recommended by the lead underwriter.

37
Table 1: Descriptive Statistics.
This table summarizes our IPO sample, which consists of 783 Chinese IPOs listed in Shenzhen SME Board or Shenzhen ChiNext Board between 10 July 2009
and 2 November 2012. Panel A reports mean, median, standard deviation, 10th, 25
th, 75
th, and 90
th percentile of the main variables used in this paper. Panel B
reports the Spearman correlation matrix where ***, **, and * indicate 1%, 5%, and 10% statistical significance levels respectively.
Panel A: Summary Statistics
Variable N Mean Median SD P10 P25 P75 P90
Initial return 783 0.3684 0.2719 0.4540 -0.0374 0.0768 0.5236 0.8547
Turnover 783 0.7101 0.7700 0.2039 0.3600 0.6300 0.8500 0.8900
STD 783 0.1557 0.1516 0.0336 0.1172 0.1330 0.1737 0.2022
MAD 783 0.1228 0.1202 0.0278 0.0903 0.1041 0.1383 0.1607
Firm age 783 1.8899 2.1058 0.7520 0.7747 1.3641 2.4122 2.7188
Offer size 783 6.4992 6.4378 0.6049 5.8171 6.0808 6.8416 7.2714
Time gap 783 2.4850 2.4849 0.2515 2.1972 2.3026 2.6391 2.7726
ROE 783 0.2370 0.2237 0.1220 0.1113 0.1620 0.2887 0.3632
Index return % 783 -0.2970 -0.3088 7.5257 -8.8330 -6.0113 4.8580 9.6056
Oversubscription 783 3.3804 3.4898 1.1758 1.7750 2.5055 4.3037 4.8250
Log # institutions 783 4.1662 4.1744 0.4636 3.5264 3.8067 4.5433 4.7791
VC/PE dummy 783 0.4994 0 0.5003 0 0 1 1
Allocation dummy 783 0.5236 1 0.4998 0 0 1 1
Lockup dummy 783 0.0830 0 0.2761 0 0 0 0
ChiNext dummy 783 0.4534 0 0.4981 0 0 1 1
Lead reputation 783 3.5230 3.9703 1.2949 1.6094 2.5649 4.5850 4.8283

38
Panel B: Spearman Correlation Matrix
ID Variable 1 2 3 4 5 6 7 8 9 10 11 12 13 14
1 Initial return 1.00
2 STD -0.01 1.00
3 Firm age -0.05 -0.08** 1.00
4 Offer size -0.27*** -0.05 -0.14*** 1.00
5 Time gap 0.16*** 0.15*** -0.18*** 0.09** 1.00
6 ROE -0.20*** 0.01 -0.05 0.05 -0.16*** 1.00
7 Index return % 0.47*** -0.06 -0.01 0.03 0.12*** -0.14*** 1.00
8 Oversubscription 0.48*** -0.13*** -0.25*** 0.06* 0.30*** -0.25*** 0.13*** 1.00
9 Log # institutions 0.44*** -0.17*** -0.24*** 0.23*** 0.25*** -0.27*** 0.16*** 0.88*** 1.00
10 VC/PE dummy -0.02 -0.09*** -0.02 0.02 -0.02 -0.07** 0.04 -0.04 -0.03 1.00
11 Allocation dummy -0.37*** -0.15*** 0.35*** -0.19*** -0.47*** 0.21*** -0.22*** -0.73*** -0.68*** 0.06* 1.00
12 Lockup dummy -0.16*** -0.07** 0.17*** -0.19*** -0.12*** 0.12*** -0.09*** -0.13*** -0.14*** 0.04 0.29*** 1.00
13 ChiNext dummy -0.03 -0.10*** 0.00 -0.27*** -0.03 0.16*** 0.00 -0.09** -0.19*** 0.14*** 0.14*** 0.06* 1.00
14 Lead reputation -0.13*** -0.12*** 0.08** 0.05 -0.11*** 0.06* -0.03 -0.22*** -0.18*** 0.13*** 0.24*** 0.10*** 0.01 1.00

39
Figure 1: Number of IPOs and Average Underpricing.
This figure depicts number of IPOs and average underpricing on a quarterly basis for our full
IPO sample which consists of 783 firms listed in Shenzhen SME board or the ChiNext board
during the period of 2009Q3 to 2012Q4. The blue bars show the number of IPOs for each
quarter and the red line shows the quarterly average IPO underpricing.

40
Table 2: Dispersion and IPO Underpricing – Baseline Regression.
The dependent variable is the IPO first-day return, defined as the ratio of the closing price of the stock
on its first trading day less the offer price to its offer price. The variable of interest is dispersion
measure STD defined as the ratio of the cross-sectional standard deviation of institutional investors’
bidding price in the offline subscription process to the mean bidding price. Variable definitions are
given in Appendix A. Reported are coefficients and t-value calculated using the industry clustered
standard errors. ***, **, and * indicate 1%, 5%, and 10% statistical significance levels respectively.
Dependent variable: First-day return
(1) (2) (3) (4)
STD 1.6539***
(5.69)
1.6563***
(5.78)
1.5651***
(4.75)
1.5737***
(4.93)
Firm age 0.0150
(0.98)
0.0120
(0.82)
0.0116
(0.97)
0.0079
(0.77)
offer size -0.2137***
(-14.07)
-0.2204***
(-12.66)
-0.2058***
(-15.01)
-0.2129***
(-15.36)
Time gap 0.1232**
(3.08)
0.1200**
(2.96)
0.1093***
(3.54)
0.1043***
(3.56)
ROE -0.0215
(-0.81)
-0.0029
(-0.13)
0.0020
(0.06)
0.0245
(0.86)
INDEX21_shenA 0.0211***
(19.86)
0.0212***
(19.67)
0.0212***
(16.14)
0.0213***
(16.64)
Oversubscription 0.1425***
(5.75)
0.1468***
(6.54)
0.1372***
(5.54)
0.1414***
(6.31)
Log # institutions 0.1817***
(4.70)
0.1834***
(4.92)
0.1320***
(5.74)
0.1310***
(6.31)
VC/PE dummy -0.0036
(-0.15)
-0.0027
(-0.11)
-0.0080
(-0.38)
-0.0071
(-0.34)
Allocation dummy 0.1735***
(4.50)
0.1786***
(4.87)
0.2266***
(15.18)
0.2291***
(17.44)
Lockup dummy -0.1146*
(-2.10)
-0.1099*
(-1.97)
-0.0937
(-1.46)
-0.0839
(-1.32)
ChiNext dummy -0.0639**
(-2.97)
-0.0660***
(-3.14)
-0.0645**
(-2.93)
-0.0676***
(-3.28)
Lead reputation 0.0086
(1.52)
0.0076
(1.41)
0.0077
(1.71)
0.0070
(1.60)
Constant -0.1424
(-1.04)
-0.1754
(-1.25)
0.2150*
(1.80)
0.2402
(1.61)
Industry FE No Yes No Yes
Year FE No No Yes Yes
N 783 783 783 783
adj. R2 0.379 0.378 0.384 0.384

41
Table 3: Dispersion and IPO Underpricing – Instrumental Variable Approach.
This table reports results from 2SLS instrumental variable regressions, where the relative ratio of lead
underwriter’s IPO valuation range to the midpoint of valuation range, i.e., 2 × (𝑃𝑟𝑐𝐻−𝑃𝑟𝑐𝐿
𝑃𝑟𝑐𝐻+𝑃𝑟𝑐𝐿) is used as
an instrumental variable for the bidding price dispersion, i.e. STD, defined as the ratio of the cross-
sectional standard deviation of institutional investors’ bidding price in the offline subscription process
to the mean bidding price. The dependent variable is the IPO initial return, defined as the ratio of the
closing price of the stock on its first trading day less the offer price to its offer price. Variable
definitions are given in Appendix A. Reported are coefficients and t-value calculated using the
industry clustered standard errors. ***, **, and * indicate 1%, 5%, and 10% statistical significance
levels respectively.
Panel A: First-stage regression Panel B: Second-stage regression
Dependent variable: STD Dependent variable: First-day return
Price band ratio 0.0545***
(6.97)
Fitted STD 6.8883***
(5.89)
Firm age -0.0012**
(-2.26)
Firm age 0.0122
(1.10)
Offer size -0.0042**
(-2.46)
Offer size -0.1882***
(-15.11)
Time gap 0.0123***
(6.11)
Time gap 0.0307
(1.72)
ROE 0.0013
(0.19)
ROE 0.0182
(0.79)
INDEX21_shenA -0.0004***
(-8.09)
INDEX21_shenA 0.0235***
(28.70)
Oversubscription -0.0091***
(-5.58)
Oversubscription 0.1907***
(14.52)
Log # institutions -0.0246***
(-7.48)
Log # institutions 0.2573***
(6.05)
VC/PE dummy -0.0020
(-1.37)
VC/PE dummy 0.0044
(0.18)
Allocation dummy -0.0288***
(-10.05)
Allocation dummy 0.3829***
(10.22)
Lockup dummy 0.0001
(0.04)
Lockup dummy -0.0828
(-1.27)
ChiNext dummy -0.0093***
(-11.36)
ChiNext dummy -0.0170
(-0.53)
Lead reputation -0.0025***
(-7.92)
Lead reputation 0.0207***
(3.19)
Constant 0.3057***
(20.35)
Constant -1.4056***
(-3.52)
Industry FE Yes Industry FE Yes
Year FE Yes Year FE Yes
N 783 N 783
adj. R2 0.246 adj. R
2 0.376

42
Table 4: Alternative Dispersion Measures and IPO Underpricing.
The dependent variable is the IPO initial return, defined as the ratio of the closing price of the stock
on its first trading day less the offer price to its offer price. The variables of interest are the alternative
dispersion measures MAD and STD weighted, where MAD is defined as the mean absolute deviation
of the bidding price surrounding the mean bidding price scaled by the mean bidding price and STD
weighted is calculated as the biding price dispersion among institutional investors weighted by their
bidding volume. Variable definitions are given in Appendix A. Reported are coefficients and t-value
calculated using the industry clustered standard errors. ***, **, and * indicate 1%, 5%, and 10%
statistical significance levels respectively.
Dependent variable: First-day return
(1) (2) (3) (4)
MAD 2.0272***
(4.86)
1.9612***
(4.46)
STD weighted
1.4750***
(4.84)
1.4530***
(4.71)
Firm age 0.0153
(1.01)
0.0081
(0.79)
0.0160
(1.05)
0.0085
(0.84)
Offer size -0.2140***
(-14.53)
-0.2128***
(-15.96)
-0.2163***
(-14.33)
-0.2148***
(-15.95)
Time gap 0.1240**
(3.06)
0.1044***
(3.51)
0.1280**
(3.03)
0.1076***
(3.49)
ROE -0.0211
(-0.77)
0.0248
(0.90)
-0.0270
(-0.99)
0.0193
(0.63)
INDEX21_shenA 0.0211***
(19.86)
0.0213***
(16.65)
0.0210***
(20.06)
0.0213***
(16.89)
Oversubscription 0.1417***
(5.71)
0.1408***
(6.30)
0.1422***
(5.60)
0.1415***
(6.19)
Log # institutions 0.1855***
(4.85)
0.1350***
(6.43)
0.1725***
(4.15)
0.1219***
(5.21)
VC/PE dummy -0.0036
(-0.15)
-0.0070
(-0.33)
-0.0045
(-0.18)
-0.0083
(-0.38)
Allocation dummy 0.1711***
(4.39)
0.2288***
(16.13)
0.1686***
(4.46)
0.2280***
(17.48)
Lockup dummy -0.1158*
(-2.13)
-0.0867
(-1.37)
-0.1138*
(-2.06)
-0.0831
(-1.30)
ChiNext dummy -0.0644**
(-2.98)
-0.0682***
(-3.30)
-0.0625**
(-3.03)
-0.0658***
(-3.29)
Lead reputation 0.0093
(1.65)
0.0077
(1.73)
0.0082
(1.42)
0.0067
(1.48)
Constant -0.1492
(-1.07)
0.2230
(1.51)
-0.0667
(-0.43)
0.3079**
(2.32)
Industry FE No Yes No Yes
Year FE No Yes No Yes
N 783 783 783 783
adj. R2 0.379 0.385 0.377 0.383

43
Table 5: Dispersion and IPO Underpricing – Cross-sectional Analysis.
This table reports regression results using subsamples based on offer size, time gap and lead
underwriter reputation respectively. The dependent variable is the IPO initial return, defined as the
ratio of the closing price of the stock on its first trading day less the offer price to its offer price. The
variable of interest is dispersion measure STD defined as the ratio of the cross-sectional standard
deviation of institutional investors’ bidding price in the offline subscription process to the mean
bidding price. Variable definitions are given in Appendix A. Reported are coefficients and t-value
calculated using the industry clustered standard errors. ***, **, and * indicate 1%, 5%, and 10%
statistical significance levels respectively.
Dependent variable: First-day return
Offer Size Time Gap Underwriter Reputation
Small Large Short Long Low High
(1) (2) (3) (4) (5) (6)
STD 1.5751***
(3.91)
0.8507***
(4.97)
2.2730***
(4.11)
0.5274*
(2.12)
2.6365***
(4.47)
0.9433***
(3.37)
Firm age -0.0003
(-0.01)
0.0194***
(3.18)
-0.0126
(-0.73)
0.0139
(1.31)
0.0242
(1.19)
-0.0009
(-0.07)
Offer size -0.5993***
(-6.92)
-0.0283
(-1.61)
-0.1974***
(-9.83)
-0.2566***
(-6.54)
-0.3038***
(-10.25)
-0.1494***
(-8.48)
Time gap 0.2011***
(7.11)
0.0090
(0.18)
-0.3300***
(-3.61)
0.0774
(0.92)
0.0880
(0.89)
0.0685**
(2.44)
ROE -0.1501**
(-2.47)
0.0344
(1.04)
0.0954*
(1.90)
-0.0959**
(-2.33)
0.2779**
(2.46)
-0.1135*
(-2.20)
INDEX21_shenA 0.0279***
(9.69)
0.0152***
(22.59)
0.0219***
(24.76)
0.0187***
(9.37)
0.0198***
(11.52)
0.0223***
(16.57)
Oversubscription 0.1635***
(3.28)
0.0952***
(22.91)
0.1683***
(9.72)
0.1082***
(3.57)
0.1924***
(7.75)
0.0625**
(2.53)
Log # institutions 0.1632***
(3.61)
0.1273***
(5.06)
0.1575***
(4.40)
0.1459***
(7.18)
0.2057***
(4.82)
0.1621***
(3.22)
VC/PE dummy -0.0282
(-0.78)
0.0001
(0.01)
-0.0249
(-0.99)
-0.0047
(-0.21)
-0.0414**
(-2.62)
0.0140
(0.39)
Allocation_ dummy 0.3685***
(12.07)
0.1123***
(4.11)
0.1739***
(11.14)
0.3263***
(12.48)
0.2638***
(9.02)
0.2298***
(14.65)
Lockup dummy -0.0366
(-0.58)
-0.0823**
(-2.89)
-0.0565
(-0.77)
-0.2215***
(-5.47)
-0.0190
(-0.27)
-0.1770**
(-3.05)
ChiNext dummy -0.1425***
(-4.37)
-0.0297
(-1.25)
-0.1257***
(-7.92)
-0.0319
(-1.41)
-0.1521***
(-4.57)
0.0059
(0.28)
Lead reputation 0.0389***
(7.81)
-0.0110**
(-2.54)
0.0214***
(4.34)
-0.0077
(-0.47)
0.0589***
(4.51)
-0.0156
(-1.64)
Constant 2.3038***
(4.25)
-0.5130*
(-2.11)
0.7093***
(4.63)
0.9742***
(3.94)
-0.2811
(-1.43)
0.3455*
(1.89)
Industry FE Yes Yes Yes Yes Yes Yes
Year FE Yes Yes Yes Yes Yes Yes
N 393 390 493 290 397 386
adj. R2 0.428 0.387 0.385 0.407 0.373 0.455

44
Table 6: Dispersion and IPO Underpricing by Bidder Category.
The dependent variable is the IPO initial return. The variable of interest is the dispersion measure STD
defined as the ratio of the cross-sectional standard deviation of institutional investors’ bidding price in
the offline subscription process to the mean bidding price. We calculate bidding price dispersion for
each different type of institutional investors separately. Specifically, STD_bj is the dispersion measure
calculated among the stock brokerage firms; STD_jj is the dispersion measured using only fund
management firms; STD_cw is calculated among financial companies; STD_xt refers to the dispersion
among trust companies; STD_bx is measured using insurance companies only; and STD_qf is the
dispersion measured among qualified foreign institutional investors (QFIIs). Variable definitions are
given in Appendix A. Reported are coefficients and t-value calculated using the industry clustered
standard errors. ***, **, and * indicate 1%, 5%, and 10% statistical significance levels respectively.
Dependent variable: First-day return
(1) (2) (3) (4) (5) (6)
STD_bj 1.4043***
(9.65)
STD_jj
1.1918***
(4.27)
STD_cw
0.6083*
(2.16)
STD_xt
0.2672
(1.71)
STD_bx
0.0745
(0.96)
STD_qf
0.0486
(0.16)
Firm age 0.0053
(0.45)
0.0089
(0.97)
0.0100
(0.66)
0.0088
(0.86)
-0.0268***
(-3.37)
0.0254
(0.43)
Offer size -0.2176***
(-16.83)
-0.2111***
(-14.66)
-0.2258***
(-15.95)
-0.2229***
(-17.26)
-0.2289***
(-29.33)
-0.1278
(-0.95)
Time gap 0.1021***
(3.80)
0.1290***
(4.80)
0.1124***
(3.79)
0.1287***
(4.40)
-0.2101***
(-7.59)
0.3824**
(2.75)
ROE 0.0314
(1.11)
0.0170
(0.53)
-0.0172
(-0.54)
-0.0104
(-0.37)
0.0813*
(1.88)
-0.6813
(-1.34)
INDEX21_shenA 0.0214***
(19.44)
0.0212***
(16.65)
0.0210***
(12.76)
0.0208***
(16.72)
0.0233***
(25.83)
0.0300**
(3.29)
Oversubscription 0.1369***
(7.24)
0.1394***
(5.97)
0.1476***
(4.33)
0.1350***
(5.30)
0.1920***
(8.10)
0.3244***
(7.50)
Log # institutions 0.1268***
(6.03)
0.1227***
(6.58)
0.0942**
(2.30)
0.1120***
(3.61)
0.0542*
(2.06)
0.5607**
(2.86)
VC/PE dummy -0.0062
(-0.29)
-0.0082
(-0.37)
-0.0157
(-0.66)
-0.0227
(-1.03)
-0.0554***
(-4.63)
0.1248
(0.97)
Allocation dummy 0.2088***
(18.53)
0.2346***
(15.96)
0.1943***
(9.62)
0.1978***
(14.03)
0.1745***
(10.20)
-0.0018
(-0.01)
Lockup dummy -0.0796
(-1.34)
-0.0917
(-1.54)
-0.1513***
(-4.06)
-0.1261*
(-1.84)
0.0282
(0.71)
0.0000
(.)
ChiNext dummy -0.0848***
(-3.44)
-0.0769***
(-3.73)
-0.0820***
(-3.19)
-0.0710**
(-2.84)
0.2287
(1.07)
0.0636
(0.57)
Lead reputation 0.0048
(1.05)
0.0063
(1.71)
0.0044
(0.82)
0.0045
(1.11)
0.0242***
(6.97)
-0.0009
(-0.04)
Constant 0.3552**
(2.78)
0.2835
(1.70)
0.5906***
(4.63)
0.5770***
(5.04)
1.1869***
(6.56)
-4.2271*
(-2.17)
Industry FE Yes Yes Yes Yes Yes Yes
Year FE Yes Yes Yes Yes Yes Yes
N 783 783 709 730 414 86
adj. R2 0.384 0.383 0.374 0.377 0.341 0.321

45
Table 7: Impact of Share Allocation Reform on Dispersion. This table presents regression results on the impact of share allocation reform on the divergence of
opinions about an IPO among institutional bidders. Panel A reports summary statistics of main
variables before and after the share allocation reform by the CSRC in 5 November 2010 and compares
the mean differences. Panel B reports the regression results. The dependent variable is the dispersion
measure STD, which is defined as the ratio of the cross-sectional standard deviation of institutional
investors’ bidding price in the offline subscription process to the mean bidding price. The variable of
interest is the Allocation dummy, which equals to one if the IPO filing date is after than 5 November
2010 when the CSRC changed the offline IPO share allocation rule from a pro-rata system to a lottery
system. We use baseline regression specifications and variable definitions are given in Appendix A.
Reported are coefficients and t-value calculated using the industry clustered standard errors. ***, **,
and * indicate 1%, 5%, and 10% statistical significance levels respectively.
Panel A: Impact of Share Allocation Reform on Dispersion - Univariate Tests
Allocation Dummy = 0
(Pro-rata basis)
Allocation Dummy = 1
(Lottery basis)
0 vs. 1
(Pro-rata vs. Lottery)
N Mean N Mean Diff T-stat
IPO Initial Return 373 0.5024 410 0.2465 -0.2559 -8.21***
STD 373 0.1609 410 0.1510 -0.0099 -4.16***
Firm age 373 1.6203 410 2.1351 0.5147 10.17***
Offer size 373 6.6104 410 6.3979 -0.2125 -4.98***
Time gap 373 2.5977 410 2.3824 -0.2153 -13.23***
ROE 373 0.2160 410 0.2561 0.0401 4.65***
Index return (%) 373 1.2780 410 -1.7299 -3.0079 -5.70***
Oversubscription 373 4.2545 410 2.5851 -1.6693 -28.14***
Log # institutions 373 4.4937 410 3.8683 -0.6254 -25.51***
VC/PE dummy 373 0.4665 410 0.5293 0.0628 1.76*
ChiNext dummy 373 0.3780 410 0.5220 0.1439 4.08***
Lead reputation 373 3.2946 410 3.7307 0.4361 4.77***
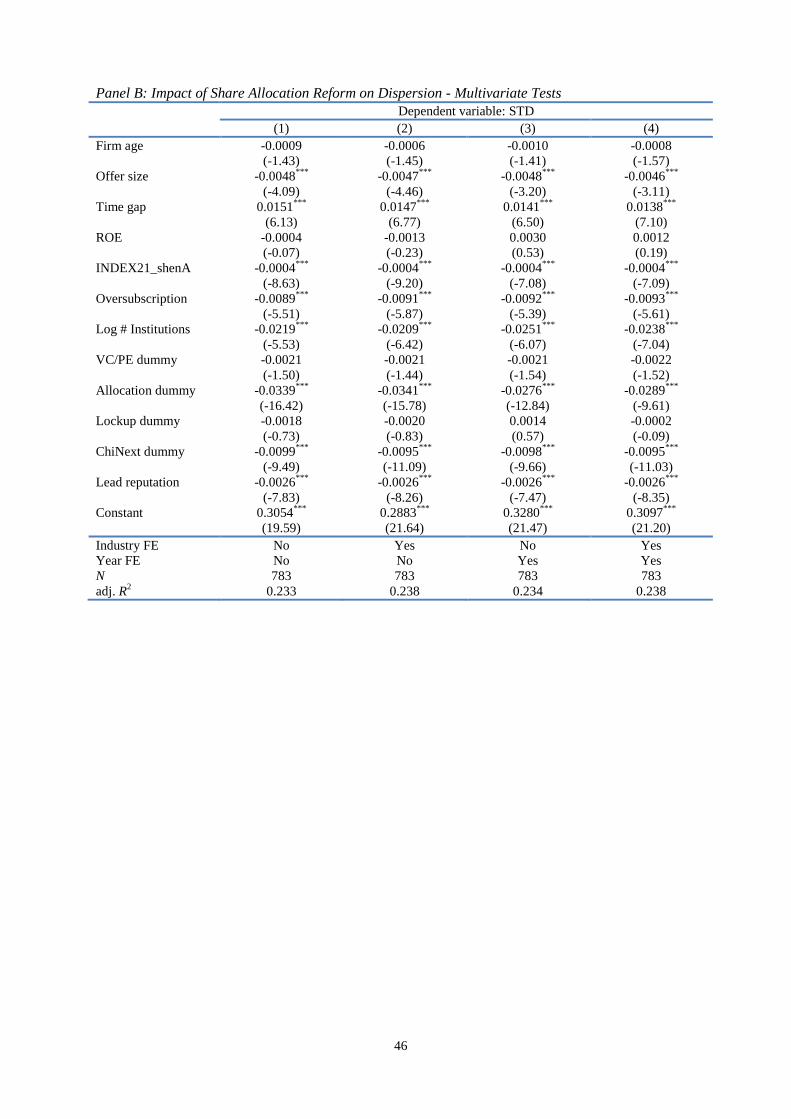
46
Panel B: Impact of Share Allocation Reform on Dispersion - Multivariate Tests
Dependent variable: STD
(1) (2) (3) (4)
Firm age -0.0009
(-1.43)
-0.0006
(-1.45)
-0.0010
(-1.41)
-0.0008
(-1.57)
Offer size -0.0048***
(-4.09)
-0.0047***
(-4.46)
-0.0048***
(-3.20)
-0.0046***
(-3.11)
Time gap 0.0151***
(6.13)
0.0147***
(6.77)
0.0141***
(6.50)
0.0138***
(7.10)
ROE -0.0004
(-0.07)
-0.0013
(-0.23)
0.0030
(0.53)
0.0012
(0.19)
INDEX21_shenA -0.0004***
(-8.63)
-0.0004***
(-9.20)
-0.0004***
(-7.08)
-0.0004***
(-7.09)
Oversubscription -0.0089***
(-5.51)
-0.0091***
(-5.87)
-0.0092***
(-5.39)
-0.0093***
(-5.61)
Log # Institutions -0.0219***
(-5.53)
-0.0209***
(-6.42)
-0.0251***
(-6.07)
-0.0238***
(-7.04)
VC/PE dummy -0.0021
(-1.50)
-0.0021
(-1.44)
-0.0021
(-1.54)
-0.0022
(-1.52)
Allocation dummy -0.0339***
(-16.42)
-0.0341***
(-15.78)
-0.0276***
(-12.84)
-0.0289***
(-9.61)
Lockup dummy -0.0018
(-0.73)
-0.0020
(-0.83)
0.0014
(0.57)
-0.0002
(-0.09)
ChiNext dummy -0.0099***
(-9.49)
-0.0095***
(-11.09)
-0.0098***
(-9.66)
-0.0095***
(-11.03)
Lead reputation -0.0026***
(-7.83)
-0.0026***
(-8.26)
-0.0026***
(-7.47)
-0.0026***
(-8.35)
Constant 0.3054***
(19.59)
0.2883***
(21.64)
0.3280***
(21.47)
0.3097***
(21.20)
Industry FE No Yes No Yes
Year FE No No Yes Yes
N 783 783 783 783
adj. R2 0.233 0.238 0.234 0.238

47
Table 8: Share Allocation Reform, Dispersion and IPO Underpricing.
The dependent variable is the IPO initial return, defined as the ratio of the closing price of the stock on
its first trading day less the offer price to its offer price. The dispersion measure STD is defined as the
ratio of the cross-sectional standard deviation of institutional investors’ bidding price in the offline
subscription process to the mean bidding price. Allocation Dummy equals to one if the IPO filing date is
later than 5 November 2010 when the CSRC changed the offline IPO share allocation rule from pro rata
basis to lottery basis. In column (1) we include interaction term between Dispersion measure and the
Allocation dummy in our baseline regression. In column (2), we report baseline regression results using
the subsample firms with pro-rata share allocation (i.e., Allocation dummy = 0). Results in column (3)
describe regression output for subsample firms with lottery share allocation (i.e., Allocation dummy =
1). Variable definitions are given in Appendix A. Reported are coefficients and t-value calculated using
the industry clustered standard errors. ***, **, and * indicate 1%, 5%, and 10% statistical significance
levels respectively.
Dependent variable: First-day return
Full Sample Allocation dummy = 0 Allocation dummy = 1
(1) (2) (3)
STD 0.9593**
(2.70)
0.9903***
(5.09)
2.2825***
(6.26)
STD ×
Allocation dummy
1.0917***
(4.52)
Firm age 0.0070
(0.66)
0.0008
(0.05)
0.0073
(0.79)
Offer size -0.2153***
(-16.07)
-0.2332***
(-11.56)
-0.2002***
(-13.15)
Time gap 0.1125***
(3.81)
0.1481***
(7.13)
-0.0452
(-1.17)
ROE 0.0217
(0.78)
-0.1103***
(-4.10)
0.1718***
(5.31)
INDEX21_shenA 0.0211***
(16.81)
0.0220***
(20.14)
0.0181***
(16.18)
Oversubscription 0.1415***
(6.44)
0.1015***
(6.26)
0.1711***
(7.55)
Log # Institutions 0.1276***
(6.14)
0.2082***
(6.06)
0.1464***
(4.04)
VC/PE dummy -0.0049
(-0.23)
-0.0014
(-0.05)
-0.0254
(-1.55)
Allocation dummy 0.0654
(1.78)
Lockup dummy -0.0774
(-1.20)
0.0000
(.)
-0.1163
(-1.58)
ChiNext dummy -0.0700***
(-3.14)
-0.0160
(-0.49)
-0.1364***
(-5.42)
Lead reputation 0.0068
(1.46)
0.0010
(0.16)
0.0229***
(5.81)
Constant 0.3519**
(2.49)
0.2036
(0.93)
0.2748
(1.71)
Industry FE Yes Yes Yes
Year FE Yes Yes Yes
N 783 373 410
adj. R2 0.385 0.359 0.302

48
Table 9: Dispersion and Post-IPO Stock Performance. This table reports regression results with post-IPO stock performance measured as the one-, three- and six-month buy and hold returns (BHRs) as dependent
variables. BHRs are calculated using monthly stock returns starting from the first month after the IPO listing date. Cumulative abnormal returns (CARs) are
measured as the cumulative difference between monthly return of IPO and corresponding monthly return of value-weighted market index. Panel A presents
summary statistics of post-IPO stock performance measures. Panel B reports regression results with corresponding stock performance measures as dependent
variables. Specifically, the first three columns report results using all sample IPOs. The last six columns reports results using IPOs with and without three-month
lockup provision respectively. The variable of interest is dispersion measure STD defined as the ratio of the cross-sectional standard deviation of institutional
investors’ bidding price in the offline subscription process to the mean bidding price. In all regression specifications, we control for firm and issue specific
characteristics. However, we don’t report their coefficient estimates to save space. Variable definitions are given in Appendix A. Reported are coefficients and t-
value calculated using the industry clustered standard errors. ***, **, and * indicate 1%, 5%, and 10% statistical significance levels respectively.
Panel A: Summary Statistics of Post-IPO Stock Performance
Variable N Mean Median SD P10 P25 P75 P90
BHR_1m 783 -0.62% -1.72% 15.81% -18.42% -11.31% 8.47% 17.96%
BHR_3m 783 -2.58% -6.22% 21.84% -26.51% -17.63% 9.07% 26.46%
BHR_6m 783 -2.07% -8.81% 29.72% -34.37% -22.77% 14.82% 35.54%
CAR_1m 783 -0.60% -2.36% 12.84% -13.67% -8.05% 4.50% 14.58%
CAR_3m 783 -2.43% -3.90% 17.77% -23.13% -13.85% 7.16% 19.61%
CAR_6m 783 -0.58% -4.02% 23.85% -29.20% -17.56% 13.87% 31.20%

49
Panel B: Impact of Dispersion on Post-IPO Stock Performance
Full sample IPOs IPOs with three-month lockup provision IPOs without three-month lockup provision
BHR_1m BHR_3m BHR_6m BHR_1m BHR_3m BHR_6m BHR_1m BHR_3m BHR_6m
(1) (2) (3) (4) (5) (6) (7) (8) (9)
STD -0.0108
(-0.11)
-0.2874**
(-2.85)
0.0062
(0.04)
0.0224
(0.19)
-0.3457***
(-3.29)
0.0441
(0.42)
-0.2079
(-1.52)
0.4062
(1.07)
-0.0883
(-0.09)
Market return 1m 1.3131***
(30.56)
1.3230***
(33.10)
1.6429***
(5.68)
Market return 3m
1.2037***
(22.87)
1.1917***
(22.57)
1.3181***
(3.86)
Market return 6m
1.0864***
(31.45)
1.1041***
(29.82)
1.3820***
(14.85)
Other controls Yes Yes Yes Yes Yes Yes Yes Yes Yes
Industry FE Yes Yes Yes Yes Yes Yes Yes Yes Yes
Year FE Yes Yes Yes Yes Yes Yes Yes Yes Yes
N 783 783 783 718 718 718 65 65 65
adj. R2 0.372 0.407 0.366 0.387 0.414 0.373 0.116 0.271 0.261

50
Table 10: Dispersion and Post-IPO Operating Performance. This table reports regression results
with post-IPO operating performance measured as the one-, two- and three-year ROE and ROA as
dependent variables. Panel A presents summary statistics of post-IPO operating performance
measures. Panel B reports regression results with corresponding operating performance measures as
dependent variables. The variable of interest is dispersion measure STD defined as the ratio of the
cross-sectional standard deviation of institutional investors’ bidding price in the offline subscription
process to the mean bidding price. Variable definitions are given in Appendix A. Reported are
coefficients and t-value calculated using the industry clustered standard errors. ***, **, and * indicate
1%, 5%, and 10% statistical significance levels respectively.
Panel A: Summary Statistics of Post-IPO Operating Performance
Variable N Mean Median SD P10 P25 P75 P90
ROE_1yr 783 8.21% 7.79% 2.89% 5.20% 6.29% 9.73% 11.62%
ROE_2yr 731 7.68% 7.50% 4.70% 3.18% 5.01% 10.16% 12.75%
ROE_3yr 544 6.45% 6.48% 8.55% 1.50% 3.72% 9.72% 13.28%
ROA_1yr 783 6.64% 6.29% 2.48% 3.95% 5.03% 7.88% 9.46%
ROA_2yr 731 6.03% 5.86% 3.69% 2.36% 3.77% 7.99% 10.20%
ROA_3yr 544 4.99% 4.83% 4.61% 1.06% 2.60% 7.32% 10.03%

51
Panel B: Impact of Dispersion on Post-IPO Operating Performance
ROE_1yr ROE_2yr ROE_3yr ROA_1yr ROA_2yr ROA_3yr
(1) (2) (3) (4) (5) (6)
STD -0.0621***
(-4.63)
-0.1029
(-1.60)
0.0004
(0.01)
-0.0359***
(-4.29)
-0.0565
(-1.23)
-0.0040
(-0.11)
Firm age 0.0005
(0.90)
0.0036**
(2.53)
0.0086***
(6.25)
-0.0003
(-0.65)
0.0027**
(2.85)
0.0072***
(10.18)
Offer size 0.0085***
(8.33)
0.0107***
(6.00)
-0.0002
(-0.05)
0.0087***
(11.22)
0.0100***
(9.85)
0.0075***
(4.82)
Time gap 0.0083***
(4.90)
0.0123
(1.60)
0.0423***
(6.38)
0.0083***
(6.32)
0.0114**
(2.22)
0.0299***
(3.76)
ROE 0.0606***
(10.41)
0.0446***
(4.20)
0.0909***
(3.55)
0.0652***
(10.61)
0.0501***
(8.26)
0.0559***
(5.83)
Market return 1yr 0.0087
(1.14)
0.0018
(0.28)
Market return 2yr
0.0162***
(3.11)
0.0062**
(2.70)
Market return 3yr
0.0228***
(4.08)
0.0100
(1.78)
Oversubscription 0.0005
(0.60)
0.0051***
(3.75)
0.0107***
(4.38)
0.0014*
(2.15)
0.0037***
(3.89)
0.0048***
(3.46)
Log # institutions -0.0125***
(-7.99)
-0.0117
(-1.64)
-0.0091*
(-1.81)
-0.0056***
(-4.43)
-0.0018
(-0.42)
0.0006
(0.17)
VC/PE dummy -0.0047***
(-3.19)
-0.0132***
(-7.27)
-0.0109***
(-5.54)
-0.0040***
(-3.17)
-0.0109***
(-7.15)
-0.0076***
(-5.68)
Allocation dummy -0.0014
(-0.32)
0.0016
(0.84)
0.0308***
(5.22)
-0.0004
(-0.12)
0.0061***
(4.77)
0.0189***
(9.83)
Lockup dummy -0.0053***
(-3.59)
-0.0154**
(-2.69)
0.0000
(.)
-0.0046**
(-2.71)
-0.0140***
(-4.22)
0.0000
(.)
ChiNext dummy -0.0068***
(-7.29)
-0.0037
(-1.31)
-0.0124***
(-3.23)
-0.0002
(-0.15)
0.0026
(1.35)
-0.0021
(-0.52)
Lead reputation 0.0010*
(1.89)
0.0023
(1.68)
0.0006
(0.33)
0.0011**
(2.41)
0.0018*
(1.80)
0.0014
(1.31)
Constant 0.0598***
(3.76)
0.0320
(0.48)
-0.0220
(-0.33)
0.0027
(0.17)
-0.0313
(-0.78)
-0.0939*
(-1.94)
Industry FE Yes Yes Yes Yes Yes Yes
Year FE Yes Yes Yes Yes Yes Yes
N 783 731 544 783 731 544
adj. R2 0.258 0.098 0.042 0.247 0.101 0.105

52
Table 11: Bidder Characteristics and Bid Price Accuracy. This table reports results of regression
analysis on the determinants of bid price accuracy. Panel A reports estimates of OLS regressions in
which the dependent variable is the continuous measure of bid price accuracy, defined as the
percentage difference between bid price and offer price. Panel B reports estimates of a probit model in
which the left-hand side dependent variable is a dummy variable indicating whether the bid price is
above offer price or not. Independent variables capture a variety of bidder characteristics such as the
size of the bid, the timing of the bid, the participation frequency of the bidder, the type of the bidder
as well as the distance measures between bidder and IPO firm and between bidders. We include issue
level fixed effects for all specifications. Variable definitions are given in Appendix A. Reported are
coefficients and t-values calculated using robust standard errors with clustering on issues. ***, **, and
* indicate 1%, 5%, and 10% statistical significance levels respectively.
Panel A: OLS regression Panel B: Probit regression
Dependent variable: % difference
between bid price and offer price
Dependent variable: 1 if bid price >
offer price, otherwise 0
(1) (2) (3) (4)
Distance 0.0259***
(3.58)
-0.0537***
(-3.55)
Distance (alternative)
0.0270***
(4.19)
-0.0567***
(-4.22)
Largest bid 0.0006
(0.10)
0.0005
(0.070)
-0.001
(-0.07)
-0.0006
(-0.04)
Second largest bid -0.0128
(-1.34)
-0.0129
(-1.35)
0.0271
(1.29)
0.0273
(1.31)
Early bid 0.0328***
(3.70)
0.0331***
(3.73)
-0.0572***
(-3.00)
-0.0577***
(-3.03)
Late bid -0.0441***
(-4.82)
-0.0441***
(-4.82)
0.0849***
(4.42)
0.0849***
(4.43)
High frequency -0.0783***
(-2.69)
-0.0782***
(-2.69)
0.1834***
(2.79)
0.1834***
(2.79)
Medium frequency -0.0843***
(-3.21)
-0.0844***
(-3.22)
0.1891***
(3.18)
0.1894***
(3.18)
Type_bx 0.111***
(7.49)
0.112***
(7.50)
-0.2485***
(-7.87)
-0.2497***
(-7.89)
Type_cw -0.0668***
(-6.57)
-0.0665***
(-6.54)
0.1181***
(5.67)
0.1175***
(5.64)
Type_gr 0.0648
(0.37)
0.0657
(0.38)
1.2220***
(15.48)
1.2220***
(15.52)
Type_jj -0.0522***
(-5.29)
-0.0518***
(-5.25)
0.1042***
(4.98)
0.1033***
(4.93)
Type_qf -0.0641*
(-1.91)
-0.0632*
(-1.89)
0.1037
(1.53)
0.1018
(1.50)
Type_tj
-0.0639***
(-3.11)
-0.0629***
(-3.07)
0.1470***
(3.28)
0.1448***
(3.28)
Type_xt
-0.119***
(-10.28)
-0.119***
(-10.29)
0.2487***
(10.42)
0.2491***
(10.43)
Constant
0.704***
(12.68)
0.698***
(13.75)
-0.2608**
(-2.22)
-0.2401**
(-2.23)
IPO FE Yes Yes Yes Yes
N 123,819 123,819 123,819 123,819
adj. R2 0.102 0.102 0.091 0.091

53
Table 12: Dispersion and Other IPO Characteristics. This table reports regression results using
Turnover, Return Volatility, Offline Oversubscription and the probability of IPO first-day closing
price below its offer price (denoted as FBO dummy) as dependent variables respectively. Turnover is
defined as the proportion of first-day trading volume to the number of IPO shares offered. Volatility is
calculated as the annualized 30-day volatility of market adjusted returns from the IPO listing date.
Oversubscription is defined as the natural logarithm of ratio of total offline subscription from
institutional investors divided by the number of shares allocated to institutional investors. FBO
dummy is an indicator variable that takes on a value of one if the first-day closing price falls below the
offer price and otherwise 0. The variable of interest is dispersion measure STD defined as the ratio of
the cross-sectional standard deviation of institutional investors’ bidding price in the offline
subscription process to the mean bidding price. Variable definitions are given in Appendix A.
Reported are coefficients and t-value calculated using the industry clustered standard errors. ***, **,
and * indicate 1%, 5%, and 10% statistical significance levels respectively.
OLS Regression Probit
Turnover Volatility Oversubscription FBO dummy
(1) (2) (4) (3)
STD 0.5043**
(2.80)
0.2545**
(2.30)
-2.7083***
(-6.89)
-5.3640***
(-7.35)
Firm age 0.0074
(1.59)
0.0038
(1.73)
0.0177*
(1.91)
-0.1332***
(-3.16)
Offer size -0.0977***
(-5.97)
-0.0386***
(-7.11)
-0.2697***
(-16.67)
0.6822***
(4.10)
Time gap -0.0031
(-0.11)
0.0305***
(7.56)
-0.0086
(-0.31)
0.4677***
(2.86)
ROE -0.0137
(-0.27)
0.0143***
(3.39)
-0.0163
(-0.24)
0.0499
(0.12)
INDEX21_shenA 0.0073***
(28.11)
0.0037***
(9.27)
-0.0058**
(-3.03)
-0.1014***
(-9.78)
Oversubscription 0.0459***
(9.46)
0.0266***
(3.17)
-0.4708***
(-6.43)
Log # institutions -0.0398***
(-4.30)
0.0244***
(3.98)
1.6499***
(44.54)
0.1060
(1.00)
VC/PE dummy -0.0093
(-0.76)
-0.0020
(-0.40)
0.0013
(0.03)
0.1604
(1.22)
Allocation dummy 0.0878***
(3.89)
0.0946**
(2.60)
-0.6851***
(-15.63)
-5.1771***
(-28.51)
Lockup dummy 0.0373*
(1.87)
-0.0081
(-0.74)
0.5105***
(9.40)
0.8663***
(4.16)
ChiNext dummy -0.0172
(-1.68)
-0.0155**
(-2.69)
0.0958***
(6.09)
0.1445**
(2.49)
Lead reputation 0.0039
(1.19)
0.0016
(1.51)
-0.0163**
(-2.72)
-0.0885***
(-2.75)
Constant 1.4062***
(18.29)
0.0292
(0.59)
-1.0947***
(-4.21)
-10.4677***
(-12.65)
Industry FE Yes Yes Yes Yes
Year FE Yes Yes Yes Yes
N 783 783 783 766
adj. R2 0.215 0.282 0.819 0.376