Embed Size (px)
Citation preview
DI
SC
US
SI
ON
P
AP
ER
S
ER
IE
S
Forschungsinstitut zur Zukunft der ArbeitInstitute for the Study of Labor
Institutional Development and Colonial Heritage within Brazil
IZA DP No. 4276
July 2009
Joana NaritomiRodrigo R. SoaresJuliano J. Assunção
Institutional Development and Colonial Heritage within Brazil
Joana Naritomi Harvard University
Rodrigo R. Soares
Pontifical Catholic University of Rio de Janeiro (PUC-Rio), NBER and IZA
Juliano J. Assunção
Pontifical Catholic University of Rio de Janeiro (PUC-Rio)
Discussion Paper No. 4276 July 2009
IZA
P.O. Box 7240 53072 Bonn
Germany
Phone: +49-228-3894-0 Fax: +49-228-3894-180
E-mail: [email protected]
Any opinions expressed here are those of the author(s) and not those of IZA. Research published in this series may include views on policy, but the institute itself takes no institutional policy positions. The Institute for the Study of Labor (IZA) in Bonn is a local and virtual international research center and a place of communication between science, politics and business. IZA is an independent nonprofit organization supported by Deutsche Post Foundation. The center is associated with the University of Bonn and offers a stimulating research environment through its international network, workshops and conferences, data service, project support, research visits and doctoral program. IZA engages in (i) original and internationally competitive research in all fields of labor economics, (ii) development of policy concepts, and (iii) dissemination of research results and concepts to the interested public. IZA Discussion Papers often represent preliminary work and are circulated to encourage discussion. Citation of such a paper should account for its provisional character. A revised version may be available directly from the author.
IZA Discussion Paper No. 4276 July 2009
ABSTRACT
Institutional Development and Colonial Heritage within Brazil* This paper analyzes the determinants of local institutions and distribution of political power within a constant ‘macro-institutional’ setting. We show that characteristics of Brazilian municipalities related to institutional quality and distribution of political power are partly inherited from the colonial histories experienced by different areas of the country. Municipalities with origins tracing back to the sugar-cane colonial cycle – characterized by a polarized and oligarchic socioeconomic structure – display today more inequality in the distribution of endowments (land). Municipalities with origins tracing back to the gold colonial cycle – characterized by a heavily inefficient presence of the Portuguese state – display today worse governance practices and less access to justice. The colonial rent-seeking episodes are also correlated with lower provision of public goods and lower income per capita. JEL Classification: N26, O17, O40 Keywords: institutions, colonial heritage, rent-seeking, geography, Brazil Corresponding author: Rodrigo R. Soares Departamento de Economia Pontifícia Universidade Católica do Rio de Janeiro Rua Marquês de São Vicente, 225 - Gávea 22451-900 Rio de Janeiro, RJ Brazil E-mail: [email protected]
* Earlier versions of this paper circulated under the title “Rent Seeking and the Unveiling of ‘De Facto’ Institutions: Development and Colonial Heritage within Brazil.” The authors gratefully thank Flávia Chein Feres for essential help in managing and sharing the basic geo-referenced dataset on Brazilian municipalities, Cláudio Egler for providing the geo-referenced data on the coastline and the projection of the Brazilian map in kilometers, and Jesus Fernando Mansilla Baca for providing the data on temperatures and types of soil. The paper also benefited from comments and suggestions from Marcelo de Paiva Abreu, Daron Acemoglu, Roger Betancourt, Filipe Campante, Alberto Diaz-Cayeros, Cláudio Ferraz, Karla Hoff, Peter Murrell, Edson Severnini, Dietrich Vollrath, and seminar participants at Columbia University, EESP-FGV, Ibmec-Rio, IMF, IPEA-Rio, Johns Hopkins University/Center for Global Development, MIT Political Economy Breakfast, PUC-Rio, Universidade de Brasília, University of California-Berkeley, University of California-Los Angeles, University of Delaware, University of Houston, University of Maryland-College Park, University of Pittsburgh, World Bank, the 2007 Panel of the LACEA Political Economy Group (Cartagena), the 2007 NBER Summer Institute on Income Distribution and Macroeconomics (Cambridge), the 2007 LACEA Annual Meeting (Bogotá), and the 2008 ACES Panel at the AEA Meetings (New Orleans). The usual disclaimer applies.
1
1. Introduction This paper analyzes the determinants of local institutions and distribution of political
power within a constant ‘macro-institutional’ setting. We present evidence that characteristics of
Brazilian municipalities related to institutional quality and distribution of endowments are partly
inherited from the colonial histories experienced by different areas of the country.1 Specifically,
we explore the role of two rent-seeking colonial episodes: the sugar-cane and gold cycles. The
results show that municipalities with origins tracing back to the sugar-cane colonial cycle –
characterized by a polarized and oligarchic socioeconomic structure – display today more
inequality in the distribution of land. Municipalities with origins related to the gold colonial
cycle – characterized by an oppressive and heavily inefficient presence of the Portuguese state –
display worse governance practices and less access to justice. Areas associated with the colonial
rent-seeking episodes also display lower provision of various types of public goods and lower
income per capita.
The role of institutions and initial distribution of economic power as determinants of
development has received increased attention in recent years. After the work of North (1991) and
Engerman and Sokoloff (1997), a vast array of cross-country empirical literature developed
following the footsteps of the seminal contributions of Acemoglu, Johnson, and Robinson (2001
and 2002).2 Much of this literature has evolved around the idea that the geographic pattern of
development observed across countries – summarized in the relationship between distance to the
equator and income per capita reproduced here in Figure 1 – reflects different institutional
arrangements, inherited from different experiences of colonization. According to the consensus
in this literature, geographic conditions were associated with particular paths of colonization,
which in turn translated into the establishment of different types of institutions. Institutions then,
through their effects on property rights, political competitiveness, and governance, led to good
policies and, ultimately, development. In this view, the adoption of distinct ‘macro-institutions’ –
determined at the country level, and related to the political and judicial systems and to the
enforcement of laws – would be the intervening force in the observed correlation between
geography and development.
1 Municipalities are the smallest political and administrative units in Brazil (see discussion in section 3). 2 See, for example, Easterly and Levine (2003), Rodrik, Subramanian, and Trebbi (2004), and Acemoglu and Johnson (2005). Other literature contends that the geographic pattern of development reflects the direct impact of geography on income per capita, through its effects on the disease environment, agricultural productivity, and access to trade (see, for example, Gallup, Sachs, and Mellinger, 1999).
2
The geographic pattern of development within Brazil raises a series of questions in
relation to the interpretation of the cross-country evidence and the conclusions of this literature.
Figure 2 replicates the typical scatter-plot of distance to the equator and income per capita for the
case of Brazilian municipalities. As in the cross-country context, localities closer to the equator
have systematically lower income per capita. In fact, the relationship between latitude and
income is stronger and tighter within Brazil than across countries: the R2 is 0.56 and the
coefficient on latitude is 0.053, while across countries the R2 is 0.32 and the coefficient is 0.038.3
As will be seen later on, the geographic pattern of development within Brazil is more striking
than this simple scatter-plot reveals. A more complete set of geographic variables explains up to
65% of the variation in income per capita across municipalities. At the same time, Brazil is a
country that shares a single colonizer and a single language, and has a very centralized federal
system. The ‘macro-institutions’ typically highlighted in the interpretation of the cross-country
evidence, as well as the historical variables identified as their sources of variation, are, and for
the most part have always been, constant within the territory (constraints on executive, legal
system, competitiveness of political system, colonizing power, legal tradition, etc).4 This
evidence challenges the understanding that the correlation between geography and development
reflects mostly the effect of climate and endowments on the type of ‘macro-institutions’ that
were ultimately adopted at the country level.
Two non-mutually exclusive possibilities arise from this challenge: geographic factors
may be important on their own as direct determinants of long-term development, which would
contradict the main consensus of the institutional literature; or, even within a constant de jure
setting, different geographic characteristics may still be associated with different de facto
institutional arrangements and distribution of economic and political power, which would then
be relevant determinants of local development.5
In this paper, we focus on the second possibility. As will be seen in section 3, various
dimensions of institutional quality follow a clear geographic pattern within Brazil. Given the
constant de jure setting at the country level, local variation is likely to reveal de facto dimensions
of institutional quality and distribution of political power. Though the recent literature has
acknowledged the difference between de jure and de facto political power and institutions 3 Cross-country data are from the Penn World Tables. Municipality data are presented in section 3. 4 The Brazilian territory has remained roughly the same since the 18th century. And, apart from brief and localized incursions of other colonial powers (such as Holland and France), the entire country stayed under Portuguese rule from the beginning of colonization until independence. 5 By de facto, we refer to the actual operation of institutions, as opposed to what is formally established by the law (de jure institutions; se discussion in Pande and Udry, 2006).
3
(Acemoglu and Robinson, 2006 and 2008, and Pande and Udry, 2006), it has yet been unable to
empirically distinguish between them and to identify the sources and consequences of variations
in the latter.
Specifically, we identify the areas of Brazil that were actively involved in two of its most
important colonial ‘cycles:’ the ‘sugar-cane cycle’ and the ‘gold cycle.’ The sugar-cane and gold
cycles were the main periods of economic expansion during Brazilian colonial history, both
associated with the initial occupation of certain areas and intrinsically connected with the
development of rent-seeking activities by the colonial power (Portugal). These so-called
‘colonial cycles’ can be delimited both chronologically and geographically, so that some
municipalities can have their origins traced back to a specific episode of extractive enterprise.
One can then ask whether municipalities affected by the historical episodes are systematically
different today.
The analysis concentrates on four municipality characteristics: distribution of economic
power, as related to the initial distribution of endowments (land); persistence of political power,
measured by whether the same family held mayoral office through successive elections; access
to justice, reflected in the local availability of courts; and quality of local government practices,
as indicated by an index of administrative efficiency. Our main results show that areas affected
by the rent-seeking cycles, and under stronger influence of Portugal during the colonial period,
have worse outcomes today. The estimated effects of each rent-seeking episode are consistent
with the socioeconomic and political characteristics highlighted in the historical literature.
Specifically, municipalities with origins linked to the socially polarized and oligarchic economy
of the sugar-cane cycle are characterized by higher concentration of land. Municipalities with
origins associated with the gold cycle – with its rentier and oppressive state – have worse
governance practices and less access to justice. In both the sugar-cane and gold episodes, the
negative consequences of the colonial cycles are significantly worse the closer the municipalities
are to Portugal, highlighting the negative influence of the interference of the metropolis,
particularly when associated with rent-seeking activities. Quantitatively, the estimated
coefficients imply that if the average city in the historical mining area had not been affected by
the gold cycle, its index of governance today would be better by 5 percent of a standard
deviation, while its index of access to justice would improve by 11 percent of a standard
deviation. Similarly, if the average municipality in the sugar-cane area had not been affected by
the sugar-cane cycle, its index of concentration of land would be lower by 35 percent of a
standard deviation.
4
The results also indicate that the rent-seeking episodes are significantly related to lower
provision of various public goods and, in the case of the gold-cycle, to lower overall economic
development. When we instrument local institutions using the historical variables, and analyze
the impact of instrumented institutions on current development, we find that better governance
practices and better access to justice are both associated with higher income per capita.
The empirical literature has recently stressed the advantages of bringing the institutional
discussion to the within country context, highlighting the minimization of problems of omitted
variables and comparability of institutional arrangements, and the gains from the potential
identification of more precise dimensions of institutions (Iyer, 2003, Banerjee and Iyer, 2004,
and Jimeno 2005). Several recent papers have taken advantage of these benefits and explored the
interaction between colonial history and very specific dimensions of institutions within countries
(Iyer, 2003, Mitchener and McLean, 2003, Berkowitz and Clay, 2004, Banerjee and Iyer, 2004,
Banerjee, Iyer, and Somanathan, 2004, Jimeno, 2005, Lagerlöff, 2005, Bonet and Roca, 2006,
Bruhn and Gallego, 2006, and Acemoglu et al, 2007; also, see review in Nunn, 2009).
This paper helps bridge the gap between the macro and micro literatures. We analyze the
historical determinants of local institutions and political environment within a country, but still
engage the broader issues raised in the cross-country debate. The original contribution of our
approach can be summarized in three points. First, we are able to measure very specific
manifestations of institutional quality, within the constant ‘macro-institutional’ framework of
Brazilian society. This allows us to avoid the general and imprecise measures of ‘institutional
quality’ typically used in cross-country studies, and to explicitly identify institutional variation
within a country. Given the extreme centralization of the Brazilian federal system, this variation
reveals a dimension of de facto institutional performance that has not yet been analyzed.
Second, instead of looking at broad historical patterns (identity of the colonizer, fraction
of Europeans, settler’s mortality, legal tradition, etc), we focus on particular events. The main
factors highlighted in the historical and institutional literature (for example, Engerman and
Sokoloff, 1997) have concrete counterparts on actual historical episodes. Our strategy is to map
the influence of the two most important such episodes in the history of Brazil. These are events
that can be precisely characterized in terms of their political and socioeconomic environments,
and therefore in terms of their likely consequences.
Finally, our empirical exercise accounts for a wide range of geographic characteristics –
distance to the equator and to the coast, sunshine, rainfall, altitude, average temperature in each
month of the year, and types of soil – measuring in an accurate way the specific endowment of a
5
well defined and limited area (municipality). So we are able to isolate the effect of colonial
heritage from that of geography and, in fact, to treat geography more carefully than usually seen
in the cross-country literature. Taking advantage of the natural diversity of Brazil, this allows us
to tackle the discussion on geography and development in a way that is not possible in other
within country studies.
The remainder of the paper is structured as follows. Section 2 describes the historical
episodes analyzed, highlighting the activities involved, their chronology, and their social,
political, and economic structures. Section 3 explains in detail the construction of our historical
variables, describes the municipality characteristics used as dependent variables, and presents the
other data used in the paper (geographic and economic variables). Section 4 presents the main
results of the paper: the impact of rent-seeking episodes on local institutions and distribution of
power. Section 5 presents the results on the effects of the colonial past and local institutions on
long-term development and provision of public goods. Section 6 concludes the paper.
2. The Sugar-Cane and Gold Cycles in Brazilian Colonial History Between 1500 and 1822, Brazil was a colony of Portugal. Through most of the colonial
period, Portuguese rule was characterized by the establishment of successive waves of
assumedly extractive endeavors, varying in form and institutional characteristic according to the
goods being demanded in Europe and the production possibilities offered by the colony. In the
first years of colonization, the main economic activity was the extraction of “pau-brasil,” a type
of wood that was obtained primarily through barter and exchange with the native population.
When Portugal decided to occupy and systematically explore Brazil (circa 1530), a system of
‘Hereditary Captaincies’ was established, dividing the colony into fifteen latitudinal stretches of
land, each under the rule of an appointed ‘captain’ (HGCB, 1968). Though the system of
Hereditary Captaincies was short-lived, it marked the beginning of the systematic exploitation of
Brazil as source of economic rent. Following, a sequence of ‘colonial cycles’ was inaugurated,
involving at different historical moments and locations the production of various commodities,
such as sugar-cane, gold, rubber, tobacco, cocoa, cotton, and coffee, among others.
Proximity to Portugal was an extremely important factor during the first centuries of
colonization. For this reason, and because of its climatic features, the Northeast was the area first
occupied by the metropolis. There was no direct and constant intervention for most of the
Southern part of the country, and in these areas history was connected to activities developed by
settlers at the margin of the colonial enterprises supported by the metropolis. Overall, the costs
6
and difficulties related to trade with Portugal constituted an important determinant of the degree
of intervention. Wheling (1994, p.302, translated by the authors) argues that
“The physical distance between Lisbon, the main centre of political and administrative decisions, and the coastal cities of Brazil, and from these coastal cities to the countryside, turned into months or years the timing of decisions (...). It imposed, therefore, an ‘administrative time’ that delayed decisions and limited the efficacy of the government apparatus.”
In general, the goods that constituted valuable commodities for the Portuguese were
determined by European demand. Local climatic and geographic conditions, together with
distance to Portugal, determined the viability and location of the different potential activities in
the Brazilian territory. Contrary to parts of the Spanish America, there were no complex societies
or densely populated areas in Brazil prior to the arrival of the Portuguese. Therefore, there was
very little impact of previously existing social arrangements or labor supply on decisions
regarding location of production. In this sense, both the activities being developed and their
location in the Brazilian territory can be understood as shocks to the economic and political
history of the country. If the local institutional setting associated with the rent-seeking activities
persisted through time, it would be possible to capture its long-term effects still today.
Among the extractive activities developed by Portugal, two deserve particular attention:
sugar-cane plantations and gold mining (see, for example, Simonsen, 1937). We choose to focus
our analysis on these two episodes for three reasons: they are typically regarded as the most
important ones, both in terms of economic relevance and area of influence; they were
characterized by an essentially extractive socioeconomic organization and an openly rent-seeking
logic; and they marked the initial occupation of important areas of the country.6
During their most prosperous periods, both sugar-cane and gold mobilized the attention
of Portugal, marking the initial occupation of, respectively, the Brazilian Northeast and Center-
South. The metropolis committed its physical resources, labor, and institutional apparatus in a
coordinated way in order to maximize rent extraction. Once these rents started to dwindle, even
though the activity itself persisted, the mobilization of attention and resources was dismantled,
6 Even though the idea of cycles implies inevitably some degree of oversimplification, there were periods when these activities clearly concentrated most of the efforts of the metropolis. Coffee is commonly considered the third most important commodity cycle in Brazil. We choose not to analyze the coffee experience for a series of reasons. First, the coffee expansion takes place at a much later stage (19th century) and over an area already previously occupied. Second, the expansion extends well after Brazilian independence. And third, the organization of production follows more closely an entrepreneurial logic, and not a rent-seeking one. So the coffee cycle does not qualify as the initial institutional shock that we want to capture with the sugar-cane and gold episodes.
7
and a new rent-seeking opportunity was sought. The idea of cycles, therefore, relates more to the
prominence of the activity among the enterprises conducted by the metropolis, rather than to the
existence of the activity itself.
The extractive nature of these colonial episodes is clear. Occupation of the Brazilian
territory up until the early 19th century was driven by the extractive interests of the metropolis
and conducted by settlers who were entirely engaged in rent-seeking activities7. Reports abound
about the lack of supply of basic types of food and other goods in the areas involved in both the
sugar-cane and gold cycles. In the case of sugar-cane, the extensive use of plantations
exclusively for sugar production led to very limited supply of other crops and also limited cattle.
In the case of gold, locations surrounding the mining areas were entirely unprepared to receive
the number of people that arrived (HGCB, 1968 and Simonsen, 1937).8
Despite the similarities, the sugar-cane and gold cycles had each their specificities and
potentially distinct implications for institutional development. Following, we discuss the social,
political and economic structures associated with them and suggest the consequences they may
have had for the institutional and political development of the affected areas.
2.1 The Sugar-Cane Cycle
The initial phase of Brazilian colonization took place mainly along the Northeastern
coast. Climatic factors and characteristics of the soil made the region particularly adequate for
sugar-cane production, and proximity to Portugal made it viable as a source of exports to Europe
(see Figure 3 for a map of Brazilian states and the position of the country in relation to Portugal).
This combination of factors made the period of sugar-cane expansion the most important
economic cycle of colonial times (Fausto, 2006, Schwartz, 1987 and Wehling, 1994).9
7 For example, it was forbidden to make public any information on Portuguese trade and profits. In fact, the crown ordered the apprehension and destruction of publications dealing with the sugar business in the colony (see Simonsen, 1937, p.112). 8 Certain coastal areas of the Northeast were exclusively reserved for sugar-cane production, being forbidden the development of any other agricultural activity. Portuguese settlers had such short-term view of their stay in the colony that, up until the 18th century, it was common for men to go to Brazil leaving their wives in Portugal. During this period, the number of white women in the colony was extremely scarce (Russel-Wood, 1977 and Wehling, 1994). In relation to the sugar industry, Father Manuel da Nóbrega wrote in the 16th century that “this people of Brazil pay attention to nothing but their ‘engenhos’ [sugar-mills] and wealth even though it be with the perdition of all their souls” (quoted in Schwartz, 1987, p.89). 9 One could assume that location of the sugar cycle in the Brazilian Northeast was determined exclusively by geographic conditions particularly adequate for sugar-cane production. In fact, proximity to Portugal played a key role. According to the UN Food and Agriculture Organization (FAO), Brazil was still the top producer of sugar in 2005, with 33% of the world’s production, but 60% of the current production is located in the Southeastern state of São Paulo (data from IBGE, the Brazilian Census Bureau). In fact, the production of São Paulo is comparable to that of India, the second largest world producer.
8
By the 17th century, Brazil was the main world producer of sugar (Prado Jr., 1945).
Sugar-cane was cultivated all along the stretch of land from the current state of Rio Grande do
Norte down to the intermediary latitudes of the state of Bahia (“Recôncavo Bahiano”). The main
centers were the areas that correspond today to the states of Bahia and Pernambuco, but even less
tropical states such as Espírito Santo and Rio de Janeiro were at certain points involved in
production (though mostly in much smaller scale and for the production of “aguardente,” the
alcoholic beverage used in exchange for slaves in Africa; see Fausto, 2006). According to
Simonsen (1937, p.112), there were roughly 120 sugar-mills in Brazil in 1600: 66 in
Pernambuco, 36 in Bahia, and 18 in all other captaincies together.
The cultivation and processing of sugar-cane were extremely important activities
throughout Brazilian history. Sugar went through various periods of expansion and contraction,
but was always among the main exports during colonial times, so the idea of a cycle is not self-
evident. Nevertheless, it is possible to identify periods of great prosperity and decline, and, most
important, periods when the efforts of the metropolis were geared almost entirely toward
exploitation of rents from sugar. Following Simonsen (1937), we identify the sugar cycle as the
period from the beginning of the effective colonization of Brazil until 1760. This includes the so-
called ‘century of sugar,’ the period ranging from 1570 to 1670, which was the height of
production and profits in the sugar business. From 1650 on, the value exported started to fall and,
by mid 18th century, it was only 60% of the historical maximum (Simonsen, 1937). In this sense,
between 1530 and 1760 there was a clear movement of expansion, peak, and decline of sugar as
the main rent-seeking activity sought by the metropolis.
The economy of the sugar was based on the plantation system, built over three essential
elements: “latifundio” (a large estate with a single owner), monoculture, and slave labor. Sugar-
cane brought the large rural estate and the patriarchal and slavery-based society not only to
Brazil, but to the entire colonial America, implying an institutional and economic transformation
that has sometimes been termed the ‘sugar revolution’ (see Higman, 2000). Sugar-mills were
enterprises that demanded a large amount of resources to be initiated at a productive scale.
Therefore, land was given to individuals that had enough funds to make the most of the land in
its sugar-producing potential. African slavery, then, appeared as the only possible way to extract
rent in a context where the supply of land for subsistence was extremely large (Reis, 2005).10
10 In 1729, Governor Luís Vahia Monteiro wrote that “The most solid properties in Brazil are slaves, and a man’s wealth is measured by having more or fewer (…), for there are lands enough, but only he who has slaves can be master of them” (quoted by Schwartz, 1987, p.81).
9
The combination of these three factors appeared, from the perspective of the metropolis, as the
only feasible way to explore the potential rents from sugar-cane production and processing.
According to Simonsen (1937, p.126, translated by the authors):
“The use of this ‘institution’ appeared, then, as an unavoidable economic imposition: industrial enterprises, the construction of mills, and expensive colonial expeditions would be allowed only if the corresponding labor supply was granted in quantity and flow. And, at those times and latitudes, only slave labor could give such guarantee.”
A typical sugar-mill would have between 60 and 100 slaves. A particularly large one
could have more than 200. In the 18th century, slaves represented more than half of the
population in the Northeastern captaincies, and between 65% and 70% in the plantation areas. In
the other extreme of the social pyramid, the “senhores de engenho” (literally, sugar-mill lords,
usually translated as ‘planters’) constituted the local landed aristocracy, invariably white and
concentrating a wide range of social, economic, and political powers (Schwartz, 1987).
Even though in most cases there was no actual ownership of land, and therefore no formal
hereditary transmission of estate (Schwartz, 1987, p.88), possession of sugar-mills and
plantations and the position of “senhor de engenho” gave enormous social prestige: “(…) the
‘senhor de engenho’ is a title aspired by many because it brings with it being served and
respected by many. And (…) the esteem given to the landlord in Brazil is proportionate to the
esteem given to noblemen in the court” (Father Antonil in 1711, quoted in Simonsen, 1937,
p.105; translated by the authors).
In reality, the local power of the sugar-mill lords remains in strong contrast to the weak
access they had to royal power. As metropolis, Portugal restricted its control over sugar related
activities to rules and devices targeting essentially the constancy of the flow of rents and the
preservation of supremacy over the areas of interest (Schwartz, 1987 and Wehling, 1994). The
political and institutional landscape of the time makes clear the rent-seeking nature of the
activity. Several reports call attention to the contrast between the frequent and recurrent demands
for tax exemptions or debt bailouts of planters, and their extreme opulence and wealth. In the
state of Pernambuco during the 17th century, about 80% of government revenues came from
various different taxes on sugar production and trade, which was the only activity allowed in
some areas during certain historical periods (Schwartz, 1987, p.98).
10
The polarization between landlord and slave, and the dominance of the plantation system
targeted at exports to Europe, constitute the foundations of the social, economic, and political
structures associated with sugar production. Following closely the idea of extractive occupation
discussed by Engerman and Sokoloff (1997), the sugar-cane society was built over extreme
social inequality, and very small economic and political elites with concentrated powers.
2.2 The Gold Cycle
The gold mining expansion in the central part of Brazil was extremely intense and
concentrated in time. In 1695, explorers made the first significant discoveries of gold in the areas
of Sabará and Caeté, in a region corresponding to the current state of Minas Gerais. Following,
successive quarries were found in the same region and, after 1720 and 1726, also in areas
corresponding to the current states of Mato Grosso and Goiás (Fausto, 2006). In 1728, the first
diamond quarries were found, and the height of Brazilian production soon followed in 1760.
After that, production started to decline and lost most of its relevance already by the end of the
18th century (Simonsen, 1937).
Despite its brief lifetime, the gold cycle left permanent imprints on the economy and
demography of the colony, on the colony-metropolis relationship, and on world markets. From
1700 to 1770, Brazilian gold production corresponded to the entire production of the rest of the
Americas between 1492 and 1850, and to roughly 50% of the production of the rest of the world
between the 16th and 18th centuries (Simonsen, 1937, p.258).
The news of the discoveries generated a ‘gold-rush’ that led to an unprecedented
occupation of the central part of the country. Only 25 years after the initial discoveries, the
Center-South region, which was mostly uninhabited previously, accounted for 50% of the
colonial population (Fausto, 2006). At that time, the Portuguese crown became seriously
concerned about the depopulation of the metropolis, resorting to legal restrictions in order to
limit emigration to Brazil (Porto, 1967, p.70 and Costa, 1982a). The collapse of the mining
economy was similarly fast, highlighting its essentially rent-seeking nature. Despite the
formation of urban centers and development of auxiliary activities, other economic initiatives
were unable to take-off as independent enterprises. So the main urban center of the region went
from 20 thousand inhabitants in 1740 to just 7 thousand in 1804. By then, gold production had
already declined to only 12% of its peak value (Fausto, 2006 and Simonsen, 1937).
In the colony, the main concern of the Portuguese crown was to keep the mining areas
under as much control and scrutiny as possible. A series of regulations related to exploration of
precious metals, movement of goods and people, and taxation was put in place in order to
11
guarantee to Portugal an amount of rent deemed adequate. In certain regions, passports were
required for people to enter or leave mining areas, but this regulation proved unenforceable and
soon was dropped (Boxer, 2000). At least twelve distinct taxes were adopted at different
moments in time, but two were the most common: the fifth (or “quinto”), which established that
20% of the gold produced belonged to the crown; and the capitation (or “capitação”), which
charged a fixed fee by slave owned (above age 12).
Gold was considered a monopoly of the Portuguese crown and exploration depended on
access to mining plots. Usually, individuals responsible for the discovery of new quarries had
priority in the selection of a fraction of the relevant area, and the remainder was allocated to
other candidates through auctions and lotteries, with the size varying according to the number of
slaves owned. After the initial allocation, miners were free to sell or trade their plots (Boxer,
2000, p.75, and Reis, 2005).
Individuals were not allowed to circulate with gold in the form of powder. Processing of
raw gold and its transformation into bars was used as a tool to enforce taxation, and therefore
was also under tight control of the metropolis. For the most part, gold bars could only circulate
with the seal of the Portuguese crown, meaning that the raw gold would have been melted in an
official establishment (“Casa de Fundição”) and due taxes would have been automatically paid.
Nevertheless, despite great efforts from the metropolis, frauds were constant. The
environment created in the mining regions was that of a constant race between individuals and
state. As miners tried to evade taxes levied by the Portuguese crown, the metropolis created more
and increasingly oppressive devices to regulate and control production even further. The natural
evolution of this process was the creation of a very heavy and ineffective state apparatus, and the
emergence of an extremely antagonistic environment between state and civil-society.11 The
height of this tension was materialized in the “derrama,” an additional tax raised when the
aggregate amount of gold collected by the crown as one-fifth of total production did not reach a
pre-established goal.12 The “derrama” was raised from the entire population as a tax on virtually
11 The antagonistic environment between society and state is illustrated by a series of anecdotal tales from colonial Brazil. The most celebrated independence movement before 1822 was the “Inconfidência Mineira,” a movement organized by the local elites in 1789 in the state of Minas Gerais, and planned to burst out on a day scheduled for tax collection. The movement was frustrated by the early warnings of a traitor (rewarded with the cancellation of his debts to the crown). The efforts to smuggle gold out of the mining areas involved entire local communities. A figure that became entrenched in Brazilian popular culture is the ‘hollow-saint’ (“santo do pau-oco,” a hollow wooden image of a catholic saint). ‘Hollow-saints’ were used by various religious orders to smuggle powder gold out of the colony. Because of their widespread use, in 1711 the Portuguese crown forbid the entrance of priests without explicit authorization and the establishment of religious orders in the state of Minas Gerais (see Boxer, 2000, p.76). For a description of the relationship between miners and the Portuguese state, see Costa (1982b). 12 The minimum amount required for taxes raised as one-fifth of production was roughly 1.5 tons of gold.
12
any type of activity (trade, ownership of business or slaves, use of public roads, etc.) and also as
a tax on wealth, based on more or less arbitrary assessments of personal assets. Tax collection
when the “derrama” was actually installed, which might last for several months, made extensive
use of the army and involved prisons, apprehension of personal assets and durable goods, and
raids into private households (Prado Jr., 1945).
Still, the mining areas were also peculiar in other ways. Despite the widespread use of
slaves, society was not as polarized as that of the sugar-cane. Technology and the scale of
production implied a certain degree of horizontality in its social organization. According to
Simonsen (1937, p.291, translated by the authors):
“The miner needed courage, some tools, and a handful of slaves. (…) While the sugar lord needed vast resources to start his business, the alluvium miner could be a man of little wealth. Despite the fact that slave labor was used as the main source of manpower, it is undeniable that a much more intense ‘division of labor’ developed in the mining areas than could be supported by the social organization in the sugar-cane areas of the Brazilian Northeast.”
Furtado (1959, p.74, translated by the authors) highlights the technological nature of this
social organization: “(...) the mining economy in Brazil opened possibilities to people with
limited resources, since exploration was not based on large and deep mines – as in the case of
silver in Peru and Mexico – but on alluvium metal deposited in the bottom of rivers.”
The work performed by slaves was considered harsher than that in plantations, but the
relationship between slave and slave-owner was essentially different. Slaves enjoyed some
degree of bargaining power because of informational advantages derived from the nature of the
production technology. They could steal or hide whatever they found, and miners depended on
their willingness to report discoveries for the enterprise to be profitable (Reis, 2005). The
unusual relationship between slave and slave-owner led to a peculiar social structure, where it
became relatively common for slaves to buy their own freedom. 13
The gold-cycle, therefore, was associated with the development of a relatively horizontal
society. Nevertheless, the emergence of this society was intrinsically connected with a rent-
13 Even though rarely used, the Portuguese crown instituted a legislation according to which slaves could gain freedom by denouncing tax evasion. Such accusations could bring serious problems even when unfounded (Costa, 1982a and Reis, 2005). Purchase of freedom initially made use of stolen gold, but the work system soon evolved into an incentive compatible set of rules, where slaves could work on their own for part of the time, paying a fixed fraction of the gold found. The fraction of freed slaves among the population of African descent, which was only 1.4% around 1740, increased to 41% by 1786 (34% of the total population, according to Russell-Wood, 1977).
13
seeking activity and took place under the overreaching and bureaucratically oppressive
centralization of the Portuguese state.
2.3 Long-Run Implications of Colonial Cycles
By setting the initial conditions in terms of distribution of economic and political power
and effectiveness of government, rent-seeking episodes of colonial times created the
environment from which the institutional and political history of the affected areas evolved.
Given the tendency towards persistency of institutions discussed in both the empirical and
theoretical literature, the effects of these initial conditions may be present still today.
In this respect, despite their similarities, there are important differences between the
sugar-cane and gold cycles. In the sugar-cane cycle, production technologies led to an extremely
polarized society, with economic and political power concentrated in the hands of local leaders
who suffered very little interference from any type of central power, and were subject to almost
no constraint from external sources (Reis, 2005). The figure of these local leaders appeared
throughout Latin America as syntheses of the political landscape created by the agricultural
society. Their heirs survived well into the 20th century, in the figures of the “Coronel” in Brazil
and the “Caudillo” in Spanish America (see, for example, Schwartz, 1987).
Economic and political power was closely related to initial concentration of land and to
the persistence of this concentration through time. In Brazil, the highly concentrated land
distribution today has its deep roots in the colonization process (see Leal, 1997 and Assunção,
2008).14 In the areas involved in sugar production, ownership of land meant economic power,
which in turn meant actual political power, in a setting very similar to that described by
Engerman and Sokoloff (1997). Ultimately, this power may have manifested itself in different
ways: through the formal absence of the state in areas initially under the influence of planters;
through the control of the formal political system by the main economic players; or maybe
simply through the overruling of state power and de jure institutions by economic power and de
facto institutions ran by local elites.
The social and political structures associated with the gold cycle were very different.
Though slavery and inequality were common factors, the social structure was less rigid and the
distribution of endowments and political power across the civil population was more equal. In
contrast, the availability of rents from gold coupled with the suffocating presence and oppressive
power of the metropolis were pervasive. The tremendous efforts of the Portuguese crown to
14 According to Frankema (2005), the Gini index of concentration of land in Brazil always remained between 78 and 80 during the 20th century.
14
monitor every single step of production and trade of precious metals led to an overgrown,
extremely focused and inefficient government apparatus. This apparatus was constructed entirely
around the supervision and extraction of rent from one single activity: mining.
The political science literature on the resource curse has repeatedly stressed the perverse
effects that the possibility of rent extraction may have, when decoupled from productive
activities and political representation. Early contributions highlight how, in the cross-country
context, “government (…) acquires an independence from people seldom found in other
countries (…)” (Mahday, 1970, p. 466). Generally, availability of resource rents – as in the case
of gold – frees the state from the need to efficiently levy taxes from productive activities and
makes it less accountable to the society being governed (Ross, 1999). As a result, the
government has no incentive to develop instruments to promote and tax other sectors, since
“State elites do not need to bargain with social elites or discover any significant information
about society. Consequently, state and social institutions atrophy (especially those related to the
democratic debate)” (Goldberg et al, 2008).
In the context of colonial Brazil, where the governing state (Portugal) was in fact
formally detached from local population, these effects are likely to have been even stronger. As a
consequence, the state in the mining regions did not function effectively in other areas and was
involved in a constant struggle against civil society, leading, ultimately, to the development of a
culture of detachment between population and state. Therefore, the implications of the gold cycle
are likely to be related to the effectiveness of government, the provision of public goods, and the
relationship between local population and state power, which may have persisted despite being
inefficient (persistence can arise in a political equilibrium such as the one described by
Acemoglu et al, 2007; see also discussion in Ross, p.308).
In the next section, we describe in detail our empirical strategy and the construction of the
historical variables used to identify the long-term effects of the sugar-cane and gold cycles. We
also discuss how the dependent variables chosen capture the different dimensions of the
historical experiences depicted in this section.
3. Empirical Strategy and Data This section presents the data and discusses our empirical strategy. All variables are
defined at the municipality level. We choose the municipality as the unit of observation for a
number of reasons. First, there are more than 5,000 municipalities in Brazil. Second,
municipalities are the smallest political and administrative units, with relatively homogeneous
15
formal role, but with great differences in terms of administrative quality and public good
provision. They have administrative autonomy, are governed by a mayor and a chamber of
representatives, and are roughly equivalent to US counties. Municipalities raise certain taxes,
receive transfers from the federal government, and decide on part of the expenditures along
various dimensions (education, health, infrastructure, etc.). So, on the one hand, they have some
administrative discretion, but, on the other hand, they have no actual power to legislate and are
subject to identical laws, determined by centralized decisions at the country level. Finally, a
municipality is a relatively small and well defined area, so that geographic characterization is
more precise at this level. The definition, description, and sources of all the variables discussed
below are presented in detail in the Appendix.
3.1 Historical Variables
We study the colonial determinants of current institutions based on the fact that: (i) it is
possible to identify the sugar-cane and gold cycles in time and geographic location; and (ii)
distance to Portugal was an important determinant of the actual degree of intervention imposed
by the metropolis.
We first identify current municipalities that are located in areas directly affected by the
colonial cycles. In the case of sugar-cane, municipalities are identified from information
contained in the historical literature and from year of foundation. Based on Simonsen (1937), we
define the sugar cycle as the period ranging from the beginning of Brazilian colonization until
1760. According to Prado Jr. (1945), Simonsen (1937) and Fausto (2006), the regions affected by
the cycle correspond to the coastal areas of the current states of Rio Grande do Norte, Paraíba,
Pernambuco, Alagoas, Bahia and Espírito Santo, and to the region of Campos dos Goytacazes, in
the state of Rio de Janeiro. But there is no precise information on the distribution of sugar-cane
production within these states and regions during colonial times. Therefore, we use the year of
foundation and location of municipalities in order to identify areas that had their origins
connected to the sugar-cane cycle. Specifically, we classify a municipality as being directly
affected by the sugar-cane cycle if it is located less than 200 kilometers from the coast in one of
the regions enumerated above, and was founded before 1760.15
In the case of gold, identification of municipalities is easier. Based on historical accounts
(for example, Russel-Wood, 1977, Simonsen, 1937, Boxer, 2000, and Fausto, 2006), we can
determine the current states that had areas directly involved in the gold cycle (Bahia, Goiás,
15 Qualitative results remain unchanged if we define the sugar-cane cycle as corresponding only to the period of most intense sugar activity, ranging from 1530 to 1700.
16
Mato Grosso, Minas Gerais, and Rondônia). Using the historical map presented in Simonsen
(1937, “Caminhos Antigos, Mineração e Máxima Expansão da Capitania Paulista”), we can
delimitate the precise location of the historical mining areas within each of these states. We then
define municipalities directly affected by the gold cycle as those located in these areas today.
From the above definitions, we construct two dummy variables assuming value one if a
municipality was directly affected by the respective colonial cycle. Yet the influence of these
historical episodes was not restricted to municipalities directly affected by them. Sugar-cane and
gold production and processing were not entirely concentrated on these locations. Similarly, the
political and social structures associated with the episodes most likely had a broader geographic
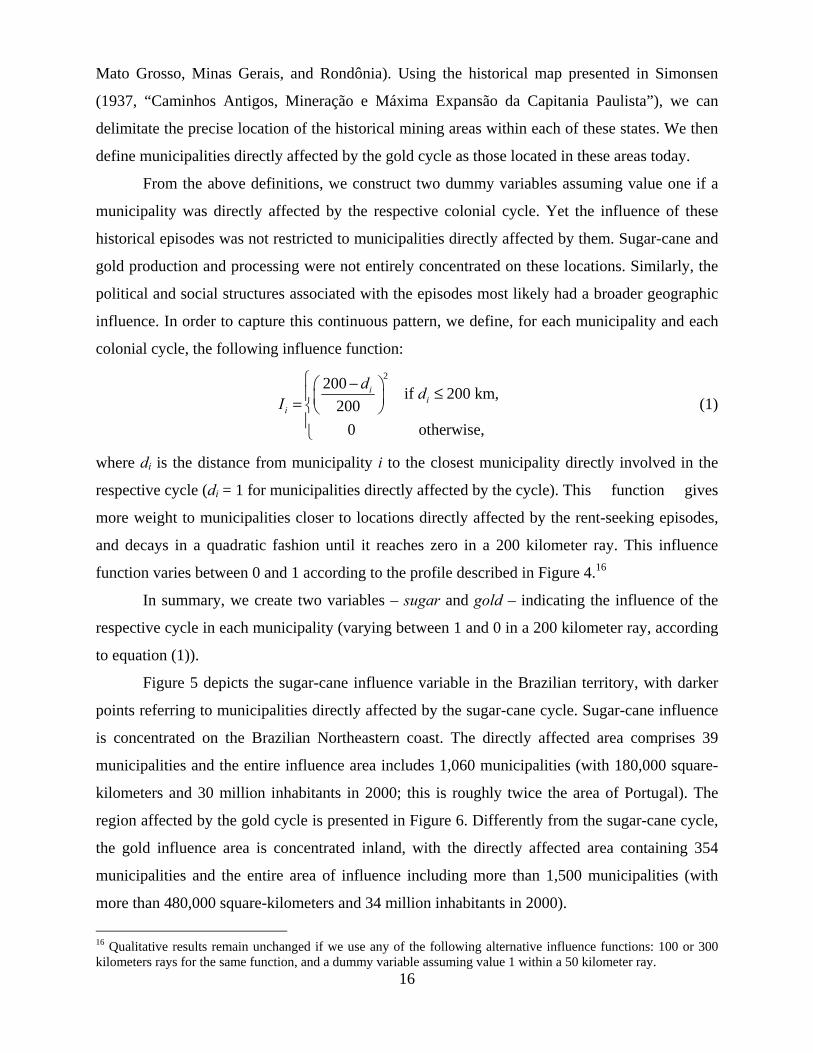
influence. In order to capture this continuous pattern, we define, for each municipality and each
colonial cycle, the following influence function: 2200 if 200 km,
2000 otherwise,
ii
i
d dI⎧ −⎛ ⎞ ≤⎪⎜ ⎟= ⎨⎝ ⎠⎪⎩
(1)
where di is the distance from municipality i to the closest municipality directly involved in the
respective cycle (di = 1 for municipalities directly affected by the cycle). This function gives
more weight to municipalities closer to locations directly affected by the rent-seeking episodes,
and decays in a quadratic fashion until it reaches zero in a 200 kilometer ray. This influence
function varies between 0 and 1 according to the profile described in Figure 4.16
In summary, we create two variables – sugar and gold – indicating the influence of the
respective cycle in each municipality (varying between 1 and 0 in a 200 kilometer ray, according
to equation (1)).
Figure 5 depicts the sugar-cane influence variable in the Brazilian territory, with darker
points referring to municipalities directly affected by the sugar-cane cycle. Sugar-cane influence
is concentrated on the Brazilian Northeastern coast. The directly affected area comprises 39
municipalities and the entire influence area includes 1,060 municipalities (with 180,000 square-
kilometers and 30 million inhabitants in 2000; this is roughly twice the area of Portugal). The
region affected by the gold cycle is presented in Figure 6. Differently from the sugar-cane cycle,
the gold influence area is concentrated inland, with the directly affected area containing 354
municipalities and the entire area of influence including more than 1,500 municipalities (with
more than 480,000 square-kilometers and 34 million inhabitants in 2000).
16 Qualitative results remain unchanged if we use any of the following alternative influence functions: 100 or 300 kilometers rays for the same function, and a dummy variable assuming value 1 within a 50 kilometer ray.
17
In addition to the indices of influence of the sugar-cane and gold cycles, we use distance
to Portugal to incorporate the active interference of the metropolis during the colonial period. As
stressed in the historical section, distance to Lisbon imposed important administrative costs that
ultimately affected the efficacy of the institutional apparatus of rent extraction.17 We define
distance to Portugal (dist to Portugal) as the Euclidian distance between each municipality and
Lisbon (38º42’N, 9ºW). Our ideal measure of distance would include transportation costs or time
by sea and land during colonial times, but this type of information is simply impossible to obtain
for the vast majority of Brazilian municipalities. Though our measure may not be ideal, it should
be highly correlated with travel distance since our geographic controls include distance to the
coast and to the equator.18 Our main interest in relation to distance to Portugal rests on the way it
affected the intervention of the metropolis during the rent-seeking episodes. For this reason, we
consider the interaction between distance to Portugal and the sugar-cane and gold influence
functions (sugar x dist to Portugal and gold x dist to Portugal). We hope this interaction will
capture variation in the degree of control exercised by the metropolis within each cycle.
We thus have five historical variables that can be used to understand the long-term
determinants of variations in local institutions: sugar, gold, dist to Portugal, sugar x dist to
Portugal, and gold x dist to Portugal.
3.2 Institutional and Political Variables
The sugar-cane and gold cycles may have affected different dimensions of the
institutional and political environment. In order to account for the various potential long-run
implications, we consider four indicators related to current institutional quality and distribution
of economic and political power.
The first two variables capture the distribution of resources and political power within
municipalities. As pointed out by Acemoglu and Robinson (2006), even if not directly allocated
to formal political institutions, individuals may exert political power. In this sense, the
concentration of economic resources in the hands of an elite acts as a source of de facto political
power. Thus, an environment of high concentration of economic power may determine poor de
17 Freyer and Sacerdote (2006) report a negative influence of the intensity of Portuguese colonization, though the result is mostly associated with the experiences of St. Helena Island (Atlantic) and Huvadu Island (Maldives). 18 Distance to Portugal varies from 59 to 95 degrees. The correlation between distance to the cost and distance to Portugal is 0.33. Distance to Portugal may also affect outcomes today because it indicates distance to Europe, and therefore access to international markets. This direct effect of distance to Europe on development should be negative, since it indicates less access to international trade. Our historical interpretation of this variable generates an effect in the opposite direction, since areas further away from Portugal would be under less strict influence of the metropolis and, therefore, potentially better-off today. The effect of access to international markets will bias the coefficient on the variables related to distance to Portugal against the hypothesis that we want to test.
18
facto political institutions irrespectively of the formalities of the de jure institutional setting. We
use two measures that rely on de facto aspects of local politics: land concentration and
persistency of families in power.
We use the Gini coefficient of distribution of land, since agriculture played a key
historical role in shaping political forces in Brazil. Ideally, we would like a measure of
concentration of land at some historical point in time, but this type of information is not available
at the municipality level. Still, land concentration today is thought to be representative of the
historical past, given that its genesis dates back to the colonial period (see Leal, 1997, Frankema,
2005, and Assunção, 2008). So we use the Gini coefficient of distribution of land, computed for
each municipality based on the 1996 Brazilian Agricultural Census (land Gini).
The other measure of political power is related to the degree of competitiveness in local
politics. It is possible that elites control elections even under a seemingly democratic
environment. For this reason, we consider the persistence of political power at the local level as
an indicator of the irrelevance of de jure political institutions as mechanisms to promote political
competition. Our index (political persistence) is a discrete variable between 0 and 2 indicating
whether the same family held mayoral office more than once across the 1996, 2000, and 2004
electoral cycles (data from the Brazilian Superior Electoral Court, or “Tribunal Superior
Eleitoral”). Electoral rules in Brazil are strictly the same for the entire country. Therefore, a high
persistence in local executive power may indicate that political institutions at the local level are
controlled by a specific group, reflecting concentration of de facto political power even within a
competitive de jure institutional setting.19
The second set of variables includes indices of quality of local administration and access
to the justice system. The first variable captures the efficiency of the local executive in terms of
administrative capacity, as reflecting its ability to provide public goods and its potential
responsiveness to demands of the local population. We use an index of governance practices
19 The discrete variable is constructed based on at least one common surname across elected mayors. It equals 0 when there is no repetition of family in power (26% of the sample), 1 when the same family won two elections (69% of the sample), and 2 when the same family won three elections (5% of the sample). The number of municipalities in Brazil changes substantially prior to 1996, so we do not look at results of previous elections. We use a measure of political persistence based on families since political parties have not been particularly stable institutions in Brazil, possibly because the country returned to democracy only in 1985. So it is common for politicians to change parties, for new parties to be created, and for old parties to be extinguished or renamed. For example, from the 513 congressmen elected in 2002, 193 (or 38%) changed parties before the end of the legislative term in 2006 (Revista Veja, 2007). In any case, we also experimented with several alternative indicators of persistence and concentration of political power based on parties, with very poor results (same party wining mayoral elections, Herfindahl index of concentration of votes for – or seats in – the local legislature, fraction of seats in local legislature held by the mayor’s party, and difference in the fraction of votes between the mayor and the runner up, among others). In the case of Brazil, this problem is intrinsic to any measure of political concentration or persistence based on parties.
19
calculated by the Brazilian Census Bureau (IBGE) and used by the Ministry of Planning as a tool
to monitor the administrative performance of municipalities. The index has various components
representing different aspects of administrative capabilities at the municipality level, from
efficiency in tax collection and information gathering, to adoption of administrative and planning
instruments.20 It is constructed as the simple average of four qualitative indicators, normalized
from 1 to 6: the year in which the database of the tax on urban property (“IPTU”) was updated,
the IPTU payment rate, the number of administrative instruments,21 and the number of planning
instruments.22 The index (governance) is calculated using data between 1997 and 2000. This
variable comes close to a measure of the overall efficiency and organizational capability of the
local administration. According to the literature discussed before, rentier governments should be
weaker precisely along these dimensions (see Ross, 1999 and Goldberg et al, 2008).
The remaining institutional variable measures access to the justice system at the local
level. Formally, there is no municipal judicial system in Brazil. Any court or justice commission
in a municipality is either related to the local executive or to the state judicial system.
Nevertheless, it is not clear why some municipalities provide different access to justice even if
located in the same state and when certain types of courts are mandatory at the municipal level
(theoretically, mayors can be prosecuted if they do not exist). For this reason, the existence of
courts at the local level represents a de facto dimension of rule of law and of provision of access
to justice. In order to capture this notion, we use an index based on the definition of access to
justice proposed by the Brazilian Census Bureau (IBGE, 2001). The index (access to justice)
varies from 0 to 3 according to the existence of courts or justice commissions. It is calculated
with data from 2001, as the sum of three binary variables indicating the existence of Small
Claims Courts (“Tribunal de Pequenas Causas”), Youth Councils (“Conselho Tutelar”), and
Consumer Commissions (“Comissão de Defesa do Consumidor”).23
20 A complete description of the methodology used to compute the index can be found in IBGE (2001). Some of the components of this index seem better than others for our purposes. Nevertheless, in order to adopt an agnostic approach and trust entirely on an indicator whose conception is exogenous to this study, we focus on the index created by the Brazilian Census Bureau. The same comment applies to the index of access to justice that will be introduced later on. 21 Computed as the average of binary variables indicating the existence of: (i) City Administrative Districts, (ii) Sub-municipal Administrative Centers, (iii) Urban Plan (“Plano Diretor”), (iv) Law of Soil Use and Division (“Lei de Parcelamento do Solo” or equivalent), (v) Zoning Law (“Lei de Zoneamento” or equivalent), (vi) Building Code (“Código de Obras”), and (vii) Code of Administrative Conduct (“Código de Posturas”). 22 Computed as the average of binary variables indicating the existence of: (i) administrative plan (“Plano de Governo”), (ii) strategic plan (“Plano Estratégico”) and (iii) municipal organic law (“Lei Orgânica”). 23 Small Claims Courts deal with civil cases with relatively low complexity and involving small amounts of money. These special courts aim at determining the rights of the litigants based on merits and avoiding the high costs and long waiting time of the traditional justice system. Youth Councils were designed to promote human development
20
Our four dependent variables – land Gini, political persistence, governance, and access
to justice – cover different aspects of the de facto institutional environment and distribution of
political power. In addition to identifying de facto variation in a way that is not possible in cross-
country comparisons, these variables are more concrete indicators of institutional quality and of
characteristics of the political environment than those typically seen in that literature.
3.3 Other Variables
We use, for various purposes, income per capita and population from the 2000 census
files. From the Brazilian Census Bureau, we obtain data on area, age (year of foundation), and
coordinates of each municipality.
Our set of geographic variables, obtained from various different sources, is given by:
distance to equator (absolute value of the latitude), distance to coast, rainfall, sunshine, altitude,
temperatures (12 monthly averages), and soils (12 dummy variables for the types of soil present
in a 0.1 degree ray around the municipality’s official center). See the Appendix for a detailed
description of definitions and sources.
We also make use of indicators of local provision of public goods, obtained from the
2000 National System of Urban Indicators, from the Brazilian Ministry of Cities. These are:
percentage of households with toilet connected to the public sewage system, number of health
centers per 10,000 inhabitants, natural logarithm of per capita municipal spending on education
and culture, a dummy variable indicating whether the municipality has at least one public library,
and a dummy variable indicating whether the municipality has at least one local radio station.
Table 1 presents a series of descriptive results, already referred to in the introduction,
related to the pattern of development within Brazil. In the first five columns, we regress income
per capita and our four dependent variables on the complete set of geographic controls. The
geographic pattern of economic and institutional development within Brazil is clear: distance to
the equator, rainfall, sunshine, average temperatures, and types of soil are all significantly related
to both economic and institutional development. Geography alone explains 65, 30, and 20
percent of the variation in, respectively, ln income per capita, governance and land Gini. In the
last column, we include the institutional and political variables as additional controls in a
regression where income per capita is the dependent variable. Municipalities with better
and protect the rights of young people. Even though they are not directly related to the issues discussed in the paper, they reveal an interesting dimension of variation in de facto institutions: in 2000, despite being mandatory according to the constitution, they were present in only 68 percent of the municipalities. Consumer Commissions comprise different institutions of protection of consumer rights, with actions covering a wide range of topics including product liability, fraud, misrepresentation, and other consumer-business interactions.
21
governance, more access to justice, lower land Gini, and lower political persistence have
typically higher income per capita. The inclusion of the institutional variables increases
substantially the explanatory power of the regression, despite the already high R2 registered in
column 1 (the fraction of the variation explained by the model increases to 74%). Nevertheless,
endogeneity between institutional and economic development prevents any causal interpretation
of these results.
Finally, Table 2 presents some descriptive statistics for the areas affected by the sugar-
cane and gold cycles, and also for the rest of the country. As expected, the sugar-cane area,
which is located in one of poorest regions of Brazil, is on average less developed than the rest of
the country. Maybe surprising is the fact that the area of influence of the gold cycle summarizes
extremely well the average level of development observed in the country as a whole.
3.4 Empirical Strategy
Our main goal is to analyze whether the historical episodes from the colonial period
explain current variation in local institutions and distribution of political power. With this in
mind, we estimate the following specification:
iiiP
iiGP
iG
iiSP
iS
i PPGGPSSZ εβγγγγγα +++++++= X' , (2)
where i indicates municipality, iZ is a municipality characteristic related to local institutions or
political environment (governance, access to justice, land Gini or political persistence), iS is the
sugar-cane cycle variable, iG is the gold cycle variable, iP is distance to Portugal, iX is a vector
of geographic attributes (distance to equator, distance to coast, rainfall, sunshine, altitude,
temperature and soils), and iε is an error term. The vector of geographic attributes ( iX ) plays an
important role in our analysis. Table 1 shows that there is a significant correlation between
institutional characteristics and geography. When compared to cross-country analyses,
municipality-level data allow us to better account for the role of geographic characteristics.
Typically, there is much less geographic variation within municipalities than within countries.
The parameters Sγ and SPγ , under the usual conditions, reflect the effect of the sugar-
cane cycle on the institutional indicator. Assuming that E(ε|S,P,G,X) = 0, straightforward
manipulation of (2) leads to:
( ) ( ) PGPSZEGPSZE SPS γγ +==−= XX ,,,0|,,,1| . (3)
In the cases where Z is a good attribute, 0<Sγ indicates that the sugar-cane cycle had a
negative influence on current characteristics. The parameter SPγ captures how this effect varies
22
with distance to Portugal. For example, 0<Sγ and 0>SPγ indicate that the sugar-cane cycle
had a negative effect and that this effect was particularly strong for municipalities closer to
Portugal.
Similarly, the parameters Gγ and GPγ capture the effect of the gold-cycle on current
institutions. Equation (2) also leads to:
( ) ( ) PGPSZEGPSZE GPG γγ +==−= XX ,0,,|,1,,| . (4)
As an exploratory exercise, we also investigate whether income per capita is affected by
the colonial determinants of current institutions and distribution of power. Our strategy relies on
an instrumental variables approach, where the sugar-cane and gold cycles, along with distance to
Portugal, are used as sources of variation in current institutional quality. The first-stage
specification is given by equation (2), while the second-stage regression is the following (we also
discuss results where distance to Portugal is not included as an instrument, given the concerns
expressed in footnote 16):
iiiiY νδγμ +++= XZ ' , (5)
where iY is income per capita (ln) in municipality i , iZ is a vector of municipality
characteristics related to institutional quality and distribution of political power, iX is a vector of
geographic attributes (distance to equator, distance to coast, rainfall, sunshine, altitude,
temperature and soils), and iν is an error term. Given the limitations of this instrumental
variables approach, discussed in detail in Section 5, we see this exercise as an exploratory effort
to understand how de facto institutions and distribution of power affect long-run development.
4. Colonial Cycles and Current Institutions 4.1 Main Results
Table 3 presents the results on the long-term effects of colonial cycles on land Gini,
political persistence, governance and access to justice. In order to reveal the raw pattern of
correlation in the data, the first four columns present regressions for each dependent variable
where only the cycle influence variables (sugar and gold) are included in the right-hand side.
Columns 5 to 8 then present the results of this basic specification with the addition of our full set
of geographic controls. The last four columns present our complete specification, including as
independent variables the influence of the sugar-cane and gold cycles, distance to Portugal, and
23
interactions between each cycle influence and distance to Portugal, so as to explore variations in
the degree of intervention of the metropolis within each cycle.24
Columns 1 to 4 show that municipalities historically associated with the sugar-cane cycle
have, on average, higher concentration of land, more political persistence, worse governance
practices, and less access to justice. Results are similar for municipalities affected by the gold
cycle, but for the fact that they seem to be mildly associated with less political persistence. These
initial results reflect the simple comparison of municipalities with origins in the colonial cycles
and other municipalities in the country. However, municipalities with origins in the colonial
cycles also have particular geographic characteristics, which are likely to be correlated with the
occurrence of the cycles. Columns 5 to 8 reveal that this is indeed the case. Once geographic
controls are introduced, the sugar cane cycle remains robustly associated only with land Gini,
while the estimated effects on political persistence, governance, and access to justice are either
reduced dramatically or change signs. The gold cycle, on its turn, remains with the same pattern
of correlations with political persistence, governance, and access to justice, though only the
latter preserves statistical significance. These preliminary results suggest that a lot of the
negative correlation between sugar cane and institutional/political variables come from
geographic characteristics of the areas where sugar cane is grown, not necessarily being
intrinsically related to sugar cane itself. On the case of gold, on the other hand, its influence does
not seem to be purely related to geography.
In any case, these simple specifications do not capture differences within each cycle, due
to distinct degrees of influence of the metropolis. In order to take that into account, given the
importance of distance during colonial times, columns 9 to 12 depict the full specification
presented in equation 2. In the complete specification, land Gini increases with the influence of
the sugar-cane cycle, and particularly so for areas closer to Portugal (column 9 in Table 3). The
political persistence variable, on the other hand, is not significantly related to either colonial
episode; it is only slightly negatively correlated with distance to Portugal.
The results for governance and access to justice follow a very different pattern (columns
7 and 8 in Table 3). The influence of the gold cycle is systematically associated with worse
quality of the local administration and less access to justice, and the effect is stronger for
municipalities closer to Portugal. In the case of access to justice, distance to Portugal is also
positive and statistically significant without the interaction with the gold cycle variable.
24 Qualitative results remain identical when we allow for censoring of the dependent variables (tobit), to account for the way the indexes are constructed.
24
Overall, apart from the absence of robust results in relation to political persistence, our
main specification paints a picture remarkably consistent with the historical discussion from
Section 2. Areas associated with the sugar-cane cycle display higher concentration of land,
which is related to higher concentration of economic power in a historical perspective. This
result can be seen as a long-term consequence of the polarized society created by the plantation
system, with its large rural properties and extensive use of slave labor, as described by Engerman
and Sokoloff (1997). Areas historically associated with the gold cycle are particularly distinct for
the poor quality of their governments. These areas are characterized by inefficient governments
and lack of provision of access to justice, as predicted by the literature on the characteristics of
rentier states (see Ross, 1999 and Godlberg et al, 2008). Both these dimensions can be
understood as heritages from the inefficiently oppressive and narrowly focused state apparatus
created by the Portuguese crown during the mining period, centered entirely on extraction of
rents from gold. Finally, the negative consequences of the sugar-cane and gold cycles seem to be
particularly relevant for municipalities geographically closer to Portugal, which were subject to
more interference from the metropolis. In this sense, our results come not only from the
comparison between municipalities inside and outside the influence areas, but also from
municipalities within the influence areas closer to and further away from Portugal.
The only surprising result refers to the absence of any significant effect when we use
political persistence as the dependent variable. One might expect the concentration of economic
power determined by the sugar-cane cycle to be also reflected on persistence and concentration
of political power in the hands of a family or particular party. The absence of significant results
may be due to the relatively short time span considered (only three electoral cycles). This is a
limitation imposed by a significant change in the number of municipalities in Brazil in the mid
1990’s. But, as mentioned before, we also experimented with alternative measures of political
persistence and concentration based on parties, with similarly disappointing results (see footnote
18). It is difficult to tell whether this is due to measurement problems or, alternatively, to the
very recent character of Brazilian democracy and the well documented instability of parties.
Our statistically significant results from Table 3 imply that if the average municipality in
the historical mining areas had not been affected by the gold cycle, its governance index today
would be higher by 5 percent of a standard deviation, while its index of access to justice would
improve by 11 percent of a standard deviation. Similarly, if the average municipality in the
sugar-cane area had not been affected by the sugar-cane cycle, its index of concentration of land
today would be lower by 35 percent of a standard deviation.
25
4.2 Robustness and Extensions
Table 4 extends our analysis by including as additional controls municipality
characteristics that may be related to colonial cycles and also to current institutions and political
environment, therefore potentially biasing the results. Some of the municipalities affected by the
cycles are among the first colonial settlements of their respective areas, and have become today
important regional centers. It may be the case that, because of congestion or returns to scale in
the provision of public goods, institutional quality or concentration of land are affected by the
size of the municipality. We therefore include two measures of size – population and area – as
additional controls (ln(population) and ln(area)). It is also possible that older municipalities are
intrinsically different and that this correlation is driving the results. Therefore, we also include as
an additional control the age (in years) of municipalities. Finally, in the last four columns of
Table 4, we include controls for unobserved regional effects. The regional dummy variables are
defined according to the official classification of Brazil into North, Northeast, Center-West,
Southeast, and South. This definition relates to the homogeneity of the different areas of the
country in terms of their human, economic, and geographic components. The table shows that
qualitative results remain unchanged after the inclusion of the controls.
Finally, Table 5 investigates the nature of the institutional variation within and between
Brazilian states. In the first four columns, 26 state dummies are included as controls.25 In the
remaining columns, we calculate state averages and run state level regressions, with only 26
observations. States are political entities endogenous to the process of institutional development
that we want to analyze, so strictly they should not be included as additional controls in our
regressions. Still, the exercise proposed helps reveal whether the effects captured are
manifestations of the development of different state apparatuses, or of distinct municipal
characteristics even within states.
In columns 1 to 4, sugar-cane and gold cycles remain significantly related to,
respectively, land Gini and governance even when we consider only within state variation.
Within states, areas closer to the sugar-cane and gold cycles have, respectively, more
concentrated distribution of land and worse governance practices. The non-significant result for
access to justice suggests that its relationship with the gold cycle is identified through variation
across states. In columns 5 to 8, this is confirmed by the significant effect of both cycles on
access to justice when we use state level averages. These results are consistent with the
organization of justice in Brazil, where states play a prominent role. It is particularly interesting 25 The federal district of Brasilia is not in the sample.
26
to note that the sugar cane cycle is also positively related to political persistence and negatively
related to access to justice when state level averages are considered. Though the number of
observations in these regressions is very small, results are suggestive that one potentially
important manifestation of colonial heritage is related to the institutional and political
environment created at the state level.
In summary, the gold cycle seems to be consistently associated with lower quality of
local government and less access to justice, while the sugar-cane cycle seems to be associated
with a more concentrated distribution of endowments. These qualitative results are generally
unaffected by our methodological choices or by the inclusion of relevant municipality
characteristics as additional controls. Finally, identification of the effect on access to justice
seems to trust on the contrast between states affected and not affected by the cycles, while the
effect on land Gini and governance comes also from within state variation.
5. Colonial Heritage, Current Institutions and Development 5.1 Main Results
We now briefly investigate whether the colonial heritage associated with the rent-seeking
episodes seems to have had any noticeable effect on income per capita today, and whether this
effect could have worked through its institutional and political legacy. First, Table 6 presents the
results of reduced form estimates, where our specifications from Table 3 are used with income
per capita as the dependent variable. When only the variables indicating the influence of the
colonial cycles are used, both the sugar-cane and the gold cycles appear as being associated with
lower income per capita. The point estimates imply that, unconditionally, municipalities directly
affected by the sugar-cane cycle have income per capita on average 68% lower than the rest of
the country, while municipalities directly affected by the gold cycle have income per capita 4.4%
lower. But when controls and interactions with distance to Portugal are included in the right-
hand side, only the variables related to the gold cycle remain significant.
The results from Table 6 illustrate that the institutional and political consequences of the
colonial cycles may have had long-term implications for the development of the various regions
of Brazil. From the perspective of our previous discussion, the interesting question is whether
these long-term effects worked through the channels analyzed before. We explore this possibility
by estimating second stage regressions of income per capita on local institutions and
concentration of power, once these are instrumented with the historical variables according to the
main specification from Table 3. Reverse causality is likely to introduce a positive bias in direct
27
inferences about the relationship between institutions and income per capita. Not only better
economic institutions increase income per capita, but also richer municipalities may demand and
be able to afford better institutions. In addition, there is the possibility of omitted variables and
measurement error, in which case it is not possible to tell a priori the expected direction of the
bias. All these reasons suggest that instruments are needed to uncover the causal impact of
institutions on development.
But the instrumental variables approach proposed here has its limitations. Instrumenting
our institutional dimensions with the historical variables is equivalent to assuming that the
colonial cycles had no other effect on development apart from that captured by the specific
variables chosen. This not only excludes possible direct economic impacts, but also other
institutional effects not related to the dimensions analyzed.26 This is probably most serious in
relation to de facto institutions that are difficult to measure, such as those associated with the
interaction of individuals within society, trust, and social capital (as, for example, in Hoff and
Pandey, 2005).
We cannot hope to solve this problem in the paper. So we see our instrumental variables
approach as an exploratory effort in the direction of understanding the role that de facto
institutions and concentration of economic power play in the process of development. Since we
do observe that colonial history shapes certain features of current institutions and of the political
landscape, and that both are related to economic development, it seems natural to ask whether
colonial history affects development through the specific channels analyzed. We follow this
strategy, keeping in mind the limitations of the exercise and seeing it as an addendum to the main
results of the paper, which were presented in the previous section. We also look at various
dimensions of public good provision as possibly capturing, in a broader sense, local institutional
and political development. This approach lacks the precision of our previous measures, but
overcomes its narrowness by using public good provision as a “catch-all” indicator of
institutional quality.
Columns 1 to 3 in Table 7 present the regressions of income per capita on governance,
access to justice, and land Gini separately, once they are instrumented with the historical
variables (we only consider the variables for which we had significant results in the previous
26 This same criticism applies to cross-country studies analyzing the effect of institutions on development, such as Acemoglu, Johnson, and Robinson (2001 and 2002). But the problem is likely to be more severe in our case, since we have more specific measures of institutions. What is an advantage in terms of understanding the historical forces shaping local institutions turns into a burden when one tries to analyze the intervening role of institutions in the relationship between colonial heritage and development.
28
section). The results related to governance and access to justice are positive and statistically
significant. Along these two dimensions, the reduced institutional quality determined by the rent-
seeking colonial episodes is reflected on reduced income per capita in the long-run.
The result related to land Gini, on the other hand, is not statistically significant.27 Though
maybe surprising, this is in line with other results from the literature and with what would be
suggested by Tables 3 and 6. Some authors have even found positive long term effects of land
inequality in Brazil (Ferraz and Finan, 2009) and in the Colombian state of Cundinamarca
(Acemoglu et al, 2007). Understanding why empirical studies in Latin America fail to find
negative long run impacts of concentration of land is an important area for future research, but is
beyond the scope of this paper.
Column 4 shows that, when all the institutional dimensions are included together,
governance and access to justice remain statistically significant (column 5 shows that both
remain statistically significant when they are the only dimensions considered).28 Quantitatively,
the coefficients from column 5 imply that an exogenous improvement in governance practices
within the municipality administration from the 25th to the 75th percentile of the observed
distribution would lead, in the long-run, to an increase of 43% in income per capita. An
analogous movement of a municipality in the observed distribution of access to justice would
lead to an increase of 62% in income per capita. To give some perspective into the magnitude of
these numbers, the difference in income per capita between municipalities in the 25th and 75th
percentiles of the income distribution is 120%.29
Finally, the inclusion of instrumented institutions as additional controls reduces the role
played by some of the main geographic variables discussed in Table 1. The coefficient on
distance to equator, for example, is reduced from 0.064 to 0.036 when we compare column 1
27 The coefficients on governance and access to justice remain statistically significant when confidence intervals robust to weak instruments are used, according to the methodology suggested by Moreira (2003) and implemented by Mikusheva and Poi (2006). 28 If distance to international markets is correlated with income per capita, distance to Portugal might not be a valid instrument. When we use dist to Portugal as an additional control, rather than an instrument, results related to the effects of the institutional variables, when taken separately, remain very similar, increasing slightly in magnitude (as should be expected from the direct effect of distance to Europe on development). The only noticeable change occurs when governance and access to justice are considered jointly: the absence of dist to Portugal as an instrument hinders the ability of the model to distinguish between the effects of governance and access to justice, and only the latter remains statistically significant. It is also worth mentioning that the results from Table 7 are robust to the inclusion of measures of human capital (education and health) as additional independent variables (results available from the authors upon request). In this sense, the exercise is not subject to the criticism raised by Glaeser et al (2004). 29 The IV coefficients from column 5 are higher than the respective OLS estimates presented in Table 1. This suggests that the IV estimation is minimizing a problem of attenuation bias. Interestingly, the vast majority of cross-country studies have also found similar differences between IV and OLS estimates (see Pande and Udry, 2006).
29
from Table 1 with column 5 Table 7, while the coefficient on rainfall drops from 0.034 to 0.015,
and the coefficient on sunshine drops from -0.018 to -0.008. At the same time, the F statistic on
the joint significance of the twelve monthly temperatures is reduced from 39.26 to 22.69, while
the F statistic on the types of soil drops from 13.46 to 4.44. Overall, part of the correlation
between geography and development within Brazilian seems to be a result of the different
episodes of colonization experienced by the country. Still, the institutional/political variables are
unable to fully account for the geographic pattern of development discussed in the introduction,
so we cannot rule out the existence of some causal relationship between endowments and
development within Brazil.
5.2 Public Good Provision as Institutional Development
One of the advantages of our data is that our variables give very concrete meaning to the
idea of institutional and political development. But the precision of these measures also opens
the possibility that relevant dimensions of the effect of colonial heritage on long-term
development may not be captured. This is particularly worrisome in the two-stage regressions
analyzing the effect of institutions on economic development, since this approach assumes that
the only potential channels through which colonial past may affect current development are the
three variables considered.
An opposite strategy would be to look for broad, encompassing measures, which even
though may not have very concrete and specific meanings, would be ‘catch-all’ indicators of
institutional development. From this perspective, good institutions would lead to good policies
and to higher provision of public goods. In this subsection, we adopt this strategy and think of
local provision of various dimensions of public goods as indicators of overall institutional and
political development. We look at local public goods related to sanitation, health, education,
culture, and information: percentage of households connected to the public sewage system,
number of health centers per 10,000 inhabitants, per capita public spending on education and
culture (ln), whether the municipality has at least one public library, and whether the
municipality has at least one local radio station.30
We estimate the main specification from Table 3 for these five dimensions of public
goods. The results are presented on Table 8. The sugar-cane cycle is associated with lower
provision of sanitation and lower number of health centers per 10,000 inhabitants. The gold
cycle, on its turn, is associated with lower provision of all dimensions of public goods, but for
30 Local radio stations in Brazil are typically private. Nevertheless, the functioning of a radio station requires a government concession that involves influence and will on the part of local political actors.
30
per capita spending on education and culture.31 In line with the results previously obtained, the
gold cycle seems to lead to a poorly functioning public administration also in relation to the
provision of sanitation, health, culture, and information. This pattern is consistent with the
theoretical characterization of the rentier state discussed in section 2.2, as non-responsive to
public demands and detached from the local population. The results from Table 8 are also robust
to the inclusion of all controls used in Table 4 (results available upon request).
6. Concluding Remarks This paper investigates the long-run determinants of local institutions in Brazil. Current
variation in local institutions is traced back to the colonial origins of municipalities. This
approach enables us to control for a large set of geographic characteristics and to explore
variation in local institutions within a constant de jure institutional setting.
Our strategy takes advantage of two features of our empirical environment. First, the
most important rent-seeking episodes of colonial Brazil (sugar-cane and gold cycles) can be seen
as historical shocks to local institutional development. Both cycles were relatively well-defined
in time and space and marked the initial occupation of certain areas of the country. Second, the
within country analysis allows the investigation of four different institutional and political
characteristics of municipalities. Thus, we provide different pathways through which the
influence of extractive episodes can be materialized.
We show that municipalities with origins tracing back to the sugar-cane colonial cycle
display more inequality in the distribution of land, while municipalities with origins tracing back
to the gold cycle display worse governance practices and less access to justice. These colonial
rent-seeking episodes are also correlated with lower provision of public goods and, in the case of
gold, lower income per capita. A significant portion of the correlation between geography and
development within Brazil seems to be related to the colonial histories experienced by different
areas of the country.
References
Acemoglu, Daron, Simon Johnson, and James A. Robinson (2001). The Colonial Origins of Comparative Development: An Empirical Investigation. American Economic Review, v91, n5, 1369-401.
31 These results are also robust to the inclusion of the additional controls used in Table 5 (results available from the authors upon request).
31
Acemoglu, Daron, Simon Johnson, and James A. Robinson (2002). Reversal of Fortune: Geography and Institutions in the Making if the Modern World Income Distribution. Quarterly Journal of Economics, v117, n4, 1231-94.
Acemoglu, Daron and James A. Robinson (2001). A Theory of Political Transitions. American Economic Review, v91, n4, 938-63.
Acemoglu, Daron and James Robinson (2006). De Facto Political Power and Institutional Persistence. American Economic Association Papers and Proceedings, v96, n2, 325-30.
Acemoglu, Daron and James Robinson (2008). Persistence of Power, Elites and Institutions. American Economic Review, v98, n1, 167-293.
Acemoglu, Daron, María Angélica Bautista, Pablo Querubín, James A. Robinson (2007). “Economic and Political Inequality in Development: The Case of Cundinamarca, Colombia.” Unpublished manuscript, MIT.
Acemoglu, Daron, Davide Ticchi, and Andrea Vindigni (2007). “Emergence and Persistence of Inefficient States.” Unpublished manuscript, MIT.
Assunção, Juliano (2008). Land Reform and Landholdings in Brazil. In: Davies, James (ed). Personal Wealth from a Global Perspective. Oxford University Press.
Banerjee, Abhijit and Lakshmi Iyer (2005). History, Institutions and Economic Performance: The Legacy of Colonial Land Tenure Systems in India. American Economic Review, v95, n4, 1190-1213.
Banerjee, Abhijit, Lakshmi Iyer and Rohini Somanathan (2004). “History, Social Division and Public Goods in Rural India.” Unpublished manuscript, MIT.
Berkowitz, Daniel and Karen Clay (2004). “Initial Conditions, Institutional Dynamics and Economic Performance: Evidence from the American States.” Unpublished manuscript, University of Pittsburgh.
Bonet, Jaime and Adolfo M. Roca (2006). “El Legado Colonial como Determinante del Ingreso per capita Departamental en Colombia.” Documentos de trabajo sobre Economía Regional n. 75, Banco de la República – Centro de Estúdios Econômicos Regionales (CEER).
Bruhn, Miriam and Francisco A. Gallego (2006). “Good, Bad and Ugly Colonial Activities: Studying Development Across the Americas.” Unpublished manuscript, PUC-Chile.
Boxer, Charles R. (2000). A Idade do Ouro do Brasil – Dores do Crescimento de uma Sociedade Colonial. Editora Nova Fronteira, Rio de Janeiro.
Costa, Iraci del Nero da (1982a). Ocupação, Povoamento e Dinâmica Populacional. In: Costa, Iraci del Nero da & LUNA, Francisco V.. Minas Colonial: Economia e Sociedade. Pioneira, São Paulo, 1-30.
Costa, Iraci del Nero da (1982b). Fundamentos Econômicos da Ocupação e Povoamento de Minas Gerais. Revista do IEB, v24, 41-52.
Easterly, William and Ross Levine (2003). Tropics, Germs, and Crops: How Endowments Influence Economic Development. Journal of Monetary Economics, v50, n1, 3-39.
Engerman, Stanley L. and Kenneth L. Sokoloff (1997). The Factor Endowments, Institutions, and Differential Paths of Growth among New World Economies. In: Stephen Harber (ed), How Latin America Fell Behind. Stanford University Press, Palo Alto.
32
Fausto, Boris (2006). História do Brasil. Editora Universidade de São Paulo, São Paulo.
Ferraz, Cláudio and Frederico Finan (2009). “Political Power Persistence and Economic Development: Evidence from Brazil’s Regime Transition.” Unpublished manuscript, Catholic University of Rio de Janeiro.
Feyrer, James and Bruce Sacerdote (2006). “Colonialism and Modern Income: Islands as Natural Experiments.” NBER Working Paper n12546.
Frankema, Ewout (2005). “The Colonial Origins of Inequality: Exploring the Causes and Consequences of Land Distribution.” University of Groningen, Ibero-America Institute for Economic Research, Discussion Paper n.119.
Furtado, Celso (1959). Formação Econômica do Brasil. Editora Fundo de Cultura, Rio de Janeiro.
Gallup, John Luke, Jeffrey Sachs, and Andrew D. Mellinger (1999). Geography and Economic Development. In: Plsekovic, Boris and Joseph Stiglitz (eds.). Annual World Bank Conference on Development Economics, 1998/1999. Washington D.C., World Bank, 127-78.
Glaeser, Edward L., Rafael La Porta, Florencio Lopez-de-Silanes and Andrei Shleifer (2004). Do Institutions Cause Growth? Journal of Economic Growth, v9, n3, 271-303.
Goldberg, Ellis, Erik Wibbels, and Eric Mvukiyehe (2008). Lessons from Strange Cases – Democracy, Development, and the Resource Curse in the U.S. States. Comparative Political Studies, v41, n4/5, 477-514.
HGCB (1968). A Época Colonial. In: Sérgio B. de Holanda (org.): História Geral da Civilização Brasileira. Difusão Européia do Livro, São Paulo.
Higman, Barry W. (2000). The Sugar Revolution. Economic History Review, LIII, 2, 213-236.
Hoff, Karla and Priyanka Pandey (2005). Opportunity is Not Everything: How Belief Systems and Mistrust Shape Responses to Economic Incentives. Economics of Transition, v13, n2, 445-472.
IBGE (2001). Pesquisa de Informações Básicas Municipais – Perfil dos Municípios Brasileiros. Instituto Brasileiro de Geografia e Estatística, Rio de Janeiro.
Iyer, Lakshmi (2003). “The Long-term Impact of Colonial Rule: Evidence from India.” Unpublished manuscript, Harvard Business School.
Jimeno, Camilo G. (2006). “Colonial Institutions and Long-Run Economic Performance in Colombia: Is There Evidence of Persistence?” Documento CEDE 2005-59.
Lagerlöf, Nills-Petter (2005). “Geography, Institutions, and Growth: the United States as a Microcosm.” Unpublished manuscript, York University.
Leal, Victor Nunes (1997). Coronelismo – Enxada e Voto. Nova Fronteira, Rio de Janeiro.
Mahdavy, Hussein (1970). The Patterns and Problems of Economic Development in Rentier States: The Case of Iran. In: M.A. Cook (ed). Studies in Economic History of the Middle East. Oxford, Oxford University Press, 428-457.
Mikusheva, Anna and Brian P. Poi (2006). Tests and Confidence Sets with Correct Size in the Simultaneous Equations Model with Potentially Weak Instruments. The Stata Journal, v6, n3, 335-347.
33
Mitchener, Kris J. and Ian W. McLean (2003). The Productivity of U.S. States since 1880. Journal of Economic Growth, n8, v1, 73-114.
Moreira, Marcelo (2003). A Conditional Likelihood Ratio Test for Structural Models. Econometrica, n71, v4, 1027-1048.
North, Douglas (1991). Institutions. Journal of Economic Perspectives, v5, n1, 97-112.
Nunn, Nathan (2009). The Importance of History for Economic Development. Annual Review of Economics, v1, n1, 1.1-1.28.
Pande, Rohini and Christopher Udry (2006). “Institutions and Development: A View from Below.” Unpublished manuscript, Yale University.
Porto, Costa (1967). O Sistema Sesmarial no Brasil. Fundação Universidade de Brasília, Brasília.
Prado Jr, Caio (1945). História Econômia do Brasil. Brasilianse, São Paulo.
Reis, Eustáquio J. (2005). “Uma Interpretação Econômica da História do Brasil.” Unpublished manuscript, Instituto de Pesquisa Econômica Aplicada.
Revista Veja (2007). A Caça aos Infiéis – A Decisão do TSE de que o Mandato é do Partido Aprimora a Democracia. Revista Veja, April 04.
Rodrik, Dani, Arvind Subramanian, and Francesco Trebbi (2004). Institutions Rule: The Primacy of Institutions over Geography and Integration in Economic Development. Journal of Economic Growth, v9, n2, 131-65.
Ross, Michael L. (1999). The Political Economy of the Resource Curse. World Politics, v51, n2, 297-322.
Russel-Wood, Anthony J. R. (1977). Technology and Society: The Impact of Gold Mining and the Institution of Slavery in Portuguese America. Journal of Economic History, v37, n1, 59-83.
Schwartz, Stuart B. (1987). Plantations and Peripheries: c.1580 – c.1750. In: Leslie Bethell (ed.). Colonial Brazil. Cambridge University Press, New York, 67-144.
Simonsen, Roberto C. (1937 [1977]). História Econômica do Brasil (1500-1820). Editora Nacional, São Paulo.
Wheling, Arno (1994). Formação do Brasil Colonial. Editora Nova Fronteira, Rio de Janeiro.
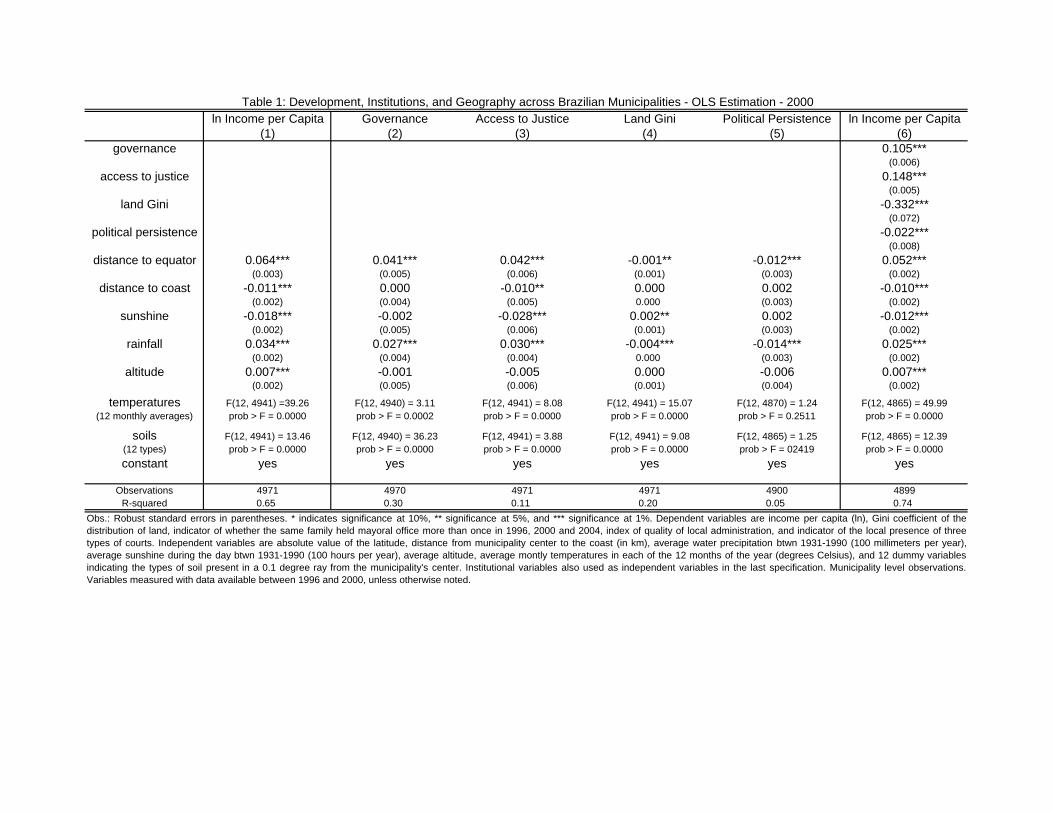
ln Income per Capita Governance Access to Justice Land Gini Political Persistence ln Income per Capita(1) (2) (3) (4) (5) (6)
governance 0.105***(0.006)
access to justice 0.148***(0.005)
land Gini -0.332***(0.072)
political persistence -0.022***(0.008)
distance to equator 0.064*** 0.041*** 0.042*** -0.001** -0.012*** 0.052***(0.003) (0.005) (0.006) (0.001) (0.003) (0.002)
distance to coast -0.011*** 0.000 -0.010** 0.000 0.002 -0.010***(0.002) (0.004) (0.005) 0.000 (0.003) (0.002)
sunshine -0.018*** -0.002 -0.028*** 0.002** 0.002 -0.012***(0.002) (0.005) (0.006) (0.001) (0.003) (0.002)
rainfall 0.034*** 0.027*** 0.030*** -0.004*** -0.014*** 0.025***(0.002) (0.004) (0.004) 0.000 (0.003) (0.002)
altitude 0.007*** -0.001 -0.005 0.000 -0.006 0.007***(0.002) (0.005) (0.006) (0.001) (0.004) (0.002)
temperatures F(12, 4941) =39.26 F(12, 4940) = 3.11 F(12, 4941) = 8.08 F(12, 4941) = 15.07 F(12, 4870) = 1.24 F(12, 4865) = 49.99(12 monthly averages) prob > F = 0.0000 prob > F = 0.0002 prob > F = 0.0000 prob > F = 0.0000 prob > F = 0.2511 prob > F = 0.0000
soils F(12, 4941) = 13.46 F(12, 4940) = 36.23 F(12, 4941) = 3.88 F(12, 4941) = 9.08 F(12, 4865) = 1.25 F(12, 4865) = 12.39(12 types) prob > F = 0.0000 prob > F = 0.0000 prob > F = 0.0000 prob > F = 0.0000 prob > F = 02419 prob > F = 0.0000constant yes yes yes yes yes yes
Observations 4971 4970 4971 4971 4900 4899R-squared 0.65 0.30 0.11 0.20 0.05 0.74
Table 1: Development, Institutions, and Geography across Brazilian Municipalities - OLS Estimation - 2000
Obs.: Robust standard errors in parentheses. * indicates significance at 10%, ** significance at 5%, and *** significance at 1%. Dependent variables are income per capita (ln), Gini coefficient of thedistribution of land, indicator of whether the same family held mayoral office more than once in 1996, 2000 and 2004, index of quality of local administration, and indicator of the local presence of threetypes of courts. Independent variables are absolute value of the latitude, distance from municipality center to the coast (in km), average water precipitation btwn 1931-1990 (100 millimeters per year),average sunshine during the day btwn 1931-1990 (100 hours per year), average altitude, average montly temperatures in each of the 12 months of the year (degrees Celsius), and 12 dummy variablesindicating the types of soil present in a 0.1 degree ray from the municipality's center. Institutional variables also used as independent variables in the last specification. Municipality level observations.Variables measured with data available between 1996 and 2000, unless otherwise noted.
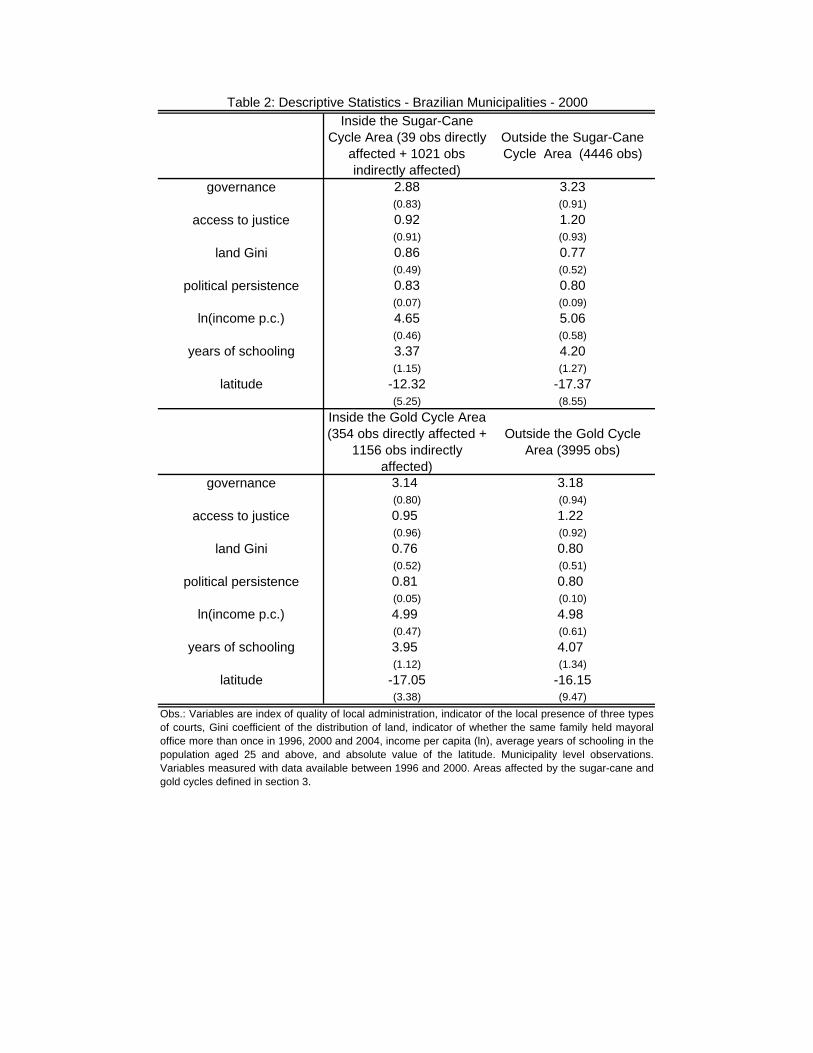
Inside the Sugar-Cane Cycle Area (39 obs directly
affected + 1021 obs indirectly affected)
Outside the Sugar-Cane Cycle Area (4446 obs)
governance 2.88 3.23(0.83) (0.91)
access to justice 0.92 1.20(0.91) (0.93)
land Gini 0.86 0.77(0.49) (0.52)
political persistence 0.83 0.80(0.07) (0.09)
ln(income p.c.) 4.65 5.06(0.46) (0.58)
years of schooling 3.37 4.20(1.15) (1.27)
latitude -12.32 -17.37(5.25) (8.55)
Inside the Gold Cycle Area (354 obs directly affected +
1156 obs indirectly affected)
Outside the Gold Cycle Area (3995 obs)
governance 3.14 3.18(0.80) (0.94)
access to justice 0.95 1.22(0.96) (0.92)
land Gini 0.76 0.80(0.52) (0.51)
political persistence 0.81 0.80(0.05) (0.10)
ln(income p.c.) 4.99 4.98(0.47) (0.61)
years of schooling 3.95 4.07(1.12) (1.34)
latitude -17.05 -16.15(3.38) (9.47)
Table 2: Descriptive Statistics - Brazilian Municipalities - 2000
Obs.: Variables are index of quality of local administration, indicator of the local presence of three typesof courts, Gini coefficient of the distribution of land, indicator of whether the same family held mayoraloffice more than once in 1996, 2000 and 2004, income per capita (ln), average years of schooling in thepopulation aged 25 and above, and absolute value of the latitude. Municipality level observations.Variables measured with data available between 1996 and 2000. Areas affected by the sugar-cane andgold cycles defined in section 3.
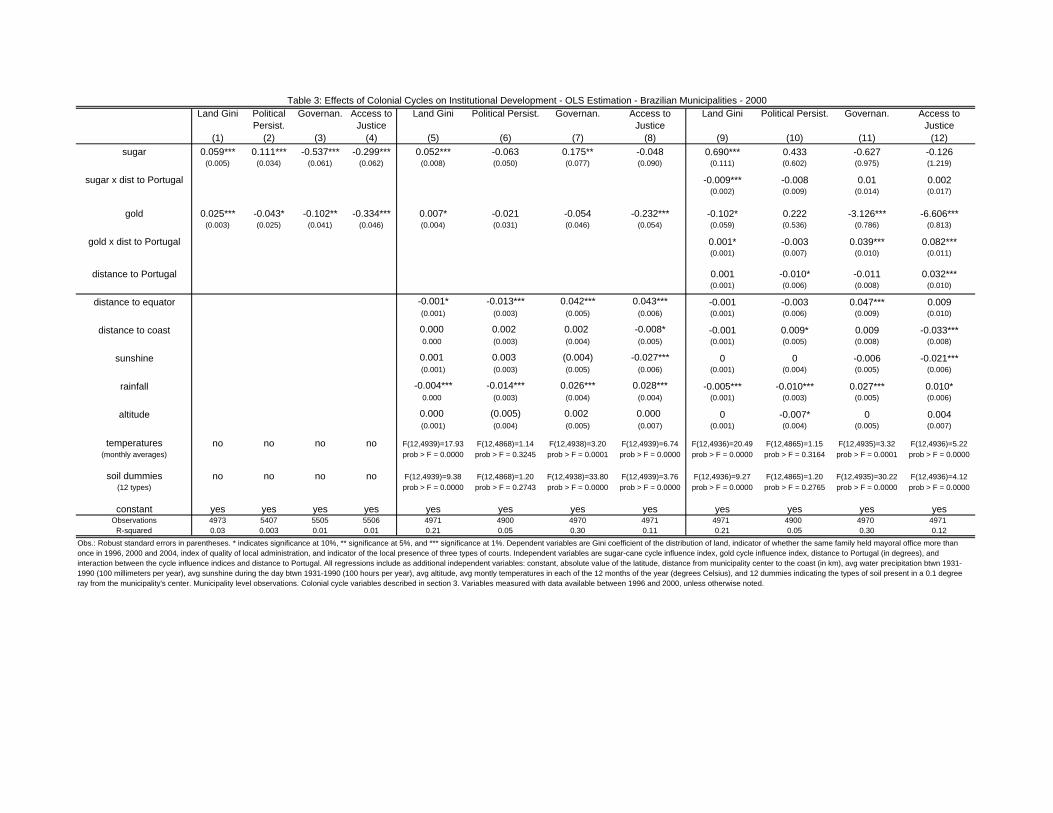
Land Gini Political Persist.
Governan. Access to Justice
Land Gini Political Persist. Governan. Access to Justice
Land Gini Political Persist. Governan. Access to Justice
(1) (2) (3) (4) (5) (6) (7) (8) (9) (10) (11) (12)sugar 0.059*** 0.111*** -0.537*** -0.299*** 0.052*** -0.063 0.175** -0.048 0.690*** 0.433 -0.627 -0.126
(0.005) (0.034) (0.061) (0.062) (0.008) (0.050) (0.077) (0.090) (0.111) (0.602) (0.975) (1.219)
sugar x dist to Portugal -0.009*** -0.008 0.01 0.002(0.002) (0.009) (0.014) (0.017)
gold 0.025*** -0.043* -0.102** -0.334*** 0.007* -0.021 -0.054 -0.232*** -0.102* 0.222 -3.126*** -6.606***(0.003) (0.025) (0.041) (0.046) (0.004) (0.031) (0.046) (0.054) (0.059) (0.536) (0.786) (0.813)
gold x dist to Portugal 0.001* -0.003 0.039*** 0.082***(0.001) (0.007) (0.010) (0.011)
distance to Portugal 0.001 -0.010* -0.011 0.032***(0.001) (0.006) (0.008) (0.010)
distance to equator -0.001* -0.013*** 0.042*** 0.043*** -0.001 -0.003 0.047*** 0.009(0.001) (0.003) (0.005) (0.006) (0.001) (0.006) (0.009) (0.010)
distance to coast 0.000 0.002 0.002 -0.008* -0.001 0.009* 0.009 -0.033***0.000 (0.003) (0.004) (0.005) (0.001) (0.005) (0.008) (0.008)
sunshine 0.001 0.003 (0.004) -0.027*** 0 0 -0.006 -0.021***(0.001) (0.003) (0.005) (0.006) (0.001) (0.004) (0.005) (0.006)
rainfall -0.004*** -0.014*** 0.026*** 0.028*** -0.005*** -0.010*** 0.027*** 0.010*0.000 (0.003) (0.004) (0.004) (0.001) (0.003) (0.005) (0.006)
altitude 0.000 (0.005) 0.002 0.000 0 -0.007* 0 0.004(0.001) (0.004) (0.005) (0.007) (0.001) (0.004) (0.005) (0.007)
temperatures no no no no F(12,4939)=17.93 F(12,4868)=1.14 F(12,4938)=3.20 F(12,4939)=6.74 F(12,4936)=20.49 F(12,4865)=1.15 F(12,4935)=3.32 F(12,4936)=5.22(monthly averages) prob > F = 0.0000 prob > F = 0.3245 prob > F = 0.0001 prob > F = 0.0000 prob > F = 0.0000 prob > F = 0.3164 prob > F = 0.0001 prob > F = 0.0000
soil dummies no no no no F(12,4939)=9.38 F(12,4868)=1.20 F(12,4938)=33.80 F(12,4939)=3.76 F(12,4936)=9.27 F(12,4865)=1.20 F(12,4935)=30.22 F(12,4936)=4.12(12 types) prob > F = 0.0000 prob > F = 0.2743 prob > F = 0.0000 prob > F = 0.0000 prob > F = 0.0000 prob > F = 0.2765 prob > F = 0.0000 prob > F = 0.0000
constant yes yes yes yes yes yes yes yes yes yes yes yesObservations 4973 5407 5505 5506 4971 4900 4970 4971 4971 4900 4970 4971
R-squared 0.03 0.003 0.01 0.01 0.21 0.05 0.30 0.11 0.21 0.05 0.30 0.12Obs.: Robust standard errors in parentheses. * indicates significance at 10%, ** significance at 5%, and *** significance at 1%. Dependent variables are Gini coefficient of the distribution of land, indicator of whether the same family held mayoral office more than once in 1996, 2000 and 2004, index of quality of local administration, and indicator of the local presence of three types of courts. Independent variables are sugar-cane cycle influence index, gold cycle influence index, distance to Portugal (in degrees), and interaction between the cycle influence indices and distance to Portugal. All regressions include as additional independent variables: constant, absolute value of the latitude, distance from municipality center to the coast (in km), avg water precipitation btwn 1931-1990 (100 millimeters per year), avg sunshine during the day btwn 1931-1990 (100 hours per year), avg altitude, avg montly temperatures in each of the 12 months of the year (degrees Celsius), and 12 dummies indicating the types of soil present in a 0.1 degree ray from the municipality's center. Municipality level observations. Colonial cycle variables described in section 3. Variables measured with data available between 1996 and 2000, unless otherwise noted.
Table 3: Effects of Colonial Cycles on Institutional Development - OLS Estimation - Brazilian Municipalities - 2000
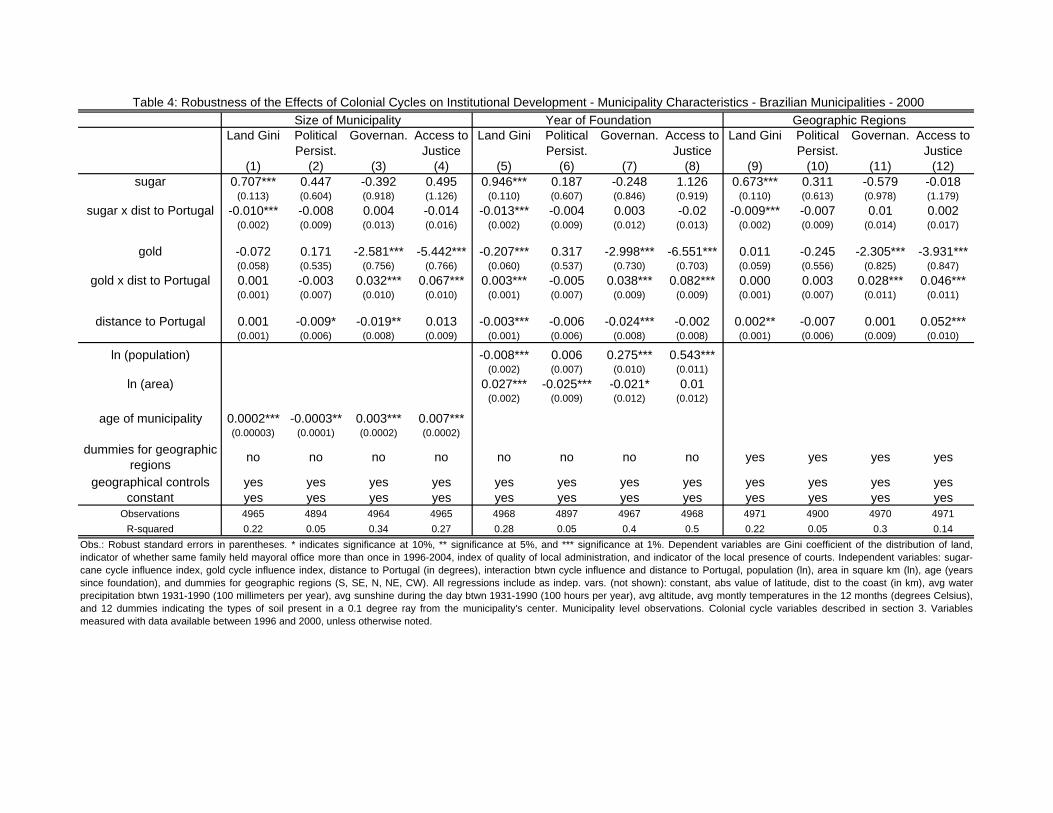
Land Gini Political Persist.
Governan. Access to Justice
Land Gini Political Persist.
Governan. Access to Justice
Land Gini Political Persist.
Governan. Access to Justice
(1) (2) (3) (4) (5) (6) (7) (8) (9) (10) (11) (12)sugar 0.707*** 0.447 -0.392 0.495 0.946*** 0.187 -0.248 1.126 0.673*** 0.311 -0.579 -0.018
(0.113) (0.604) (0.918) (1.126) (0.110) (0.607) (0.846) (0.919) (0.110) (0.613) (0.978) (1.179)sugar x dist to Portugal -0.010*** -0.008 0.004 -0.014 -0.013*** -0.004 0.003 -0.02 -0.009*** -0.007 0.01 0.002
(0.002) (0.009) (0.013) (0.016) (0.002) (0.009) (0.012) (0.013) (0.002) (0.009) (0.014) (0.017)
gold -0.072 0.171 -2.581*** -5.442*** -0.207*** 0.317 -2.998*** -6.551*** 0.011 -0.245 -2.305*** -3.931***(0.058) (0.535) (0.756) (0.766) (0.060) (0.537) (0.730) (0.703) (0.059) (0.556) (0.825) (0.847)
gold x dist to Portugal 0.001 -0.003 0.032*** 0.067*** 0.003*** -0.005 0.038*** 0.082*** 0.000 0.003 0.028*** 0.046***(0.001) (0.007) (0.010) (0.010) (0.001) (0.007) (0.009) (0.009) (0.001) (0.007) (0.011) (0.011)
distance to Portugal 0.001 -0.009* -0.019** 0.013 -0.003*** -0.006 -0.024*** -0.002 0.002** -0.007 0.001 0.052***(0.001) (0.006) (0.008) (0.009) (0.001) (0.006) (0.008) (0.008) (0.001) (0.006) (0.009) (0.010)
ln (population) -0.008*** 0.006 0.275*** 0.543***(0.002) (0.007) (0.010) (0.011)
ln (area) 0.027*** -0.025*** -0.021* 0.01(0.002) (0.009) (0.012) (0.012)
age of municipality 0.0002*** -0.0003** 0.003*** 0.007***(0.00003) (0.0001) (0.0002) (0.0002)
dummies for geographic regions no no no no no no no no yes yes yes yes
geographical controls yes yes yes yes yes yes yes yes yes yes yes yesconstant yes yes yes yes yes yes yes yes yes yes yes yes
Observations 4965 4894 4964 4965 4968 4897 4967 4968 4971 4900 4970 4971R-squared 0.22 0.05 0.34 0.27 0.28 0.05 0.4 0.5 0.22 0.05 0.3 0.14
Table 4: Robustness of the Effects of Colonial Cycles on Institutional Development - Municipality Characteristics - Brazilian Municipalities - 2000
Obs.: Robust standard errors in parentheses. * indicates significance at 10%, ** significance at 5%, and *** significance at 1%. Dependent variables are Gini coefficient of the distribution of land,indicator of whether same family held mayoral office more than once in 1996-2004, index of quality of local administration, and indicator of the local presence of courts. Independent variables: sugar-cane cycle influence index, gold cycle influence index, distance to Portugal (in degrees), interaction btwn cycle influence and distance to Portugal, population (ln), area in square km (ln), age (yearssince foundation), and dummies for geographic regions (S, SE, N, NE, CW). All regressions include as indep. vars. (not shown): constant, abs value of latitude, dist to the coast (in km), avg waterprecipitation btwn 1931-1990 (100 millimeters per year), avg sunshine during the day btwn 1931-1990 (100 hours per year), avg altitude, avg montly temperatures in the 12 months (degrees Celsius),and 12 dummies indicating the types of soil present in a 0.1 degree ray from the municipality's center. Municipality level observations. Colonial cycle variables described in section 3. Variablesmeasured with data available between 1996 and 2000, unless otherwise noted.
Size of Municipality Year of Foundation Geographic Regions
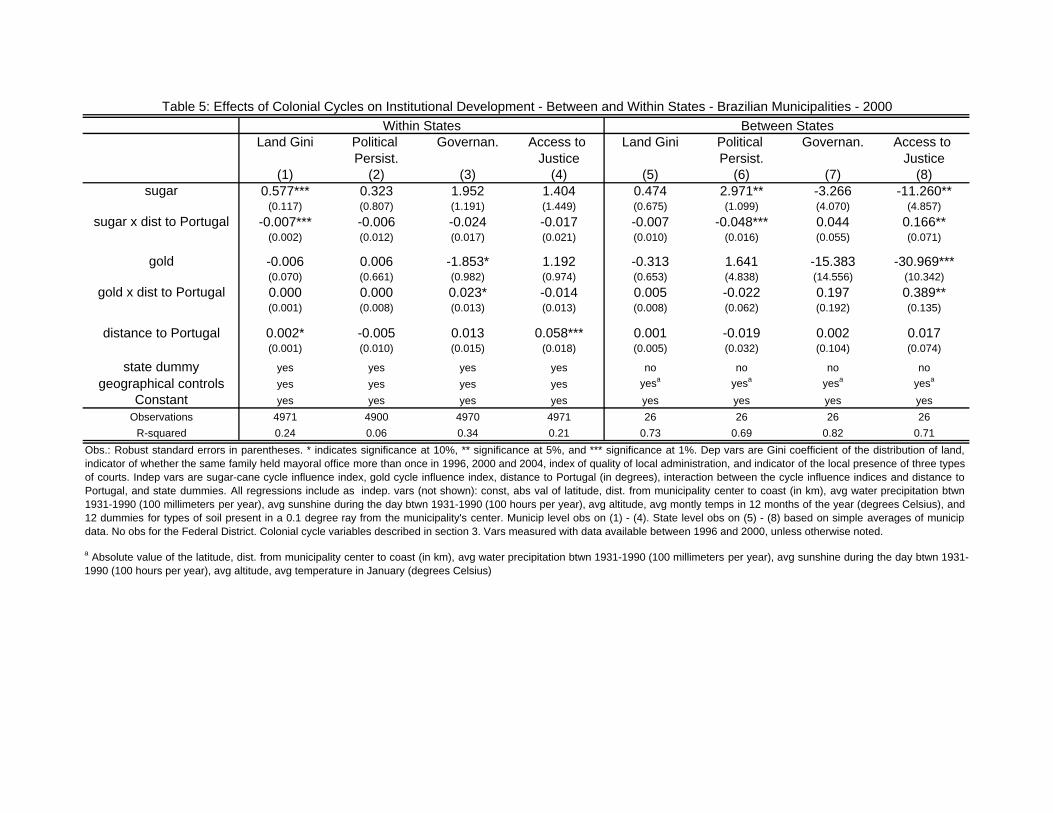
Land Gini Political Persist.
Governan. Access to Justice
Land Gini Political Persist.
Governan. Access to Justice
(1) (2) (3) (4) (5) (6) (7) (8)sugar 0.577*** 0.323 1.952 1.404 0.474 2.971** -3.266 -11.260**
(0.117) (0.807) (1.191) (1.449) (0.675) (1.099) (4.070) (4.857)sugar x dist to Portugal -0.007*** -0.006 -0.024 -0.017 -0.007 -0.048*** 0.044 0.166**
(0.002) (0.012) (0.017) (0.021) (0.010) (0.016) (0.055) (0.071)
gold -0.006 0.006 -1.853* 1.192 -0.313 1.641 -15.383 -30.969***(0.070) (0.661) (0.982) (0.974) (0.653) (4.838) (14.556) (10.342)
gold x dist to Portugal 0.000 0.000 0.023* -0.014 0.005 -0.022 0.197 0.389**(0.001) (0.008) (0.013) (0.013) (0.008) (0.062) (0.192) (0.135)
distance to Portugal 0.002* -0.005 0.013 0.058*** 0.001 -0.019 0.002 0.017(0.001) (0.010) (0.015) (0.018) (0.005) (0.032) (0.104) (0.074)
state dummy yes yes yes yes no no no nogeographical controls yes yes yes yes yesa yesa yesa yesa
Constant yes yes yes yes yes yes yes yesObservations 4971 4900 4970 4971 26 26 26 26
R-squared 0.24 0.06 0.34 0.21 0.73 0.69 0.82 0.71
a Absolute value of the latitude, dist. from municipality center to coast (in km), avg water precipitation btwn 1931-1990 (100 millimeters per year), avg sunshine during the day btwn 1931-1990 (100 hours per year), avg altitude, avg temperature in January (degrees Celsius)
Table 5: Effects of Colonial Cycles on Institutional Development - Between and Within States - Brazilian Municipalities - 2000 Within States Between States
Obs.: Robust standard errors in parentheses. * indicates significance at 10%, ** significance at 5%, and *** significance at 1%. Dep vars are Gini coefficient of the distribution of land,indicator of whether the same family held mayoral office more than once in 1996, 2000 and 2004, index of quality of local administration, and indicator of the local presence of three typesof courts. Indep vars are sugar-cane cycle influence index, gold cycle influence index, distance to Portugal (in degrees), interaction between the cycle influence indices and distance toPortugal, and state dummies. All regressions include as indep. vars (not shown): const, abs val of latitude, dist. from municipality center to coast (in km), avg water precipitation btwn1931-1990 (100 millimeters per year), avg sunshine during the day btwn 1931-1990 (100 hours per year), avg altitude, avg montly temps in 12 months of the year (degrees Celsius), and12 dummies for types of soil present in a 0.1 degree ray from the municipality's center. Municip level obs on (1) - (4). State level obs on (5) - (8) based on simple averages of municipdata. No obs for the Federal District. Colonial cycle variables described in section 3. Vars measured with data available between 1996 and 2000, unless otherwise noted.
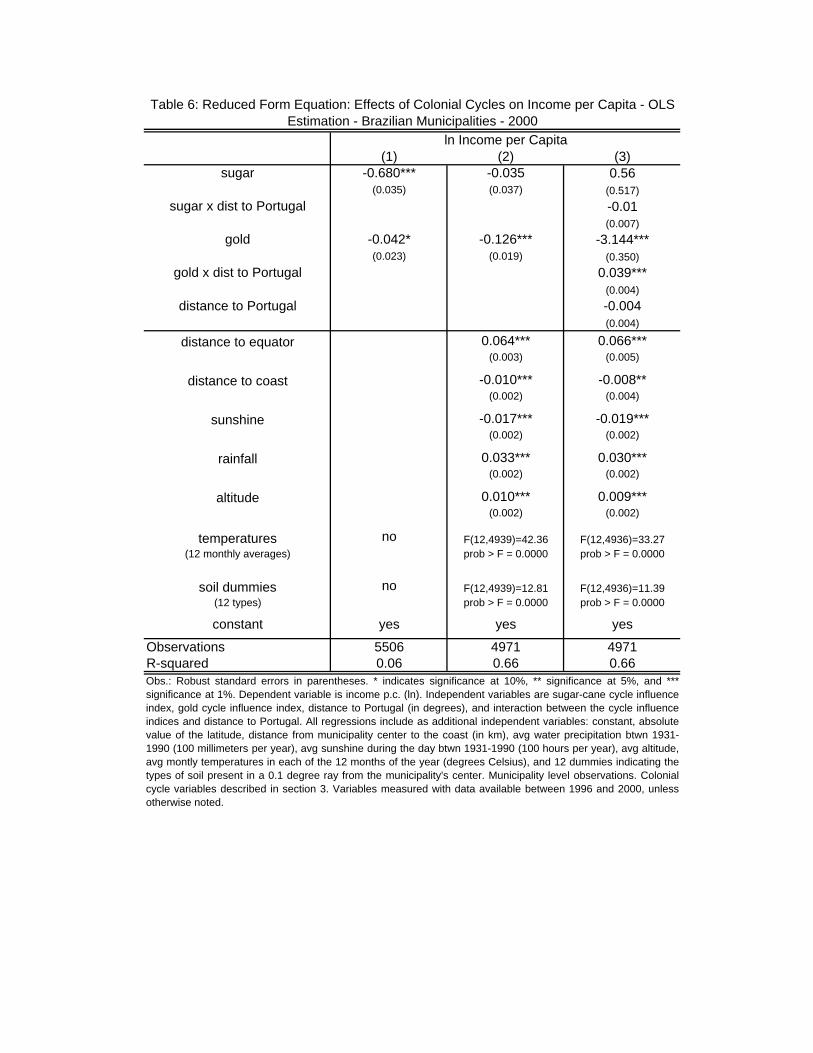
(1) (2) (3)sugar -0.680*** -0.035 0.56
(0.035) (0.037) (0.517)sugar x dist to Portugal -0.01
(0.007)gold -0.042* -0.126*** -3.144***
(0.023) (0.019) (0.350)gold x dist to Portugal 0.039***
(0.004)distance to Portugal -0.004
(0.004)
distance to equator 0.064*** 0.066***(0.003) (0.005)
distance to coast -0.010*** -0.008**(0.002) (0.004)
sunshine -0.017*** -0.019***(0.002) (0.002)
rainfall 0.033*** 0.030***(0.002) (0.002)
altitude 0.010*** 0.009***(0.002) (0.002)
temperatures no F(12,4939)=42.36 F(12,4936)=33.27(12 monthly averages) prob > F = 0.0000 prob > F = 0.0000
soil dummies no F(12,4939)=12.81 F(12,4936)=11.39(12 types) prob > F = 0.0000 prob > F = 0.0000
constant yes yes yes
Observations 5506 4971 4971R-squared 0.06 0.66 0.66Obs.: Robust standard errors in parentheses. * indicates significance at 10%, ** significance at 5%, and ***significance at 1%. Dependent variable is income p.c. (ln). Independent variables are sugar-cane cycle influenceindex, gold cycle influence index, distance to Portugal (in degrees), and interaction between the cycle influenceindices and distance to Portugal. All regressions include as additional independent variables: constant, absolutevalue of the latitude, distance from municipality center to the coast (in km), avg water precipitation btwn 1931-1990 (100 millimeters per year), avg sunshine during the day btwn 1931-1990 (100 hours per year), avg altitude,avg montly temperatures in each of the 12 months of the year (degrees Celsius), and 12 dummies indicating thetypes of soil present in a 0.1 degree ray from the municipality's center. Municipality level observations. Colonialcycle variables described in section 3. Variables measured with data available between 1996 and 2000, unlessotherwise noted.
Table 6: Reduced Form Equation: Effects of Colonial Cycles on Income per Capita - OLS Estimation - Brazilian Municipalities - 2000
ln Income per Capita
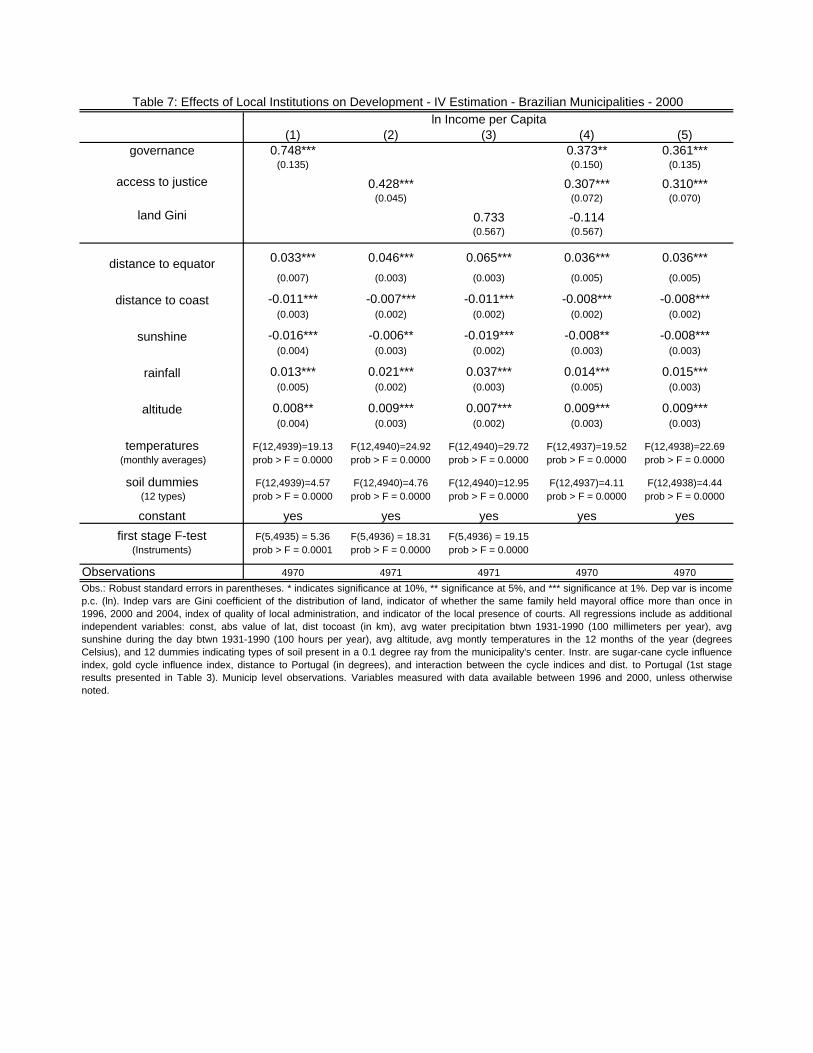
(1) (2) (3) (4) (5)governance 0.748*** 0.373** 0.361***
(0.135) (0.150) (0.135)
access to justice 0.428*** 0.307*** 0.310***(0.045) (0.072) (0.070)
land Gini 0.733 -0.114(0.567) (0.567)
distance to equator 0.033*** 0.046*** 0.065*** 0.036*** 0.036***(0.007) (0.003) (0.003) (0.005) (0.005)
distance to coast -0.011*** -0.007*** -0.011*** -0.008*** -0.008***(0.003) (0.002) (0.002) (0.002) (0.002)
sunshine -0.016*** -0.006** -0.019*** -0.008** -0.008***(0.004) (0.003) (0.002) (0.003) (0.003)
rainfall 0.013*** 0.021*** 0.037*** 0.014*** 0.015***(0.005) (0.002) (0.003) (0.005) (0.003)
altitude 0.008** 0.009*** 0.007*** 0.009*** 0.009***(0.004) (0.003) (0.002) (0.003) (0.003)
temperatures F(12,4939)=19.13 F(12,4940)=24.92 F(12,4940)=29.72 F(12,4937)=19.52 F(12,4938)=22.69 (monthly averages) prob > F = 0.0000 prob > F = 0.0000 prob > F = 0.0000 prob > F = 0.0000 prob > F = 0.0000
soil dummies F(12,4939)=4.57 F(12,4940)=4.76 F(12,4940)=12.95 F(12,4937)=4.11 F(12,4938)=4.44 (12 types) prob > F = 0.0000 prob > F = 0.0000 prob > F = 0.0000 prob > F = 0.0000 prob > F = 0.0000
constant yes yes yes yes yesfirst stage F-test F(5,4935) = 5.36 F(5,4936) = 18.31 F(5,4936) = 19.15
(Instruments) prob > F = 0.0001 prob > F = 0.0000 prob > F = 0.0000
Observations 4970 4971 4971 4970 4970Obs.: Robust standard errors in parentheses. * indicates significance at 10%, ** significance at 5%, and *** significance at 1%. Dep var is incomep.c. (ln). Indep vars are Gini coefficient of the distribution of land, indicator of whether the same family held mayoral office more than once in1996, 2000 and 2004, index of quality of local administration, and indicator of the local presence of courts. All regressions include as additionalindependent variables: const, abs value of lat, dist tocoast (in km), avg water precipitation btwn 1931-1990 (100 millimeters per year), avgsunshine during the day btwn 1931-1990 (100 hours per year), avg altitude, avg montly temperatures in the 12 months of the year (degreesCelsius), and 12 dummies indicating types of soil present in a 0.1 degree ray from the municipality's center. Instr. are sugar-cane cycle influenceindex, gold cycle influence index, distance to Portugal (in degrees), and interaction between the cycle indices and dist. to Portugal (1st stageresults presented in Table 3). Municip level observations. Variables measured with data available between 1996 and 2000, unless otherwisenoted.
ln Income per CapitaTable 7: Effects of Local Institutions on Development - IV Estimation - Brazilian Municipalities - 2000
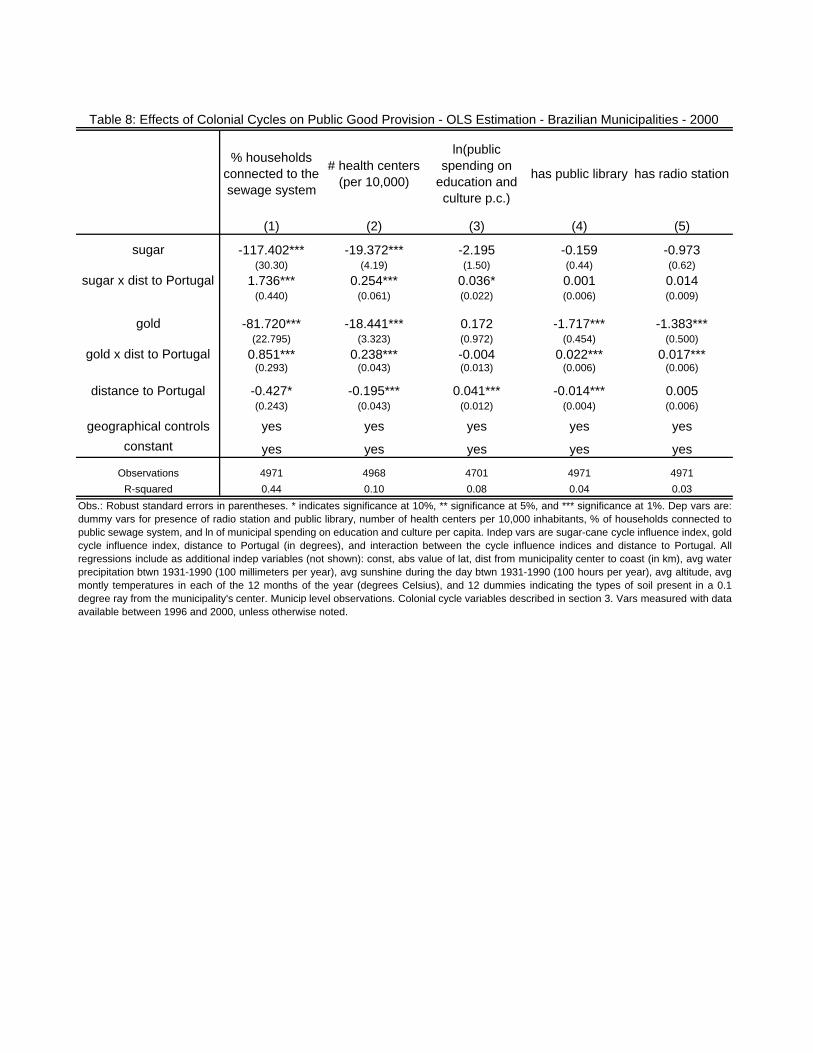
% households connected to the sewage system
# health centers (per 10,000)
ln(public spending on
education and culture p.c.)
has public library has radio station
(1) (2) (3) (4) (5)
sugar -117.402*** -19.372*** -2.195 -0.159 -0.973(30.30) (4.19) (1.50) (0.44) (0.62)
sugar x dist to Portugal 1.736*** 0.254*** 0.036* 0.001 0.014(0.440) (0.061) (0.022) (0.006) (0.009)
gold -81.720*** -18.441*** 0.172 -1.717*** -1.383***(22.795) (3.323) (0.972) (0.454) (0.500)
gold x dist to Portugal 0.851*** 0.238*** -0.004 0.022*** 0.017***(0.293) (0.043) (0.013) (0.006) (0.006)
distance to Portugal -0.427* -0.195*** 0.041*** -0.014*** 0.005(0.243) (0.043) (0.012) (0.004) (0.006)
geographical controls yes yes yes yes yesconstant yes yes yes yes yes
Observations 4971 4968 4701 4971 4971R-squared 0.44 0.10 0.08 0.04 0.03
Table 8: Effects of Colonial Cycles on Public Good Provision - OLS Estimation - Brazilian Municipalities - 2000
Obs.: Robust standard errors in parentheses. * indicates significance at 10%, ** significance at 5%, and *** significance at 1%. Dep vars are:dummy vars for presence of radio station and public library, number of health centers per 10,000 inhabitants, % of households connected topublic sewage system, and ln of municipal spending on education and culture per capita. Indep vars are sugar-cane cycle influence index, goldcycle influence index, distance to Portugal (in degrees), and interaction between the cycle influence indices and distance to Portugal. Allregressions include as additional indep variables (not shown): const, abs value of lat, dist from municipality center to coast (in km), avg waterprecipitation btwn 1931-1990 (100 millimeters per year), avg sunshine during the day btwn 1931-1990 (100 hours per year), avg altitude, avgmontly temperatures in each of the 12 months of the year (degrees Celsius), and 12 dummies indicating the types of soil present in a 0.1degree ray from the municipality's center. Municip level observations. Colonial cycle variables described in section 3. Vars measured with dataavailable between 1996 and 2000, unless otherwise noted.
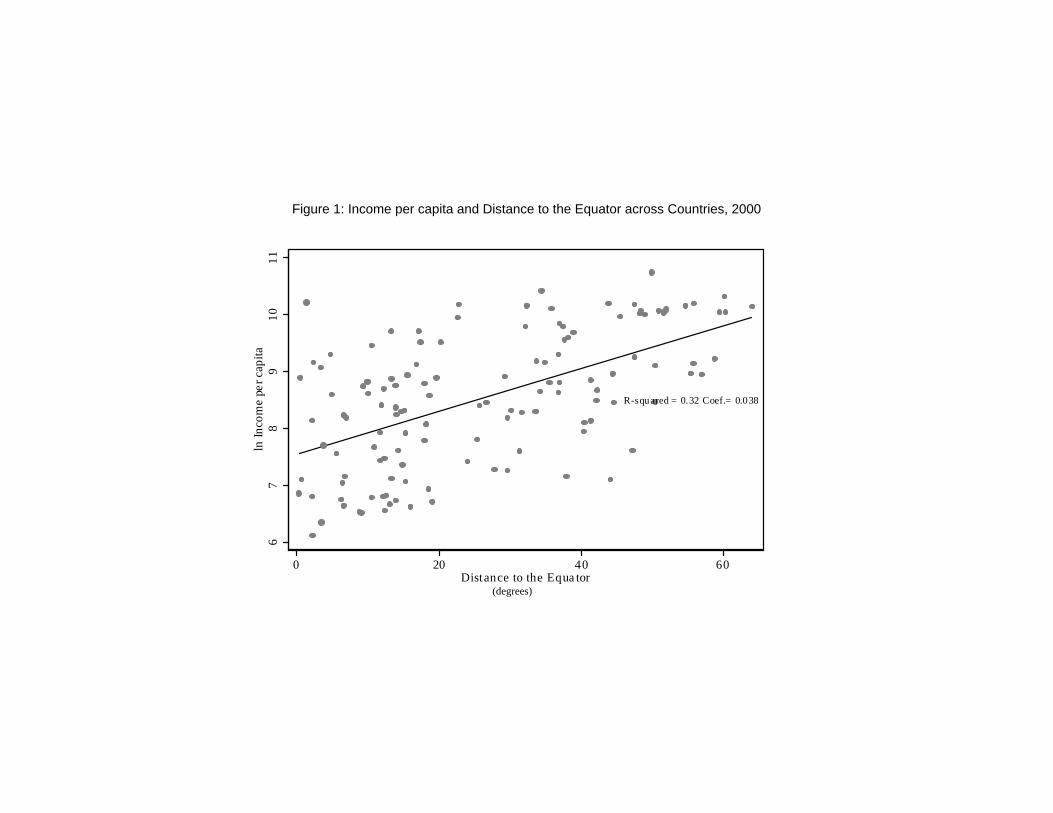
Figure 1: Income per capita and Distance to the Equator across Countries, 2000
67
89
1011
ln In
com
e pe
r cap
ita
0 20 40 60Distance to the Equa tor
R-squared = 0.32 Coef.= 0.038
(degrees)
67
89
1011
ln In
com
e pe
r cap
ita
0 20 40 60Distance to the Equa tor
R-squared = 0.32 Coef.= 0.038
(degrees)
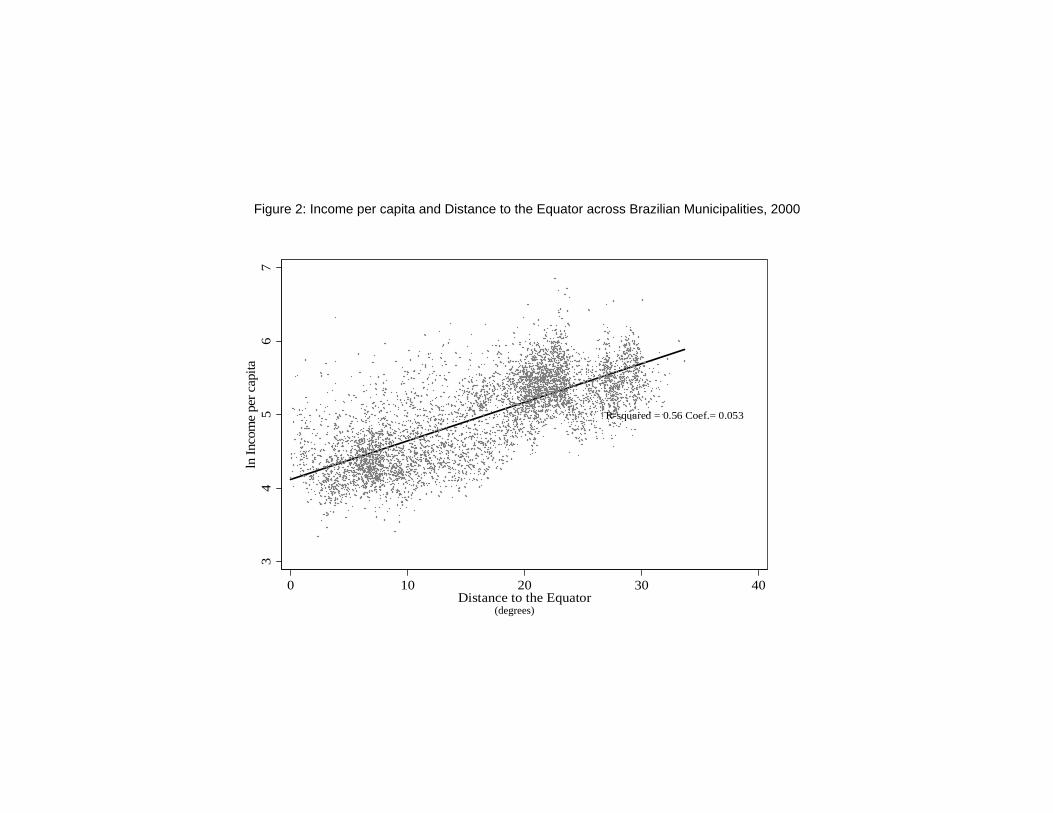
Figure 2: Income per capita and Distance to the Equator across Brazilian Municipalities, 2000
34
56
7ln
Inco
me
per c
apita
0 10 20 30 40Distance to the Equator
R-squared = 0.56 Coef.= 0.053
(degrees)
34
56
7ln
Inco
me
per c
apita
0 10 20 30 40Distance to the Equator
R-squared = 0.56 Coef.= 0.053
(degrees)
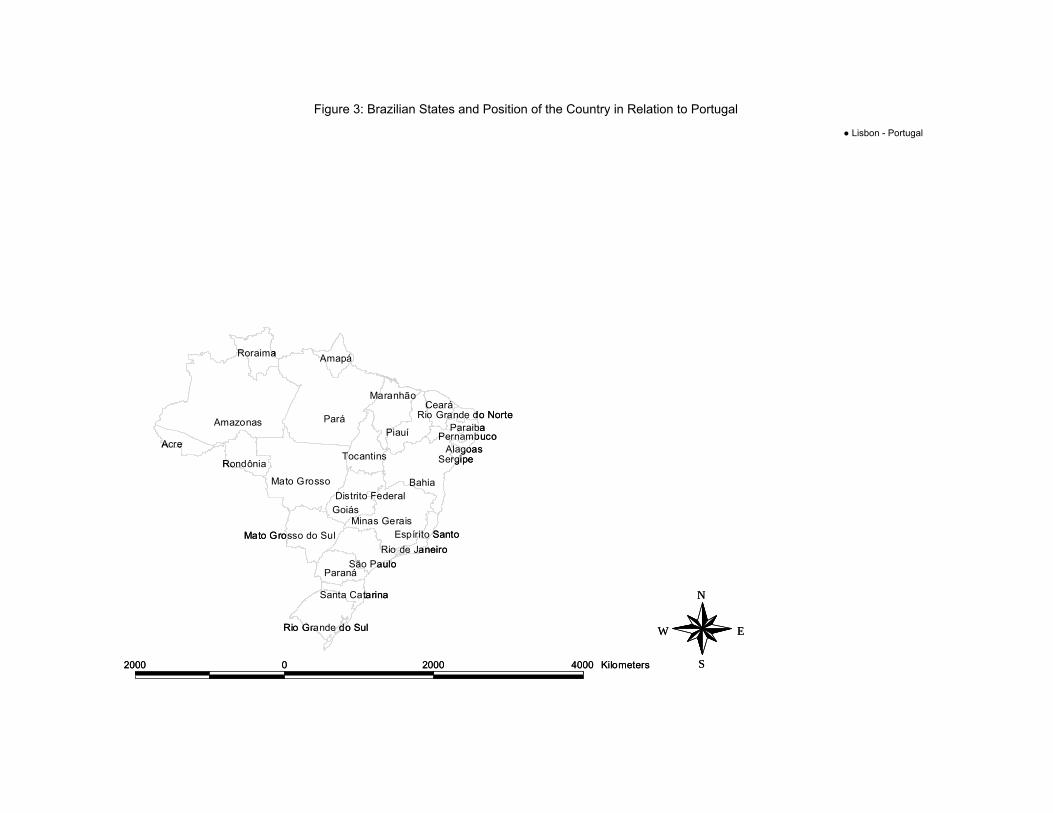
● Lisbon - Portugal
Figure 3: Brazilian States and Position of the Country in Relation to Portugal
Acre
Rio Grande do Sul
SergipeAlagoas
PernambucoParaiba
Rio Grande do Norte
Santa Catarina
Paraná
Mato Grosso do Sul
São PauloRio de Janeiro
Minas GeraisEspírito Santo
Bahia
GoiásDistrito Federal
Mato Grosso
Rondônia
Amazonas
Roraima Amapá
Pará
Maranhão
Tocantins
Piauí
Ceará
2000 0 2000 4000 Kilometers
N
EW
S
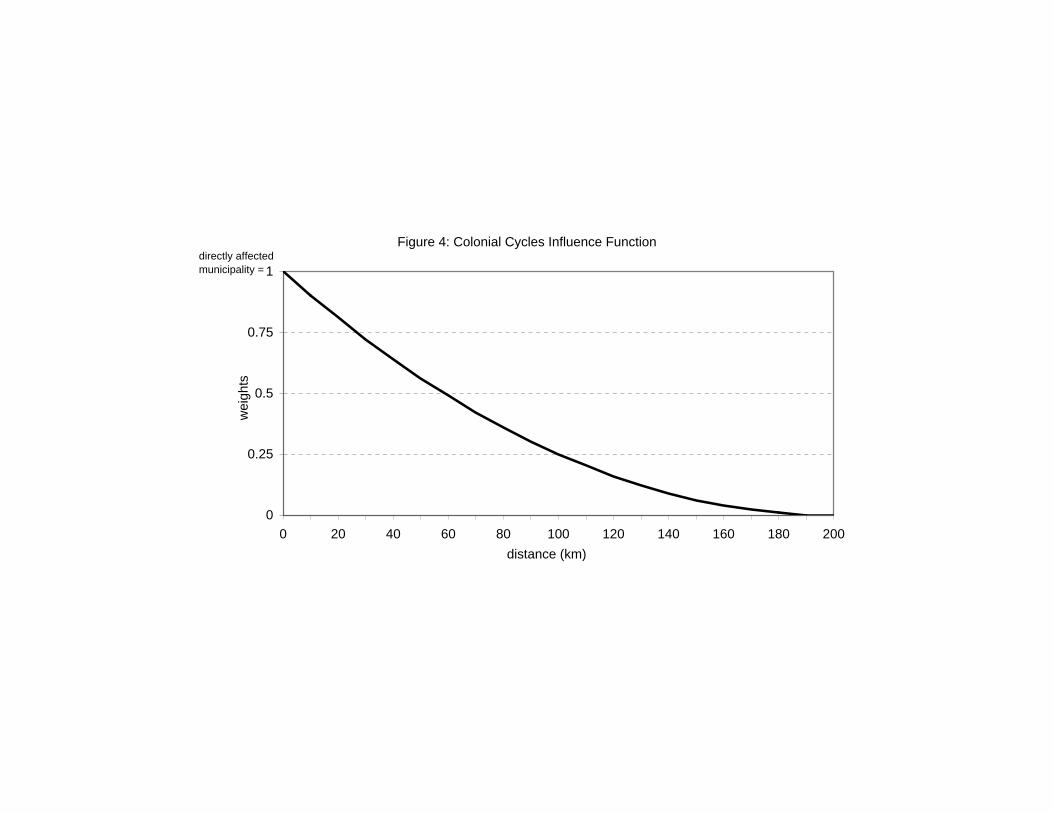
Figure 4: Colonial Cycles Influence Function
0
0.25
0.5
0.75
1
0 20 40 60 80 100 120 140 160 180 200distance (km)
wei
ghts
directly affected municipality =
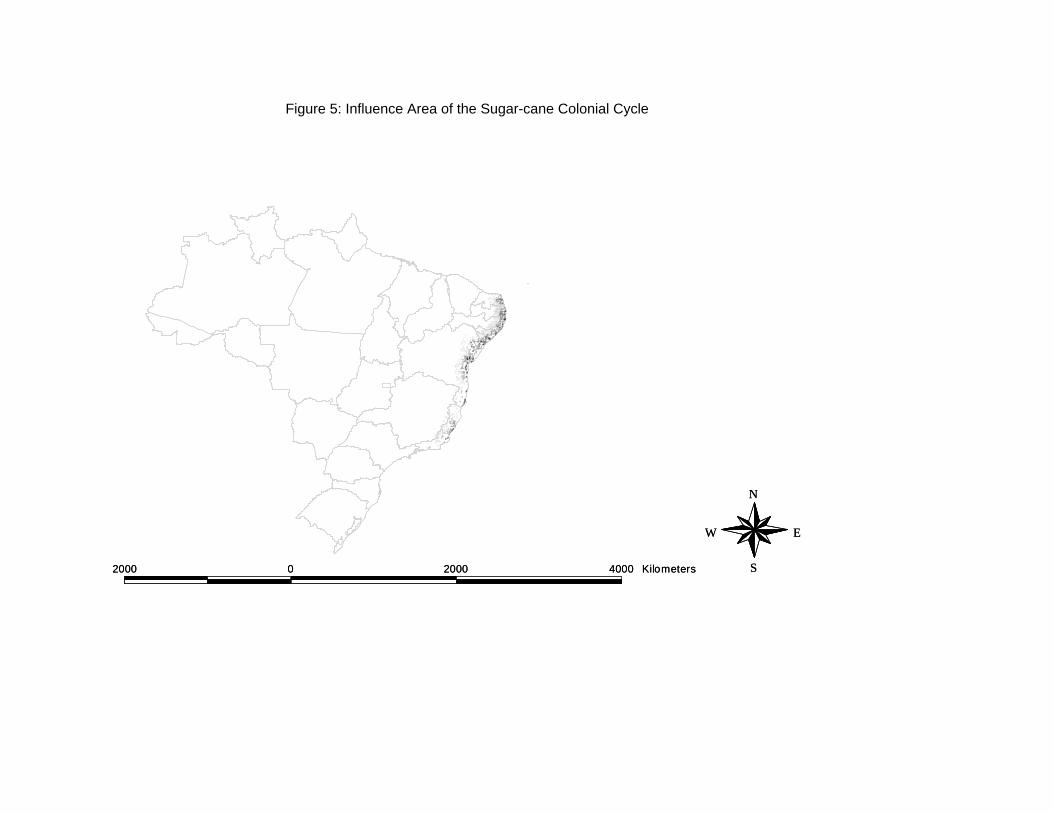
Figure 5: Influence Area of the Sugar-cane Colonial Cycle
####
##
#########
## #
#
#####
#####
##
#
##
#
#
#
#
###
#
#####
#
#
#
#
#
#
##
#
##
#
#
#
#
##
##
#
##
###
##
##
#
#
#
##
#
#
#
###
## #
##
##
#
##
##
#
##
###
##
#
#
##
#
##
###
#
#
#
#
#
#
#
#
#
#
#
#
# #
#
##
#
# #
#
##
####
####
##
# #### ##
## # #### ##
#
#
##
#
#
#
# ##
#
##
##
#
###
##
## ####
####
##### ###
###
#####
# #######
### ######## # ### ##
#
##
#
#
## #
#
##
##
#
###
# #######
##
#
##
#
##
###
##
#
#
##
##
#
#
###
### # #
### #
#####
## ####
##
#
#
####
##
###
##
## ####
#
#
#
####
#
###
#
#
#
#
#
#
##
#
####
###
#
#
###
#
###
#### ######
# ####
##
###
##
#
##
####
#######
#
###
#####
####
#
#########
#######
### #
##### ### ##
##########
### ### ### ### ###
# ## ### #####
###
######
#####
######### ##
#######
# ##
##
#
######## ###########
# # ###
######### ###
## ## ##### #
###
## #### ### ## ####### ##### # # #### ## #### #### #### # ###### ### ###### ##### ## ### # ### ##### ### #### # #### ### #### ####### ##
##
#### #####
#####
####
#### ########## #########
#####
## ##### #### ######
## ####
#### ### #
### # ### #### ###
# ## # # ### # #### ##### # ####
# ####
## ##
#
# #
##
#
#
#
#
####
#
# ###
## #
###
##
##
##
#
##
####
##
2000 0 2000 4000 Kilometers
N
EW
S
####
##
#########
## #
#
#####
#####
##
#
##
#
#
#
#
###
#
#####
#
#
#
#
#
#
##
#
##
#
#
#
#
##
##
#
##
###
##
##
#
#
#
##
#
#
#
###
## #
##
##
#
##
##
#
##
###
##
#
#
##
#
##
###
#
#
#
#
#
#
#
#
#
#
#
#
# #
#
##
#
# #
#
##
####
####
##
# #### ##
## # #### ##
#
#
##
#
#
#
# ##
#
##
##
#
###
##
## ####
####
##### ###
###
#####
# #######
### ######## # ### ##
#
##
#
#
## #
#
##
##
#
###
# #######
##
#
##
#
##
###
##
#
#
##
##
#
#
###
### # #
### #
#####
## ####
##
#
#
####
##
###
##
## ####
#
#
#
####
#
###
#
#
#
#
#
#
##
#
####
###
#
#
###
#
###
#### ######
# ####
##
###
##
#
##
####
#######
#
###
#####
####
#
#########
#######
### #
##### ### ##
##########
### ### ### ### ###
# ## ### #####
###
######
#####
######### ##
#######
# ##
##
#
######## ###########
# # ###
######### ###
## ## ##### #
###
## #### ### ## ####### ##### # # #### ## #### #### #### # ###### ### ###### ##### ## ### # ### ##### ### #### # #### ### #### ####### ##
##
#### #####
#####
####
#### ########## #########
#####
## ##### #### ######
## ####
#### ### #
### # ### #### ###
# ## # # ### # #### ##### # ####
# ####
## ##
#
# #
##
#
#
#
#
####
#
# ###
## #
###
##
##
##
#
##
####
##
2000 0 2000 4000 Kilometers
N
EW
S
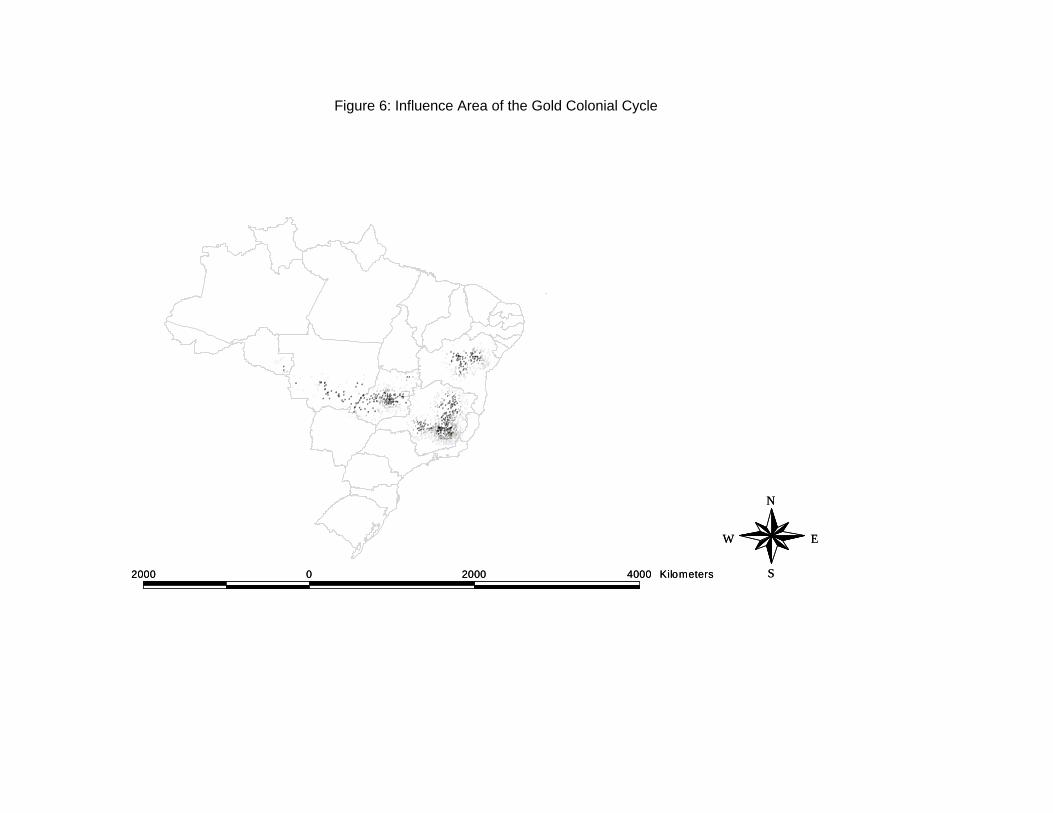
Figure 6: Influence Area of the Gold Colonial Cycle
##
##
#
#
### #
##
##
# #
#
##
##
#
#
#
#
#
#
#
##
##
#
###
#
#
#
#
#
#
####
#
##
#
##
#
#
#
#
##
#
#
#
#
#
####
#
##
#
#
#
#
#
##
#
#
#
#
#
#
#
#
#
# #
#
#
#
## # #
#
## #
#
#
#
#
#
#
#
#
#
##
#
##
#
##
#
#
#
##
#
#
##
#
#
#
#
#
##
##
#
###
#
#
##
#
#
####
#
#
##
#
### #
#
#
#
#
###
#
#
###
##
#
#
#
#
#
#
#
#
##
#
###
#
#
##
##
#
#
##
#
####
#
#####
##
#
#
#
##
##
##
##### ##
#
#
##
##
#
#
#
#
#
#
##
#
#
#
#
#
#
#
#
#
##
# #
#
#
#
#
#
#
#
#
#
##
#
#
##
#
#
#
#
#
#
#
###
#
#
#
#
#
#
#
#####
#
#
##
##
#
#
###
##
##
#
##
#
#
###
##
###
##
#
#
#
#
##
##
###
#
#
## ##
#
###
#
##
##
##
#
# #
#
### ### # ## ## # #
####
###### # ##
#
# ##
### # # ##
## ##
## ####
### #### ## # ###### #
#
# #### #
#
#
##
#
##
#
#
##
#
##
#
#
#
#
#
#######
##
#
###
#
###
##
##
##
#
#
#
#
####
## ####
#
##### #
######
### ###
### #
#########
##
#
###
#
#
###
#
####
#
#
#
###
##
## #
####
#
####
#
#
###
#
#
#
#
#
#
#
#
#
##
#
#
#######
####
### #
##
##
#
#
#
#
#
#
######
##
## ###
##
#
##
#
#
####
#
#
#
######
#
#
#
########
#
# ########
#
#
#######
#
##
####
####
#####
###
#
##
#
### #####
#
#
##
#
#
#
###
##
#
##
#
###
#
#
##
#
####
##
##
#
# ###
#
#
#
##
#
###### ####
#
#
#
#
#
#
##
#
###### ########
#############
##
##
###
#
####
### #
#
# ###
##
##
#
##
#
#
#
#
##
##
#
###
# #
##
#
##
##
##
##
#
#
## #### # # ##
#
#
#
#####
#
#
#
#
#
#
##
###
#
#
##
###
#
#
#
#
#
#
#
##
#
##
#
##
#
#
#
##
##
#
#
##
#
#
#
#
## ####
## # ##
## #
## # #
# ### ## # # ## ###
##
#
#
#
#
#
###
#
#
##
# ##
#
##
#
#####
#
#
# # ##
#
##
#
##
#
#
#
#
#
#
##
#
####
##
#
##
#
#
#
#
#
##
#
##
#
##
#
#
## #
#
#
## #
#
##
##
# ####
#
#### #
######
##
#
##
##
###
##
#
##
##
####
######
#
#
###
##
#
#
#
#
# ##
#
#
#
#
##
##
###
#
## ##
####
##
# #
#
##
#
#
#
#
#
#
#
#
##
#
#
##
# #
#
#
## # #
## #
#
#
#
#
#
#
#####
## #### ##
#
###
#
#
#
####
## #
#
#
###
##
##
## ######
##
### ##
##### ####
#
##
#
##
# #
#
###
#
#
#
##
##
##### #
###
#
##
#
###
### #
#
######
### #
###
## ##########
##
#
####
#
#
##
##
#
#
##
#
#
#
#
#
#
###
#
#
#
#
#
#
#
######
##
## ###
##
#
#
#
#
######
#
#
##
####
##
#####
#
##
####
#
#
#
#
###
#
#
#
####
#
#
##
#
##
#
#
#
#
##
###
# #
#
##
# ##
# ##
#
##
#
#####
#
#
# # ##
#
##
#
#
##
##
###
##
##
#
##
####
##
# ###
##
2000 0 2000 4000 Kilometers
N
EW
S
##
##
#
#
### #
##
##
# #
#
##
##
#
#
#
#
#
#
#
##
##
#
###
#
#
#
#
#
#
####
#
##
#
##
#
#
#
#
##
#
#
#
#
#
####
#
##
#
#
#
#
#
##
#
#
#
#
#
#
#
#
#
# #
#
#
#
## # #
#
## #
#
#
#
#
#
#
#
#
#
##
#
##
#
##
#
#
#
##
#
#
##
#
#
#
#
#
##
##
#
###
#
#
##
#
#
####
#
#
##
#
### #
#
#
#
#
###
#
#
###
##
#
#
#
#
#
#
#
#
##
#
###
#
#
##
##
#
#
##
#
####
#
#####
##
#
#
#
##
##
##
##### ##
#
#
##
##
#
#
#
#
#
#
##
#
#
#
#
#
#
#
#
#
##
# #
#
#
#
#
#
#
#
#
#
##
#
#
##
#
#
#
#
#
#
#
###
#
#
#
#
#
#
#
#####
#
#
##
##
#
#
###
##
##
#
##
#
#
###
##
###
##
#
#
#
#
##
##
###
#
#
## ##
#
###
#
##
##
##
#
# #
#
### ### # ## ## # #
####
###### # ##
#
# ##
### # # ##
## ##
## ####
### #### ## # ###### #
#
# #### #
#
#
##
#
##
#
#
##
#
##
#
#
#
#
#
#######
##
#
###
#
###
##
##
##
#
#
#
#
####
## ####
#
##### #
######
### ###
### #
#########
##
#
###
#
#
###
#
####
#
#
#
###
##
## #
####
#
####
#
#
###
#
#
#
#
#
#
#
#
#
##
#
#
#######
####
### #
##
##
#
#
#
#
#
#
######
##
## ###
##
#
##
#
#
####
#
#
#
######
#
#
#
########
#
# ########
#
#
#######
#
##
####
####
#####
###
#
##
#
### #####
#
#
##
#
#
#
###
##
#
##
#
###
#
#
##
#
####
##
##
#
# ###
#
#
#
##
#
###### ####
#
#
#
#
#
#
##
#
###### ########
#############
##
##
###
#
####
### #
#
# ###
##
##
#
##
#
#
#
#
##
##
#
###
# #
##
#
##
##
##
##
#
#
## #### # # ##
#
#
#
#####
#
#
#
#
#
#
##
###
#
#
##
###
#
#
#
#
#
#
#
##
#
##
#
##
#
#
#
##
##
#
#
##
#
#
#
#
## ####
## # ##
## #
## # #
# ### ## # # ## ###
##
#
#
#
#
#
###
#
#
##
# ##
#
##
#
#####
#
#
# # ##
#
##
#
##
#
#
#
#
#
#
##
#
####
##
#
##
#
#
#
#
#
##
#
##
#
##
#
#
## #
#
#
## #
#
##
##
# ####
#
#### #
######
##
#
##
##
###
##
#
##
##
####
######
#
#
###
##
#
#
#
#
# ##
#
#
#
#
##
##
###
#
## ##
####
##
# #
#
##
#
#
#
#
#
#
#
#
##
#
#
##
# #
#
#
## # #
## #
#
#
#
#
#
#
#####
## #### ##
#
###
#
#
#
####
## #
#
#
###
##
##
## ######
##
### ##
##### ####
#
##
#
##
# #
#
###
#
#
#
##
##
##### #
###
#
##
#
###
### #
#
######
### #
###
## ##########
##
#
####
#
#
##
##
#
#
##
#
#
#
#
#
#
###
#
#
#
#
#
#
#
######
##
## ###
##
#
#
#
#
######
#
#
##
####
##
#####
#
##
####
#
#
#
#
###
#
#
#
####
#
#
##
#
##
#
#
#
#
##
###
# #
#
##
# ##
# ##
#
##
#
#####
#
#
# # ##
#
##
#
#
##
##
###
##
##
#
##
####
##
# ###
##
2000 0 2000 4000 Kilometers
N
EW
S
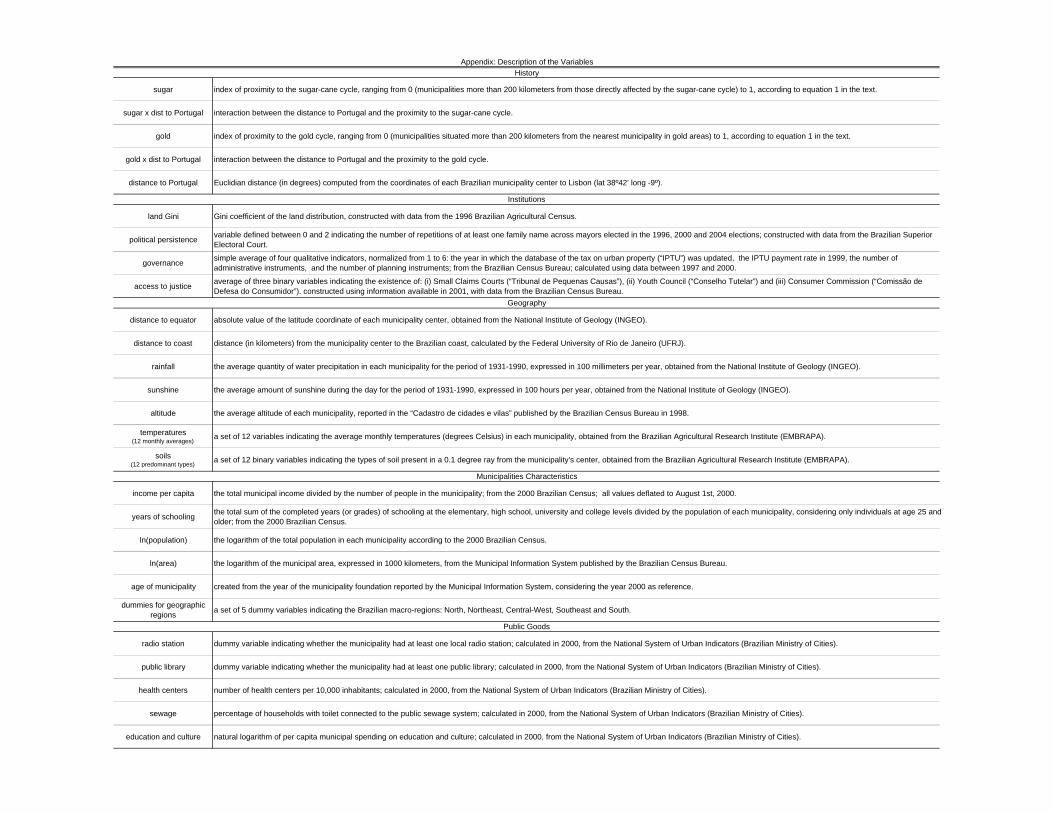
sugar index of proximity to the sugar-cane cycle, ranging from 0 (municipalities more than 200 kilometers from those directly affected by the sugar-cane cycle) to 1, according to equation 1 in the text.
sugar x dist to Portugal interaction between the distance to Portugal and the proximity to the sugar-cane cycle.
gold index of proximity to the gold cycle, ranging from 0 (municipalities situated more than 200 kilometers from the nearest municipality in gold areas) to 1, according to equation 1 in the text.
gold x dist to Portugal interaction between the distance to Portugal and the proximity to the gold cycle.
distance to Portugal Euclidian distance (in degrees) computed from the coordinates of each Brazilian municipality center to Lisbon (lat 38º42’ long -9º).
land Gini Gini coefficient of the land distribution, constructed with data from the 1996 Brazilian Agricultural Census.
political persistence variable defined between 0 and 2 indicating the number of repetitions of at least one family name across mayors elected in the 1996, 2000 and 2004 elections; constructed with data from the Brazilian Superior Electoral Court.
governance simple average of four qualitative indicators, normalized from 1 to 6: the year in which the database of the tax on urban property (“IPTU”) was updated, the IPTU payment rate in 1999, the number of administrative instruments, and the number of planning instruments; from the Brazilian Census Bureau; calculated using data between 1997 and 2000.
access to justice average of three binary variables indicating the existence of: (i) Small Claims Courts (“Tribunal de Pequenas Causas”), (ii) Youth Council (“Conselho Tutelar”) and (iii) Consumer Commission (“Comissão de Defesa do Consumidor”). constructed using information available in 2001, with data from the Brazilian Census Bureau.
distance to equator absolute value of the latitude coordinate of each municipality center, obtained from the National Institute of Geology (INGEO).
distance to coast distance (in kilometers) from the municipality center to the Brazilian coast, calculated by the Federal University of Rio de Janeiro (UFRJ).
rainfall the average quantity of water precipitation in each municipality for the period of 1931-1990, expressed in 100 millimeters per year, obtained from the National Institute of Geology (INGEO).
sunshine the average amount of sunshine during the day for the period of 1931-1990, expressed in 100 hours per year, obtained from the National Institute of Geology (INGEO).
altitude the average altitude of each municipality, reported in the “Cadastro de cidades e vilas” published by the Brazilian Census Bureau in 1998.
temperatures (12 monthly averages)
a set of 12 variables indicating the average monthly temperatures (degrees Celsius) in each municipality, obtained from the Brazilian Agricultural Research Institute (EMBRAPA).
soils (12 predominant types)
a set of 12 binary variables indicating the types of soil present in a 0.1 degree ray from the municipality's center, obtained from the Brazilian Agricultural Research Institute (EMBRAPA).
income per capita the total municipal income divided by the number of people in the municipality; from the 2000 Brazilian Census; all values deflated to August 1st, 2000.
years of schooling the total sum of the completed years (or grades) of schooling at the elementary, high school, university and college levels divided by the population of each municipality, considering only individuals at age 25 and older; from the 2000 Brazilian Census.
ln(population) the logarithm of the total population in each municipality according to the 2000 Brazilian Census.
ln(area) the logarithm of the municipal area, expressed in 1000 kilometers, from the Municipal Information System published by the Brazilian Census Bureau.
age of municipality created from the year of the municipality foundation reported by the Municipal Information System, considering the year 2000 as reference.
dummies for geographic regions a set of 5 dummy variables indicating the Brazilian macro-regions: North, Northeast, Central-West, Southeast and South.
radio station dummy variable indicating whether the municipality had at least one local radio station; calculated in 2000, from the National System of Urban Indicators (Brazilian Ministry of Cities).
public library dummy variable indicating whether the municipality had at least one public library; calculated in 2000, from the National System of Urban Indicators (Brazilian Ministry of Cities).
health centers number of health centers per 10,000 inhabitants; calculated in 2000, from the National System of Urban Indicators (Brazilian Ministry of Cities).
sewage percentage of households with toilet connected to the public sewage system; calculated in 2000, from the National System of Urban Indicators (Brazilian Ministry of Cities).
education and culture natural logarithm of per capita municipal spending on education and culture; calculated in 2000, from the National System of Urban Indicators (Brazilian Ministry of Cities).
Public Goods
Appendix: Description of the Variables
Municipalities Characteristics
Geography
Institutions
History