Embed Size (px)
Citation preview
INSTITUTIONAL EQUITY RESEARCH
Page | 1 | PHILLIPCAPITAL INDIA RESEARCH
Bharti Airtel (BHARTI IN)
African safari: Big game hunting begins!
INDIA | TELECOM | Company Update
11 December 2017
Bharti Airtel organised an analyst meet in its top-performing African country, Uganda, to apprise investors of the turnaround in operations. The analyst meet is a critical milestone for Bharti, indicating growing confidence about its African operations and its ability to generate value. Interactions with its Africa MD, Raghunath Mandava, were a key highlight, as he detailed key initiatives and future prospects for the geography. Overall, we find the cost initiatives and margin improvement (1400bps in six quarters) sustainable in a stable external environment, and the focus is now increasingly shifting towards revenue growth.
Our interactions with other team members of Bharti Africa indicated an energetic team with clear objectives – representative of the management’s long-term and strategic thought process. Africa is now clearly positioned to drive value, enhancing visibility. As of now, we are not making any material changes to our target, as we have captured the turnaround to a certain extent (maintain Buy, target at Rs 670, 28% upside). Our key takeaways from the analyst meet are as follows: Sustainable cost initiatives: The African business’ EBIDTA margins have improved to a healthy 32% in Q2FY18 from 17% in Q1FY16. Most of the improvement has come from cost initiatives, as revenue growth has been uninspiring. However, we find these initiatives strategic; they are not only helping the company to manage costs better, but are helping deliver value to customers. Key measures that seem sustainable over the long term are: (1) network optimisation by deploying U900MHz for data, (2) recharge margin correction, (3) logistics cost management and others which appear fairly simple on paper but take up a lot of management bandwidth to implement. Bharti has managed to figure the right cost model for this geography and is now increasingly implementing growth measures to drive value. Sound strategy for revenue growth: Bharti’s Africa business reporting as a consolidated entity misleads investors about its scale, which often leads to comparisons with India. However, in truth, its Africa business consists of 15 countries and does not have India’s scale or revenue elasticity, but it has the advantage of limited competition. Hence, Bharti’s earlier strategy of reducing prices and replicating the India model backfired in this geography massively. Now Bharti is back to basics in terms of sketching out a customised strategy for each country. Its focus is clearly better network with more data products like 3G and 4G, distribution and brand enhancement, and enhanced focus on Airtel Money. All these initiatives are long term and strategic (will take time, but yield sustainable results). Case study – Uganda: Bharti’s management highlighted the success of its Uganda operations. More than its commentary, we take comfort from the on-the-ground visibility of branding and interactions with locals and channel partners. Airtel is running an incredibly strong business and MTN (market leader) enjoys only a legacy advantage in Uganda. We believe Uganda is well-poised to be a strong value driver for Bharti’s operations. Conclusion: Even as Bharti’s Africa story is underway, two big pieces of the puzzle are still missing – Nigeria and Kenya. It is in the race for acquiring Etisalat’s Nigeria, which has a market share of 12%; considering recent acquisitions, we expect Bharti’s management to be prudent. Kenya continues to be a challenge but the Kenyan market is not very competitive and there is huge scope for a strong second player. In general, we found more hits than misses for Africa. Most of the management commentary was strategic and our understanding of the operations is much better, but our valuations already capture the turnaround – in terms of higher exit multiples in our DCF-based calculations. Hence, for now, we maintain our target and recommendation.
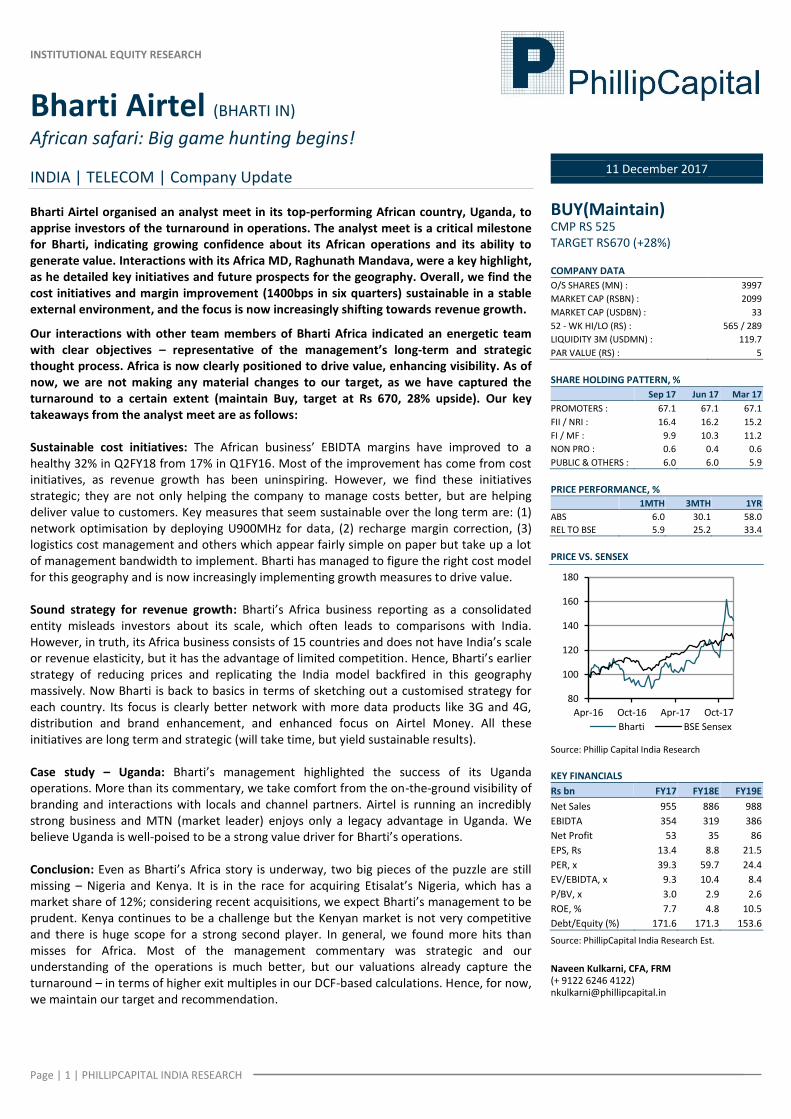
BUY(Maintain) CMP RS 525 TARGET RS670 (+28%) COMPANY DATA
O/S SHARES (MN) : 3997
MARKET CAP (RSBN) : 2099
MARKET CAP (USDBN) : 33
52 - WK HI/LO (RS) : 565 / 289
LIQUIDITY 3M (USDMN) : 119.7
PAR VALUE (RS) : 5
SHARE HOLDING PATTERN, %
Sep 17 Jun 17 Mar 17
PROMOTERS : 67.1 67.1 67.1
FII / NRI : 16.4 16.2 15.2
FI / MF : 9.9 10.3 11.2
NON PRO : 0.6 0.4 0.6
PUBLIC & OTHERS : 6.0 6.0 5.9
PRICE PERFORMANCE, %
1MTH 3MTH 1YR
ABS 6.0 30.1 58.0
REL TO BSE 5.9 25.2 33.4
PRICE VS. SENSEX
Source: Phillip Capital India Research
KEY FINANCIALS
Rs bn FY17 FY18E FY19E
Net Sales 955 886 988
EBIDTA 354 319 386
Net Profit 53 35 86
EPS, Rs 13.4 8.8 21.5
PER, x 39.3 59.7 24.4
EV/EBIDTA, x 9.3 10.4 8.4
P/BV, x 3.0 2.9 2.6
ROE, % 7.7 4.8 10.5
Debt/Equity (%) 171.6 171.3 153.6
Source: PhillipCapital India Research Est.
Naveen Kulkarni, CFA, FRM (+ 9122 6246 4122) [email protected]
80
100
120
140
160
180
Apr-16 Oct-16 Apr-17 Oct-17
Bharti BSE Sensex
Page | 2 | PHILLIPCAPITAL INDIA RESEARCH
BHARTI AIRTEL COMPANY UPDATE
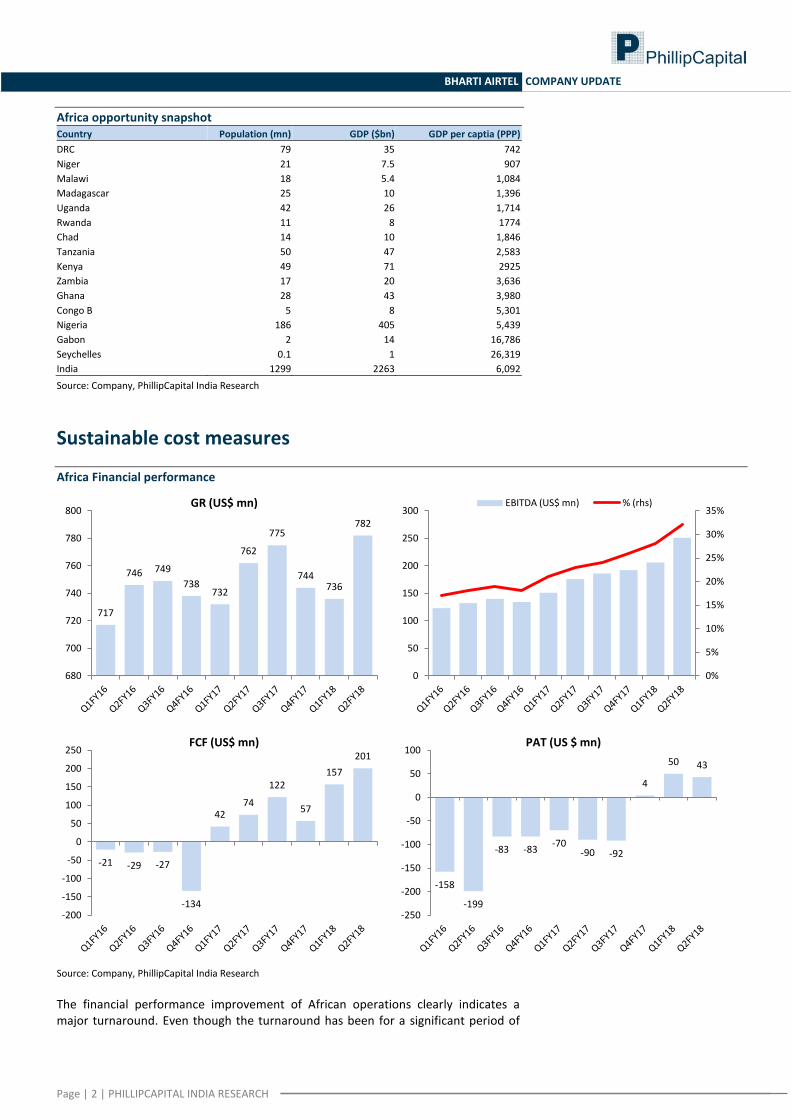
Africa opportunity snapshot Country Population (mn) GDP ($bn) GDP per captia (PPP)
DRC 79 35 742
Niger 21 7.5 907
Malawi 18 5.4 1,084
Madagascar 25 10 1,396
Uganda 42 26 1,714
Rwanda 11 8 1774
Chad 14 10 1,846
Tanzania 50 47 2,583
Kenya 49 71 2925
Zambia 17 20 3,636
Ghana 28 43 3,980
Congo B 5 8 5,301
Nigeria 186 405 5,439
Gabon 2 14 16,786
Seychelles 0.1 1 26,319
India 1299 2263 6,092
Source: Company, PhillipCapital India Research
Sustainable cost measures
Africa Financial performance
Source: Company, PhillipCapital India Research
The financial performance improvement of African operations clearly indicates a major turnaround. Even though the turnaround has been for a significant period of
717
746 749
738 732
762
775
744 736
782
680
700
720
740
760
780
800 GR (US$ mn)
0%
5%
10%
15%
20%
25%
30%
35%
0
50
100
150
200
250
300 EBITDA (US$ mn) % (rhs)
-21 -29 -27
-134
42 74
122
57
157
201
-200
-150
-100
-50
0
50
100
150
200
250 FCF (US$ mn)
-158
-199
-83 -83 -70
-90 -92
4
50 43
-250
-200
-150
-100
-50
0
50
100 PAT (US $ mn)
Page | 3 | PHILLIPCAPITAL INDIA RESEARCH
BHARTI AIRTEL COMPANY UPDATE
time, there were doubts about the sustainability of the turnaround as there have been false signals in the past.
Financial performance Period <20% 20-30% 30-40% >40%
FY16 8 4 3 0
Q2FY18 4 4 2 5
TZ, KE, GH, RW MG, DRC, TD, CG NG, SC ML, UG, ZM, NE, GA
Source: Company, PhillipCapital India Research
This time, however, the quality of turnaround indicates sustainability, and our on-the-ground visit in Uganda has convinced us further. As is typically the case with telecom operations, with margins crossing the 40% mark, value addition gains serious traction. There are 5 countries that earn more than 40% margins and two countries that earn margins of 30-40%. While five countries in the >40% bracket are not the biggest in terms of potential, the quality of turnaround seems to be lasting. Apart from the indications from the financial parameters, we found the operational initiatives taken by the management very sound. The key initiatives detailed by the management in the presentation are as follows:
Network optimisation is a key cost and revenue initiative: Network, for any telecom company, holds the key. Bharti has made significant changes in network optimisation over the last two years, and the key to that change is utilisation of U 900MHz for data. In anecdotal evidence, Raghunath indicated that in a certain location, changing the frequency to 900MHz resulted in a 25% jump in volumes, as penetration of 900MHz is far superior, which led to more availability of network and better utilisation.
Financial performance OPCO U900 LTE
Uganda Zambia Malawi Madagascar Gabon Seychelles Kenya Congo B Planned
Chad Planned
Tanzania -
Niger Planned Planned
Rwanda Planned -
Nigeria - Planned
DRC Planned -
Source: Company, PhillipCapital India Research
Launch of LTE operations, seen in many of the key countries, significantly helps in branding.
Radio frequency planning and optimisation
Improvement of network KPIs. Apart from a major overhaul of the network, Bharti has taken a slew of cost measures, which have resulted in opex productivity improving by 10.5%.
Recharge margin correction in some OPCOs
SIM/ RCV cost reduction P & L focus for each retail store
Logistics, warehousing revamped
Bandwidth: Flow redesign and optimized planning
Re-scope fuel distribution and managed services
Page | 4 | PHILLIPCAPITAL INDIA RESEARCH
BHARTI AIRTEL COMPANY UPDATE
Rightsizing of sites with more capacity/site
Converting dollar denominated contracts into local contracts. As indicated earlier most of the measures highlighted above are operationally very intensive and take a lot of time to implement in a geography like Africa where multiple challenges exist. Bharti has managed to execute very well and most measures clearly seem sustainable for the long-term.
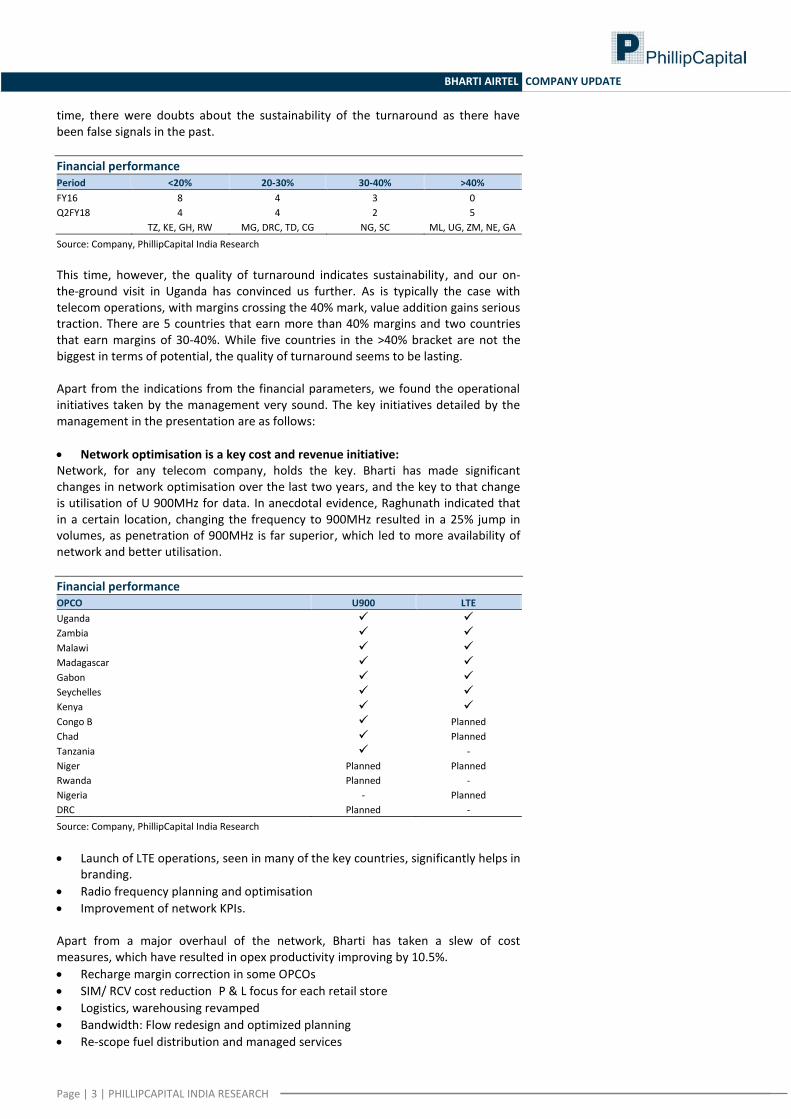
Solid revenue initiatives The initial strategy of reducing pricing and expecting elasticity to pick up resulting in higher ARPU or widening of base at a significantly quicker pace backfired big time for Bharti Airtel. It has taken a while for it to figure out the right scale of operations. So, the management took a couple of step back to launch itself. The first step was to ease the pricing pressure in the market – a significant positive measure. Then, it focussed on selling more bundled plans, which resulted in improvement in ARPU. The focus on its 4G network and data is another key initiative that has resulted in improvement of its branding. We tested Bharti’s 4G network in Africa and found the network speed to be very satisfactory. The randomly conducted speed test in Kampala (Uganda)was quite encouraging.
Market share holds the key to margins
Country
Key Telecom
operators
Our
position
Market size
(mn $)
Airtel RMS
(%)
Key
competitors
EBITDA
range
Uganda 5 2 699 >40% MTN >40%
Zambia 3 1 479 >40% MTN >40%
Gabon 4 2 348 >40% Marco >40%
Niger 4 1 329 >40% Orange >40%
Malawi 4 1 222 >40% TNM >40%
Congo B 3 2 375 >40% MTN 30-40%
Seychelles 2 2 53 >40% C&W 30-40%
Nigeria 6 2 4707 ~20% MTN 30-40%
Chad 3 2 272 >40% Tigo 20-30%
Madagascar 3 1 192 30-40% Orange, Telma 20-30%
DRC 6 3 988 20-30% Voda, Orange 20-30%
Tanznia 5 3 1039 20-30% Vodacom, Tigo <20%
Kenya 3 2 2292 <10% Safaricom <20%
Rwanda 3 3 163 10-20% MTN, Tigo Negative
Source: Company, PhillipCapital India Research
Apart from improving the product profile, it has enhanced the distribution and branding. The company has focussed on building alternate channels for SIM sale and Airtel Money through freelancers and exclusive mini shops and kiosks. Also, its branding initiatives in Kampala were very high decibel, clearly indicating the brand traction. Considering the operational traction in Uganda and probably in the countries where the company is doing very well, revenue growth is likely to gather critical mass soon.
Page | 5 | PHILLIPCAPITAL INDIA RESEARCH
BHARTI AIRTEL COMPANY UPDATE
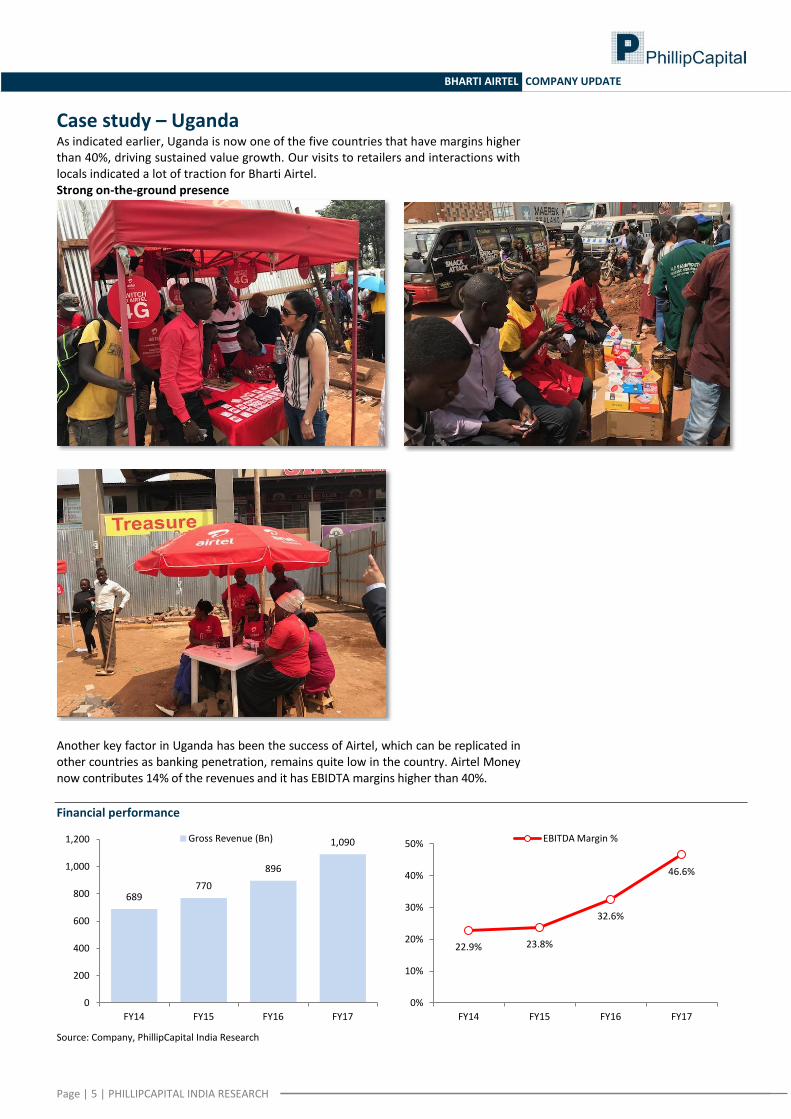
Case study – Uganda As indicated earlier, Uganda is now one of the five countries that have margins higher than 40%, driving sustained value growth. Our visits to retailers and interactions with locals indicated a lot of traction for Bharti Airtel. Strong on-the-ground presence
Another key factor in Uganda has been the success of Airtel, which can be replicated in other countries as banking penetration, remains quite low in the country. Airtel Money now contributes 14% of the revenues and it has EBIDTA margins higher than 40%.
Financial performance
Source: Company, PhillipCapital India Research
689 770
896
1,090
0
200
400
600
800
1,000
1,200
FY14 FY15 FY16 FY17
Gross Revenue (Bn)
22.9% 23.8%
32.6%
46.6%
0%
10%
20%
30%
40%
50%
FY14 FY15 FY16 FY17
EBITDA Margin %
Page | 6 | PHILLIPCAPITAL INDIA RESEARCH
BHARTI AIRTEL COMPANY UPDATE
Uganda is a country where Bharti has managed to check all the boxes – which means growth traction will sustain long term.
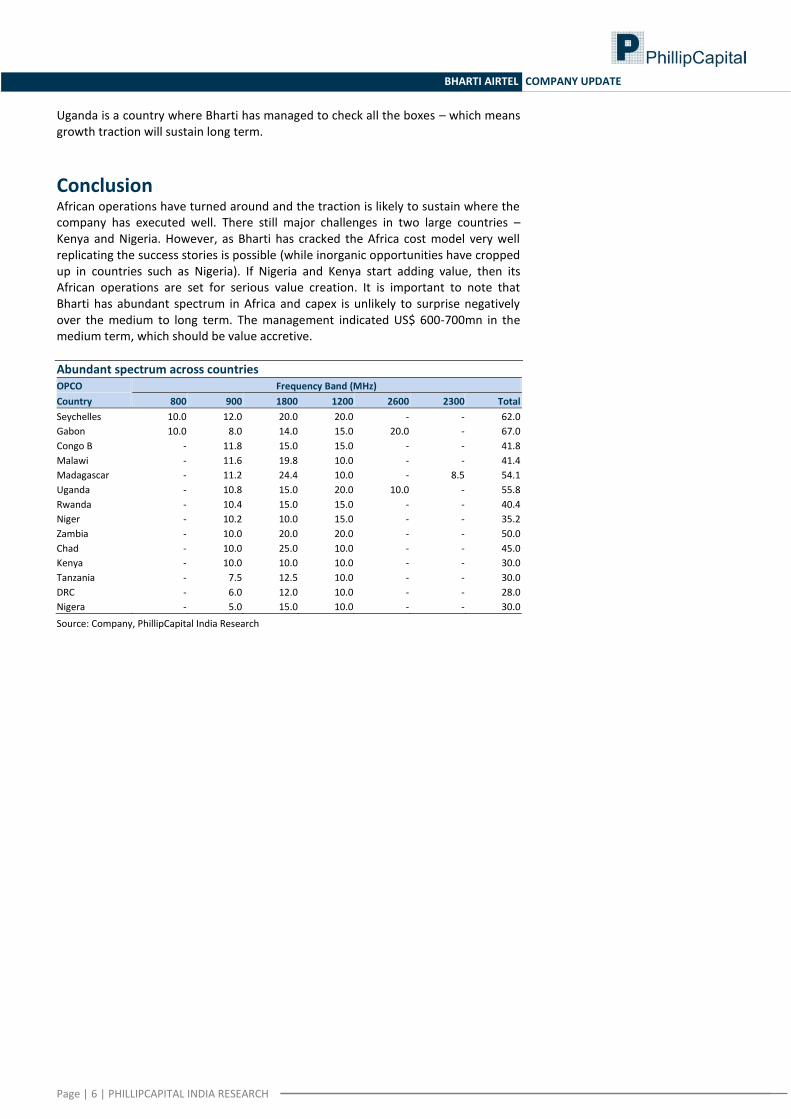
Conclusion African operations have turned around and the traction is likely to sustain where the company has executed well. There still major challenges in two large countries – Kenya and Nigeria. However, as Bharti has cracked the Africa cost model very well replicating the success stories is possible (while inorganic opportunities have cropped up in countries such as Nigeria). If Nigeria and Kenya start adding value, then its African operations are set for serious value creation. It is important to note that Bharti has abundant spectrum in Africa and capex is unlikely to surprise negatively over the medium to long term. The management indicated US$ 600-700mn in the medium term, which should be value accretive.
Abundant spectrum across countries OPCO Frequency Band (MHz)
Country 800 900 1800 1200 2600 2300 Total
Seychelles 10.0 12.0 20.0 20.0 - - 62.0
Gabon 10.0 8.0 14.0 15.0 20.0 - 67.0
Congo B - 11.8 15.0 15.0 - - 41.8
Malawi - 11.6 19.8 10.0 - - 41.4
Madagascar - 11.2 24.4 10.0 - 8.5 54.1
Uganda - 10.8 15.0 20.0 10.0 - 55.8
Rwanda - 10.4 15.0 15.0 - - 40.4
Niger - 10.2 10.0 15.0 - - 35.2
Zambia - 10.0 20.0 20.0 - - 50.0
Chad - 10.0 25.0 10.0 - - 45.0
Kenya - 10.0 10.0 10.0 - - 30.0
Tanzania - 7.5 12.5 10.0 - - 30.0
DRC - 6.0 12.0 10.0 - - 28.0
Nigera - 5.0 15.0 10.0 - - 30.0
Source: Company, PhillipCapital India Research
Page | 7 | PHILLIPCAPITAL INDIA RESEARCH
BHARTI AIRTEL COMPANY UPDATE
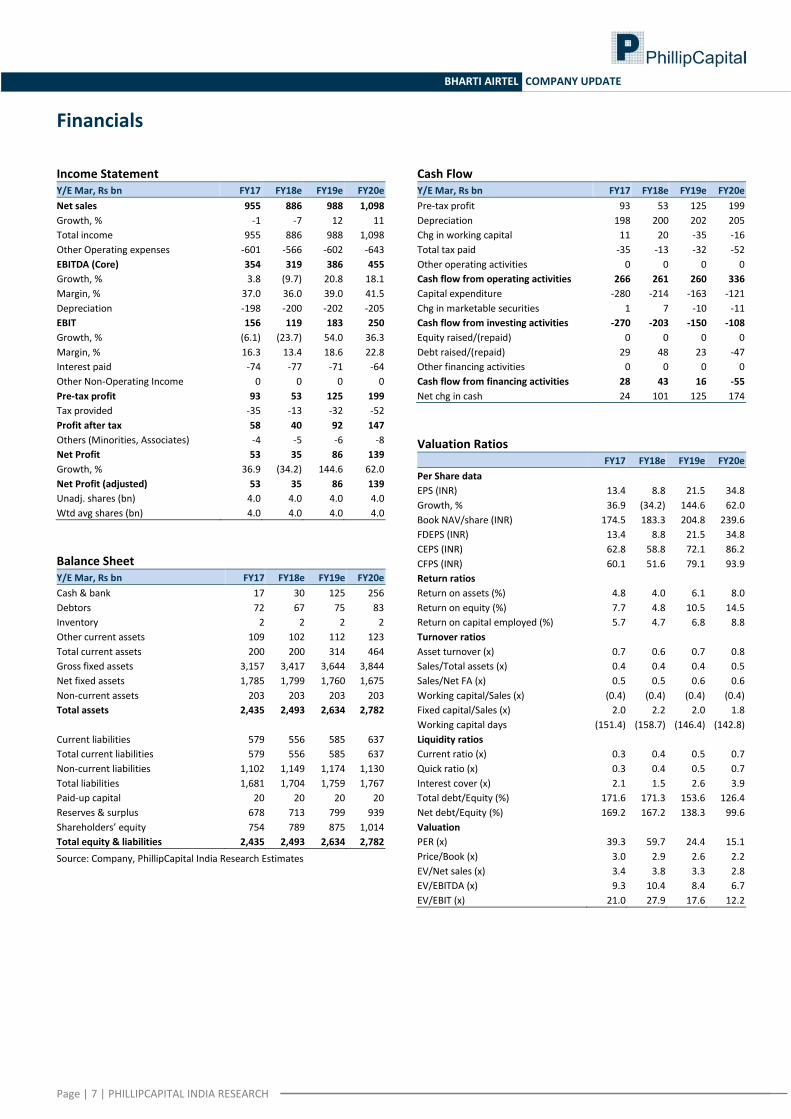
Financials
Income Statement Y/E Mar, Rs bn FY17 FY18e FY19e FY20e
Net sales 955 886 988 1,098
Growth, % -1 -7 12 11
Total income 955 886 988 1,098
Other Operating expenses -601 -566 -602 -643
EBITDA (Core) 354 319 386 455
Growth, % 3.8 (9.7) 20.8 18.1
Margin, % 37.0 36.0 39.0 41.5
Depreciation -198 -200 -202 -205
EBIT 156 119 183 250
Growth, % (6.1) (23.7) 54.0 36.3
Margin, % 16.3 13.4 18.6 22.8
Interest paid -74 -77 -71 -64
Other Non-Operating Income 0 0 0 0
Pre-tax profit 93 53 125 199
Tax provided -35 -13 -32 -52
Profit after tax 58 40 92 147
Others (Minorities, Associates) -4 -5 -6 -8
Net Profit 53 35 86 139
Growth, % 36.9 (34.2) 144.6 62.0
Net Profit (adjusted) 53 35 86 139
Unadj. shares (bn) 4.0 4.0 4.0 4.0
Wtd avg shares (bn) 4.0 4.0 4.0 4.0
Balance Sheet Y/E Mar, Rs bn FY17 FY18e FY19e FY20e
Cash & bank 17 30 125 256
Debtors 72 67 75 83
Inventory 2 2 2 2
Other current assets 109 102 112 123
Total current assets 200 200 314 464
Gross fixed assets 3,157 3,417 3,644 3,844
Net fixed assets 1,785 1,799 1,760 1,675
Non-current assets 203 203 203 203
Total assets 2,435 2,493 2,634 2,782
Current liabilities 579 556 585 637
Total current liabilities 579 556 585 637
Non-current liabilities 1,102 1,149 1,174 1,130
Total liabilities 1,681 1,704 1,759 1,767
Paid-up capital 20 20 20 20
Reserves & surplus 678 713 799 939
Shareholders’ equity 754 789 875 1,014
Total equity & liabilities 2,435 2,493 2,634 2,782
Source: Company, PhillipCapital India Research Estimates
Cash Flow Y/E Mar, Rs bn FY17 FY18e FY19e FY20e
Pre-tax profit 93 53 125 199
Depreciation 198 200 202 205
Chg in working capital 11 20 -35 -16
Total tax paid -35 -13 -32 -52
Other operating activities 0 0 0 0
Cash flow from operating activities 266 261 260 336
Capital expenditure -280 -214 -163 -121
Chg in marketable securities 1 7 -10 -11
Cash flow from investing activities -270 -203 -150 -108
Equity raised/(repaid) 0 0 0 0
Debt raised/(repaid) 29 48 23 -47
Other financing activities 0 0 0 0
Cash flow from financing activities 28 43 16 -55
Net chg in cash 24 101 125 174
Valuation Ratios
FY17 FY18e FY19e FY20e
Per Share data
EPS (INR) 13.4 8.8 21.5 34.8
Growth, % 36.9 (34.2) 144.6 62.0
Book NAV/share (INR) 174.5 183.3 204.8 239.6
FDEPS (INR) 13.4 8.8 21.5 34.8
CEPS (INR) 62.8 58.8 72.1 86.2
CFPS (INR) 60.1 51.6 79.1 93.9
Return ratios
Return on assets (%) 4.8 4.0 6.1 8.0
Return on equity (%) 7.7 4.8 10.5 14.5
Return on capital employed (%) 5.7 4.7 6.8 8.8
Turnover ratios
Asset turnover (x) 0.7 0.6 0.7 0.8
Sales/Total assets (x) 0.4 0.4 0.4 0.5
Sales/Net FA (x) 0.5 0.5 0.6 0.6
Working capital/Sales (x) (0.4) (0.4) (0.4) (0.4)
Fixed capital/Sales (x) 2.0 2.2 2.0 1.8
Working capital days (151.4) (158.7) (146.4) (142.8)
Liquidity ratios
Current ratio (x) 0.3 0.4 0.5 0.7
Quick ratio (x) 0.3 0.4 0.5 0.7
Interest cover (x) 2.1 1.5 2.6 3.9
Total debt/Equity (%) 171.6 171.3 153.6 126.4
Net debt/Equity (%) 169.2 167.2 138.3 99.6
Valuation
PER (x) 39.3 59.7 24.4 15.1
Price/Book (x) 3.0 2.9 2.6 2.2
EV/Net sales (x) 3.4 3.8 3.3 2.8
EV/EBITDA (x) 9.3 10.4 8.4 6.7
EV/EBIT (x) 21.0 27.9 17.6 12.2
Page | 8 | PHILLIPCAPITAL INDIA RESEARCH
BHARTI AIRTEL COMPANY UPDATE
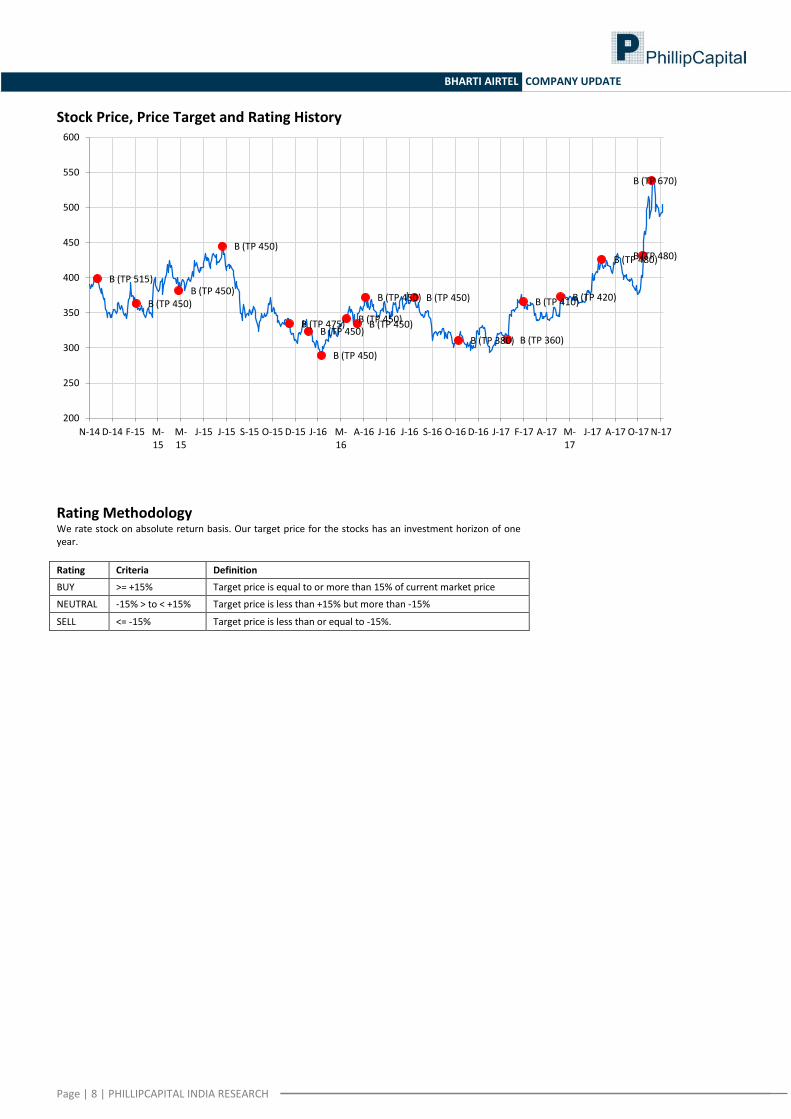
Stock Price, Price Target and Rating History
Rating Methodology We rate stock on absolute return basis. Our target price for the stocks has an investment horizon of one year.
Rating Criteria Definition
BUY >= +15% Target price is equal to or more than 15% of current market price
NEUTRAL -15% > to < +15% Target price is less than +15% but more than -15%
SELL <= -15% Target price is less than or equal to -15%.
B (TP 515)
B (TP 450) B (TP 450)
B (TP 450)
B (TP 475) B (TP 450)
B (TP 450)
B (TP 450) B (TP 450)
B (TP 450) B (TP 450)
B (TP 380) B (TP 360)
B (TP 410) B (TP 420)
B (TP 480) B (TP 480)
B (TP 670)
200
250
300
350
400
450
500
550
600
N-14 D-14 F-15 M-15
M-15
J-15 J-15 S-15 O-15 D-15 J-16 M-16
A-16 J-16 J-16 S-16 O-16 D-16 J-17 F-17 A-17 M-17
J-17 A-17 O-17 N-17
Page | 9 | PHILLIPCAPITAL INDIA RESEARCH
BHARTI AIRTEL COMPANY UPDATE
Management Vineet Bhatnagar (Managing Director) (91 22) 2483 1919
Kinshuk Bharti Tiwari (Head – Institutional Equity) (91 22) 6246 4101
Jignesh Shah (Head – Equity Derivatives) (91 22) 6667 9735
Research
Automobiles
Engineering, Capital Goods
Pharma & Specialty Chem
Dhawal Doshi (9122) 6246 4128
Jonas Bhutta (9122) 6246 4119
Surya Patra (9122) 6246 4121
Nitesh Sharma, CFA (9122) 6246 4126
Vikram Rawat (9122) 6246 4120
Mehul Sheth (9122) 6246 4123
Banking, NBFCs
IT Services & Infrastructure
Strategy
Manish Agarwalla (9122) 6246 4125
Vibhor Singhal (9122) 6246 4109
Naveen Kulkarni, CFA, FRM (9122) 6246 4122
Pradeep Agrawal (9122) 6246 4113
Shyamal Dhruve (9122) 6246 4110
Neeraj Chadawar (9122) 6246 4116
Paresh Jain (9122) 6246 4114
Logistics, Transportation & Midcap
Telecom
Consumer & Retail
Vikram Suryavanshi (9122) 6246 4111
Naveen Kulkarni, CFA, FRM (9122) 6246 4122
Naveen Kulkarni, CFA, FRM (9122) 6246 4122
Media
Preeyam Tolia (9122) 6246 4129
Naveen Kulkarni, CFA, FRM (9122) 6246 4122
Technicals
Vishal Gutka (9122) 6246 4118
Vishal Gutka (9122) 6246 4118
Subodh Gupta, CMT (9122) 6246 4136
Cement
Metals
Production Manager
Vaibhav Agarwal (9122) 6246 4124
Dhawal Doshi (9122) 6246 4128
Ganesh Deorukhkar (9122) 6667 9966
Economics
Vipul Agrawal (9122) 6246 4127
Editor
Anjali Verma (9122) 6246 4115
Mid-Caps
Roshan Sony 98199 72726
Shruti Bajpai (9122) 6246 4135
Deepak Agarwal (9122) 6246 4112
Sr. Manager – Equities Support
Oil & Gas
Rosie Ferns (9122) 6667 9971
Sabri Hazarika (9122) 6246 4130
Sales & Distribution
Corporate Communications
Ashvin Patil (9122) 6246 4105
Asia Sales
Zarine Damania (9122) 6667 9976
Kishor Binwal (9122) 6246 4106
Dhawal Shah 8522 277 6747
Bhavin Shah (9122) 6246 4102
Sales Trader
Ashka Mehta Gulati (9122) 6246 4108
Dilesh Doshi (9122) 6667 9747
Execution
Archan Vyas (9122) 6246 4107
Suniil Pandit (9122) 6667 9745
Mayur Shah (9122) 6667 9945
Contact Information (Regional Member Companies)
SINGAPORE: Phillip Securities Pte Ltd
250 North Bridge Road, #06-00 RafflesCityTower,
Singapore 179101
Tel : (65) 6533 6001 Fax: (65) 6535 3834
www.phillip.com.sg
MALAYSIA: Phillip Capital Management Sdn Bhd
B-3-6 Block B Level 3, Megan Avenue II,
No. 12, Jalan Yap Kwan Seng, 50450 Kuala Lumpur
Tel (60) 3 2162 8841 Fax (60) 3 2166 5099
www.poems.com.my
HONG KONG: Phillip Securities (HK) Ltd
11/F United Centre 95 Queensway Hong Kong
Tel (852) 2277 6600 Fax: (852) 2868 5307
www.phillip.com.hk
JAPAN: Phillip Securities Japan, Ltd
4-2 Nihonbashi Kabutocho, Chuo-ku
Tokyo 103-0026
Tel: (81) 3 3666 2101 Fax: (81) 3 3664 0141
www.phillip.co.jp
INDONESIA: PT Phillip Securities Indonesia
ANZTower Level 23B, Jl Jend Sudirman Kav 33A,
Jakarta 10220, Indonesia
Tel (62) 21 5790 0800 Fax: (62) 21 5790 0809
www.phillip.co.id
CHINA: Phillip Financial Advisory (Shanghai) Co. Ltd.
No 550 Yan An East Road, OceanTower Unit 2318
Shanghai 200 001
Tel (86) 21 5169 9200 Fax: (86) 21 6351 2940
www.phillip.com.cn
THAILAND: Phillip Securities (Thailand) Public Co. Ltd.
15th Floor, VorawatBuilding, 849 Silom Road,
Silom, Bangrak, Bangkok 10500 Thailand
Tel (66) 2 2268 0999 Fax: (66) 2 2268 0921
www.phillip.co.th
FRANCE: King & Shaxson Capital Ltd.
3rd Floor, 35 Rue de la Bienfaisance
75008 Paris France
Tel (33) 1 4563 3100 Fax : (33) 1 4563 6017
www.kingandshaxson.com
UNITED KINGDOM: King & Shaxson Ltd.
6th Floor, Candlewick House, 120 Cannon Street
London, EC4N 6AS
Tel (44) 20 7929 5300 Fax: (44) 20 7283 6835
www.kingandshaxson.com
UNITED STATES: Phillip Futures Inc.
141 W Jackson Blvd Ste 3050
The Chicago Board of TradeBuilding
Chicago, IL 60604 USA
Tel (1) 312 356 9000 Fax: (1) 312 356 9005
AUSTRALIA: PhillipCapital Australia
Level 10, 330 Collins Street
Melbourne, VIC 3000, Australia
Tel: (61) 3 8633 9800 Fax: (61) 3 8633 9899
www.phillipcapital.com.au
SRI LANKA: Asha Phillip Securities Limited
Level 4, Millennium House, 46/58 Navam Mawatha,
Colombo 2, Sri Lanka
Tel: (94) 11 2429 100 Fax: (94) 11 2429 199
www.ashaphillip.net/home.htm
INDIA
PhillipCapital (India) Private Limited
No. 1, 18th Floor, Urmi Estate, 95 Ganpatrao Kadam Marg, Lower Parel West, Mumbai 400013 Tel: (9122) 2483 1919 Fax: (9122) 6667 9955 www.phillipcapital.in
Page | 10 | PHILLIPCAPITAL INDIA RESEARCH
BHARTI AIRTEL COMPANY UPDATE
Disclosures and Disclaimers PhillipCapital (India) Pvt. Ltd. has three independent equity research groups: Institutional Equities, Institutional Equity Derivatives, and Private Client Group. This report has been prepared by Institutional Equities Group. The views and opinions expressed in this document may, may not match, or may be contrary at times with the views, estimates, rating, and target price of the other equity research groups of PhillipCapital (India) Pvt. Ltd.
This report is issued by PhillipCapital (India) Pvt. Ltd., which is regulated by the SEBI. PhillipCapital (India) Pvt. Ltd. is a subsidiary of Phillip (Mauritius) Pvt. Ltd. References to "PCIPL" in this report shall mean PhillipCapital (India) Pvt. Ltd unless otherwise stated. This report is prepared and distributed by PCIPL for information purposes only, and neither the information contained herein, nor any opinion expressed should be construed or deemed to be construed as solicitation or as offering advice for the purposes of the purchase or sale of any security, investment, or derivatives. The information and opinions contained in the report were considered by PCIPL to be valid when published. The report also contains information provided to PCIPL by third parties. The source of such information will usually be disclosed in the report. Whilst PCIPL has taken all reasonable steps to ensure that this information is correct, PCIPL does not offer any warranty as to the accuracy or completeness of such information. Any person placing reliance on the report to undertake trading does so entirely at his or her own risk and PCIPL does not accept any liability as a result. Securities and Derivatives markets may be subject to rapid and unexpected price movements and past performance is not necessarily an indication of future performance.
This report does not regard the specific investment objectives, financial situation, and the particular needs of any specific person who may receive this report. Investors must undertake independent analysis with their own legal, tax, and financial advisors and reach their own conclusions regarding the appropriateness of investing in any securities or investment strategies discussed or recommended in this report and should understand that statements regarding future prospects may not be realised. Under no circumstances can it be used or considered as an offer to sell or as a solicitation of any offer to buy or sell the securities mentioned within it. The information contained in the research reports may have been taken from trade and statistical services and other sources, which PCIL believe is reliable. PhillipCapital (India) Pvt. Ltd. or any of its group/associate/affiliate companies do not guarantee that such information is accurate or complete and it should not be relied upon as such. Any opinions expressed reflect judgments at this date and are subject to change without notice.
Important: These disclosures and disclaimers must be read in conjunction with the research report of which it forms part. Receipt and use of the research report is subject to all aspects of these disclosures and disclaimers. Additional information about the issuers and securities discussed in this research report is available on request.
Certifications: The research analyst(s) who prepared this research report hereby certifies that the views expressed in this research report accurately reflect the research analyst’s personal views about all of the subject issuers and/or securities, that the analyst(s) have no known conflict of interest and no part of the research analyst’s compensation was, is, or will be, directly or indirectly, related to the specific views or recommendations contained in this research report.
Additional Disclosures of Interest: Unless specifically mentioned in Point No. 9 below: 1. The Research Analyst(s), PCIL, or its associates or relatives of the Research Analyst does not have any financial interest in the company(ies) covered in
this report. 2. The Research Analyst, PCIL or its associates or relatives of the Research Analyst affiliates collectively do not hold more than 1% of the securities of the
company (ies)covered in this report as of the end of the month immediately preceding the distribution of the research report. 3. The Research Analyst, his/her associate, his/her relative, and PCIL, do not have any other material conflict of interest at the time of publication of this
research report. 4. The Research Analyst, PCIL, and its associates have not received compensation for investment banking or merchant banking or brokerage services or for
any other products or services from the company(ies) covered in this report, in the past twelve months. 5. The Research Analyst, PCIL or its associates have not managed or co-managed in the previous twelve months, a private or public offering of securities for
the company (ies) covered in this report. 6. PCIL or its associates have not received compensation or other benefits from the company(ies) covered in this report or from any third party, in
connection with the research report. 7. The Research Analyst has not served as an Officer, Director, or employee of the company (ies) covered in the Research report. 8. The Research Analyst and PCIL has not been engaged in market making activity for the company(ies) covered in the Research report. 9. Details of PCIL, Research Analyst and its associates pertaining to the companies covered in the Research report:
Sr. no. Particulars Yes/No
1 Whether compensation has been received from the company(ies) covered in the Research report in the past 12 months for investment banking transaction by PCIL
No
2 Whether Research Analyst, PCIL or its associates or relatives of the Research Analyst affiliates collectively hold more than 1% of the company(ies) covered in the Research report
No
3 Whether compensation has been received by PCIL or its associates from the company(ies) covered in the Research report No
4 PCIL or its affiliates have managed or co-managed in the previous twelve months a private or public offering of securities for the company(ies) covered in the Research report
No
5 Research Analyst, his associate, PCIL or its associates have received compensation for investment banking or merchant banking or brokerage services or for any other products or services from the company(ies) covered in the Research report, in the last twelve months
No
Independence: PhillipCapital (India) Pvt. Ltd. has not had an investment banking relationship with, and has not received any compensation for investment banking services from, the subject issuers in the past twelve (12) months, and PhillipCapital (India) Pvt. Ltd does not anticipate receiving or intend to seek compensation for investment banking services from the subject issuers in the next three (3) months. PhillipCapital (India) Pvt. Ltd is not a market maker in the securities mentioned in this research report, although it, or its affiliates/employees, may have positions in, purchase or sell, or be materially interested in any of the securities covered in the report.
Suitability and Risks: This research report is for informational purposes only and is not tailored to the specific investment objectives, financial situation or particular requirements of any individual recipient hereof. Certain securities may give rise to substantial risks and may not be suitable for certain investors. Each investor must make its own determination as to the appropriateness of any securities referred to in this research report based upon the legal, tax and accounting considerations applicable to such investor and its own investment objectives or strategy, its financial situation and its investing experience. The value of any security may be positively or adversely affected by changes in foreign exchange or interest rates, as well as by other financial, economic, or political factors. Past performance is not necessarily indicative of future performance or results.
Page | 11 | PHILLIPCAPITAL INDIA RESEARCH
BHARTI AIRTEL COMPANY UPDATE
Sources, Completeness and Accuracy: The material herein is based upon information obtained from sources that PCIPL and the research analyst believe to be reliable, but neither PCIPL nor the research analyst represents or guarantees that the information contained herein is accurate or complete and it should not be relied upon as such. Opinions expressed herein are current opinions as of the date appearing on this material, and are subject to change without notice. Furthermore, PCIPL is under no obligation to update or keep the information current. Without limiting any of the foregoing, in no event shall PCIL, any of its affiliates/employees or any third party involved in, or related to computing or compiling the information have any liability for any damages of any kind including but not limited to any direct or consequential loss or damage, however arising, from the use of this document.
Copyright: The copyright in this research report belongs exclusively to PCIPL. All rights are reserved. Any unauthorised use or disclosure is prohibited. No reprinting or reproduction, in whole or in part, is permitted without the PCIPL’s prior consent, except that a recipient may reprint it for internal circulation only and only if it is reprinted in its entirety.
Caution: Risk of loss in trading/investment can be substantial and even more than the amount / margin given by you. Investment in securities market are subject to market risks, you are requested to read all the related documents carefully before investing. You should carefully consider whether trading/investment is appropriate for you in light of your experience, objectives, financial resources and other relevant circumstances. PhillipCapital and any of its employees, directors, associates, group entities, or affiliates shall not be liable for losses, if any, incurred by you. You are further cautioned that trading/investments in financial markets are subject to market risks and are advised to seek independent third party trading/investment advice outside PhillipCapital/group/associates/affiliates/directors/employees before and during your trading/investment. There is no guarantee/assurance as to returns or profits or capital protection or appreciation. PhillipCapital and any of its employees, directors, associates, and/or employees, directors, associates of PhillipCapital’s group entities or affiliates is not inducing you for trading/investing in the financial market(s). Trading/Investment decision is your sole responsibility. You must also read the Risk Disclosure Document and Do’s and Don’ts before investing.
Kindly note that past performance is not necessarily a guide to future performance.
For Detailed Disclaimer: Please visit our website www.phillipcapital.in
For U.S. persons only: This research report is a product of PhillipCapital (India) Pvt Ltd., which is the employer of the research analyst(s) who has prepared the research report. The research analyst(s) preparing the research report is/are resident outside the United States (U.S.) and are not associated persons of any U.S.-regulated broker-dealer and therefore the analyst(s) is/are not subject to supervision by a U.S. broker-dealer, and is/are not required to satisfy the regulatory licensing requirements of FINRA or required to otherwise comply with U.S. rules or regulations regarding, among other things, communications with a subject company, public appearances, and trading securities held by a research analyst account.
This report is intended for distribution by PhillipCapital (India) Pvt Ltd. only to "Major Institutional Investors" as defined by Rule 15a-6(b)(4) of the U.S. Securities and Exchange Act, 1934 (the Exchange Act) and interpretations thereof by the U.S. Securities and Exchange Commission (SEC) in reliance on Rule 15a 6(a)(2). If the recipient of this report is not a Major Institutional Investor as specified above, then it should not act upon this report and return the same to the sender. Further, this report may not be copied, duplicated, and/or transmitted onward to any U.S. person, which is not a Major Institutional Investor. In reliance on the exemption from registration provided by Rule 15a-6 of the Exchange Act and interpretations thereof by the SEC in order to conduct certain
business with Major Institutional Investors, PhillipCapital (India) Pvt Ltd. has entered into an agreement with a U.S. registered broker-dealer, Decker & Co, LLC. Transactions in securities discussed in this research report should be effected through Decker & Co, LLC or another U.S. registered broker dealer.
If Distribution is to Australian Investors This report is produced by PhillipCapital (India) Pvt Ltd and is being distributed in Australia by Phillip Capital Limited (Australian Financial Services Licence No. 246827).
This report contains general securities advice and does not take into account your personal objectives, situation and needs. Please read the Disclosures and Disclaimers set out above. By receiving or reading this report, you agree to be bound by the terms and limitations set out above. Any failure to comply with
these terms and limitations may constitute a violation of law. This report has been provided to you for personal use only and shall not be reproduced, distributed or published by you in whole or in part, for any purpose. If you have received this report by mistake, please delete or destroy it, and notify the sender immediately.
PhillipCapital (India) Pvt. Ltd. Registered office: No. 1, 18th Floor, Urmi Estate, 95 Ganpatrao Kadam Marg, Lower Parel West, Mumbai 400013


![Bharti Telecom Performance Appraisal in Bharti Telecom[1]](https://img.pdfslide.net/doc/110x75/547f3ee15806b5b35e8b47d6/bharti-telecom-performance-appraisal-in-bharti-telecom1.jpg)