Embed Size (px)
Citation preview

INSTITUTIONAL EQUITY RESEARCH
Page | 1 | PHILLIPCAPITAL INDIA RESEARCH
Infrastructure
BOT Segment – Consolidation on the cards INDIA | INFRASTRUCTURE | Sector Update
26 March 2015
The road sector in India is about to undergo a radical transformation over the next three years. Large no of BOT projects are expected to be put‐up for sale by their owners – driven by change in business focus, deleveraging efforts and funding requirement for new projects. At the same time, with the traffic growth picking‐up and interest rates expected to come down, we expect lost of strategic investors and PE players (foreign and domestic) to come forth to acquire these projects, to benefit from the valuation upside. Early signs are already visible (TRIL’s acquisition of Madhucon’s project, GMR’s divestment of two projects) – we expect a surge in the inorganic activity in the sector, over the next three years. Over 100 BOT projects up for sale: Our analysis of 200 BOT projects across the country reveals that over 100 BOT projects are currently on the block, where the developer is looking for partial/complete exit. Majority of these projects are in operational stage, where the developer is allowed to divest 74% stake. Most of these projects are, as expected, currently owned by EPC players, who now want to shift their focus back to EPC. We expect PE investors and developers like IRB, Ashoka and L&T to benefit from this unprecedented supply of BOT projects, and grow their portfolios inorganically. Shift in NHAI focus from BOT to EPC: Over the last five years (FY09‐14), the focus in the roads sector has been on BOT projects – primarily because NHAI awarded over 90% of the projects as BOT. The period witnessed robust growth in the portfolio of many BOT companies (IRB, Ashoka, Sadbhav and ITNL). It also saw most of the EPC companies join the BOT bandwagon – and carve a separate division for the BOT assets – primarily acting as a feeder to their EPC division. However, over the next three years, the focus of NHAI award process is expected to shift from BOT to EPC. Hence we expect these EPC companies to exit their BOT projects – to focus on their core competency – construction. Companies looking to deleverage their balance sheets: Many BOT developers (like Sadbhav, ITNL) and asset owners (like GMR, GVK, Gammon Infra) are currently, not generating enough cash from their operational projects, to fund the equity requirement for their new projects or have highly stretched balance sheets. We expect many of these companies to put, their road BOT projects, up for sale. Increasing interest from the demand side: On the demand side too, the landscape is changing rapidly. While only few developers (like IRB, L&T, Ashoka) have the might to acquire new projects – private equity firms like IDFC PE, SBI‐Macquarie, Piramal Enterprises and TRIL have also evinced their interest. These firms have been waiting at the sidelines, for the last five years – looking for investment opportunities in the infrastructure sector. With traffic growth picking‐up and interest rates expected to come down – this could be the best time for them to buy these assets – at cheap valuations and significant upside potential.
Also, we expect many foreign funds (pension and sovereign funds) to be attracted to this segment. These funds typically operate on dividend/cash‐flow based models, and invest in companies that can provide stable cashflows for long durations. The BOT projects perfectly fit their investment criterion, especially with the macro‐environment looking up. A perfect win‐win situation: Overall, we expect a surge in inorganic activity in the roads sector, over the next three years. Large no of BOT projects are expected to undergo change in their ownership – leading to growth in portfolio of the buyers and deleveraging of balance sheets of the sellers. It appears to be a perfect win‐win situation for the sector – in order to capitalize on the huge investment opportunity expected to unravel over the next three years. We maintain our BUY rating on IRB Infra, and upgrade Ashoka Buildcon to BUY.
Companies IRB INFRASTRUCURE Reco BUY CMP, Rs 250 Target Price, Rs Rs 336 ASHOKA BUILDCON Reco BUY CMP, Rs 162 Target Price, Rs 191 SADBHAV ENGINEERING Reco NOT RATED CMP, Rs 342 ILFS TRANSPORTTION Reco NOT RATED CMP, Rs 192 BOT companies – Relative Positioning
Source: Bloomberg, Phillip Capital India Research Vibhor Singhal (+ 9122 6667 9949) [email protected]
Ashoka
Sadbhav
ITNL
IRB
0.5
1.0
1.5
2.0
2.5
3.0
3.5
4.0
4.5
0.0 1.0 2.0 3.0 4.0 5.0
P/BV
(FY16E)
Debt:Equity (FY16E)

Page | 2 | PHILLIPCAPITAL INDIA RESEARCH
INFRASTRUCTURE SECTOR UPDATE
Table of Contents
Road sector – At the crossroads ∙∙∙∙∙∙∙∙∙∙∙∙∙∙∙∙∙∙∙∙∙∙∙∙∙∙∙∙∙∙∙∙∙∙∙∙∙∙∙∙∙∙∙∙∙∙∙∙∙∙∙∙∙∙∙∙∙∙∙∙∙∙∙∙∙∙∙∙∙∙∙∙∙∙∙∙∙∙∙∙ 3
BOT segment – Time for consolidation? ∙∙∙∙∙∙∙∙∙∙∙∙∙∙∙∙∙∙∙∙∙∙∙∙∙∙∙∙∙∙∙∙∙∙∙∙∙∙∙∙∙∙∙∙∙∙∙∙∙∙∙∙∙∙∙∙∙∙∙∙∙∙∙∙∙∙∙ 4
Supply Side – Plenty on the plate ∙∙∙∙∙∙∙∙∙∙∙∙∙∙∙∙∙∙∙∙∙∙∙∙∙∙∙∙∙∙∙∙∙∙∙∙∙∙∙∙∙∙∙∙∙∙∙∙∙∙∙∙∙∙∙∙∙∙∙∙∙∙∙∙∙∙∙∙∙∙∙∙∙∙∙∙∙∙ 5
Demand side – Increasing levels of interest ∙∙∙∙∙∙∙∙∙∙∙∙∙∙∙∙∙∙∙∙∙∙∙∙∙∙∙∙∙∙∙∙∙∙∙∙∙∙∙∙∙∙∙∙∙∙∙∙∙∙∙∙∙∙∙∙∙∙∙∙∙∙ 6
BOT Portfolios – As big as it can get ∙∙∙∙∙∙∙∙∙∙∙∙∙∙∙∙∙∙∙∙∙∙∙∙∙∙∙∙∙∙∙∙∙∙∙∙∙∙∙∙∙∙∙∙∙∙∙∙∙∙∙∙∙∙∙∙∙∙∙∙∙∙∙∙∙∙∙∙∙∙∙∙∙∙ 8
Projects on the block – Plentiful ∙∙∙∙∙∙∙∙∙∙∙∙∙∙∙∙∙∙∙∙∙∙∙∙∙∙∙∙∙∙∙∙∙∙∙∙∙∙∙∙∙∙∙∙∙∙∙∙∙∙∙∙∙∙∙∙∙∙∙∙∙∙∙∙∙∙∙∙∙∙∙∙∙∙∙∙∙∙∙∙ 10
Regulatory barriers – Significantly low; being lowered further ∙∙∙∙∙∙∙∙∙∙∙∙∙∙∙∙∙∙∙∙∙∙∙∙∙∙∙∙∙∙∙∙ 12
BOT Sector – Valuation triggers on the anvil ∙∙∙∙∙∙∙∙∙∙∙∙∙∙∙∙∙∙∙∙∙∙∙∙∙∙∙∙∙∙∙∙∙∙∙∙∙∙∙∙∙∙∙∙∙∙∙∙∙∙∙∙∙∙∙∙∙∙∙∙∙ 13
Appendix ∙∙∙∙∙∙∙∙∙∙∙∙∙∙∙∙∙∙∙∙∙∙∙∙∙∙∙∙∙∙∙∙∙∙∙∙∙∙∙∙∙∙∙∙∙∙∙∙∙∙∙∙∙∙∙∙∙∙∙∙∙∙∙∙∙∙∙∙∙∙∙∙∙∙∙∙∙∙∙∙∙∙∙∙∙∙∙∙∙∙∙∙∙∙∙∙∙∙∙∙∙∙∙∙∙∙∙∙∙∙∙∙∙∙∙ 14
The BIG Guys – Potential buyers ∙∙∙∙∙∙∙∙∙∙∙∙∙∙∙∙∙∙∙∙∙∙∙∙∙∙∙∙∙∙∙∙∙∙∙∙∙∙ available in hard copy
Asset Owners – The Willing sellers ∙∙∙∙∙∙∙∙∙∙∙∙∙∙∙∙∙∙∙∙∙∙∙∙∙∙∙∙∙∙∙∙∙∙ available in hard copy
EPC players – ready to move out of BOT ∙∙∙∙∙∙∙∙∙∙∙∙∙∙∙∙∙∙∙∙∙∙∙∙∙∙ available in hard copy
The Private players ∙∙∙∙∙∙∙∙∙∙∙∙∙∙∙∙∙∙∙∙∙∙∙∙∙∙∙∙∙∙∙∙∙∙∙∙∙∙∙∙∙∙∙∙∙∙∙∙∙∙∙∙∙∙∙∙∙∙ available in hard copy
Companies Section
IRB Infrastructure ∙∙∙∙∙∙∙∙∙∙∙∙∙∙∙∙∙∙∙∙∙∙∙∙∙∙∙∙∙∙∙∙∙∙∙∙∙∙∙∙∙∙∙∙∙∙∙∙∙∙∙∙∙∙∙∙∙∙∙∙∙∙∙∙∙∙∙∙∙∙∙∙∙∙∙∙∙∙∙∙∙∙∙∙∙∙∙∙∙∙∙∙∙∙∙∙∙∙∙∙∙∙ 16
Ashoka Buildcon ∙∙∙∙∙∙∙∙∙∙∙∙∙∙∙∙∙∙∙∙∙∙∙∙∙∙∙∙∙∙∙∙∙∙∙∙∙∙∙∙∙∙∙∙∙∙∙∙∙∙∙∙∙∙∙∙∙∙∙∙∙∙∙∙∙∙∙∙∙∙∙∙∙∙∙∙∙∙∙∙∙∙∙∙∙∙∙∙∙∙∙∙∙∙∙∙∙∙∙∙∙∙∙∙ 19
Sadbhav Engineering ∙∙∙∙∙∙∙∙∙∙∙∙∙∙∙∙∙∙∙∙∙∙∙∙∙∙∙∙∙∙∙∙∙∙∙∙∙∙∙∙∙∙∙∙∙∙∙∙∙∙∙∙∙∙∙∙∙∙∙∙∙∙∙∙∙∙∙∙∙∙∙∙∙∙∙∙∙∙∙∙∙∙∙∙∙∙∙∙∙∙∙∙∙∙∙∙∙ 22
ILFS Transportation Networks ∙∙∙∙∙∙∙∙∙∙∙∙∙∙∙∙∙∙∙∙∙∙∙∙∙∙∙∙∙∙∙∙∙∙∙∙∙∙∙∙∙∙∙∙∙∙∙∙∙∙∙∙∙∙∙∙∙∙∙∙∙∙∙∙∙∙∙∙∙∙∙∙∙∙∙∙∙∙∙∙∙∙∙ 25

Page | 3 | PHILLIPCAPITAL INDIA RESEARCH
INFRASTRUCTURE SECTOR UPDATE
Road sector – At the crossroads FY13 and FY14 remained forgettable years for NHAI in terms of achieving their targeted length of awarded projects. The regulatory body awarded only 1,100 km and 1,400 km in FY13 and FY14 vs. their own target of 8,800 km and 6,500 km, respectively. The dismal performance was led by problems surrounding land acquisition and environmental clearance, because of which execution could not start on many projects awarded in FY12.
However, the more worrisome part of the dismal order award process of the last five years, was the low share of EPC projects. Over FY10‐14, NHAI awarded a paltry 7% of the total awards on EPC basis. This led to many EPC players joining the BOT bandwagon, as they faced muted order inflows from other segments too (Buildings, Irrigation etc). This has led to many of these companies, with unviable BOT projects in their portfolio – which they now want to ‘get rid of’. NHAI – Dismal performance over last two years – last five years dominated by BOT projects
Source: PhillipCapital India Research However, we expect a resurrection in EPC orders from NHAI, starting FY16. Of the 14,600km yet to be awarded in the NHDP, over 8,500km are under phase IV – which would primarily be EPC orders. Overall NHAI intends to award 70% of the projects over the next two years on EPC basis.
While the resurgence in EPC orders augurs well for the EPC companies, it also diminishes the growth potential for the BOT players. This, in our opinion, might force the BOT players to scout for inorganic opportunities. NHDP current status — Jan 2015 (length in km)
Total length
(km) Already
4‐laned (km)
Under Implementation
(km)To be
awarded (km)Golden Quadrilateral 5,846 5,846 ‐ ‐NS ‐ EW Ph. I & II 7,142 6,360 365 417 NHDP Phase III 12,109 6,393 4,373 1,343 NHDP Phase IV 14,799 942 5,904 7,953 NHDP Phase V 6,500 2,001 2,080 2,419 NHDP Phase VI 1,000 ‐ ‐ 1,000 NHDP Phase VII 700 22 19 659 NHDP Total 48,096 21,564 12,741 13,791 Port Connectivity 380 379 1 ‐Others 2,142 1,527 338 277 Total by NHAI 50,618 23,470 13,080 14,068
Source: NHAI
‐
1,000
2,000
3,000
4,000
5,000
6,000
7,000
FY05 FY06 FY07 FY08 FY09 FY10 FY11 FY12 FY13 FY14
Constructed Awarded
‐
1,000
2,000
3,000
4,000
5,000
6,000
7,000
FY05 FY06 FY07 FY08 FY09 FY10 FY11 FY12 FY13 FY14
BOT EPC

Page | 4 | PHILLIPCAPITAL INDIA RESEARCH
INFRASTRUCTURE SECTOR UPDATE
BOT segment – Time for consolidation? Over the next three years, we expect a surge in M&A activity in the roads BOT space. Road is relatively a more mature sector in the infrastructure space – with over a decade’s history of BOT projects, tightly woven model concession agreement and standardized procedures (operational and financial). With minimum regulatory concerns, we see the inorganic equation for the BOT space being met from both the demand as well as supply side: Supply: • EPC companies looking to exit their BOT portfolios completely/partially • BOT developers requiring funds for their new projects • Diversified players looking to deleverage their BS or raise funds for other projects Demand: • Domestic PE funds, who have been waiting at the sideline for last five years • Foreign Pension/Sovereign funds, which typically invest in long duration projects
with stable cashflows • BOT developers with strong balance sheets, looking grow their portfolio
inorganically Why do sellers want to sell BOT assets ? Reason Companies Lower than expected toll collection IVRCL, NCC Projects were won only for EPC contract Most EPC companies Higher interest rate ‐ low bargaining power with banks Private smaller players Equity requirement for new projects GMR, GVK, Gammon Infra Deleverage balance sheet GMR, GVK, NCC, Lanco Strategic shift away from BOT business model Most EPC companies
Source: PhillipCapital India Research Why do buyers want to buy BOT assets ? Developers Private Equity / Pension Funds Quick and easy way to grow portfolio inorganically, eliminating execution risk Infrastructure based funds need to deploy capital in infrastructure assets Developers with healthier balance sheet / relation with bankers can turn around a project with lower cost of debt
Mature assets available at cheap valuations, which offer valuation upside with higher traffic growth and lower interest rates
Acquire missing links on a continuous stretch or a parallel competing road Long duration projects with stable cashflows
Source: PhillipCapital India Research
Historic PE deals in the BOT space Date Investor Company Amount Stake ___Portfolio size (Rs mn)__ ___Implicit Valuation___ Rs mn % Project Cost Book value Rs mn P/BVInvestment in portfolios Mar‐08 AMP Capital Gayatri Projects 2,000 29.4 77,310 12,564 6,803 0.54Aug‐10 Norwest + Xander Sadbhav Engg 4,000 22.2 74,777 14,662 18,018 1.23Jul‐11 Xander group HCC 2,400 14.5 55,380 11,905 16,552 1.39Jan‐12 3i Group Supreme Infra ‐ 3 projects 3,000 49.0 11,040 2,765 6,122 2.21Aug‐12 SBI Macquarie Ashoka Buildcon 8,000 34.0 76,890 19,202 23,529 1.23Apr‐13 Piramal Ent Navayuga 5,500 NA NA NA NA NADec‐14 Canada Pension Plan L&T ‐ IDPL 20,000 NA 423,340 81,320 NA NAAsset divestment May‐12 IRB Infra MVR Infra 1,280 74.0 3,076 842 1,280 1.52Apr‐13 Tata Realty & Infra IVRCL ‐ 3 projects* NA 74.0 22,055 5,876 NA NAFeb‐13 SBI Macquarie GMR ‐ Jadcherla 2,060 74.0 5,155 1,620 2,784 1.72Sep‐13 IDFC PE GMR ‐ Ullundurpet 2,220 74.0 8,817 3,440 3,000 0.87Nov‐14 IDFC PE HCC ‐ Nirmal BOT 640 74.0 3,150 630 640 1.02Dec‐14 Tata Realty & Infra Madhucon ‐ Agra‐Jaipur 2,500 74.0 3,680 994 2,500 2.52
Source: PhillipCapital India Research (*Deal yet to be signed)

Page | 5 | PHILLIPCAPITAL INDIA RESEARCH
INFRASTRUCTURE SECTOR UPDATE
Supply Side – plenty on the plate 1) The EPC players – stuck in the quagmire The EPC players are stuck in a tricky situation with their BOT assets. These companies invested in these assets, as they were facing a paucity of orders from other segments (Buildings, Irrigation, Power) and most of the road projects were being awarded as BOT projects. They did not have competency to estimate and forecast traffic for long duration (20‐30 years), nor did they intend to stay invested in projects for long. However, economic downturn (leading to lower than expected traffic growth) and high interest rates (leading to higher interest expense) made most of their BOT projects financially unviable. Equity commitment for these projects, along with inflated WC cycle in their core EPC business, forced many of these companies into CDR, over the last few years. Most of these companies now want to shift focus, back to their competency – EPC. Looking to deleverage their balance sheets, many have put up, most of their BOT assets on the block. We expect large no of deals to materialize in this space – where buyers will be able to acquire quality road assets at cheap valuations. The sellers will be able to get rid of their ‘non‐core’ assets, and plough back the capital raised into their core business – EPC. A perfect win‐win situation for the sector. EPC players – sizeable BOT portfolios Company Projects Length Portfolio Size Debt Obligation Equity Size
# km Rs mn Rs mn Rs mnSupreme Infra 10 482 44,040 32,607 11,433 IVRCL Ltd 7 521 52,715 33,748 13,567 NCC Ltd 5 250 29,410 19,036 8,513 HCC Ltd 6 382 55,380 33,135 11,905 Era Infra 6 388 54,226 36,550 9,966 Madhucon 9 685 74,128 51,004 17,577 Gayatri Projects 8 620 77,310 51,845 12,564 Ramky Infra 7 642 77,977 58,935 14,988
Source: Company, PhillipCapital India Research
2) The BOT developers – bitten off more than they can chew BOT developers have their own sorry story to narrate. Barring few focused BOT players (like IRB, Ashoka and Sadbhav), most developers invested indiscriminately into projects across sectors (Airport, Power, MRTS). However lower than expected cash flow generation from their operational projects (on the back of deteriorating macro‐environment), has meant that most of them are struggling to fund the equity requirement for their under‐construction projects.
We expect developers like GMR, GVK, Lanco, Gammon Infra and L&T IDPL to put‐up large part of their BOT road assets on the block – to raise capital that they can plough back into new projects. The divestments might be in the form of strategic stake in the BOT arm (like the recent L&T IDPL deal) or outright sale of BOT assets (like GMR). Asset owners – staring at significant equity requirement
Company Portfolio size (TPC) (Rs mn)
Equity reqd (Rs mn)
Consol Debt (Rs mn)
Standalone Debt (Rs mn)
Consol Debt:Equity
GMR Infra 4,82,172 12,000 4,30,721 35,261 5.1GVK Power 3,65,516 15,000 2,46,240 52,500 12.0Gammon Infra 95,418 5,461 42,178 4,500 4.4L&T IDPL 4,23,340 46,400 9,17,622 NA 2.3
Source: Company, PhillipCapital India Research
Page | 6 | PHILLIPCAPITAL INDIA RESEARCH
INFRASTRUCTURE SECTOR UPDATE
Demand side – Increasing levels of interest 1) Strategic investments for the solvent developers On the demand side, there are not many developers who have the balance sheet to acquire incrementally new projects. However, developers like IRB, Ashoka, L&T and Sadbhav remain open to acquiring projects which can provide them strategic advantage – missing links on a continuous stretch or parallel competing roads.
IRB, for example, might look to acquire Vadodara‐Bharuch project from L&T, as it completes its continuous stretch of projects from Ahmadabad‐Vadodara‐Bharuch‐Surat‐Dahisar.
Multiple road projects in Maharashtra make strategic sense for IRB Infra
Source: Companies, Google maps, PhillipCapital India Research
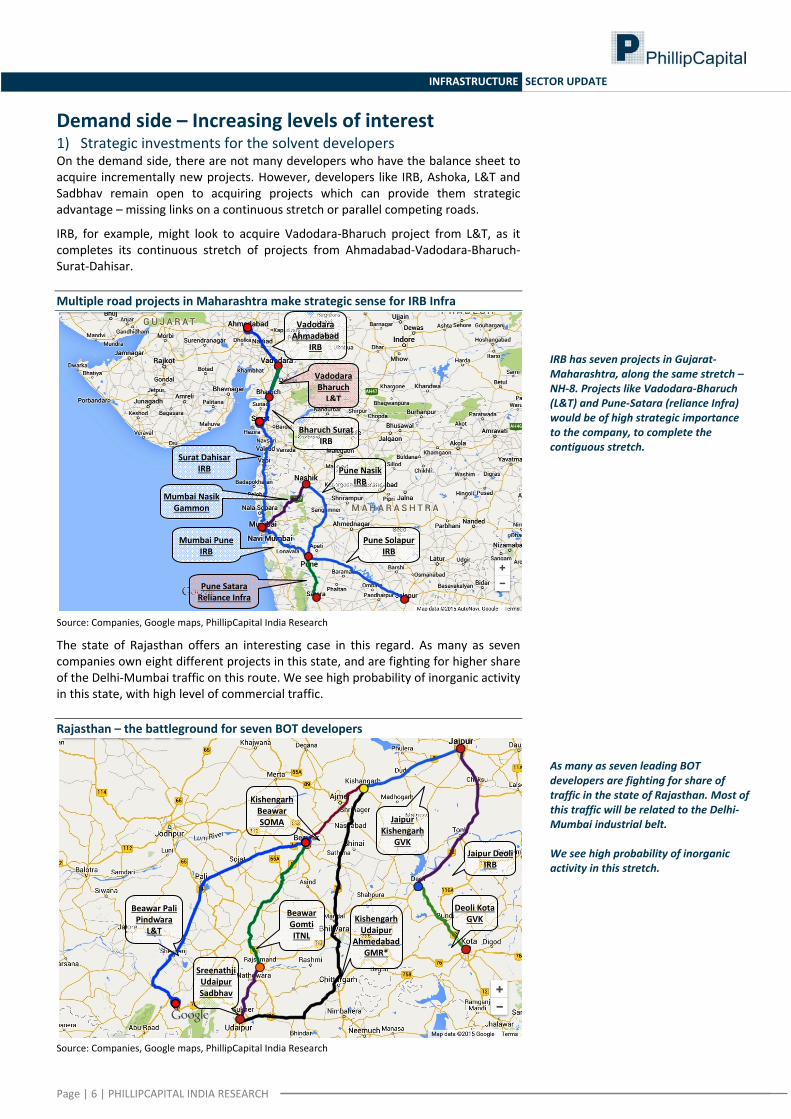
The state of Rajasthan offers an interesting case in this regard. As many as seven companies own eight different projects in this state, and are fighting for higher share of the Delhi‐Mumbai traffic on this route. We see high probability of inorganic activity in this state, with high level of commercial traffic.
Rajasthan – the battleground for seven BOT developers
Source: Companies, Google maps, PhillipCapital India Research
Deoli KotaGVK
Jaipur Kishengarh
GVK
Kishengarh Beawar SOMA
Beawar Pali Pindwara
L&T
Sreenathji Udaipur Sadbhav
Beawar Gomti ITNL
Kishengarh Udaipur
Ahmedabad GMR*
Jaipur DeoliIRB
Mumbai Nasik Gammon
Pune NasikIRB
Vadodara Ahmadabad
IRB
Vadodara Bharuch L&T
Bharuch SuratIRB
Surat Dahisar IRB
Pune SolapurIRB
Mumbai PuneIRB
Pune Satara Reliance Infra
As many as seven leading BOT developers are fighting for share of traffic in the state of Rajasthan. Most of this traffic will be related to the Delhi‐Mumbai industrial belt. We see high probability of inorganic activity in this stretch.
IRB has seven projects in Gujarat‐Maharashtra, along the same stretch – NH‐8. Projects like Vadodara‐Bharuch (L&T) and Pune‐Satara (reliance Infra) would be of high strategic importance to the company, to complete the contiguous stretch.

Page | 7 | PHILLIPCAPITAL INDIA RESEARCH
INFRASTRUCTURE SECTOR UPDATE
2) The PE players – knights in shining armor While the supply side of the inorganic activity looks attractive, it’s the demand side which appears short. Not many developers have the might or balance sheet to absorb the kind of supply we expect in the BOT space. Most BOT companies (with the exception of IRB Infra, Ashoka Buildcon and Sabhav Engg) have to fund equity commitments for their own portfolio – so the chances of them acquiring large no of these assets remain weak.
However, Private Equity funds – foreign and domestic, appear to have to the rescue of the willing sellers. Many PE funds, like IDFC, SBI‐Macquarie and Piramal Enterprises have been waiting at the sidelines for few years now – ready to deploy capital into infrastructure space, at the opportune time. They have been active on the M&A front in the BOT space – but the deals have been few, and far between. PE Funds – waiting at sidelines Company Fund size Existing investment in the road sectorIDFC Alternative Investment $ 3bn GMR Ullundurpet, HCC Nirmal Piramal Enterprises Rs 50bn Navyuga Road ProjectsSBI Macquarie Rs 12bn Ashoka Buildcon, GMR Jadcherla Xander Group $2 bn HCC Concessionaries, Sadbhav Infra Projects3i India Infra fund £ 1.1bn Supreme InfraTata Reality & Infrastructure $ 1bn Madhucon Agra Jaipur, IVRCL (3 projects)*
Source: PhillipCapital India Research (*Deal yet to be closed)
The current environment offers a perfect entry opportunity for these funds. • Most of the BOT assets are available at cheap valuations (less than 0.7x P/BV) –
on the back of low traffic growth, high interest rates and desperation of existing developers to exit.
• With the macro‐environment looking up, we can expect healthy traffic growth over the next three years.
• The interest rates are also expected to come down over the next two years – the first rate cuts having been recently announced.
The sector might also witness demand from an unanticipated source – global pension and sovereign funds. These funds typically operate on dividend/cash‐flow based models and invest in low‐risk, high yield, long‐term projects, that can provide stable cashflows for long durations. The BOT projects (operational) perfectly fit their investment criterion, especially with the macro‐environment looking up. We have already seen 2 such investment in the last few months: • Canada Pension funds invested Rs20bn in L&T IDPL • Holland’s APG has tied up with Piramal Enterprises to invest $1bn in
infrastructure projects Pension / Sovereign funds invested in India Fund Global fund size Existing investments in IndiaAbu Dhabi Investment Authority $ 773bn L&T, IDFC, HDFC, Infosys, Sun PharmaCanada Pension Fund $ 238bn Infosys, HDFC, ICICI, Tata Motors, WiproNorwegian Government Pension Fund* $ 850bn Coal India, GMR, GVK, Lanco, Reliance PowerSkandia Investments NA NTPC, PFC, Adani Ports, Reliance Power
Source: PhillipCapital India Research (*Sold large part of its investments in India recently)

Page | 8 | PHILLIPCAPITAL INDIA RESEARCH
INFRASTRUCTURE SECTOR UPDATE
BOT Portfolios – Rs 2 trillion investments at stake In this report, we analyse the BOT road portfolio of 21 largest players in the industry. Our analysis spans across 201 road projects, spread over 20 states, covering 17,500km and entailing an investment of ~Rs 2trillion. In our analysis, we have focused on data that would help determine two most important things: • Project specification – length, project cost, financial structure and tenure • Current project situation – toll collection While the first parameter is essential from project information perspective, the latter gives us the most important variable, to arrive at the project valuation. We note that these 200 projects would serve as more‐than sufficient sample space, for the entire BOT space. We have chosen 21 biggest players in this sector (listed and private), and most projects outside this space, would be the ones, owned by small local players. BOT Portfolio – Rs 2 trillion of investment at stake Company Projects Length Project Cost Debt Equity Toll collection # kms Rs mn Rs mn Rs mn Rs mn/dayIRB Infra 21 2,104 2,63,402 1,71,925 70,255 55ILFS Transport 26 2,831 3,29,859 2,39,933 59,316 42Sadbhav Engg. 13 1,042 1,15,727 82,622 22,688 21Ashoka Buildcon 9 804 95,890 70,658 21,502 17L&T IDPL 14 1,440 1,54,533 1,19,743 32,540 39Reliance Infra 11 967 1,14,200 74,000 32,200 26Gammon Infra 9 524 73,872 56,057 12,722 12GMR Infra 9 730 82,689 58,247 15,526 25GVK Power 3 275 26,344 18,525 5,710 8Lanco Infra 3 443 23,492 6,178 3,662 ‐Supreme Infra 10 482 44,040 32,607 11,433 4IVRCL Ltd 7 521 52,715 33,748 13,567 4NCC Ltd 5 250 29,410 19,036 8,513 10HCC Ltd 6 382 55,380 33,135 11,905 10Era Infra 6 388 54,226 36,550 9,966 15Madhucon 9 792 74,128 51,004 17,577 12Gayatri Projects 8 620 77,310 51,845 12,564 11Ramky Infra 7 642 77,977 58,935 14,988 13Essel Infra 7 632 81,204 32,117 10,607 3Transstroy 10 1,311 75,273 47,994 18,040 4Soma Enterprises 8 733 1,26,154 98,720 28,815 7Total 201 17,913 20,27,824 13,93,578 4,34,096 335
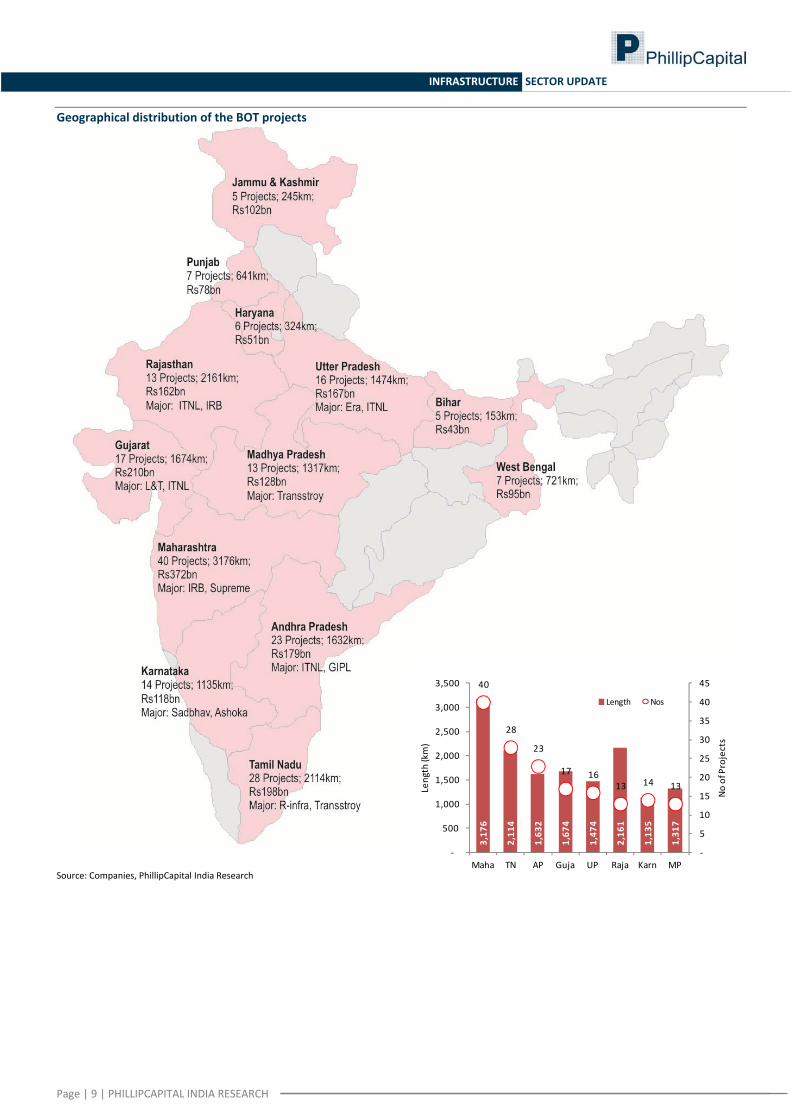
Source: Companies, PhillipCapital India Research Over analysis reveals that while 70 of the 201 projects are owned by BOT players focused on road sector, 50 projects are owned by asset owners with presence in other sectors like airport, power etc and 60 by EPC players, who joined the BOT bandwagon because of lack of orders from other segments. Also we find that the state of Maharashtra accounts for the maximum no of projects (40) – followed by Tamil Nadu (28), AP (23) and Gujarat (17). The capital investment for Maharashtra too stands way ahead of others at Rs 370bn, with Gujarat, TN and AP at Rs 210bn, Rs 198bn and Rs 180bn respectively. Amongst these 201 projects, 142 projects, entailing an investment of Rs 1.2trillion are already operational – while 59 other, entailing investment of Rs806bn are under construction. ITNL remains the biggest player in the BOT space, with 26 projects, followed by IRB Infra, L&T, Sadbhav Engineering and Reliance Infra.
Premier players in the BOT segment Asset owners with roads forming a small part of overall portfolio Predominantly EPC players, having ventured into BOT segment Private players
Page | 9 | PHILLIPCAPITAL INDIA RESEARCH
INFRASTRUCTURE SECTOR UPDATE
Geographical distribution of the BOT projects
Source: Companies, PhillipCapital India Research
3,17
6
2,11
4
1,63
2
1,67
4
1,47
4
2,16
1
1,13
5
1,31
7 40
28
23
17 16 13 14 13
‐
5
10
15
20
25
30
35
40
45
‐
500
1,000
1,500
2,000
2,500
3,000
3,500
Maha TN AP Guja UP Raja Karn MP
No of Projects
Length (km)
Length Nos

Page | 10 | PHILLIPCAPITAL INDIA RESEARCH
INFRASTRUCTURE SECTOR UPDATE
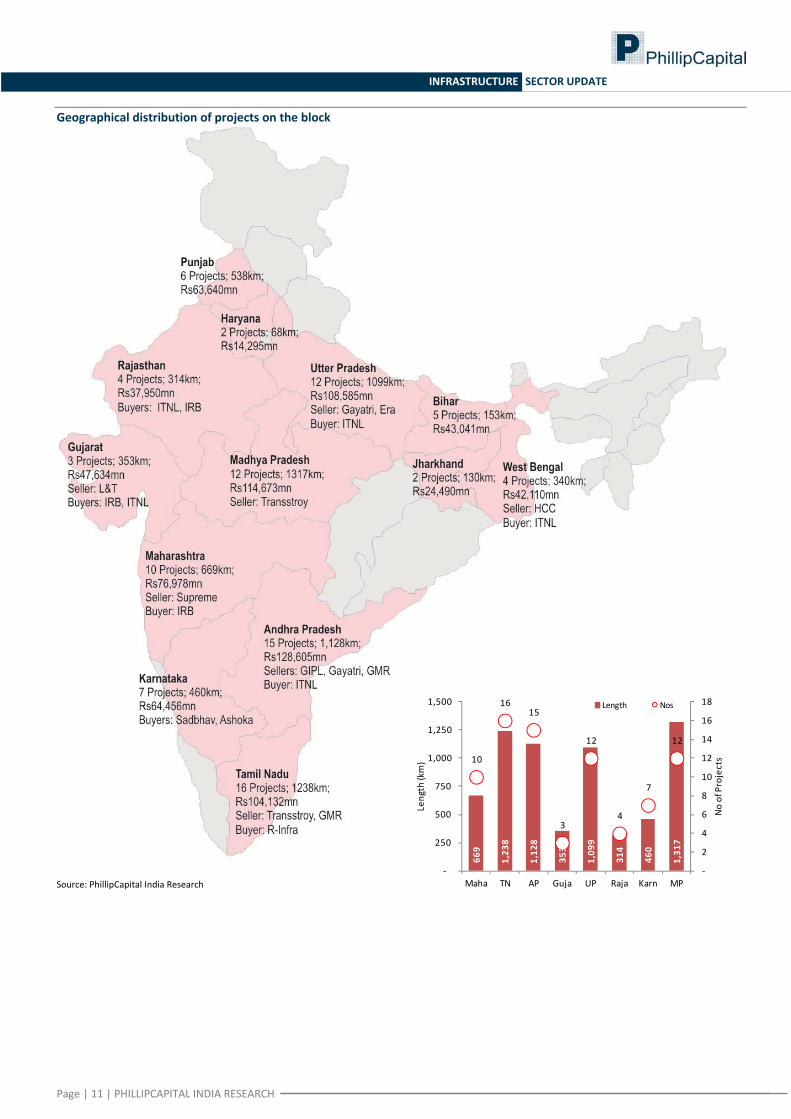
Projects on the block – Plentiful Our analysis reveals that in over 100 of the above projects, spanning 8136km of length and investment of Rs 910bn, the current developer is looking for partial/complete exit. 65 of these projects are already operational – and hence, would evince interest from developers as well as investment funds.
As expected, most of these projects (53%) are currently owned by the EPC players, who won these projects during the FY10‐14 period – which saw little activity in the other construction sectors (like Building, Irrigation and Power) and Road BOT was the only avenue left for them to grow their orderbooks.
We expect large number of these BOT projects, to change ownership, over the next three years. The majority of deals are expected to take place in operational projects – as they eliminate execution risk. On the back of this tendency, we also expect a pick‐up in execution of some of the under‐construction projects – the current developers would want to make those projects operational as soon as possible, so as to increase interest levels leading to their eventual exit. Almost 50% of the BOT projects are on the block Projects No of projects Length Investment km Rs mnUnlikely to be divested 58 5,903 7,07,461With already an investor in the parent portfolio 39 3,453 3,77,191Where majority stake has already been divested 4 221 20,802Most likely to be divested 100 8,336 9,22,371Total 201 17,913 20,27,824 EPC players own more than 50% of the projects on sale Asset Owners Listed EPC players Private players TotalNos 22 53 25 100Length (Km) 1,840 3,820 2,676 8,336Investment (Rs mn) 1,92,425 4,47,315 2,82,631 9,22,371 Almost 2/3rd of the projects on the block, are operational Likely to be divested Unlikely to be divested
Operational Under
Construction Total OperationalUnder
Construction TotalNos 65 35 100 44 14 58Length (Km) 4,703 3,633 8,336 4,208 1,695 5,903Investment (Rs mn) 5,01,437 4,20,934 9,22,371 4,18,660 2,88,801 7,07,461 Assets on the block – majority are owned by EPC players, and are already operational
Source:PhillipCapital India Research
1,840
3,820
2,676
192 447
283
22
53
25
‐
10
20
30
40
50
60
‐
1,000
2,000
3,000
4,000
Asset Owners Listed EPC players Private players
No of projects
Length (km)
Length (km) Investment (Rs bn) Nos
4,703
3,633
501 421
65
35
‐
10
20
30
40
50
60
70
‐
1,000
2,000
3,000
4,000
5,000
Operational Under Construction
No of projects
Length (km)
Length (km) Investment (Rs bn) Nos
Page | 11 | PHILLIPCAPITAL INDIA RESEARCH
INFRASTRUCTURE SECTOR UPDATE
Geographical distribution of projects on the block
Source: PhillipCapital India Research
669
1,23
8
1,12
8
353
1,09
9
314
460
1,31
7
10
16 15
3
12
4
7
12
‐
2
4
6
8
10
12
14
16
18
‐
250
500
750
1,000
1,250
1,500
Maha TN AP Guja UP Raja Karn MP
No of Projects
Length (km)
Length Nos

Page | 12 | PHILLIPCAPITAL INDIA RESEARCH
INFRASTRUCTURE SECTOR UPDATE
Regulatory barriers – significantly low, being lowered further Roads sector is the most mature sector in the entire infrastructure space, with a tightly wound model concession agreement and independent regulatory body. We believe the low regulatory risk, along with the friendly exit policy, make this sector highly attractive from M&A perspective. Exit Policy While the earlier regulation called for a developer to hold minimum 26% stake in the projects for its entire life, the new regulations (post implementation of B.K.Chaturvedi report) allow for complete exit after two years of operations. Exit policy for concessionaire Old regulation New regulation Mandatory for the winning bidder/consortium to hold: Holding criterion modified to: 51% stake during construction 51% stake during construction 33% for first three years of operations 26% for first two years of operations 26% thereafter, until the end Complete exit allowed thereafter
Source: PhillipCapital India Research NHAI now intends to make the exit policy even friendlier ‐ by allowing complete exit, right after construction. Ease of financing The road ministry, along with the Reserve Bank of India (RBI) is trying to make financing of the BOT projects easier for the developer. Some of the steps already taken are:
1) Premium rescheduling: It allows the developers to reschedule their premium payments, as promised in their winning bid, according to the cashflows of the projects, keeping the NPV of the premium same as before.
2) 5:25 scheme: It allows for developers to refinance their project debt, after tenure of 5 years, for as long as 25 years – will help the developers align their debt repayment cycle with the cashflow cycle of the projects.
3) RBI allows annuities and toll collection rights to be treated as tangible securities by banks, subject to the condition that banks’ right over them is legally enforceable and irrevocable – this helps bring down the borrowing cost, the debt being classified as ‘secured lending’.
Land acquisition and environmental clearance issues The road ministry, along with Ministry of Environment and Forests (MoEF) has tried to clear the logjam of road projects, stuck due to environmental clearance and land acquisitions: Some of the steps taken in that direction are:
1) Delinking of Environment and Forest clearance: Delinking of FC and EC has meant that the developer can start construction on the stretch of the road for which it does not require FC – while the process of obtaining the FC is being pursued.
2) Land acquisition: Provisions are being made to ensure that 100% land is acquired before a project is awarded. Currently 80% of land needs to be acquired for awarding a project – and it is generally the remaining 20%, which is difficult to acquire. The amendments to the land acquisition bill, currently being discussed in the parliament, will also help towards easing of land acquisition for road projects.

Page | 13 | PHILLIPCAPITAL INDIA RESEARCH
INFRASTRUCTURE SECTOR UPDATE
BOT Sector – Valuation triggers on the anvil Our expectations of Interest rates and Traffic growth over next 2 years
BOT companies (excl Sadbhav) have not yet seen the kind of surge in stock prices, as EPC companies
Infrastructure Sector – Valuation Table Company Mkt Cap CMP _____P/E_____ ___EV/EBITDA___ _____ROE_____ _____D/E_____ _____P/BV_____ Rs bn Rs FY16E FY17E FY16E FY17E FY16E FY17E FY16E FY17E FY16E FY17EAsset Owners GMR Infra 62.3 16 (4.0) (42.0) 18.2 11.3 (23.4) (2.3) 6.8 6.7 0.9 0.9GVK Power 12.6 8 (1.6) (3.4) 13.2 8.5 (55.7) (27.6) 16.5 17.9 0.9 0.9Adani Ports 650.0 314 23.2 19.0 18.3 14.9 20.1 20.0 0.6 0.5 4.7 3.8BOT Road Players IRB Infra 250 15.8 12.2 7.6 7.3 10.4 11.2 2.7 2.5 1.7 1.4 250Ashoka Buildcon 162 20.1 11.7 9.7 7.0 9.2 13.9 3.6 3.5 1.9 1.6 162Sadbhav Engineering* 59.3 342 38.7 29.2 16.6 13.9 10.6 12.6 4.0 ‐ 4.1 3.6ILFS Transportation* 46.9 192 8.8 8.1 10.5 9.6 8.5 8.6 3.4 ‐ 0.8 0.7EPC Companies NCC 53.9 97 18.3 12.5 9.8 7.9 8.4 11.0 0.6 0.5 1.5 1.4J Kumar 20.3 630 13.6 10.0 7.1 5.7 15.9 18.2 0.6 0.5 2.2 1.8KNR 11.3 402 13.7 10.7 7.1 5.7 12.6 14.0 0.1 0.0 1.7 1.5HCC 19.4 30 (36.8) ‐ 11.8 ‐ (4.1) ‐ 3.9 ‐ 1.5 ‐IVRCL 4.6 15 (1.2) ‐ 24.4 ‐ (55.5) ‐ 6.1 ‐ 0.6 ‐Gammon India 2.3 17 (1.0) ‐ 40.5 ‐ (21.9) ‐ 4.7 ‐ 0.2 ‐
Source: Bloomberg, PhillipCapital India Research (*Bloomberg estimates)
0%
50%
100%
150%
200%
250%
300%
350%
400%
6 months 1 year
6 and 12 month returns
Jkumar KNR NCC BSE
‐50%
0%
50%
100%
150%
200%
250%
300%
6 months 1 year
6 and 12 months returns
IRB Infra Ashoka Sadbhav ITNL BSE

Page | 14 | PHILLIPCAPITAL INDIA RESEARCH
INFRASTRUCTURE SECTOR UPDATE
Appendix The appendix section of this report contains the project details of the 201 BOT road projects in India – spread over 17,500km and entailing investment of Rs 2trillion. These 201 projects are owned by 21 developers, which include diversified asset owner, BOT road players, EPC companies and private road developers. Project details for each of the projects include: • Project specification:
o Length (km) o Type (Toll/Annuity) o Lanes (4/6/8) o Stake (%) o Commissioning date (date) o Concession Period (yrs)
• Financial structure: o Project Cost (Rs mn) o Debt (Rs mn) o Equity (Rs mn) o Grant/Premium (Rs mn)
• Status update: o Latest Toll Collection (Rs mn/day)
We believe this section will be extremely helpful in analysing the financial viability, valuation and status of the BOT projects and would serve as a useful compendium for the sector. Available on request, in hard copy format

Page | 15 | PHILLIPCAPITAL INDIA RESEARCH
INFRASTRUCTURE SECTOR UPDATE
gar
Compa
nies Sectio
n

INSTITUTIONAL EQUITY RESEARCH
Page | 16 | PHILLIPCAPITAL INDIA RESEARCH
IRB Infrastructure (IRB IN) Well placed to pluck the low hanging fruit INDIA | INFRASTRUCTURE | Company Update
26 March 2015
Biggest beneficiary of opening up of road awards: With its superior domain expertise and strong balance sheet, IRB looks well set to exploit an uptick in the highly lucrative roads sector, which is the first sector that the new government is likely to push in its drive to get infrastructure development back on track.
IRB should be one of the largest beneficiaries of this pipeline. It is one of the few BOT developers with a relatively strong balance sheet and appetite for grabbing more projects. Large numbers of road developers are currently under CDR (Isolux‐Soma, Gammon, IVRCL, HCC) or are divesting assets to deleverage their balance sheet (GMR, GVK, L&T IDPL). That reduces competition for IRB significantly.
Strong pick‐up in traffic growth across the portfolio: Over the last three quarters, IRB has reported robust growth in most of its major projects. Toll collections have reported growth of 22%, 25% and 25% in the first three quarters respectively. Adjusting for new projects and Mumbai‐Pune (18% tariff hike in April‐14), the “Like‐for‐like‐excl‐MPEW” toll collections have also reported strong growth of 19%, 25% and 19% over the last three quarters – implying a robust double‐digit growth in traffic.
We see the robust traffic growth in IRB’s portfolio as a testimony of the ‘high‐beta’ nature of the road projects in its portfolio. During the economic downturn of FY11‐14, IRB’s projects – which lie primarily in the industrial regions of Rajasthan, Gujarat and Maharashtra – reported lower growth than peers (like Ashoka). Now, with the economic cycle reviving, we expect its projects to benefit more than peers, and report higher traffic growth.
Shored up EPC orderbook means stability: IRB’s current orderbook stands at Rs110bn (Rs88bn adjusting for the O&M contracts and airport) – a robust 4.0x book‐to‐sales. This imparts high revenue visibility for the EPC division. It also means that while the company might report a decline in EPC revenues in FY15, its FY16 EPC revenues should jump by over 20% YoY.
The funding for the current portfolio is also not a concern for the company, as it can meet equity needs of all the new projects through internal accruals. Implementation of premium rescheduling for Vadodara‐Ahmedabad and Tumkur‐Chitradurga projects (already approved by NHAI) should also ease the financial burden on its cash reserves.
Outlook and Valuation: IRB’s stock has significantly underperformed the infrastructure sector (esp EPC players) over the last six months. It is currently trading at 12x FY17 P/E and we see significant upside in the stock, on the back of the quality of its BOT portfolio, strong EPC revenue visibility, and potential to win future projects from NHAI’s order pipeline. While the outcome of the RTI activist murder investigation remains a key risk, we believe that a large part of the potential negative impact has already been priced in.
We also note that IRB’s valuation is highly sensitive to interest rate and traffic growth. A 1% increase in traffic growth along with 1% decrease in interest rate, leads to 20% increase in our SoTP valuation. We believe that we are currently at the peak of interest rate cycle, and at bottom of traffic growth cycle. As economic activity picks up, we expect both of the above to reverse, simultaneously, over the next few quarters – significantly benefitting companies like IRB.
At current levels, we see the risk‐reward profile as highly favorable. We maintain BUY, with a price target of Rs 336 (BOT Rs 235 + EPC Rs 101), representing 34% upside from current levels.
BUY (Maintain) CMP RS 250 TARGET RS 336 (+34%) COMPANY DATA O/S SHARES (MN) : 332MARKET CAP (RSBN) : 82MARKET CAP (USDBN) : 1.352 ‐ WK HI/LO (RS) : 289 / 95LIQUIDITY 3M (USDMN) : 11.8PAR VALUE (RS) : 10 SHARE HOLDING PATTERN, % PROMOTERS : 61.1FII / NRI : 24.9FI / MF : 6.5NON PROMOTER CORP. HOLDINGS : 2.7PUBLIC & OTHERS : 4.8 PRICE PERFORMANCE, %
1MTH 3MTH 1YRABS ‐1.8 ‐1.0 154.9REL TO BSE 0.9 ‐4.8 126.9 PRICE VS. SENSEX
Source: Phillip Capital India Research KEY FINANCIALS Rs mn FY14 FY15E FY16E FY17ENet Sales 37,319 39,106 52,441 56,728EBIDTA 17,537 22,520 28,803 31,954Net Profit 4,591 5,768 5,237 6,788EPS, Rs 13.8 17.4 15.8 20.4PER, x 17.7 14.1 15.5 12.0EV/EBIDTA, x 10.1 8.8 7.5 7.2P/BV, x 2.3 2.0 1.6 1.3ROE, % 12.9 13.8 10.4 11.2Debt/Equity (x) 3.1 3.0 2.7 2.5
Source: PhillipCapital India Research Est. Vibhor Singhal (+ 9122 6667 9949) [email protected]
10
40
70
100
130
160
Apr‐11 Mar‐12 Feb‐13 Jan‐14 Dec‐14
IRB Infra (LHS) BSE Sensex

Page | 17 | PHILLIPCAPITAL INDIA RESEARCH
IRB INFRASTRUCTURE COMPANY UPDATE
Robust toll collection growth over last three quarters Gross Toll Revenue 1QFY15 2QFY15 3QFY15 YoY QoQ Surat ‐ Dahisar 1,316 1,314 1,453 14% 11% Mumbai ‐ Pune 1,352 1,361 1,474 34% 8% Tumkur ‐ Chitradurga 447 450 467 10% 4% Bharuch ‐ Surat 438 449 487 14% 8% Vadodara Ahmedabad 360 350 423 30% 21% Talegaon‐Amravati 129 105 110 53% 5% Others 832 889 1,057 39% 19% Total toll collection 4,874 4,918 5,471 25% 11% Like for like toll collection 4,872 4,906 5,379 23% 10% Like for like excl Mumbai‐Pune 3,520 3,545 3,905 20% 10%
Total toll collection growth 22% 25% 25% Like for like toll collection growth 22% 25% 23% Like for like growth excl Mumbai‐Pune 21% 25% 20%
Source: PhillipCapital India Research Valuation sensitivity to Interest rate and Traffic growth rate Price Target Change in Traffic Growth Rate
336 ‐2.0% ‐1.0% 0.0% 1.0% 2.0%
Change in Interest Rate
2.0% 213 253 298 343 387
1.0% 232 273 317 363 407
0.0% 252 293 336 382 426
‐1.0% 273 313 357 402 446
‐2.0% 293 333 377 422 466
Source: PhillipCapital India Research SOTP Valuation
DCF Valuation Project Cost
(Rs mn) Length (kms)
Equity Value (Rs mn)
Per share (Rs)
Operational BOT Projects NPV @ 13% CoESmaller Operational Projects 3,275 187 3,445 10.0Thane‐GHB 2,469 15 1,717 5.2 Mumbai‐Pune 13,017 95 11,148 33.5 Bharuch‐Surat 14,700 65 6,044 18.2 Surat‐Dahisar* 25,372 239 3,161 9.5 MVR 3,076 68 3,086 9.3 Total Value 61,909 601 28,601 86.1 Recently commissioned projects NPV @ 13% CoEKolhapur 4,300 50 3,594 10.8 Talegaon ‐Amravati 8,880 67 3,524 10.6 Jaipur ‐ Deoli 17,330 149 8,063 24.3 Amritsar ‐ Pathankot 14,453 102 8,582 25.8 Tumkur ‐ Chitradurga 11,420 114 6,665 20.1 Vadodara ‐ Ahmedabad 48,800 196 6,589 19.8 Total Value 1,05,183 678 37,017 111.4 New projects NPV @ 15% CoEGoa ‐ Kundapur 21,030 192 5,711 17.2Solapur Yedeshi 13,030 99 2,731 8.2Yedeshi Aurangabad 26,420 190 2,348 7.1Kaithal ‐ Rajasthan 20,660 166 1,770 5.3Total Value 81,140 647 12,560 37.8E&C Business 6x FY16E EV/EBITDAFY16E EBITDA 9,234 Assumed EV/EBITDA 6.0 Value to IRB 55,404 166.7 Others (Net Cash) (21,610) (65.0)Price Target 1,11,787 336.0 Source: PhillipCapital India Research
IRB’s stock remains highly sensitive to Interest rate and Traffic growth rate – 1% change in both leads to 20% increase in valuation

Page | 18 | PHILLIPCAPITAL INDIA RESEARCH
IRB INFRASTRUCTURE COMPANY UPDATE
Financials
Income Statement Y/E Mar, Rs mn FY14 FY15e FY16e FY17eNet sales 37,319 39,106 52,441 56,728Growth, % 1 5 34 8Total income 37,319 39,106 52,441 56,728Raw material expenses ‐16,501 ‐13,656 ‐19,709 ‐20,524Employee expenses ‐1,799 ‐1,719 ‐2,305 ‐2,493Other Operating expenses ‐1,482 ‐1,211 ‐1,625 ‐1,757EBITDA (Core) 17,537 22,520 28,803 31,954Growth, % 7.4 28.4 27.9 10.9Margin, % 47.0 57.6 54.9 56.3Depreciation ‐4,771 ‐7,167 ‐9,138 ‐10,501EBIT 12,766 15,353 19,665 21,453Growth, % 7.1 20.3 28.1 9.1Margin, % 34.2 39.3 37.5 37.8Interest paid ‐7,562 ‐9,127 ‐12,435 ‐12,385Pre‐tax profit 6,419 7,349 8,206 10,117Tax provided ‐1,823 ‐1,577 ‐2,964 ‐3,324Profit after tax 4,596 5,773 5,242 6,793Others (Minorities, Associates) ‐5 ‐5 ‐5 ‐5Net Profit 4,591 5,768 5,237 6,788Growth, % (17.5) 25.6 (9.2) 29.6Unadj. shares (m) 332 332 332 332Wtd avg shares (m) 332 332 332 332 Balance Sheet Y/E Mar, Rs mn FY14 FY15e FY16e FY17eCash & bank 15,012 6,150 3,186 1,115Debtors 55 59 79 85Inventory 2,683 2,571 3,161 3,419Loans & advances 8,519 9,643 12,931 13,211Other current assets 212 212 212 212Total current assets 26,481 18,634 19,569 18,042Investments 145 145 145 145Gross fixed assets 1,05,855 3,12,708 3,13,008 3,13,308Less: Depreciation ‐20,311 ‐27,478 ‐36,616 ‐47,117Add: Capital WIP 44,867 75,518 1,08,720 1,42,712Net fixed assets 1,30,411 3,60,748 3,85,112 4,08,903Total assets 1,57,119 3,79,608 4,04,907 4,27,172
Current liabilities 10,090 9,622 13,147 14,134Total current liabilities 10,090 9,622 13,147 14,134Non‐current liabilities 1,11,065 3,27,915 3,41,122 3,52,071Total liabilities 1,21,156 3,37,537 3,54,269 3,66,205Paid‐up capital 3,324 3,324 3,324 3,324Reserves & surplus 32,283 38,387 46,949 57,272Shareholders’ equity 35,963 42,072 50,638 60,967Total equity & liabilities 1,57,119 3,79,608 4,04,907 4,27,172 Source: Company, PhillipCapital India Research Estimates
Cash Flow FY14 FY15e FY16e FY17e
Pre‐tax profit 6,419 7,349 8,206 10,117Depreciation 4,771 7,167 9,138 10,501Chg in working capital 710 2,02,926 ‐1,624 ‐1,880Total tax paid ‐1,938 ‐1,577 ‐2,964 ‐3,324Cash flow from operating activities 9,962 2,15,866 12,756 15,415Capital expenditure ‐30,934 ‐2,37,504 ‐33,502 ‐34,292Chg in investments 475 0 0 0Cash flow from investing activities ‐30,459 ‐2,37,504 ‐33,502 ‐34,292Free cash flow ‐20,497 ‐21,638 ‐20,746 ‐18,877Equity raised/(repaid) 391 1,892 4,880 5,091Debt raised/(repaid) 23,080 12,440 14,459 13,271Dividend (incl. tax) ‐1,555 ‐1,555 ‐1,555 ‐1,555Other financing activities ‐376 0 0 0Cash flow from financing activities 20,799 12,776 17,783 16,806Net chg in cash 302 ‐8,862 ‐2,963 ‐2,071 Valuation Ratios
FY14 FY15e FY16e FY17ePer Share data EPS (INR) 13.8 17.4 15.8 20.4Growth, % (17.5) 25.6 (9.2) 29.6Book NAV/share (INR) 107.1 125.5 151.3 182.3FDEPS (INR) 13.8 17.4 15.8 20.4CEPS (INR) 28.2 38.9 43.3 52.0CFPS (INR) 26.3 646.1 35.4 43.2DPS (INR) 4.0 4.0 4.0 4.0Return ratios Return on assets (%) 6.5 4.3 3.4 3.5Return on equity (%) 12.9 13.8 10.4 11.2Return on capital employed (%) 7.0 4.5 3.5 3.6Turnover ratios Asset turnover (x) 0.3 0.3 0.3 0.3Sales/Total assets (x) 0.3 0.1 0.1 0.1Sales/Net FA (x) 0.3 0.2 0.1 0.1Working capital/Sales (x) 0.0 0.1 0.1 0.0Receivable days 0.5 0.6 0.6 0.6Inventory days 26.2 24.0 22.0 22.0Payable days 132.9 148.2 158.4 165.7Working capital days 13.5 26.7 22.5 18.0Liquidity ratios Current ratio (x) 2.6 1.9 1.5 1.3Quick ratio (x) 2.4 1.7 1.2 1.0Interest cover (x) 1.7 1.7 1.6 1.7Dividend cover (x) 3.5 4.3 3.9 5.1Total debt/Equity (x) 3.1 3.0 2.7 2.5Net debt/Equity (x) 2.7 2.8 2.7 2.5Valuation PER (x) 17.7 14.1 15.5 12.0Price/Book (x) 2.3 2.0 1.6 1.3EV/Net sales (x) 4.7 5.1 4.1 4.1EV/EBITDA (x) 10.1 8.8 7.5 7.2EV/EBIT (x) 13.9 12.9 11.0 10.8

INSTITUTIONAL EQUITY RESEARCH
Page | 19 | PHILLIPCAPITAL INDIA RESEARCH
Ashoka Buildcon (ASBL IN) Set to ride the NHAI wave INDIA | INFRASTRUCTURE | Company Update
26 March 2015
Coveted BOT portolfio: Ashoka Builcon is one of the few companies that has not seen significant traffic decline in most of its BOT projects. It has 9 projects on the NH‐6 (Surat‐Kolkata highway) where the traffic decline has been much lower than other prominent highways like NH‐8 (Mumbai‐Delhi) and NH‐4 (Mumbai‐Bengaluru). We view that a testimony to the quality of its BOT portfolio, which should ensure healthy returns over the life of its projects.
Funding no longer a concern: Ashoka Buildcon has got itself into a unique position, where it should be comfortably able to manage the equity requirement for its current and future project wins, over the next three years. Its divestment of 34% stake in ACL to SBI‐Macquarie has taken care of the equity requirements of its current portfolio. It also means that SBI‐Macquarie will finance 34% of the equity needs of its future projects. Its ABL BOT portfolio generates Rs 1.3bn of free cash flow every year. That coupled with Rs 2.3bn of EBITDA from the EPC division means the company can comfortably finance projects up to Rs 30bn (~300km) without needing any external funding. This places it in a significantly superior position to exploit the huge opportunity in the roads segment.
Well set to bite big into the low hanging fruit: Ashoka is one of the few BOT developers with a relatively strong balance sheet and appetite for grabbing more projects. Large numbers of road developers are currently under CDR (Isolux‐Soma, Gammon, IVRCL, HCC) or are divesting assets to deleverage their balance sheet (GMR, GVK, L&T IDPL). That reduces competition for Ashoka Buildcon significantly.
NHAI is expected to award 20,000km of road projects over the next two years – 70% as EPC contracts. That would translate into a huge opportunity for the entire EPC sector (companies like L&T, NCC, KNR, HCC) and BOT companies (like IRB, Ashoka, Sadbhav). Companies, like Ashoka and Sadbhav, will be the biggest beneficiaries in our opinion, as they will be able to bid for and benefit from both the segments – EPC as well as BOT. EPC orderbook – minor concern: The EPC orderbook for the company currently stands at Rs33.8bn – 1.9x book‐to‐sales – relatively lower than its peers. If the company does not win a decent sized project in the next few months, its EPC revenue growth for FY16 could come under pressure. However, with the strong pipeline of EPC awards expected from NHAI over the next two years, we believe the company will be able to grab significant projects to pacify these concerns. Outlook and Valuation: We view the company as having a fundamentally superior profile and strong execution track record in the roads segment. While its EPC orderbook at 1.9x book‐to‐sales provides low revenue visibility for the division – we expect the same to be cleared over the next few months, with the robust order award pipeline from NHAI on the anvil. Ashoka, like Sadbhav, will be one of the few companies to benefit from order awards from both the EPC and BOT segments.
At current levels the stock appears fairly inexpensive, currently trading at 11.5x FY17 P/E, inline with IRB Infra. We upgrade our target multiple for the EPC division to 6x FY17E EV/EBITDA (earlier 5x) – on the back of the robust order ward pipeline form NHAI and the higher allocation for roads in the FY16 Union Budget. Our revised price target of Rs191 (earlier Rs162) offers 18% upside from current levels. We upgrade to BUY.
Upgrade to BUY CMP RS 162 TARGET RS 191 (+18%) COMPANY DATA O/S SHARES (MN) : 247MARKET CAP (RSBN) : 40MARKET CAP (USDBN) : 0.652 ‐ WK HI/LO (RS) : 257 / 113LIQUIDITY 3M (USDMN) : 1.0PAR VALUE (RS) : 10 SHARE HOLDING PATTERN, % PROMOTERS : 67.5FII / NRI : 3.9FI / MF : 12.4NON PROMOTER CORP. HOLDINGS : 8.0PUBLIC & OTHERS : 8.2 PRICE PERFORMANCE, %
1MTH 3MTH 1YRABS ‐8.7 11.3 67.6REL TO BSE ‐6.0 7.6 39.6 PRICE VS. SENSEX
Source: Phillip Capital India Research KEY FINANCIALS Rs mn FY14 FY15E FY16E FY17ENet Sales 17,949 20,526 29,228 38,163EBIDTA 3,945 4,766 7,730 11,284Net Profit 1,084 541 1,272 2,195EPS, Rs 6.9 3.4 8.1 13.9PER, x 23.3 46.7 19.9 11.5EV/EBIDTA, x 14.5 14.6 9.7 7.0P/BV, x 2.0 2.0 1.8 1.6ROE, % 8.7 4.2 9.2 13.9Debt/Equity (x) 2.6 3.5 3.6 3.5
Source: PhillipCapital India Research Est. Vibhor Singhal (+ 9122 6667 9949) [email protected]
04080
120160200240
Apr‐11Feb‐12Dec‐12Oct‐13Aug‐14
Ashoka Buildcon BSE Sensex

Page | 20 | PHILLIPCAPITAL INDIA RESEARCH
ASHOKA BUILDCON COMPANY UPDATE
Toll collections have been steady Orderbook visibility has declined over last three quarters
Project funding – not a significant constraint Particulars Rs mn Assumption Project length (km) 300Project cost 30,000 Rs 100mn per km Debt 21,000 70:30 Debt:Equity Equity required 9,000SBI McQuarie contribution 3,060 SBI‐McQ stake of 34% Ashoka Total Contribution 5,940Ashoka Annual Contribution 2,376 2.5 years of construction period ABL Annual EBITDA 1,268 75% EBITDA Margins EPC EBITDA 2,274 FY14 number Surplus 1,166 SoTP Valuation
Project Equity Value (Rs mn) Stake (%)
Ashoka Equity Value (Rs mn)
Per Share (Rs)
ABL BOT Projects 3x FCFE of 18 BOT ProjectsCumulative OCF for 3 years 4,844 4,844 30.7Gross debt (1,133) (1,133) (7.2)
Value to Ashoka Buildcon 3,711 3,711 23.5
EPC Division 6x FY17 EV/EBITDAEPC division 3,852 6.0 23,110 146.3Net cash at parent level (4,193) (4,193) (26.5)
Value to Ashoka Buildcon 18,917 18,917 119.8
ACL BOT Projects NPV @ 13% CoE Bhandara 1,498 51 764 4.8Jarora Nayagaon 5,760 38 2,172 13.7Belgaum Dharwad 2,281 100 2,281 14.4Pimpalgaon Nasik Gonde (3,660) 26 (952) (6.0)Durg bypass 2,297 51 1,171 7.4Sambalpur baragarh 3,624 100 3,624 22.9Dhankuni Kharagpur 4,145 100 4,145 26.2Chennai ORR 1,892 50 946 6.0Total 17,836 14,151 89.6Holding company discount 20% 11,321 71.7
Value to Ashoka Buildcon 66.0% 7,472 47.3
Total value of Ashoka Buildcon 30,099 191.0
Source: Company, PhillipCapital India Research
527 406
500 585
709 606 597
1,341 1,293 1,333 1,380 1,469 1,490
1,656
‐
200
400
600
800
1,000
1,200
1,400
1,600
1,800 1Q
FY14
2QFY14
3QFY14
4QFY14
1QFY15
2QFY15
3QFY15
Toll Co
llection (Rs m
n)
ABL Toll Collection ACL Toll Collection
‐
0.5
1.0
1.5
2.0
2.5
3.0
‐
5
10
15
20
25
30
35
40
45
50
1QFY14
2QFY14
3QFY14
4QFY14
1QFY15
2QFY15
3QFY15
Book
to Sales (x)
Orderbo
ok (Rs b
n)
Orderbook Book to Sales
We value ABL’s BOT portfolio at 3x FY15FCFE, with only 3 years of average useful life remaining for the projects, and expected increase in FCFE assumed to be equivalent to the discount rate
We value the EPC division at 6x FY16E EV/EBITDA, inline with IRB Infra We provide a 20% holding company discount to the valuation of ACL

Page | 21 | PHILLIPCAPITAL INDIA RESEARCH
ASHOKA BUILDCON COMPANY UPDATE
Financials
Income Statement Y/E Mar, Rs mn FY14 FY15e FY16e FY17eNet sales 17,949 20,526 29,228 38,163Growth, % ‐3 14 42 31Total income 17,949 20,526 29,228 38,163Raw material expenses 0 0 0 0Employee expenses ‐583 ‐665 ‐947 ‐1,237Other Operating expenses ‐13,421 ‐15,096 ‐20,550 ‐25,641EBITDA (Core) 3,945 4,766 7,730 11,284Growth, % 6.1 20.8 62.2 46.0Margin, % 22.0 23.2 26.4 29.6Depreciation ‐1,389 ‐1,577 ‐2,118 ‐3,019EBIT 2,556 3,188 5,612 8,266Growth, % 6.7 24.7 76.0 47.3Margin, % 14.2 15.5 19.2 21.7Interest paid ‐1,335 ‐2,551 ‐4,429 ‐5,443Pre‐tax profit 1,237 503 1,161 2,852Tax provided ‐688 ‐688 ‐885 ‐1,286Profit after tax 549 ‐185 276 1,566Others (Minorities, Associates) 425 726 996 629Net Profit 975 541 1,272 2,195Growth, % 13.9 (50.1) 135.1 72.6Unadj. shares (m) 158 158 158 158Wtd avg shares (m) 158 158 158 158 Balance Sheet Y/E Mar, Rs mn FY14 FY15e FY16e FY17eCash & bank 945 1,029 877 1,165Debtors 1,305 1,406 2,002 2,614Inventory 6,272 7,029 9,609 12,547Loans & advances 3,087 3,374 4,805 6,273Other current assets 835 835 835 835Total current assets 12,444 13,674 18,127 23,435Investments 2,847 2,847 2,847 2,847Gross fixed assets 20,275 53,795 53,845 53,895Less: Depreciation ‐6,664 ‐8,241 ‐10,359 ‐13,377Add: Capital WIP 1,06,260 85,871 92,063 97,863Net fixed assets 1,19,871 1,31,425 1,35,549 1,38,380Total assets 1,35,183 1,47,966 1,56,543 1,64,682
Current liabilities 85,077 84,319 86,417 88,574Total current liabilities 85,077 84,319 86,417 88,574Non‐current liabilities 32,981 45,218 50,432 54,455Total liabilities 1,18,058 1,29,537 1,36,849 1,43,030Paid‐up capital 790 790 790 790Reserves & surplus 11,690 11,994 13,029 14,987Shareholders’ equity 17,125 18,429 19,694 21,653Total equity & liabilities 1,35,183 1,47,966 1,56,543 1,64,682 Source: Company, PhillipCapital India Research Estimates
Cash Flow FY14 FY15e FY16e FY17e
Pre‐tax profit 1,237 503 1,161 2,852Depreciation 1,389 1,577 2,118 3,019Chg in working capital ‐3,041 ‐1,904 ‐2,508 ‐2,861Total tax paid ‐702 ‐688 ‐885 ‐1,286Cash flow from operating activities ‐1,116 ‐511 ‐114 1,724Capital expenditure ‐10,161 ‐13,131 ‐6,242 ‐5,850Chg in investments ‐23 0 0 0Cash flow from investing activities ‐10,184 ‐13,131 ‐6,242 ‐5,850Free cash flow ‐11,299 ‐13,642 ‐6,356 ‐4,126Equity raised/(repaid) 1,384 0 0 0Debt raised/(repaid) 8,297 12,237 5,214 4,023Other financing activities 0 0 0 0Cash flow from financing activities 11,727 13,726 6,203 4,415Net chg in cash 428 84 ‐153 289 Valuation Ratios
FY14 FY15e FY16e FY17ePer Share data EPS (INR) 6.9 3.4 8.1 13.9Growth, % (62.0) (50.1) 135.1 72.6Book NAV/share (INR) 79.0 80.9 87.5 99.9FDEPS (INR) 6.8 3.4 8.1 13.9CEPS (INR) 16.7 13.4 21.5 33.0CFPS (INR) (8.2) (2.4) (0.6) 10.7Return ratios Return on assets (%) 1.1 1.0 2.0 3.1Return on equity (%) 8.7 4.2 9.2 13.9Return on capital employed (%) 3.2 2.5 4.6 6.8Turnover ratios Asset turnover (x) 0.4 0.4 0.5 0.6Sales/Total assets (x) 0.1 0.1 0.2 0.2Sales/Net FA (x) 0.2 0.2 0.2 0.3Working capital days ‐ ‐ ‐ ‐Liquidity ratios Current ratio (x) 0.1 0.2 0.2 0.3Quick ratio (x) 0.1 0.1 0.1 0.1Interest cover (x) 1.9 1.2 1.3 1.5Total debt/Equity (x) 2.6 3.5 3.6 3.5Net debt/Equity (x) 2.6 3.5 3.6 3.4Valuation PER (x) 23.3 46.7 19.9 11.5Price/Book (x) 2.0 2.0 1.8 1.6EV/Net sales (x) 3.2 3.4 2.6 2.1EV/EBITDA (x) 14.5 14.6 9.7 7.0EV/EBIT (x) 22.4 21.8 13.3 9.5
INSTITUTIONAL EQUITY RESEARCH
Page | 22 | PHILLIPCAPITAL INDIA RESEARCH
Sadbhav Engineering (SADE IN) Valuations ahead of fundamentals INDIA | INFRASTRUCTURE | Company Update
26 March 2015
Over the last few years, Sadbhav Engineering (SADE) has transformed into one of the largest BOT developers in the country. It currently has a portfolio of 13 projects, spread across 1042km and entailing investment of Rs 114trn. Nine of these projects are already operations, and generate Rs 1.4bn of quarterly toll collections. Its EPC orderbook stands at Rs82.4bn (3x book‐to‐sales) – spread across roads, irrigation and mining – providing high revenue visibility for the next three years.
SADE recently completed its QIP, raising Rs2.5bn to fund the capex and working capital requirements of the parent company. The company is also planning an IPO of its BOT division – Sadbhav Infrastructure Pvt Ltd (SIPL). The proceeds of the IPO will be utilized to repay holding company debt at SIPL level, fund equity requirement for under‐construction projects and provide partial exit to PE investors (Xander Group and Norwest Ventures), which have 23% stake in SIPL.
Well set to bite big into the low hanging fruit: Sadbhav is one of the few BOT developers with a decent appetite for grabbing more projects. Large numbers of road developers are currently under CDR (Isolux‐Soma, Gammon, IVRCL, HCC) or are divesting assets to deleverage their balance sheet (GMR, GVK, L&T IDPL). That reduces competition for Sadbhav significantly.
NHAI is expected to award 20,000km of road projects over the next two years – 70% as EPC contracts. That would translate into a huge opportunity for the entire EPC sector (companies like L&T, NCC, KNR, HCC) and BOT companies (like IRB, Ashoka, Sadbhav). Companies, like Ashoka and Sadbhav, will be the biggest beneficiaries in our opinion, as they will be able to bid for and benefit from both the segments – EPC as well as BOT.
BOT funding not a major concern, balance sheet is: Sadbhav requires Rs2bn of equity investment into its current BOT portfolio over the next three years – which should be easily met with the current cash balance (Rs500mn), IPO proceeds and the internal accruals over the next two years.
However, the leverage for the company – especially at standalone level, remains a concern. The standalone debt for the company stands at Rs10.5bn (1.0x D/E) and consolidated debt at Rs54.5bn (3.8x D/E). The company intends to use the proceeds from the SIPL IPO, to payback debt at SIPL holdco level. But even after that, the company will not be left with any growth capital – and might not be able to capitalize the huge opportunity in the roads segment – both in EPC and BOT form.
Expensive valuations: Sadbhav’s stock has run up significantly over the last few months (6m‐57%, 12m‐290%) and has significantly outperformed its infrastructure peers (BOT as well as EPC). Assuming 6x EV/EBITDA for the EPC division (inline with IRB Infra and Ashoka Buildcon), the current stock price attributes 4.3x P/BV to the BOT division (not accounting for the proposed IPO) – extremely high in our opinion. The implicit valuation multiples for IRB and Ashoka, assuming the same 6x EV/EBITDA for the EPC division, stand at 0.67x and 0.98x respectively.
We view the current valuations as highly expensive, and out‐of‐sync with the combined earnings potential of the BOT and EPC division. Also while the current balance sheet can support equity funding of the current portfolio – how the company is able to fund future growth, remains a key concern.
NOT RATED CMP RS 341 COMPANY DATA O/S SHARES (MN) : 172MARKET CAP (RSBN) : 61MARKET CAP (USDBN) : 1.052 ‐ WK HI/LO (RS) : 385 / 88LIQUIDITY 3M (USDMN) : 1.5PAR VALUE (RS) : 1 SHARE HOLDING PATTERN, % PROMOTERS : 47.12FII / NRI : 15.4FI / MF : 24.99NON PROMOTER CORP. HOLDINGS : 0PUBLIC & OTHERS : 12.49 PRICE PERFORMANCE, %
1MTH 3MTH 1YRABS 13.2 42.5 294.2REL TO BSE 15.8 38.7 266.2 PRICE VS. SENSEX
Source: Phillip Capital India Research KEY FINANCIALS Rs mn FY11 FY12 FY13 FY14Net Sales 23,296 28,663 21,596 27,325EBIDTA 3,335 4,144 3,941 4,456Net Profit 928 1,223 75 444EPS, Rs 6.2 8.1 0.5 2.9PER, x 55.5 42.3 697.3 117.0EV/EBIDTA, x 21.1 20.5 24.6 24.2P/BV, x 5.9 4.4 4.3 4.1ROE, % 10.6 10.4 0.6 3.5Debt/Equity (x) 2.3 3.0 3.8 4.5
Source: PhillipCapital India Research Est. Vibhor Singhal (+ 9122 6667 9949) [email protected]
50
100
150
200
250
300
350
Apr‐11Feb‐12Dec‐12Oct‐13Aug‐14
Sadbhav Engg BSE Sensex

Page | 23 | PHILLIPCAPITAL INDIA RESEARCH
SADBHAV ENGINEERING COMPANY UPDATE
Sadbhav’s CMP implies 4.3x book‐value to its BOT portfolio Particular Rs mn Per Share Assumption Current Market Cap 60,025 350.00
EPC Valuation* 22,060 128.63 6x EV/EBITDA – inline with IRB Infra Debt at SIPL level 5,000 29.15
Implicit BOT Value 42,965 250.52 Adjusting for Holdco Discount 53,706 313.16 20% Holding company discount Adjusting for PE stake 69,748 406.70 23% stake of PE Investors
Book Value of BOT portfolio 16,201 94.47 Implicit P/BV for Sadbhav 4.31 4.31 Implicit P/BV for IRB Infra 0.67 Implicit P/BV for Ashoka 0.98
Source: Company, Bloomberg, PhillipCapital India Research (*Based on consensus estimates for FY17) Toll collection growth has been decent over last three quarters Quarterly Toll collection 1QFY15 2QFY15 3QFY15 YoY QoQ Ahmedabad Ring road 188.4 202.7 223.0 18% 10% Aurangabad Jalna 85.4 79.1 92.8 106% 17% Bijapur Hungund 255.2 259.6 254.6 10% ‐2% Hyderabad Yadgiri 111.4 106.0 112.7 16% 6% Maharashtra Border Check Post 196.1 222.0 237.7 212% 7% Dhule Palasner 338.9 317.3 335.1 7% 6% Rohtak Panipat 217.4 199.2 210.2 6% Total Toll Collection 1,392.8 1,385.9 1,466.1 54% 6% Like for like toll collection 979.3 964.7 1,018.2 Like for like Growth 19% 16% 16%
Source: Company, PhillipCapital India Research EPC orderbook visibility has remained high … … and margins largely stable
Source: Company, PhillipCapital India Research
‐
1.0
2.0
3.0
4.0
5.0
6.0
7.0
‐
20.0
40.0
60.0
80.0
100.0
120.0
FY10 FY11 FY12 FY13 FY14
Bok to Sales (x)
Orderbo
ok (Rs b
n)
Orderbook (Rs bn) Book‐to‐Sales
0.0%
2.0%
4.0%
6.0%
8.0%
10.0%
12.0%
‐
5,000
10,000
15,000
20,000
25,000
30,000
FY10 FY11 FY12 FY13 FY14
EBITDA Margins (%
)
Revenu
es (Rs m
n)
Topline (Rs mn) EBITDA Margins (%)
CMP implied valuation of Sadbhav’s BOT portfolio is highly expensive, as compared to IRB Infra and Ashoka Buildcon

Page | 24 | PHILLIPCAPITAL INDIA RESEARCH
SADBHAV ENGINEERING COMPANY UPDATE
Financials
Income Statement Y/E Mar, Rs mn FY11 FY12 FY13 FY14Net sales 23,296 28,663 21,596 27,325Growth, % 74 23 ‐25 27Total income 23,296 28,663 21,596 27,325Employee expenses ‐385 ‐462 ‐532 ‐766Other Operating expenses ‐19,962 ‐20,761 ‐14,439 ‐18,325EBITDA (Core) 3,335 4,144 3,941 4,456Growth, % 85.2 24.3 (4.9) 13.1Margin, % 14.3 14.5 18.2 16.3Depreciation ‐789 ‐860 ‐1,707 ‐1,305EBIT 2,546 3,284 2,234 3,151Growth, % 105.9 29.0 (32.0) 41.0Margin, % 10.9 11.5 10.3 11.5Interest paid ‐1,399 ‐1,559 ‐3,042 ‐4,555Other Income 262 273 382 306Pre‐tax profit 1,409 1,975 136 121Tax provided ‐639 ‐808 ‐435 141Profit after tax 771 1,167 ‐299 262Others (Minorities, Associates) 158 56 374 181Net Profit 928 1,223 75 444Growth, % (2,289.8) 31.7 (93.9) 493.1Unadj. shares (m) 150 150 152 151Wtd avg shares (m) 150 150 152 151 Balance Sheet Y/E Mar, Rs mn FY11 FY12 FY13 FY14Cash & bank 1,365 1,801 735 1,280Debtors 5,871 7,377 7,517 5,957Inventory 736 884 1,022 1,638Loans & advances 9,776 6,279 7,583 7,824Other current assets 658 358 884 743Total current assets 18,406 16,700 17,741 17,442Investments 261 402 327 1,284Gross fixed assets 20,930 41,998 37,089 57,885Less: Depreciation ‐2,643 ‐3,371 ‐5,051 ‐4,738Add: Capital WIP 0 2 16,355 7,529Net fixed assets 18,287 38,629 48,393 60,676Total assets 36,954 55,731 66,461 79,403
Current liabilities 5,981 7,144 6,844 7,644Total current liabilities 5,981 7,144 6,844 7,644Non‐current liabilities 20,234 35,109 45,958 57,496Total liabilities 26,215 42,252 52,803 65,140Paid‐up capital 150 150 151 383Reserves & surplus 8,573 11,582 11,951 12,348Shareholders’ equity 10,740 13,478 13,659 14,263Total equity & liabilities 36,954 55,731 66,461 79,403 Source: Company, PhillipCapital India Research Estimates
Cash Flow FY11 FY12 FY13 FY14
Pre‐tax profit 1,409 1,975 136 121Depreciation 789 860 1,707 1,305Chg in working capital ‐6,552 3,306 ‐2,407 1,644Total tax paid ‐619 ‐734 ‐352 181Cash flow from operating activities ‐4,973 5,407 ‐917 3,251Capital expenditure ‐6,075 ‐21,202 ‐11,471 ‐13,588Chg in investments 603 ‐141 75 ‐957Cash flow from investing activities ‐5,472 ‐21,343 ‐11,396 ‐14,545Free cash flow ‐10,445 ‐15,937 ‐12,313 ‐11,295Equity raised/(repaid) 4,474 2,093 399 431Debt raised/(repaid) 5,523 14,801 10,767 11,498Dividend (incl Tax) ‐105 ‐105 ‐105 ‐125Other financing activities ‐181 ‐200 1 ‐120Cash flow from financing activities 11,304 16,373 11,246 11,840Net chg in cash 858 436 ‐1,067 545 Valuation Ratios
FY11 FY12 FY13 FY14Per Share data EPS (INR) 6.2 8.1 0.5 2.9Growth, % (1,926.3) 31.3 (93.9) 495.9Book NAV/share (INR) 58.2 78.0 79.8 84.3FDEPS (INR) 6.2 8.1 0.5 2.9CEPS (INR) 11.5 13.9 11.7 11.6CFPS (INR) (34.9) 34.3 (12.3) 11.4DPS (INR) 0.6 0.6 0.6 0.7Return ratios Return on assets (%) 5.5 4.7 2.7 4.4Return on equity (%) 10.6 10.4 0.6 3.5Return on capital employed (%) 6.7 5.4 3.0 4.8Turnover ratios Asset turnover (x) 1.0 0.8 0.4 0.4Sales/Total assets (x) 0.8 0.6 0.4 0.4Working capital/Sales (x) 0.5 0.3 0.5 0.3Working capital days 173.3 98.8 171.8 113.8Liquidity ratios Current ratio (x) 3.1 2.3 2.6 2.3Quick ratio (x) 3.0 2.2 2.4 2.1Interest cover (x) 1.8 2.1 0.7 0.7Dividend Cover (x) 10.3 13.6 0.8 4.2Total debt/Equity (x) 2.3 3.0 3.8 4.5Net debt/Equity (x) 2.1 2.8 3.7 4.4Valuation PER (x) 55.5 42.3 697.3 117.0Price/Book (x) 5.9 4.4 4.3 4.1EV/Net sales (x) 3.0 3.0 4.5 3.9EV/EBITDA (x) 21.1 20.5 24.6 24.2EV/EBIT (x) 27.6 25.8 43.5 34.2
INSTITUTIONAL EQUITY RESEARCH
Page | 25 | PHILLIPCAPITAL INDIA RESEARCH
ILFS Transportation (ILFT IN) Balance sheet concerns to continue INDIA | INFRASTRUCTURE | Company Update
26 March 2015
ILFS Transportation (ITNL) is the largest BOT player in India, with its road portfolio spread across 2831km, entailing investment of Rs329trn. It also has stakes in highway projects in China (Yu‐He expressway) and Spain (Eslamax), and other urban‐infra projects (like Bus terminal, Gurgaon Metro and MP border checkpost). It was recently declared the lowest bidder for a $325mn project in Kenya, for a concession period of 10 years.
Robust BOT portfolio: ITNL has a robust BOT portfolio, with marquee projects like RIDCOR and Noida Toll Bridge. The company currently generates Rs3.8bn as quarterly toll revenues (Rs5.3bn including Yu He and Autovia). The company traditionally has had strong relationships with state governments (Rajasthan, Kerala, Jharkhand) and is executing multiple state‐highway projects – as opposed to players like IRB, which are largely dependent on NHAI.
But stretched balance sheet: However, ITNL’s balance sheet is extremely stretched, and looks incapable of exploiting the huge opportunity expected to be unveiled by NHAI, over the next two years. The current standalone debt stands at Rs64bn (1.7x D/E) and consolidate debt at Rs222bn (3.8x D/E).
In order to address the balance sheet concerns, the company had raised Rs5.25bn through a rights‐issue in Sep‐2014 and Rs7.5bn through preference shares in FY14. Also, the company is looking for a QIP in coming months, to raise cash to fund the equity requirement for future project wins. But even with the entire fund‐raising exercise, the debt at standalone or consolidated level is not expected to reduce significantly, leading to continued pressure on earnings.
Overall, ITNL requires Rs7.4bn of equity investments in its current BOT projects, over the next three years – 50% of it is required for the Gurgaon‐Metro project (Phase II). Considering the current cash balance of Rs6bn and internal accruals over the next two years – the company should be able to fund the equity requirement of the current portfolio. However, without the QIP, we believe the company will find itself financially stretched while bidding for new projects.
Expected to miss out on the huge opportunity in roads: NHAI is expected to award 20,000km of road projects over the next two years – 70% as EPC contracts and 30% as BOT contracts. However, we see ITNL incapable of benefiting from the BOT opportunity (it does not bid for external EPC projects), due to its stretched balance sheet. Players like IRB, Ashoka and Sadbhav will benefit at the expense of ITNL, unless the company resorts to asset divestment to deleverage its balance sheet.
Valuations: ITNL stock has significantly underperformed its BOT peers like IRB, Ashoka and Sadbhav, over the last one year. Balance sheet concerns have made investors skeptical about the growth potential of the company, and it ability to bid for new projects. We do not expect the concerns to fade away in near future, and the stock to continue to underperform the sector.
NOT RATED CMP RS 192 COMPANY DATA O/S SHARES (MN) : 247MARKET CAP (RSBN) : 47MARKET CAP (USDBN) : 0.852 ‐ WK HI/LO (RS) : 257 / 113LIQUIDITY 3M (USDMN) : 1.0PAR VALUE (RS) : 5 SHARE HOLDING PATTERN, % PROMOTERS : 70.79FII / NRI : 5.25FI / MF : 2.33NON PROMOTER CORP. HOLDINGS : 0PUBLIC & OTHERS : 21.65 PRICE PERFORMANCE, %
1MTH 3MTH 1YRABS ‐8.7 11.3 67.6REL TO BSE ‐6.0 7.6 39.6 PRICE VS. SENSEX
Source: Phillip Capital India Research KEY FINANCIALS Rs mn FY11 FY12 FY13 FY14Net Sales 40,482 56,056 66,448 65,870EBIDTA 11,543 14,656 18,379 18,896Net Profit 4,329 4,970 5,202 4,630EPS, Rs 22.3 25.6 26.8 23.8PER, x 9.0 7.9 7.5 8.4EV/EBIDTA, x 7.6 9.4 9.7 11.7P/BV, x 1.6 1.3 1.0 0.7ROE, % 20.3 18.0 14.7 9.8Debt/Equity (x) 2.2 3.3 3.6 3.4
Source: PhillipCapital India Research Est. Vibhor Singhal (+ 9122 6667 9949) [email protected]
0
30
60
90
120
150
180
Apr‐11Feb‐12Dec‐12Oct‐13Aug‐14
ITNL BSE Sensex
Page | 26 | PHILLIPCAPITAL INDIA RESEARCH
ILFS TRANSPORTATION NETWORKS COMPANY UPDATE
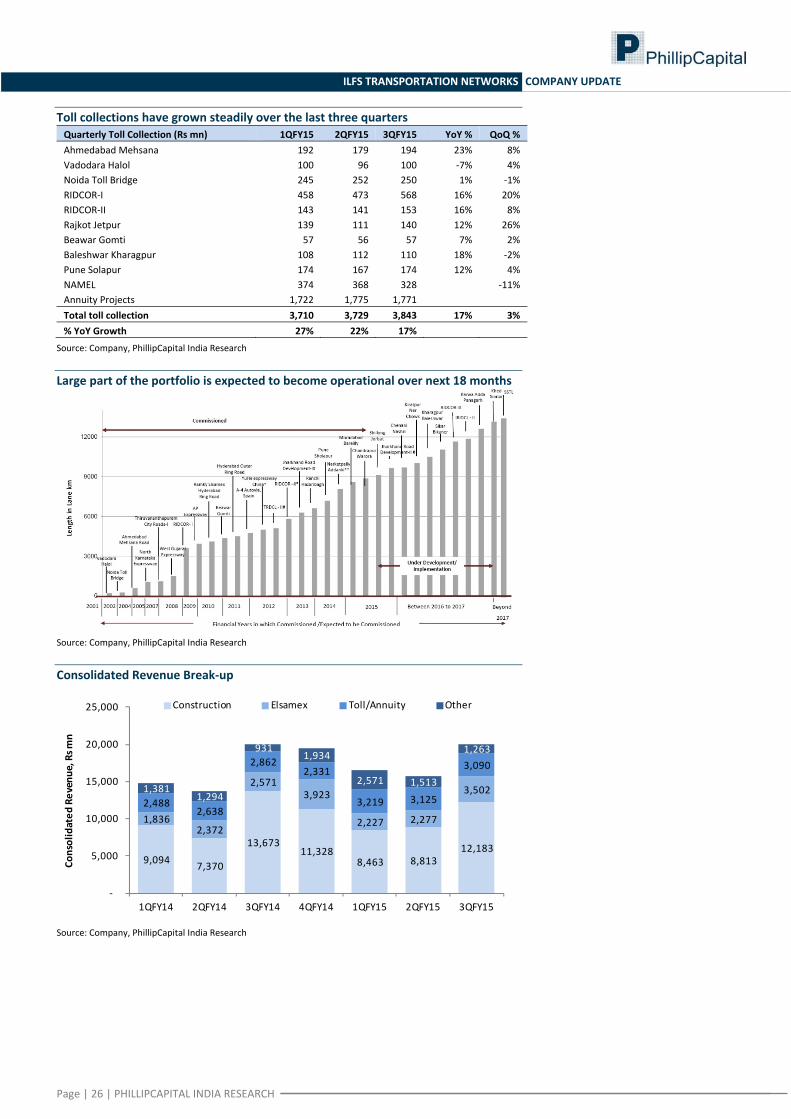
Toll collections have grown steadily over the last three quarters Quarterly Toll Collection (Rs mn) 1QFY15 2QFY15 3QFY15 YoY % QoQ % Ahmedabad Mehsana 192 179 194 23% 8% Vadodara Halol 100 96 100 ‐7% 4% Noida Toll Bridge 245 252 250 1% ‐1% RIDCOR‐I 458 473 568 16% 20% RIDCOR‐II 143 141 153 16% 8% Rajkot Jetpur 139 111 140 12% 26% Beawar Gomti 57 56 57 7% 2% Baleshwar Kharagpur 108 112 110 18% ‐2% Pune Solapur 174 167 174 12% 4% NAMEL 374 368 328 ‐11% Annuity Projects 1,722 1,775 1,771 Total toll collection 3,710 3,729 3,843 17% 3% % YoY Growth 27% 22% 17%
Source: Company, PhillipCapital India Research Large part of the portfolio is expected to become operational over next 18 months
Source: Company, PhillipCapital India Research Consolidated Revenue Break‐up
Source: Company, PhillipCapital India Research
9,094 7,370
13,673 11,328
8,463 8,813 12,183
1,836 2,372
2,571 3,923
2,227 2,277
3,502 2,488
2,638
2,862 2,331
3,219 3,125
3,090
1,381 1,294
931 1,934
2,571 1,513
1,263
‐
5,000
10,000
15,000
20,000
25,000
1QFY14 2QFY14 3QFY14 4QFY14 1QFY15 2QFY15 3QFY15
Consolidated
Revenue, Rs m
n
Construction Elsamex Toll/Annuity Other

Page | 27 | PHILLIPCAPITAL INDIA RESEARCH
ILFS TRANSPORTATION NETWORKS COMPANY UPDATE
Financials
Income Statement Y/E Mar, Rs mn FY11 FY12 FY13 FY14Net sales 40,482 56,056 66,448 65,870Growth, % 68 38 19 ‐1Total income 40,482 56,056 66,448 65,870Employee expenses ‐3,522 ‐3,694 ‐3,819 ‐4,141Other Operating expenses ‐28,939 ‐36,465 ‐42,693 ‐40,559EBITDA (Core) 11,543 14,656 18,379 18,896Growth, % 45.4 27.0 25.4 2.8Margin, % 28.5 26.1 27.7 28.7Depreciation ‐614 ‐766 ‐944 ‐1,510EBIT 10,929 13,890 17,435 17,386Growth, % 48.9 27.1 25.5 (0.3)Margin, % 27.0 24.8 26.2 26.4Interest paid ‐4,981 ‐7,282 ‐11,190 ‐14,710Other Income 791 1,238 1,440 2,155Pre‐tax profit 6,692 7,885 7,731 4,882Tax provided ‐2,242 ‐2,457 ‐2,274 ‐265Profit after tax 4,450 5,427 5,457 4,617Others (Minorities, Associates) ‐121 ‐458 ‐255 14Net Profit 4,329 4,970 5,202 4,630Growth, % 25.7 14.8 4.7 (11.0)Unadj. shares (m) 194 194 194 194Wtd avg shares (m) 194 194 194 194 Balance Sheet Y/E Mar, Rs mn FY11 FY12 FY13 FY14Cash & bank 5,275 2,838 4,202 6,713Debtors 7,489 8,820 7,517 9,875Inventory 262 210 169 172Loans & advances 16,855 17,143 14,170 20,763Other current assets 29,638 50,372 71,052 87,815Total current assets 59,519 79,382 97,110 1,25,338Investments 2,009 3,954 6,871 4,691Gross fixed assets 17,666 33,647 34,932 57,960Less: Depreciation ‐3,646 ‐4,783 ‐5,799 ‐7,953Add: Capital WIP 18,562 40,274 72,678 91,112Net fixed assets 32,581 69,138 1,01,811 1,41,119Total assets 94,226 1,52,480 2,05,903 2,71,328
Current liabilities 14,272 17,602 19,911 26,546Total current liabilities 14,272 17,602 19,911 26,546Non‐current liabilities 55,387 1,04,306 1,46,017 1,90,156Total liabilities 69,659 1,21,907 1,65,927 2,16,702Paid‐up capital 1,943 1,943 1,943 5,707Reserves & surplus 20,450 25,695 34,455 44,331Shareholders’ equity 24,567 30,573 39,975 54,626Total equity & liabilities 94,226 1,52,480 2,05,903 2,71,328 Source: Company, PhillipCapital India Research Estimates
Cash Flow FY11 FY12 FY13 FY14
Pre‐tax profit 6,692 7,885 7,731 4,882Depreciation 614 766 944 1,510Chg in working capital ‐16,816 ‐18,971 ‐14,054 ‐19,082Total tax paid ‐1,699 ‐1,738 ‐2,001 ‐770Cash flow from operating activities ‐11,209 ‐12,059 ‐7,380 ‐13,459Capital expenditure ‐14,248 ‐37,323 ‐33,617 ‐40,818Chg in investments 2,535 ‐1,945 ‐2,917 2,180Cash flow from investing activities ‐11,714 ‐39,268 ‐36,534 ‐38,638Free cash flow ‐22,923 ‐51,326 ‐43,914 ‐52,097Equity raised/(repaid) 2,130 1,722 5,438 11,676Debt raised/(repaid) 20,733 48,311 41,332 44,574Dividend (incl tax) ‐790 ‐903 ‐909 ‐1,512Other financing activities ‐312 ‐543 ‐970 ‐1,155Cash flow from financing activities 22,696 48,889 45,278 54,608Net chg in cash ‐226 ‐2,438 1,364 2,511 Valuation Ratios
FY11 FY12 FY13 FY14Per Share data EPS (INR) 22.3 25.6 26.8 23.8Growth, % 25.7 14.8 4.7 (11.0)Book NAV/share (INR) 126.5 157.4 205.8 281.2FDEPS (INR) 22.3 25.6 26.8 23.8CEPS (INR) 25.4 29.5 31.6 31.6CFPS (INR) (61.5) (68.6) (45.6) (80.6)DPS (INR) 3.5 4.0 4.0 6.7Return ratios Return on assets (%) 9.8 8.2 7.0 5.9Return on equity (%) 20.3 18.0 14.7 9.8Return on capital employed (%) 11.5 9.4 7.9 6.5Turnover ratios Asset turnover (x) 0.7 0.6 0.4 0.3Sales/Total assets (x) 0.5 0.5 0.4 0.3Working capital/Sales (x) 1.0 1.1 1.1 1.4Working capital days 360.4 383.8 401.0 510.2Liquidity ratios Current ratio (x) 4.2 4.5 4.9 4.7Quick ratio (x) 4.2 4.5 4.9 4.7Interest cover (x) 2.2 1.9 1.6 1.2Total debt/Equity (x) 2.2 3.3 3.6 3.4Net debt/Equity (x) 2.0 3.3 3.5 3.3Valuation PER (x) 8.6 7.5 7.2 8.1PEG (x) ‐ y‐o‐y growth 0.3 0.5 1.5 (0.7)Price/Book (x) 1.5 1.2 0.9 0.7EV/Net sales (x) 2.1 2.4 2.7 3.3EV/EBITDA (x) 7.4 9.3 9.6 11.6EV/EBIT (x) 7.9 9.8 10.1 12.6

Page | 28 | PHILLIPCAPITAL INDIA RESEARCH
INFRASTRUCTURE SECTOR UPDATE
Contact Information (Regional Member Companies)
SINGAPORE Phillip Securities Pte Ltd
250 North Bridge Road, #06‐00 Raffles City Tower, Singapore 179101
Tel : (65) 6533 6001 Fax: (65) 6535 3834 www.phillip.com.sg
MALAYSIA Phillip Capital Management Sdn Bhd B‐3‐6 Block B Level 3, Megan Avenue II,
No. 12, Jalan Yap Kwan Seng, 50450 Kuala Lumpur Tel (60) 3 2162 8841 Fax (60) 3 2166 5099
www.poems.com.my
HONG KONG Phillip Securities (HK) Ltd
11/F United Centre 95 Queensway Hong Kong Tel (852) 2277 6600 Fax: (852) 2868 5307
www.phillip.com.hk
JAPAN Phillip Securities Japan, Ltd
4‐2 Nihonbashi Kabutocho, Chuo‐ku Tokyo 103‐0026
Tel: (81) 3 3666 2101 Fax: (81) 3 3664 0141 www.phillip.co.jp
INDONESIA PT Phillip Securities Indonesia
ANZ Tower Level 23B, Jl Jend Sudirman Kav 33A, Jakarta 10220, Indonesia
Tel (62) 21 5790 0800 Fax: (62) 21 5790 0809 www.phillip.co.id
CHINA Phillip Financial Advisory (Shanghai) Co. Ltd.
No 550 Yan An East Road, Ocean Tower Unit 2318 Shanghai 200 001
Tel (86) 21 5169 9200 Fax: (86) 21 6351 2940 www.phillip.com.cn
THAILAND Phillip Securities (Thailand) Public Co. Ltd.
15th Floor, Vorawat Building, 849 Silom Road, Silom, Bangrak, Bangkok 10500 Thailand
Tel (66) 2 2268 0999 Fax: (66) 2 2268 0921 www.phillip.co.th
FRANCE King & Shaxson Capital Ltd.
3rd Floor, 35 Rue de la Bienfaisance 75008 Paris France
Tel (33) 1 4563 3100 Fax : (33) 1 4563 6017 www.kingandshaxson.com
UNITED KINGDOM King & Shaxson Ltd.
6th Floor, Candlewick House, 120 Cannon Street London, EC4N 6AS
Tel (44) 20 7929 5300 Fax: (44) 20 7283 6835 www.kingandshaxson.com
UNITED STATES Phillip Futures Inc.
141 W Jackson Blvd Ste 3050 The Chicago Board of Trade Building
Chicago, IL 60604 USA Tel (1) 312 356 9000 Fax: (1) 312 356 9005
AUSTRALIA PhillipCapital Australia
Level 37, 530 Collins Street Melbourne, Victoria 3000, Australia
Tel: (61) 3 9629 8380 Fax: (61) 3 9614 8309 www.phillipcapital.com.au
SRI LANKA Asha Phillip Securities Limited
Level 4, Millennium House, 46/58 Navam Mawatha, Colombo 2, Sri Lanka
Tel: (94) 11 2429 100 Fax: (94) 11 2429 199 www.ashaphillip.net/home.htm
INDIA PhillipCapital (India) Private Limited
No. 1, 18th Floor, Urmi Estate, 95 Ganpatrao Kadam Marg, Lower Parel West, Mumbai 400013 Tel: (9122) 2300 2999 Fax: (9122) 6667 9955 www.phillipcapital.in
Management (91 22) 2300 2999
Kinshuk Bharti Tiwari (Head – Institutional Equity) (91 22) 6667 9946(91 22) 6667 9735
Research Engineering, Capital Goods Pharma
Dhawal Doshi (9122) 6667 9769 Ankur Sharma (9122) 6667 9759 Surya Patra (9122) 6667 9768Priya Ranjan (9122) 6667 9965 Hrishikesh Bhagat (9122) 6667 9986
Retail, Real EstateInfrastructure & IT Services Abhishek Ranganathan, CFA (9122) 6667 9952
Manish Agarwalla (9122) 6667 9962 Vibhor Singhal (9122) 6667 9949 Neha Garg (9122) 6667 9996Pradeep Agrawal (9122) 6667 9953 Deepan Kapadia (9122) 6667 9992Paresh Jain (9122) 6667 9948 Technicals
Midcap Subodh Gupta, CMT (9122) 6667 9762Consumer, Media, Telecom Vikram Suryavanshi (9122) 6667 9951Naveen Kulkarni, CFA, FRM (9122) 6667 9947 Production ManagerJubil Jain (9122) 6667 9766 Metals Ganesh Deorukhkar (9122) 6667 9966
Dhawal Doshi (9122) 6667 9769Ankit Gor (9122) 6667 9987
CementVaibhav Agarwal (9122) 6667 9967 Oil&Gas, Agri Inputs
Gauri Anand (9122) 6667 9943 Sr. Manager – Equities SupportEconomics Deepak Pareek (9122) 6667 9950 Rosie Ferns (9122) 6667 9971Anjali Verma (9122) 6667 9969Sales & Distribution Ashvin Patil (9122) 6667 9991 Sales Trader Zarine Damania (9122) 6667 9976Shubhangi Agrawal (9122) 6667 9964 Dilesh Doshi (9122) 6667 9747 Kishor Binwal (9122) 6667 9989 Suniil Pandit (9122) 6667 9745Sidharth Agrawal (9122) 6667 9934 ExecutionBhavin Shah (9122) 6667 9974 Mayur Shah (9122) 6667 9945
Corporate Communications
Vineet Bhatnagar (Managing Director)
Jignesh Shah (Head – Equity Derivatives)
Automobiles
Banking, NBFCs

Page | 29 | PHILLIPCAPITAL INDIA RESEARCH
INFRASTRUCTURE SECTOR UPDATE
Disclosures and Disclaimers PhillipCapital (India) Pvt. Ltd. has three independent equity research groups: Institutional Equities, Institutional Equity Derivatives and Private Client Group. This report has been prepared by Institutional Equities Group. The views and opinions expressed in this document may or may not match or may be contrary at times with the views, estimates, rating, target price of the other equity research groups of PhillipCapital (India) Pvt. Ltd. This report is issued by PhillipCapital (India) Pvt. Ltd. which is regulated by SEBI. PhillipCapital (India) Pvt. Ltd. is a subsidiary of Phillip (Mauritius) Pvt. Ltd. References to "PCIPL" in this report shall mean PhillipCapital (India) Pvt. Ltd unless otherwise stated. This report is prepared and distributed by PCIPL for information purposes only and neither the information contained herein nor any opinion expressed should be construed or deemed to be construed as solicitation or as offering advice for the purposes of the purchase or sale of any security, investment or derivatives. The information and opinions contained in the Report were considered by PCIPL to be valid when published. The report also contains information provided to PCIPL by third parties. The source of such information will usually be disclosed in the report. Whilst PCIPL has taken all reasonable steps to ensure that this information is correct, PCIPL does not offer any warranty as to the accuracy or completeness of such information. Any person placing reliance on the report to undertake trading does so entirely at his or her own risk and PCIPL does not accept any liability as a result. Securities and Derivatives markets may be subject to rapid and unexpected price movements and past performance is not necessarily an indication to future performance. This report does not have regard to the specific investment objectives, financial situation and the particular needs of any specific person who may receive this report. Investors must undertake independent analysis with their own legal, tax and financial advisors and reach their own regarding the appropriateness of investing in any securities or investment strategies discussed or recommended in this report and should understand that statements regarding future prospects may not be realized. In no circumstances it be used or considered as an offer to sell or a solicitation of any offer to buy or sell the Securities mentioned in it. The information contained in the research reports may have been taken from trade and statistical services and other sources, which we believe are reliable. PhillipCapital (India) Pvt. Ltd. or any of its group/associate/affiliate companies do not guarantee that such information is accurate or complete and it should not be relied upon as such. Any opinions expressed reflect judgments at this date and are subject to change without notice Important: These disclosures and disclaimers must be read in conjunction with the research report of which it forms part. Receipt and use of the research report is subject to all aspects of these disclosures and disclaimers. Additional information about the issuers and securities discussed in this research report is available on request. Certifications: The research analyst(s) who prepared this research report hereby certifies that the views expressed in this research report accurately reflect the research analyst’s personal views about all of the subject issuers and/or securities, that the analyst have no known conflict of interest and no part of the research analyst’s compensation was, is or will be, directly or indirectly, related to the specific views or recommendations contained in this research report. The Research Analyst certifies that he /she or his / her family members does not own the stock(s) covered in this research report. Independence/Conflict: PhillipCapital (India) Pvt. Ltd. has not had an investment banking relationship with, and has not received any compensation for investment banking services from, the subject issuers in the past twelve (12) months, and PhillipCapital (India) Pvt. Ltd does not anticipate receiving or intend to seek compensation for investment banking services from the subject issuers in the next three (3) months. PhillipCapital (India) Pvt. Ltd is not a market maker in the securities mentioned in this research report, although it or its employees, directors, or affiliates may hold either long or short positions in such securities. PhillipCapital (India) Pvt. Ltd may not hold more than 1% of the shares of the company(ies) covered in this report. Suitability and Risks: This research report is for informational purposes only and is not tailored to the specific investment objectives, financial situation or particular requirements of any individual recipient hereof. Certain securities may give rise to substantial risks and may not be suitable for certain investors. Each investor must make its own determination as to the appropriateness of any securities referred to in this research report based upon the legal, tax and accounting considerations applicable to such investor and its own investment objectives or strategy, its financial situation and its investing experience. The value of any security may be positively or adversely affected by changes in foreign exchange or interest rates, as well as by other financial, economic or political factors. Past performance is not necessarily indicative of future performance or results. Sources, Completeness and Accuracy: The material herein is based upon information obtained from sources that PCIPL and the research analyst believe to be reliable, but neither PCIPL nor the research analyst represents or guarantees that the information contained herein is accurate or complete and it should not be relied upon as such. Opinions expressed herein are current opinions as of the date appearing on this material and are subject to change without notice. Furthermore, PCIPL is under no obligation to update or keep the information current. Copyright: The copyright in this research report belongs exclusively to PCIPL. All rights are reserved. Any unauthorized use or disclosure is prohibited. No reprinting or reproduction, in whole or in part, is permitted without the PCIPL’s prior consent, except that a recipient may reprint it for internal circulation only and only if it is reprinted in its entirety. Caution: Risk of loss in trading in can be substantial. You should carefully consider whether trading is appropriate for you in light of your experience, objectives, financial resources and other relevant circumstances. For U.S. persons only: This research report is a product of PhillipCapital (India) Pvt Ltd. which is the employer of the research analyst(s) who has prepared the research report. The research analyst(s) preparing the research report is/are resident outside the United States (U.S.) and are not associated persons of any U.S. regulated broker‐dealer and therefore the analyst(s) is/are not subject to supervision by a U.S. broker‐dealer, and is/are not required to satisfy the regulatory licensing requirements of FINRA or required to otherwise comply with U.S. rules or regulations regarding, among other things, communications with a subject company, public appearances and trading securities held by a research analyst account. This report is intended for distribution by PhillipCapital (India) Pvt Ltd. only to "Major Institutional Investors" as defined by Rule 15a‐6(b)(4) of the U.S. Securities and Exchange Act, 1934 (the Exchange Act) and interpretations thereof by U.S. Securities and Exchange Commission (SEC) in reliance on Rule 15a 6(a)(2). If the recipient of this report is not a Major Institutional Investor as specified above, then it should not act upon this report and return the same to the sender. Further, this report may not be copied, duplicated and/or transmitted onward to any U.S. person, which is not the Major Institutional Investor. In reliance on the exemption from registration provided by Rule 15a‐6 of the Exchange Act and interpretations thereof by the SEC in order to conduct certain business with Major Institutional Investors, PhillipCapital (India) Pvt Ltd. has entered into an agreement with a U.S. registered broker‐dealer, Marco Polo Securities Inc. ("Marco Polo").Transactions in securities discussed in this research report should be effected through Marco Polo or another U.S. registered broker dealer. PhillipCapital (India) Pvt. Ltd. Registered office: No. 1, 18th Floor, Urmi Estate, 95 Ganpatrao Kadam Marg, Lower Parel West, Mumbai 400013