Embed Size (px)
Citation preview
INSTITUTIONAL EQUITY RESEARCH
Page | 1 | PHILLIPCAPITAL INDIA RESEARCH Please see penultimate page for additional important disclosures. PhillipCapital (India) Private Limited. (“PHILLIPCAP”) is a foreign broker-dealer unregistered in the USA. PHILLIPCAP research is prepared by research analysts who are not registered in the USA. PHILLIPCAP research is distributed in the USA pursuant to Rule 15a-6 of the Securities Exchange Act of 1934 solely by Rosenblatt Securities Inc, an SEC registered and FINRA-member broker-dealer.
IT Services
One + One = Eleven (Part 2)
INDIA | IT SERVICES | Sector Update
12 December 2019
We predicted it five years ago: Five years ago, we had published a report (read here) where we had highlighted that most midcap IT companies will find it difficult to withstand competition in the rapidly evolving technology landscape – and hence, their promoters (also driven by lack of succession planning), might look to sell themselves out. We had further hypothesized that IF one or more of these midcap IT companies could be brought together to merge with another (perhaps facilitated by large PE investors), they could lead to the formation of a formidable IT company, which could perform much better than the individual components, and would also command valuation premium.
Perhaps the report was a little ahead of its time! While this did not materialize immediately, we are seeing transactions of this exact nature happening NOW – FIVE years later. Over the last few quarters, promoters of multiple midcap companies (Mindtree, NIIT Tech, KPIT) have exited their businesses. The acquisition of Mindtree by L&T group and NIIT Tech by Barings PE group are definite precursors to these acquired entities eventually merging with group IT companies. We pat ourselves on having predicted this highly imaginative (five years ago) hypothesis well ahead, accurately. We expect the trend to continue, and more consolidation to take place in the IT midcap space over the next few years.
Spate of M&A activity in last five years: Over the last five years, we have witnessed (1) acquisition of the promoter stake in Hexaware and NIIT Tech by Barings PE, (2) acquisition of the promoter stake in Mphasis by Blackstone, (3) demerger of KPIT Tech and merger of its IT business with Birlasoft, (4) acquisition of Mindtree by the L&T group, paving the way for a future merger with LTI, and (5) acquisition of Polaris by Virtusa. The list is a perfect nod to our 2014 report – four out of the five likely ‘targets’, highlighted in our report, have gone through a change in ownership and merger-demerger activity.
Growth challenges and lack of succession planning to drive M&A: We believe that promoters of midcap companies exiting their businesses (some due to lack of succession planning, some due to hostile takeovers) signal that the businesses and their valuations have peaked out. Over the last two years, we have seen the IT midcap companies outperforming their largecap counterpart significantly – registering double-digit growth, as compared to mid-single-digit growth by large-caps. But with the ‘digital’ technology cycle now entering its ‘early majority’ phase and deal sizes gradually increasing, midcaps will find it extremely difficult to grab deals (and marketshare) from largecaps.
Expect M&A activity to continue in the IT mid-cap space: Accordingly, we expect M&A activity to continue over the next few years, and the ‘remaining’ IT midcaps to be targets for larger peers and also for PE firms. Companies like Cyient and Persistent have been struggling to grow their businesses, and have been constantly losing market share. Cyient could be a perfect target for companies like LTTS or HCL Tech (also for any foreign ERD company) due to its strength in the ERD space. But Persistent might find it difficult to fit into most other business models, given its unique offerings. Also, we believe small-cap companies like Sonata Software and Zensar – with unique value propositions in niche domains – could also be potential M&A targets.
IT mid-cap attractive post time correction, event-based opportunities offer option value: Over the last one year, most midcaps (excl NITEC) have undergone significant time/price/both correction, and no longer appear as expensive as they did, year ago. While the growth too has tapered down over this period, we believe select midcap stocks currently offer a favourable risk-reward profile, along with event-based opportunities, offered by potential M&A activity in these stocks.
We upgrade LTTS, Mindtree and Cyient to BUY, based on potential turnaround opportunity and attractive valuations. We continue to find valuations expensive for LTI and NITEC.
Companies L&T Infotech Neutral CMP 1650 TP 1750
L&T Technology Services Buy CMP 1475 TP 1760
MindTree Buy CMP 740 TP 910
Cyient Buy CMP 391 TP 490
NIIT Technologies Neutral CMP 1455 TP 1550
Vibhor Singhal, Research Analyst (+ 9122 6246 4109) [email protected]
Page | 2 | PHILLIPCAPITAL INDIA RESEARCH
IT SERVICES SECTOR UPDATE
We predicted it FIVE years ago! Five years ago, we had published a report (read here) where we had highlighted that most midcap IT companies will find it difficult to withstand competition, in the rapidly evolving technology landscape – and hence, might look to sell themselves out, over the next few years. We had also hypothesized that IF one or more of these midcap IT companies could be merged (perhaps facilitated by PE owners), this could lead to the formation of a formidable IT company that could perform much better than its individual components, and would also command a valuation premium. We had analysed this by taking five niche midcap IT companies with significant PE presence. We then created four hypothetical Integrated Entities (IEs) merging three different midcap companies from this set and then analysed the overall profile of these IEs with respect to clients, revenue diversification, and operating margins. Our analysis had revealed that the hypothetical integration would have led to formation of well-diversified full-service IT companies with a sizeable revenue base; ones which could maintain their competitive edge in niche domains. Their profile would have been very similar to the profiles of the top-5 players, which would have led to them being significantly rerated.
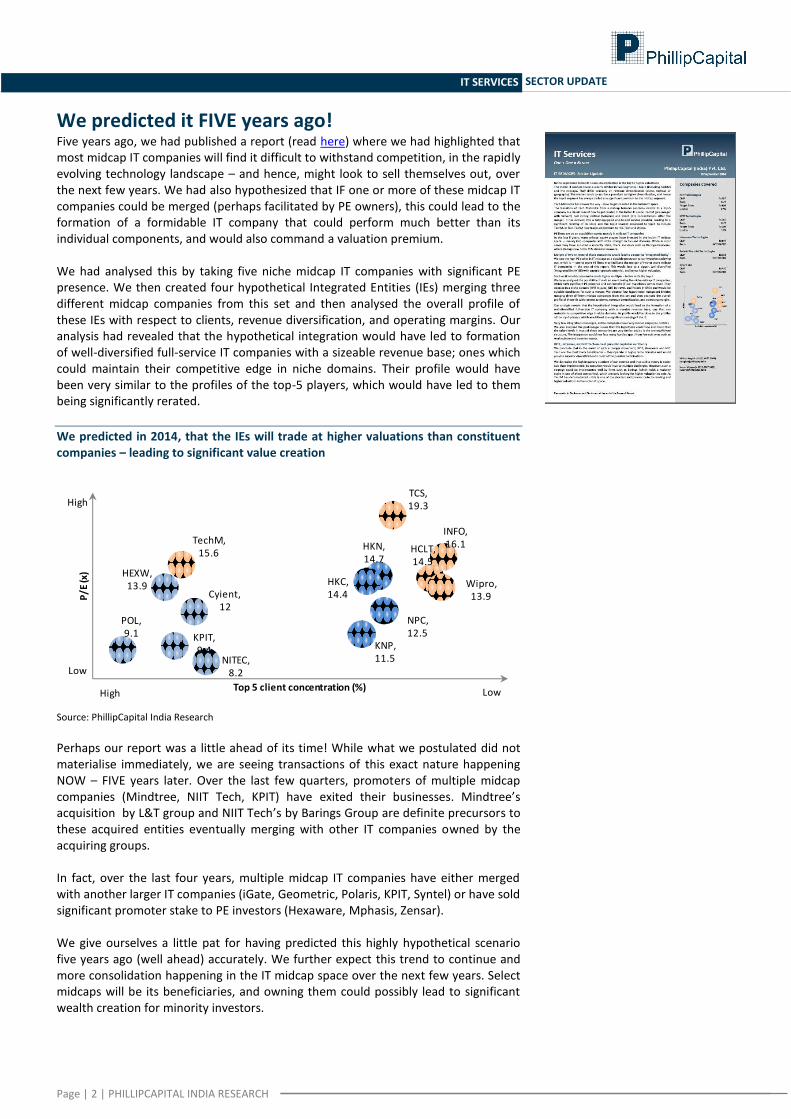
We predicted in 2014, that the IEs will trade at higher valuations than constituent companies – leading to significant value creation
Source: PhillipCapital India Research Perhaps our report was a little ahead of its time! While what we postulated did not materialise immediately, we are seeing transactions of this exact nature happening NOW – FIVE years later. Over the last few quarters, promoters of multiple midcap companies (Mindtree, NIIT Tech, KPIT) have exited their businesses. Mindtree’s acquisition by L&T group and NIIT Tech’s by Barings Group are definite precursors to these acquired entities eventually merging with other IT companies owned by the acquiring groups. In fact, over the last four years, multiple midcap IT companies have either merged with another larger IT companies (iGate, Geometric, Polaris, KPIT, Syntel) or have sold significant promoter stake to PE investors (Hexaware, Mphasis, Zensar). We give ourselves a little pat for having predicted this highly hypothetical scenario five years ago (well ahead) accurately. We further expect this trend to continue and more consolidation happening in the IT midcap space over the next few years. Select midcaps will be its beneficiaries, and owning them could possibly lead to significant wealth creation for minority investors.
HEXW,13.9
NITEC,8.2
KPIT,9.4
POL,9.1
Cyient,12
INFO,16.1
TCS,19.3
HCLT,14.5
Wipro,13.9
TechM,15.6
KNP,11.5
HKN,14.7
HKC,14.4
NPC,12.5
P/E
(x)
Top 5 client concentration (%)
Low
High
LowHigh
Page | 3 | PHILLIPCAPITAL INDIA RESEARCH
IT SERVICES SECTOR UPDATE
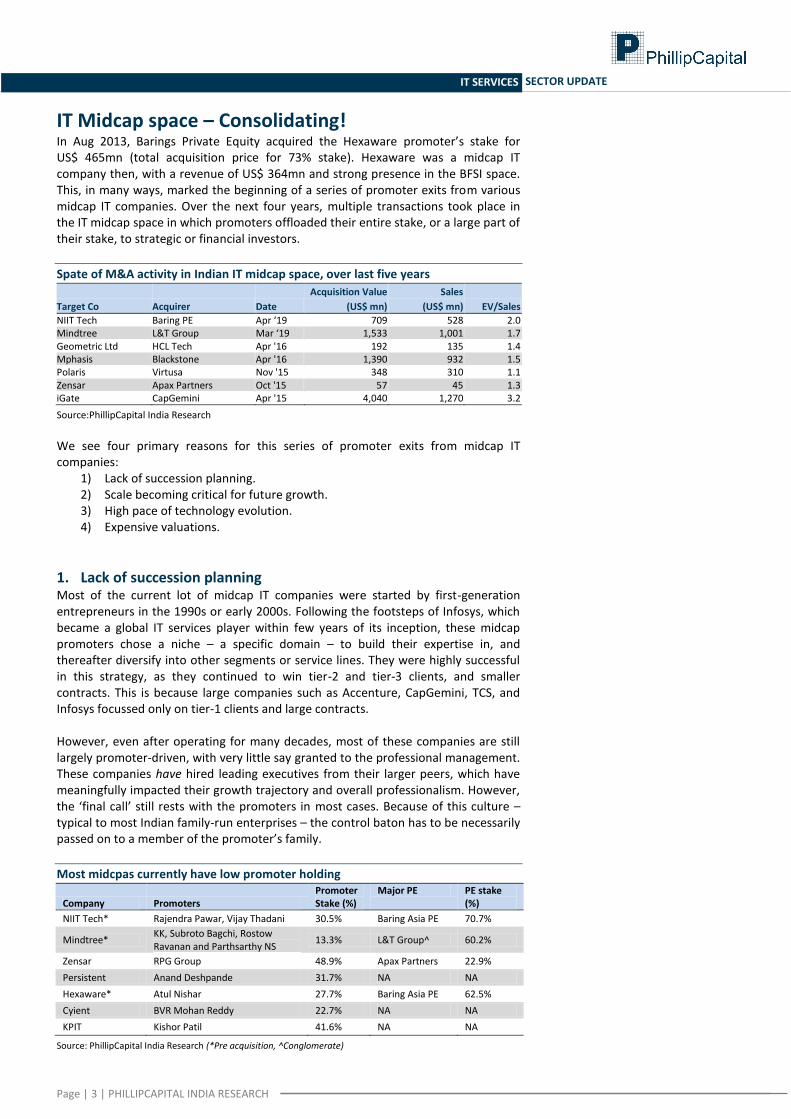
IT Midcap space – Consolidating! In Aug 2013, Barings Private Equity acquired the Hexaware promoter’s stake for US$ 465mn (total acquisition price for 73% stake). Hexaware was a midcap IT company then, with a revenue of US$ 364mn and strong presence in the BFSI space. This, in many ways, marked the beginning of a series of promoter exits from various midcap IT companies. Over the next four years, multiple transactions took place in the IT midcap space in which promoters offloaded their entire stake, or a large part of their stake, to strategic or financial investors.
Spate of M&A activity in Indian IT midcap space, over last five years
Target Co Acquirer Date
Acquisition Value
(US$ mn)
Sales
(US$ mn) EV/Sales
NIIT Tech Baring PE Apr ‘19 709 528 2.0 Mindtree L&T Group Mar ‘19 1,533 1,001 1.7 Geometric Ltd HCL Tech Apr '16 192 135 1.4 Mphasis Blackstone Apr '16 1,390 932 1.5 Polaris Virtusa Nov '15 348 310 1.1 Zensar Apax Partners Oct '15 57 45 1.3 iGate CapGemini Apr '15 4,040 1,270 3.2
Source:PhillipCapital India Research
We see four primary reasons for this series of promoter exits from midcap IT companies:
1) Lack of succession planning. 2) Scale becoming critical for future growth. 3) High pace of technology evolution. 4) Expensive valuations.
1. Lack of succession planning Most of the current lot of midcap IT companies were started by first-generation entrepreneurs in the 1990s or early 2000s. Following the footsteps of Infosys, which became a global IT services player within few years of its inception, these midcap promoters chose a niche – a specific domain – to build their expertise in, and thereafter diversify into other segments or service lines. They were highly successful in this strategy, as they continued to win tier-2 and tier-3 clients, and smaller contracts. This is because large companies such as Accenture, CapGemini, TCS, and Infosys focussed only on tier-1 clients and large contracts. However, even after operating for many decades, most of these companies are still largely promoter-driven, with very little say granted to the professional management. These companies have hired leading executives from their larger peers, which have meaningfully impacted their growth trajectory and overall professionalism. However, the ‘final call’ still rests with the promoters in most cases. Because of this culture – typical to most Indian family-run enterprises – the control baton has to be necessarily passed on to a member of the promoter’s family.
Most midcpas currently have low promoter holding
Company Promoters Promoter Stake (%)
Major PE PE stake (%)
NIIT Tech* Rajendra Pawar, Vijay Thadani 30.5% Baring Asia PE 70.7%
Mindtree* KK, Subroto Bagchi, Rostow Ravanan and Parthsarthy NS
13.3% L&T Group^ 60.2%
Zensar RPG Group 48.9% Apax Partners 22.9%
Persistent Anand Deshpande 31.7% NA NA
Hexaware* Atul Nishar 27.7% Baring Asia PE 62.5%
Cyient BVR Mohan Reddy 22.7% NA NA
KPIT Kishor Patil 41.6% NA NA
Source: PhillipCapital India Research (*Pre acquisition, ^Conglomerate)
Page | 4 | PHILLIPCAPITAL INDIA RESEARCH
IT SERVICES SECTOR UPDATE
This is where the problems begin. Most of the promoters of these companies started them in the early 1990s, when they were about 20-30 years old. Most are now close to retirement age. However, hardly any of them have a proper succession plan in place. Their ‘heirs’ tend to have other business interests and many do not want to work in the IT services business. Under the circumstances, the only solution left for these promoters is to sell their stake to a strategic or financial investor, and exit the company that they have founded. New investors would run the company in a much more professional way – either as a part of a larger professional IT company (if acquired by a strategic investor) or as part of a portfolio of professionally run companies (if acquired by a financial investor). Either way, the company would have a better future and this scenario would present better stake-monetization opportunities for promoters.
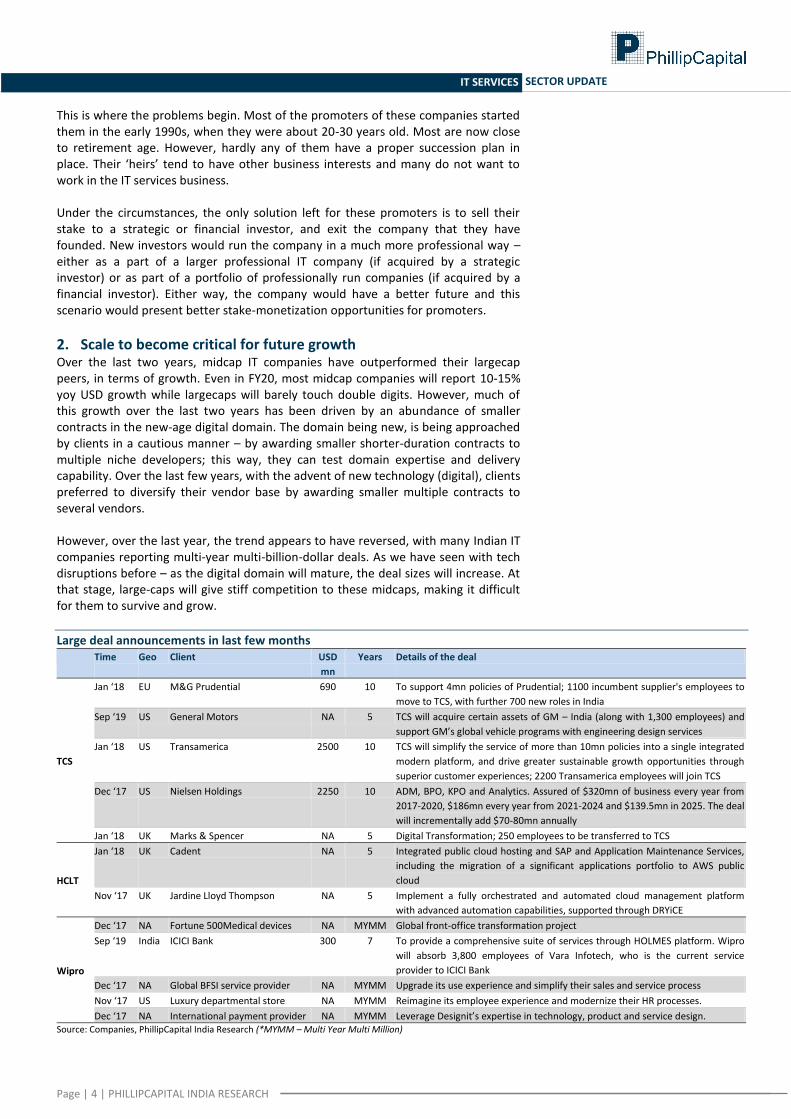
2. Scale to become critical for future growth Over the last two years, midcap IT companies have outperformed their largecap peers, in terms of growth. Even in FY20, most midcap companies will report 10-15% yoy USD growth while largecaps will barely touch double digits. However, much of this growth over the last two years has been driven by an abundance of smaller contracts in the new-age digital domain. The domain being new, is being approached by clients in a cautious manner – by awarding smaller shorter-duration contracts to multiple niche developers; this way, they can test domain expertise and delivery capability. Over the last few years, with the advent of new technology (digital), clients preferred to diversify their vendor base by awarding smaller multiple contracts to several vendors. However, over the last year, the trend appears to have reversed, with many Indian IT companies reporting multi-year multi-billion-dollar deals. As we have seen with tech disruptions before – as the digital domain will mature, the deal sizes will increase. At that stage, large-caps will give stiff competition to these midcaps, making it difficult for them to survive and grow.
Large deal announcements in last few months Time Geo Client USD
mn
Years Details of the deal
TCS
Jan ‘18 EU M&G Prudential 690 10 To support 4mn policies of Prudential; 1100 incumbent supplier's employees to
move to TCS, with further 700 new roles in India
Sep ‘19 US General Motors NA 5 TCS will acquire certain assets of GM – India (along with 1,300 employees) and
support GM’s global vehicle programs with engineering design services
Jan ‘18 US Transamerica 2500 10 TCS will simplify the service of more than 10mn policies into a single integrated
modern platform, and drive greater sustainable growth opportunities through
superior customer experiences; 2200 Transamerica employees will join TCS
Dec ‘17 US Nielsen Holdings 2250 10 ADM, BPO, KPO and Analytics. Assured of $320mn of business every year from
2017-2020, $186mn every year from 2021-2024 and $139.5mn in 2025. The deal
will incrementally add $70-80mn annually
Jan ‘18 UK Marks & Spencer NA 5 Digital Transformation; 250 employees to be transferred to TCS
HCLT
Jan ‘18 UK Cadent NA 5 Integrated public cloud hosting and SAP and Application Maintenance Services,
including the migration of a significant applications portfolio to AWS public
cloud
Nov ‘17 UK Jardine Lloyd Thompson NA 5 Implement a fully orchestrated and automated cloud management platform
with advanced automation capabilities, supported through DRYiCE
Wipro
Dec ‘17 NA Fortune 500Medical devices NA MYMM Global front-office transformation project
Sep ‘19 India ICICI Bank 300 7 To provide a comprehensive suite of services through HOLMES platform. Wipro
will absorb 3,800 employees of Vara Infotech, who is the current service
provider to ICICI Bank
Dec ‘17 NA Global BFSI service provider NA MYMM Upgrade its use experience and simplify their sales and service process
Nov ‘17 US Luxury departmental store NA MYMM Reimagine its employee experience and modernize their HR processes.
Dec ‘17 NA International payment provider NA MYMM Leverage Designit’s expertise in technology, product and service design. Source: Companies, PhillipCapital India Research (*MYMM – Multi Year Multi Million)
Page | 5 | PHILLIPCAPITAL INDIA RESEARCH
IT SERVICES SECTOR UPDATE
The average revenue size of the midcap IT companies today is US$ 500-1500mn. At that size, these companies are in an in-between stage – neither are they big enough (like the largecaps) to be invited in large tenders, nor are they small enough to be able to survive and grow by focussing only on small deals. They need to be a part of a larger group where they are invited due to their size and are then able to clinch the contract based on their domain expertise. Integration with another player offers them just that.
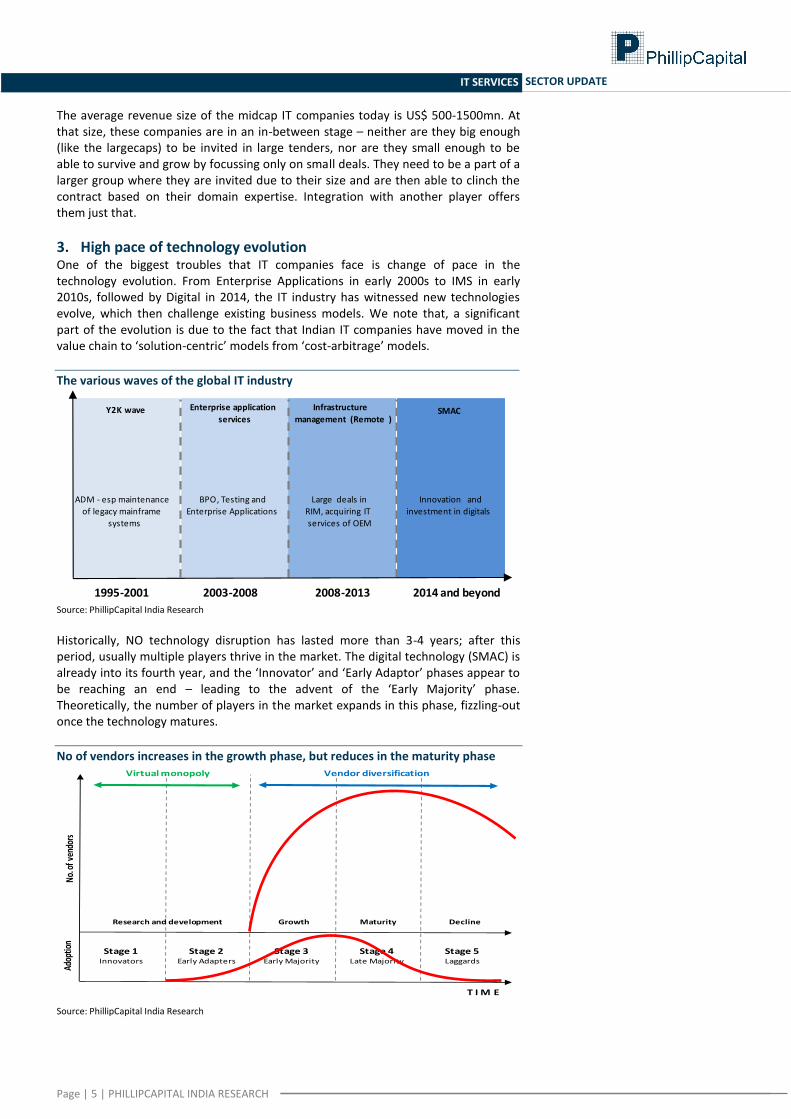
3. High pace of technology evolution One of the biggest troubles that IT companies face is change of pace in the technology evolution. From Enterprise Applications in early 2000s to IMS in early 2010s, followed by Digital in 2014, the IT industry has witnessed new technologies evolve, which then challenge existing business models. We note that, a significant part of the evolution is due to the fact that Indian IT companies have moved in the value chain to ‘solution-centric’ models from ‘cost-arbitrage’ models.
The various waves of the global IT industry
Source: PhillipCapital India Research
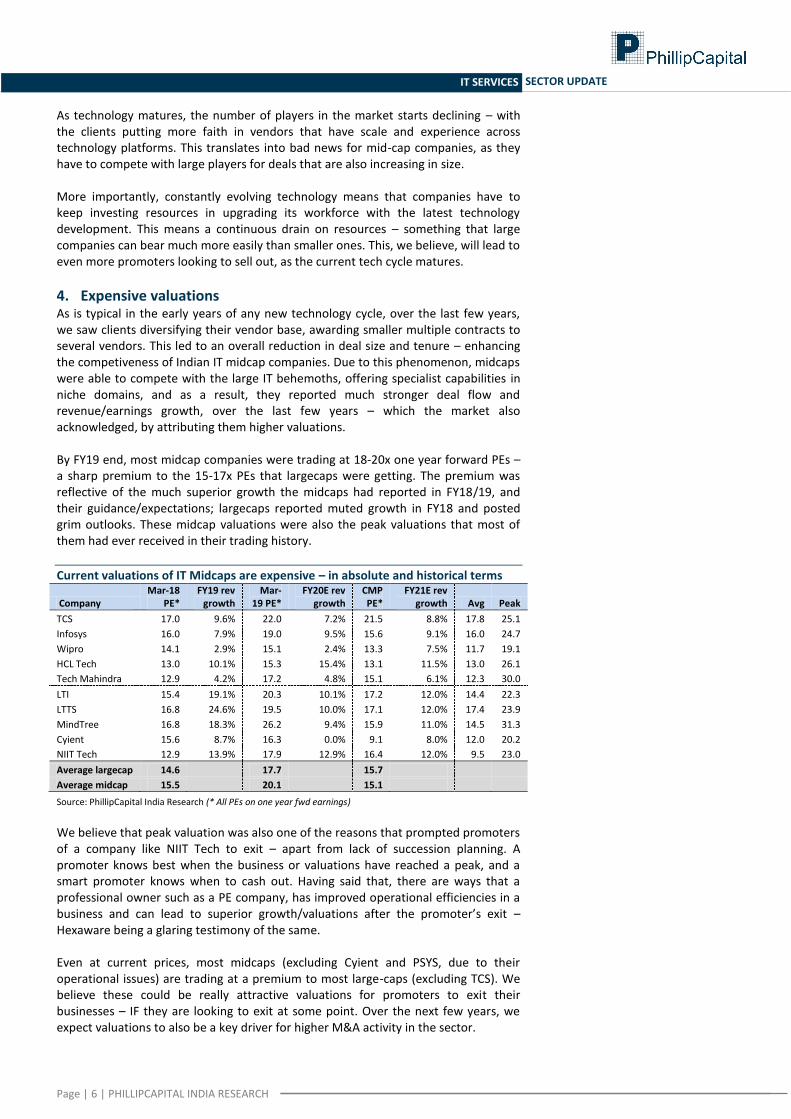
Historically, NO technology disruption has lasted more than 3-4 years; after this period, usually multiple players thrive in the market. The digital technology (SMAC) is already into its fourth year, and the ‘Innovator’ and ‘Early Adaptor’ phases appear to be reaching an end – leading to the advent of the ‘Early Majority’ phase. Theoretically, the number of players in the market expands in this phase, fizzling-out once the technology matures.
No of vendors increases in the growth phase, but reduces in the maturity phase
Source: PhillipCapital India Research
1995-2001 2003-2008 2008-2013 2014 and beyond
Y2K wave Enterprise application
services
Infrastructure
management (Remote )SMAC
ADM - esp maintenance
of legacy mainframe
systems
BPO, Testing and
Enterprise Applications
Large deals in
RIM, acquiring IT
services of OEM
Innovation and
investment in digitals
Stage 1Innovators
Stage 2Early Adapters
Stage 3Early Majority
Stage 4Late Majority
Stage 5Laggards
T I M E
Virtual monopoly Vendor diversification
Research and development Growth Maturity Decline
Adop
tion
No.
of v
endo
rs
Page | 6 | PHILLIPCAPITAL INDIA RESEARCH
IT SERVICES SECTOR UPDATE
As technology matures, the number of players in the market starts declining – with the clients putting more faith in vendors that have scale and experience across technology platforms. This translates into bad news for mid-cap companies, as they have to compete with large players for deals that are also increasing in size. More importantly, constantly evolving technology means that companies have to keep investing resources in upgrading its workforce with the latest technology development. This means a continuous drain on resources – something that large companies can bear much more easily than smaller ones. This, we believe, will lead to even more promoters looking to sell out, as the current tech cycle matures.
4. Expensive valuations As is typical in the early years of any new technology cycle, over the last few years, we saw clients diversifying their vendor base, awarding smaller multiple contracts to several vendors. This led to an overall reduction in deal size and tenure – enhancing the competiveness of Indian IT midcap companies. Due to this phenomenon, midcaps were able to compete with the large IT behemoths, offering specialist capabilities in niche domains, and as a result, they reported much stronger deal flow and revenue/earnings growth, over the last few years – which the market also acknowledged, by attributing them higher valuations. By FY19 end, most midcap companies were trading at 18-20x one year forward PEs – a sharp premium to the 15-17x PEs that largecaps were getting. The premium was reflective of the much superior growth the midcaps had reported in FY18/19, and their guidance/expectations; largecaps reported muted growth in FY18 and posted grim outlooks. These midcap valuations were also the peak valuations that most of them had ever received in their trading history.
Current valuations of IT Midcaps are expensive – in absolute and historical terms
Company Mar-18
PE* FY19 rev
growth Mar-
19 PE* FY20E rev
growth CMP PE*
FY21E rev growth Avg Peak
TCS 17.0 9.6% 22.0 7.2% 21.5 8.8% 17.8 25.1
Infosys 16.0 7.9% 19.0 9.5% 15.6 9.1% 16.0 24.7
Wipro 14.1 2.9% 15.1 2.4% 13.3 7.5% 11.7 19.1
HCL Tech 13.0 10.1% 15.3 15.4% 13.1 11.5% 13.0 26.1
Tech Mahindra 12.9 4.2% 17.2 4.8% 15.1 6.1% 12.3 30.0
LTI 15.4 19.1% 20.3 10.1% 17.2 12.0% 14.4 22.3
LTTS 16.8 24.6% 19.5 10.0% 17.1 12.0% 17.4 23.9
MindTree 16.8 18.3% 26.2 9.4% 15.9 11.0% 14.5 31.3
Cyient 15.6 8.7% 16.3 0.0% 9.1 8.0% 12.0 20.2
NIIT Tech 12.9 13.9% 17.9 12.9% 16.4 12.0% 9.5 23.0
Average largecap 14.6
17.7
15.7 Average midcap 15.5
20.1
15.1
Source: PhillipCapital India Research (* All PEs on one year fwd earnings)
We believe that peak valuation was also one of the reasons that prompted promoters of a company like NIIT Tech to exit – apart from lack of succession planning. A promoter knows best when the business or valuations have reached a peak, and a smart promoter knows when to cash out. Having said that, there are ways that a professional owner such as a PE company, has improved operational efficiencies in a business and can lead to superior growth/valuations after the promoter’s exit – Hexaware being a glaring testimony of the same. Even at current prices, most midcaps (excluding Cyient and PSYS, due to their operational issues) are trading at a premium to most large-caps (excluding TCS). We believe these could be really attractive valuations for promoters to exit their businesses – IF they are looking to exit at some point. Over the next few years, we expect valuations to also be a key driver for higher M&A activity in the sector.
Page | 7 | PHILLIPCAPITAL INDIA RESEARCH
IT SERVICES SECTOR UPDATE
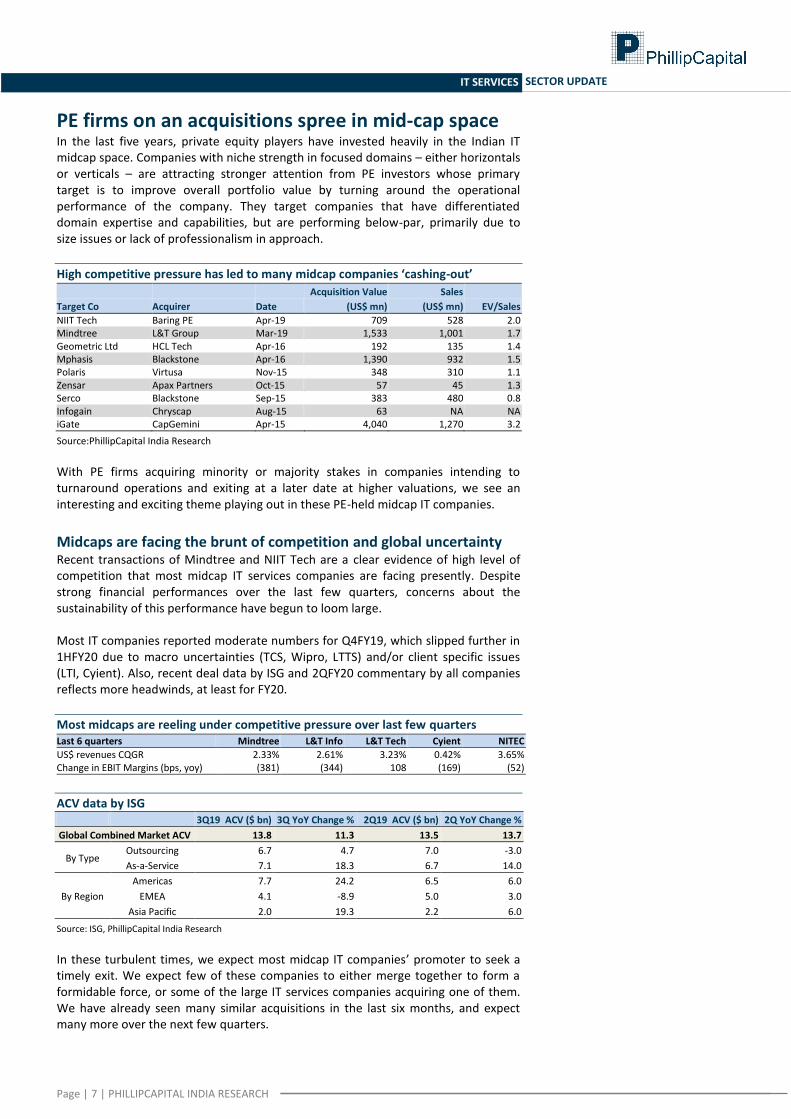
PE firms on an acquisitions spree in mid-cap space In the last five years, private equity players have invested heavily in the Indian IT midcap space. Companies with niche strength in focused domains – either horizontals or verticals – are attracting stronger attention from PE investors whose primary target is to improve overall portfolio value by turning around the operational performance of the company. They target companies that have differentiated domain expertise and capabilities, but are performing below-par, primarily due to size issues or lack of professionalism in approach.
High competitive pressure has led to many midcap companies ‘cashing-out’
Target Co Acquirer Date
Acquisition Value
(US$ mn)
Sales
(US$ mn) EV/Sales
NIIT Tech Baring PE Apr-19 709 528 2.0 Mindtree L&T Group Mar-19 1,533 1,001 1.7 Geometric Ltd HCL Tech Apr-16 192 135 1.4 Mphasis Blackstone Apr-16 1,390 932 1.5 Polaris Virtusa Nov-15 348 310 1.1 Zensar Apax Partners Oct-15 57 45 1.3 Serco Blackstone Sep-15 383 480 0.8 Infogain Chryscap Aug-15 63 NA NA iGate CapGemini Apr-15 4,040 1,270 3.2
Source:PhillipCapital India Research
With PE firms acquiring minority or majority stakes in companies intending to turnaround operations and exiting at a later date at higher valuations, we see an interesting and exciting theme playing out in these PE-held midcap IT companies.
Midcaps are facing the brunt of competition and global uncertainty Recent transactions of Mindtree and NIIT Tech are a clear evidence of high level of competition that most midcap IT services companies are facing presently. Despite strong financial performances over the last few quarters, concerns about the sustainability of this performance have begun to loom large. Most IT companies reported moderate numbers for Q4FY19, which slipped further in 1HFY20 due to macro uncertainties (TCS, Wipro, LTTS) and/or client specific issues (LTI, Cyient). Also, recent deal data by ISG and 2QFY20 commentary by all companies reflects more headwinds, at least for FY20.
Most midcaps are reeling under competitive pressure over last few quarters Last 6 quarters Mindtree L&T Info L&T Tech Cyient NITEC
US$ revenues CQGR 2.33% 2.61% 3.23% 0.42% 3.65% Change in EBIT Margins (bps, yoy) (381) (344) 108 (169) (52)
ACV data by ISG
3Q19 ACV ($ bn) 3Q YoY Change % 2Q19 ACV ($ bn) 2Q YoY Change %
Global Combined Market ACV 13.8 11.3 13.5 13.7
By Type Outsourcing 6.7 4.7 7.0 -3.0
As-a-Service 7.1 18.3 6.7 14.0
By Region
Americas 7.7 24.2 6.5 6.0
EMEA 4.1 -8.9 5.0 3.0
Asia Pacific 2.0 19.3 2.2 6.0
Source: ISG, PhillipCapital India Research In these turbulent times, we expect most midcap IT companies’ promoter to seek a timely exit. We expect few of these companies to either merge together to form a formidable force, or some of the large IT services companies acquiring one of them. We have already seen many similar acquisitions in the last six months, and expect many more over the next few quarters.
Page | 8 | PHILLIPCAPITAL INDIA RESEARCH
IT SERVICES SECTOR UPDATE
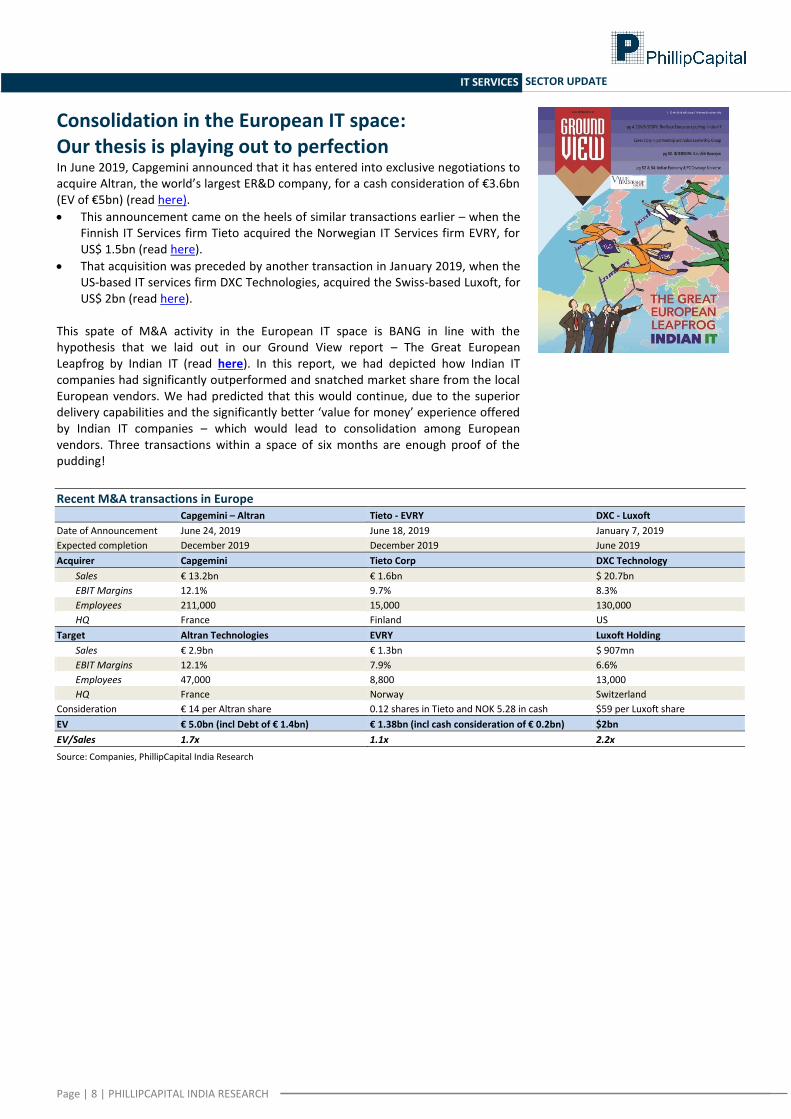
Consolidation in the European IT space: Our thesis is playing out to perfection In June 2019, Capgemini announced that it has entered into exclusive negotiations to acquire Altran, the world’s largest ER&D company, for a cash consideration of €3.6bn (EV of €5bn) (read here).
This announcement came on the heels of similar transactions earlier – when the Finnish IT Services firm Tieto acquired the Norwegian IT Services firm EVRY, for US$ 1.5bn (read here).
That acquisition was preceded by another transaction in January 2019, when the US-based IT services firm DXC Technologies, acquired the Swiss-based Luxoft, for US$ 2bn (read here).
This spate of M&A activity in the European IT space is BANG in line with the hypothesis that we laid out in our Ground View report – The Great European Leapfrog by Indian IT (read here). In this report, we had depicted how Indian IT companies had significantly outperformed and snatched market share from the local European vendors. We had predicted that this would continue, due to the superior delivery capabilities and the significantly better ‘value for money’ experience offered by Indian IT companies – which would lead to consolidation among European vendors. Three transactions within a space of six months are enough proof of the pudding!
Recent M&A transactions in Europe Capgemini – Altran Tieto - EVRY DXC - Luxoft
Date of Announcement June 24, 2019 June 18, 2019 January 7, 2019
Expected completion December 2019 December 2019 June 2019
Acquirer Capgemini Tieto Corp DXC Technology
Sales € 13.2bn € 1.6bn $ 20.7bn
EBIT Margins 12.1% 9.7% 8.3%
Employees 211,000 15,000 130,000
HQ France Finland US
Target Altran Technologies EVRY Luxoft Holding
Sales € 2.9bn € 1.3bn $ 907mn
EBIT Margins 12.1% 7.9% 6.6%
Employees 47,000 8,800 13,000
HQ France Norway Switzerland
Consideration € 14 per Altran share 0.12 shares in Tieto and NOK 5.28 in cash $59 per Luxoft share
EV € 5.0bn (incl Debt of € 1.4bn) € 1.38bn (incl cash consideration of € 0.2bn) $2bn
EV/Sales 1.7x 1.1x 2.2x
Source: Companies, PhillipCapital India Research
Page | 9 | PHILLIPCAPITAL INDIA RESEARCH
IT SERVICES SECTOR UPDATE
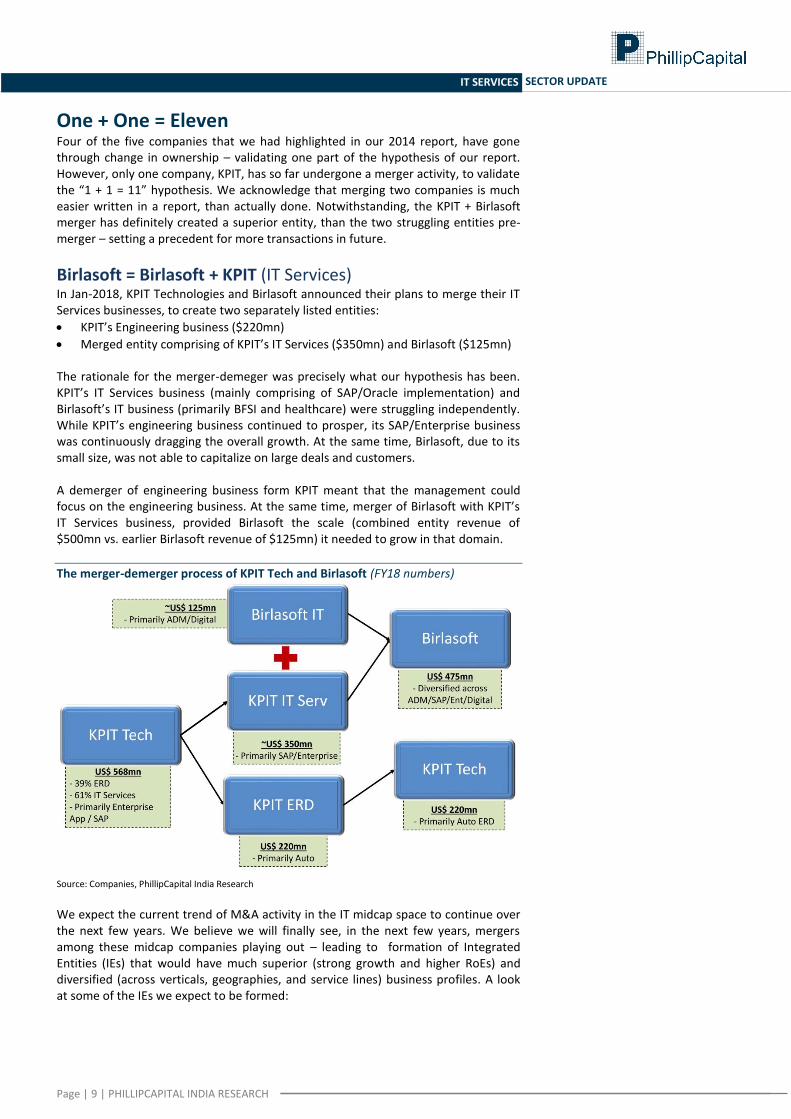
One + One = Eleven Four of the five companies that we had highlighted in our 2014 report, have gone through change in ownership – validating one part of the hypothesis of our report. However, only one company, KPIT, has so far undergone a merger activity, to validate the “1 + 1 = 11” hypothesis. We acknowledge that merging two companies is much easier written in a report, than actually done. Notwithstanding, the KPIT + Birlasoft merger has definitely created a superior entity, than the two struggling entities pre-merger – setting a precedent for more transactions in future.
Birlasoft = Birlasoft + KPIT (IT Services) In Jan-2018, KPIT Technologies and Birlasoft announced their plans to merge their IT Services businesses, to create two separately listed entities:
KPIT’s Engineering business ($220mn)
Merged entity comprising of KPIT’s IT Services ($350mn) and Birlasoft ($125mn) The rationale for the merger-demeger was precisely what our hypothesis has been. KPIT’s IT Services business (mainly comprising of SAP/Oracle implementation) and Birlasoft’s IT business (primarily BFSI and healthcare) were struggling independently. While KPIT’s engineering business continued to prosper, its SAP/Enterprise business was continuously dragging the overall growth. At the same time, Birlasoft, due to its small size, was not able to capitalize on large deals and customers. A demerger of engineering business form KPIT meant that the management could focus on the engineering business. At the same time, merger of Birlasoft with KPIT’s IT Services business, provided Birlasoft the scale (combined entity revenue of $500mn vs. earlier Birlasoft revenue of $125mn) it needed to grow in that domain.
The merger-demerger process of KPIT Tech and Birlasoft (FY18 numbers)
Source: Companies, PhillipCapital India Research We expect the current trend of M&A activity in the IT midcap space to continue over the next few years. We believe we will finally see, in the next few years, mergers among these midcap companies playing out – leading to formation of Integrated Entities (IEs) that would have much superior (strong growth and higher RoEs) and diversified (across verticals, geographies, and service lines) business profiles. A look at some of the IEs we expect to be formed:
Page | 10 | PHILLIPCAPITAL INDIA RESEARCH
IT SERVICES SECTOR UPDATE
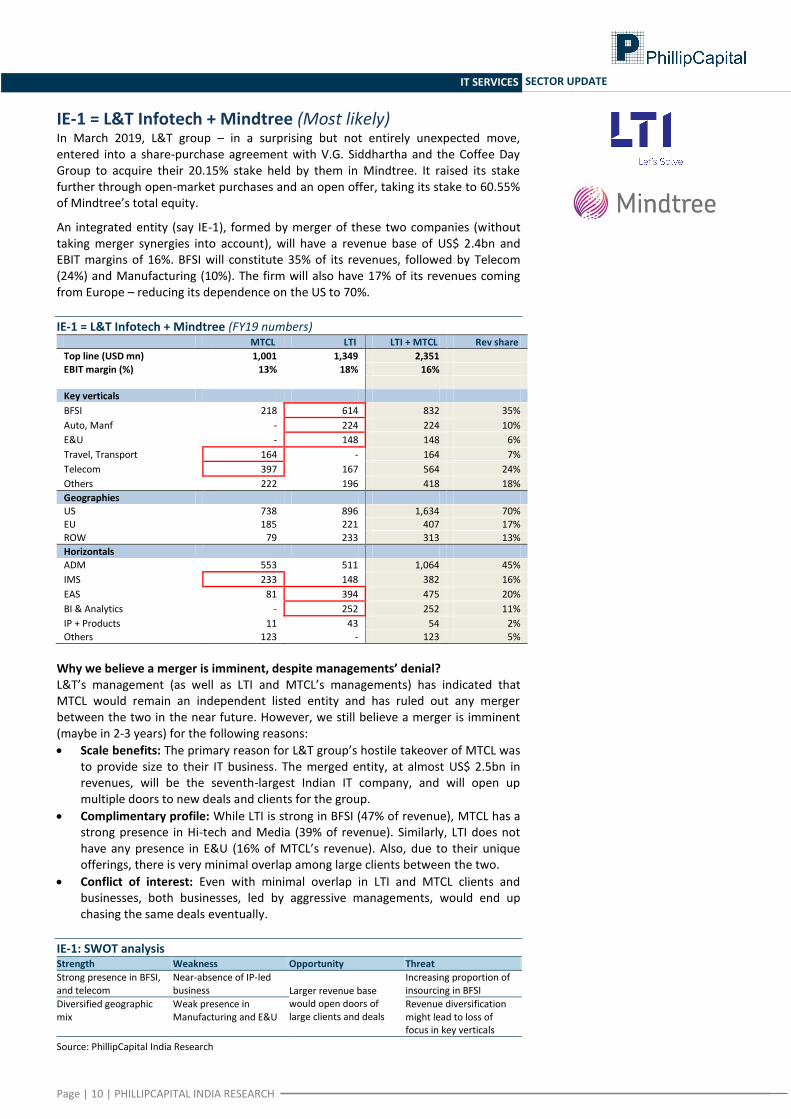
IE-1 = L&T Infotech + Mindtree (Most likely) In March 2019, L&T group – in a surprising but not entirely unexpected move, entered into a share-purchase agreement with V.G. Siddhartha and the Coffee Day Group to acquire their 20.15% stake held by them in Mindtree. It raised its stake further through open-market purchases and an open offer, taking its stake to 60.55% of Mindtree’s total equity.
An integrated entity (say IE-1), formed by merger of these two companies (without taking merger synergies into account), will have a revenue base of US$ 2.4bn and EBIT margins of 16%. BFSI will constitute 35% of its revenues, followed by Telecom (24%) and Manufacturing (10%). The firm will also have 17% of its revenues coming from Europe – reducing its dependence on the US to 70%.
IE-1 = L&T Infotech + Mindtree (FY19 numbers) MTCL LTI LTI + MTCL Rev share
Top line (USD mn) 1,001 1,349 2,351
EBIT margin (%) 13% 18% 16% Key verticals
BFSI 218 614 832 35%
Auto, Manf - 224 224 10%
E&U - 148 148 6%
Travel, Transport 164 - 164 7%
Telecom 397 167 564 24%
Others 222 196 418 18%
Geographies US 738 896 1,634 70% EU 185 221 407 17%
ROW 79 233 313 13%
Horizontals
ADM 553 511 1,064 45%
IMS 233 148 382 16%
EAS 81 394 475 20%
BI & Analytics - 252 252 11%
IP + Products 11 43 54 2%
Others 123 - 123 5%
Why we believe a merger is imminent, despite managements’ denial? L&T’s management (as well as LTI and MTCL’s managements) has indicated that MTCL would remain an independent listed entity and has ruled out any merger between the two in the near future. However, we still believe a merger is imminent (maybe in 2-3 years) for the following reasons:
Scale benefits: The primary reason for L&T group’s hostile takeover of MTCL was to provide size to their IT business. The merged entity, at almost US$ 2.5bn in revenues, will be the seventh-largest Indian IT company, and will open up multiple doors to new deals and clients for the group.
Complimentary profile: While LTI is strong in BFSI (47% of revenue), MTCL has a strong presence in Hi-tech and Media (39% of revenue). Similarly, LTI does not have any presence in E&U (16% of MTCL’s revenue). Also, due to their unique offerings, there is very minimal overlap among large clients between the two.
Conflict of interest: Even with minimal overlap in LTI and MTCL clients and businesses, both businesses, led by aggressive managements, would end up chasing the same deals eventually.
IE-1: SWOT analysis Strength Weakness Opportunity Threat
Strong presence in BFSI, and telecom
Near-absence of IP-led business Larger revenue base
would open doors of large clients and deals
Increasing proportion of insourcing in BFSI
Diversified geographic mix
Weak presence in Manufacturing and E&U
Revenue diversification might lead to loss of focus in key verticals
Source: PhillipCapital India Research
Page | 11 | PHILLIPCAPITAL INDIA RESEARCH
IT SERVICES SECTOR UPDATE
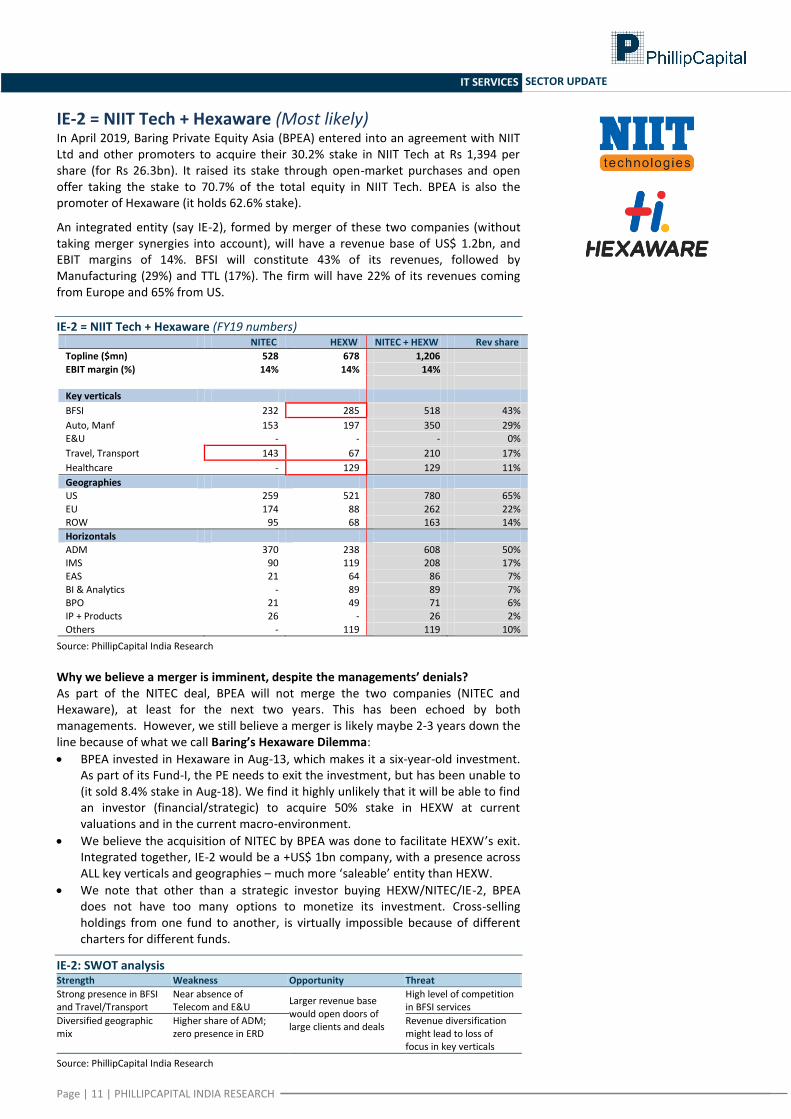
IE-2 = NIIT Tech + Hexaware (Most likely) In April 2019, Baring Private Equity Asia (BPEA) entered into an agreement with NIIT Ltd and other promoters to acquire their 30.2% stake in NIIT Tech at Rs 1,394 per share (for Rs 26.3bn). It raised its stake through open-market purchases and open offer taking the stake to 70.7% of the total equity in NIIT Tech. BPEA is also the promoter of Hexaware (it holds 62.6% stake).
An integrated entity (say IE-2), formed by merger of these two companies (without taking merger synergies into account), will have a revenue base of US$ 1.2bn, and EBIT margins of 14%. BFSI will constitute 43% of its revenues, followed by Manufacturing (29%) and TTL (17%). The firm will have 22% of its revenues coming from Europe and 65% from US.
IE-2 = NIIT Tech + Hexaware (FY19 numbers) NITEC HEXW NITEC + HEXW Rev share
Topline ($mn) 528 678 1,206
EBIT margin (%) 14% 14% 14% Key verticals
BFSI 232 285 518 43%
Auto, Manf 153 197 350 29% E&U - - - 0%
Travel, Transport 143 67 210 17%
Healthcare - 129 129 11%
Geographies US 259 521 780 65%
EU 174 88 262 22% ROW 95 68 163 14%
Horizontals
ADM 370 238 608 50% IMS 90 119 208 17% EAS 21 64 86 7%
BI & Analytics - 89 89 7% BPO 21 49 71 6% IP + Products 26 - 26 2%
Others - 119 119 10%
Source: PhillipCapital India Research
Why we believe a merger is imminent, despite the managements’ denials? As part of the NITEC deal, BPEA will not merge the two companies (NITEC and Hexaware), at least for the next two years. This has been echoed by both managements. However, we still believe a merger is likely maybe 2-3 years down the line because of what we call Baring’s Hexaware Dilemma:
BPEA invested in Hexaware in Aug-13, which makes it a six-year-old investment. As part of its Fund-I, the PE needs to exit the investment, but has been unable to (it sold 8.4% stake in Aug-18). We find it highly unlikely that it will be able to find an investor (financial/strategic) to acquire 50% stake in HEXW at current valuations and in the current macro-environment.
We believe the acquisition of NITEC by BPEA was done to facilitate HEXW’s exit. Integrated together, IE-2 would be a +US$ 1bn company, with a presence across ALL key verticals and geographies – much more ‘saleable’ entity than HEXW.
We note that other than a strategic investor buying HEXW/NITEC/IE-2, BPEA does not have too many options to monetize its investment. Cross-selling holdings from one fund to another, is virtually impossible because of different charters for different funds.
IE-2: SWOT analysis Strength Weakness Opportunity Threat
Strong presence in BFSI and Travel/Transport
Near absence of Telecom and E&U
Larger revenue base would open doors of large clients and deals
High level of competition in BFSI services
Diversified geographic mix
Higher share of ADM; zero presence in ERD
Revenue diversification might lead to loss of focus in key verticals
Source: PhillipCapital India Research
Page | 12 | PHILLIPCAPITAL INDIA RESEARCH
IT SERVICES SECTOR UPDATE
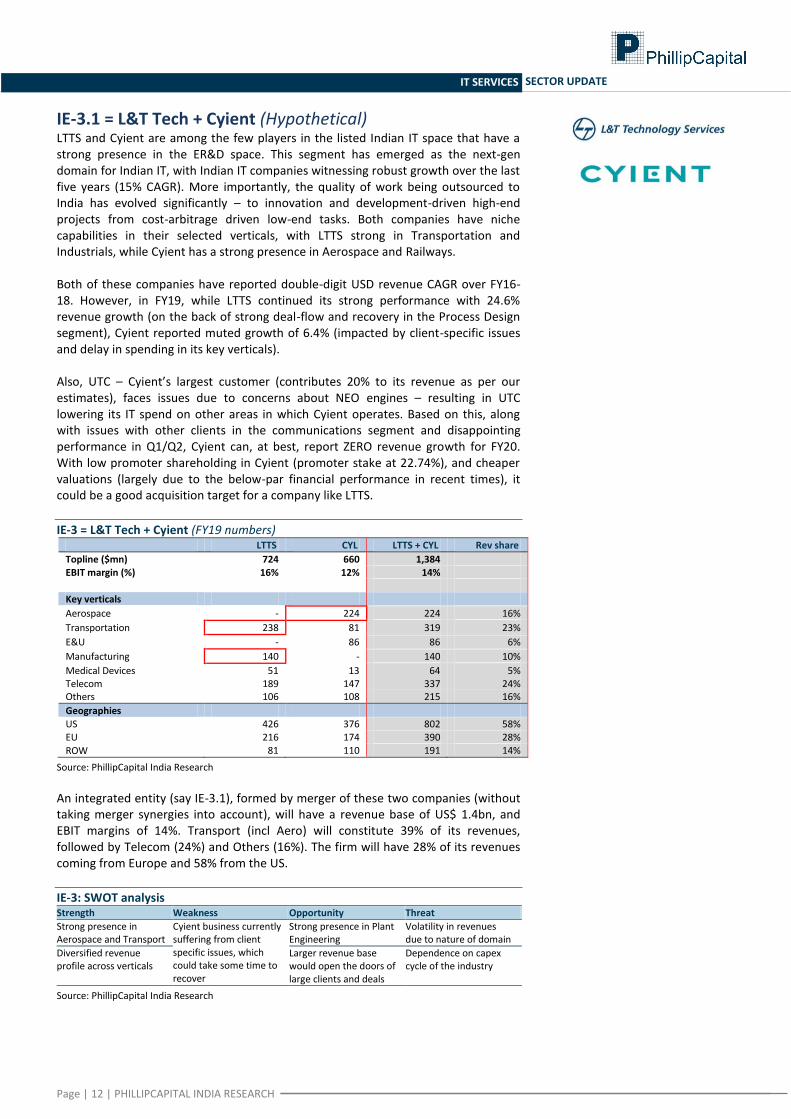
IE-3.1 = L&T Tech + Cyient (Hypothetical) LTTS and Cyient are among the few players in the listed Indian IT space that have a strong presence in the ER&D space. This segment has emerged as the next-gen domain for Indian IT, with Indian IT companies witnessing robust growth over the last five years (15% CAGR). More importantly, the quality of work being outsourced to India has evolved significantly – to innovation and development-driven high-end projects from cost-arbitrage driven low-end tasks. Both companies have niche capabilities in their selected verticals, with LTTS strong in Transportation and Industrials, while Cyient has a strong presence in Aerospace and Railways. Both of these companies have reported double-digit USD revenue CAGR over FY16-18. However, in FY19, while LTTS continued its strong performance with 24.6% revenue growth (on the back of strong deal-flow and recovery in the Process Design segment), Cyient reported muted growth of 6.4% (impacted by client-specific issues and delay in spending in its key verticals). Also, UTC – Cyient’s largest customer (contributes 20% to its revenue as per our estimates), faces issues due to concerns about NEO engines – resulting in UTC lowering its IT spend on other areas in which Cyient operates. Based on this, along with issues with other clients in the communications segment and disappointing performance in Q1/Q2, Cyient can, at best, report ZERO revenue growth for FY20. With low promoter shareholding in Cyient (promoter stake at 22.74%), and cheaper valuations (largely due to the below-par financial performance in recent times), it could be a good acquisition target for a company like LTTS.
IE-3 = L&T Tech + Cyient (FY19 numbers) LTTS CYL LTTS + CYL Rev share
Topline ($mn) 724 660 1,384 EBIT margin (%) 16% 12% 14%
Key verticals
Aerospace - 224 224 16%
Transportation 238 81 319 23%
E&U - 86 86 6%
Manufacturing 140 - 140 10%
Medical Devices 51 13 64 5% Telecom 189 147 337 24% Others 106 108 215 16%
Geographies
US 426 376 802 58% EU 216 174 390 28%
ROW 81 110 191 14%
Source: PhillipCapital India Research
An integrated entity (say IE-3.1), formed by merger of these two companies (without taking merger synergies into account), will have a revenue base of US$ 1.4bn, and EBIT margins of 14%. Transport (incl Aero) will constitute 39% of its revenues, followed by Telecom (24%) and Others (16%). The firm will have 28% of its revenues coming from Europe and 58% from the US.
IE-3: SWOT analysis Strength Weakness Opportunity Threat
Strong presence in Aerospace and Transport
Cyient business currently suffering from client specific issues, which could take some time to recover
Strong presence in Plant Engineering
Volatility in revenues due to nature of domain
Diversified revenue profile across verticals
Larger revenue base would open the doors of large clients and deals
Dependence on capex cycle of the industry
Source: PhillipCapital India Research
Page | 13 | PHILLIPCAPITAL INDIA RESEARCH
IT SERVICES SECTOR UPDATE
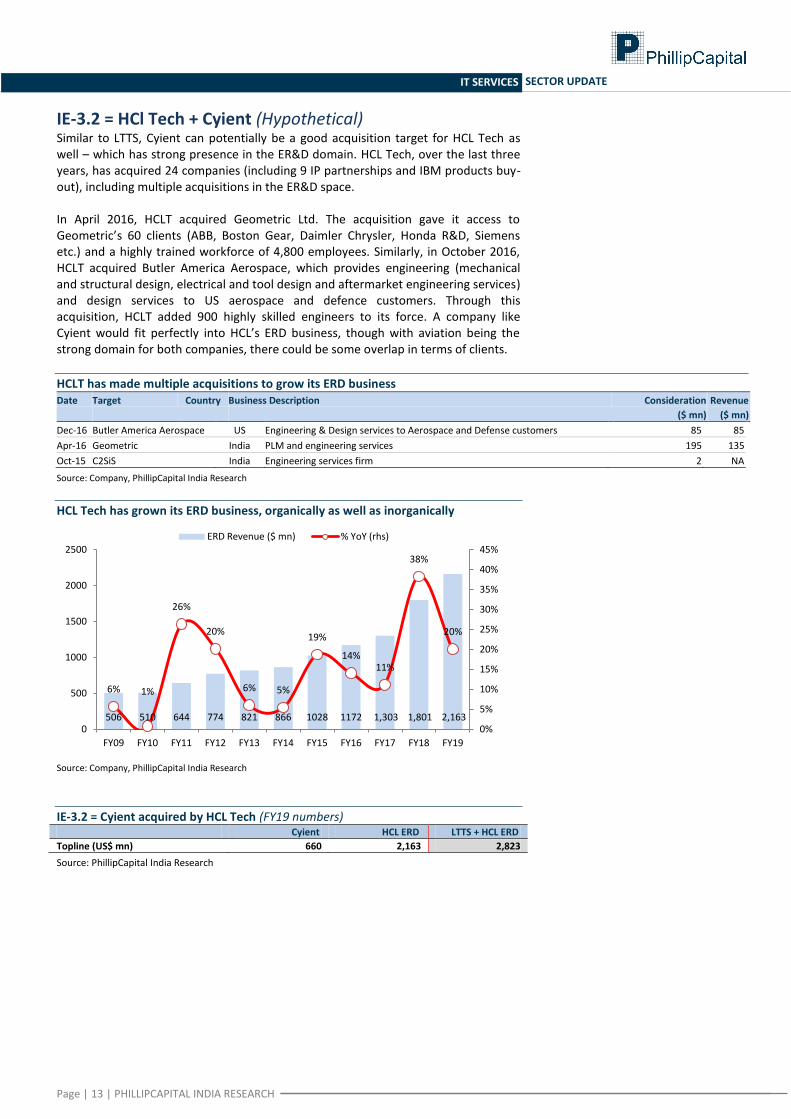
IE-3.2 = HCl Tech + Cyient (Hypothetical) Similar to LTTS, Cyient can potentially be a good acquisition target for HCL Tech as well – which has strong presence in the ER&D domain. HCL Tech, over the last three years, has acquired 24 companies (including 9 IP partnerships and IBM products buy-out), including multiple acquisitions in the ER&D space. In April 2016, HCLT acquired Geometric Ltd. The acquisition gave it access to Geometric’s 60 clients (ABB, Boston Gear, Daimler Chrysler, Honda R&D, Siemens etc.) and a highly trained workforce of 4,800 employees. Similarly, in October 2016, HCLT acquired Butler America Aerospace, which provides engineering (mechanical and structural design, electrical and tool design and aftermarket engineering services) and design services to US aerospace and defence customers. Through this acquisition, HCLT added 900 highly skilled engineers to its force. A company like Cyient would fit perfectly into HCL’s ERD business, though with aviation being the strong domain for both companies, there could be some overlap in terms of clients.
HCLT has made multiple acquisitions to grow its ERD business Date Target Country Business Description Consideration
($ mn)
Revenue
($ mn)
Dec-16 Butler America Aerospace US Engineering & Design services to Aerospace and Defense customers 85 85
Apr-16 Geometric India PLM and engineering services 195 135
Oct-15 C2SiS India Engineering services firm 2 NA
Source: Company, PhillipCapital India Research
HCL Tech has grown its ERD business, organically as well as inorganically
Source: Company, PhillipCapital India Research
IE-3.2 = Cyient acquired by HCL Tech (FY19 numbers) Cyient HCL ERD LTTS + HCL ERD
Topline (US$ mn) 660 2,163 2,823
Source: PhillipCapital India Research
506 510 644 774 821 866 1028 1172 1,303 1,801 2,163
6% 1%
26%
20%
6% 5%
19%
14% 11%
38%
20%
0%
5%
10%
15%
20%
25%
30%
35%
40%
45%
0
500
1000
1500
2000
2500
FY09 FY10 FY11 FY12 FY13 FY14 FY15 FY16 FY17 FY18 FY19
ERD Revenue ($ mn) % YoY (rhs)
Page | 14 | PHILLIPCAPITAL INDIA RESEARCH
IT SERVICES SECTOR UPDATE
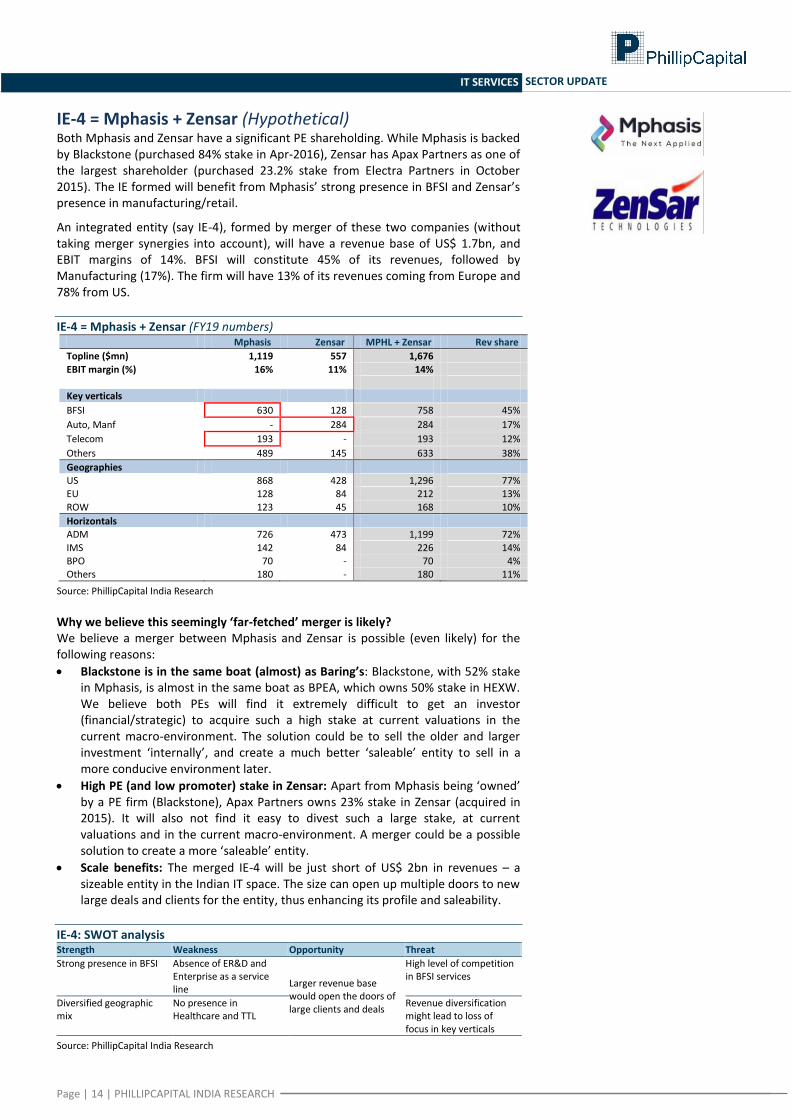
IE-4 = Mphasis + Zensar (Hypothetical) Both Mphasis and Zensar have a significant PE shareholding. While Mphasis is backed by Blackstone (purchased 84% stake in Apr-2016), Zensar has Apax Partners as one of the largest shareholder (purchased 23.2% stake from Electra Partners in October 2015). The IE formed will benefit from Mphasis’ strong presence in BFSI and Zensar’s presence in manufacturing/retail.
An integrated entity (say IE-4), formed by merger of these two companies (without taking merger synergies into account), will have a revenue base of US$ 1.7bn, and EBIT margins of 14%. BFSI will constitute 45% of its revenues, followed by Manufacturing (17%). The firm will have 13% of its revenues coming from Europe and 78% from US.
IE-4 = Mphasis + Zensar (FY19 numbers) Mphasis Zensar MPHL + Zensar Rev share
Topline ($mn) 1,119 557 1,676
EBIT margin (%) 16% 11% 14% Key verticals
BFSI 630 128 758 45%
Auto, Manf - 284 284 17%
Telecom 193 - 193 12%
Others 489 145 633 38%
Geographies US 868 428 1,296 77% EU 128 84 212 13%
ROW 123 45 168 10%
Horizontals ADM 726 473 1,199 72%
IMS 142 84 226 14% BPO 70 - 70 4% Others 180 - 180 11%
Source: PhillipCapital India Research
Why we believe this seemingly ‘far-fetched’ merger is likely? We believe a merger between Mphasis and Zensar is possible (even likely) for the following reasons:
Blackstone is in the same boat (almost) as Baring’s: Blackstone, with 52% stake in Mphasis, is almost in the same boat as BPEA, which owns 50% stake in HEXW. We believe both PEs will find it extremely difficult to get an investor (financial/strategic) to acquire such a high stake at current valuations in the current macro-environment. The solution could be to sell the older and larger investment ‘internally’, and create a much better ‘saleable’ entity to sell in a more conducive environment later.
High PE (and low promoter) stake in Zensar: Apart from Mphasis being ‘owned’ by a PE firm (Blackstone), Apax Partners owns 23% stake in Zensar (acquired in 2015). It will also not find it easy to divest such a large stake, at current valuations and in the current macro-environment. A merger could be a possible solution to create a more ‘saleable’ entity.
Scale benefits: The merged IE-4 will be just short of US$ 2bn in revenues – a sizeable entity in the Indian IT space. The size can open up multiple doors to new large deals and clients for the entity, thus enhancing its profile and saleability.
IE-4: SWOT analysis Strength Weakness Opportunity Threat
Strong presence in BFSI Absence of ER&D and Enterprise as a service line
Larger revenue base would open the doors of large clients and deals
High level of competition in BFSI services
Diversified geographic mix
No presence in Healthcare and TTL
Revenue diversification might lead to loss of focus in key verticals
Source: PhillipCapital India Research
Page | 15 | PHILLIPCAPITAL INDIA RESEARCH
IT SERVICES SECTOR UPDATE
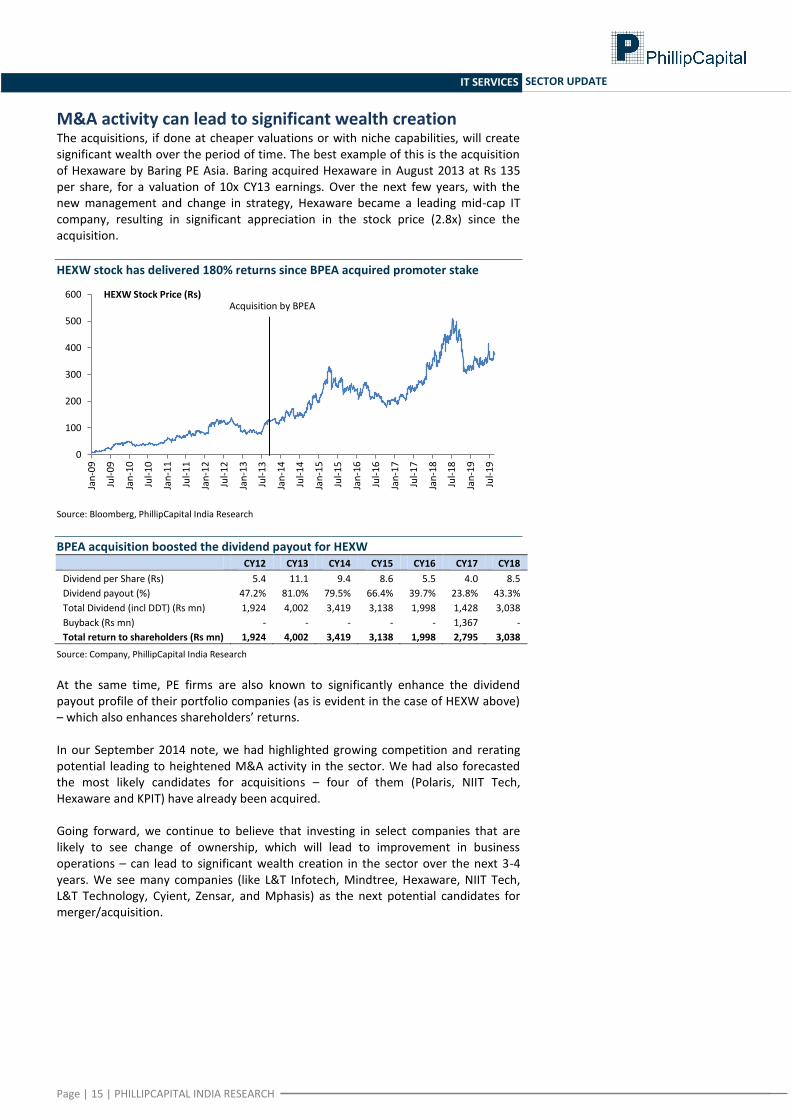
M&A activity can lead to significant wealth creation The acquisitions, if done at cheaper valuations or with niche capabilities, will create significant wealth over the period of time. The best example of this is the acquisition of Hexaware by Baring PE Asia. Baring acquired Hexaware in August 2013 at Rs 135 per share, for a valuation of 10x CY13 earnings. Over the next few years, with the new management and change in strategy, Hexaware became a leading mid-cap IT company, resulting in significant appreciation in the stock price (2.8x) since the acquisition.
HEXW stock has delivered 180% returns since BPEA acquired promoter stake
Source: Bloomberg, PhillipCapital India Research
BPEA acquisition boosted the dividend payout for HEXW CY12 CY13 CY14 CY15 CY16 CY17 CY18
Dividend per Share (Rs) 5.4 11.1 9.4 8.6 5.5 4.0 8.5
Dividend payout (%) 47.2% 81.0% 79.5% 66.4% 39.7% 23.8% 43.3%
Total Dividend (incl DDT) (Rs mn) 1,924 4,002 3,419 3,138 1,998 1,428 3,038
Buyback (Rs mn) - - - - - 1,367 -
Total return to shareholders (Rs mn) 1,924 4,002 3,419 3,138 1,998 2,795 3,038
Source: Company, PhillipCapital India Research At the same time, PE firms are also known to significantly enhance the dividend payout profile of their portfolio companies (as is evident in the case of HEXW above) – which also enhances shareholders’ returns. In our September 2014 note, we had highlighted growing competition and rerating potential leading to heightened M&A activity in the sector. We had also forecasted the most likely candidates for acquisitions – four of them (Polaris, NIIT Tech, Hexaware and KPIT) have already been acquired. Going forward, we continue to believe that investing in select companies that are likely to see change of ownership, which will lead to improvement in business operations – can lead to significant wealth creation in the sector over the next 3-4 years. We see many companies (like L&T Infotech, Mindtree, Hexaware, NIIT Tech, L&T Technology, Cyient, Zensar, and Mphasis) as the next potential candidates for merger/acquisition.
0
100
200
300
400
500
600
Jan
-09
Jul-
09
Jan
-10
Jul-
10
Jan
-11
Jul-
11
Jan
-12
Jul-
12
Jan
-13
Jul-
13
Jan
-14
Jul-
14
Jan
-15
Jul-
15
Jan
-16
Jul-
16
Jan
-17
Jul-
17
Jan
-18
Jul-
18
Jan
-19
Jul-
19
HEXW Stock Price (Rs) Acquisition by BPEA
Page | 16 | PHILLIPCAPITAL INDIA RESEARCH
IT SERVICES SECTOR UPDATE
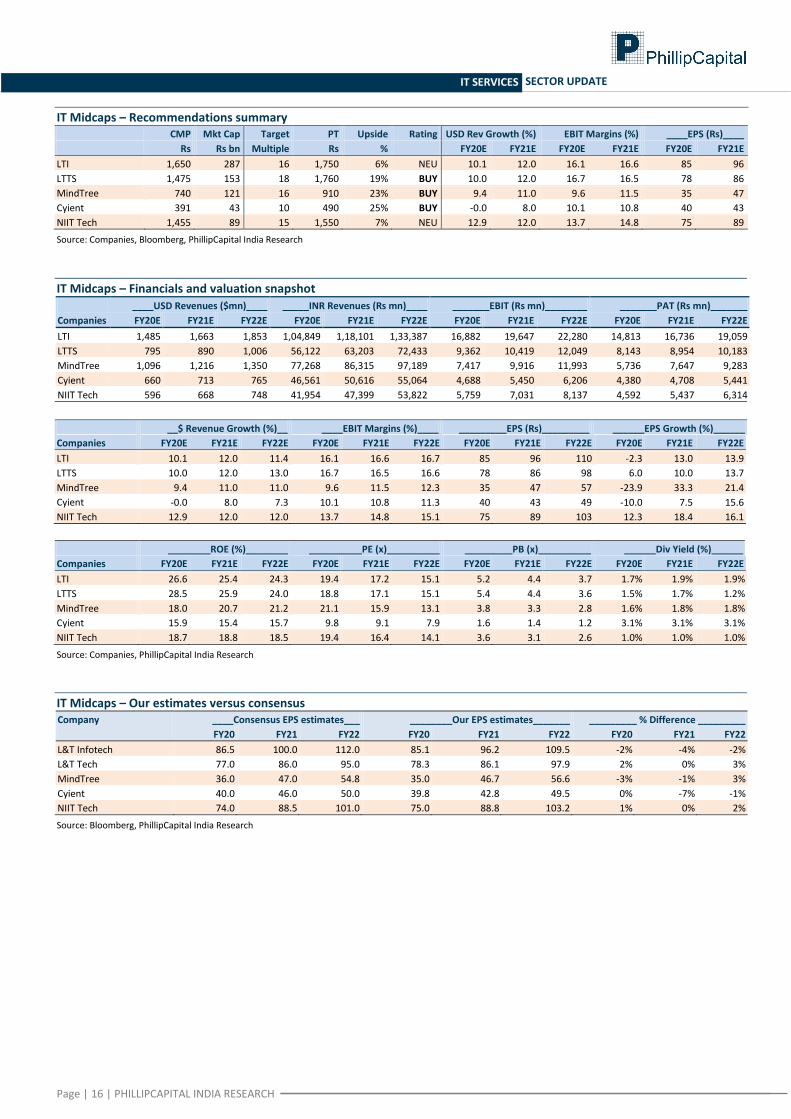
IT Midcaps – Recommendations summary CMP Mkt Cap Target PT Upside Rating USD Rev Growth (%) EBIT Margins (%) ____EPS (Rs)____
Rs Rs bn Multiple Rs % FY20E FY21E FY20E FY21E FY20E FY21E
LTI 1,650 287 16 1,750 6% NEU 10.1 12.0 16.1 16.6 85 96
LTTS 1,475 153 18 1,760 19% BUY 10.0 12.0 16.7 16.5 78 86
MindTree 740 121 16 910 23% BUY 9.4 11.0 9.6 11.5 35 47
Cyient 391 43 10 490 25% BUY -0.0 8.0 10.1 10.8 40 43
NIIT Tech 1,455 89 15 1,550 7% NEU 12.9 12.0 13.7 14.8 75 89
Source: Companies, Bloomberg, PhillipCapital India Research
IT Midcaps – Financials and valuation snapshot ____USD Revenues ($mn)____ _____INR Revenues (Rs mn)____ _______EBIT (Rs mn)________ _______PAT (Rs mn)_______
Companies FY20E FY21E FY22E FY20E FY21E FY22E FY20E FY21E FY22E FY20E FY21E FY22E
LTI 1,485 1,663 1,853 1,04,849 1,18,101 1,33,387 16,882 19,647 22,280 14,813 16,736 19,059
LTTS 795 890 1,006 56,122 63,203 72,433 9,362 10,419 12,049 8,143 8,954 10,183
MindTree 1,096 1,216 1,350 77,268 86,315 97,189 7,417 9,916 11,993 5,736 7,647 9,283
Cyient 660 713 765 46,561 50,616 55,064 4,688 5,450 6,206 4,380 4,708 5,441
NIIT Tech 596 668 748 41,954 47,399 53,822 5,759 7,031 8,137 4,592 5,437 6,314
__$ Revenue Growth (%)__ ____EBIT Margins (%)____ _________EPS (Rs)_________ ______EPS Growth (%)______
Companies FY20E FY21E FY22E FY20E FY21E FY22E FY20E FY21E FY22E FY20E FY21E FY22E
LTI 10.1 12.0 11.4 16.1 16.6 16.7 85 96 110 -2.3 13.0 13.9
LTTS 10.0 12.0 13.0 16.7 16.5 16.6 78 86 98 6.0 10.0 13.7
MindTree 9.4 11.0 11.0 9.6 11.5 12.3 35 47 57 -23.9 33.3 21.4
Cyient -0.0 8.0 7.3 10.1 10.8 11.3 40 43 49 -10.0 7.5 15.6
NIIT Tech 12.9 12.0 12.0 13.7 14.8 15.1 75 89 103 12.3 18.4 16.1
________ROE (%)________ __________PE (x)__________ _________PB (x)__________ ______Div Yield (%)______
Companies FY20E FY21E FY22E FY20E FY21E FY22E FY20E FY21E FY22E FY20E FY21E FY22E
LTI 26.6 25.4 24.3 19.4 17.2 15.1 5.2 4.4 3.7 1.7% 1.9% 1.9%
LTTS 28.5 25.9 24.0 18.8 17.1 15.1 5.4 4.4 3.6 1.5% 1.7% 1.2%
MindTree 18.0 20.7 21.2 21.1 15.9 13.1 3.8 3.3 2.8 1.6% 1.8% 1.8%
Cyient 15.9 15.4 15.7 9.8 9.1 7.9 1.6 1.4 1.2 3.1% 3.1% 3.1%
NIIT Tech 18.7 18.8 18.5 19.4 16.4 14.1 3.6 3.1 2.6 1.0% 1.0% 1.0%
Source: Companies, PhillipCapital India Research
IT Midcaps – Our estimates versus consensus Company ____Consensus EPS estimates___ ________Our EPS estimates_______ _________ % Difference _________
FY20 FY21 FY22 FY20 FY21 FY22 FY20 FY21 FY22
L&T Infotech 86.5 100.0 112.0 85.1 96.2 109.5 -2% -4% -2%
L&T Tech 77.0 86.0 95.0 78.3 86.1 97.9 2% 0% 3%
MindTree 36.0 47.0 54.8 35.0 46.7 56.6 -3% -1% 3%
Cyient 40.0 46.0 50.0 39.8 42.8 49.5 0% -7% -1%
NIIT Tech 74.0 88.5 101.0 75.0 88.8 103.2 1% 0% 2%
Source: Bloomberg, PhillipCapital India Research
INSTITUTIONAL EQUITY RESEARCH
Page | 17 | PHILLIPCAPITAL INDIA RESEARCH
L&T Infotech (LTI IN)
Revenue concentration remains a key risk
INDIA |IT SERVICES | Company Update
12 December 2019
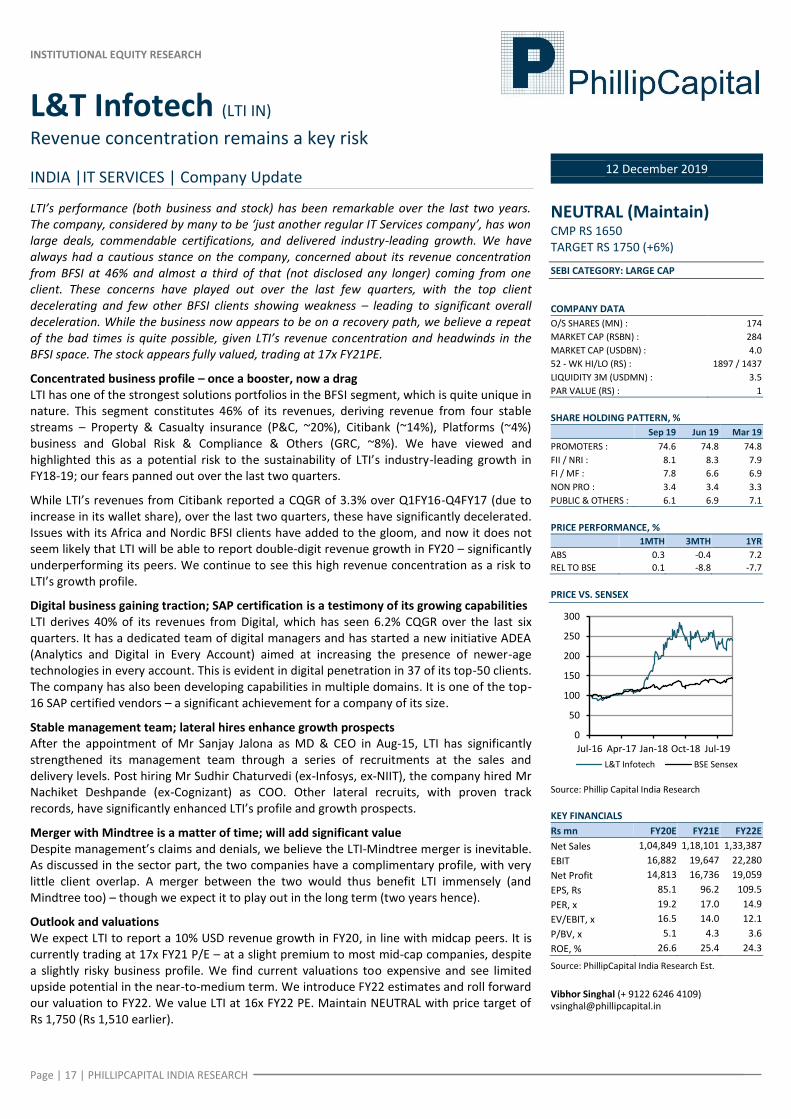
LTI’s performance (both business and stock) has been remarkable over the last two years. The company, considered by many to be ‘just another regular IT Services company’, has won large deals, commendable certifications, and delivered industry-leading growth. We have always had a cautious stance on the company, concerned about its revenue concentration from BFSI at 46% and almost a third of that (not disclosed any longer) coming from one client. These concerns have played out over the last few quarters, with the top client decelerating and few other BFSI clients showing weakness – leading to significant overall deceleration. While the business now appears to be on a recovery path, we believe a repeat of the bad times is quite possible, given LTI’s revenue concentration and headwinds in the BFSI space. The stock appears fully valued, trading at 17x FY21PE.
Concentrated business profile – once a booster, now a drag LTI has one of the strongest solutions portfolios in the BFSI segment, which is quite unique in nature. This segment constitutes 46% of its revenues, deriving revenue from four stable streams – Property & Casualty insurance (P&C, ~20%), Citibank (~14%), Platforms (~4%) business and Global Risk & Compliance & Others (GRC, ~8%). We have viewed and highlighted this as a potential risk to the sustainability of LTI’s industry-leading growth in FY18-19; our fears panned out over the last two quarters.
While LTI’s revenues from Citibank reported a CQGR of 3.3% over Q1FY16-Q4FY17 (due to increase in its wallet share), over the last two quarters, these have significantly decelerated. Issues with its Africa and Nordic BFSI clients have added to the gloom, and now it does not seem likely that LTI will be able to report double-digit revenue growth in FY20 – significantly underperforming its peers. We continue to see this high revenue concentration as a risk to LTI’s growth profile.
Digital business gaining traction; SAP certification is a testimony of its growing capabilities LTI derives 40% of its revenues from Digital, which has seen 6.2% CQGR over the last six quarters. It has a dedicated team of digital managers and has started a new initiative ADEA (Analytics and Digital in Every Account) aimed at increasing the presence of newer-age technologies in every account. This is evident in digital penetration in 37 of its top-50 clients. The company has also been developing capabilities in multiple domains. It is one of the top-16 SAP certified vendors – a significant achievement for a company of its size.
Stable management team; lateral hires enhance growth prospects After the appointment of Mr Sanjay Jalona as MD & CEO in Aug-15, LTI has significantly strengthened its management team through a series of recruitments at the sales and delivery levels. Post hiring Mr Sudhir Chaturvedi (ex-Infosys, ex-NIIT), the company hired Mr Nachiket Deshpande (ex-Cognizant) as COO. Other lateral recruits, with proven track records, have significantly enhanced LTI’s profile and growth prospects.
Merger with Mindtree is a matter of time; will add significant value Despite management’s claims and denials, we believe the LTI-Mindtree merger is inevitable. As discussed in the sector part, the two companies have a complimentary profile, with very little client overlap. A merger between the two would thus benefit LTI immensely (and Mindtree too) – though we expect it to play out in the long term (two years hence).
Outlook and valuations We expect LTI to report a 10% USD revenue growth in FY20, in line with midcap peers. It is currently trading at 17x FY21 P/E – at a slight premium to most mid-cap companies, despite a slightly risky business profile. We find current valuations too expensive and see limited upside potential in the near-to-medium term. We introduce FY22 estimates and roll forward our valuation to FY22. We value LTI at 16x FY22 PE. Maintain NEUTRAL with price target of Rs 1,750 (Rs 1,510 earlier).
NEUTRAL (Maintain) CMP RS 1650 TARGET RS 1750 (+6%)
SEBI CATEGORY: LARGE CAP
COMPANY DATA
O/S SHARES (MN) : 174
MARKET CAP (RSBN) : 284
MARKET CAP (USDBN) : 4.0
52 - WK HI/LO (RS) : 1897 / 1437
LIQUIDITY 3M (USDMN) : 3.5
PAR VALUE (RS) : 1
SHARE HOLDING PATTERN, %
Sep 19 Jun 19 Mar 19
PROMOTERS : 74.6 74.8 74.8
FII / NRI : 8.1 8.3 7.9
FI / MF : 7.8 6.6 6.9
NON PRO : 3.4 3.4 3.3
PUBLIC & OTHERS : 6.1 6.9 7.1
PRICE PERFORMANCE, %
1MTH 3MTH 1YR
ABS 0.3 -0.4 7.2
REL TO BSE 0.1 -8.8 -7.7
PRICE VS. SENSEX
Source: Phillip Capital India Research
KEY FINANCIALS
Rs mn FY20E FY21E FY22E
Net Sales 1,04,849 1,18,101 1,33,387
EBIT 16,882 19,647 22,280
Net Profit 14,813 16,736 19,059
EPS, Rs 85.1 96.2 109.5
PER, x 19.2 17.0 14.9
EV/EBIT, x 16.5 14.0 12.1
P/BV, x 5.1 4.3 3.6
ROE, % 26.6 25.4 24.3
Source: PhillipCapital India Research Est.
Vibhor Singhal (+ 9122 6246 4109) [email protected]
0
50
100
150
200
250
300
Jul-16 Apr-17 Jan-18 Oct-18 Jul-19
L&T Infotech BSE Sensex
Page | 18 | PHILLIPCAPITAL INDIA RESEARCH
L&T INFOTECH COMPANY UPDATE
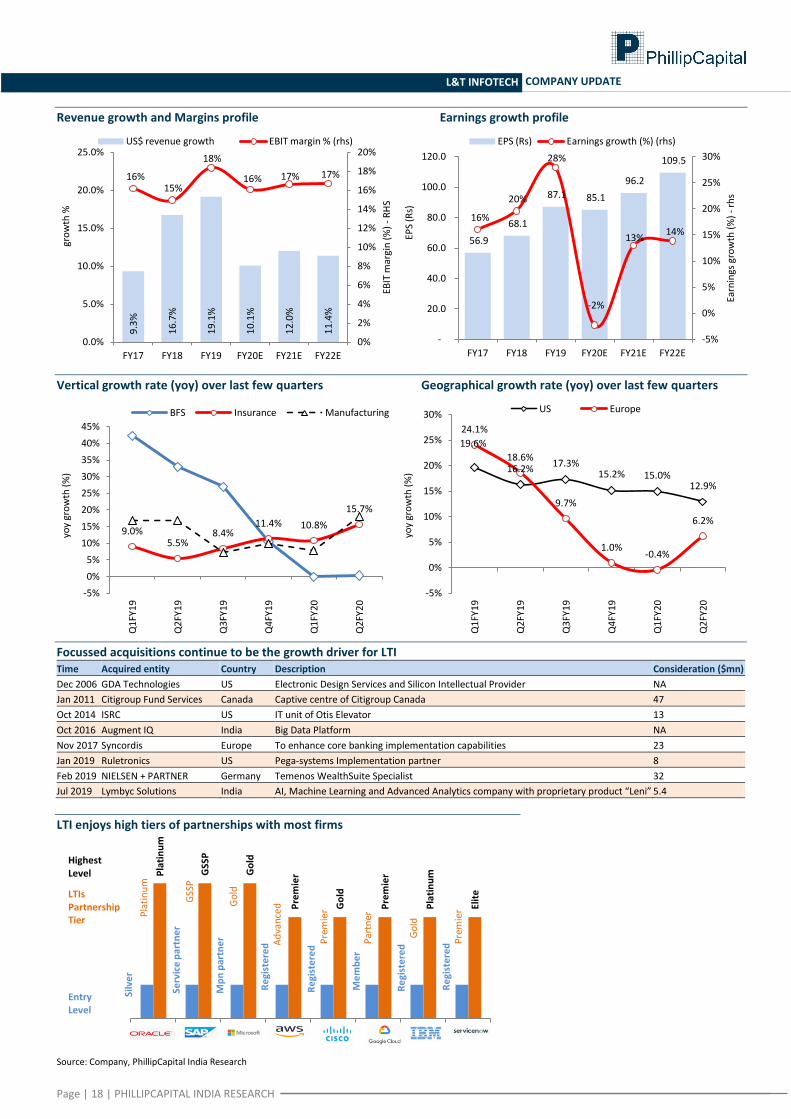
Revenue growth and Margins profile Earnings growth profile
Vertical growth rate (yoy) over last few quarters Geographical growth rate (yoy) over last few quarters
Focussed acquisitions continue to be the growth driver for LTI Time Acquired entity Country Description Consideration ($mn)
Dec 2006 GDA Technologies US Electronic Design Services and Silicon Intellectual Provider NA
Jan 2011 Citigroup Fund Services Canada Captive centre of Citigroup Canada 47
Oct 2014 ISRC US IT unit of Otis Elevator 13
Oct 2016 Augment IQ India Big Data Platform NA
Nov 2017 Syncordis Europe To enhance core banking implementation capabilities 23
Jan 2019 Ruletronics US Pega-systems Implementation partner 8
Feb 2019 NIELSEN + PARTNER Germany Temenos WealthSuite Specialist 32
Jul 2019 Lymbyc Solutions India AI, Machine Learning and Advanced Analytics company with proprietary product “Leni” 5.4
LTI enjoys high tiers of partnerships with most firms
Source: Company, PhillipCapital India Research
9.3
%
16
.7%
19
.1%
10
.1%
12
.0%
11
.4%
16% 15%
18%
16% 17% 17%
0%
2%
4%
6%
8%
10%
12%
14%
16%
18%
20%
0.0%
5.0%
10.0%
15.0%
20.0%
25.0%
FY17 FY18 FY19 FY20E FY21E FY22E
EBIT
mar
gin
(%
) -
RH
S
gro
wth
%
US$ revenue growth EBIT margin % (rhs)
56.9
68.1
87.1 85.1
96.2
109.5
16%
20%
28%
-2%
13% 14%
-5%
0%
5%
10%
15%
20%
25%
30%
-
20.0
40.0
60.0
80.0
100.0
120.0
FY17 FY18 FY19 FY20E FY21E FY22E
Earn
ings
gro
wth
(%
) -
rhs
EPS
(Rs)
EPS (Rs) Earnings growth (%) (rhs)
9.0% 5.5%
8.4% 11.4% 10.8%
15.7%
-5%
0%
5%
10%
15%
20%
25%
30%
35%
40%
45%
Q1
FY1
9
Q2
FY1
9
Q3
FY1
9
Q4
FY1
9
Q1
FY2
0
Q2
FY2
0
yoy
gro
wth
(%
)
BFS Insurance Manufacturing
19.6%
16.2% 17.3%
15.2% 15.0% 12.9%
24.1%
18.6%
9.7%
1.0% -0.4%
6.2%
-5%
0%
5%
10%
15%
20%
25%
30%
Q1
FY1
9
Q2
FY1
9
Q3
FY1
9
Q4
FY1
9
Q1
FY2
0
Q2
FY2
0
yoy
gro
wth
(%
) US Europe
Silv
er
Serv
ice
par
tne
r
Mp
n p
artn
er
Re
gist
ere
d
Re
gist
ere
d
Me
mb
er
Re
gist
ere
d
Re
gist
ere
d
Pla
tin
um
GSS
P
Go
ld
Pre
mie
r
Go
ld
Pre
mie
r
Pla
tin
um
Elit
e
Pla
tin
um
GSS
P
Go
ld
Ad
van
ced
Pre
mie
r
Par
tner
Pre
mie
r
Go
ld
LTIs Partnership Tier
Highest Level
Entry Level
Page | 19 | PHILLIPCAPITAL INDIA RESEARCH
L&T INFOTECH COMPANY UPDATE
Financials
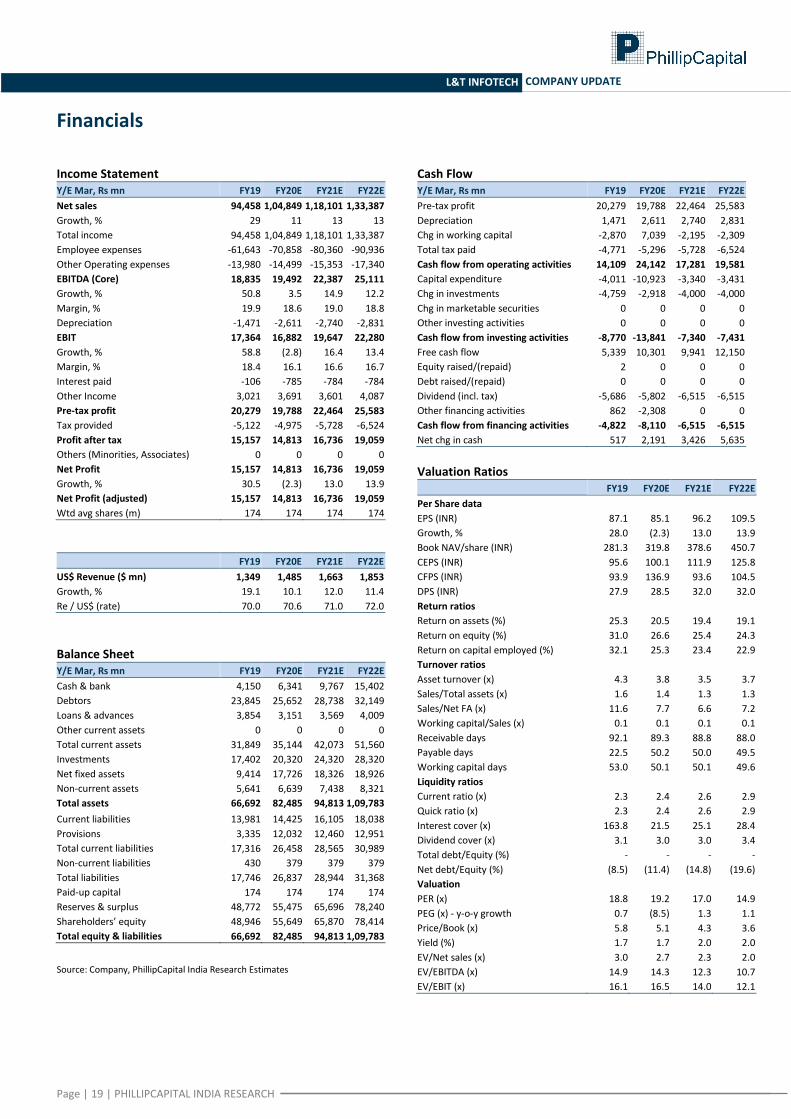
Income Statement Y/E Mar, Rs mn FY19 FY20E FY21E FY22E
Net sales 94,458 1,04,849 1,18,101 1,33,387
Growth, % 29 11 13 13
Total income 94,458 1,04,849 1,18,101 1,33,387
Employee expenses -61,643 -70,858 -80,360 -90,936
Other Operating expenses -13,980 -14,499 -15,353 -17,340
EBITDA (Core) 18,835 19,492 22,387 25,111
Growth, % 50.8 3.5 14.9 12.2
Margin, % 19.9 18.6 19.0 18.8
Depreciation -1,471 -2,611 -2,740 -2,831
EBIT 17,364 16,882 19,647 22,280
Growth, % 58.8 (2.8) 16.4 13.4
Margin, % 18.4 16.1 16.6 16.7
Interest paid -106 -785 -784 -784
Other Income 3,021 3,691 3,601 4,087
Pre-tax profit 20,279 19,788 22,464 25,583
Tax provided -5,122 -4,975 -5,728 -6,524
Profit after tax 15,157 14,813 16,736 19,059
Others (Minorities, Associates) 0 0 0 0
Net Profit 15,157 14,813 16,736 19,059
Growth, % 30.5 (2.3) 13.0 13.9
Net Profit (adjusted) 15,157 14,813 16,736 19,059
Wtd avg shares (m) 174 174 174 174
FY19 FY20E FY21E FY22E
US$ Revenue ($ mn) 1,349 1,485 1,663 1,853
Growth, % 19.1 10.1 12.0 11.4
Re / US$ (rate) 70.0 70.6 71.0 72.0
Balance Sheet Y/E Mar, Rs mn FY19 FY20E FY21E FY22E
Cash & bank 4,150 6,341 9,767 15,402
Debtors 23,845 25,652 28,738 32,149
Loans & advances 3,854 3,151 3,569 4,009
Other current assets 0 0 0 0
Total current assets 31,849 35,144 42,073 51,560
Investments 17,402 20,320 24,320 28,320
Net fixed assets 9,414 17,726 18,326 18,926
Non-current assets 5,641 6,639 7,438 8,321
Total assets 66,692 82,485 94,813 1,09,783
Current liabilities 13,981 14,425 16,105 18,038
Provisions 3,335 12,032 12,460 12,951
Total current liabilities 17,316 26,458 28,565 30,989
Non-current liabilities 430 379 379 379
Total liabilities 17,746 26,837 28,944 31,368
Paid-up capital 174 174 174 174
Reserves & surplus 48,772 55,475 65,696 78,240
Shareholders’ equity 48,946 55,649 65,870 78,414
Total equity & liabilities 66,692 82,485 94,813 1,09,783
Source: Company, PhillipCapital India Research Estimates
Cash Flow Y/E Mar, Rs mn FY19 FY20E FY21E FY22E
Pre-tax profit 20,279 19,788 22,464 25,583
Depreciation 1,471 2,611 2,740 2,831
Chg in working capital -2,870 7,039 -2,195 -2,309
Total tax paid -4,771 -5,296 -5,728 -6,524
Cash flow from operating activities 14,109 24,142 17,281 19,581
Capital expenditure -4,011 -10,923 -3,340 -3,431
Chg in investments -4,759 -2,918 -4,000 -4,000
Chg in marketable securities 0 0 0 0
Other investing activities 0 0 0 0
Cash flow from investing activities -8,770 -13,841 -7,340 -7,431
Free cash flow 5,339 10,301 9,941 12,150
Equity raised/(repaid) 2 0 0 0
Debt raised/(repaid) 0 0 0 0
Dividend (incl. tax) -5,686 -5,802 -6,515 -6,515
Other financing activities 862 -2,308 0 0
Cash flow from financing activities -4,822 -8,110 -6,515 -6,515
Net chg in cash 517 2,191 3,426 5,635
Valuation Ratios
FY19 FY20E FY21E FY22E
Per Share data
EPS (INR) 87.1 85.1 96.2 109.5
Growth, % 28.0 (2.3) 13.0 13.9
Book NAV/share (INR) 281.3 319.8 378.6 450.7
CEPS (INR) 95.6 100.1 111.9 125.8
CFPS (INR) 93.9 136.9 93.6 104.5
DPS (INR) 27.9 28.5 32.0 32.0
Return ratios Return on assets (%) 25.3 20.5 19.4 19.1
Return on equity (%) 31.0 26.6 25.4 24.3
Return on capital employed (%) 32.1 25.3 23.4 22.9
Turnover ratios Asset turnover (x) 4.3 3.8 3.5 3.7
Sales/Total assets (x) 1.6 1.4 1.3 1.3
Sales/Net FA (x) 11.6 7.7 6.6 7.2
Working capital/Sales (x) 0.1 0.1 0.1 0.1
Receivable days 92.1 89.3 88.8 88.0
Payable days 22.5 50.2 50.0 49.5
Working capital days 53.0 50.1 50.1 49.6
Liquidity ratios
Current ratio (x) 2.3 2.4 2.6 2.9
Quick ratio (x) 2.3 2.4 2.6 2.9
Interest cover (x) 163.8 21.5 25.1 28.4
Dividend cover (x) 3.1 3.0 3.0 3.4
Total debt/Equity (%) - - - -
Net debt/Equity (%) (8.5) (11.4) (14.8) (19.6)
Valuation
PER (x) 18.8 19.2 17.0 14.9
PEG (x) - y-o-y growth 0.7 (8.5) 1.3 1.1
Price/Book (x) 5.8 5.1 4.3 3.6
Yield (%) 1.7 1.7 2.0 2.0
EV/Net sales (x) 3.0 2.7 2.3 2.0
EV/EBITDA (x) 14.9 14.3 12.3 10.7
EV/EBIT (x) 16.1 16.5 14.0 12.1
INSTITUTIONAL EQUITY RESEARCH
Page | 20 | PHILLIPCAPITAL INDIA RESEARCH
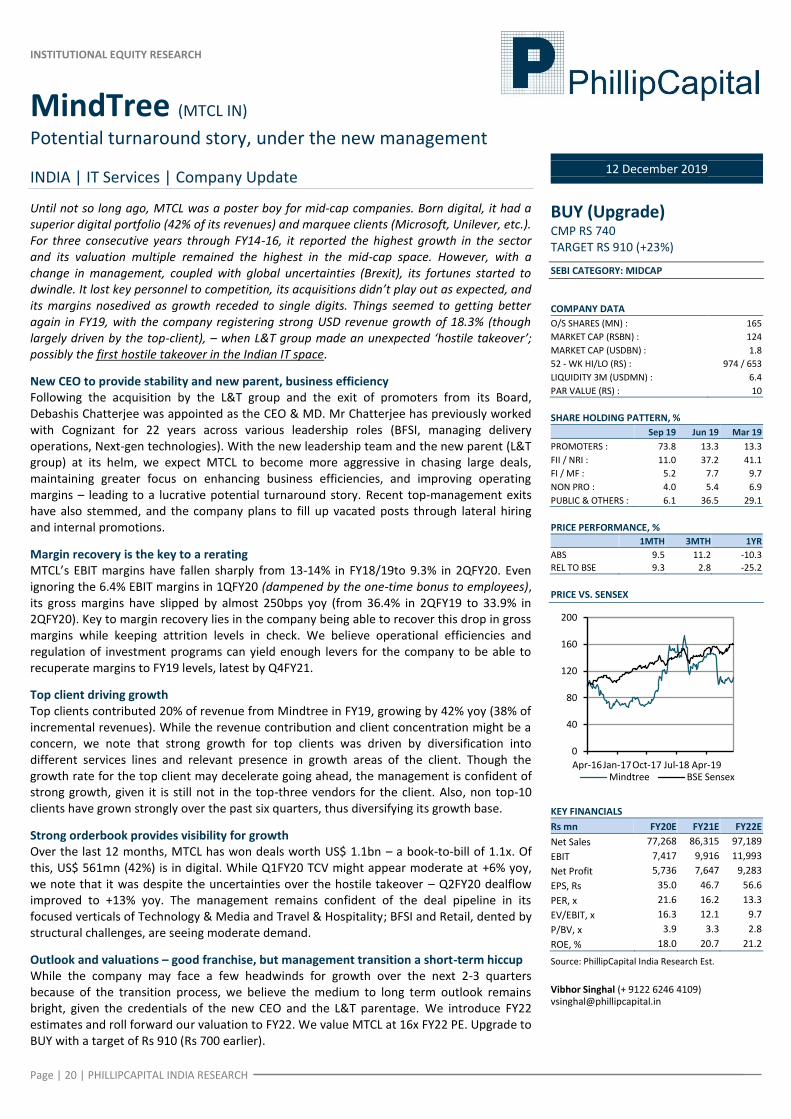
MindTree (MTCL IN)
Potential turnaround story, under the new management
INDIA | IT Services | Company Update
12 December 2019
Until not so long ago, MTCL was a poster boy for mid-cap companies. Born digital, it had a superior digital portfolio (42% of its revenues) and marquee clients (Microsoft, Unilever, etc.). For three consecutive years through FY14-16, it reported the highest growth in the sector and its valuation multiple remained the highest in the mid-cap space. However, with a change in management, coupled with global uncertainties (Brexit), its fortunes started to dwindle. It lost key personnel to competition, its acquisitions didn’t play out as expected, and its margins nosedived as growth receded to single digits. Things seemed to getting better again in FY19, with the company registering strong USD revenue growth of 18.3% (though largely driven by the top-client), – when L&T group made an unexpected ‘hostile takeover’; possibly the first hostile takeover in the Indian IT space.
New CEO to provide stability and new parent, business efficiency Following the acquisition by the L&T group and the exit of promoters from its Board, Debashis Chatterjee was appointed as the CEO & MD. Mr Chatterjee has previously worked with Cognizant for 22 years across various leadership roles (BFSI, managing delivery operations, Next-gen technologies). With the new leadership team and the new parent (L&T group) at its helm, we expect MTCL to become more aggressive in chasing large deals, maintaining greater focus on enhancing business efficiencies, and improving operating margins – leading to a lucrative potential turnaround story. Recent top-management exits have also stemmed, and the company plans to fill up vacated posts through lateral hiring and internal promotions.
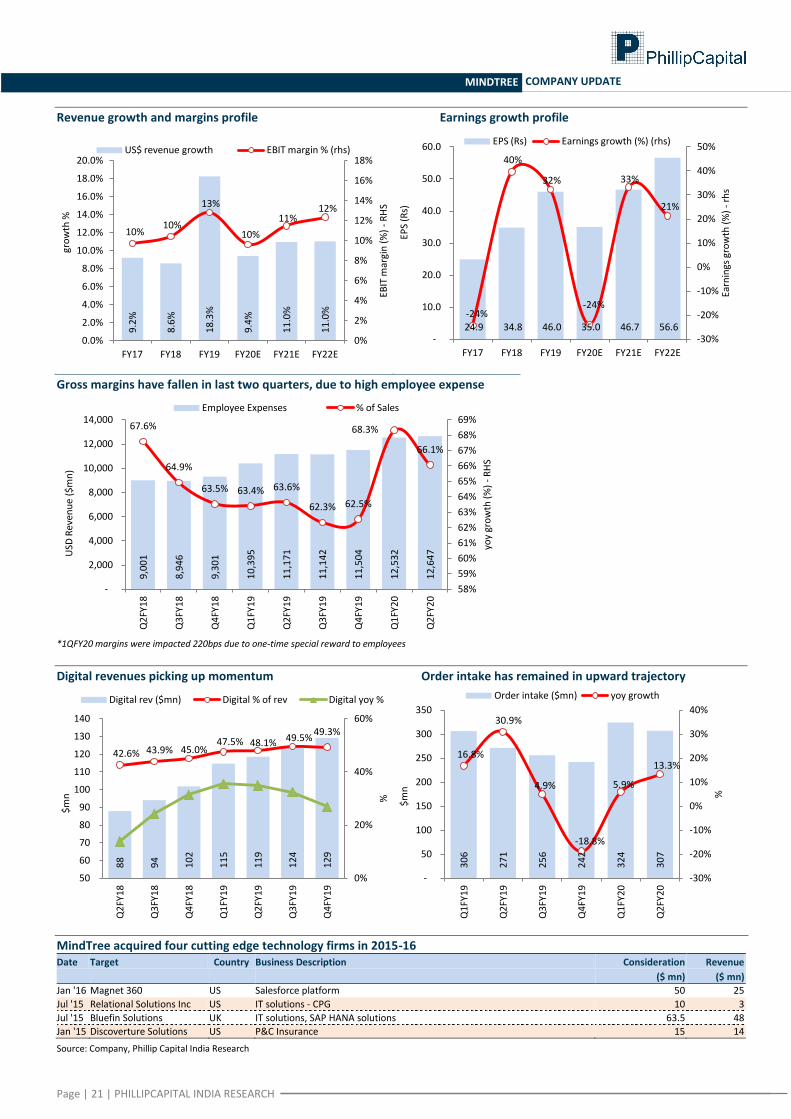
Margin recovery is the key to a rerating MTCL’s EBIT margins have fallen sharply from 13-14% in FY18/19to 9.3% in 2QFY20. Even ignoring the 6.4% EBIT margins in 1QFY20 (dampened by the one-time bonus to employees), its gross margins have slipped by almost 250bps yoy (from 36.4% in 2QFY19 to 33.9% in 2QFY20). Key to margin recovery lies in the company being able to recover this drop in gross margins while keeping attrition levels in check. We believe operational efficiencies and regulation of investment programs can yield enough levers for the company to be able to recuperate margins to FY19 levels, latest by Q4FY21.
Top client driving growth Top clients contributed 20% of revenue from Mindtree in FY19, growing by 42% yoy (38% of incremental revenues). While the revenue contribution and client concentration might be a concern, we note that strong growth for top clients was driven by diversification into different services lines and relevant presence in growth areas of the client. Though the growth rate for the top client may decelerate going ahead, the management is confident of strong growth, given it is still not in the top-three vendors for the client. Also, non top-10 clients have grown strongly over the past six quarters, thus diversifying its growth base.
Strong orderbook provides visibility for growth Over the last 12 months, MTCL has won deals worth US$ 1.1bn – a book-to-bill of 1.1x. Of this, US$ 561mn (42%) is in digital. While Q1FY20 TCV might appear moderate at +6% yoy, we note that it was despite the uncertainties over the hostile takeover – Q2FY20 dealflow improved to +13% yoy. The management remains confident of the deal pipeline in its focused verticals of Technology & Media and Travel & Hospitality; BFSI and Retail, dented by structural challenges, are seeing moderate demand.
Outlook and valuations – good franchise, but management transition a short-term hiccup While the company may face a few headwinds for growth over the next 2-3 quarters because of the transition process, we believe the medium to long term outlook remains bright, given the credentials of the new CEO and the L&T parentage. We introduce FY22 estimates and roll forward our valuation to FY22. We value MTCL at 16x FY22 PE. Upgrade to BUY with a target of Rs 910 (Rs 700 earlier).
BUY (Upgrade) CMP RS 740 TARGET RS 910 (+23%)
SEBI CATEGORY: MIDCAP
COMPANY DATA
O/S SHARES (MN) : 165
MARKET CAP (RSBN) : 124
MARKET CAP (USDBN) : 1.8
52 - WK HI/LO (RS) : 974 / 653
LIQUIDITY 3M (USDMN) : 6.4
PAR VALUE (RS) : 10
SHARE HOLDING PATTERN, %
Sep 19 Jun 19 Mar 19
PROMOTERS : 73.8 13.3 13.3
FII / NRI : 11.0 37.2 41.1
FI / MF : 5.2 7.7 9.7
NON PRO : 4.0 5.4 6.9
PUBLIC & OTHERS : 6.1 36.5 29.1
PRICE PERFORMANCE, %
1MTH 3MTH 1YR
ABS 9.5 11.2 -10.3
REL TO BSE 9.3 2.8 -25.2
PRICE VS. SENSEX
KEY FINANCIALS
Rs mn FY20E FY21E FY22E
Net Sales 77,268 86,315 97,189
EBIT 7,417 9,916 11,993
Net Profit 5,736 7,647 9,283
EPS, Rs 35.0 46.7 56.6
PER, x 21.6 16.2 13.3
EV/EBIT, x 16.3 12.1 9.7
P/BV, x 3.9 3.3 2.8
ROE, % 18.0 20.7 21.2
Source: PhillipCapital India Research Est.
Vibhor Singhal (+ 9122 6246 4109) [email protected]
0
40
80
120
160
200
Apr-16 Jan-17 Oct-17 Jul-18 Apr-19 Mindtree BSE Sensex
Page | 21 | PHILLIPCAPITAL INDIA RESEARCH
MINDTREE COMPANY UPDATE
Revenue growth and margins profile Earnings growth profile
Gross margins have fallen in last two quarters, due to high employee expense
*1QFY20 margins were impacted 220bps due to one-time special reward to employees
Digital revenues picking up momentum Order intake has remained in upward trajectory
MindTree acquired four cutting edge technology firms in 2015-16 Date Target Country Business Description Consideration
($ mn)
Revenue
($ mn)
Jan '16 Magnet 360 US Salesforce platform 50 25
Jul '15 Relational Solutions Inc US IT solutions - CPG 10 3
Jul '15 Bluefin Solutions UK IT solutions, SAP HANA solutions 63.5 48
Jan '15 Discoverture Solutions US P&C Insurance 15 14
Source: Company, Phillip Capital India Research
9.2
%
8.6
%
18
.3%
9.4
%
11
.0%
11
.0%
10% 10%
13%
10%
11% 12%
0%
2%
4%
6%
8%
10%
12%
14%
16%
18%
0.0%
2.0%
4.0%
6.0%
8.0%
10.0%
12.0%
14.0%
16.0%
18.0%
20.0%
FY17 FY18 FY19 FY20E FY21E FY22E
EBIT
mar
gin
(%
) -
RH
S
gro
wth
%
US$ revenue growth EBIT margin % (rhs)
24.9 34.8 46.0 35.0 46.7 56.6 -24%
40%
32%
-24%
33%
21%
-30%
-20%
-10%
0%
10%
20%
30%
40%
50%
-
10.0
20.0
30.0
40.0
50.0
60.0
FY17 FY18 FY19 FY20E FY21E FY22E
Earn
ings
gro
wth
(%
) -
rhs
EPS
(Rs)
EPS (Rs) Earnings growth (%) (rhs) 9
,00
1
8,9
46
9,3
01
10
,39
5
11
,17
1
11
,14
2
11
,50
4
12
,53
2
12
,64
7
67.6%
64.9%
63.5% 63.4% 63.6%
62.3% 62.5%
68.3%
66.1%
58%
59%
60%
61%
62%
63%
64%
65%
66%
67%
68%
69%
-
2,000
4,000
6,000
8,000
10,000
12,000
14,000
Q2
FY1
8
Q3
FY1
8
Q4
FY1
8
Q1
FY1
9
Q2
FY1
9
Q3
FY1
9
Q4
FY1
9
Q1
FY2
0
Q2
FY2
0
yoy
gro
wth
(%
) -
RH
S
USD
Rev
enu
e ($
mn
)
Employee Expenses % of Sales
88
94
10
2
11
5
11
9
12
4
12
9
42.6% 43.9% 45.0% 47.5% 48.1% 49.5%
49.3%
0%
20%
40%
60%
50
60
70
80
90
100
110
120
130
140
Q2
FY1
8
Q3
FY1
8
Q4
FY1
8
Q1
FY1
9
Q2
FY1
9
Q3
FY1
9
Q4
FY1
9
%
$m
n
Digital rev ($mn) Digital % of rev Digital yoy %
30
6
27
1
25
6
24
2
32
4
30
7
16.8%
30.9%
4.9%
-18.8%
5.9%
13.3%
-30%
-20%
-10%
0%
10%
20%
30%
40%
-
50
100
150
200
250
300
350
Q1
FY1
9
Q2
FY1
9
Q3
FY1
9
Q4
FY1
9
Q1
FY2
0
Q2
FY2
0
%
$m
n
Order intake ($mn) yoy growth
Page | 22 | PHILLIPCAPITAL INDIA RESEARCH
MINDTREE COMPANY UPDATE
Financials
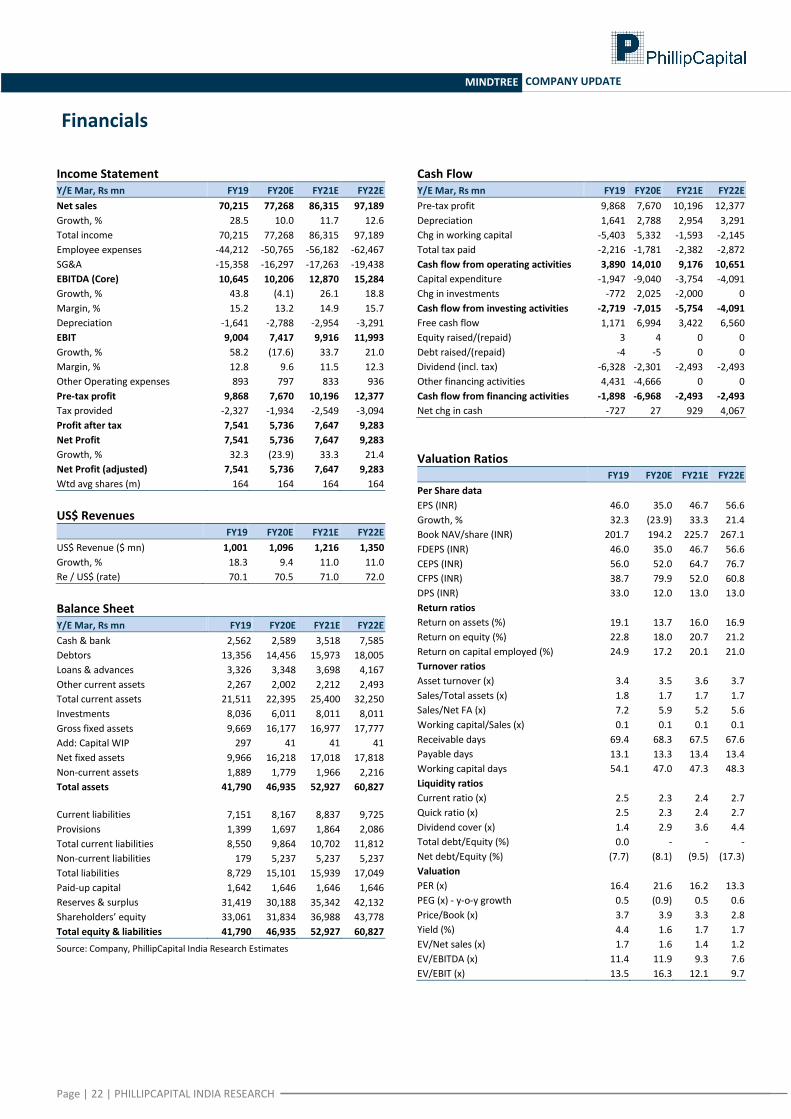
Income Statement Y/E Mar, Rs mn FY19 FY20E FY21E FY22E
Net sales 70,215 77,268 86,315 97,189
Growth, % 28.5 10.0 11.7 12.6
Total income 70,215 77,268 86,315 97,189
Employee expenses -44,212 -50,765 -56,182 -62,467
SG&A -15,358 -16,297 -17,263 -19,438
EBITDA (Core) 10,645 10,206 12,870 15,284
Growth, % 43.8 (4.1) 26.1 18.8
Margin, % 15.2 13.2 14.9 15.7
Depreciation -1,641 -2,788 -2,954 -3,291
EBIT 9,004 7,417 9,916 11,993
Growth, % 58.2 (17.6) 33.7 21.0
Margin, % 12.8 9.6 11.5 12.3
Other Operating expenses 893 797 833 936
Pre-tax profit 9,868 7,670 10,196 12,377
Tax provided -2,327 -1,934 -2,549 -3,094
Profit after tax 7,541 5,736 7,647 9,283
Net Profit 7,541 5,736 7,647 9,283
Growth, % 32.3 (23.9) 33.3 21.4
Net Profit (adjusted) 7,541 5,736 7,647 9,283
Wtd avg shares (m) 164 164 164 164
US$ Revenues FY19 FY20E FY21E FY22E
US$ Revenue ($ mn) 1,001 1,096 1,216 1,350
Growth, % 18.3 9.4 11.0 11.0
Re / US$ (rate) 70.1 70.5 71.0 72.0
Balance Sheet Y/E Mar, Rs mn FY19 FY20E FY21E FY22E
Cash & bank 2,562 2,589 3,518 7,585
Debtors 13,356 14,456 15,973 18,005
Loans & advances 3,326 3,348 3,698 4,167
Other current assets 2,267 2,002 2,212 2,493
Total current assets 21,511 22,395 25,400 32,250
Investments 8,036 6,011 8,011 8,011
Gross fixed assets 9,669 16,177 16,977 17,777
Add: Capital WIP 297 41 41 41
Net fixed assets 9,966 16,218 17,018 17,818
Non-current assets 1,889 1,779 1,966 2,216
Total assets 41,790 46,935 52,927 60,827
Current liabilities 7,151 8,167 8,837 9,725
Provisions 1,399 1,697 1,864 2,086
Total current liabilities 8,550 9,864 10,702 11,812
Non-current liabilities 179 5,237 5,237 5,237
Total liabilities 8,729 15,101 15,939 17,049
Paid-up capital 1,642 1,646 1,646 1,646
Reserves & surplus 31,419 30,188 35,342 42,132
Shareholders’ equity 33,061 31,834 36,988 43,778
Total equity & liabilities 41,790 46,935 52,927 60,827
Source: Company, PhillipCapital India Research Estimates
Cash Flow Y/E Mar, Rs mn FY19 FY20E FY21E FY22E
Pre-tax profit 9,868 7,670 10,196 12,377
Depreciation 1,641 2,788 2,954 3,291
Chg in working capital -5,403 5,332 -1,593 -2,145
Total tax paid -2,216 -1,781 -2,382 -2,872
Cash flow from operating activities 3,890 14,010 9,176 10,651
Capital expenditure -1,947 -9,040 -3,754 -4,091
Chg in investments -772 2,025 -2,000 0
Cash flow from investing activities -2,719 -7,015 -5,754 -4,091
Free cash flow 1,171 6,994 3,422 6,560
Equity raised/(repaid) 3 4 0 0
Debt raised/(repaid) -4 -5 0 0
Dividend (incl. tax) -6,328 -2,301 -2,493 -2,493
Other financing activities 4,431 -4,666 0 0
Cash flow from financing activities -1,898 -6,968 -2,493 -2,493
Net chg in cash -727 27 929 4,067
Valuation Ratios
FY19 FY20E FY21E FY22E
Per Share data
EPS (INR) 46.0 35.0 46.7 56.6
Growth, % 32.3 (23.9) 33.3 21.4
Book NAV/share (INR) 201.7 194.2 225.7 267.1
FDEPS (INR) 46.0 35.0 46.7 56.6
CEPS (INR) 56.0 52.0 64.7 76.7
CFPS (INR) 38.7 79.9 52.0 60.8
DPS (INR) 33.0 12.0 13.0 13.0
Return ratios Return on assets (%) 19.1 13.7 16.0 16.9
Return on equity (%) 22.8 18.0 20.7 21.2
Return on capital employed (%) 24.9 17.2 20.1 21.0
Turnover ratios Asset turnover (x) 3.4 3.5 3.6 3.7
Sales/Total assets (x) 1.8 1.7 1.7 1.7
Sales/Net FA (x) 7.2 5.9 5.2 5.6
Working capital/Sales (x) 0.1 0.1 0.1 0.1
Receivable days 69.4 68.3 67.5 67.6
Payable days 13.1 13.3 13.4 13.4
Working capital days 54.1 47.0 47.3 48.3
Liquidity ratios
Current ratio (x) 2.5 2.3 2.4 2.7
Quick ratio (x) 2.5 2.3 2.4 2.7
Dividend cover (x) 1.4 2.9 3.6 4.4
Total debt/Equity (%) 0.0 - - -
Net debt/Equity (%) (7.7) (8.1) (9.5) (17.3)
Valuation
PER (x) 16.4 21.6 16.2 13.3
PEG (x) - y-o-y growth 0.5 (0.9) 0.5 0.6
Price/Book (x) 3.7 3.9 3.3 2.8
Yield (%) 4.4 1.6 1.7 1.7
EV/Net sales (x) 1.7 1.6 1.4 1.2
EV/EBITDA (x) 11.4 11.9 9.3 7.6
EV/EBIT (x) 13.5 16.3 12.1 9.7
INSTITUTIONAL EQUITY RESEARCH
Page | 23 | PHILLIPCAPITAL INDIA RESEARCH
L&T Technology Services (LTTS IN)
Engineering in the DNA; Valuations getting attractive
INDIA |IT SERVICES | Company Update
12 December 2019
LTTS has reported strong performance in FY18/19, – outperforming peers with 20%/25% yoy growth in US revenues. While it started FY20 with a guidance of 14-16% USD growth (and has reported 13% yoy growth in 1HFY20), persistent weakness in telecom/hi-tech (due to global trade concerns) has led to the management cutting its guidance twice – to the current 10-12% growth. All along, the dealflow and performance in other segments remains strong. We do not see any cascading effect of the expected weak performance of 2HFY20 and expect the company to revert to its strong growth path in FY21. The growth will be driven by strong deal-flow and continued strength in Transport & Plant design. With time correction (-2% returns in the last 12 months), the stock is no longer expensive, and presents an attractive risk-reward profile. We upgrade to BUY.
Telecom & Hi-tech have remained volatile; Transport remains strong Telecom & Hi-tech (20% of revenue) has remained volatile for LTTS due to macro (highly competitive domain, global uncertainties) and micro (ramp-down by key clients) reasons. While in FY18, the segment saw a strong recovery (+66% yoy), driven by large deal wins and acquisition of Esencia, the segment has declined by -12% yoy in 1HFY20. The managements continues to expect a weak 2HFY20 for the segment. We expect 3QFY20 to the bottom for the segment, with pick-up in deal activity and low-base driving growth in FY21.
On the other hand, LTTS continues to see strong traction in Transport (35% of revenue), CQGR of 6% over last eight quarters. The management remains highly optimistic about the domain, though near term bumps might be seen amidst global trade war and dwindling auto sales across the globe.
Plant Engineering recovered in FY19 Plant Engineering is a segment that involves part/complete design of plants for various chemicals, FMCG, and petroleum companies. LTTS has a competitive advantage in this domain and has been able to make inroads into many clients (Shell, Unilever, P&G) because of its parent company L&T. The segment had remained muted over FY17-18, due to lower incremental capex by clients in E&U and retail segments. With crude prices now inching up, and retail companies looking to expand capacity, the segment is already witnessing a revival (FY19/1HFY20 growth of 38%/29% yoy).
IP monetization to aide margin LTTS is betting big on monetization of its IPs. It is looking to develop plug-and-play solutions for various industries, and monetize them to implement the ‘develop once deploy multiple’ strategy. It has developed various IP platforms like UBIQWeise, WAGES, and I-BEMS. In fact, one of its Israel-based clients recently launched the “Smartest Office in the World” project – which is being run on LTTS’ smart campus platform i-BEMS. The company intends to increase the higher-margin IP revenue. Any traction in IP business can lead to significant margin expansion (US$ 1mn of incremental IP revenue results in 80bps margin expansion).
Potential candidate for M&A activity We see LTTS as a potential M&A candidate, though more as an acquirer. We believe if LTTS continues to do well, and Cyient continues to struggle, LTTS’ management wouldn’t be shy of exploring M&A opportunities with Cyient – given Cyient’s strong clientele (especially in aerospace) and L&S management track record (recent Mindtree acquisition).
Outlook and valuations We expect revenue CAGR of 12% over FY19-22 — one of the highest in our coverage universe. We continue to like companies in the ERD space, – especially LTTS, with its diversified profile and strong credentials. With time correction, the valuations that once appeared expensive are now getting into the attractive range. We introduce FY22 estimates and roll forward our valuation to FY22. We value LTTS at 18x FY22 PE. Upgrade to BUY with target of Rs 1,760 (Rs 1,530 earlier).
BUY (Upgrade) CMP RS 1475 TARGET RS 1760 (+19%)
SEBI CATEGORY: MIDCAP
COMPANY DATA
O/S SHARES (MN) : 104
MARKET CAP (RSBN) : 156
MARKET CAP (USDBN) : 2.2
52 - WK HI/LO (RS) : 1818 / 1396
LIQUIDITY 3M (USDMN) : 2.7
PAR VALUE (RS) : 10
SHARE HOLDING PATTERN, %
Sep 19 Jun 19 Mar 19
PROMOTERS : 75.0 75.0 78.9
FII / NRI : 9.8 9.4 5.1
FI / MF : 3.9 3.9 4.4
NON PRO : 3.6 2.4 3.2
PUBLIC & OTHERS : 7.7 9.4 8.4
PRICE PERFORMANCE, %
1MTH 3MTH 1YR
ABS 3.4 -7.6 -3.6
REL TO BSE 3.3 -16.0 -18.5
PRICE VS. SENSEX
KEY FINANCIALS
Rs mn FY20E FY21E FY22E
Net Sales 56,122 63,203 72,433
EBIT 9,362 10,419 12,049
Net Profit 8,143 8,954 10,183
EPS, Rs 78.3 86.1 97.9
PER, x 19.1 17.4 15.3
EV/EBIT, x 16.6 14.8 12.5
P/BV, x 5.4 4.5 3.7
ROE, % 28.5 25.9 24.0
Source: PhillipCapital India Research Est.
Vibhor Singhal (+ 9122 6246 4109) [email protected]
60
80
100
120
140
160
180
200
220
Oct-16 Oct-17 Oct-18 Oct-19
L&T Tech BSE Sensex
read
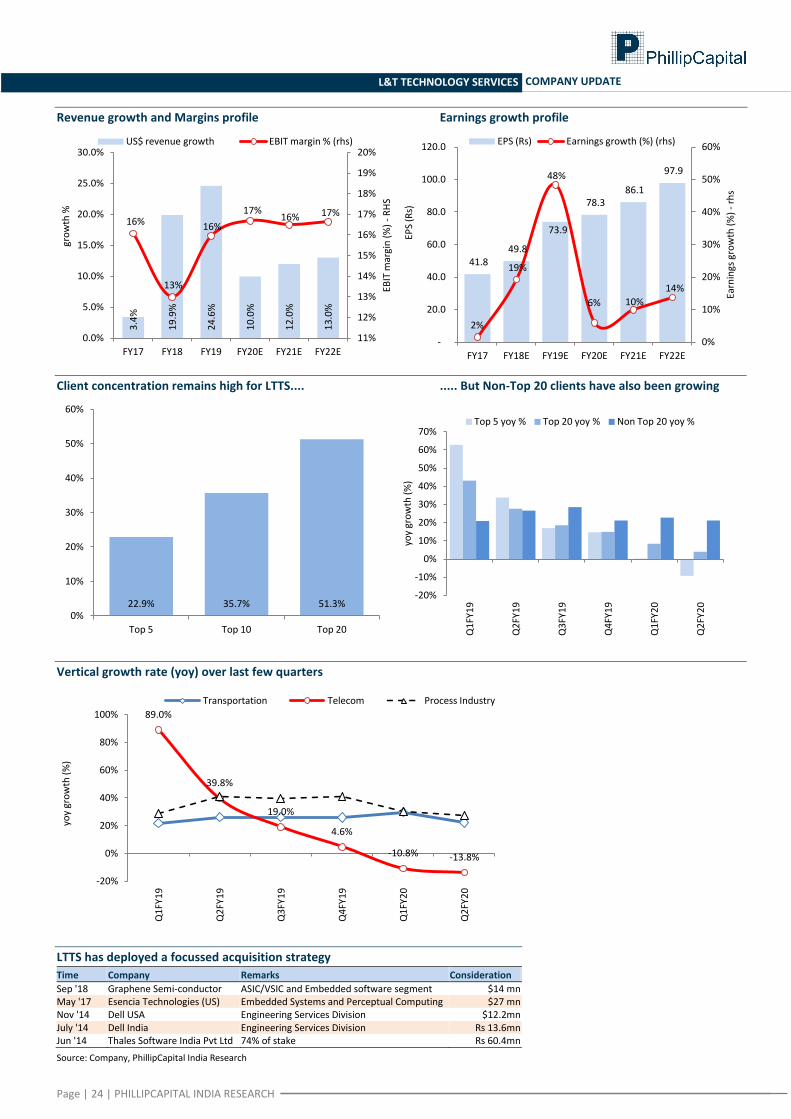
Page | 24 | PHILLIPCAPITAL INDIA RESEARCH
L&T TECHNOLOGY SERVICES COMPANY UPDATE
Revenue growth and Margins profile Earnings growth profile
Client concentration remains high for LTTS.... ..... But Non-Top 20 clients have also been growing
Vertical growth rate (yoy) over last few quarters
LTTS has deployed a focussed acquisition strategy
Time Company Remarks Consideration
Sep '18 Graphene Semi-conductor ASIC/VSIC and Embedded software segment $14 mn May '17 Esencia Technologies (US) Embedded Systems and Perceptual Computing $27 mn Nov '14 Dell USA Engineering Services Division $12.2mn July '14 Dell India Engineering Services Division Rs 13.6mn Jun '14 Thales Software India Pvt Ltd 74% of stake Rs 60.4mn
Source: Company, PhillipCapital India Research
3.4
%
19
.9%
24
.6%
10
.0%
12
.0%
13
.0%
16%
13%
16%
17% 16% 17%
11%
12%
13%
14%
15%
16%
17%
18%
19%
20%
0.0%
5.0%
10.0%
15.0%
20.0%
25.0%
30.0%
FY17 FY18 FY19 FY20E FY21E FY22E
EBIT
mar
gin
(%
) -
RH
S
gro
wth
%
US$ revenue growth EBIT margin % (rhs)
41.8 49.8
73.9
78.3 86.1
97.9
2%
19%
48%
6% 10%
14%
0%
10%
20%
30%
40%
50%
60%
-
20.0
40.0
60.0
80.0
100.0
120.0
FY17 FY18E FY19E FY20E FY21E FY22E
Earn
ings
gro
wth
(%
) -
rhs
EPS
(Rs)
EPS (Rs) Earnings growth (%) (rhs)
22.9% 35.7% 51.3% 0%
10%
20%
30%
40%
50%
60%
Top 5 Top 10 Top 20
-20%
-10%
0%
10%
20%
30%
40%
50%
60%
70%
Q1
FY1
9
Q2
FY1
9
Q3
FY1
9
Q4
FY1
9
Q1
FY2
0
Q2
FY2
0
yoy
gro
wth
(%
)
Top 5 yoy % Top 20 yoy % Non Top 20 yoy %
89.0%
39.8%
19.0%
4.6%
-10.8% -13.8%
-20%
0%
20%
40%
60%
80%
100%
Q1
FY1
9
Q2
FY1
9
Q3
FY1
9
Q4
FY1
9
Q1
FY2
0
Q2
FY2
0
yoy
gro
wth
(%
)
Transportation Telecom Process Industry
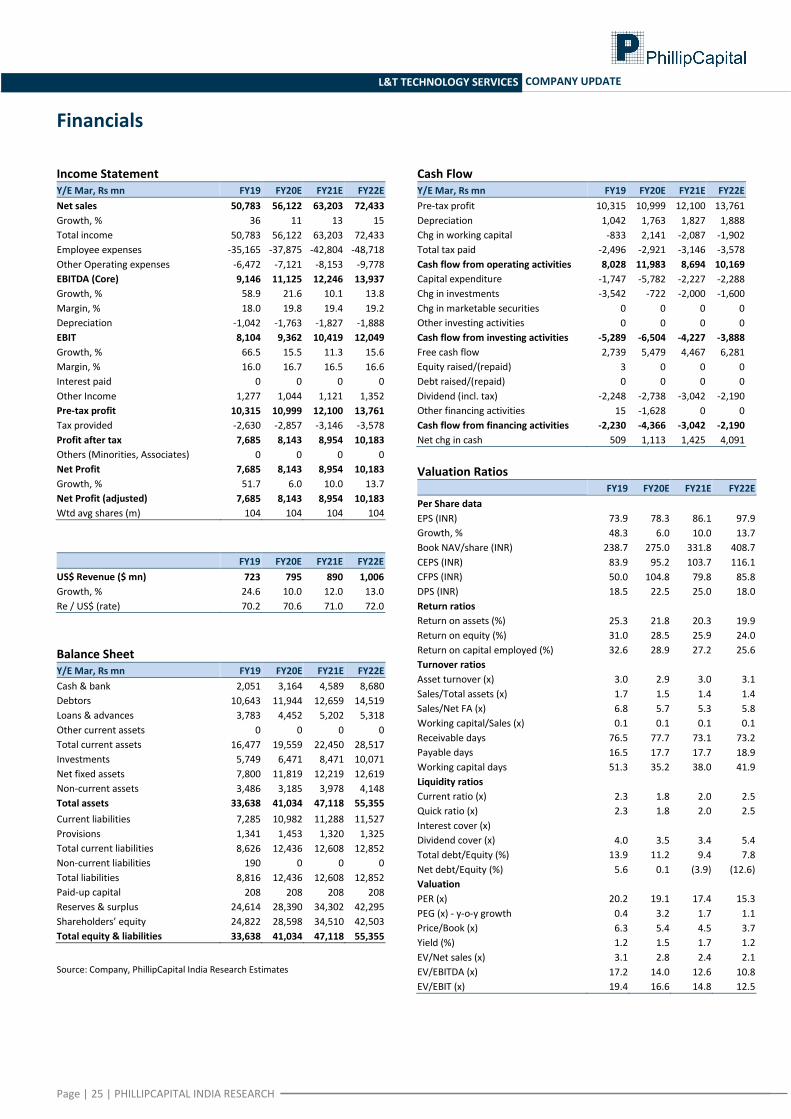
Page | 25 | PHILLIPCAPITAL INDIA RESEARCH
L&T TECHNOLOGY SERVICES COMPANY UPDATE
Financials
Income Statement Y/E Mar, Rs mn FY19 FY20E FY21E FY22E
Net sales 50,783 56,122 63,203 72,433
Growth, % 36 11 13 15
Total income 50,783 56,122 63,203 72,433
Employee expenses -35,165 -37,875 -42,804 -48,718
Other Operating expenses -6,472 -7,121 -8,153 -9,778
EBITDA (Core) 9,146 11,125 12,246 13,937
Growth, % 58.9 21.6 10.1 13.8
Margin, % 18.0 19.8 19.4 19.2
Depreciation -1,042 -1,763 -1,827 -1,888
EBIT 8,104 9,362 10,419 12,049
Growth, % 66.5 15.5 11.3 15.6
Margin, % 16.0 16.7 16.5 16.6
Interest paid 0 0 0 0
Other Income 1,277 1,044 1,121 1,352
Pre-tax profit 10,315 10,999 12,100 13,761
Tax provided -2,630 -2,857 -3,146 -3,578
Profit after tax 7,685 8,143 8,954 10,183
Others (Minorities, Associates) 0 0 0 0
Net Profit 7,685 8,143 8,954 10,183
Growth, % 51.7 6.0 10.0 13.7
Net Profit (adjusted) 7,685 8,143 8,954 10,183
Wtd avg shares (m) 104 104 104 104
FY19 FY20E FY21E FY22E
US$ Revenue ($ mn) 723 795 890 1,006
Growth, % 24.6 10.0 12.0 13.0
Re / US$ (rate) 70.2 70.6 71.0 72.0
Balance Sheet Y/E Mar, Rs mn FY19 FY20E FY21E FY22E
Cash & bank 2,051 3,164 4,589 8,680
Debtors 10,643 11,944 12,659 14,519
Loans & advances 3,783 4,452 5,202 5,318
Other current assets 0 0 0 0
Total current assets 16,477 19,559 22,450 28,517
Investments 5,749 6,471 8,471 10,071
Net fixed assets 7,800 11,819 12,219 12,619
Non-current assets 3,486 3,185 3,978 4,148
Total assets 33,638 41,034 47,118 55,355
Current liabilities 7,285 10,982 11,288 11,527
Provisions 1,341 1,453 1,320 1,325
Total current liabilities 8,626 12,436 12,608 12,852
Non-current liabilities 190 0 0 0
Total liabilities 8,816 12,436 12,608 12,852
Paid-up capital 208 208 208 208
Reserves & surplus 24,614 28,390 34,302 42,295
Shareholders’ equity 24,822 28,598 34,510 42,503
Total equity & liabilities 33,638 41,034 47,118 55,355
Source: Company, PhillipCapital India Research Estimates
Cash Flow Y/E Mar, Rs mn FY19 FY20E FY21E FY22E
Pre-tax profit 10,315 10,999 12,100 13,761
Depreciation 1,042 1,763 1,827 1,888
Chg in working capital -833 2,141 -2,087 -1,902
Total tax paid -2,496 -2,921 -3,146 -3,578
Cash flow from operating activities 8,028 11,983 8,694 10,169
Capital expenditure -1,747 -5,782 -2,227 -2,288
Chg in investments -3,542 -722 -2,000 -1,600
Chg in marketable securities 0 0 0 0
Other investing activities 0 0 0 0
Cash flow from investing activities -5,289 -6,504 -4,227 -3,888
Free cash flow 2,739 5,479 4,467 6,281
Equity raised/(repaid) 3 0 0 0
Debt raised/(repaid) 0 0 0 0
Dividend (incl. tax) -2,248 -2,738 -3,042 -2,190
Other financing activities 15 -1,628 0 0
Cash flow from financing activities -2,230 -4,366 -3,042 -2,190
Net chg in cash 509 1,113 1,425 4,091
Valuation Ratios
FY19 FY20E FY21E FY22E
Per Share data
EPS (INR) 73.9 78.3 86.1 97.9
Growth, % 48.3 6.0 10.0 13.7
Book NAV/share (INR) 238.7 275.0 331.8 408.7
CEPS (INR) 83.9 95.2 103.7 116.1
CFPS (INR) 50.0 104.8 79.8 85.8
DPS (INR) 18.5 22.5 25.0 18.0
Return ratios Return on assets (%) 25.3 21.8 20.3 19.9
Return on equity (%) 31.0 28.5 25.9 24.0
Return on capital employed (%) 32.6 28.9 27.2 25.6
Turnover ratios Asset turnover (x) 3.0 2.9 3.0 3.1
Sales/Total assets (x) 1.7 1.5 1.4 1.4
Sales/Net FA (x) 6.8 5.7 5.3 5.8
Working capital/Sales (x) 0.1 0.1 0.1 0.1
Receivable days 76.5 77.7 73.1 73.2
Payable days 16.5 17.7 17.7 18.9
Working capital days 51.3 35.2 38.0 41.9
Liquidity ratios
Current ratio (x) 2.3 1.8 2.0 2.5
Quick ratio (x) 2.3 1.8 2.0 2.5
Interest cover (x) Dividend cover (x) 4.0 3.5 3.4 5.4
Total debt/Equity (%) 13.9 11.2 9.4 7.8
Net debt/Equity (%) 5.6 0.1 (3.9) (12.6)
Valuation
PER (x) 20.2 19.1 17.4 15.3
PEG (x) - y-o-y growth 0.4 3.2 1.7 1.1
Price/Book (x) 6.3 5.4 4.5 3.7
Yield (%) 1.2 1.5 1.7 1.2
EV/Net sales (x) 3.1 2.8 2.4 2.1
EV/EBITDA (x) 17.2 14.0 12.6 10.8
EV/EBIT (x) 19.4 16.6 14.8 12.5
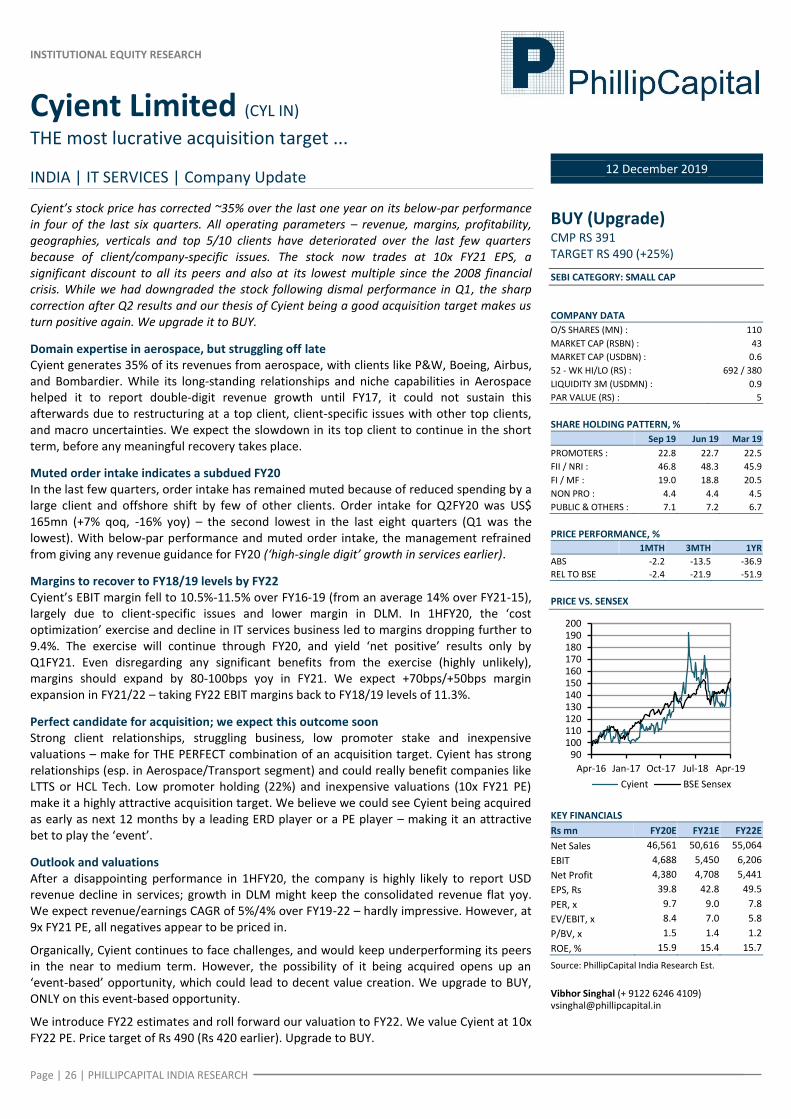
INSTITUTIONAL EQUITY RESEARCH
Page | 26 | PHILLIPCAPITAL INDIA RESEARCH
Cyient Limited (CYL IN)
THE most lucrative acquisition target ...
INDIA | IT SERVICES | Company Update
12 December 2019
Cyient’s stock price has corrected ~35% over the last one year on its below-par performance in four of the last six quarters. All operating parameters – revenue, margins, profitability, geographies, verticals and top 5/10 clients have deteriorated over the last few quarters because of client/company-specific issues. The stock now trades at 10x FY21 EPS, a significant discount to all its peers and also at its lowest multiple since the 2008 financial crisis. While we had downgraded the stock following dismal performance in Q1, the sharp correction after Q2 results and our thesis of Cyient being a good acquisition target makes us turn positive again. We upgrade it to BUY.
Domain expertise in aerospace, but struggling off late Cyient generates 35% of its revenues from aerospace, with clients like P&W, Boeing, Airbus, and Bombardier. While its long-standing relationships and niche capabilities in Aerospace helped it to report double-digit revenue growth until FY17, it could not sustain this afterwards due to restructuring at a top client, client-specific issues with other top clients, and macro uncertainties. We expect the slowdown in its top client to continue in the short term, before any meaningful recovery takes place.
Muted order intake indicates a subdued FY20 In the last few quarters, order intake has remained muted because of reduced spending by a large client and offshore shift by few of other clients. Order intake for Q2FY20 was US$ 165mn (+7% qoq, -16% yoy) – the second lowest in the last eight quarters (Q1 was the lowest). With below-par performance and muted order intake, the management refrained from giving any revenue guidance for FY20 (‘high-single digit’ growth in services earlier).
Margins to recover to FY18/19 levels by FY22 Cyient’s EBIT margin fell to 10.5%-11.5% over FY16-19 (from an average 14% over FY21-15), largely due to client-specific issues and lower margin in DLM. In 1HFY20, the ‘cost optimization’ exercise and decline in IT services business led to margins dropping further to 9.4%. The exercise will continue through FY20, and yield ‘net positive’ results only by Q1FY21. Even disregarding any significant benefits from the exercise (highly unlikely), margins should expand by 80-100bps yoy in FY21. We expect +70bps/+50bps margin expansion in FY21/22 – taking FY22 EBIT margins back to FY18/19 levels of 11.3%.
Perfect candidate for acquisition; we expect this outcome soon Strong client relationships, struggling business, low promoter stake and inexpensive valuations – make for THE PERFECT combination of an acquisition target. Cyient has strong relationships (esp. in Aerospace/Transport segment) and could really benefit companies like LTTS or HCL Tech. Low promoter holding (22%) and inexpensive valuations (10x FY21 PE) make it a highly attractive acquisition target. We believe we could see Cyient being acquired as early as next 12 months by a leading ERD player or a PE player – making it an attractive bet to play the ‘event’.
Outlook and valuations After a disappointing performance in 1HFY20, the company is highly likely to report USD revenue decline in services; growth in DLM might keep the consolidated revenue flat yoy. We expect revenue/earnings CAGR of 5%/4% over FY19-22 – hardly impressive. However, at 9x FY21 PE, all negatives appear to be priced in.
Organically, Cyient continues to face challenges, and would keep underperforming its peers in the near to medium term. However, the possibility of it being acquired opens up an ‘event-based’ opportunity, which could lead to decent value creation. We upgrade to BUY, ONLY on this event-based opportunity.
We introduce FY22 estimates and roll forward our valuation to FY22. We value Cyient at 10x FY22 PE. Price target of Rs 490 (Rs 420 earlier). Upgrade to BUY.
BUY (Upgrade) CMP RS 391 TARGET RS 490 (+25%)
SEBI CATEGORY: SMALL CAP
COMPANY DATA
O/S SHARES (MN) : 110
MARKET CAP (RSBN) : 43
MARKET CAP (USDBN) : 0.6
52 - WK HI/LO (RS) : 692 / 380
LIQUIDITY 3M (USDMN) : 0.9
PAR VALUE (RS) : 5
SHARE HOLDING PATTERN, %
Sep 19 Jun 19 Mar 19
PROMOTERS : 22.8 22.7 22.5
FII / NRI : 46.8 48.3 45.9
FI / MF : 19.0 18.8 20.5
NON PRO : 4.4 4.4 4.5
PUBLIC & OTHERS : 7.1 7.2 6.7
PRICE PERFORMANCE, %
1MTH 3MTH 1YR
ABS -2.2 -13.5 -36.9
REL TO BSE -2.4 -21.9 -51.9
PRICE VS. SENSEX
KEY FINANCIALS
Rs mn FY20E FY21E FY22E
Net Sales 46,561 50,616 55,064
EBIT 4,688 5,450 6,206
Net Profit 4,380 4,708 5,441
EPS, Rs 39.8 42.8 49.5
PER, x 9.7 9.0 7.8
EV/EBIT, x 8.4 7.0 5.8
P/BV, x 1.5 1.4 1.2
ROE, % 15.9 15.4 15.7
Source: PhillipCapital India Research Est.
Vibhor Singhal (+ 9122 6246 4109) [email protected]
90 100 110 120 130 140 150 160 170 180 190 200
Apr-16 Jan-17 Oct-17 Jul-18 Apr-19
Cyient BSE Sensex
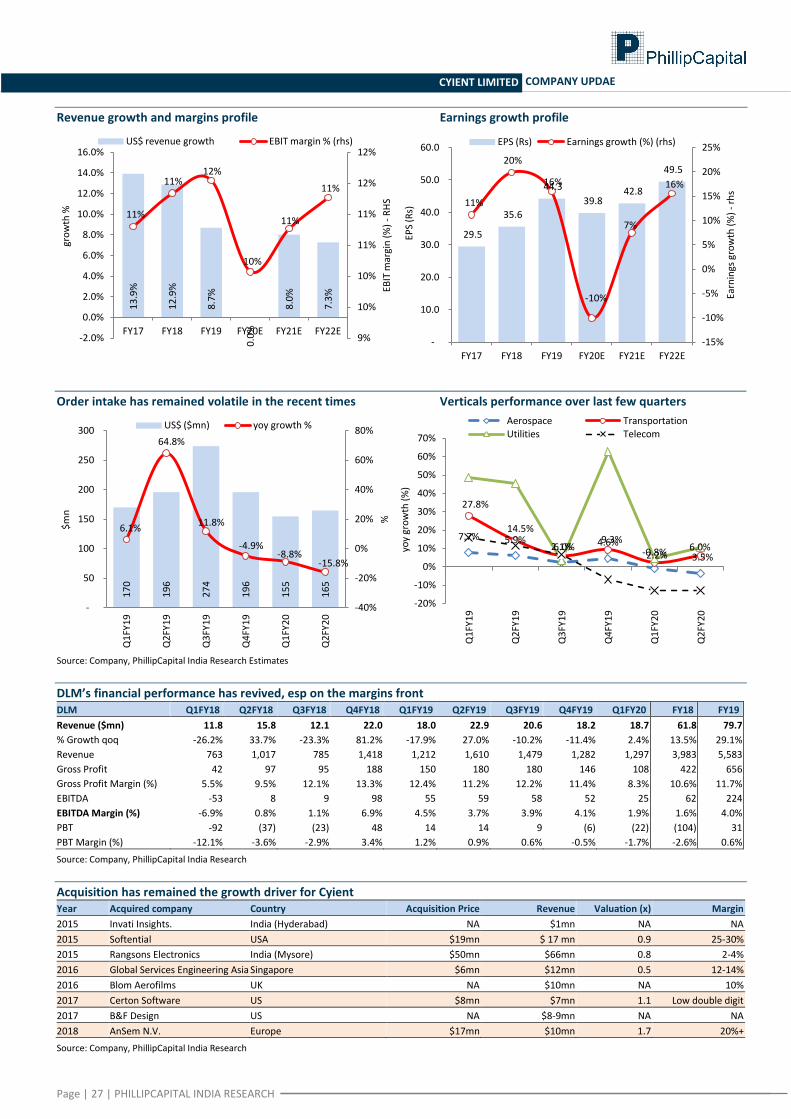
Page | 27 | PHILLIPCAPITAL INDIA RESEARCH
CYIENT LIMITED COMPANY UPDAE
Revenue growth and margins profile Earnings growth profile
Order intake has remained volatile in the recent times Verticals performance over last few quarters
Source: Company, PhillipCapital India Research Estimates
DLM’s financial performance has revived, esp on the margins front DLM Q1FY18 Q2FY18 Q3FY18 Q4FY18 Q1FY19 Q2FY19 Q3FY19 Q4FY19 Q1FY20 FY18 FY19
Revenue ($mn) 11.8 15.8 12.1 22.0 18.0 22.9 20.6 18.2 18.7 61.8 79.7
% Growth qoq -26.2% 33.7% -23.3% 81.2% -17.9% 27.0% -10.2% -11.4% 2.4% 13.5% 29.1%
Revenue 763 1,017 785 1,418 1,212 1,610 1,479 1,282 1,297 3,983 5,583
Gross Profit 42 97 95 188 150 180 180 146 108 422 656
Gross Profit Margin (%) 5.5% 9.5% 12.1% 13.3% 12.4% 11.2% 12.2% 11.4% 8.3% 10.6% 11.7%
EBITDA -53 8 9 98 55 59 58 52 25 62 224
EBITDA Margin (%) -6.9% 0.8% 1.1% 6.9% 4.5% 3.7% 3.9% 4.1% 1.9% 1.6% 4.0%
PBT -92 (37) (23) 48 14 14 9 (6) (22) (104) 31
PBT Margin (%) -12.1% -3.6% -2.9% 3.4% 1.2% 0.9% 0.6% -0.5% -1.7% -2.6% 0.6%
Source: Company, PhillipCapital India Research
Acquisition has remained the growth driver for Cyient Year Acquired company Country Acquisition Price Revenue Valuation (x) Margin
2015 Invati Insights. India (Hyderabad) NA $1mn NA NA
2015 Softential USA $19mn $ 17 mn 0.9 25-30%
2015 Rangsons Electronics India (Mysore) $50mn $66mn 0.8 2-4%
2016 Global Services Engineering Asia Singapore $6mn $12mn 0.5 12-14%
2016 Blom Aerofilms UK NA $10mn NA 10%
2017 Certon Software US $8mn $7mn 1.1 Low double digit
2017 B&F Design US NA $8-9mn NA NA
2018 AnSem N.V. Europe $17mn $10mn 1.7 20%+
Source: Company, PhillipCapital India Research
13
.9%
12
.9%
8.7
%
0.0
%
8.0
%
7.3
%
11%
11% 12%
10%
11%
11%
9%
10%
10%
11%
11%
12%
12%
-2.0%
0.0%
2.0%
4.0%
6.0%
8.0%
10.0%
12.0%
14.0%
16.0%
FY17 FY18 FY19 FY20E FY21E FY22E
EBIT
mar
gin
(%
) -
RH
S
gro
wth
%
US$ revenue growth EBIT margin % (rhs)
29.5
35.6
44.3
39.8 42.8
49.5
11%
20%
16%
-10%
7%
16%
-15%
-10%
-5%
0%
5%
10%
15%
20%
25%
-
10.0
20.0
30.0
40.0
50.0
60.0
FY17 FY18 FY19 FY20E FY21E FY22E
Earn
ings
gro
wth
(%
) -
rhs
EPS
(Rs)
EPS (Rs) Earnings growth (%) (rhs)
17
0
19
6
27
4
19
6
15
5
16
5
6.1%
64.8%
11.8%
-4.9% -8.8%
-15.8%
-40%
-20%
0%
20%
40%
60%
80%
-
50
100
150
200
250
300
Q1
FY1
9
Q2
FY1
9
Q3
FY1
9
Q4
FY1
9
Q1
FY2
0
Q2
FY2
0
%
$m
n
US$ ($mn) yoy growth %
7.7% 5.9% 2.1% 4.6%
-0.8% -3.5%
27.8%
14.5%
6.0% 9.3%
2.2% 6.0%
-20%
-10%
0%
10%
20%
30%
40%
50%
60%
70%
Q1
FY1
9
Q2
FY1
9
Q3
FY1
9
Q4
FY1
9
Q1
FY2
0
Q2
FY2
0
yoy
gro
wth
(%
)
Aerospace Transportation Utilities Telecom
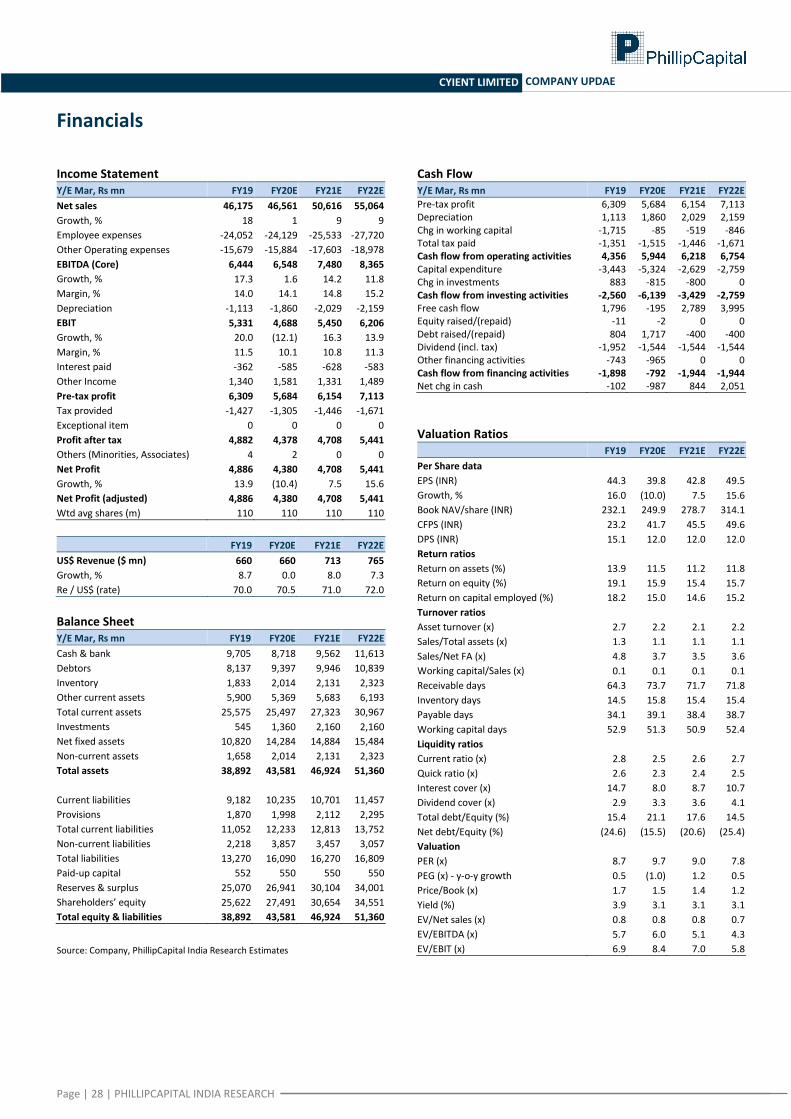
Page | 28 | PHILLIPCAPITAL INDIA RESEARCH
CYIENT LIMITED COMPANY UPDAE
Financials
Income Statement Y/E Mar, Rs mn FY19 FY20E FY21E FY22E
Net sales 46,175 46,561 50,616 55,064
Growth, % 18 1 9 9
Employee expenses -24,052 -24,129 -25,533 -27,720
Other Operating expenses -15,679 -15,884 -17,603 -18,978
EBITDA (Core) 6,444 6,548 7,480 8,365
Growth, % 17.3 1.6 14.2 11.8
Margin, % 14.0 14.1 14.8 15.2
Depreciation -1,113 -1,860 -2,029 -2,159
EBIT 5,331 4,688 5,450 6,206
Growth, % 20.0 (12.1) 16.3 13.9
Margin, % 11.5 10.1 10.8 11.3
Interest paid -362 -585 -628 -583
Other Income 1,340 1,581 1,331 1,489
Pre-tax profit 6,309 5,684 6,154 7,113
Tax provided -1,427 -1,305 -1,446 -1,671
Exceptional item 0 0 0 0
Profit after tax 4,882 4,378 4,708 5,441
Others (Minorities, Associates) 4 2 0 0
Net Profit 4,886 4,380 4,708 5,441
Growth, % 13.9 (10.4) 7.5 15.6
Net Profit (adjusted) 4,886 4,380 4,708 5,441
Wtd avg shares (m) 110 110 110 110
FY19 FY20E FY21E FY22E
US$ Revenue ($ mn) 660 660 713 765
Growth, % 8.7 0.0 8.0 7.3
Re / US$ (rate) 70.0 70.5 71.0 72.0
Balance Sheet Y/E Mar, Rs mn FY19 FY20E FY21E FY22E
Cash & bank 9,705 8,718 9,562 11,613
Debtors 8,137 9,397 9,946 10,839
Inventory 1,833 2,014 2,131 2,323
Other current assets 5,900 5,369 5,683 6,193
Total current assets 25,575 25,497 27,323 30,967
Investments 545 1,360 2,160 2,160
Net fixed assets 10,820 14,284 14,884 15,484
Non-current assets 1,658 2,014 2,131 2,323
Total assets 38,892 43,581 46,924 51,360
Current liabilities 9,182 10,235 10,701 11,457
Provisions 1,870 1,998 2,112 2,295
Total current liabilities 11,052 12,233 12,813 13,752
Non-current liabilities 2,218 3,857 3,457 3,057
Total liabilities 13,270 16,090 16,270 16,809
Paid-up capital 552 550 550 550
Reserves & surplus 25,070 26,941 30,104 34,001
Shareholders’ equity 25,622 27,491 30,654 34,551
Total equity & liabilities 38,892 43,581 46,924 51,360
Source: Company, PhillipCapital India Research Estimates
Cash Flow Y/E Mar, Rs mn FY19 FY20E FY21E FY22E
Pre-tax profit 6,309 5,684 6,154 7,113 Depreciation 1,113 1,860 2,029 2,159 Chg in working capital -1,715 -85 -519 -846 Total tax paid -1,351 -1,515 -1,446 -1,671 Cash flow from operating activities 4,356 5,944 6,218 6,754 Capital expenditure -3,443 -5,324 -2,629 -2,759 Chg in investments 883 -815 -800 0 Cash flow from investing activities -2,560 -6,139 -3,429 -2,759 Free cash flow 1,796 -195 2,789 3,995 Equity raised/(repaid) -11 -2 0 0 Debt raised/(repaid) 804 1,717 -400 -400 Dividend (incl. tax) -1,952 -1,544 -1,544 -1,544 Other financing activities -743 -965 0 0 Cash flow from financing activities -1,898 -792 -1,944 -1,944 Net chg in cash -102 -987 844 2,051
Valuation Ratios
FY19 FY20E FY21E FY22E
Per Share data
EPS (INR) 44.3 39.8 42.8 49.5
Growth, % 16.0 (10.0) 7.5 15.6
Book NAV/share (INR) 232.1 249.9 278.7 314.1
CFPS (INR) 23.2 41.7 45.5 49.6
DPS (INR) 15.1 12.0 12.0 12.0
Return ratios Return on assets (%) 13.9 11.5 11.2 11.8
Return on equity (%) 19.1 15.9 15.4 15.7
Return on capital employed (%) 18.2 15.0 14.6 15.2
Turnover ratios Asset turnover (x) 2.7 2.2 2.1 2.2
Sales/Total assets (x) 1.3 1.1 1.1 1.1
Sales/Net FA (x) 4.8 3.7 3.5 3.6
Working capital/Sales (x) 0.1 0.1 0.1 0.1
Receivable days 64.3 73.7 71.7 71.8
Inventory days 14.5 15.8 15.4 15.4
Payable days 34.1 39.1 38.4 38.7
Working capital days 52.9 51.3 50.9 52.4
Liquidity ratios
Current ratio (x) 2.8 2.5 2.6 2.7
Quick ratio (x) 2.6 2.3 2.4 2.5
Interest cover (x) 14.7 8.0 8.7 10.7
Dividend cover (x) 2.9 3.3 3.6 4.1
Total debt/Equity (%) 15.4 21.1 17.6 14.5
Net debt/Equity (%) (24.6) (15.5) (20.6) (25.4)
Valuation
PER (x) 8.7 9.7 9.0 7.8
PEG (x) - y-o-y growth 0.5 (1.0) 1.2 0.5
Price/Book (x) 1.7 1.5 1.4 1.2
Yield (%) 3.9 3.1 3.1 3.1
EV/Net sales (x) 0.8 0.8 0.8 0.7
EV/EBITDA (x) 5.7 6.0 5.1 4.3
EV/EBIT (x) 6.9 8.4 7.0 5.8
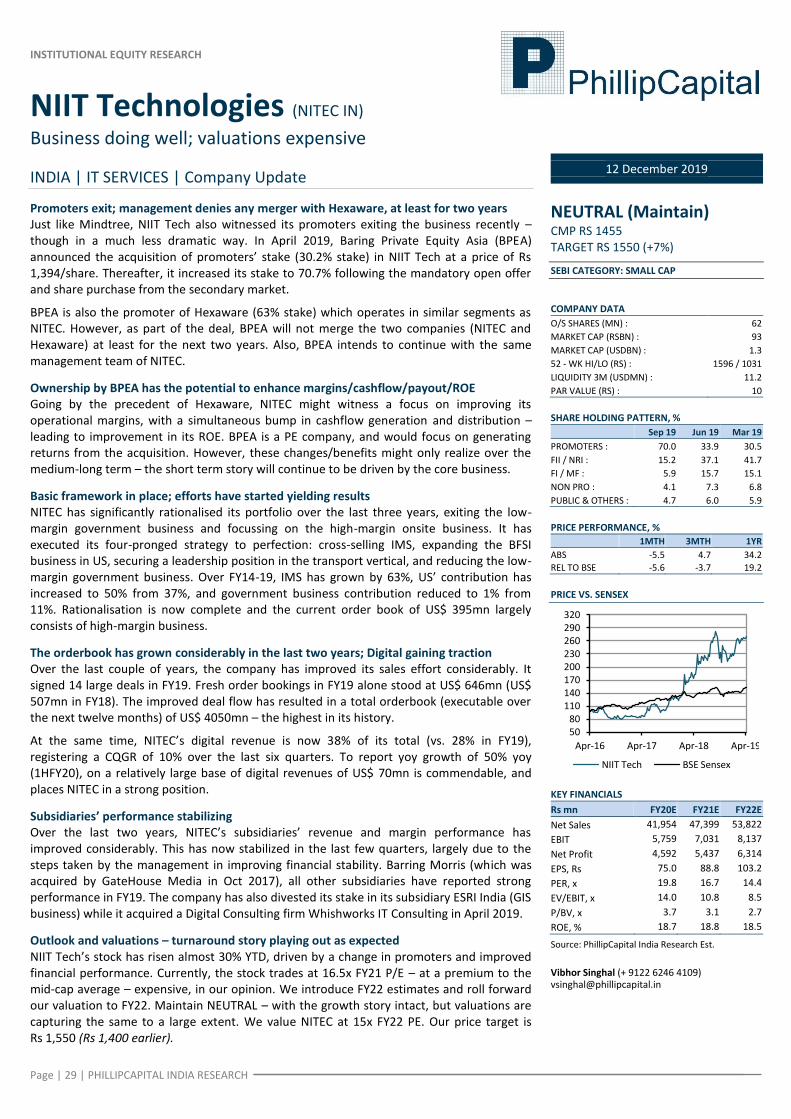
INSTITUTIONAL EQUITY RESEARCH
Page | 29 | PHILLIPCAPITAL INDIA RESEARCH
NIIT Technologies (NITEC IN)
Business doing well; valuations expensive
INDIA | IT SERVICES | Company Update
12 December 2019
Promoters exit; management denies any merger with Hexaware, at least for two years Just like Mindtree, NIIT Tech also witnessed its promoters exiting the business recently – though in a much less dramatic way. In April 2019, Baring Private Equity Asia (BPEA) announced the acquisition of promoters’ stake (30.2% stake) in NIIT Tech at a price of Rs 1,394/share. Thereafter, it increased its stake to 70.7% following the mandatory open offer and share purchase from the secondary market.
BPEA is also the promoter of Hexaware (63% stake) which operates in similar segments as NITEC. However, as part of the deal, BPEA will not merge the two companies (NITEC and Hexaware) at least for the next two years. Also, BPEA intends to continue with the same management team of NITEC.
Ownership by BPEA has the potential to enhance margins/cashflow/payout/ROE Going by the precedent of Hexaware, NITEC might witness a focus on improving its operational margins, with a simultaneous bump in cashflow generation and distribution – leading to improvement in its ROE. BPEA is a PE company, and would focus on generating returns from the acquisition. However, these changes/benefits might only realize over the medium-long term – the short term story will continue to be driven by the core business.
Basic framework in place; efforts have started yielding results NITEC has significantly rationalised its portfolio over the last three years, exiting the low-margin government business and focussing on the high-margin onsite business. It has executed its four-pronged strategy to perfection: cross-selling IMS, expanding the BFSI business in US, securing a leadership position in the transport vertical, and reducing the low-margin government business. Over FY14-19, IMS has grown by 63%, US’ contribution has increased to 50% from 37%, and government business contribution reduced to 1% from 11%. Rationalisation is now complete and the current order book of US$ 395mn largely consists of high-margin business.
The orderbook has grown considerably in the last two years; Digital gaining traction Over the last couple of years, the company has improved its sales effort considerably. It signed 14 large deals in FY19. Fresh order bookings in FY19 alone stood at US$ 646mn (US$ 507mn in FY18). The improved deal flow has resulted in a total orderbook (executable over the next twelve months) of US$ 4050mn – the highest in its history.
At the same time, NITEC’s digital revenue is now 38% of its total (vs. 28% in FY19), registering a CQGR of 10% over the last six quarters. To report yoy growth of 50% yoy (1HFY20), on a relatively large base of digital revenues of US$ 70mn is commendable, and places NITEC in a strong position.
Subsidiaries’ performance stabilizing Over the last two years, NITEC’s subsidiaries’ revenue and margin performance has improved considerably. This has now stabilized in the last few quarters, largely due to the steps taken by the management in improving financial stability. Barring Morris (which was acquired by GateHouse Media in Oct 2017), all other subsidiaries have reported strong performance in FY19. The company has also divested its stake in its subsidiary ESRI India (GIS business) while it acquired a Digital Consulting firm Whishworks IT Consulting in April 2019.
Outlook and valuations – turnaround story playing out as expected NIIT Tech’s stock has risen almost 30% YTD, driven by a change in promoters and improved financial performance. Currently, the stock trades at 16.5x FY21 P/E – at a premium to the mid-cap average – expensive, in our opinion. We introduce FY22 estimates and roll forward our valuation to FY22. Maintain NEUTRAL – with the growth story intact, but valuations are capturing the same to a large extent. We value NITEC at 15x FY22 PE. Our price target is Rs 1,550 (Rs 1,400 earlier).
NEUTRAL (Maintain) CMP RS 1455 TARGET RS 1550 (+7%)
SEBI CATEGORY: SMALL CAP
COMPANY DATA
O/S SHARES (MN) : 62
MARKET CAP (RSBN) : 93
MARKET CAP (USDBN) : 1.3
52 - WK HI/LO (RS) : 1596 / 1031
LIQUIDITY 3M (USDMN) : 11.2
PAR VALUE (RS) : 10
SHARE HOLDING PATTERN, %
Sep 19 Jun 19 Mar 19
PROMOTERS : 70.0 33.9 30.5
FII / NRI : 15.2 37.1 41.7
FI / MF : 5.9 15.7 15.1
NON PRO : 4.1 7.3 6.8
PUBLIC & OTHERS : 4.7 6.0 5.9
PRICE PERFORMANCE, %
1MTH 3MTH 1YR
ABS -5.5 4.7 34.2
REL TO BSE -5.6 -3.7 19.2
PRICE VS. SENSEX
KEY FINANCIALS
Rs mn FY20E FY21E FY22E
Net Sales 41,954 47,399 53,822
EBIT 5,759 7,031 8,137
Net Profit 4,592 5,437 6,314
EPS, Rs 75.0 88.8 103.2
PER, x 19.8 16.7 14.4
EV/EBIT, x 14.0 10.8 8.5
P/BV, x 3.7 3.1 2.7
ROE, % 18.7 18.8 18.5
Source: PhillipCapital India Research Est.
Vibhor Singhal (+ 9122 6246 4109) [email protected]
50 80
110 140 170 200 230 260 290 320
Apr-16 Apr-17 Apr-18 Apr-19
NIIT Tech BSE Sensex
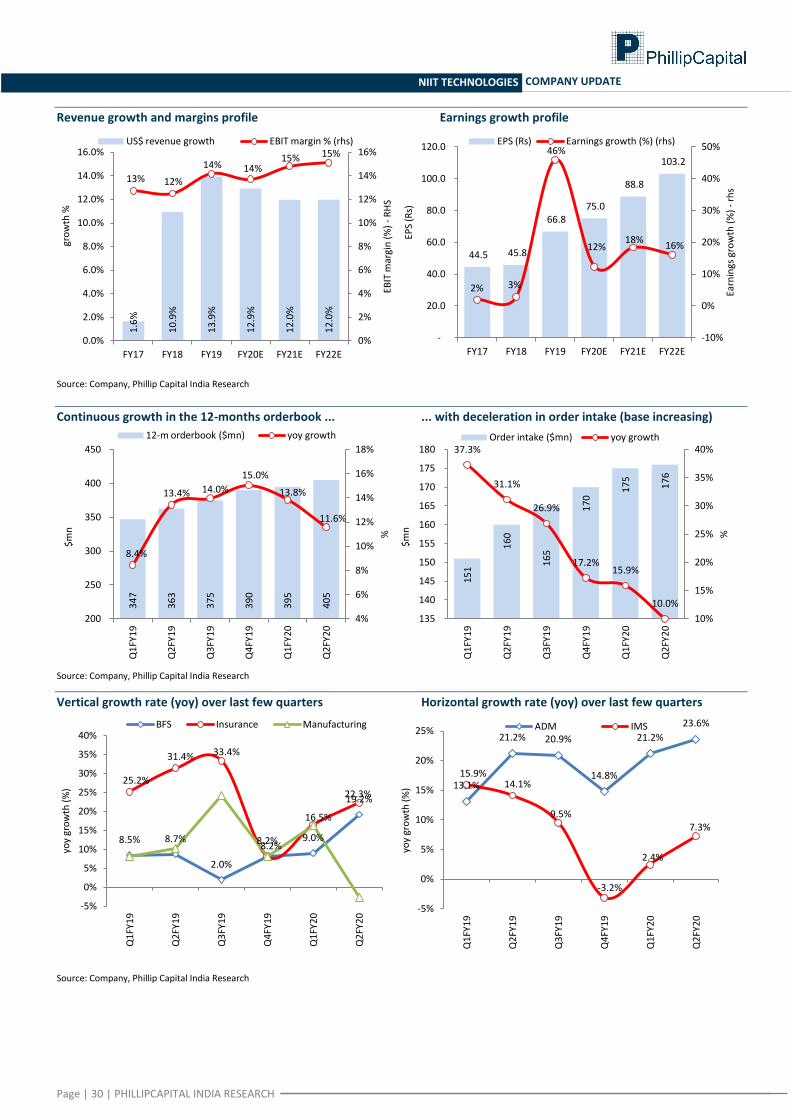
Page | 30 | PHILLIPCAPITAL INDIA RESEARCH
NIIT TECHNOLOGIES COMPANY UPDATE
Revenue growth and margins profile Earnings growth profile
Source: Company, Phillip Capital India Research
Continuous growth in the 12-months orderbook ... ... with deceleration in order intake (base increasing)
Source: Company, Phillip Capital India Research
Vertical growth rate (yoy) over last few quarters Horizontal growth rate (yoy) over last few quarters
Source: Company, Phillip Capital India Research
1.6
%
10
.9%
13
.9%
12
.9%
12
.0%
12
.0%
13% 12%
14% 14% 15% 15%
0%
2%
4%
6%
8%
10%
12%
14%
16%
0.0%
2.0%
4.0%
6.0%
8.0%
10.0%
12.0%
14.0%
16.0%
FY17 FY18 FY19 FY20E FY21E FY22E
EBIT
mar
gin
(%
) -
RH
S
gro
wth
%
US$ revenue growth EBIT margin % (rhs)
44.5 45.8
66.8 75.0
88.8
103.2
2% 3%
46%
12% 18%
16%
-10%
0%
10%
20%
30%
40%
50%
-
20.0
40.0
60.0
80.0
100.0
120.0
FY17 FY18 FY19 FY20E FY21E FY22E
Earn
ings
gro
wth
(%
) -
rhs
EPS
(Rs)
EPS (Rs) Earnings growth (%) (rhs) 3
47
36
3
37
5
39
0
39
5
40
5
8.4%
13.4% 14.0%
15.0%
13.8%
11.6%
4%
6%
8%
10%
12%
14%
16%
18%
200
250
300
350
400
450
Q1
FY1
9
Q2
FY1
9
Q3
FY1
9
Q4
FY1
9
Q1
FY2
0
Q2
FY2
0
%
$m
n
12-m orderbook ($mn) yoy growth
15
1
16
0
16
5
17
0 1
75
17
6
37.3%
31.1%
26.9%
17.2% 15.9%
10.0%
10%
15%
20%
25%
30%
35%
40%
135
140
145
150
155
160
165
170
175
180
Q1
FY1
9
Q2
FY1
9
Q3
FY1
9
Q4
FY1
9
Q1
FY2
0
Q2
FY2
0
%
$m
n
Order intake ($mn) yoy growth
8.5% 8.7%
2.0%
8.2% 9.0%
19.2%
25.2%
31.4% 33.4%
8.2%
16.5%
22.3%
-5%
0%
5%
10%
15%
20%
25%
30%
35%
40%
Q1
FY1
9
Q2
FY1
9
Q3
FY1
9
Q4
FY1
9
Q1
FY2
0
Q2
FY2
0
yoy
gro
wth
(%
)
BFS Insurance Manufacturing
13.1%
21.2% 20.9%
14.8%
21.2%
23.6%
15.9% 14.1%
9.5%
-3.2%
2.4%
7.3%
-5%
0%
5%
10%
15%
20%
25%
Q1
FY1
9
Q2
FY1
9
Q3
FY1
9
Q4
FY1
9
Q1
FY2
0
Q2
FY2
0
yoy
gro
wth
(%
)
ADM IMS
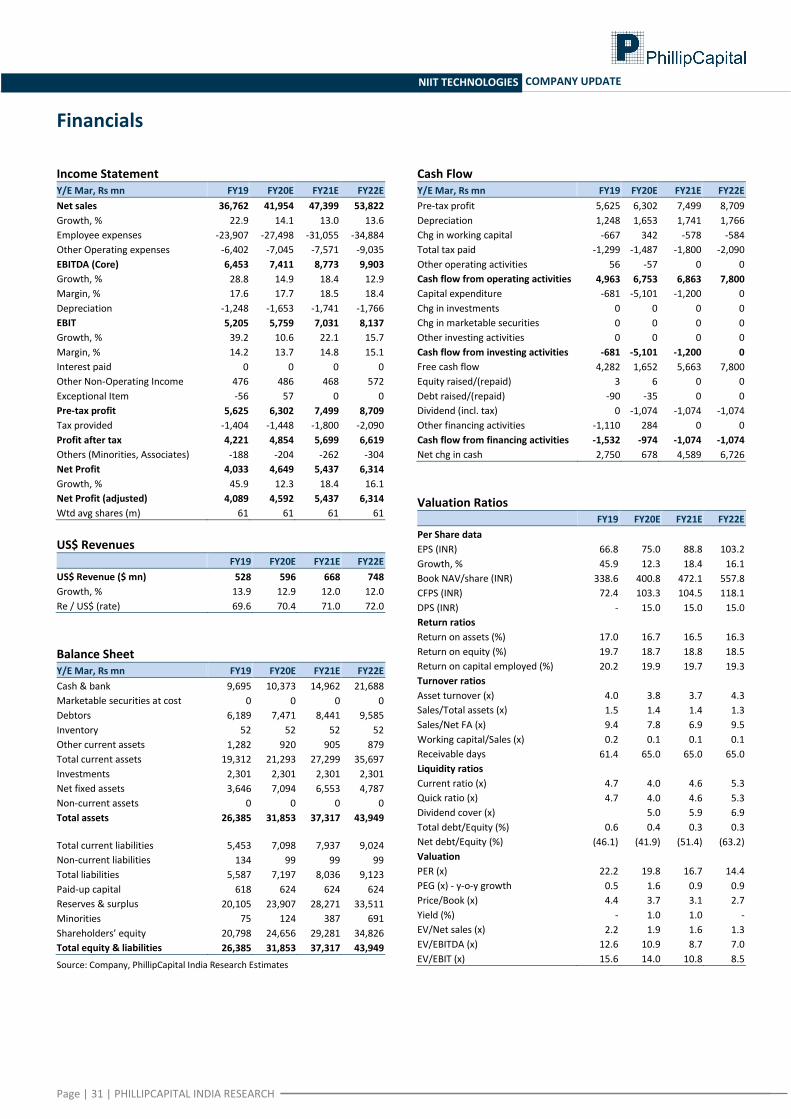
Page | 31 | PHILLIPCAPITAL INDIA RESEARCH
NIIT TECHNOLOGIES COMPANY UPDATE
Financials
Income Statement Y/E Mar, Rs mn FY19 FY20E FY21E FY22E
Net sales 36,762 41,954 47,399 53,822
Growth, % 22.9 14.1 13.0 13.6
Employee expenses -23,907 -27,498 -31,055 -34,884
Other Operating expenses -6,402 -7,045 -7,571 -9,035
EBITDA (Core) 6,453 7,411 8,773 9,903
Growth, % 28.8 14.9 18.4 12.9
Margin, % 17.6 17.7 18.5 18.4
Depreciation -1,248 -1,653 -1,741 -1,766
EBIT 5,205 5,759 7,031 8,137
Growth, % 39.2 10.6 22.1 15.7
Margin, % 14.2 13.7 14.8 15.1
Interest paid 0 0 0 0
Other Non-Operating Income 476 486 468 572
Exceptional Item -56 57 0 0
Pre-tax profit 5,625 6,302 7,499 8,709
Tax provided -1,404 -1,448 -1,800 -2,090
Profit after tax 4,221 4,854 5,699 6,619
Others (Minorities, Associates) -188 -204 -262 -304
Net Profit 4,033 4,649 5,437 6,314
Growth, % 45.9 12.3 18.4 16.1
Net Profit (adjusted) 4,089 4,592 5,437 6,314
Wtd avg shares (m) 61 61 61 61
US$ Revenues FY19 FY20E FY21E FY22E
US$ Revenue ($ mn) 528 596 668 748
Growth, % 13.9 12.9 12.0 12.0
Re / US$ (rate) 69.6 70.4 71.0 72.0
Balance Sheet Y/E Mar, Rs mn FY19 FY20E FY21E FY22E
Cash & bank 9,695 10,373 14,962 21,688
Marketable securities at cost 0 0 0 0
Debtors 6,189 7,471 8,441 9,585
Inventory 52 52 52 52
Other current assets 1,282 920 905 879
Total current assets 19,312 21,293 27,299 35,697
Investments 2,301 2,301 2,301 2,301
Net fixed assets 3,646 7,094 6,553 4,787
Non-current assets 0 0 0 0
Total assets 26,385 31,853 37,317 43,949
Total current liabilities 5,453 7,098 7,937 9,024
Non-current liabilities 134 99 99 99
Total liabilities 5,587 7,197 8,036 9,123
Paid-up capital 618 624 624 624
Reserves & surplus 20,105 23,907 28,271 33,511
Minorities 75 124 387 691
Shareholders’ equity 20,798 24,656 29,281 34,826
Total equity & liabilities 26,385 31,853 37,317 43,949
Source: Company, PhillipCapital India Research Estimates
Cash Flow Y/E Mar, Rs mn FY19 FY20E FY21E FY22E
Pre-tax profit 5,625 6,302 7,499 8,709
Depreciation 1,248 1,653 1,741 1,766
Chg in working capital -667 342 -578 -584
Total tax paid -1,299 -1,487 -1,800 -2,090
Other operating activities 56 -57 0 0
Cash flow from operating activities 4,963 6,753 6,863 7,800
Capital expenditure -681 -5,101 -1,200 0
Chg in investments 0 0 0 0
Chg in marketable securities 0 0 0 0
Other investing activities 0 0 0 0
Cash flow from investing activities -681 -5,101 -1,200 0
Free cash flow 4,282 1,652 5,663 7,800
Equity raised/(repaid) 3 6 0 0
Debt raised/(repaid) -90 -35 0 0
Dividend (incl. tax) 0 -1,074 -1,074 -1,074
Other financing activities -1,110 284 0 0
Cash flow from financing activities -1,532 -974 -1,074 -1,074
Net chg in cash 2,750 678 4,589 6,726
Valuation Ratios
FY19 FY20E FY21E FY22E
Per Share data
EPS (INR) 66.8 75.0 88.8 103.2
Growth, % 45.9 12.3 18.4 16.1
Book NAV/share (INR) 338.6 400.8 472.1 557.8
CFPS (INR) 72.4 103.3 104.5 118.1
DPS (INR) - 15.0 15.0 15.0
Return ratios Return on assets (%) 17.0 16.7 16.5 16.3
Return on equity (%) 19.7 18.7 18.8 18.5
Return on capital employed (%) 20.2 19.9 19.7 19.3
Turnover ratios Asset turnover (x) 4.0 3.8 3.7 4.3
Sales/Total assets (x) 1.5 1.4 1.4 1.3
Sales/Net FA (x) 9.4 7.8 6.9 9.5
Working capital/Sales (x) 0.2 0.1 0.1 0.1
Receivable days 61.4 65.0 65.0 65.0
Liquidity ratios
Current ratio (x) 4.7 4.0 4.6 5.3
Quick ratio (x) 4.7 4.0 4.6 5.3
Dividend cover (x)
5.0 5.9 6.9
Total debt/Equity (%) 0.6 0.4 0.3 0.3
Net debt/Equity (%) (46.1) (41.9) (51.4) (63.2)
Valuation
PER (x) 22.2 19.8 16.7 14.4
PEG (x) - y-o-y growth 0.5 1.6 0.9 0.9
Price/Book (x) 4.4 3.7 3.1 2.7
Yield (%) - 1.0 1.0 -
EV/Net sales (x) 2.2 1.9 1.6 1.3
EV/EBITDA (x) 12.6 10.9 8.7 7.0
EV/EBIT (x) 15.6 14.0 10.8 8.5
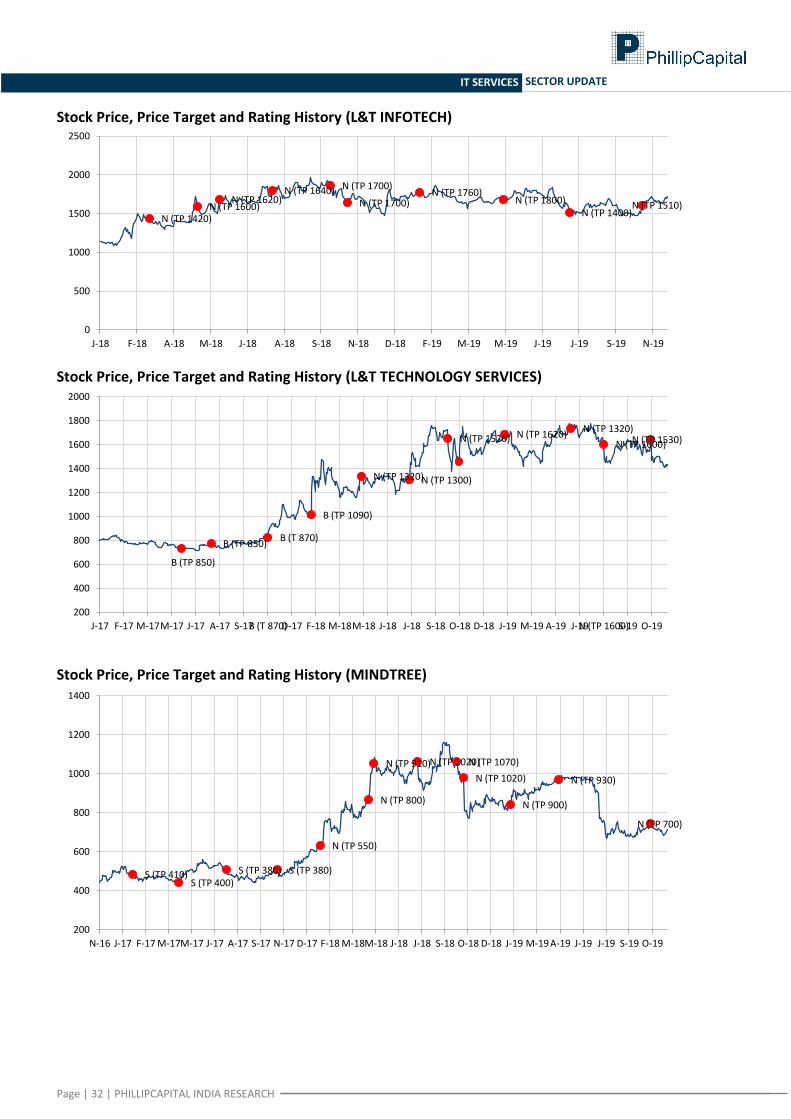
Page | 32 | PHILLIPCAPITAL INDIA RESEARCH
IT SERVICES SECTOR UPDATE
Stock Price, Price Target and Rating History (L&T INFOTECH)
Stock Price, Price Target and Rating History (L&T TECHNOLOGY SERVICES)
Stock Price, Price Target and Rating History (MINDTREE)
N (TP 1420) N (TP 1600)
N (TP 1620) N (TP 1640) N (TP 1700)
N (TP 1700) N (TP 1760)
N (TP 1800) N (TP 1400)
N (TP 1510)
0
500
1000
1500
2000
2500
J-18 F-18 A-18 M-18 J-18 A-18 S-18 N-18 D-18 F-19 M-19 M-19 J-19 J-19 S-19 N-19
B (TP 850)
B (TP 850) B (T 870)
B (TP 1090)
N (TP 1320) N (TP 1300)
N (TP 1520) N (TP 1620) N (TP 1320)
N (TP 1600) N (TP 1530)
200
400
600
800
1000
1200
1400
1600
1800
2000
J-17 F-17 M-17 M-17 J-17 A-17 S-17 B (T 870) D-17 F-18 M-18 M-18 J-18 J-18 S-18 O-18 D-18 J-19 M-19 A-19 J-19 N (TP 1600) S-19 O-19
S (TP 410) S (TP 400)
S (TP 380) S (TP 380)
N (TP 550)
N (TP 800)
N (TP 910) N (TP 1020) N (TP 1070)
N (TP 1020)
N (TP 900)
N (TP 930)
N (TP 700)
200
400
600
800
1000
1200
1400
N-16 J-17 F-17 M-17 M-17 J-17 A-17 S-17 N-17 D-17 F-18 M-18 M-18 J-18 J-18 S-18 O-18 D-18 J-19 M-19 A-19 J-19 J-19 S-19 O-19
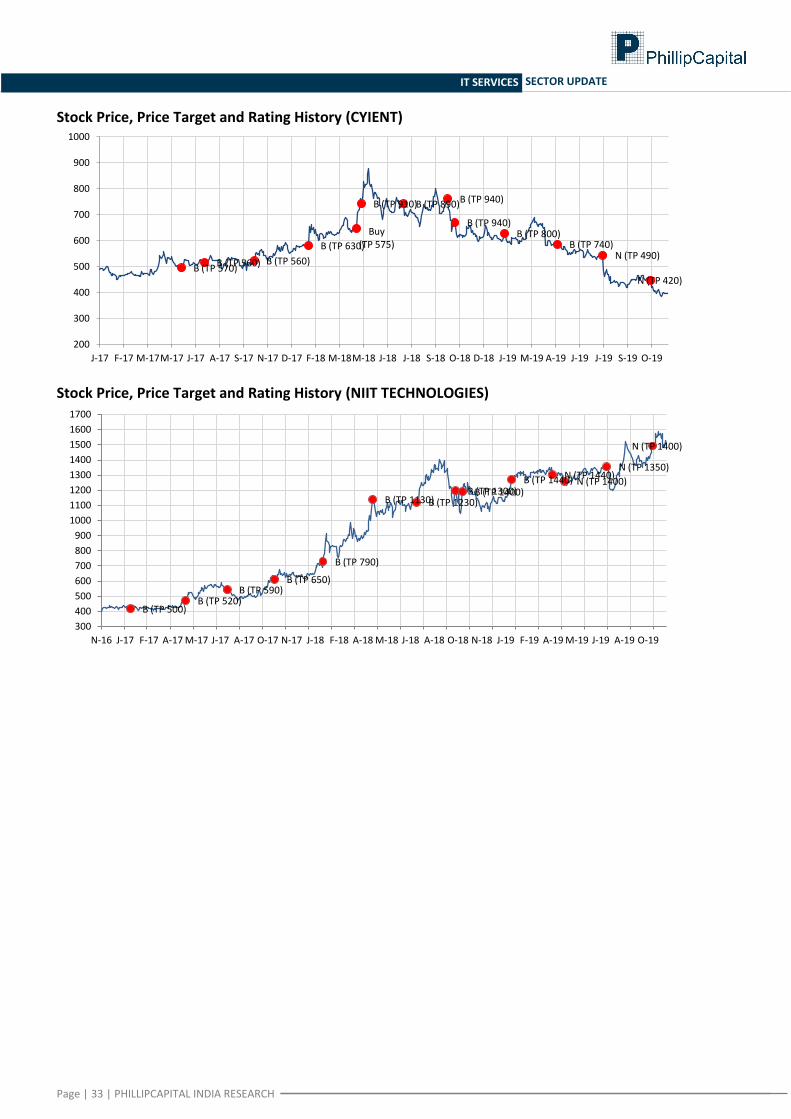
Page | 33 | PHILLIPCAPITAL INDIA RESEARCH
IT SERVICES SECTOR UPDATE
Stock Price, Price Target and Rating History (CYIENT)
Stock Price, Price Target and Rating History (NIIT TECHNOLOGIES)
B (TP 570) B (TP 560) B (TP 560)
B (TP 630)
Buy (TP 575)
B (TP 910) B (TP 890) B (TP 940)
B (TP 940) B (TP 800)
B (TP 740) N (TP 490)
N (TP 420)
200
300
400
500
600
700
800
900
1000
J-17 F-17 M-17 M-17 J-17 A-17 S-17 N-17 D-17 F-18 M-18 M-18 J-18 J-18 S-18 O-18 D-18 J-19 M-19 A-19 J-19 J-19 S-19 O-19
B (TP 500) B (TP 520)
B (TP 590) B (TP 650)
B (TP 790)
B (TP 1130) B (TP 1230) B (TP 1300) B (TP 1400)
B (TP 1440) N (TP 1440) N (TP 1400)
N (TP 1350)
N (TP 1400)
300
400
500
600
700
800
900
1000
1100
1200
1300
1400
1500
1600
1700
N-16 J-17 F-17 A-17 M-17 J-17 A-17 O-17 N-17 J-18 F-18 A-18 M-18 J-18 A-18 O-18 N-18 J-19 F-19 A-19 M-19 J-19 A-19 O-19
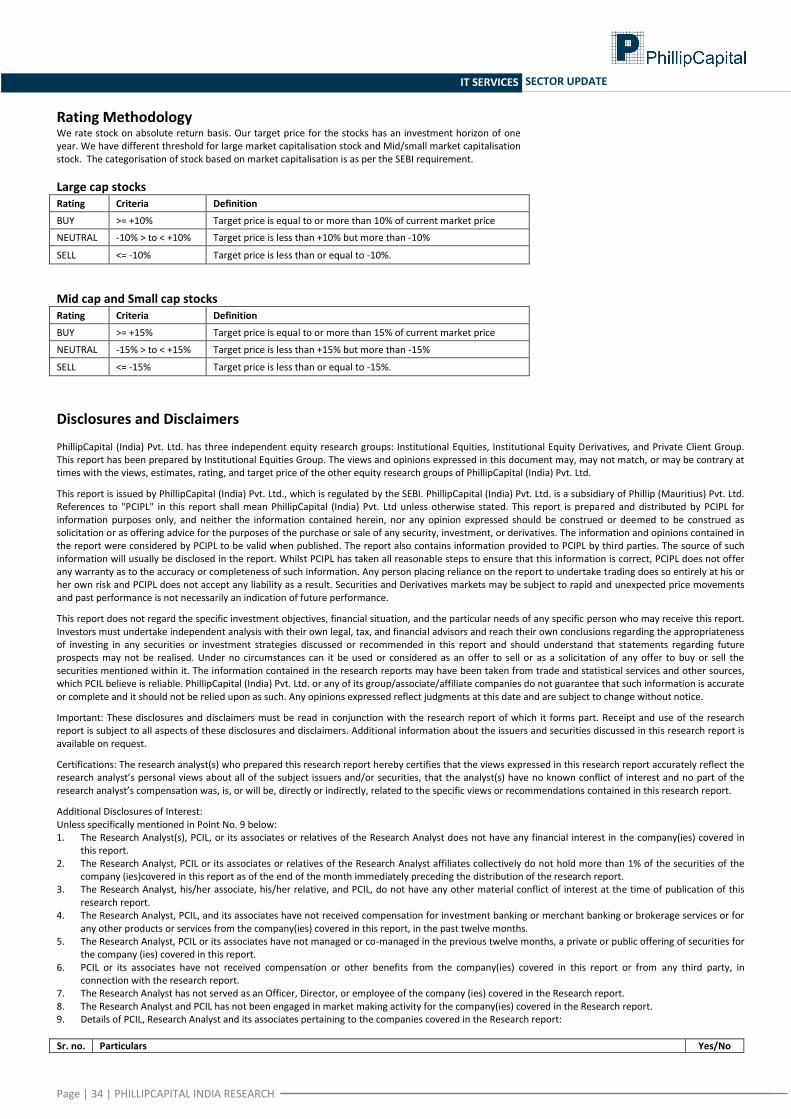
Page | 34 | PHILLIPCAPITAL INDIA RESEARCH
IT SERVICES SECTOR UPDATE
Rating Methodology We rate stock on absolute return basis. Our target price for the stocks has an investment horizon of one year. We have different threshold for large market capitalisation stock and Mid/small market capitalisation stock. The categorisation of stock based on market capitalisation is as per the SEBI requirement.
Large cap stocks Rating Criteria Definition
BUY >= +10% Target price is equal to or more than 10% of current market price
NEUTRAL -10% > to < +10% Target price is less than +10% but more than -10%
SELL <= -10% Target price is less than or equal to -10%.
Mid cap and Small cap stocks Rating Criteria Definition
BUY >= +15% Target price is equal to or more than 15% of current market price
NEUTRAL -15% > to < +15% Target price is less than +15% but more than -15%
SELL <= -15% Target price is less than or equal to -15%.
Disclosures and Disclaimers PhillipCapital (India) Pvt. Ltd. has three independent equity research groups: Institutional Equities, Institutional Equity Derivatives, and Private Client Group. This report has been prepared by Institutional Equities Group. The views and opinions expressed in this document may, may not match, or may be contrary at times with the views, estimates, rating, and target price of the other equity research groups of PhillipCapital (India) Pvt. Ltd.
This report is issued by PhillipCapital (India) Pvt. Ltd., which is regulated by the SEBI. PhillipCapital (India) Pvt. Ltd. is a subsidiary of Phillip (Mauritius) Pvt. Ltd. References to "PCIPL" in this report shall mean PhillipCapital (India) Pvt. Ltd unless otherwise stated. This report is prepared and distributed by PCIPL for information purposes only, and neither the information contained herein, nor any opinion expressed should be construed or deemed to be construed as solicitation or as offering advice for the purposes of the purchase or sale of any security, investment, or derivatives. The information and opinions contained in the report were considered by PCIPL to be valid when published. The report also contains information provided to PCIPL by third parties. The source of such information will usually be disclosed in the report. Whilst PCIPL has taken all reasonable steps to ensure that this information is correct, PCIPL does not offer any warranty as to the accuracy or completeness of such information. Any person placing reliance on the report to undertake trading does so entirely at his or her own risk and PCIPL does not accept any liability as a result. Securities and Derivatives markets may be subject to rapid and unexpected price movements and past performance is not necessarily an indication of future performance.
This report does not regard the specific investment objectives, financial situation, and the particular needs of any specific person who may receive this report. Investors must undertake independent analysis with their own legal, tax, and financial advisors and reach their own conclusions regarding the appropriateness of investing in any securities or investment strategies discussed or recommended in this report and should understand that statements regarding future prospects may not be realised. Under no circumstances can it be used or considered as an offer to sell or as a solicitation of any offer to buy or sell the securities mentioned within it. The information contained in the research reports may have been taken from trade and statistical services and other sources, which PCIL believe is reliable. PhillipCapital (India) Pvt. Ltd. or any of its group/associate/affiliate companies do not guarantee that such information is accurate or complete and it should not be relied upon as such. Any opinions expressed reflect judgments at this date and are subject to change without notice.
Important: These disclosures and disclaimers must be read in conjunction with the research report of which it forms part. Receipt and use of the research report is subject to all aspects of these disclosures and disclaimers. Additional information about the issuers and securities discussed in this research report is available on request.
Certifications: The research analyst(s) who prepared this research report hereby certifies that the views expressed in this research report accurately reflect the research analyst’s personal views about all of the subject issuers and/or securities, that the analyst(s) have no known conflict of interest and no part of the research analyst’s compensation was, is, or will be, directly or indirectly, related to the specific views or recommendations contained in this research report.
Additional Disclosures of Interest: Unless specifically mentioned in Point No. 9 below: 1. The Research Analyst(s), PCIL, or its associates or relatives of the Research Analyst does not have any financial interest in the company(ies) covered in
this report. 2. The Research Analyst, PCIL or its associates or relatives of the Research Analyst affiliates collectively do not hold more than 1% of the securities of the
company (ies)covered in this report as of the end of the month immediately preceding the distribution of the research report. 3. The Research Analyst, his/her associate, his/her relative, and PCIL, do not have any other material conflict of interest at the time of publication of this
research report. 4. The Research Analyst, PCIL, and its associates have not received compensation for investment banking or merchant banking or brokerage services or for
any other products or services from the company(ies) covered in this report, in the past twelve months. 5. The Research Analyst, PCIL or its associates have not managed or co-managed in the previous twelve months, a private or public offering of securities for
the company (ies) covered in this report. 6. PCIL or its associates have not received compensation or other benefits from the company(ies) covered in this report or from any third party, in
connection with the research report. 7. The Research Analyst has not served as an Officer, Director, or employee of the company (ies) covered in the Research report. 8. The Research Analyst and PCIL has not been engaged in market making activity for the company(ies) covered in the Research report. 9. Details of PCIL, Research Analyst and its associates pertaining to the companies covered in the Research report:
Sr. no. Particulars Yes/No
Page | 35 | PHILLIPCAPITAL INDIA RESEARCH
IT SERVICES SECTOR UPDATE
1 Whether compensation has been received from the company(ies) covered in the Research report in the past 12 months for investment banking transaction by PCIL
No
2 Whether Research Analyst, PCIL or its associates or relatives of the Research Analyst affiliates collectively hold more than 1% of the company(ies) covered in the Research report
No
3 Whether compensation has been received by PCIL or its associates from the company(ies) covered in the Research report No
4 PCIL or its affiliates have managed or co-managed in the previous twelve months a private or public offering of securities for the company(ies) covered in the Research report
No
5 Research Analyst, his associate, PCIL or its associates have received compensation for investment banking or merchant banking or brokerage services or for any other products or services from the company(ies) covered in the Research report, in the last twelve months
No
Independence: PhillipCapital (India) Pvt. Ltd. has not had an investment banking relationship with, and has not received any compensation for investment banking services from, the subject issuers in the past twelve (12) months, and PhillipCapital (India) Pvt. Ltd does not anticipate receiving or intend to seek compensation for investment banking services from the subject issuers in the next three (3) months. PhillipCapital (India) Pvt. Ltd is not a market maker in the securities mentioned in this research report, although it, or its affiliates/employees, may have positions in, purchase or sell, or be materially interested in any of the securities covered in the report.
Suitability and Risks: This research report is for informational purposes only and is not tailored to the specific investment objectives, financial situation or particular requirements of any individual recipient hereof. Certain securities may give rise to substantial risks and may not be suitable for certain investors. Each investor must make its own determination as to the appropriateness of any securities referred to in this research report based upon the legal, tax and accounting considerations applicable to such investor and its own investment objectives or strategy, its financial situation and its investing experience. The value of any security may be positively or adversely affected by changes in foreign exchange or interest rates, as well as by other financial, economic, or political factors. Past performance is not necessarily indicative of future performance or results.
Sources, Completeness and Accuracy: The material herein is based upon information obtained from sources that PCIPL and the research analyst believe to be reliable, but neither PCIPL nor the research analyst represents or guarantees that the information contained herein is accurate or complete and it should not be relied upon as such. Opinions expressed herein are current opinions as of the date appearing on this material, and are subject to change without notice. Furthermore, PCIPL is under no obligation to update or keep the information current. Without limiting any of the foregoing, in no event shall PCIL, any of its affiliates/employees or any third party involved in, or related to computing or compiling the information have any liability for any damages of any kind including but not limited to any direct or consequential loss or damage, however arising, from the use of this document.
Copyright: The copyright in this research report belongs exclusively to PCIPL. All rights are reserved. Any unauthorised use or disclosure is prohibited. No reprinting or reproduction, in whole or in part, is permitted without the PCIPL’s prior consent, except that a recipient may reprint it for internal circulation only and only if it is reprinted in its entirety.
Caution: Risk of loss in trading/investment can be substantial and even more than the amount / margin given by you. Investment in securities market are subject to market risks, you are requested to read all the related documents carefully before investing. You should carefully consider whether trading/investment is appropriate for you in light of your experience, objectives, financial resources and other relevant circumstances. PhillipCapital and any of its employees, directors, associates, group entities, or affiliates shall not be liable for losses, if any, incurred by you. You are further cautioned that trading/investments in financial markets are subject to market risks and are advised to seek independent third party trading/investment advice outside PhillipCapital/group/associates/affiliates/directors/employees before and during your trading/investment. There is no guarantee/assurance as to returns or profits or capital protection or appreciation. PhillipCapital and any of its employees, directors, associates, and/or employees, directors, associates of PhillipCapital’s group entities or affiliates is not inducing you for trading/investing in the financial market(s). Trading/Investment decision is your sole responsibility. You must also read the Risk Disclosure Document and Do’s and Don’ts before investing.
Kindly note that past performance is not necessarily a guide to future performance.
For Detailed Disclaimer: Please visit our website www.phillipcapital.in IMPORTANT DISCLOSURES FOR U.S. PERSONS This research report is a product of PhillipCapital (India) Pvt. Ltd. which is the employer of the research analyst(s) who has prepared the research report. PhillipCapital (India) Pvt Ltd. is authorized to engage in securities activities in India. PHILLIPCAP is not a registered broker-dealer in the United States and, therefore, is not subject to U.S. rules regarding the preparation of research reports and the independence of research analysts. This research report is provided for distribution to “major U.S. institutional investors” in reliance on the exemption from registration provided by Rule 15a-6 of the U.S. Securities Exchange Act of 1934, as amended (the “Exchange Act”). If the recipient of this report is not a Major Institutional Investor as specified above, then it should not act upon this report and return the same to the sender. Further, this report may not be copied, duplicated and/or transmitted onward to any U.S. person, which is not a Major Institutional Investor.
Any U.S. recipient of this research report wishing to effect any transaction to buy or sell securities or related financial instruments based on the information provided in this research report should do so only through Rosenblatt Securities Inc, 40 Wall Street 59th Floor, New York NY 10005, a registered broker dealer in the United States. Under no circumstances should any recipient of this research report effect any transaction to buy or sell securities or related financial instruments through PHILLIPCAP. Rosenblatt Securities Inc. accepts responsibility for the contents of this research report, subject to the terms set out below, to the extent that it is delivered to a U.S. person other than a major U.S. institutional investor.
The analyst whose name appears in this research report is not registered or qualified as a research analyst with the Financial Industry Regulatory Authority (“FINRA”) and may not be an associated person of Rosenblatt Securities Inc. and, therefore, may not be subject to applicable restrictions under FINRA Rules on communications with a subject company, public appearances and trading securities held by a research analyst account. Ownership and Material Conflicts of Interest Rosenblatt Securities Inc. or its affiliates does not ‘beneficially own,’ as determined in accordance with Section 13(d) of the Exchange Act, 1% or more of any of the equity securities mentioned in the report. Rosenblatt Securities Inc, its affiliates and/or their respective officers, directors or employees may have interests, or long or short positions, and may at any time make purchases or sales as a principal or agent of the securities referred to herein. Rosenblatt Securities Inc. is not aware of any material conflict of interest as of the date of this publication Compensation and Investment Banking Activities
Page | 36 | PHILLIPCAPITAL INDIA RESEARCH
IT SERVICES SECTOR UPDATE
Rosenblatt Securities Inc. or any affiliate has not managed or co-managed a public offering of securities for the subject company in the past 12 months, nor received compensation for investment banking services from the subject company in the past 12 months, neither does it or any affiliate expect to receive, or intends to seek compensation for investment banking services from the subject company in the next 3 months. Additional Disclosures This research report is for distribution only under such circumstances as may be permitted by applicable law. This research report has no regard to the specific investment objectives, financial situation or particular needs of any specific recipient, even if sent only to a single recipient. This research report is not guaranteed to be a complete statement or summary of any securities, markets, reports or developments referred to in this research report. Neither PHILLIPCAP nor any of its directors, officers, employees or agents shall have any liability, however arising, for any error, inaccuracy or incompleteness of fact or opinion in this research report or lack of care in this research report’s preparation or publication, or any losses or damages which may arise from the use of this research report.
PHILLIPCAP may rely on information barriers, such as “Chinese Walls” to control the flow of information within the areas, units, divisions, groups, or affiliates of PHILLIPCAP.
Investing in any non-U.S. securities or related financial instruments (including ADRs) discussed in this research report may present certain risks. The securities of non-U.S. issuers may not be registered with, or be subject to the regulations of, the U.S. Securities and Exchange Commission. Information on such non-U.S. securities or related financial instruments may be limited. Foreign companies may not be subject to audit and reporting standards and regulatory requirements comparable to those in effect within the United States.
The value of any investment or income from any securities or related financial instruments discussed in this research report denominated in a currency other than U.S. dollars is subject to exchange rate fluctuations that may have a positive or adverse effect on the value of or income from such securities or related financial instruments.
Past performance is not necessarily a guide to future performance and no representation or warranty, express or implied, is made by PHILLIPCAP with respect to future performance. Income from investments may fluctuate. The price or value of the investments to which this research report relates, either directly or indirectly, may fall or rise against the interest of investors. Any recommendation or opinion contained in this research report may become outdated as a consequence of changes in the environment in which the issuer of the securities under analysis operates, in addition to changes in the estimates and forecasts, assumptions and valuation methodology used herein.
No part of the content of this research report may be copied, forwarded or duplicated in any form or by any means without the prior written consent of PHILLIPCAP and PHILLIPCAP accepts no liability whatsoever for the actions of third parties in this respect.
PhillipCapital (India) Pvt. Ltd. Registered office: 18th floor, Urmi Estate, Ganpatrao Kadam Marg, Lower Parel (West), Mumbai – 400013, India.


![Moteurs pas-à-pas et PC_ ETSF [Dunod]](https://img.pdfslide.net/doc/110x75/54929600ac7959984c8b487c/moteurs-pas-a-pas-et-pc-etsf-dunod.jpg)