Embed Size (px)
Citation preview
INSTITUTIONAL EQUITY RESEARCH
Kotak Mahindra Bank (KMB IN)
Dial 811 for growth
Page | 1 | PHILLIPCAPITAL INDIA RESEARCH
INDIA | BANKING | Initiating Coverage
18 June 2018
“Financialisation” of savings is a big structural change in India’s economy. Some banks took asset‐quality shocks, making them risk averse, which led to a shift in loan market‐share to a few strong private banks. The financial ecosystem created by Kotak is well poised to capture the benefits of this financialisation. Its digital strategy of “811” has seen early success with c60% growth in its total customer base. Strong customer acquisition on the liability side in a cost‐effective manner should enable the bank to augment its low‐cost deposits even further – to 58% by FY21 from 51% at present. Kotak is well‐positioned to capture loan market‐share and the rising interest‐rate environment bodes well for it as it has a high proportion of low‐cost deposits. Its superior underwriting skills, strong monitoring of portfolio, and cost optimisation should lead to enhanced return ratios – we see 2% RoA by FY21 (1.7% in FY18). Our Buy rating is based on the following: 58% CASA ratio by 2021: Kotak’s customer base has increased by c.60% in FY18 to c.13mn, up from 8mn in March 2017. We estimate that c.70% of its new customers came from 811 (digital banking); 811 will continue to provide strong traction in terms of customer growth, resulting in high growth in savings deposits. Kotak’s savings deposit base should more than double over the next three years with market share increasing to 3.1% from 1.8% in March 2018; as a result, its CASA should touch 58% by 2021.
NIM to see uptrend: We estimate NIMs to rise from here mainly on: (1) Rising yield: 10‐year government bond yield has increased by 55bps since March 2018; we believe this will push up asset yield (as 60% of loan book is floating), leading to an uptick in NIMs, (2) increasing lending towards high‐yielding assets (increased focus towards CV/CE), and (3) shifting funding mix towards a low‐cost deposit base. Overall, we expect NIMs to increase by c.19bps over FY19‐21.
Loan growth momentum to continue: Kotak restarted its growth engine in FY18 after successful integration of ING. Loan book grew by 25% yoy mainly driven by CV/CE and corporate segments. The market remains conducive for the CV segment and Kotak should continue to capture share in corporate. Accelerated customer acquisition through 811 will also provide opportunities for cross‐selling retail loan products. We estimate a loan CAGR of 22% over the next three years (management’s guidance is 20% loan growth in FY19).
Positive on cost; asset quality stable: We believe cost synergies from the ING merger have already started to flow through; Kotak’s cost‐to‐income ratio declined from 55% pre‐merger (FY15) to 48% in FY18. Its digital investments are also expected to bring in further operating efficiency. We expect cost‐to‐income ratio to continue falling to 44% by FY21. Kotak also has one of the best asset qualities in the industry, mainly due to its diversified portfolio, efficient risk monitoring, and control. We see no downside to asset quality from here (in fact, we expect it to remain strong).
Subsidiaries to benefit from a shift in the savings market: The share of financial savings in India as a % of total household savings increased to 41.5% in FY16 from 31.1% in FY12. In FY17, investment in shares & debentures increased to 10% from 2.7% in FY16. Kotak’s subsidiaries, which provide services across products (from insurance to asset management to securities) are likely to be key beneficiaries of this shift. A large part of the customers of its subsidiaries (40% for securities, 50% for insurance) are acquired through Kotak Bank; hence, an increasing customer base will provide higher cross‐selling opportunities.
Recommendation and valuation: We expect earnings CAGR of 28% over FY19‐21, resulting in a FY21 ROA of 2.0x. Based on the SOTP method, we arrive at a target of Rs 1,545, translating into an implied P/adjusted BVPS of 3.7x FY21 (adjusted BVPS of Rs 292). We initiate coverage on Kotak Mahindra Bank with a Buy rating.
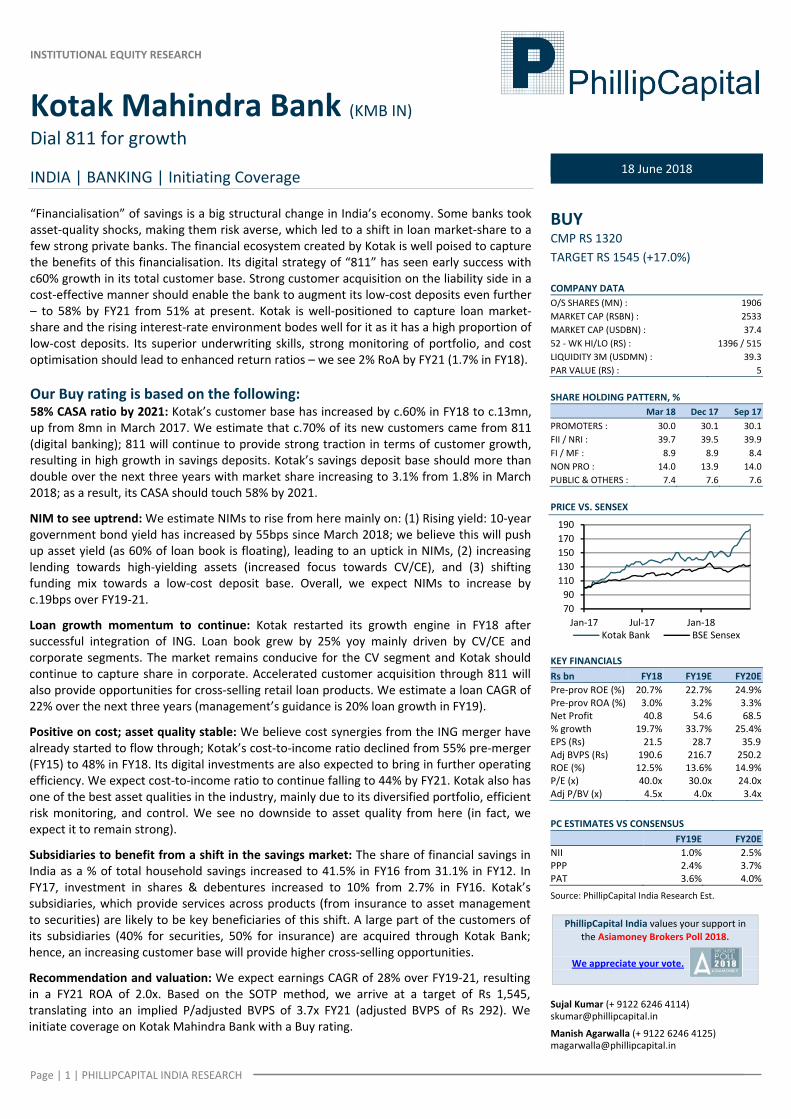
BUY CMP RS 1320 TARGET RS 1545 (+17.0%) COMPANY DATA O/S SHARES (MN) : 1906MARKET CAP (RSBN) : 2533MARKET CAP (USDBN) : 37.452 ‐ WK HI/LO (RS) : 1396 / 515LIQUIDITY 3M (USDMN) : 39.3PAR VALUE (RS) : 5 SHARE HOLDING PATTERN, % Mar 18 Dec 17 Sep 17PROMOTERS : 30.0 30.1 30.1FII / NRI : 39.7 39.5 39.9FI / MF : 8.9 8.9 8.4NON PRO : 14.0 13.9 14.0PUBLIC & OTHERS : 7.4 7.6 7.6 PRICE VS. SENSEX
KEY FINANCIALS Rs bn FY18 FY19E FY20EPre‐prov ROE (%) 20.7% 22.7% 24.9%Pre‐prov ROA (%) 3.0% 3.2% 3.3%Net Profit 40.8 54.6 68.5% growth 19.7% 33.7% 25.4%EPS (Rs) 21.5 28.7 35.9Adj BVPS (Rs) 190.6 216.7 250.2ROE (%) 12.5% 13.6% 14.9%P/E (x) 40.0x 30.0x 24.0xAdj P/BV (x) 4.5x 4.0x 3.4x
PC ESTIMATES VS CONSENSUS FY19E FY20ENII 1.0% 2.5%PPP 2.4% 3.7%PAT 3.6% 4.0%
Source: PhillipCapital India Research Est.
PhillipCapital India values your support in the Asiamoney Brokers Poll 2018.
We appreciate your vote.
Sujal Kumar (+ 9122 6246 4114) [email protected]
Manish Agarwalla (+ 9122 6246 4125) [email protected]
7090110130150170190
Jan‐17 Jul‐17 Jan‐18Kotak Bank BSE Sensex
KOTAK MAHINDRA BANK INITIATING COVERAGE
Page | 2 | PHILLIPCAPITAL INDIA RESEARCH
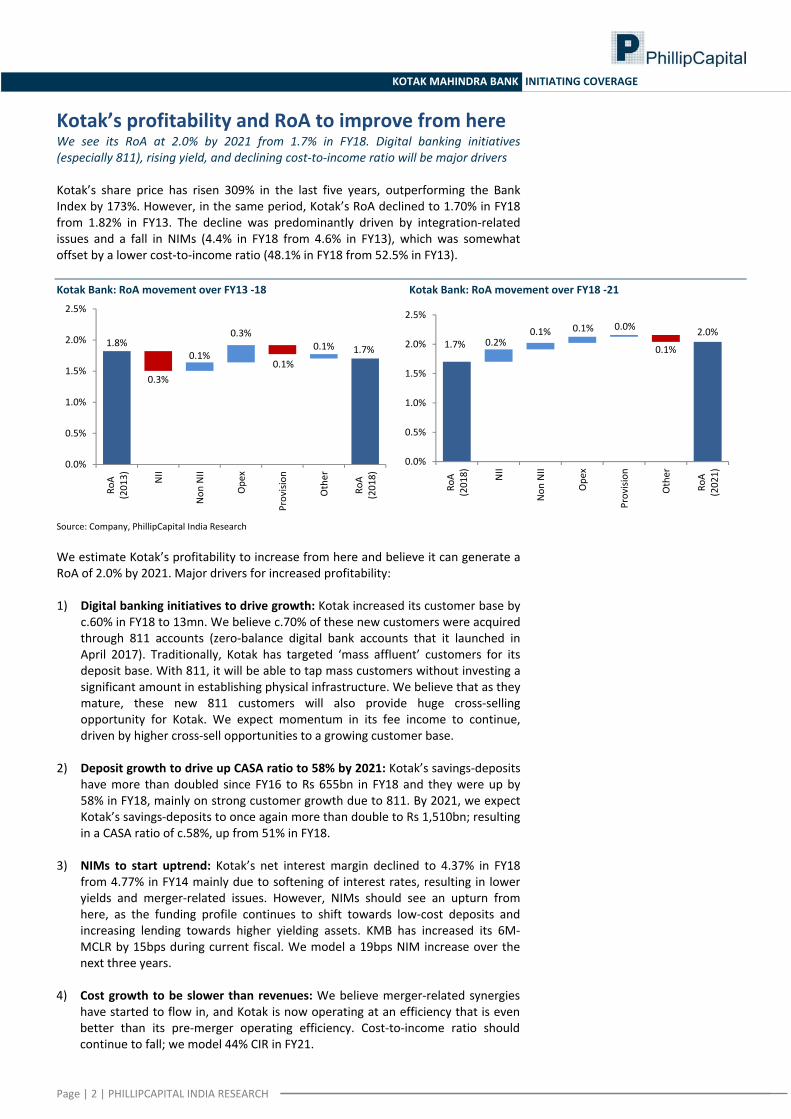
Kotak’s profitability and RoA to improve from here We see its RoA at 2.0% by 2021 from 1.7% in FY18. Digital banking initiatives (especially 811), rising yield, and declining cost‐to‐income ratio will be major drivers Kotak’s share price has risen 309% in the last five years, outperforming the Bank Index by 173%. However, in the same period, Kotak’s RoA declined to 1.70% in FY18 from 1.82% in FY13. The decline was predominantly driven by integration‐related issues and a fall in NIMs (4.4% in FY18 from 4.6% in FY13), which was somewhat offset by a lower cost‐to‐income ratio (48.1% in FY18 from 52.5% in FY13).
Kotak Bank: RoA movement over FY13 ‐18 Kotak Bank: RoA movement over FY18 ‐21
Source: Company, PhillipCapital India Research We estimate Kotak’s profitability to increase from here and believe it can generate a RoA of 2.0% by 2021. Major drivers for increased profitability: 1) Digital banking initiatives to drive growth: Kotak increased its customer base by
c.60% in FY18 to 13mn. We believe c.70% of these new customers were acquired through 811 accounts (zero‐balance digital bank accounts that it launched in April 2017). Traditionally, Kotak has targeted ‘mass affluent’ customers for its deposit base. With 811, it will be able to tap mass customers without investing a significant amount in establishing physical infrastructure. We believe that as they mature, these new 811 customers will also provide huge cross‐selling opportunity for Kotak. We expect momentum in its fee income to continue, driven by higher cross‐sell opportunities to a growing customer base.
2) Deposit growth to drive up CASA ratio to 58% by 2021: Kotak’s savings‐deposits have more than doubled since FY16 to Rs 655bn in FY18 and they were up by 58% in FY18, mainly on strong customer growth due to 811. By 2021, we expect Kotak’s savings‐deposits to once again more than double to Rs 1,510bn; resulting in a CASA ratio of c.58%, up from 51% in FY18.
3) NIMs to start uptrend: Kotak’s net interest margin declined to 4.37% in FY18 from 4.77% in FY14 mainly due to softening of interest rates, resulting in lower yields and merger‐related issues. However, NIMs should see an upturn from here, as the funding profile continues to shift towards low‐cost deposits and increasing lending towards higher yielding assets. KMB has increased its 6M‐MCLR by 15bps during current fiscal. We model a 19bps NIM increase over the next three years.
4) Cost growth to be slower than revenues: We believe merger‐related synergies have started to flow in, and Kotak is now operating at an efficiency that is even better than its pre‐merger operating efficiency. Cost‐to‐income ratio should continue to fall; we model 44% CIR in FY21.
1.8%1.7%
0.3%
0.1%
0.3%
0.1%
0.1%
0.0%
0.5%
1.0%
1.5%
2.0%
2.5%
RoA
(2013) NII
Non
NII
Ope
x
Provision
Other
RoA
(2018)
1.7%2.0%
0.2%0.1% 0.1% 0.0%
0.1%
0.0%
0.5%
1.0%
1.5%
2.0%
2.5%
RoA
(2018) NII
Non
NII
Ope
x
Provision
Other
RoA
(2021)
KOTAK MAHINDRA BANK INITIATING COVERAGE
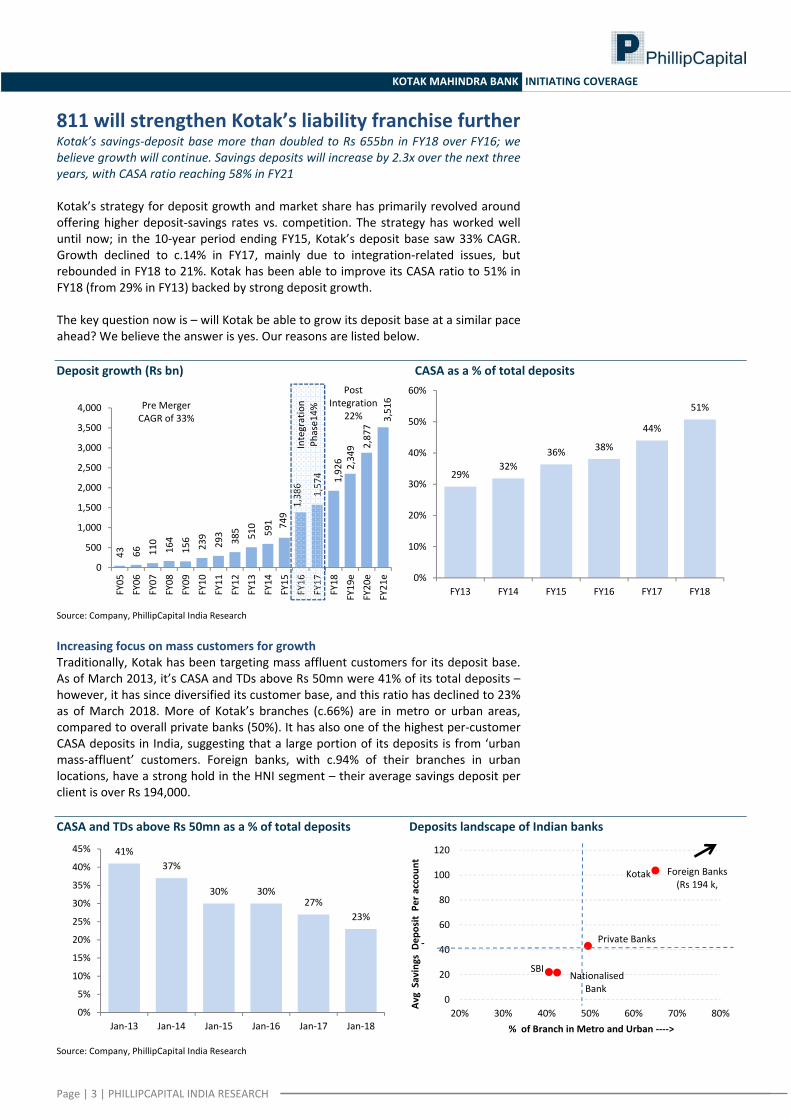
811 will strengthen Kotak’s liability franchise further Kotak’s savings‐deposit base more than doubled to Rs 655bn in FY18 over FY16; we believe growth will continue. Savings deposits will increase by 2.3x over the next three years, with CASA ratio reaching 58% in FY21 Kotak’s strategy for deposit growth and market share has primarily revolved around offering higher deposit‐savings rates vs. competition. The strategy has worked well until now; in the 10‐year period ending FY15, Kotak’s deposit base saw 33% CAGR. Growth declined to c.14% in FY17, mainly due to integration‐related issues, but rebounded in FY18 to 21%. Kotak has been able to improve its CASA ratio to 51% in FY18 (from 29% in FY13) backed by strong deposit growth. The key question now is – will Kotak be able to grow its deposit base at a similar pace ahead? We believe the answer is yes. Our reasons are listed below. Deposit growth (Rs bn) CASA as a % of total deposits
43 66 110
164
156
239
293
385 510
591 7491,386
1,574 1,926 2,349 2,877
3,516
0
500
1,000
1,500
2,000
2,500
3,000
3,500
4,000
FY05
FY06
FY07
FY08
FY09
FY10
FY11
FY12
FY13
FY14
FY15
FY16
FY17
FY18
FY19e
FY20e
FY21e
Pre Merger CAGR of 33%
Post Integration
22%
Integration
Phase14%
29%32%
36% 38%
44%
51%
0%
10%
20%
30%
40%
50%
60%
FY13 FY14 FY15 FY16 FY17 FY18
Source: Company, PhillipCapital India Research Increasing focus on mass customers for growth Traditionally, Kotak has been targeting mass affluent customers for its deposit base. As of March 2013, it’s CASA and TDs above Rs 50mn were 41% of its total deposits – however, it has since diversified its customer base, and this ratio has declined to 23% as of March 2018. More of Kotak’s branches (c.66%) are in metro or urban areas, compared to overall private banks (50%). It has also one of the highest per‐customer CASA deposits in India, suggesting that a large portion of its deposits is from ‘urban mass‐affluent’ customers. Foreign banks, with c.94% of their branches in urban locations, have a strong hold in the HNI segment – their average savings deposit per client is over Rs 194,000. CASA and TDs above Rs 50mn as a % of total deposits Deposits landscape of Indian banks
41%37%
30% 30%27%
23%
0%
5%
10%
15%
20%
25%
30%
35%
40%
45%
Jan‐13 Jan‐14 Jan‐15 Jan‐16 Jan‐17 Jan‐18
Kotak
Private Banks
SBI Nationalised
Bank0
20
40
60
80
100
120
20% 30% 40% 50% 60% 70% 80%
f
% of Branch in Metro and Urban ‐‐‐‐>
Avg Savings D
eposit Per
accoun
t
Foreign Banks (Rs 194 k,
Source: Company, PhillipCapital India Research
Page | 3 | PHILLIPCAPITAL INDIA RESEARCH
KOTAK MAHINDRA BANK INITIATING COVERAGE
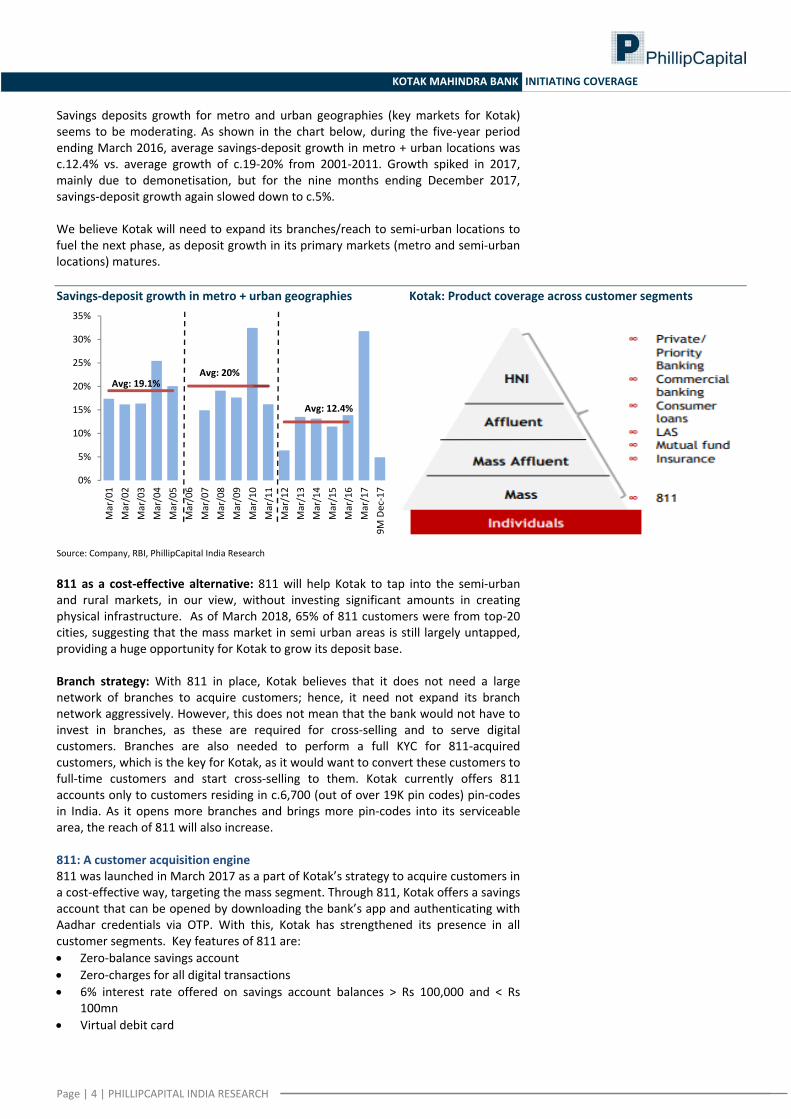
Savings deposits growth for metro and urban geographies (key markets for Kotak) seems to be moderating. As shown in the chart below, during the five‐year period ending March 2016, average savings‐deposit growth in metro + urban locations was c.12.4% vs. average growth of c.19‐20% from 2001‐2011. Growth spiked in 2017, mainly due to demonetisation, but for the nine months ending December 2017, savings‐deposit growth again slowed down to c.5%. We believe Kotak will need to expand its branches/reach to semi‐urban locations to fuel the next phase, as deposit growth in its primary markets (metro and semi‐urban locations) matures. Savings‐deposit growth in metro + urban geographies Kotak: Product coverage across customer segments
0%
5%
10%
15%
20%
25%
30%
35%
Mar/01
Mar/02
Mar/03
Mar/04
Mar/05
Mar/06
Mar/07
Mar/08
Mar/09
Mar/10
Mar/11
Mar/12
Mar/13
Mar/14
Mar/15
Mar/16
Mar/17
9M Dec‐17
Avg: 19.1%Avg: 20%
Avg: 12.4%
Source: Company, RBI, PhillipCapital India Research 811 as a cost‐effective alternative: 811 will help Kotak to tap into the semi‐urban and rural markets, in our view, without investing significant amounts in creating physical infrastructure. As of March 2018, 65% of 811 customers were from top‐20 cities, suggesting that the mass market in semi urban areas is still largely untapped, providing a huge opportunity for Kotak to grow its deposit base. Branch strategy: With 811 in place, Kotak believes that it does not need a large network of branches to acquire customers; hence, it need not expand its branch network aggressively. However, this does not mean that the bank would not have to invest in branches, as these are required for cross‐selling and to serve digital customers. Branches are also needed to perform a full KYC for 811‐acquired customers, which is the key for Kotak, as it would want to convert these customers to full‐time customers and start cross‐selling to them. Kotak currently offers 811 accounts only to customers residing in c.6,700 (out of over 19K pin codes) pin‐codes in India. As it opens more branches and brings more pin‐codes into its serviceable area, the reach of 811 will also increase. 811: A customer acquisition engine 811 was launched in March 2017 as a part of Kotak’s strategy to acquire customers in a cost‐effective way, targeting the mass segment. Through 811, Kotak offers a savings account that can be opened by downloading the bank’s app and authenticating with Aadhar credentials via OTP. With this, Kotak has strengthened its presence in all customer segments. Key features of 811 are: • Zero‐balance savings account • Zero‐charges for all digital transactions • 6% interest rate offered on savings account balances > Rs 100,000 and < Rs
100mn • Virtual debit card
Page | 4 | PHILLIPCAPITAL INDIA RESEARCH
KOTAK MAHINDRA BANK INITIATING COVERAGE
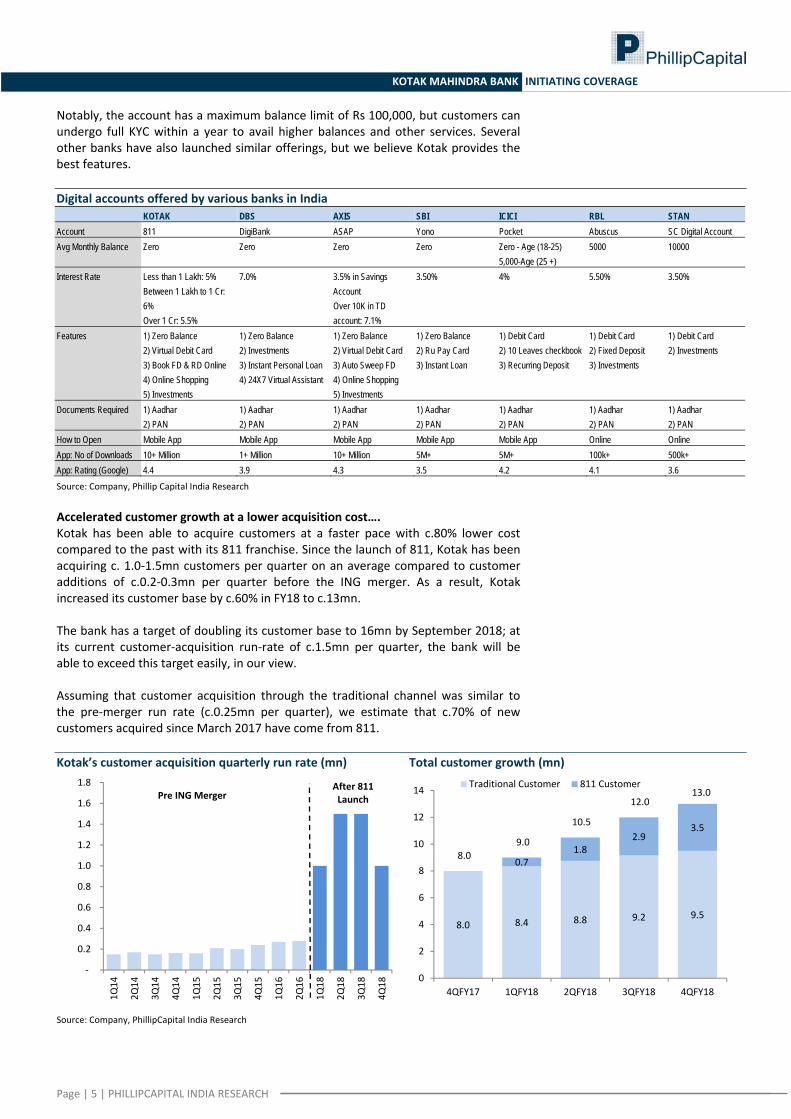
Notably, the account has a maximum balance limit of Rs 100,000, but customers can undergo full KYC within a year to avail higher balances and other services. Several other banks have also launched similar offerings, but we believe Kotak provides the best features. Digital accounts offered by various banks in India KOTAK DBS AXIS SBI ICICI RBL STAN Account 811 DigiBank ASAP Yono Pocket Abuscus SC Digital Account Avg Monthly Balance Zero Zero Zero Zero Zero - Age (18-25)
5,000-Age (25 +) 5000 10000
Interest Rate Less than 1 Lakh: 5% Between 1 Lakh to 1 Cr: 6% Over 1 Cr: 5.5%
7.0% 3.5% in Savings Account Over 10K in TD account: 7.1%
3.50% 4% 5.50% 3.50%
Features 1) Zero Balance 2) Virtual Debit Card 3) Book FD & RD Online 4) Online Shopping 5) Investments
1) Zero Balance 2) Investments 3) Instant Personal Loan 4) 24X7 Virtual Assistant
1) Zero Balance 2) Virtual Debit Card 3) Auto Sweep FD 4) Online Shopping 5) Investments
1) Zero Balance 2) Ru Pay Card 3) Instant Loan
1) Debit Card 2) 10 Leaves checkbook 3) Recurring Deposit
1) Debit Card 2) Fixed Deposit 3) Investments
1) Debit Card 2) Investments
Documents Required 1) Aadhar 2) PAN
1) Aadhar 2) PAN
1) Aadhar 2) PAN
1) Aadhar 2) PAN
1) Aadhar 2) PAN
1) Aadhar 2) PAN
1) Aadhar 2) PAN
How to Open Mobile App Mobile App Mobile App Mobile App Mobile App Online Online App: No of Downloads 10+ Million 1+ Million 10+ Million 5M+ 5M+ 100k+ 500k+ App: Rating (Google) 4.4 3.9 4.3 3.5 4.2 4.1 3.6 Source: Company, Phillip Capital India Research Accelerated customer growth at a lower acquisition cost…. Kotak has been able to acquire customers at a faster pace with c.80% lower cost compared to the past with its 811 franchise. Since the launch of 811, Kotak has been acquiring c. 1.0‐1.5mn customers per quarter on an average compared to customer additions of c.0.2‐0.3mn per quarter before the ING merger. As a result, Kotak increased its customer base by c.60% in FY18 to c.13mn. The bank has a target of doubling its customer base to 16mn by September 2018; at its current customer‐acquisition run‐rate of c.1.5mn per quarter, the bank will be able to exceed this target easily, in our view. Assuming that customer acquisition through the traditional channel was similar to the pre‐merger run rate (c.0.25mn per quarter), we estimate that c.70% of new customers acquired since March 2017 have come from 811. Kotak’s customer acquisition quarterly run rate (mn) Total customer growth (mn)
‐
0.2
0.4
0.6
0.8
1.0
1.2
1.4
1.6
1.8
1Q14
2Q14
3Q14
4Q14
1Q15
2Q15
3Q15
4Q15
1Q16
2Q16
1Q18
2Q18
3Q18
4Q18
Pre ING MergerAfter 811 Launch
8.0 8.4 8.8 9.2 9.5
0.71.8
2.93.5
8.0 9.0
10.5
12.0 13.0
0
2
4
6
8
10
12
14
4QFY17 1QFY18 2QFY18 3QFY18 4QFY18
Traditional Customer 811 Customer
Source: Company, PhillipCapital India Research
Page | 5 | PHILLIPCAPITAL INDIA RESEARCH
KOTAK MAHINDRA BANK INITIATING COVERAGE
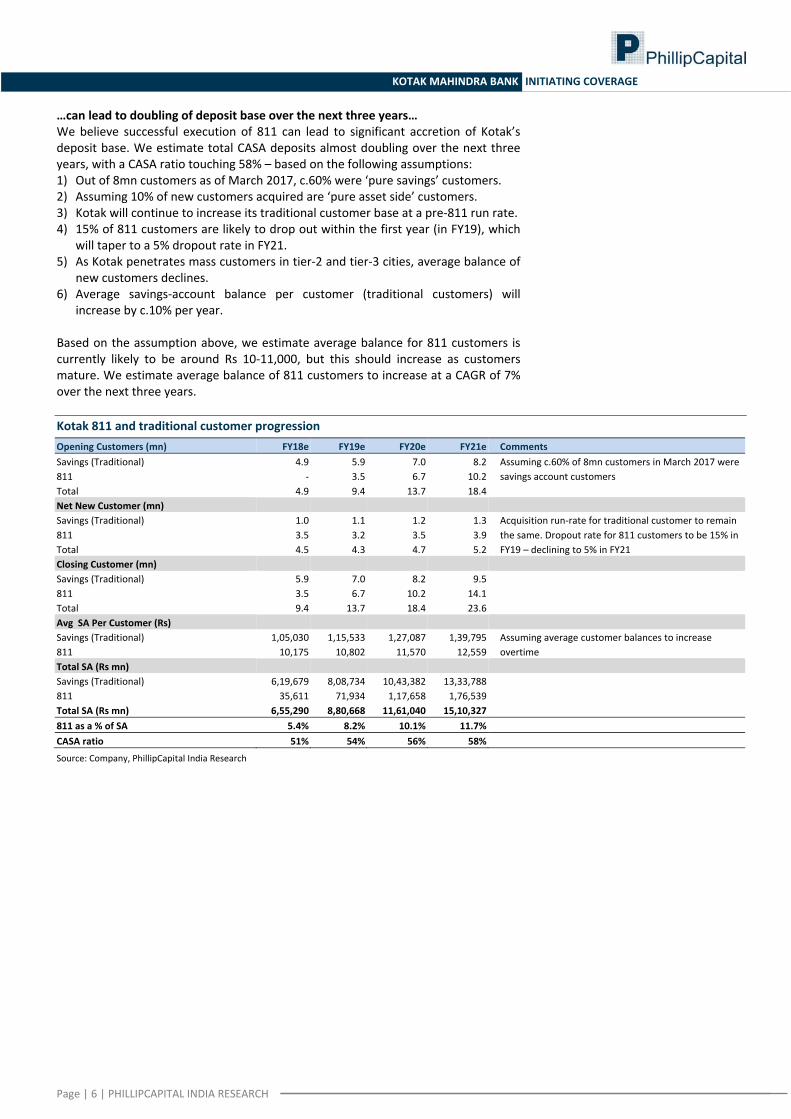
…can lead to doubling of deposit base over the next three years… We believe successful execution of 811 can lead to significant accretion of Kotak’s deposit base. We estimate total CASA deposits almost doubling over the next three years, with a CASA ratio touching 58% – based on the following assumptions: 1) Out of 8mn customers as of March 2017, c.60% were ‘pure savings’ customers. 2) Assuming 10% of new customers acquired are ‘pure asset side’ customers. 3) Kotak will continue to increase its traditional customer base at a pre‐811 run rate. 4) 15% of 811 customers are likely to drop out within the first year (in FY19), which
will taper to a 5% dropout rate in FY21. 5) As Kotak penetrates mass customers in tier‐2 and tier‐3 cities, average balance of
new customers declines. 6) Average savings‐account balance per customer (traditional customers) will
increase by c.10% per year. Based on the assumption above, we estimate average balance for 811 customers is currently likely to be around Rs 10‐11,000, but this should increase as customers mature. We estimate average balance of 811 customers to increase at a CAGR of 7% over the next three years. Kotak 811 and traditional customer progression Opening Customers (mn) FY18e FY19e FY20e FY21e Comments Savings (Traditional) 4.9 5.9 7.0 8.2 Assuming c.60% of 8mn customers in March 2017 were
savings account customers 811 ‐ 3.5 6.7 10.2 Total 4.9 9.4 13.7 18.4 Net New Customer (mn) Savings (Traditional) 1.0 1.1 1.2 1.3 Acquisition run‐rate for traditional customer to remain
the same. Dropout rate for 811 customers to be 15% in FY19 – declining to 5% in FY21
811 3.5 3.2 3.5 3.9 Total 4.5 4.3 4.7 5.2 Closing Customer (mn) Savings (Traditional) 5.9 7.0 8.2 9.5 811 3.5 6.7 10.2 14.1 Total 9.4 13.7 18.4 23.6 Avg SA Per Customer (Rs) Savings (Traditional) 1,05,030 1,15,533 1,27,087 1,39,795 Assuming average customer balances to increase
overtime 811 10,175 10,802 11,570 12,559 Total SA (Rs mn) Savings (Traditional) 6,19,679 8,08,734 10,43,382 13,33,788 811 35,611 71,934 1,17,658 1,76,539 Total SA (Rs mn) 6,55,290 8,80,668 11,61,040 15,10,327 811 as a % of SA 5.4% 8.2% 10.1% 11.7% CASA ratio 51% 54% 56% 58%
Source: Company, PhillipCapital India Research
Page | 6 | PHILLIPCAPITAL INDIA RESEARCH
KOTAK MAHINDRA BANK INITIATING COVERAGE
Page | 7 | PHILLIPCAPITAL INDIA RESEARCH
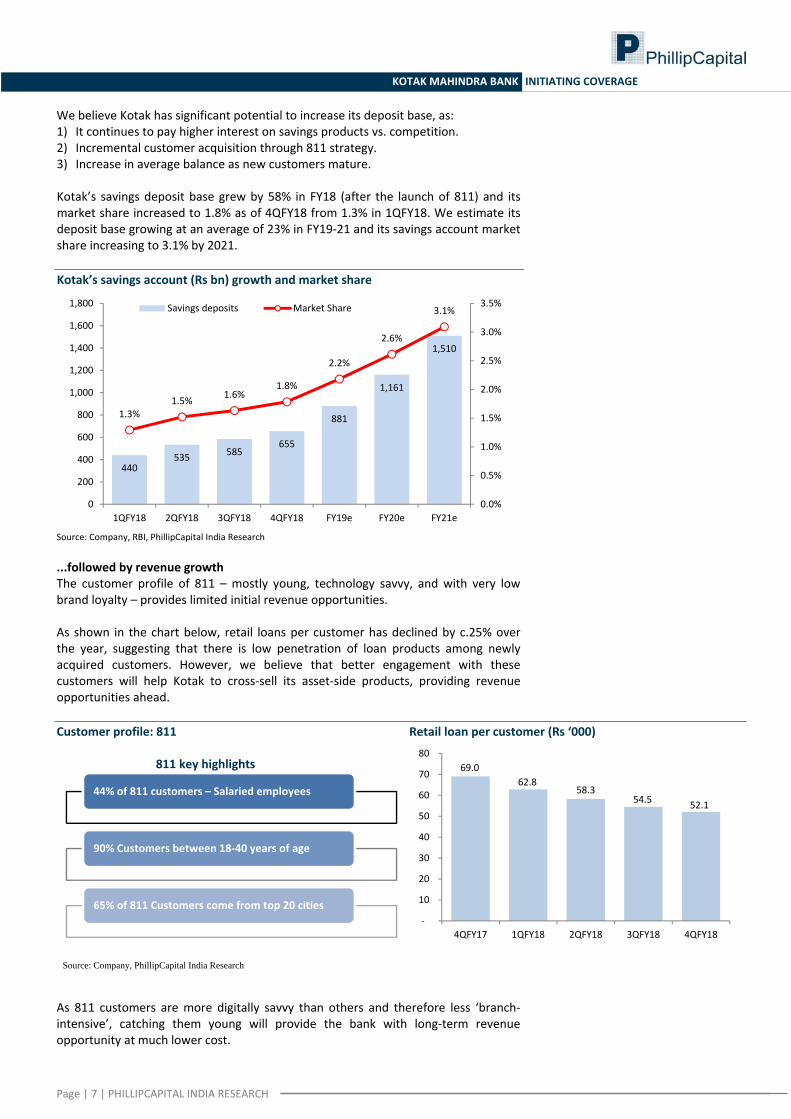
We believe Kotak has significant potential to increase its deposit base, as: 1) It continues to pay higher interest on savings products vs. competition. 2) Incremental customer acquisition through 811 strategy. 3) Increase in average balance as new customers mature.
Kotak’s savings deposit base grew by 58% in FY18 (after the launch of 811) and its market share increased to 1.8% as of 4QFY18 from 1.3% in 1QFY18. We estimate its deposit base growing at an average of 23% in FY19‐21 and its savings account market share increasing to 3.1% by 2021. Kotak’s savings account (Rs bn) growth and market share
Source: Company, RBI, PhillipCapital India Research
...followed by revenue growth The customer profile of 811 – mostly young, technology savvy, and with very low brand loyalty – provides limited initial revenue opportunities. As shown in the chart below, retail loans per customer has declined by c.25% over the year, suggesting that there is low penetration of loan products among newly acquired customers. However, we believe that better engagement with these customers will help Kotak to cross‐sell its asset‐side products, providing revenue opportunities ahead. Customer profile: 811 Retail loan per customer (Rs ‘000) 811 key highlights
Source: Company, PhillipCapital India Research As 811 customers are more digitally savvy than others and therefore less ‘branch‐intensive’, catching them young will provide the bank with long‐term revenue opportunity at much lower cost.
440535 585
655
881
1,161
1,510
1.3%1.5% 1.6%
1.8%
2.2%
2.6%
3.1%
0.0%
0.5%
1.0%
1.5%
2.0%
2.5%
3.0%
3.5%
0
200
400
600
800
1,000
1,200
1,400
1,600
1,800
1QFY18 2QFY18 3QFY18 4QFY18 FY19e FY20e FY21e
Savings deposits Market Share
44% of 811 customers – Salaried employees
90% Customers between 18‐40 years of age
65% of 811 Customers come from top 20 cities
69.062.8
58.354.5 52.1
‐
10
20
30
40
50
60
70
80
4QFY17 1QFY18 2QFY18 3QFY18 4QFY18
Page | 8 | PHILLIPCAPITAL INDIA RESEARCH
KOTAK MAHINDRA BANK INITIATING COVERAGE
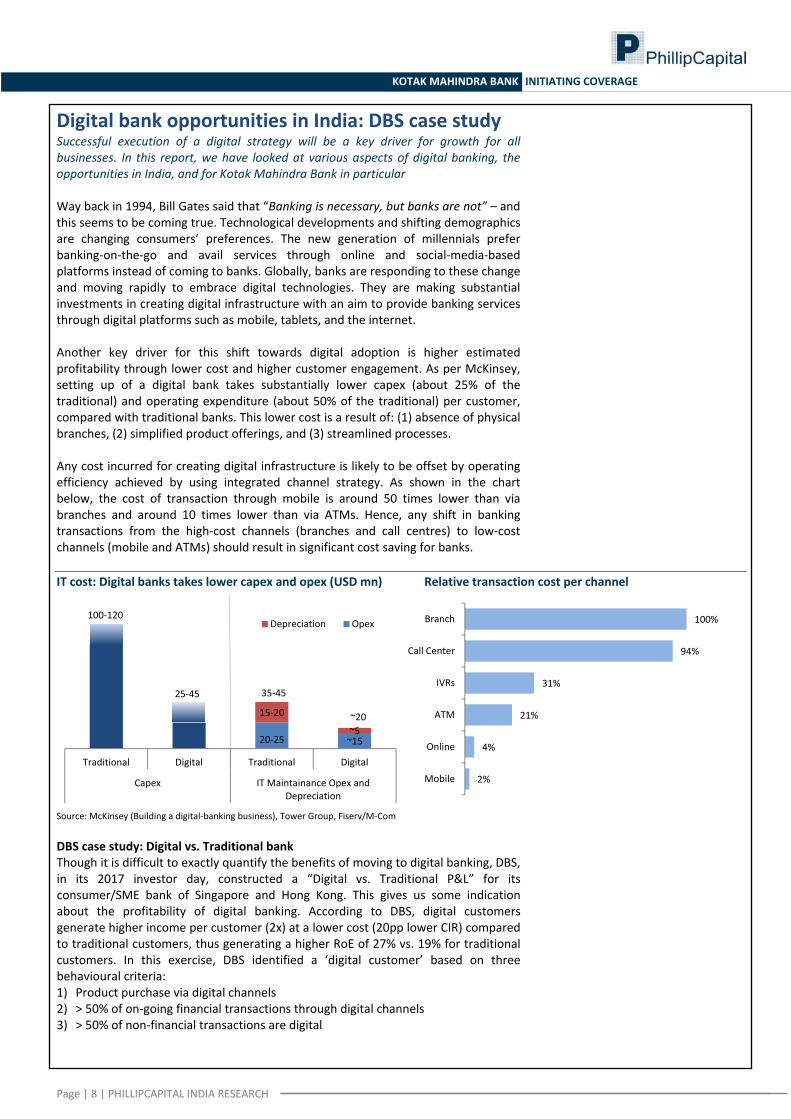
Digital bank opportunities in India: DBS case study Successful execution of a digital strategy will be a key driver for growth for all businesses. In this report, we have looked at various aspects of digital banking, the opportunities in India, and for Kotak Mahindra Bank in particular Way back in 1994, Bill Gates said that “Banking is necessary, but banks are not” – and this seems to be coming true. Technological developments and shifting demographics are changing consumers’ preferences. The new generation of millennials prefer banking‐on‐the‐go and avail services through online and social‐media‐based platforms instead of coming to banks. Globally, banks are responding to these change and moving rapidly to embrace digital technologies. They are making substantial investments in creating digital infrastructure with an aim to provide banking services through digital platforms such as mobile, tablets, and the internet. Another key driver for this shift towards digital adoption is higher estimated profitability through lower cost and higher customer engagement. As per McKinsey, setting up of a digital bank takes substantially lower capex (about 25% of the traditional) and operating expenditure (about 50% of the traditional) per customer, compared with traditional banks. This lower cost is a result of: (1) absence of physical branches, (2) simplified product offerings, and (3) streamlined processes. Any cost incurred for creating digital infrastructure is likely to be offset by operating efficiency achieved by using integrated channel strategy. As shown in the chart below, the cost of transaction through mobile is around 50 times lower than via branches and around 10 times lower than via ATMs. Hence, any shift in banking transactions from the high‐cost channels (branches and call centres) to low‐cost channels (mobile and ATMs) should result in significant cost saving for banks. IT cost: Digital banks takes lower capex and opex (USD mn) Relative transaction cost per channel
Source: McKinsey (Building a digital‐banking business), Tower Group, Fiserv/M‐Com
DBS case study: Digital vs. Traditional bank Though it is difficult to exactly quantify the benefits of moving to digital banking, DBS, in its 2017 investor day, constructed a “Digital vs. Traditional P&L” for its consumer/SME bank of Singapore and Hong Kong. This gives us some indication about the profitability of digital banking. According to DBS, digital customers generate higher income per customer (2x) at a lower cost (20pp lower CIR) compared to traditional customers, thus generating a higher RoE of 27% vs. 19% for traditional customers. In this exercise, DBS identified a ‘digital customer’ based on three behavioural criteria: 1) Product purchase via digital channels 2) > 50% of on‐going financial transactions through digital channels 3) > 50% of non‐financial transactions are digital
20‐25 ~15
100‐120
25‐45
15‐20
~5
Traditional Digital Traditional Digital
Capex IT Maintainance Opex and Depreciation
Depreciation Opex
35‐45
~20
100%
94%
31%
21%
4%
2%
Branch
Call Center
IVRs
ATM
Online
Mobile
Page | 9 | PHILLIPCAPITAL INDIA RESEARCH
KOTAK MAHINDRA BANK INITIATING COVERAGE
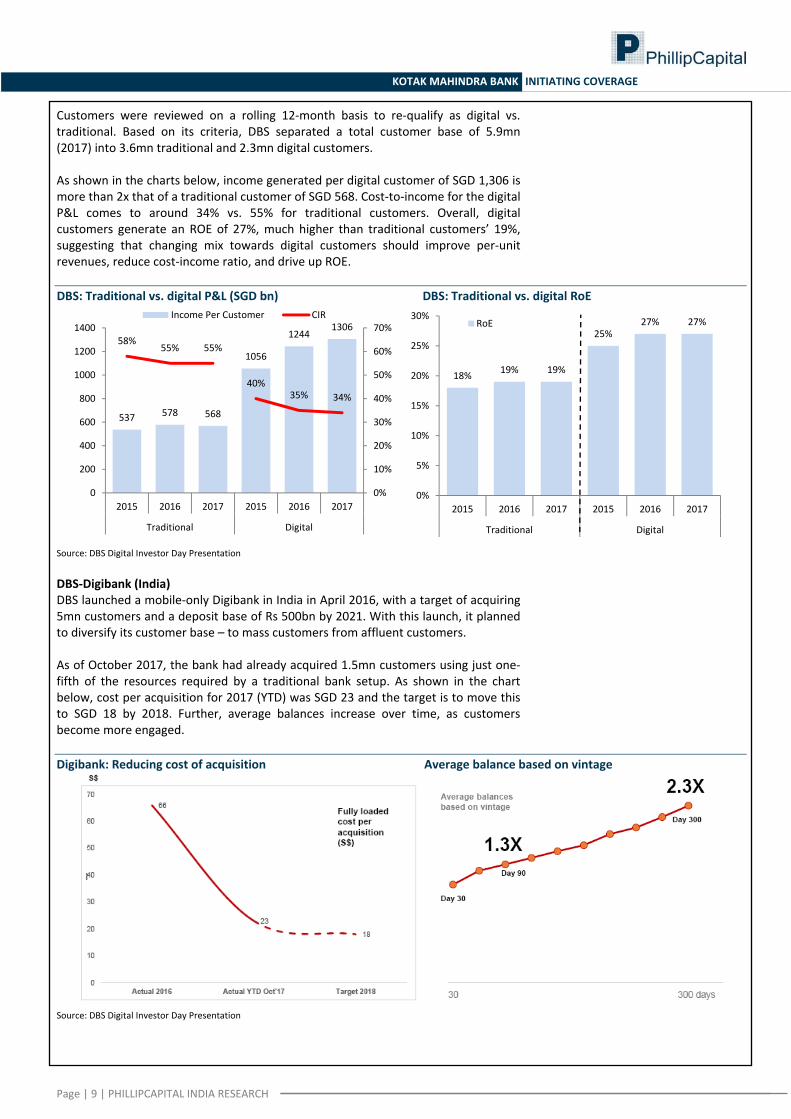
Customers were reviewed on a rolling 12‐month basis to re‐qualify as digital vs. traditional. Based on its criteria, DBS separated a total customer base of 5.9mn (2017) into 3.6mn traditional and 2.3mn digital customers. As shown in the charts below, income generated per digital customer of SGD 1,306 is more than 2x that of a traditional customer of SGD 568. Cost‐to‐income for the digital P&L comes to around 34% vs. 55% for traditional customers. Overall, digital customers generate an ROE of 27%, much higher than traditional customers’ 19%, suggesting that changing mix towards digital customers should improve per‐unit revenues, reduce cost‐income ratio, and drive up ROE. DBS: Traditional vs. digital P&L (SGD bn) DBS: Traditional vs. digital RoE
Source: DBS Digital Investor Day Presentation DBS‐Digibank (India) DBS launched a mobile‐only Digibank in India in April 2016, with a target of acquiring 5mn customers and a deposit base of Rs 500bn by 2021. With this launch, it planned to diversify its customer base – to mass customers from affluent customers. As of October 2017, the bank had already acquired 1.5mn customers using just one‐fifth of the resources required by a traditional bank setup. As shown in the chart below, cost per acquisition for 2017 (YTD) was SGD 23 and the target is to move this to SGD 18 by 2018. Further, average balances increase over time, as customers become more engaged. Digibank: Reducing cost of acquisition Average balance based on vintage
Source: DBS Digital Investor Day Presentation
537 578 568
1056
12441306
58%55% 55%
40%35% 34%
0%
10%
20%
30%
40%
50%
60%
70%
0
200
400
600
800
1000
1200
1400
2015 2016 2017 2015 2016 2017
Traditional Digital
Income Per Customer CIR
18% 19% 19%
25%27% 27%
0%
5%
10%
15%
20%
25%
30%
2015 2016 2017 2015 2016 2017
Traditional Digital
RoE
Page | 10 | PHILLIPCAPITAL INDIA RESEARCH
KOTAK MAHINDRA BANK INITIATING COVERAGE
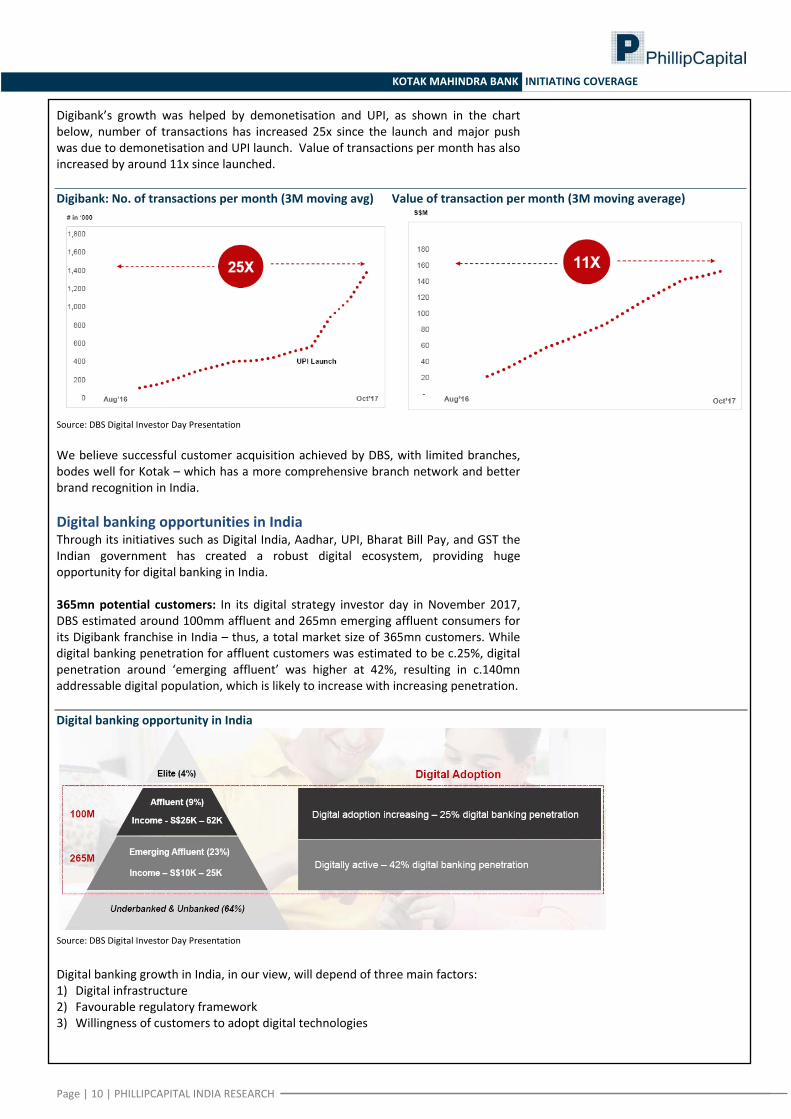
Digibank’s growth was helped by demonetisation and UPI, as shown in the chart below, number of transactions has increased 25x since the launch and major push was due to demonetisation and UPI launch. Value of transactions per month has also increased by around 11x since launched. Digibank: No. of transactions per month (3M moving avg) Value of transaction per month (3M moving average)
Source: DBS Digital Investor Day Presentation We believe successful customer acquisition achieved by DBS, with limited branches, bodes well for Kotak – which has a more comprehensive branch network and better brand recognition in India. Digital banking opportunities in India Through its initiatives such as Digital India, Aadhar, UPI, Bharat Bill Pay, and GST the Indian government has created a robust digital ecosystem, providing huge opportunity for digital banking in India. 365mn potential customers: In its digital strategy investor day in November 2017, DBS estimated around 100mm affluent and 265mn emerging affluent consumers for its Digibank franchise in India – thus, a total market size of 365mn customers. While digital banking penetration for affluent customers was estimated to be c.25%, digital penetration around ‘emerging affluent’ was higher at 42%, resulting in c.140mn addressable digital population, which is likely to increase with increasing penetration. Digital banking opportunity in India
Source: DBS Digital Investor Day Presentation
Digital banking growth in India, in our view, will depend of three main factors: 1) Digital infrastructure 2) Favourable regulatory framework 3) Willingness of customers to adopt digital technologies
Page | 11 | PHILLIPCAPITAL INDIA RESEARCH
KOTAK MAHINDRA BANK INITIATING COVERAGE
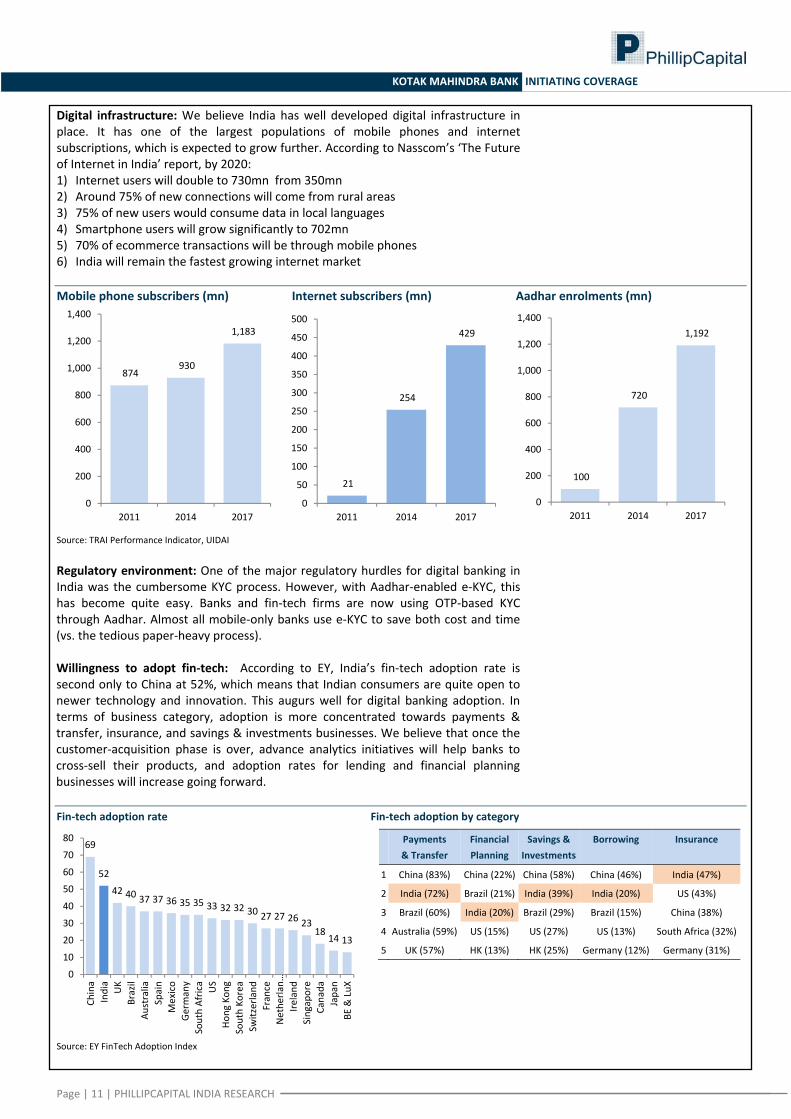
Digital infrastructure: We believe India has well developed digital infrastructure in place. It has one of the largest populations of mobile phones and internet subscriptions, which is expected to grow further. According to Nasscom’s ‘The Future of Internet in India’ report, by 2020: 1) Internet users will double to 730mn from 350mn 2) Around 75% of new connections will come from rural areas 3) 75% of new users would consume data in local languages 4) Smartphone users will grow significantly to 702mn 5) 70% of ecommerce transactions will be through mobile phones 6) India will remain the fastest growing internet market Mobile phone subscribers (mn) Internet subscribers (mn) Aadhar enrolments (mn)
Source: TRAI Performance Indicator, UIDAI Regulatory environment: One of the major regulatory hurdles for digital banking in India was the cumbersome KYC process. However, with Aadhar‐enabled e‐KYC, this has become quite easy. Banks and fin‐tech firms are now using OTP‐based KYC through Aadhar. Almost all mobile‐only banks use e‐KYC to save both cost and time (vs. the tedious paper‐heavy process). Willingness to adopt fin‐tech: According to EY, India’s fin‐tech adoption rate is second only to China at 52%, which means that Indian consumers are quite open to newer technology and innovation. This augurs well for digital banking adoption. In terms of business category, adoption is more concentrated towards payments & transfer, insurance, and savings & investments businesses. We believe that once the customer‐acquisition phase is over, advance analytics initiatives will help banks to cross‐sell their products, and adoption rates for lending and financial planning businesses will increase going forward. Fin‐tech adoption rate Fin‐tech adoption by category
Payments & Transfer
Financial Planning
Savings & Investments
Borrowing
Insurance
1 China (83%) China (22%) China (58%) China (46%) India (47%)
2 India (72%) Brazil (21%) India (39%) India (20%) US (43%)
3 Brazil (60%) India (20%) Brazil (29%) Brazil (15%) China (38%)
4 Australia (59%) US (15%) US (27%) US (13%) South Africa (32%)
5 UK (57%) HK (13%) HK (25%) Germany (12%) Germany (31%)
Source: EY FinTech Adoption Index
874 930
1,183
0
200
400
600
800
1,000
1,200
1,400
2011 2014 2017
21
254
429
0
50
100
150
200
250
300
350
400
450
500
2011 2014 2017
100
720
1,192
0
200
400
600
800
1,000
1,200
1,400
2011 2014 2017
69
52
42 40 37 37 36 35 35 33 32 32 30 27 27 26 2318
14 13
0
10
20
30
40
50
60
70
80
China
India
UK
Brazil
Australia
Spain
Mexico
Germany
South Africa US
Hong
Kon
gSouth Ko
rea
Switzerland
France
Nethe
rlan…
Ireland
Singapore
Canada
Japan
BE & LuX
KOTAK MAHINDRA BANK INITIATING COVERAGE
Page | 12 | PHILLIPCAPITAL INDIA RESEARCH
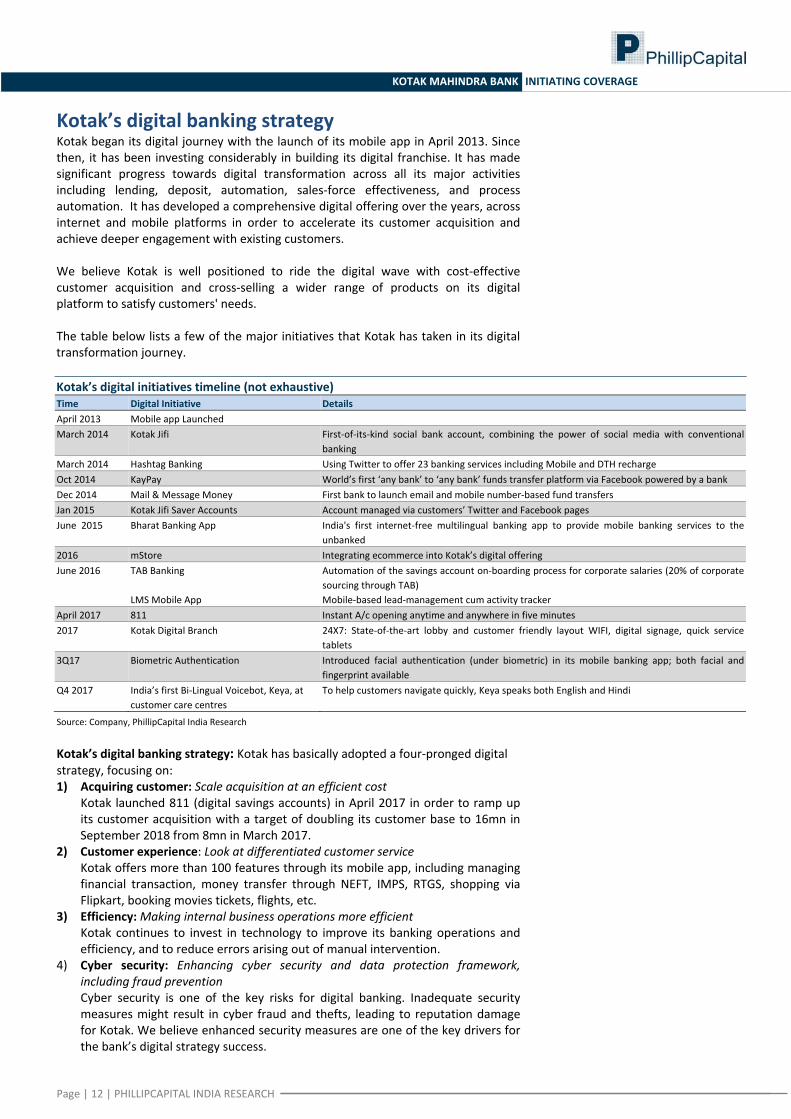
Kotak’s digital banking strategy Kotak began its digital journey with the launch of its mobile app in April 2013. Since then, it has been investing considerably in building its digital franchise. It has made significant progress towards digital transformation across all its major activities including lending, deposit, automation, sales‐force effectiveness, and process automation. It has developed a comprehensive digital offering over the years, across internet and mobile platforms in order to accelerate its customer acquisition and achieve deeper engagement with existing customers. We believe Kotak is well positioned to ride the digital wave with cost‐effective customer acquisition and cross‐selling a wider range of products on its digital platform to satisfy customers' needs. The table below lists a few of the major initiatives that Kotak has taken in its digital transformation journey. Kotak’s digital initiatives timeline (not exhaustive) Time Digital Initiative Details April 2013 Mobile app Launched March 2014 Kotak Jifi First‐of‐its‐kind social bank account, combining the power of social media with conventional
banking March 2014 Hashtag Banking Using Twitter to offer 23 banking services including Mobile and DTH recharge Oct 2014 KayPay World’s first ‘any bank’ to ‘any bank’ funds transfer platform via Facebook powered by a bank Dec 2014 Mail & Message Money First bank to launch email and mobile number‐based fund transfers Jan 2015 Kotak Jifi Saver Accounts Account managed via customers’ Twitter and Facebook pages June 2015 Bharat Banking App India's first internet‐free multilingual banking app to provide mobile banking services to the
unbanked 2016 mStore Integrating ecommerce into Kotak’s digital offering June 2016 TAB Banking Automation of the savings account on‐boarding process for corporate salaries (20% of corporate
sourcing through TAB) LMS Mobile App Mobile‐based lead‐management cum activity tracker April 2017 811 Instant A/c opening anytime and anywhere in five minutes 2017 Kotak Digital Branch 24X7: State‐of‐the‐art lobby and customer friendly layout WIFI, digital signage, quick service
tablets 3Q17 Biometric Authentication Introduced facial authentication (under biometric) in its mobile banking app; both facial and
fingerprint available Q4 2017 India’s first Bi‐Lingual Voicebot, Keya, at
customer care centres To help customers navigate quickly, Keya speaks both English and Hindi
Source: Company, PhillipCapital India Research Kotak’s digital banking strategy: Kotak has basically adopted a four‐pronged digital strategy, focusing on: 1) Acquiring customer: Scale acquisition at an efficient cost
Kotak launched 811 (digital savings accounts) in April 2017 in order to ramp up its customer acquisition with a target of doubling its customer base to 16mn in September 2018 from 8mn in March 2017.
2) Customer experience: Look at differentiated customer service Kotak offers more than 100 features through its mobile app, including managing financial transaction, money transfer through NEFT, IMPS, RTGS, shopping via Flipkart, booking movies tickets, flights, etc.
3) Efficiency: Making internal business operations more efficient Kotak continues to invest in technology to improve its banking operations and efficiency, and to reduce errors arising out of manual intervention.
4) Cyber security: Enhancing cyber security and data protection framework, including fraud prevention Cyber security is one of the key risks for digital banking. Inadequate security measures might result in cyber fraud and thefts, leading to reputation damage for Kotak. We believe enhanced security measures are one of the key drivers for the bank’s digital strategy success.
KOTAK MAHINDRA BANK INITIATING COVERAGE
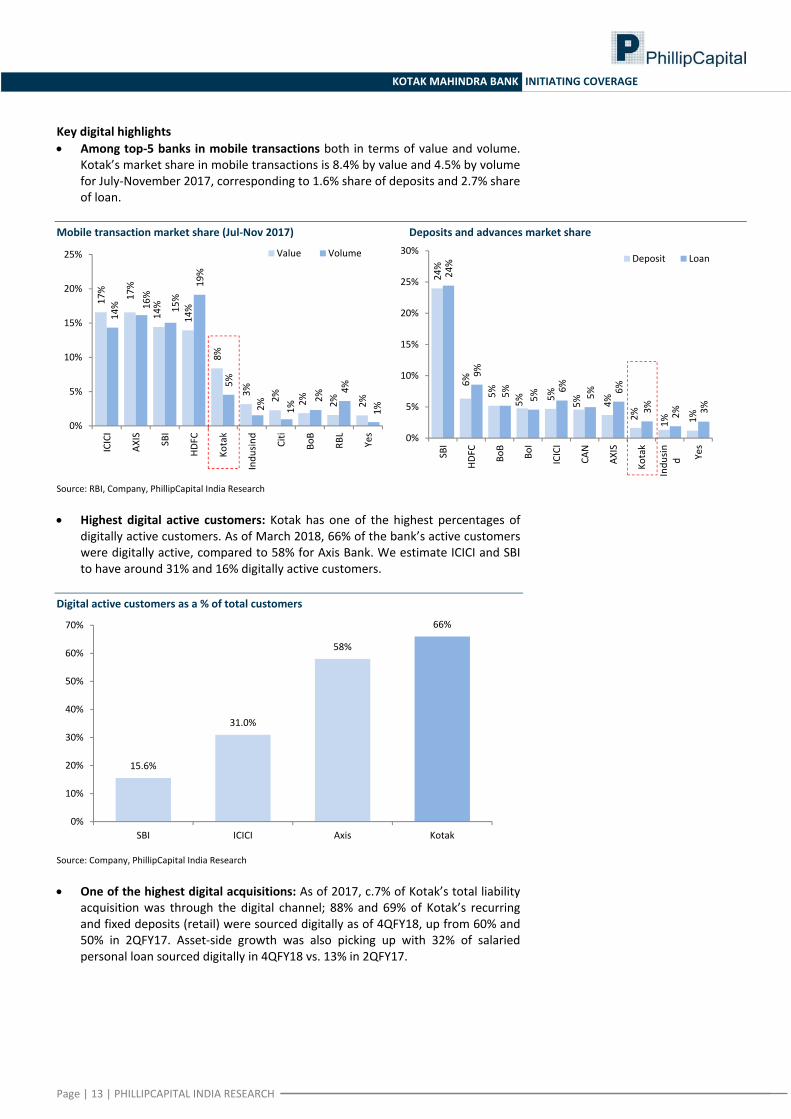
Key digital highlights • Among top‐5 banks in mobile transactions both in terms of value and volume.
Kotak’s market share in mobile transactions is 8.4% by value and 4.5% by volume for July‐November 2017, corresponding to 1.6% share of deposits and 2.7% share of loan.
Mobile transaction market share (Jul‐Nov 2017) Deposits and advances market share
17% 17%
14%
14%
8%
3% 2% 2% 2% 2%
14% 16%
15%
19%
5%
2% 1%
2%
4%
1%
0%
5%
10%
15%
20%
25%
ICICI
AXIS SBI
HDFC
Kotak
Indu
sind
Citi
BoB
RBL
Yes
Value Volume
24%
6%
5%
5% 5%
5% 4%
2% 1% 1%
24%
9%
5% 5%
6%
5% 6%
3% 2% 3%
0%
5%
10%
15%
20%
25%
30%
SBI
HDFC BoB
BoI
ICICI
CAN
AXIS
Kotak
Indu
sin d Yes
Deposit Loan
Source: RBI, Company, PhillipCapital India Research • Highest digital active customers: Kotak has one of the highest percentages of
digitally active customers. As of March 2018, 66% of the bank’s active customers were digitally active, compared to 58% for Axis Bank. We estimate ICICI and SBI to have around 31% and 16% digitally active customers.
Digital active customers as a % of total customers
15.6%
31.0%
58%
66%
0%
10%
20%
30%
40%
50%
60%
70%
SBI ICICI Axis Kotak
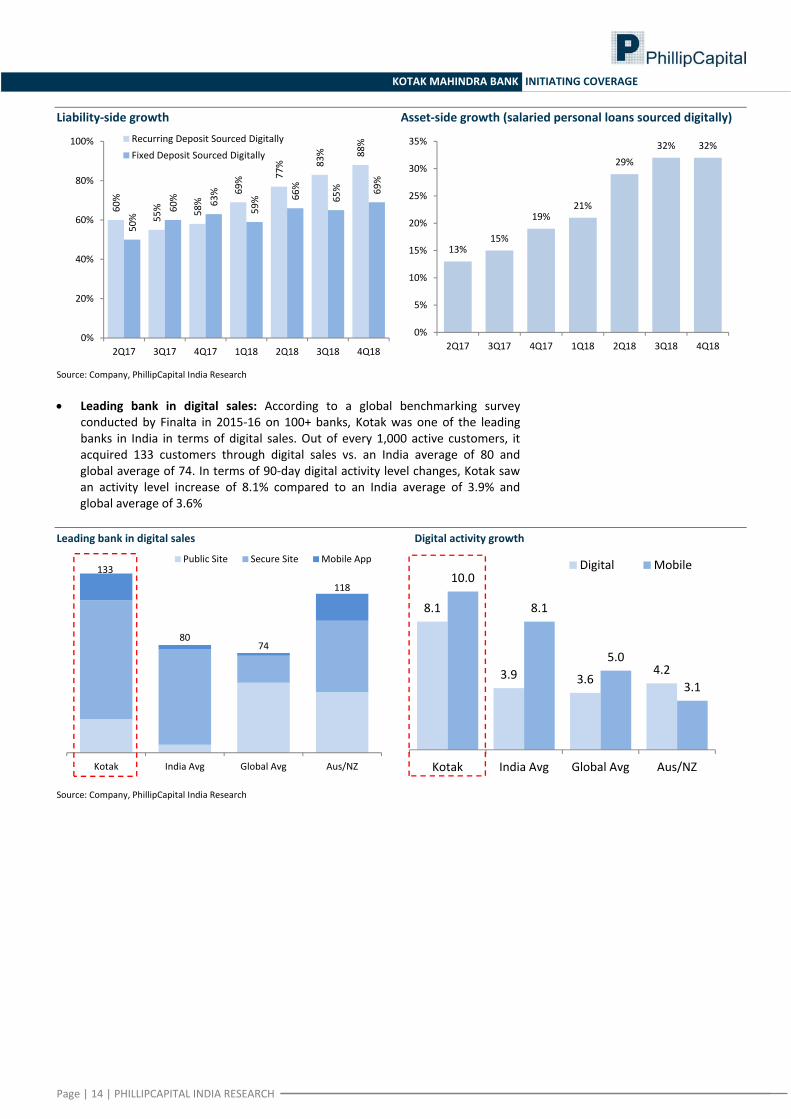
Source: Company, PhillipCapital India Research • One of the highest digital acquisitions: As of 2017, c.7% of Kotak’s total liability
acquisition was through the digital channel; 88% and 69% of Kotak’s recurring and fixed deposits (retail) were sourced digitally as of 4QFY18, up from 60% and 50% in 2QFY17. Asset‐side growth was also picking up with 32% of salaried personal loan sourced digitally in 4QFY18 vs. 13% in 2QFY17.
Page | 13 | PHILLIPCAPITAL INDIA RESEARCH
KOTAK MAHINDRA BANK INITIATING COVERAGE
Liability‐side growth Asset‐side growth (salaried personal loans sourced digitally)
60%
55% 58%
69% 77
% 83% 88%
50%
60% 63%
59% 66
%
65% 69%
0%
20%
40%
60%
80%
100%
2Q17 3Q17 4Q17 1Q18 2Q18 3Q18 4Q18
Recurring Deposit Sourced DigitallyFixed Deposit Sourced Digitally
13%15%
19%21%
29%32% 32%
0%
5%
10%
15%
20%
25%
30%
35%
2Q17 3Q17 4Q17 1Q18 2Q18 3Q18 4Q18
Source: Company, PhillipCapital India Research • Leading bank in digital sales: According to a global benchmarking survey
conducted by Finalta in 2015‐16 on 100+ banks, Kotak was one of the leading banks in India in terms of digital sales. Out of every 1,000 active customers, it acquired 133 customers through digital sales vs. an India average of 80 and global average of 74. In terms of 90‐day digital activity level changes, Kotak saw an activity level increase of 8.1% compared to an India average of 3.9% and global average of 3.6%
Leading bank in digital sales Digital activity growth
133
8074
118
Kotak India Avg Global Avg Aus/NZ
Public Site Secure Site Mobile App
8.1
3.9 3.64.2
10.0
8.1
5.0
3.1
Kotak India Avg Global Avg Aus/NZ
Digital Mobile
Source: Company, PhillipCapital India Research
Page | 14 | PHILLIPCAPITAL INDIA RESEARCH
KOTAK MAHINDRA BANK INITIATING COVERAGE
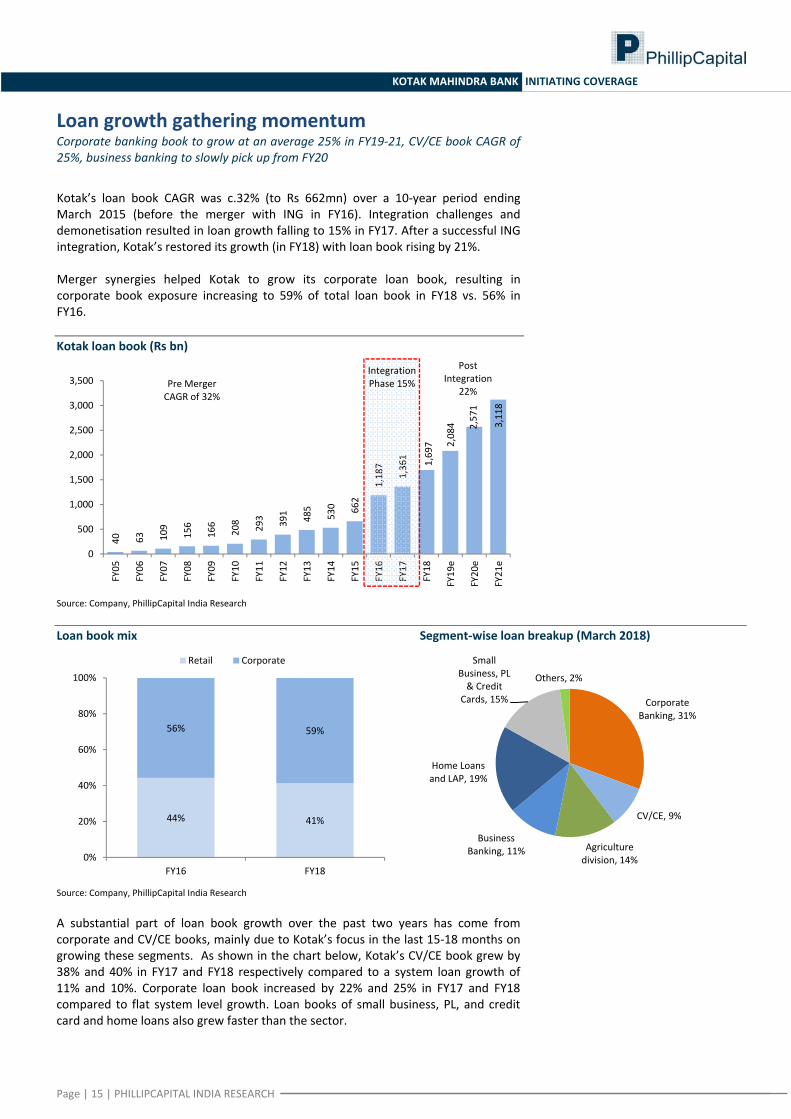
Loan growth gathering momentum Corporate banking book to grow at an average 25% in FY19‐21, CV/CE book CAGR of 25%, business banking to slowly pick up from FY20
Kotak’s loan book CAGR was c.32% (to Rs 662mn) over a 10‐year period ending March 2015 (before the merger with ING in FY16). Integration challenges and demonetisation resulted in loan growth falling to 15% in FY17. After a successful ING integration, Kotak’s restored its growth (in FY18) with loan book rising by 21%. Merger synergies helped Kotak to grow its corporate loan book, resulting in corporate book exposure increasing to 59% of total loan book in FY18 vs. 56% in FY16. Kotak loan book (Rs bn)
40 63 109
156
166
208 293 391 485
530 662
1,187
1,361 1,697 2,084 2,571
3,118
0
500
1,000
1,500
2,000
2,500
3,000
3,500
FY05
FY06
FY07
FY08
FY09
FY10
FY11
FY12
FY13
FY14
FY15
FY16
FY17
FY18
FY19e
FY20e
FY21e
Pre Merger CAGR of 32%
Post Integration
22%
Integration Phase 15%
Source: Company, PhillipCapital India Research
Loan book mix Segment‐wise loan breakup (March 2018)
44% 41%
56% 59%
0%
20%
40%
60%
80%
100%
FY16 FY18
Retail Corporate
Corporate Banking, 31%
CV/CE, 9%
Agriculture division, 14%
Business Banking, 11%
Home Loans and LAP, 19%
Small Business, PL & Credit
Cards, 15%
Others, 2%
Source: Company, PhillipCapital India Research
A substantial part of loan book growth over the past two years has come from corporate and CV/CE books, mainly due to Kotak’s focus in the last 15‐18 months on growing these segments. As shown in the chart below, Kotak’s CV/CE book grew by 38% and 40% in FY17 and FY18 respectively compared to a system loan growth of 11% and 10%. Corporate loan book increased by 22% and 25% in FY17 and FY18 compared to flat system level growth. Loan books of small business, PL, and credit card and home loans also grew faster than the sector.
Page | 15 | PHILLIPCAPITAL INDIA RESEARCH
KOTAK MAHINDRA BANK INITIATING COVERAGE
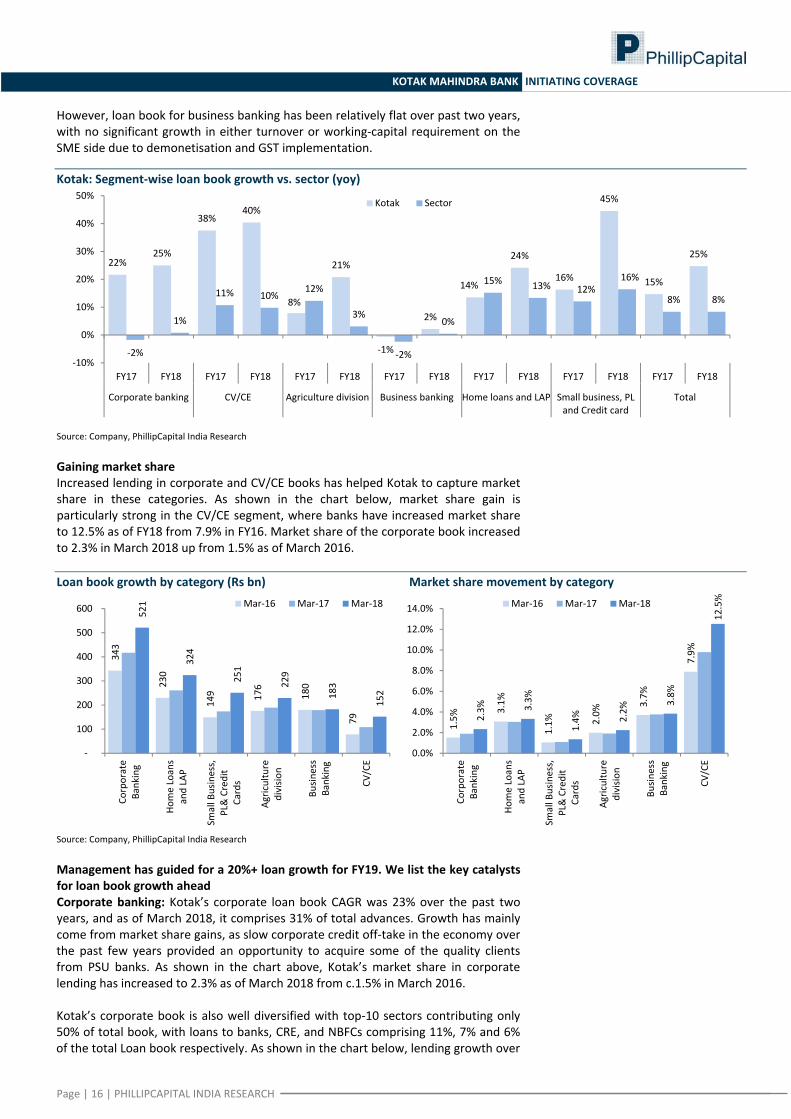
However, loan book for business banking has been relatively flat over past two years, with no significant growth in either turnover or working‐capital requirement on the SME side due to demonetisation and GST implementation.
Kotak: Segment‐wise loan book growth vs. sector (yoy)
22%25%
38%40%
8%
21%
‐1%
2%
14%
24%
16%
45%
15%
25%
‐2%
1%
11% 10%12%
3%
‐2%
0%
15% 13% 12%16%
8% 8%
‐10%
0%
10%
20%
30%
40%
50%
FY17 FY18 FY17 FY18 FY17 FY18 FY17 FY18 FY17 FY18 FY17 FY18 FY17 FY18
Corporate banking CV/CE Agriculture division Business banking Home loans and LAP Small business, PL and Credit card
Total
Kotak Sector
Source: Company, PhillipCapital India Research
Gaining market share Increased lending in corporate and CV/CE books has helped Kotak to capture market share in these categories. As shown in the chart below, market share gain is particularly strong in the CV/CE segment, where banks have increased market share to 12.5% as of FY18 from 7.9% in FY16. Market share of the corporate book increased to 2.3% in March 2018 up from 1.5% as of March 2016.
Loan book growth by category (Rs bn) Market share movement by category
343
230
149 176
180
79
521
324
251
229
183
152
‐
100
200
300
400
500
600
Corporate
Banking
Home Loans
and LAP
Small Business,
PL& Credit
Cards
Agriculture
divisio
n
Busin
ess
Banking
CV/CE
Mar‐16 Mar‐17 Mar‐18
1.5%
3.1%
1.1% 2.0%
3.7%
7.9%
2.3% 3.3%
1.4% 2.2%
3.8%
12.5%
0.0%
2.0%
4.0%
6.0%
8.0%
10.0%
12.0%
14.0%
Corporate
Banking
Home Loans
and LAP
Small Business,
PL& Credit
Cards
Agriculture
divisio
n
Busin
ess
Banking
CV/CE
Mar‐16 Mar‐17 Mar‐18
Source: Company, PhillipCapital India Research
Management has guided for a 20%+ loan growth for FY19. We list the key catalysts for loan book growth ahead Corporate banking: Kotak’s corporate loan book CAGR was 23% over the past two years, and as of March 2018, it comprises 31% of total advances. Growth has mainly come from market share gains, as slow corporate credit off‐take in the economy over the past few years provided an opportunity to acquire some of the quality clients from PSU banks. As shown in the chart above, Kotak’s market share in corporate lending has increased to 2.3% as of March 2018 from c.1.5% in March 2016. Kotak’s corporate book is also well diversified with top‐10 sectors contributing only 50% of total book, with loans to banks, CRE, and NBFCs comprising 11%, 7% and 6% of the total Loan book respectively. As shown in the chart below, lending growth over
Page | 16 | PHILLIPCAPITAL INDIA RESEARCH
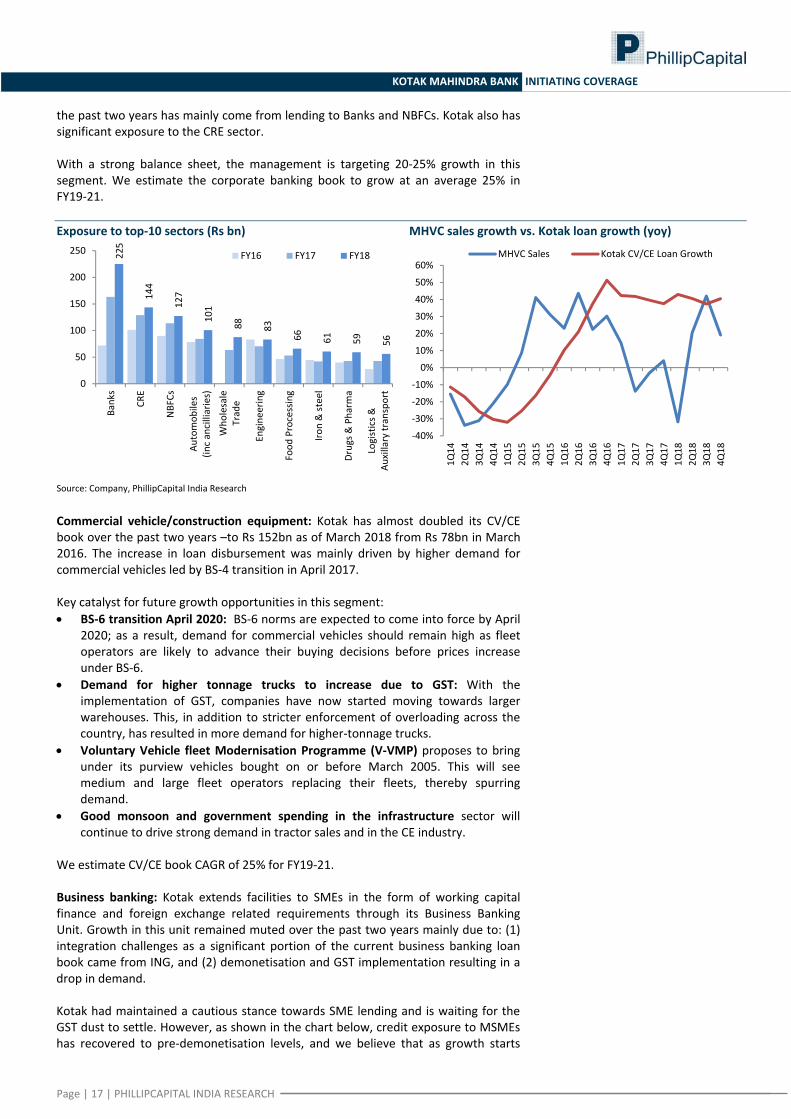
KOTAK MAHINDRA BANK INITIATING COVERAGE
the past two years has mainly come from lending to Banks and NBFCs. Kotak also has significant exposure to the CRE sector. With a strong balance sheet, the management is targeting 20‐25% growth in this segment. We estimate the corporate banking book to grow at an average 25% in FY19‐21. Exposure to top‐10 sectors (Rs bn) MHVC sales growth vs. Kotak loan growth (yoy)
225
144
127
101
88 83
66 61 59 560
50
100
150
200
250
Banks
CRE
NBFCs
Automob
iles
(inc ancilliaries)
Who
lesale
Trade
Engine
ering
Food
Processing
Iron & steel
Drugs &
Pharm
a
Logistics &
Au
xillary transport
FY16 FY17 FY18
‐40%
‐30%
‐20%
‐10%
0%
10%
20%
30%
40%
50%
60%
1Q14
2Q14
3Q14
4Q14
1Q15
2Q15
3Q15
4Q15
1Q16
2Q16
3Q16
4Q16
1Q17
2Q17
3Q17
4Q17
1Q18
2Q18
3Q18
4Q18
MHVC Sales Kotak CV/CE Loan Growth
Source: Company, PhillipCapital India Research
Commercial vehicle/construction equipment: Kotak has almost doubled its CV/CE book over the past two years –to Rs 152bn as of March 2018 from Rs 78bn in March 2016. The increase in loan disbursement was mainly driven by higher demand for commercial vehicles led by BS‐4 transition in April 2017. Key catalyst for future growth opportunities in this segment: • BS‐6 transition April 2020: BS‐6 norms are expected to come into force by April
2020; as a result, demand for commercial vehicles should remain high as fleet operators are likely to advance their buying decisions before prices increase under BS‐6.
• Demand for higher tonnage trucks to increase due to GST: With the implementation of GST, companies have now started moving towards larger warehouses. This, in addition to stricter enforcement of overloading across the country, has resulted in more demand for higher‐tonnage trucks.
• Voluntary Vehicle fleet Modernisation Programme (V‐VMP) proposes to bring under its purview vehicles bought on or before March 2005. This will see medium and large fleet operators replacing their fleets, thereby spurring demand.
• Good monsoon and government spending in the infrastructure sector will continue to drive strong demand in tractor sales and in the CE industry.
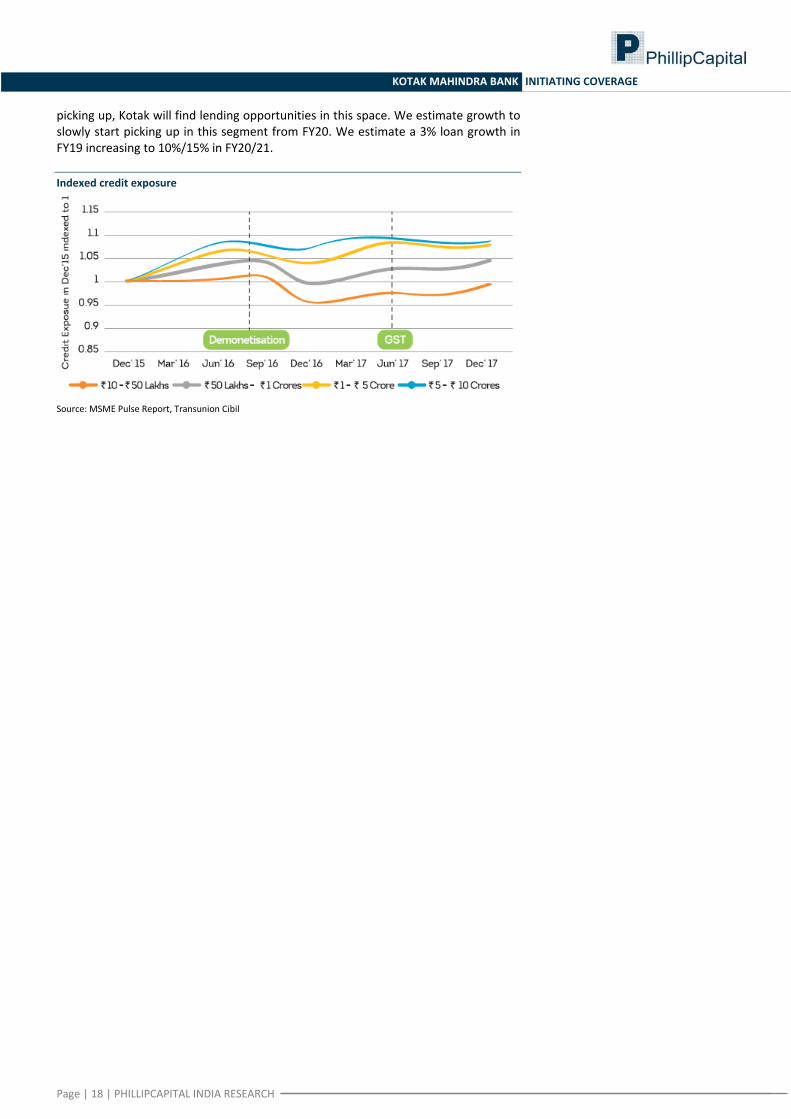
We estimate CV/CE book CAGR of 25% for FY19‐21. Business banking: Kotak extends facilities to SMEs in the form of working capital finance and foreign exchange related requirements through its Business Banking Unit. Growth in this unit remained muted over the past two years mainly due to: (1) integration challenges as a significant portion of the current business banking loan book came from ING, and (2) demonetisation and GST implementation resulting in a drop in demand. Kotak had maintained a cautious stance towards SME lending and is waiting for the GST dust to settle. However, as shown in the chart below, credit exposure to MSMEs has recovered to pre‐demonetisation levels, and we believe that as growth starts
Page | 17 | PHILLIPCAPITAL INDIA RESEARCH
KOTAK MAHINDRA BANK INITIATING COVERAGE
picking up, Kotak will find lending opportunities in this space. We estimate growth to slowly start picking up in this segment from FY20. We estimate a 3% loan growth in FY19 increasing to 10%/15% in FY20/21.
Indexed credit exposure
Source: MSME Pulse Report, Transunion Cibil
Page | 18 | PHILLIPCAPITAL INDIA RESEARCH
KOTAK MAHINDRA BANK INITIATING COVERAGE
NIM to turn around from here NIM will return to pre‐merger levels because of rising yield, loan mix changing towards high‐yield assets, good loan and deposit growth, and lower deposit costs
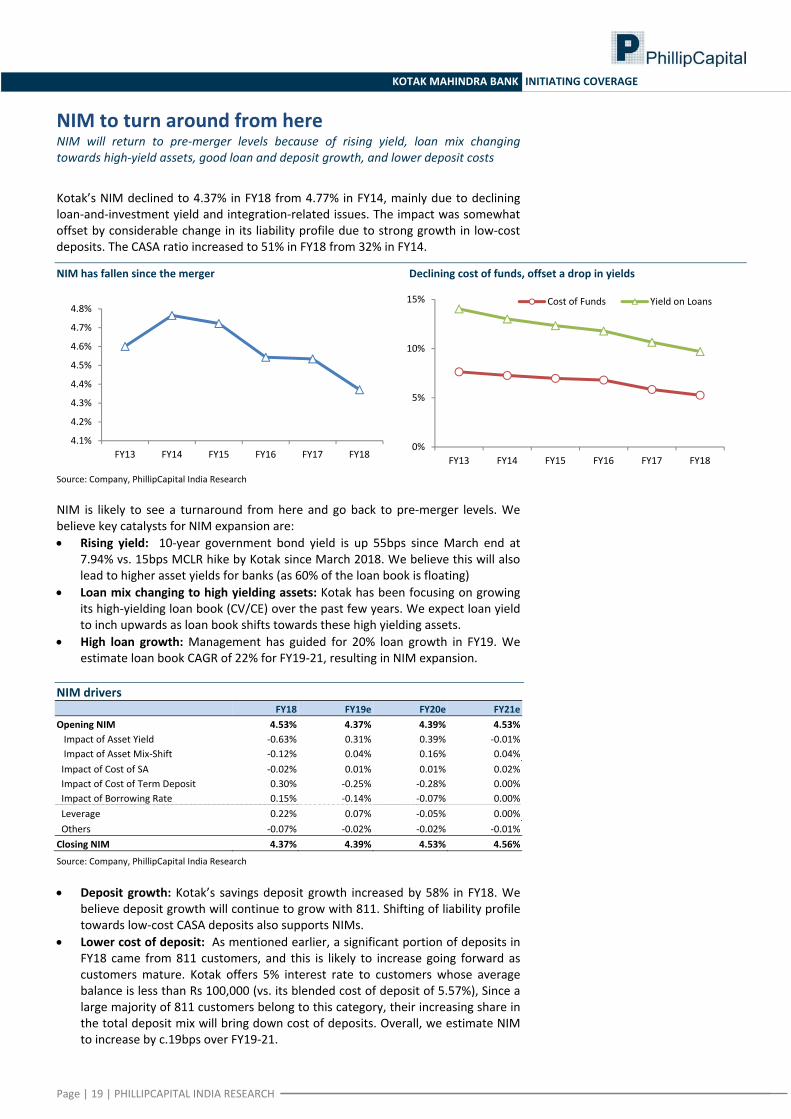
Kotak’s NIM declined to 4.37% in FY18 from 4.77% in FY14, mainly due to declining loan‐and‐investment yield and integration‐related issues. The impact was somewhat offset by considerable change in its liability profile due to strong growth in low‐cost deposits. The CASA ratio increased to 51% in FY18 from 32% in FY14.
NIM has fallen since the merger Declining cost of funds, offset a drop in yields
4.1%
4.2%
4.3%
4.4%
4.5%
4.6%
4.7%
4.8%
FY13 FY14 FY15 FY16 FY17 FY180%
5%
10%
15%
FY13 FY14 FY15 FY16 FY17 FY18
Cost of Funds Yield on Loans
Source: Company, PhillipCapital India Research NIM is likely to see a turnaround from here and go back to pre‐merger levels. We believe key catalysts for NIM expansion are: • Rising yield: 10‐year government bond yield is up 55bps since March end at
7.94% vs. 15bps MCLR hike by Kotak since March 2018. We believe this will also lead to higher asset yields for banks (as 60% of the loan book is floating)
• Loan mix changing to high yielding assets: Kotak has been focusing on growing its high‐yielding loan book (CV/CE) over the past few years. We expect loan yield to inch upwards as loan book shifts towards these high yielding assets.
• High loan growth: Management has guided for 20% loan growth in FY19. We estimate loan book CAGR of 22% for FY19‐21, resulting in NIM expansion.
NIM drivers FY18 FY19e FY20e FY21eOpening NIM 4.53% 4.37% 4.39% 4.53% Impact of Asset Yield ‐0.63% 0.31% 0.39% ‐0.01% Impact of Asset Mix‐Shift ‐0.12% 0.04% 0.16% 0.04% Impact of Cost of SA ‐0.02% 0.01% 0.01% 0.02% Impact of Cost of Term Deposit 0.30% ‐0.25% ‐0.28% 0.00% Impact of Borrowing Rate 0.15% ‐0.14% ‐0.07% 0.00% Leverage 0.22% 0.07% ‐0.05% 0.00% Others ‐0.07% ‐0.02% ‐0.02% ‐0.01%Closing NIM 4.37% 4.39% 4.53% 4.56%
Source: Company, PhillipCapital India Research
• Deposit growth: Kotak’s savings deposit growth increased by 58% in FY18. We believe deposit growth will continue to grow with 811. Shifting of liability profile towards low‐cost CASA deposits also supports NIMs.
• Lower cost of deposit: As mentioned earlier, a significant portion of deposits in FY18 came from 811 customers, and this is likely to increase going forward as customers mature. Kotak offers 5% interest rate to customers whose average balance is less than Rs 100,000 (vs. its blended cost of deposit of 5.57%), Since a large majority of 811 customers belong to this category, their increasing share in the total deposit mix will bring down cost of deposits. Overall, we estimate NIM to increase by c.19bps over FY19‐21.
Page | 19 | PHILLIPCAPITAL INDIA RESEARCH
KOTAK MAHINDRA BANK INITIATING COVERAGE
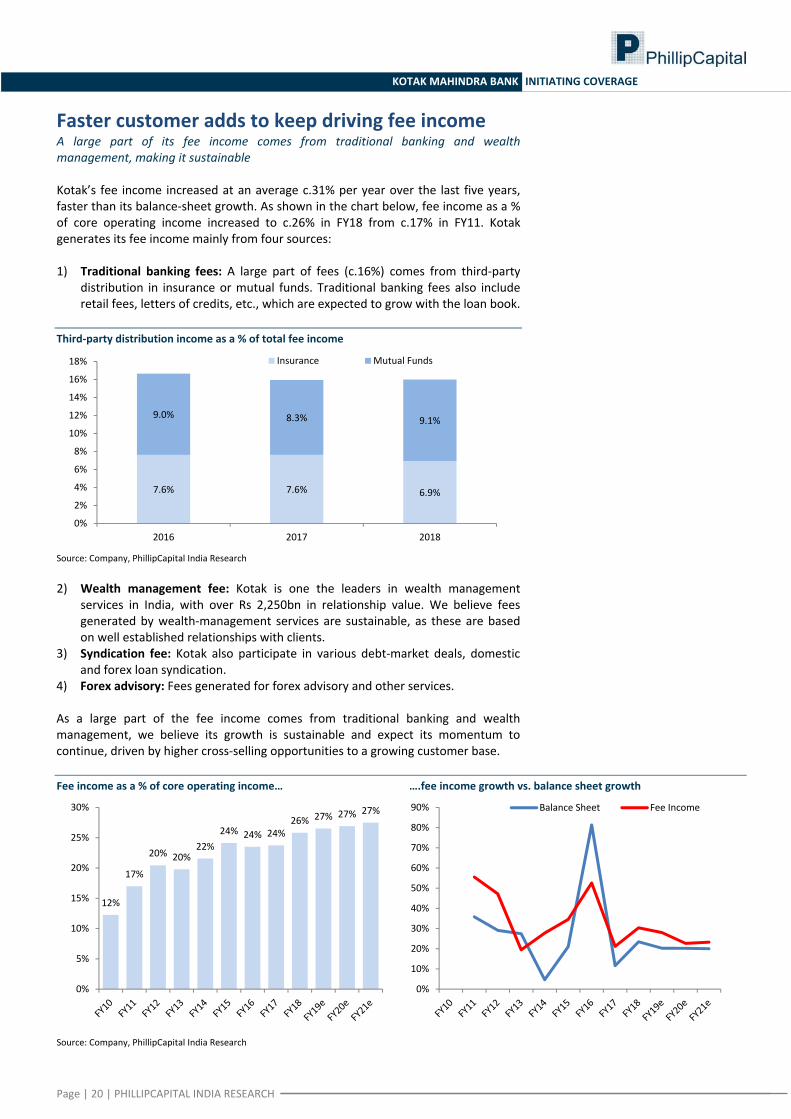
Faster customer adds to keep driving fee income A large part of its fee income comes from traditional banking and wealth management, making it sustainable Kotak’s fee income increased at an average c.31% per year over the last five years, faster than its balance‐sheet growth. As shown in the chart below, fee income as a % of core operating income increased to c.26% in FY18 from c.17% in FY11. Kotak generates its fee income mainly from four sources: 1) Traditional banking fees: A large part of fees (c.16%) comes from third‐party
distribution in insurance or mutual funds. Traditional banking fees also include retail fees, letters of credits, etc., which are expected to grow with the loan book.
Third‐party distribution income as a % of total fee income
7.6% 7.6% 6.9%
9.0% 8.3% 9.1%
0%
2%
4%
6%
8%
10%
12%
14%
16%
18%
2016 2017 2018
Insurance Mutual Funds
Source: Company, PhillipCapital India Research
2) Wealth management fee: Kotak is one the leaders in wealth management
services in India, with over Rs 2,250bn in relationship value. We believe fees generated by wealth‐management services are sustainable, as these are based on well established relationships with clients.
3) Syndication fee: Kotak also participate in various debt‐market deals, domestic and forex loan syndication.
4) Forex advisory: Fees generated for forex advisory and other services.
As a large part of the fee income comes from traditional banking and wealth management, we believe its growth is sustainable and expect its momentum to continue, driven by higher cross‐selling opportunities to a growing customer base. Fee income as a % of core operating income… ….fee income growth vs. balance sheet growth
12%
17%
20% 20%22%
24% 24% 24%26% 27% 27% 27%
0%
5%
10%
15%
20%
25%
30%
0%
10%
20%
30%
40%
50%
60%
70%
80%
90% Balance Sheet Fee Income
Source: Company, PhillipCapital India Research
Page | 20 | PHILLIPCAPITAL INDIA RESEARCH
KOTAK MAHINDRA BANK INITIATING COVERAGE
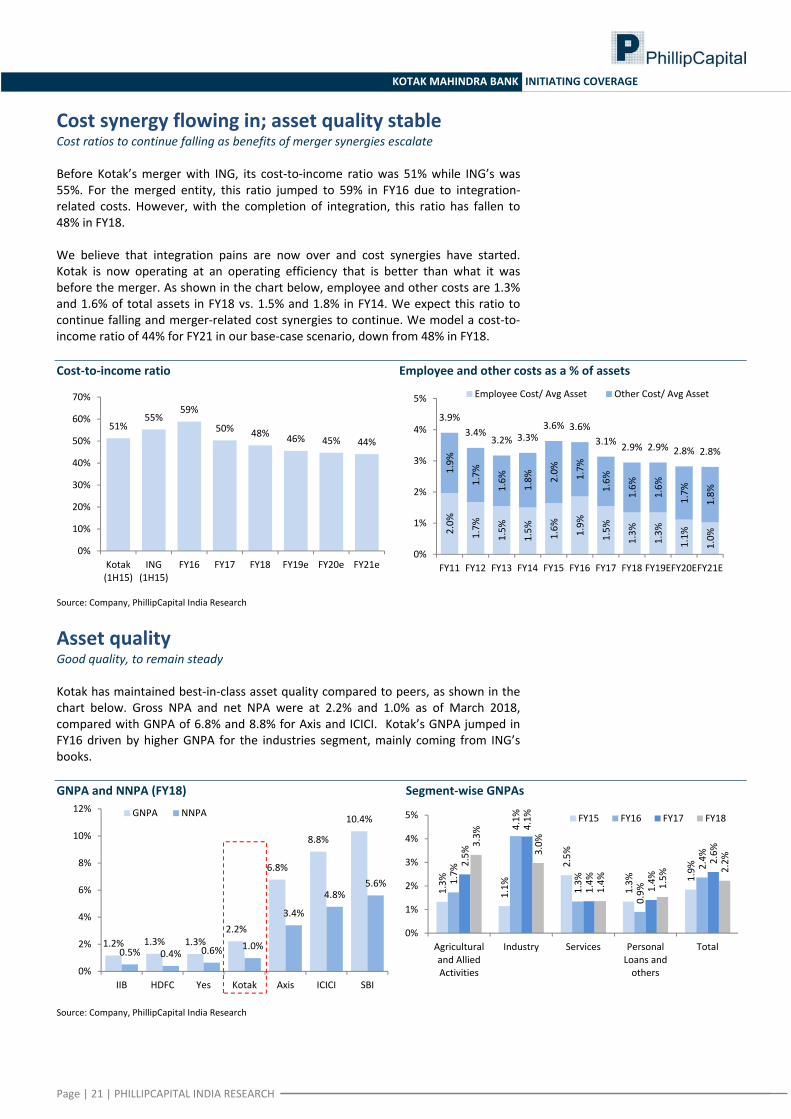
Cost synergy flowing in; asset quality stable Cost ratios to continue falling as benefits of merger synergies escalate Before Kotak’s merger with ING, its cost‐to‐income ratio was 51% while ING’s was 55%. For the merged entity, this ratio jumped to 59% in FY16 due to integration‐related costs. However, with the completion of integration, this ratio has fallen to 48% in FY18. We believe that integration pains are now over and cost synergies have started. Kotak is now operating at an operating efficiency that is better than what it was before the merger. As shown in the chart below, employee and other costs are 1.3% and 1.6% of total assets in FY18 vs. 1.5% and 1.8% in FY14. We expect this ratio to continue falling and merger‐related cost synergies to continue. We model a cost‐to‐income ratio of 44% for FY21 in our base‐case scenario, down from 48% in FY18. Cost‐to‐income ratio Employee and other costs as a % of assets
51%55%
59%
50% 48% 46% 45% 44%
0%
10%
20%
30%
40%
50%
60%
70%
Kotak (1H15)
ING(1H15)
FY16 FY17 FY18 FY19e FY20e FY21e
2.0%
1.7%
1.5%
1.5% 1.6% 1.9%
1.5%
1.3%
1.3%
1.1%
1.0%
1.9%
1.7%
1.6%
1.8% 2.0% 1.7%
1.6%
1.6%
1.6%
1.7%
1.8%
3.9%3.4%
3.2% 3.3%3.6% 3.6%
3.1% 2.9% 2.9% 2.8% 2.8%
0%
1%
2%
3%
4%
5%
FY11 FY12 FY13 FY14 FY15 FY16 FY17 FY18 FY19EFY20EFY21E
Employee Cost/ Avg Asset Other Cost/ Avg Asset
Source: Company, PhillipCapital India Research
Asset quality Good quality, to remain steady Kotak has maintained best‐in‐class asset quality compared to peers, as shown in the chart below. Gross NPA and net NPA were at 2.2% and 1.0% as of March 2018, compared with GNPA of 6.8% and 8.8% for Axis and ICICI. Kotak’s GNPA jumped in FY16 driven by higher GNPA for the industries segment, mainly coming from ING’s books.
GNPA and NNPA (FY18) Segment‐wise GNPAs
1.2% 1.3% 1.3%2.2%
6.8%
8.8%
10.4%
0.5% 0.4% 0.6% 1.0%
3.4%
4.8%5.6%
0%
2%
4%
6%
8%
10%
12%
IIB HDFC Yes Kotak Axis ICICI SBI
GNPA NNPA
1.3%
1.1%
2.5%
1.3% 1.
9%
1.7%
4.1%
1.3%
0.9%
2.4%2.5%
4.1%
1.4%
1.4%
2.6%
3.3%
3.0%
1.4% 1.5%
2.2%
0%
1%
2%
3%
4%
5%
Agricultural and Allied Activities
Industry Services Personal Loans and others
Total
FY15 FY16 FY17 FY18
Source: Company, PhillipCapital India Research
Page | 21 | PHILLIPCAPITAL INDIA RESEARCH
KOTAK MAHINDRA BANK INITIATING COVERAGE
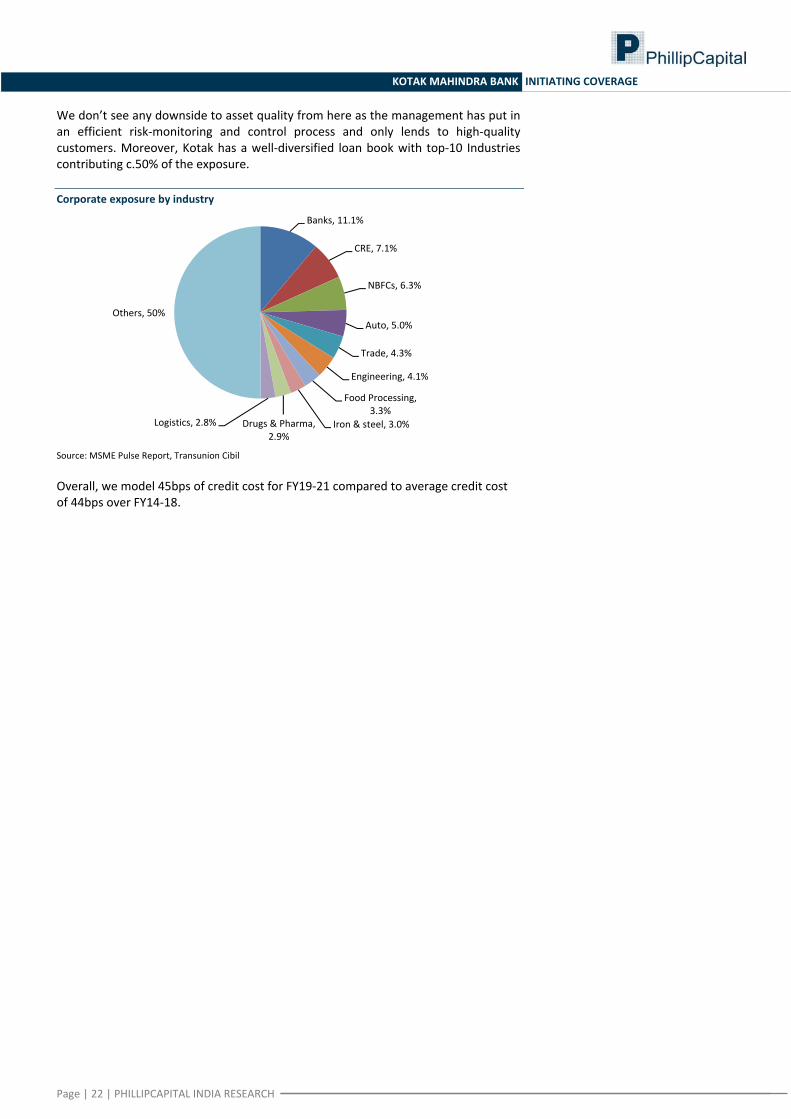
We don’t see any downside to asset quality from here as the management has put in an efficient risk‐monitoring and control process and only lends to high‐quality customers. Moreover, Kotak has a well‐diversified loan book with top‐10 Industries contributing c.50% of the exposure.
Corporate exposure by industry
Banks, 11.1%
CRE, 7.1%
NBFCs, 6.3%
Auto, 5.0%
Trade, 4.3%
Engineering, 4.1%
Food Processing, 3.3%
Iron & steel, 3.0%Drugs & Pharma, 2.9%
Logistics, 2.8%
Others, 50%
Source: MSME Pulse Report, Transunion Cibil Overall, we model 45bps of credit cost for FY19‐21 compared to average credit cost of 44bps over FY14‐18.
Page | 22 | PHILLIPCAPITAL INDIA RESEARCH
KOTAK MAHINDRA BANK INITIATING COVERAGE
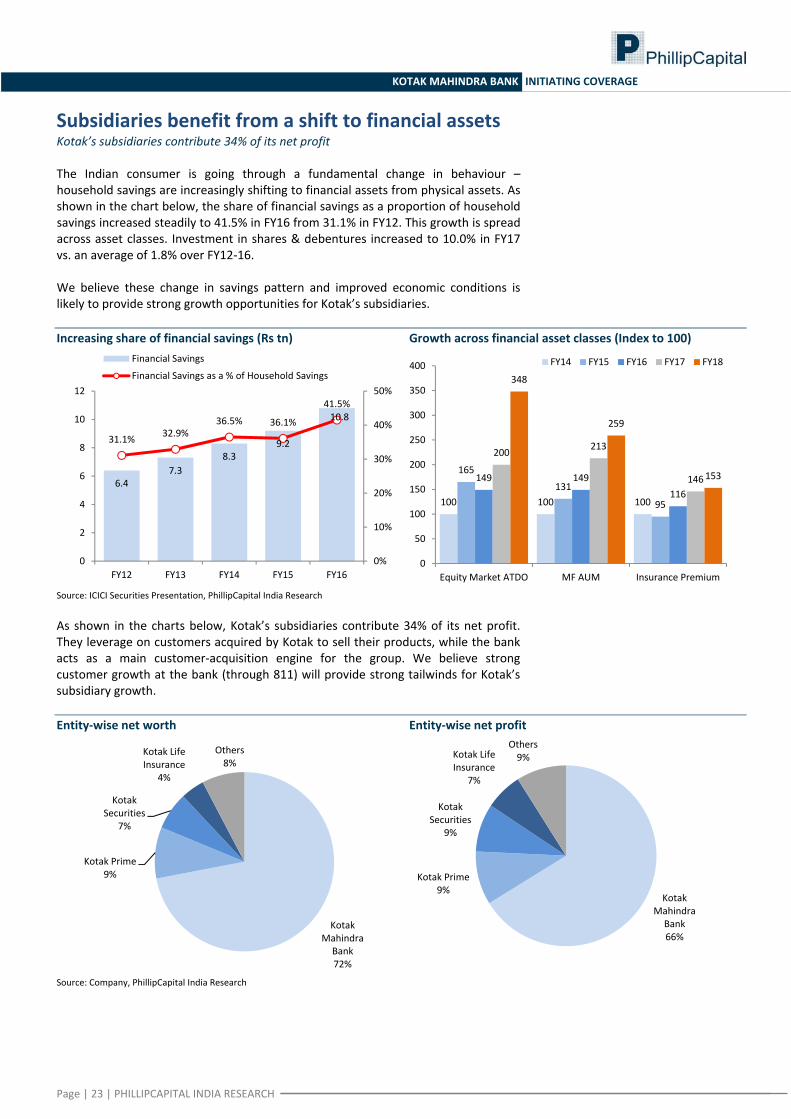
Subsidiaries benefit from a shift to financial assets Kotak’s subsidiaries contribute 34% of its net profit The Indian consumer is going through a fundamental change in behaviour – household savings are increasingly shifting to financial assets from physical assets. As shown in the chart below, the share of financial savings as a proportion of household savings increased steadily to 41.5% in FY16 from 31.1% in FY12. This growth is spread across asset classes. Investment in shares & debentures increased to 10.0% in FY17 vs. an average of 1.8% over FY12‐16. We believe these change in savings pattern and improved economic conditions is likely to provide strong growth opportunities for Kotak’s subsidiaries. Increasing share of financial savings (Rs tn) Growth across financial asset classes (Index to 100)
6.47.3
8.39.2
10.8
31.1% 32.9%36.5% 36.1%
41.5%
0%
10%
20%
30%
40%
50%
0
2
4
6
8
10
12
FY12 FY13 FY14 FY15 FY16
Financial Savings
Financial Savings as a % of Household Savings
100 100 100
165
131
95
149 149116
200 213
146
348
259
153
0
50
100
150
200
250
300
350
400
Equity Market ATDO MF AUM Insurance Premium
FY14 FY15 FY16 FY17 FY18
Source: ICICI Securities Presentation, PhillipCapital India Research
As shown in the charts below, Kotak’s subsidiaries contribute 34% of its net profit. They leverage on customers acquired by Kotak to sell their products, while the bank acts as a main customer‐acquisition engine for the group. We believe strong customer growth at the bank (through 811) will provide strong tailwinds for Kotak’s subsidiary growth. Entity‐wise net worth Entity‐wise net profit
Kotak Mahindra Bank72%
Kotak Prime9%
Kotak Securities
7%
Kotak Life Insurance
4%
Others8%
Kotak Mahindra Bank66%
Kotak Prime9%
Kotak Securities
9%
Kotak Life Insurance
7%
Others9%
Source: Company, PhillipCapital India Research
Page | 23 | PHILLIPCAPITAL INDIA RESEARCH
KOTAK MAHINDRA BANK INITIATING COVERAGE
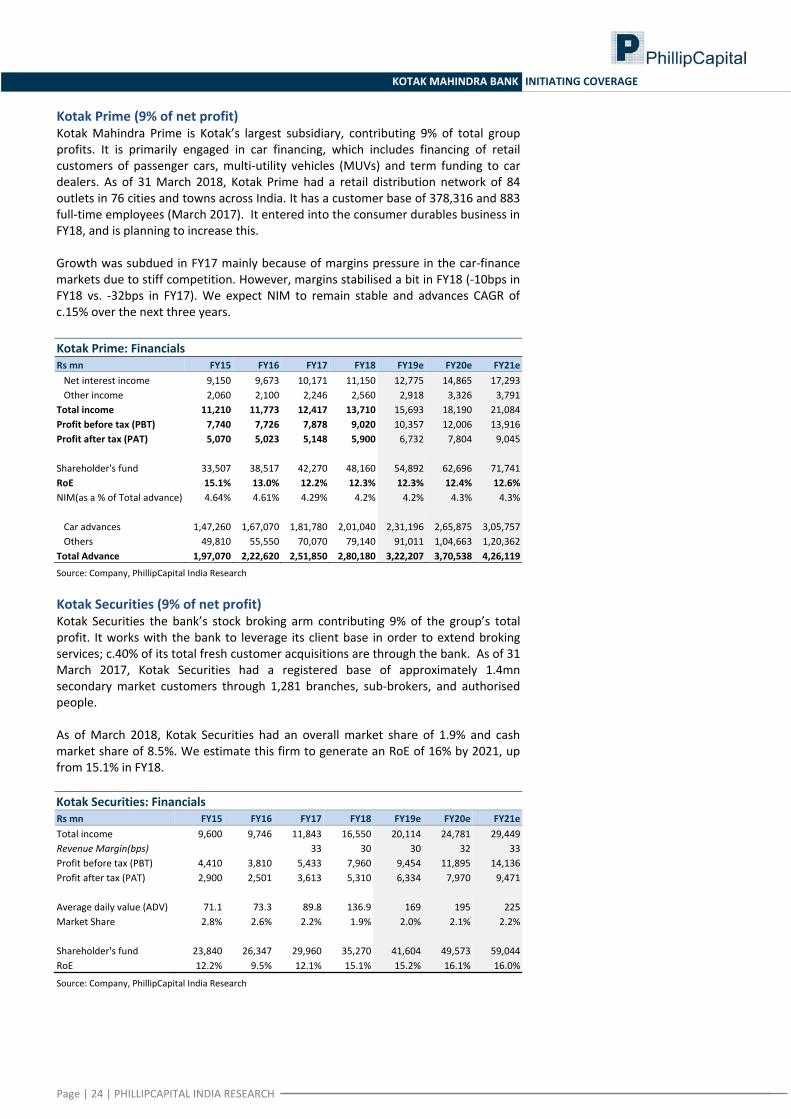
Kotak Prime (9% of net profit) Kotak Mahindra Prime is Kotak’s largest subsidiary, contributing 9% of total group profits. It is primarily engaged in car financing, which includes financing of retail customers of passenger cars, multi‐utility vehicles (MUVs) and term funding to car dealers. As of 31 March 2018, Kotak Prime had a retail distribution network of 84 outlets in 76 cities and towns across India. It has a customer base of 378,316 and 883 full‐time employees (March 2017). It entered into the consumer durables business in FY18, and is planning to increase this. Growth was subdued in FY17 mainly because of margins pressure in the car‐finance markets due to stiff competition. However, margins stabilised a bit in FY18 (‐10bps in FY18 vs. ‐32bps in FY17). We expect NIM to remain stable and advances CAGR of c.15% over the next three years. Kotak Prime: Financials Rs mn FY15 FY16 FY17 FY18 FY19e FY20e FY21e Net interest income 9,150 9,673 10,171 11,150 12,775 14,865 17,293 Other income 2,060 2,100 2,246 2,560 2,918 3,326 3,791Total income 11,210 11,773 12,417 13,710 15,693 18,190 21,084Profit before tax (PBT) 7,740 7,726 7,878 9,020 10,357 12,006 13,916Profit after tax (PAT) 5,070 5,023 5,148 5,900 6,732 7,804 9,045
Shareholder's fund 33,507 38,517 42,270 48,160 54,892 62,696 71,741RoE 15.1% 13.0% 12.2% 12.3% 12.3% 12.4% 12.6%NIM(as a % of Total advance) 4.64% 4.61% 4.29% 4.2% 4.2% 4.3% 4.3%
Car advances 1,47,260 1,67,070 1,81,780 2,01,040 2,31,196 2,65,875 3,05,757 Others 49,810 55,550 70,070 79,140 91,011 1,04,663 1,20,362Total Advance 1,97,070 2,22,620 2,51,850 2,80,180 3,22,207 3,70,538 4,26,119
Source: Company, PhillipCapital India Research Kotak Securities (9% of net profit) Kotak Securities the bank’s stock broking arm contributing 9% of the group’s total profit. It works with the bank to leverage its client base in order to extend broking services; c.40% of its total fresh customer acquisitions are through the bank. As of 31 March 2017, Kotak Securities had a registered base of approximately 1.4mn secondary market customers through 1,281 branches, sub‐brokers, and authorised people. As of March 2018, Kotak Securities had an overall market share of 1.9% and cash market share of 8.5%. We estimate this firm to generate an RoE of 16% by 2021, up from 15.1% in FY18. Kotak Securities: Financials Rs mn FY15 FY16 FY17 FY18 FY19e FY20e FY21eTotal income 9,600 9,746 11,843 16,550 20,114 24,781 29,449Revenue Margin(bps) 33 30 30 32 33Profit before tax (PBT) 4,410 3,810 5,433 7,960 9,454 11,895 14,136Profit after tax (PAT) 2,900 2,501 3,613 5,310 6,334 7,970 9,471
Average daily value (ADV) 71.1 73.3 89.8 136.9 169 195 225Market Share 2.8% 2.6% 2.2% 1.9% 2.0% 2.1% 2.2%
Shareholder's fund 23,840 26,347 29,960 35,270 41,604 49,573 59,044RoE 12.2% 9.5% 12.1% 15.1% 15.2% 16.1% 16.0%
Source: Company, PhillipCapital India Research
Page | 24 | PHILLIPCAPITAL INDIA RESEARCH
KOTAK MAHINDRA BANK INITIATING COVERAGE
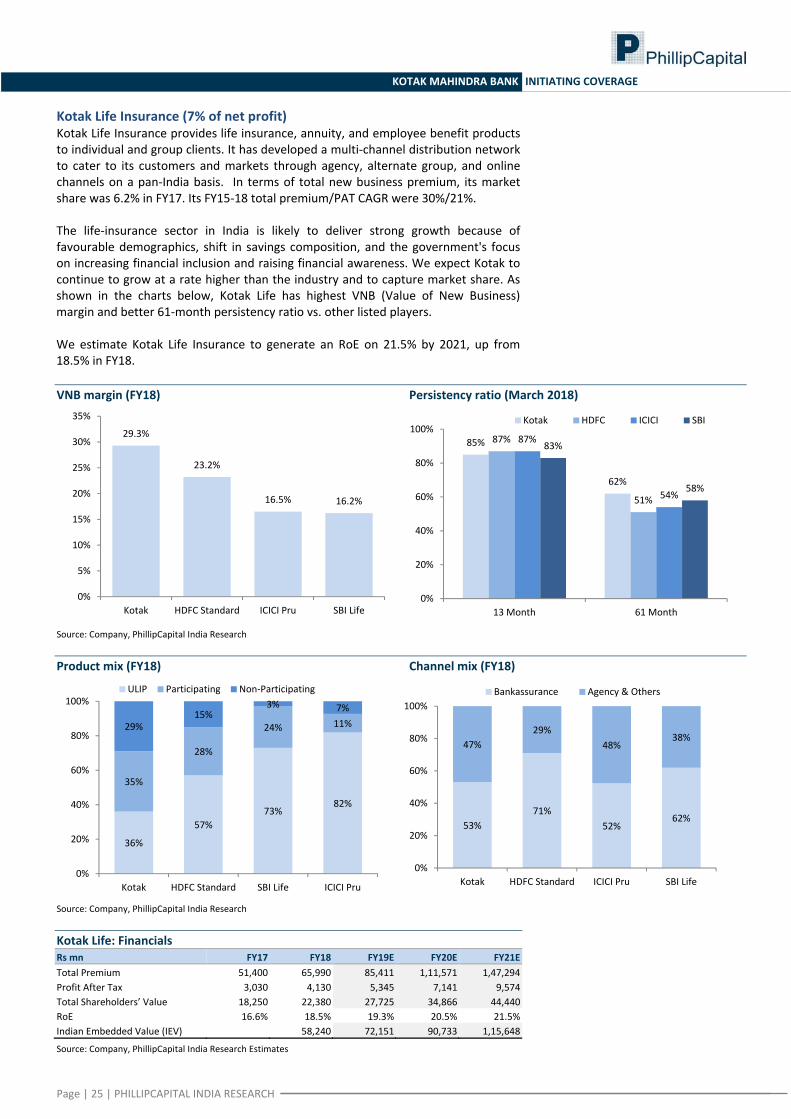
Kotak Life Insurance (7% of net profit) Kotak Life Insurance provides life insurance, annuity, and employee benefit products to individual and group clients. It has developed a multi‐channel distribution network to cater to its customers and markets through agency, alternate group, and online channels on a pan‐India basis. In terms of total new business premium, its market share was 6.2% in FY17. Its FY15‐18 total premium/PAT CAGR were 30%/21%. The life‐insurance sector in India is likely to deliver strong growth because of favourable demographics, shift in savings composition, and the government's focus on increasing financial inclusion and raising financial awareness. We expect Kotak to continue to grow at a rate higher than the industry and to capture market share. As shown in the charts below, Kotak Life has highest VNB (Value of New Business) margin and better 61‐month persistency ratio vs. other listed players. We estimate Kotak Life Insurance to generate an RoE on 21.5% by 2021, up from 18.5% in FY18. VNB margin (FY18) Persistency ratio (March 2018)
29.3%
23.2%
16.5% 16.2%
0%
5%
10%
15%
20%
25%
30%
35%
Kotak HDFC Standard ICICI Pru SBI Life
85%
62%
87%
51%
87%
54%
83%
58%
0%
20%
40%
60%
80%
100%
13 Month 61 Month
Kotak HDFC ICICI SBI
Source: Company, PhillipCapital India Research Product mix (FY18) Channel mix (FY18)
36%
57%73%
82%
35%
28%
24% 11%29%15%
3% 7%
0%
20%
40%
60%
80%
100%
Kotak HDFC Standard SBI Life ICICI Pru
ULIP Participating Non‐Participating
53%71%
52%62%
47%29%
48%38%
0%
20%
40%
60%
80%
100%
Kotak HDFC Standard ICICI Pru SBI Life
Bankassurance Agency & Others
Source: Company, PhillipCapital India Research Kotak Life: Financials Rs mn FY17 FY18 FY19E FY20E FY21ETotal Premium 51,400 65,990 85,411 1,11,571 1,47,294Profit After Tax 3,030 4,130 5,345 7,141 9,574 Total Shareholders’ Value 18,250 22,380 27,725 34,866 44,440 RoE 16.6% 18.5% 19.3% 20.5% 21.5%Indian Embedded Value (IEV) 58,240 72,151 90,733 1,15,648
Source: Company, PhillipCapital India Research Estimates
Page | 25 | PHILLIPCAPITAL INDIA RESEARCH
KOTAK MAHINDRA BANK INITIATING COVERAGE
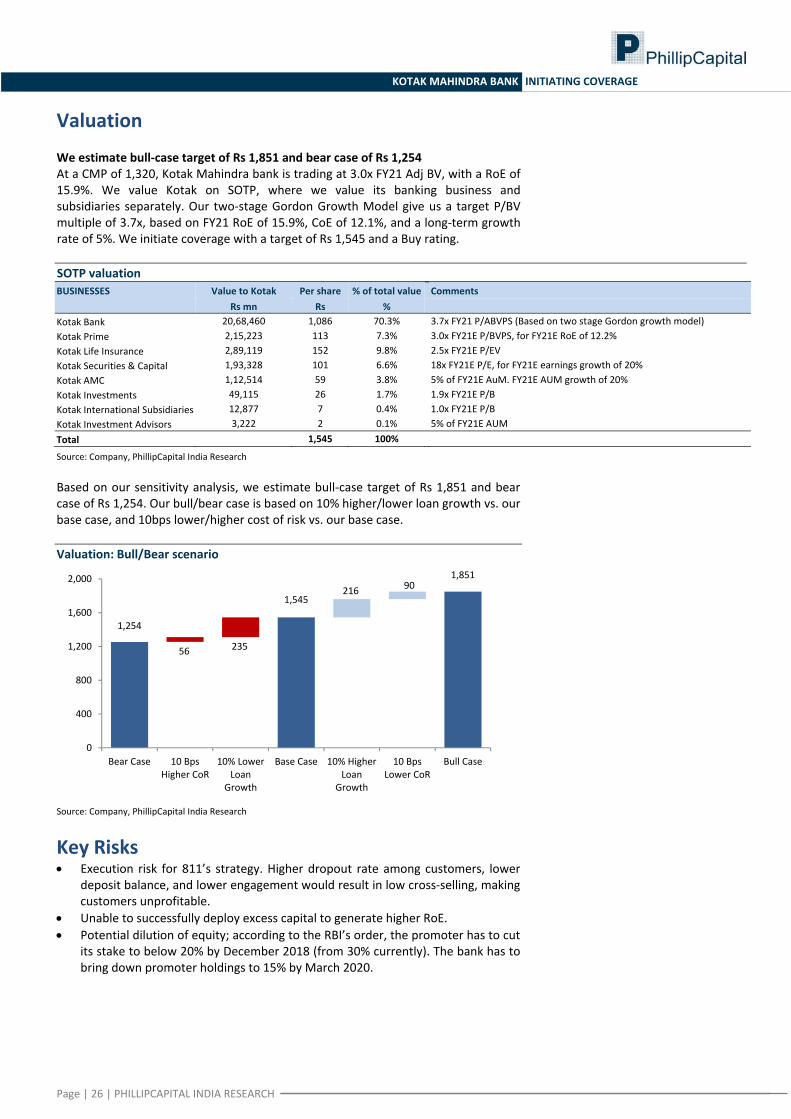
Valuation We estimate bull‐case target of Rs 1,851 and bear case of Rs 1,254 At a CMP of 1,320, Kotak Mahindra bank is trading at 3.0x FY21 Adj BV, with a RoE of 15.9%. We value Kotak on SOTP, where we value its banking business and subsidiaries separately. Our two‐stage Gordon Growth Model give us a target P/BV multiple of 3.7x, based on FY21 RoE of 15.9%, CoE of 12.1%, and a long‐term growth rate of 5%. We initiate coverage with a target of Rs 1,545 and a Buy rating. SOTP valuation BUSINESSES Value to Kotak Per share % of total value Comments Rs mn Rs % Kotak Bank 20,68,460 1,086 70.3% 3.7x FY21 P/ABVPS (Based on two stage Gordon growth model) Kotak Prime 2,15,223 113 7.3% 3.0x FY21E P/BVPS, for FY21E RoE of 12.2% Kotak Life Insurance 2,89,119 152 9.8% 2.5x FY21E P/EV Kotak Securities & Capital 1,93,328 101 6.6% 18x FY21E P/E, for FY21E earnings growth of 20% Kotak AMC 1,12,514 59 3.8% 5% of FY21E AuM. FY21E AUM growth of 20% Kotak Investments 49,115 26 1.7% 1.9x FY21E P/B Kotak International Subsidiaries 12,877 7 0.4% 1.0x FY21E P/B Kotak Investment Advisors 3,222 2 0.1% 5% of FY21E AUM Total 1,545 100%
Source: Company, PhillipCapital India Research Based on our sensitivity analysis, we estimate bull‐case target of Rs 1,851 and bear case of Rs 1,254. Our bull/bear case is based on 10% higher/lower loan growth vs. our base case, and 10bps lower/higher cost of risk vs. our base case. Valuation: Bull/Bear scenario
1,254
1,545
1,851
56 235
216 90
0
400
800
1,200
1,600
2,000
Bear Case 10 Bps Higher CoR
10% Lower Loan
Growth
Base Case 10% Higher Loan
Growth
10 Bps Lower CoR
Bull Case
Source: Company, PhillipCapital India Research
Key Risks • Execution risk for 811’s strategy. Higher dropout rate among customers, lower
deposit balance, and lower engagement would result in low cross‐selling, making customers unprofitable.
• Unable to successfully deploy excess capital to generate higher RoE. • Potential dilution of equity; according to the RBI’s order, the promoter has to cut
its stake to below 20% by December 2018 (from 30% currently). The bank has to bring down promoter holdings to 15% by March 2020.
Page | 26 | PHILLIPCAPITAL INDIA RESEARCH
KOTAK MAHINDRA BANK INITIATING COVERAGE
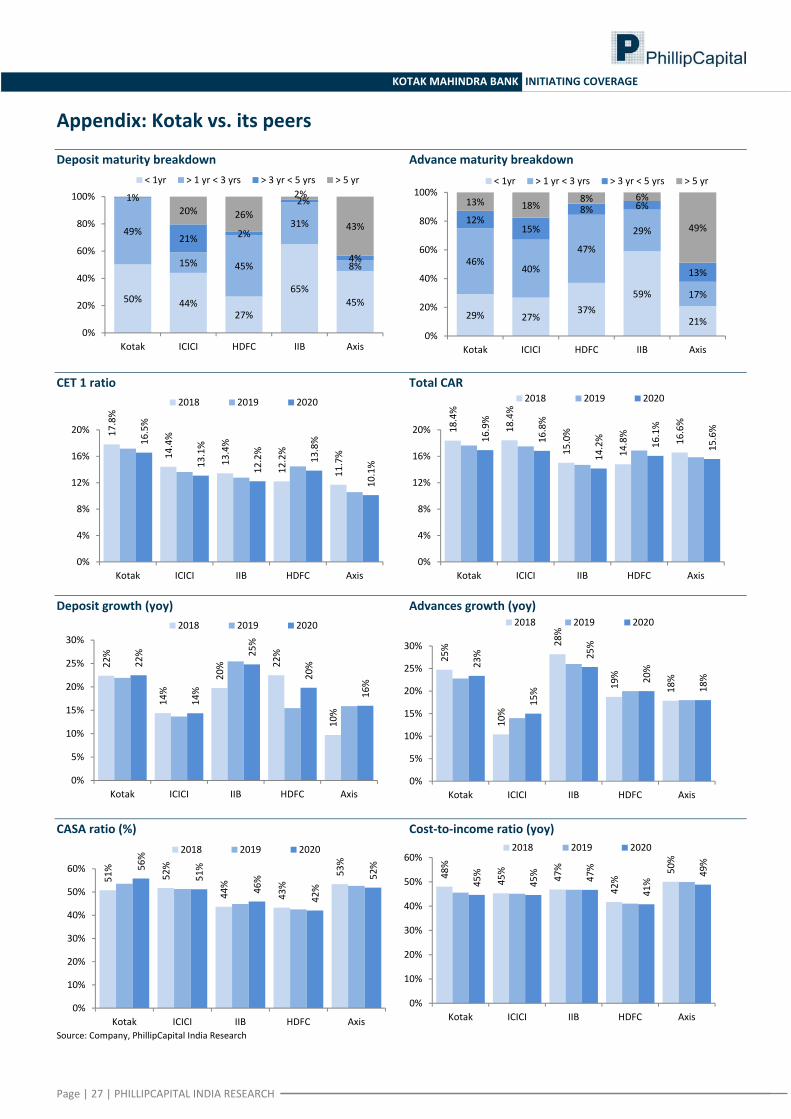
Appendix: Kotak vs. its peers Deposit maturity breakdown Advance maturity breakdown
50% 44%27%
65%45%
49%
15% 45%
31%
8%
1%
21% 2%
2%
4%
20% 26%2%
43%
0%
20%
40%
60%
80%
100%
Kotak ICICI HDFC IIB Axis
< 1yr > 1 yr < 3 yrs > 3 yr < 5 yrs > 5 yr
29% 27%37%
59%
21%
46%40%
47%
29%
17%
12%15%
8% 6%
13%
13% 18%8% 6%
49%
0%
20%
40%
60%
80%
100%
Kotak ICICI HDFC IIB Axis
< 1yr > 1 yr < 3 yrs > 3 yr < 5 yrs > 5 yr
CET 1 ratio Total CAR
17.8%
14.4%
13.4%
12.2%
11.7%
16.5%
13.1%
12.2%
13.8%
10.1%
0%
4%
8%
12%
16%
20%
Kotak ICICI IIB HDFC Axis
2018 2019 2020
18.4%
18.4%
15.0%
14.8%
16.6%
16.9%
16.8%
14.2% 16.1%
15.6%
0%
4%
8%
12%
16%
20%
Kotak ICICI IIB HDFC Axis
2018 2019 2020
Deposit growth (yoy) Advances growth (yoy)
22%
14%
20% 22
%
10%
22%
14%
25%
20%
16%
0%
5%
10%
15%
20%
25%
30%
Kotak ICICI IIB HDFC Axis
2018 2019 2020
25%
10%
28%
19%
18%
23%
15%
25%
20%
18%
0%
5%
10%
15%
20%
25%
30%
Kotak ICICI IIB HDFC Axis
2018 2019 2020
CASA ratio (%) Cost‐to‐income ratio (yoy)
51%
52%
44%
43%
53%56%
51%
46%
42%
52%
0%
10%
20%
30%
40%
50%
60%
Kotak ICICI IIB HDFC Axis
2018 2019 2020
48%
45%
47%
42%
50%
45%
45% 47%
41%
49%
0%
10%
20%
30%
40%
50%
60%
Kotak ICICI IIB HDFC Axis
2018 2019 2020
Source: Company, PhillipCapital India Research
Page | 27 | PHILLIPCAPITAL INDIA RESEARCH
KOTAK MAHINDRA BANK INITIATING COVERAGE
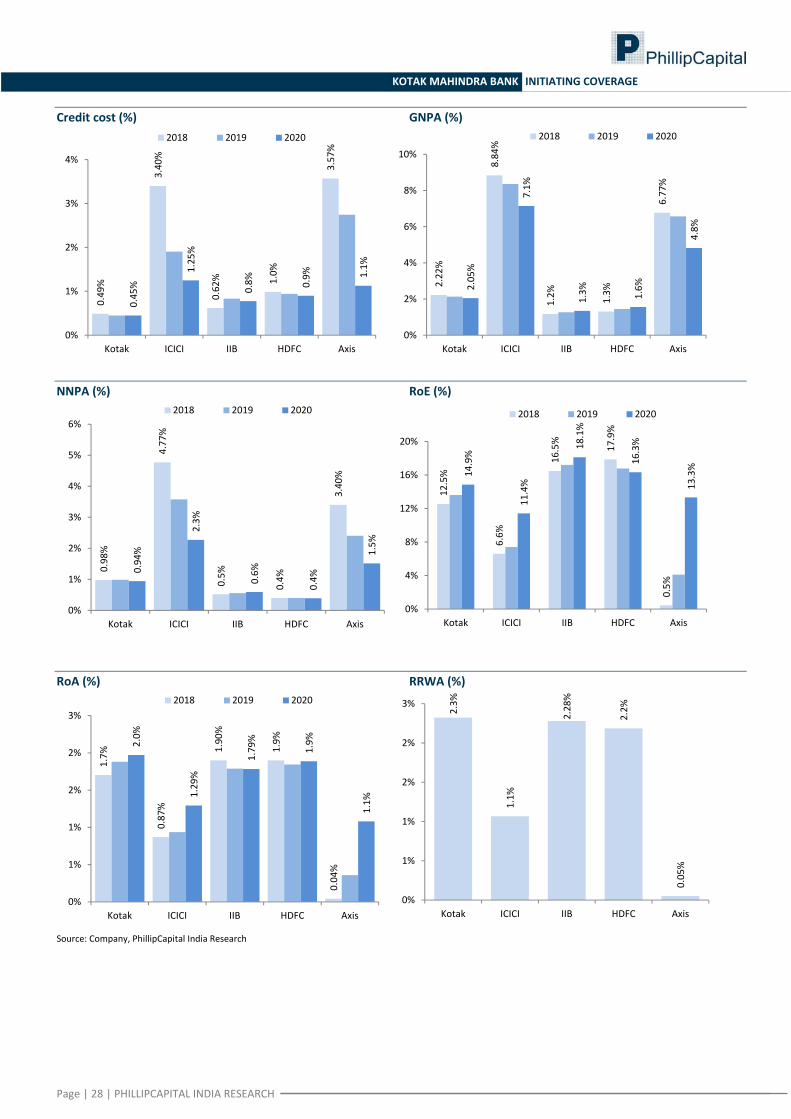
Credit cost (%) GNPA (%)
0.49%
3.40%
0.62% 1.0%
3.57%
0.45%
1.25%
0.8% 0.9% 1.1%
0%
1%
2%
3%
4%
Kotak ICICI IIB HDFC Axis
2018 2019 2020
2.22%
8.84%
1.2% 1.3%
6.77%
2.05%
7.1%
1.3% 1.6%
4.8%
0%
2%
4%
6%
8%
10%
Kotak ICICI IIB HDFC Axis
2018 2019 2020
NNPA (%) RoE (%)
0.98%
4.77%
0.5%
0.4%
3.40%
0.94%
2.3%
0.6%
0.4%
1.5%
0%
1%
2%
3%
4%
5%
6%
Kotak ICICI IIB HDFC Axis
2018 2019 2020
12.5%
6.6%
16.5%
17.9%
0.5%
14.9%
11.4%
18.1%
16.3%
13.3%
0%
4%
8%
12%
16%
20%
Kotak ICICI IIB HDFC Axis
2018 2019 2020
RoA (%) RRWA (%)
1.7%
0.87%
1.90%
1.9%
0.04%
2.0%
1.29%
1.79%
1.9%
1.1%
0%
1%
1%
2%
2%
3%
Kotak ICICI IIB HDFC Axis
2018 2019 2020
2.3%
1.1%
2.28%
2.2%
0.05%
0%
1%
1%
2%
2%
3%
Kotak ICICI IIB HDFC Axis
Source: Company, PhillipCapital India Research
Page | 28 | PHILLIPCAPITAL INDIA RESEARCH
Page | 29 | PHILLIPCAPITAL INDIA RESEARCH
KOTAK MAHINDRA BANK INITIATING COVERAGE
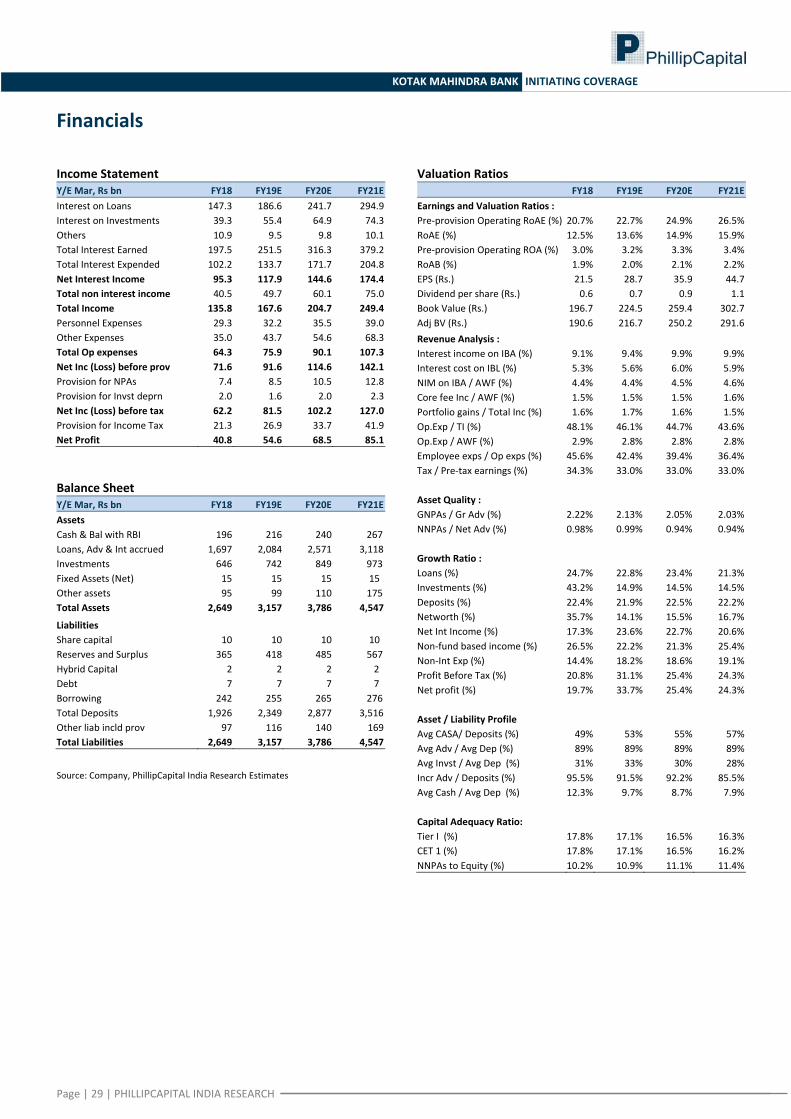
Financials
Income Statement Y/E Mar, Rs bn FY18 FY19E FY20E FY21EInterest on Loans 147.3 186.6 241.7 294.9 Interest on Investments 39.3 55.4 64.9 74.3 Others 10.9 9.5 9.8 10.1 Total Interest Earned 197.5 251.5 316.3 379.2 Total Interest Expended 102.2 133.7 171.7 204.8 Net Interest Income 95.3 117.9 144.6 174.4Total non interest income 40.5 49.7 60.1 75.0 Total Income 135.8 167.6 204.7 249.4Personnel Expenses 29.3 32.2 35.5 39.0 Other Expenses 35.0 43.7 54.6 68.3 Total Op expenses 64.3 75.9 90.1 107.3Net Inc (Loss) before prov 71.6 91.6 114.6 142.1Provision for NPAs 7.4 8.5 10.5 12.8 Provision for Invst deprn 2.0 1.6 2.0 2.3 Net Inc (Loss) before tax 62.2 81.5 102.2 127.0Provision for Income Tax 21.3 26.9 33.7 41.9 Net Profit 40.8 54.6 68.5 85.1 Balance Sheet Y/E Mar, Rs bn FY18 FY19E FY20E FY21EAssets Cash & Bal with RBI 196 216 240 267 Loans, Adv & Int accrued 1,697 2,084 2,571 3,118 Investments 646 742 849 973 Fixed Assets (Net) 15 15 15 15 Other assets 95 99 110 175 Total Assets 2,649 3,157 3,786 4,547
Liabilities Share capital 10 10 10 10 Reserves and Surplus 365 418 485 567 Hybrid Capital 2 2 2 2 Debt 7 7 7 7 Borrowing 242 255 265 276 Total Deposits 1,926 2,349 2,877 3,516 Other liab incld prov 97 116 140 169 Total Liabilities 2,649 3,157 3,786 4,547 Source: Company, PhillipCapital India Research Estimates
Valuation Ratios FY18 FY19E FY20E FY21E
Earnings and Valuation Ratios : Pre‐provision Operating RoAE (%) 20.7% 22.7% 24.9% 26.5%RoAE (%) 12.5% 13.6% 14.9% 15.9%Pre‐provision Operating ROA (%) 3.0% 3.2% 3.3% 3.4%RoAB (%) 1.9% 2.0% 2.1% 2.2%EPS (Rs.) 21.5 28.7 35.9 44.7 Dividend per share (Rs.) 0.6 0.7 0.9 1.1 Book Value (Rs.) 196.7 224.5 259.4 302.7 Adj BV (Rs.) 190.6 216.7 250.2 291.6 Revenue Analysis : Interest income on IBA (%) 9.1% 9.4% 9.9% 9.9%Interest cost on IBL (%) 5.3% 5.6% 6.0% 5.9%NIM on IBA / AWF (%) 4.4% 4.4% 4.5% 4.6%Core fee Inc / AWF (%) 1.5% 1.5% 1.5% 1.6%Portfolio gains / Total Inc (%) 1.6% 1.7% 1.6% 1.5%Op.Exp / TI (%) 48.1% 46.1% 44.7% 43.6%Op.Exp / AWF (%) 2.9% 2.8% 2.8% 2.8%Employee exps / Op exps (%) 45.6% 42.4% 39.4% 36.4%Tax / Pre‐tax earnings (%) 34.3% 33.0% 33.0% 33.0% Asset Quality : GNPAs / Gr Adv (%) 2.22% 2.13% 2.05% 2.03%NNPAs / Net Adv (%) 0.98% 0.99% 0.94% 0.94% Growth Ratio : Loans (%) 24.7% 22.8% 23.4% 21.3%Investments (%) 43.2% 14.9% 14.5% 14.5%Deposits (%) 22.4% 21.9% 22.5% 22.2%Networth (%) 35.7% 14.1% 15.5% 16.7%Net Int Income (%) 17.3% 23.6% 22.7% 20.6%Non‐fund based income (%) 26.5% 22.2% 21.3% 25.4%Non‐Int Exp (%) 14.4% 18.2% 18.6% 19.1%Profit Before Tax (%) 20.8% 31.1% 25.4% 24.3%Net profit (%) 19.7% 33.7% 25.4% 24.3% Asset / Liability Profile Avg CASA/ Deposits (%) 49% 53% 55% 57%Avg Adv / Avg Dep (%) 89% 89% 89% 89%Avg Invst / Avg Dep (%) 31% 33% 30% 28%Incr Adv / Deposits (%) 95.5% 91.5% 92.2% 85.5%Avg Cash / Avg Dep (%) 12.3% 9.7% 8.7% 7.9% Capital Adequacy Ratio: Tier I (%) 17.8% 17.1% 16.5% 16.3%CET 1 (%) 17.8% 17.1% 16.5% 16.2%NNPAs to Equity (%) 10.2% 10.9% 11.1% 11.4%
KOTAK MAHINDRA BANK INITIATING COVERAGE
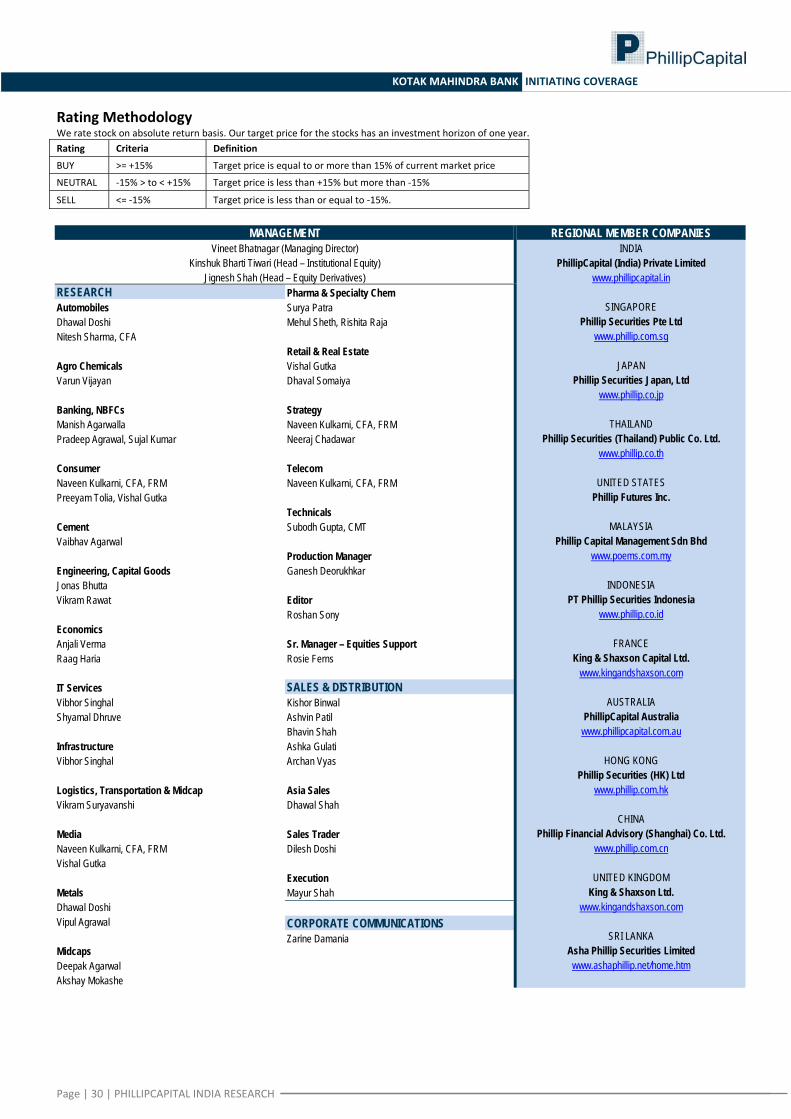
Rating Methodology We rate stock on absolute return basis. Our target price for the stocks has an investment horizon of one year. Rating Criteria Definition
BUY >= +15% Target price is equal to or more than 15% of current market price
NEUTRAL ‐15% > to < +15% Target price is less than +15% but more than ‐15%
SELL <= ‐15% Target price is less than or equal to ‐15%.
MANAGEMENT
Vineet Bhatnagar (Managing Director) Kinshuk Bharti Tiwari (Head – Institutional Equity)
Jignesh Shah (Head – Equity Derivatives)
REGIONAL MEMBER COMPANIES INDIA
PhillipCapital (India) Private Limited www.phillipcapital.in
SINGAPORE
Phillip Securities Pte Ltd www.phillip.com.sg
JAPAN
Phillip Securities Japan, Ltd www.phillip.co.jp
THAILAND
Phillip Securities (Thailand) Public Co. Ltd. www.phillip.co.th
UNITED STATES
Phillip Futures Inc.
MALAYSIA Phillip Capital Management Sdn Bhd
www.poems.com.my
INDONESIA PT Phillip Securities Indonesia
www.phillip.co.id
FRANCE King & Shaxson Capital Ltd.
www.kingandshaxson.com
AUSTRALIA PhillipCapital Australia
www.phillipcapital.com.au
HONG KONG Phillip Securities (HK) Ltd
www.phillip.com.hk
CHINA Phillip Financial Advisory (Shanghai) Co. Ltd.
www.phillip.com.cn
UNITED KINGDOM King & Shaxson Ltd.
www.kingandshaxson.com
SRI LANKA Asha Phillip Securities Limited www.ashaphillip.net/home.htm
RESEARCH Automobiles Dhawal Doshi Nitesh Sharma, CFA Agro Chemicals Varun Vijayan Banking, NBFCs Manish Agarwalla Pradeep Agrawal, Sujal Kumar Consumer Naveen Kulkarni, CFA, FRM Preeyam Tolia, Vishal Gutka Cement Vaibhav Agarwal Engineering, Capital Goods Jonas Bhutta Vikram Rawat Economics Anjali Verma Raag Haria IT Services Vibhor Singhal Shyamal Dhruve Infrastructure Vibhor Singhal Logistics, Transportation & Midcap Vikram Suryavanshi Media Naveen Kulkarni, CFA, FRM Vishal Gutka Metals Dhawal Doshi Vipul Agrawal Midcaps Deepak Agarwal Akshay Mokashe
Pharma & Specialty Chem Surya Patra Mehul Sheth, Rishita Raja Retail & Real Estate Vishal Gutka Dhaval Somaiya Strategy Naveen Kulkarni, CFA, FRM Neeraj Chadawar Telecom Naveen Kulkarni, CFA, FRM Technicals Subodh Gupta, CMT Production Manager Ganesh Deorukhkar Editor Roshan Sony Sr. Manager – Equities Support Rosie Ferns SALES & DISTRIBUTION Kishor Binwal Ashvin Patil Bhavin Shah Ashka Gulati Archan Vyas Asia Sales Dhawal Shah Sales Trader Dilesh Doshi Execution Mayur Shah CORPORATE COMMUNICATIONS Zarine Damania
Page | 30 | PHILLIPCAPITAL INDIA RESEARCH
KOTAK MAHINDRA BANK INITIATING COVERAGE
Disclosures and Disclaimers PhillipCapital (India) Pvt. Ltd. has three independent equity research groups: Institutional Equities, Institutional Equity Derivatives, and Private Client Group. This report has been prepared by Institutional Equities Group. The views and opinions expressed in this document may, may not match, or may be contrary at times with the views, estimates, rating, and target price of the other equity research groups of PhillipCapital (India) Pvt. Ltd.
This report is issued by PhillipCapital (India) Pvt. Ltd., which is regulated by the SEBI. PhillipCapital (India) Pvt. Ltd. is a subsidiary of Phillip (Mauritius) Pvt. Ltd. References to "PCIPL" in this report shall mean PhillipCapital (India) Pvt. Ltd unless otherwise stated. This report is prepared and distributed by PCIPL for information purposes only, and neither the information contained herein, nor any opinion expressed should be construed or deemed to be construed as solicitation or as offering advice for the purposes of the purchase or sale of any security, investment, or derivatives. The information and opinions contained in the report were considered by PCIPL to be valid when published. The report also contains information provided to PCIPL by third parties. The source of such information will usually be disclosed in the report. Whilst PCIPL has taken all reasonable steps to ensure that this information is correct, PCIPL does not offer any warranty as to the accuracy or completeness of such information. Any person placing reliance on the report to undertake trading does so entirely at his or her own risk and PCIPL does not accept any liability as a result. Securities and Derivatives markets may be subject to rapid and unexpected price movements and past performance is not necessarily an indication of future performance.
This report does not regard the specific investment objectives, financial situation, and the particular needs of any specific person who may receive this report. Investors must undertake independent analysis with their own legal, tax, and financial advisors and reach their own conclusions regarding the appropriateness of investing in any securities or investment strategies discussed or recommended in this report and should understand that statements regarding future prospects may not be realised. Under no circumstances can it be used or considered as an offer to sell or as a solicitation of any offer to buy or sell the securities mentioned within it. The information contained in the research reports may have been taken from trade and statistical services and other sources, which PCIL believe is reliable. PhillipCapital (India) Pvt. Ltd. or any of its group/associate/affiliate companies do not guarantee that such information is accurate or complete and it should not be relied upon as such. Any opinions expressed reflect judgments at this date and are subject to change without notice.
Important: These disclosures and disclaimers must be read in conjunction with the research report of which it forms part. Receipt and use of the research report is subject to all aspects of these disclosures and disclaimers. Additional information about the issuers and securities discussed in this research report is available on request.
Certifications: The research analyst(s) who prepared this research report hereby certifies that the views expressed in this research report accurately reflect the research analyst’s personal views about all of the subject issuers and/or securities, that the analyst(s) have no known conflict of interest and no part of the research analyst’s compensation was, is, or will be, directly or indirectly, related to the specific views or recommendations contained in this research report.
Additional Disclosures of Interest: Unless specifically mentioned in Point No. 9 below: 1. The Research Analyst(s), PCIL, or its associates or relatives of the Research Analyst does not have any financial interest in the company(ies) covered in
this report. 2. The Research Analyst, PCIL or its associates or relatives of the Research Analyst affiliates collectively do not hold more than 1% of the securities of the
company (ies)covered in this report as of the end of the month immediately preceding the distribution of the research report. 3. The Research Analyst, his/her associate, his/her relative, and PCIL, do not have any other material conflict of interest at the time of publication of this
research report. 4. The Research Analyst, PCIL, and its associates have not received compensation for investment banking or merchant banking or brokerage services or for
any other products or services from the company(ies) covered in this report, in the past twelve months. 5. The Research Analyst, PCIL or its associates have not managed or co‐managed in the previous twelve months, a private or public offering of securities for
the company (ies) covered in this report. 6. PCIL or its associates have not received compensation or other benefits from the company(ies) covered in this report or from any third party, in
connection with the research report. 7. The Research Analyst has not served as an Officer, Director, or employee of the company (ies) covered in the Research report. 8. The Research Analyst and PCIL has not been engaged in market making activity for the company(ies) covered in the Research report. 9. Details of PCIL, Research Analyst and its associates pertaining to the companies covered in the Research report: Sr. no. Particulars Yes/No
1 Whether compensation has been received from the company(ies) covered in the Research report in the past 12 months for investment banking transaction by PCIL
No
2 Whether Research Analyst, PCIL or its associates or relatives of the Research Analyst affiliates collectively hold more than 1% of the company(ies) covered in the Research report
No
3 Whether compensation has been received by PCIL or its associates from the company(ies) covered in the Research report No4 PCIL or its affiliates have managed or co‐managed in the previous twelve months a private or public offering of securities for the
company(ies) covered in the Research report No
5 Research Analyst, his associate, PCIL or its associates have received compensation for investment banking or merchant banking or brokerage services or for any other products or services from the company(ies) covered in the Research report, in the last twelve months
No
Independence: PhillipCapital (India) Pvt. Ltd. has not had an investment banking relationship with, and has not received any compensation for investment banking services from, the subject issuers in the past twelve (12) months, and PhillipCapital (India) Pvt. Ltd does not anticipate receiving or intend to seek compensation for investment banking services from the subject issuers in the next three (3) months. PhillipCapital (India) Pvt. Ltd is not a market maker in the securities mentioned in this research report, although it, or its affiliates/employees, may have positions in, purchase or sell, or be materially interested in any of the securities covered in the report.
Suitability and Risks: This research report is for informational purposes only and is not tailored to the specific investment objectives, financial situation or particular requirements of any individual recipient hereof. Certain securities may give rise to substantial risks and may not be suitable for certain investors. Each investor must make its own determination as to the appropriateness of any securities referred to in this research report based upon the legal, tax and accounting considerations applicable to such investor and its own investment objectives or strategy, its financial situation and its investing experience. The value of any security may be positively or adversely affected by changes in foreign exchange or interest rates, as well as by other financial, economic, or political factors. Past performance is not necessarily indicative of future performance or results.
Page | 31 | PHILLIPCAPITAL INDIA RESEARCH
Page | 32 | PHILLIPCAPITAL INDIA RESEARCH
KOTAK MAHINDRA BANK INITIATING COVERAGE
Sources, Completeness and Accuracy: The material herein is based upon information obtained from sources that PCIPL and the research analyst believe to be reliable, but neither PCIPL nor the research analyst represents or guarantees that the information contained herein is accurate or complete and it should not be relied upon as such. Opinions expressed herein are current opinions as of the date appearing on this material, and are subject to change without notice. Furthermore, PCIPL is under no obligation to update or keep the information current. Without limiting any of the foregoing, in no event shall PCIL, any of its affiliates/employees or any third party involved in, or related to computing or compiling the information have any liability for any damages of any kind including but not limited to any direct or consequential loss or damage, however arising, from the use of this document.
Copyright: The copyright in this research report belongs exclusively to PCIPL. All rights are reserved. Any unauthorised use or disclosure is prohibited. No reprinting or reproduction, in whole or in part, is permitted without the PCIPL’s prior consent, except that a recipient may reprint it for internal circulation only and only if it is reprinted in its entirety.
Caution: Risk of loss in trading/investment can be substantial and even more than the amount / margin given by you. Investment in securities market are subject to market risks, you are requested to read all the related documents carefully before investing. You should carefully consider whether trading/investment is appropriate for you in light of your experience, objectives, financial resources and other relevant circumstances. PhillipCapital and any of its employees, directors, associates, group entities, or affiliates shall not be liable for losses, if any, incurred by you. You are further cautioned that trading/investments in financial markets are subject to market risks and are advised to seek independent third party trading/investment advice outside PhillipCapital/group/associates/affiliates/directors/employees before and during your trading/investment. There is no guarantee/assurance as to returns or profits or capital protection or appreciation. PhillipCapital and any of its employees, directors, associates, and/or employees, directors, associates of PhillipCapital’s group entities or affiliates is not inducing you for trading/investing in the financial market(s). Trading/Investment decision is your sole responsibility. You must also read the Risk Disclosure Document and Do’s and Don’ts before investing.
Kindly note that past performance is not necessarily a guide to future performance.
For Detailed Disclaimer: Please visit our website www.phillipcapital.in
For U.S. persons only: This research report is a product of PhillipCapital (India) Pvt Ltd., which is the employer of the research analyst(s) who has prepared the research report. The research analyst(s) preparing the research report is/are resident outside the United States (U.S.) and are not associated persons of any U.S.‐regulated broker‐dealer and therefore the analyst(s) is/are not subject to supervision by a U.S. broker‐dealer, and is/are not required to satisfy the regulatory licensing requirements of FINRA or required to otherwise comply with U.S. rules or regulations regarding, among other things, communications with a subject company, public appearances, and trading securities held by a research analyst account.
This report is intended for distribution by PhillipCapital (India) Pvt Ltd. only to "Major Institutional Investors" as defined by Rule 15a‐6(b)(4) of the U.S. Securities and Exchange Act, 1934 (the Exchange Act) and interpretations thereof by the U.S. Securities and Exchange Commission (SEC) in reliance on Rule 15a 6(a)(2). If the recipient of this report is not a Major Institutional Investor as specified above, then it should not act upon this report and return the same to the sender. Further, this report may not be copied, duplicated, and/or transmitted onward to any U.S. person, which is not a Major Institutional Investor. In reliance on the exemption from registration provided by Rule 15a‐6 of the Exchange Act and interpretations thereof by the SEC in order to conduct certain business with Major Institutional Investors, PhillipCapital (India) Pvt Ltd. has entered into an agreement with a U.S. registered broker‐dealer, Decker & Co, LLC. Transactions in securities discussed in this research report should be effected through Decker & Co, LLC or another U.S. registered broker dealer. If Distribution is to Australian Investors This report is produced by PhillipCapital (India) Pvt Ltd and is being distributed in Australia by Phillip Capital Limited (Australian Financial Services Licence No. 246827). This report contains general securities advice and does not take into account your personal objectives, situation and needs. Please read the Disclosures and Disclaimers set out above. By receiving or reading this report, you agree to be bound by the terms and limitations set out above. Any failure to comply with these terms and limitations may constitute a violation of law. This report has been provided to you for personal use only and shall not be reproduced, distributed or published by you in whole or in part, for any purpose. If you have received this report by mistake, please delete or destroy it, and notify the sender immediately. PhillipCapital (India) Pvt. Ltd. Registered office: No. 1, 18th Floor, Urmi Estate, 95 Ganpatrao Kadam Marg, Lower Parel West, Mumbai 400013