Embed Size (px)
Citation preview
i
INSTITUTIONAL FACTORS INFLUENCING THE PROVISION OF
QUALITY EDUCATION IN PUBLIC UNIVERSITIES IN KENYA: A
CASE OF FACULTY OF ARTS, UNIVERSITY OF NAIROBI, KENYA
Tom Ochieng’ Kuja
A Research Project Submitted in Partial fulfillment for the Requirement for
the Award of the Degree of Master of Education in Corporate Governance in
Education
UNIVERSITY OF NAIROBI
2016
ii
DECLARATION
This research project is my original work and has not been presented for award of
a degree in any other university
_________________________________
Tom Ochieng‟ Kuja
E55/70509/2013
This research project has been submitted for examination with our approval as
university supervisors
_________________________________
Dr. Ursulla Okoth
Senior Lecturer
Department of Educational Administration and Planning
University of Nairobi
_________________________________
Jeremiah M. Kalai, PhD
Senior Lecturer and Chairman
Department of Educational Administration and Planning
University of Nairobi
iii
DEDICATION
This research project is dedicated to my mother Joyce Tom Kuja.
iv
ACKNOWLEDGEMENTS
My most sincere gratitude is directed to the almighty God for my life, good
health, guidance and providence that saw me overcome many challenges
throughout my entire course. Such an accomplishment would not have been
brought to reality had it not been a concerted effort of prominent personalities,
whose priceless contribution I wish to acknowledge.
I am deeply indebted to my supervisors Dr. Jeremiah Kalai-Chairman,
Department of Educational Administration and Planning in School of Education
and Dr. Ursulla Okoth who despite their busy schedule found time to read through
my work. Their mentorship was paramount in giving a well-rounded experience
throughout my study and completion of this project. Their commitment inspired
and encouraged me. I would also like to thank the lecturers in the Department of
Educational Administration and Planning of the University of Nairobi especially
Dr. Mari Nelson and Prof. Akala for their input, valuable discussions and
accessibility during this project. I am also thankful to my mother Joyce Tom Kuja
for her encouragement and moral support throughout this project and my late dad
Tom Onyango Kuja.
I am equally appreciative and grateful to the Dean, Faculty of Arts, PhD
candidates, Masters and Bachelors students from the Faculty of Arts in the
College of Humanities and Social Sciences of The University of Nairobi who
participated in the study and provided primary data.
v
TABLE OF CONTENTS
Content page
Title page------------------------------------------------------------------------------i
Declaration----------------------------------------------------------------------------ii
Dedication-----------------------------------------------------------------------------iii
Acknowledgement-------------------------------------------------------------------iv
Table of contents----------------------------------------------------------------------v
List of tables--------------------------------------------------------------------------ix
List of figures-------------------------------------------------------------------------x
List of abbreviations and acronyms-----------------------------------------------xi
Abstract-------------------------------------------------------------------------------xii
CHAPTER ONE
INTRODUCTION
1.1 Background to the study-----------------------------------------------------1
1.2 Statement of the problem----------------------------------------------------7
1.3 Purpose of the study----------------------------------------------------------8
1.4 Objectives of the study-------------------------------------------------------8
1.5 Research questions------------------------------------------------------------9
1.6 Significance of the study-----------------------------------------------------9
1.7 Limitation of the study-------------------------------------------------------10
1.8 Delimitation of the study----------------------------------------------------10
1.9 Basic assumptions of the study---------------------------------------------11
1.10 Definition of significant terms---------------------------------------------11
vi
1.11 Organization of the study-------------------------------------------------------12
CHAPTER TWO
REVIEW OF RELATED LITERATURE
2.1 Introduction----------------------------------------------------------------------------13
2.2 Concept of quality in education-----------------------------------------------------15
2.3 Influence of lecturer student ratio on quality of education----------------------16
2.4 Internet accessibility on provision of quality education-------------------------17
2.5 Teaching Learning Resource and Quality Education----------------------------18
2.6 Relevance of physical facilities on the provision of quality education--------18
2.7 Summary of literature review-------------------------------------------------------18
2.8 Theoretical framework---------------------------------------------------------------19
2.9 Conceptual framework---------------------------------------------------------------20
CHAPTER THREE
RESEARCH METHODOLOGY
3.1 Introduction----------------------------------------------------------------------------21
3.2 Research design-----------------------------------------------------------------------21
3.3 Target population---------------------------------------------------------------------21
3.4 Sample size and sampling procedure-----------------------------------------------22
3.5 Research instruments-----------------------------------------------------------------22
3.6 Validity of Instrument ---------------------------------------------------------------23
3.7 Reliability of Instruments------------------------------------------------------------23
3.8 Data collection procedures-----------------------------------------------------------25
3.9 Data analysis techniques-------------------------------------------------------------26
vii
3.10 Ethical Considerations--------------------------------------------------------------26
CHAPTER FOUR
DATA ANALYSIS, PRESENTATION, INTERPRETATION AND
DISCUSSION
4.1 Introduction----------------------------------------------------------------------------27
4.2 Questionnaire and Interview Schedule return rate--------------------------------27
4.3 Demographic information of Respondents----------------------------------------28
4.4 Lecturer-student ratio-----------------------------------------------------------------33
4.5 Internet access-------------------------------------------------------------------------39
4.6 Availability of Teaching-Learning Resources------------------------------------48
4.7 Adequacy of Physical Facilities-----------------------------------------------------55
4.7.1 Accommodation within the university----------------------------------55
4.7.2 How possession of a room affects student‟s studies------------------56
4.7.3 Adequacy of resources in relation to student population-------------57
CHAPTER FIVE
SUMMARY, CONCLUSION AND RECOMMENDATIONS
5.1 Introduction---------------------------------------------------------------------------62
5.2 Summary of the study---------------------------------------------------------------62
5.3 Findings of Study--------------------------------------------------------------------63
5.4 Conclusions---------------------------------------------------------------------------65
5.5 Recommendations on the research findings--------------------------------------67
5.6 Recommendations for further research--------------------------------------------68
REFERENCES---------------------------------------------------------------------------69
viii
APPENDICES
Appendix I. Letter of Introduction-----------------------------------------------------76
Appendix II. Questionnaire for Students----------------------------------------------77
Appendix III. Interview Schedule for dean, Faculty of Arts-----------------------80
Appendix IV. Observation Schedule--------------------------------------------------81
Appendix V. Authorization letter-----------------------------------------------------82
Appendix V. Research Permit----------------------------------------------------------83
ix
LIST OF TABLES
Table Page
Table 1.1 Show student admissions and Completion for bachelors‟ degree in
the Faculty of Arts, 2009-2014------------------------------------------------5
Table 1.2 Number of graduates from the Faculty of Arts 2009-2014----------------6
Table 4.1 Questionnaires and interview schedule return rate------------------------27
Table 4.2 Students Level of Education-------------------------------------------------31
Table 4.3 Point of Internet access for bachelors‟ students---------------------------42
Table 4.4 Point of Internet access for masters‟ students------------------------------43
Table 4.5 Point of internet access for PhD students-----------------------------------44
Table 4.6 Internet accessibility rating by Bachelors degree students---------------45
Table 4.7 Internet accessibility rating by masters degree students------------------45
Table 4.8 Internet accessibility rating by PhD students------------------------------46
Table 4.9 Adequacy of Teaching-Learning resources for bachelors‟ students----49
Table 4.10 Adequacy of Teaching-Learning resources for masters‟ students-----51
Table 4.11 Adequacy of Teaching-Learning resources for PhD students----------53
Table 4.12 Adequacy of resources in relation to bachelors‟ degree student
Population--------------------------------------------------------------------55
Table 4.13 Adequacy of resources in relation to masters degree student
Population--------------------------------------------------------------------57
Table 4.14 Adequacy of resources in relation to PhD degree student population-59

x
LIST OF FIGURES
Figure Page
Figure 2.1: Relationship between institutional factors and quality in public
Universities in Kenya education-------------------------------------------21
Figure 4.1 Distribution of students by gender-----------------------------------------29
Figure 4.2 Ages of Students--------------------------------------------------------------30
Figure 4.3 Students academic year------------------------------------------------------32
Figure 4.4 Lecturers availability for individualized assistance for Bachelors
Students-----------------------------------------------------------------------33
Figure 4.5 Lecturers availability for individualized assistance for Masters
Students------------------------------------------------------------------------34
Figure 4.6 Lecturer man-hour attendance rates----------------------------------------36
Figure 4.7 Course content coverage rating by Bachelors degree students---------37
Figure 4.8 Course content coverage rating by Masters degree students------------38
Figure 4.9 Frequencies of internet usage among Bachelors students---------------39
Figure 4.10 Frequencies of internet usage among Masters Students---------------40
Figure 4.11 Frequencies of internet usage among PhD students--------------------41
Figure 4.12 Influence of internet accessibility on performance---------------------47
Figure 4.13 Accommodation of students within the university---------------------55
Figure 4.14 Accommodation within University premises and its influence on
students studies--------------------------------------------------------------56
xi
ABBREVIATIONS AND ACRONYMS
AfriQA African Quality Assurance Network
ATICS African Tertiary Institutions Connectivity Survey
CHE Commission for Higher Education
COL Commonwealth of Learning
CUE Commission for University Education
E.P Educational Processes
GDP Gross Domestic Product
ICT Information and Communication Technology
NAAC National Assessment and accreditation council
NACOSTI National Commission of Science, Technology and
Innovation
OECD Organization for Economic Cooperation and Development
FoA Faculty of Arts
UNICEF United Nation Children‟s Fund
UNESCO United Nations Educational, Scientific and Cultural
Organization
USA United States of America
USAID United States Agency for International Development

xii
ABSTRACT
Higher education plays a key role in training qualified individuals who are capable of implementing new technologies and using innovative methods to establish more efficient enterprises and institutions and thus allocate resources more effectively to enhance quality education. University of Nairobi has been ranked through webometrics ranking of world universities 2016 as 6th out of 1448 universities in Africa and one of the main criteria used is webometric that to extend reflects the quality of education offered at the university. The study analyzed institutional factors influencing provision of quality education in public universities in Kenya: case of Faculty of Arts, University of Nairobi, Kenya. The objective of the study were to determine the extent to which student-lecture ratio, internet access, availability of teaching and learning resources and adequacy of physical facilities influence the provision of quality education in public Universities in Kenya. The indicators of quality in Universities were pass rates, number of PhD‟s and Masters students‟ admitted and graduating, ongoing and completed research, seminars organized and attended as well as research and publication. The research employed descriptive survey design and was built on Human Capital Theory. The target population for this study was 8774 that included, 7502 undergraduate students, 1230 master of Arts students, 41 PhD students and the Dean Faculty of Arts. The sample consisted 4 PhD student, 123 Masters Students and 750 Bachelors students and 76.4%. Simple random sampling and purposive sampling used to get respondents. A reliability co-efficient of 0.8 was realized. Questionnaires, interview and observation schedules were used for data collection. Descriptive statistical analysis on quantitative data used results presented using frequency tables, bar graphs, percentages and pie charts. The study concluded that institutional factors influence the provision of quality of education. On the first objective the study concluded that the availability of lecturers for individualized learning, attendance and course content coverage affect the provision of quality education. On the second objective, internet accessibility at the various places affect the performance of the course work hence affecting quality of education. The study also concluded that availability of teaching learning resources and their adequacy influence the provision of quality education. As a result of this the study it recommends that the Faculty of Arts ought to add the teaching staff to increase the lecturer student ratio so as to ensure that the students get an individualized and personalized tutorials, there is need to add more computer laboratories because many students use them to access internet, add internet ports in the lecture rooms to enhance connectivity even when the wireless connectivity is limited, library materials also need to be customized to ensure that even student with disability can access all electronic materials with ease, lecture halls should be fitted with better furniture, public address system, projectors (electronic equipment that facilitate projection by lecturers) smart boards, proper lighting and hostels need to be increased and the existing ones need renovation. There is also need for more classroom space, offices and tutorial space. This will help promote the quality of service provided by the Faculty and university at large.
1
CHAPTER ONE
INTRODUCTION
1.1 Background to the study
Education is the basis to fostering efforts to enhance productivity, competitive
economic growth, innovation and performance across social and economic
sectors. As a capital good, education is used to develop human resources that is
the pillar to production of other goods and services resulting into social and
economic transformation of the society (Olaniyan & Okemakinde, 2008). In
particular, higher education plays a key role in training qualified individuals who
are capable of implementing new technologies and using innovative methods to
establish more efficient enterprises and institutions and thus allocate resources
more effectively (World Bank, 2010). Bloom, Canning, and Chan (2006),
established that University education stock would raise the long-run steady-state
by generating a total increase of 0.63 percentage points in Africa‟s GDP in the
first year. Montenegro and Patrinos (2013) cited in USAID (2014) on rates of
both private and society returns to schooling around the world shows that the
returns are highest globally at the tertiary level with a world average of 16.8
percent, while primary and secondary returns are at 10.3 percent and 6.9 percent,
respectively. Further, it is important to note that, India‟s leap onto the world
economic stage has been attributed to its decade-long successful effort to provide
highly-quality, technically oriented tertiary and university education to a
significant number of its citizens (Bloom, Canning and Chan, 2006).

2
The ability of education to play this role rests on the quality and quantity
dimensions of an education system (Olaniyan & Okemakinde, 2008) However,
rapid expansion and change in university education system, through adoption and
application of different modes of learning presents both opportunities and risks in
ensuring quality education in Universities (Chacha, 2005). It has therefore
become necessary given huge public and private investment in University
education, to urgently evaluate how effectively this investment is being utilized
by examining the quality of educational infrastructure, the cadre of qualified
tutors, the quality of teaching and learning resources and other resources in place
(UNESCO, 2005).
The word “quality” has been derived from the Latin word qualis, meaning, “what
kind of”. With a wide variety of meanings and connotations attached to it, quality
is a difficult and elusive term to define, having thus been referred to as a “slippery
concept” (Pfeffer and Coote, 1991 cited in NAAC & COL, 2006). As such it has
been defined with different perspectives and orientations, according to the person,
the measures applied and the context within which it is considered. Chua (2004)
defines quality in the context of education as the Input–Process–Output (IPO)
framework in which „Input‟ refers to the entry requirements, „Process‟ refers to
the teaching and learning process, and „Output‟ refers to the in this case refers to
the undergraduate pass rates, seminars organized and attended, ongoing and
completed research work as well as publications done, number of PhD and
masters students enrolled and graduated. Inputs such as teaching staff, physical
3
facilities and teaching-learning resource including ICT facilities are necessary for
completeness of the definition
The student/faculty ratio has implications not only for the cost of education, but
also for the quality (OECD, 1995). In developed countries like United Kingdom
(UK), lecturer student ratio is used in accrediting university programmes and
courses, a significant basis of raising tuition fees, an indicator on the level of
investment in education and a selling point to those choosing institutions of
tertiary education (court, 2012). Internet revolution has shifted the focus of ICT in
education to its impact on online activities: use of Internet, use of educative online
platform, digital devices, use of blogs and wikis among others. Information and
communication technology (ICT) constitutes an input in the student learning
process that should help produce better learning output by making it possible for
students to access book and journals, carry out assignment online, make
references, stay in touch with lecturers throughout the learning periods (Fuchs and
Woessman, 2004; Etim, 2006).
Physical facilities influence the students‟ use of institutional resources and
therefore institutions of learning must ensure their adequate supply if quality
education is to be ensured (Oyedum & Nwalo, 2011). According to Omotayo
(2008), carrying out lecturing, research work, seminars, workshop and other
practical assignment will be properly done if the physical facilities are adequate.
Therefore, for universities to provide quality learning and research process, they
4
are expected to provide adequate lecturer room, library space, chairs, tables, and
lighting system.
Ugwuanyi, Eze and Obi (2013) define teaching-learning resources as basic
requirements that aid and facilitate effective teaching and learning comprising of
audio and visual teaching technology resources such as projectors, smart boards,
white boards or blackboards, office and student computer systems. The University
of Nairobi has a student population of 68,000 and 10,000 among these are from
the faculty of arts and serviced by a staff of 254 fulltime and 180 part-time
lecturers whose ranks range from 17 professors, 37 associate professors, 44 senior
lecturers, 105 lecturers, 12 assistant lecturers, 180 part time lecturers, 31 tutorial
fellows, 7 visiting lecturers and 1 graduate assistant. The University through its
strategic plan is committed on recruiting academic staff by reviewing and
implementing policy on doctorial training, providing modern and adequate
equipment for teaching and learning, develop libraries to improve learning and
quality of research through information and communication Technology by
establishing and equipping computer laboratories for students and staff. These
efforts are aimed at ensuring quality of the programmes and graduates produced
by the university (arts.uonbi.ac.ke).
Each year, the faculty, through Kenya Universities and College placement
Services (KUCCPS) admits nearly 900 government-sponsored students to its
regular programs and about 1,200 students to self-sponsored the fourteen
department; Geography, History, Linguistics, Kiswahili, Literature,

5
communication skills and studies, philosophy, political science, psychology,
sociology, France, Confucius Institute, Korean Studies, Library and Information
science. (arts.uonbi.ac.ke).
Table 1.1 shows student admissions and Completion for bachelors‟ degree in the
Faculty of Arts, 2009-2014
Table 1.1 Student admissions and Completion for bachelors’ degree in the
Faculty of Arts, 2009-2014 (Source: Faculty of Arts Annual Reports, 2009-
2014)
Yr. of No. Yr. of 1st
Class 2nd
Class 2nd
Class Pass Total
Adm. Adm. Grad. Honors Upper Lower
f % f % f % f %
2010 2234 2014 17 1.4 803 67.0 335 28.8 43 3.5 1198
2009 2189 2013 24 1.9 962 75.7 237 18.6 47 3.7 1270
2008 2123 2012 24 1.9 917 68.7 357 26.8 36 2.7 1334
2007 2177 2011 34 2.7 905 71.7 323 26.6 0 0.0 1262
2006 2168 2010 29 2.6 754 68.9 310 28.3 2 0.2 1095
2005 2105 2009 23 2.3 651 65.5 327 32.6 1 0.1 1002
From Table 1.1 it‟s evident that the completion rate is low. This means that not all
bachelors‟ degree students admitted graduates at the end of their study.
Table 1.2 shows number of Diploma, Post-graduate diploma, Masters and
Doctorate students that graduated from the Faculty of Arts between 2009 and
2014.
6
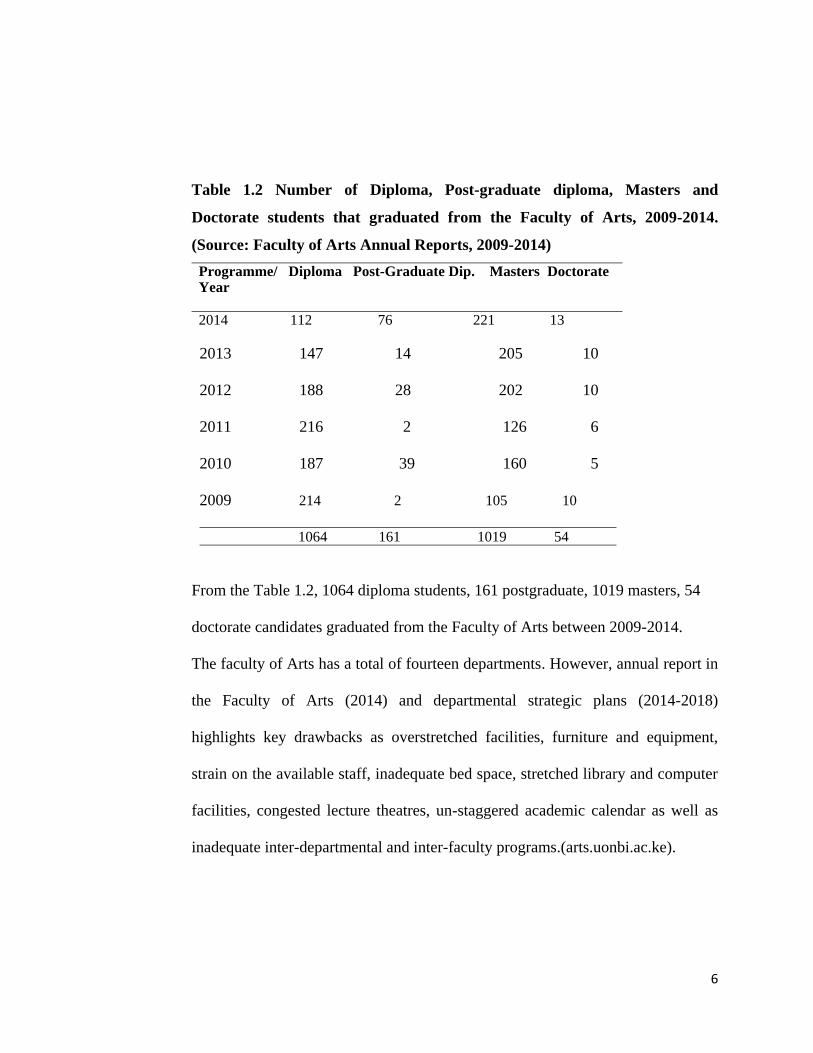
Table 1.2 Number of Diploma, Post-graduate diploma, Masters and
Doctorate students that graduated from the Faculty of Arts, 2009-2014.
(Source: Faculty of Arts Annual Reports, 2009-2014)
Programme/ Diploma Post-Graduate Dip. Masters Doctorate Year
2014 112 76 221 13
2013 147 14 205 10
2012 188 28 202 10
2011 216 2 126 6
2010 187 39 160 5
2009 214 2 105 10
1064 161 1019 54
From the Table 1.2, 1064 diploma students, 161 postgraduate, 1019 masters, 54
doctorate candidates graduated from the Faculty of Arts between 2009-2014.
The faculty of Arts has a total of fourteen departments. However, annual report in
the Faculty of Arts (2014) and departmental strategic plans (2014-2018)
highlights key drawbacks as overstretched facilities, furniture and equipment,
strain on the available staff, inadequate bed space, stretched library and computer
facilities, congested lecture theatres, un-staggered academic calendar as well as
inadequate inter-departmental and inter-faculty programs.(arts.uonbi.ac.ke).
7
What remains unclear however is the extent and magnitude of institutional factors
and how these challenges compromise the quality of education given limited
documentation and research that exists.
1.2 Statement of the problem
Literature of funding University education in Kenya confirms that public funding
is inadequate (Republic of Kenya, 2012). This is likely to affect the input-output
relationships and reduce the quality of University output in terms of teaching,
research and provision of services critical to the economy.
The Government of Kenya in its capacity has ensured that the quality of education
in public Universities in Kenya is fully achieved (Republic of Kenya, 2012). To
effect, the government has hired and paid salaries for qualified lecturers to teach
in the public universities, provision of resources/materials as well building of
infrastructures in public universities with goal of achieving quality education in
these institutions. In addition, the establishment of Commission for University
Education(CUE) (formerly CHE in 1985 by an act of parliament), University Act
CAP 210B as a body corporate to make better provision for the advancement and
quality assurance of university education in Kenya for connected purposes (CHE,
2012). CUE is mandated to accredit, regulate, inspect, promote, set standards and
assure quality and relevance of university programs. (University Act, 2012).
Despite these efforts by the Kenyan government, there has been inadequate
teaching staff, little research funds availed, inadequate teaching-learning
materials, lack of enough libraries and working spaces as well as inadequate ICT

8
infrastructure. This has been caused by the fact that there has been limited
financial resource. Public Universities are reportedly carrying out a number of
revenue diversification initiatives to supplement government funds. It is therefore
arguable that government funding even in the University of Nairobi is still not
enough and this leads to inadequate staff, teaching/learning resources,
infrastructure (lecture rooms, tutorial and office space), hence lack of financial
resources remains a key challenge to effective delivery of its programs
(arts.uonbi.ac.ke). However what is not clear is the extent to institutional factors
(academic staff/lecturer-student ratio, physical facilities, teaching-learning
resources and ICT infrastructure/internet access) have influenced quality of
education offered. With limited studies available, this study intends to fill this gap
by investigating institutional factors that influence the provision of quality
education in the Faculty of Arts, University of Nairobi.
1.3 The Purpose of the Study
The purpose of this study was to investigate institutional factors influencing the
provision of quality education in public universities: A case of Faculty of Arts,
University of Nairobi, Kenya
1.4 Objectives of the study
The study targeted to achieving the following objectives:
i. To assess how lecturer-student ratio influence provision of quality
education in public universities in Kenya.
9
ii. To examine how internet access level influence provision of quality
education in public universities in Kenya.
iii. To assess how the availability of teaching-learning resources influence
provision of quality education in public universities in Kenya.
iv. To analyze how the adequacy of physical facilities influence provision of
quality education in public universities in Kenya.
1.5 Research questions
The following questions guided the study:
i. How does lecturer-student ratio influence provision of quality education in
public universities in Kenya?
ii. To what extent does internet access influence provision of quality
education in public universities in Kenya?
iii. How does availability of teaching-learning resources influence provision
of quality education in public universities in Kenya?
iv. How do provision of physical facilities influence quality education in
public universities in Kenya?
1.6 Significance of the study
The findings of this study ought to help to identify gaps help the Faculty of arts
management and administrators to identify the extent of institutional gaps. Policy
makers (at institutional level and ministry level) and among stakeholders (such as
Commission for University Education) ought to use the findings to re-examine the
existing policies on provision of quality university education in relation to

10
educational inputs. This seeks to pinpointed areas that may need the attention of
University council, Senate as well as future researchers in order to ensure
production of quality, employable graduates.
1.7 Limitations of the study
The respondents‟ availability particularly academic staff due to their busy
schedules was challenge. However, the researcher sought appointment in advance
from the academic staff and collect data within campus session in order to access
students more particularly masters and PhD students. Similarly, the fear to
provide information especially on inadequacies of capacities which seems like
discrediting the institution will be handled by researcher assuring confidentiality
and anonymity of the respondents and that data is to be used for academic
purposes only.
1.8 Delimitation of the study
The study was confined to the experiences of Faculty of Arts, University of
Nairobi. Only the dean-Faculty of arts, PhD, Masters and Bachelors of Arts
students participated in the study. Similarly, the study focused on adequacy of
academic staff, connectivity of ICT infrastructure, availability of teaching and
learning resources and physical facilities. Even though there were other
institutional factors influencing quality at the Faculty of Arts, they were not
explicitly examined by the study.
1.9 Basic assumptions of the study

11
The researcher based the study on the following assumptions:
i. That the Faculty of Arts has programs that are approved by the
Commission for University Education (CUE).
ii. That the students admitted in the Faculty of Arts met minimum
qualifications.
1.10 Definition of significant terms
Academic staff/faculty member refers to the teaching staff at the university and
the Faculty of Arts, University of Nairobi.
Information Communication Technology (ICT) refers to diverse set of
technological tools and resources used to communicate, create, disseminate, store
and manage information within the education institution.
Institutional factors refers to inputs in the teaching learning process, which
determine the quality of output or outcomes of an education system such as
academic staff, connectivity of ICTs, teaching learning resources and physical
facilities.
Physical facilities means any structure intended to be used for lecturing or like
lecture rooms and lecture theatres, staff offices, research areas, seminar rooms,
libraries and or students residences, communal and social services areas such as
places of worship, kitchen, dining, common rooms, recreational facilities.
Quality refers to the standard or the degree of excellence of education as
measured against pass rates, seminars organized/attended, ongoing/completed
12
research, employability of graduates, growth in research and publication,
increased income among other variables.
Quality education refers to ability of education system (input-process-output) to
provide standardized learner experience as indicated by quality of student
scholarly work, their employability and ability to contribute to economic
development through provision of adequate institutional capacities.
1.11 Organization of the study
This study has five chapters. Chapter one include introduction and background to study,
statement of the problem, purpose of the study, objective of the study, research questions,
limitations of the study, delimitation of the study, basic assumptions of the study,
definition of significant terms and organization of the study. Chapter two contains a
review of literature which includes the following sub-headings; concept of quality
education, quality assurance in higher education in Kenya, the role of quality education
on development, influence of lecturer-student ratio on quality of education, internet
accessibility on provision of quality education, quality education and teaching learning
resources, relevance of physical facilities on provision of quality of education. It also
includes theoretical framework, conceptual framework and a summary of the literature
review. Chapter three covers the research methodology which includes; research design,
target population, sample size and sampling techniques, instrument validity, instrument
reliability, data collection procedure, data analysis techniques and consideration for
ethical issues. Chapter four covers findings and discussion. Chapter five covers data
presentation and summary of the study, conclusions and recommendations for further
research.
13
CHAPTER TWO
REVIEW OF RELATED LITERATURE
2.1. Introduction
This section reviews literature on the following areas; concept of quality
education, quality assurance in higher education in Kenya, contribution of quality
education on development, influence of lecturer student ratio on quality of
education, the role of internet access on provision of quality education,
relationship between quality education and teaching learning resources, relevance
of physical facilities on provision of quality education. In addition, the section
provides summary of the literature review, theoretical framework and conceptual
framework of the study.
2.2. Concept of quality in education in public Universities
The word “quality” has been derived from the Latin word qualis, meaning, “what
kind of”. With a wide variety of meanings and connotations attached to it, quality
is a difficult and elusive term to define, having thus been referred to as a “slippery
concept” (Pfeffer & Coote, 1991 cited in NAAC & COL, 2006). As such it has
been defined with different perspectives and orientations, according to the person,
the measures applied and the context within which it is considered. Chua (2004)
defines quality in the context of education as the Input–Process–Output (IPO)
framework in which „Input‟ refers to the entry requirements, „Process‟ refers to
the teaching and learning process, and „Output‟ refers to the employability and
academic standings. Inputs such as teaching staff, physical facilities and teaching-
learning resource including ICT facilities are necessary for completeness of the
14
definition. Whereas concept of quality remains amorphous and contextual, in
higher education, it has widely been used to mean educational system (input-
process-output) being such that it ensures students achieve their goals and thereby
satisfies the needs of the society and help in national development (NAAC
&COL, 2006). Chitty‟s three concepts of schooling summarize quality education
as schooling for human fulfillment, schooling as preparation for the world of
work and schooling for social progress or change.
Higher education in Kenya like the rest of the world, has witnessed continuous
and rising demand and particularly the university system. Among other ways,
public universities responded to this development by mounting privately
sponsored programs, taking over middle level colleges, establishment of satellite
campuses, distance learning programs, evening programs and establishment of
new universities (Owuor, 2012).Commission for Higher Education (CHE) was
established in 1985 by an Act of Parliament, Universities Act CAP 210B as a
body corporate, to make better provisions for the advancement and quality
assurance of university education in Kenya and for connected purposes (CHE,
2012). However, CHE mandate were highly limited to private universities a fact
that saw an enactment of Universities Act, No. 42 of 2012, to establish
Commission for University Education (CUE) as the successor to the Commission
for Higher Education that has mandate over both public and private universities in
Kenya.
15
The CUE is mandated (with among other roles) to accredit, regulate, inspect,
promote, set standards and assure quality and relevance of university programs
(university Act, 2012). A university needs to prove its capacity in terms of human
resource and physical infrastructure for accreditation. However, universities
remain autonomous in carrying out internal day to day mandates and in award of
degrees. The Commission is also a full member of International Network of
Quality Assurance Agencies for Higher Education (INQAAHE) and African
Quality Assurance Network (AfriQAN). This ensures there is comparability of the
quality of university education among the member countries regionally and
globally (CUE, 2013). Harbison (1973) argues that the wealth of nations depend
on their capacity to develop their human resources and not so much on their
physical resources. He argues that ―if a country is unable to develop skills and
knowledge of its citizens and to make use of them effectively in the national
economy it will be unable to develop anything else. Education provides a route to
economic prosperity, the key to scientific and technological advancement, the
means to combat unemployment, the foundation of social equality, equal wealth
distribution, and the spearhead of political socialization and cultural diversity
(Pscharopolous, 1988).Countries with high literacy rates among men and women
have lower levels of fertility, lower infant and maternal mortality and longer life
expectancy (Otiato, 2009). It is from this background that an assumption of
existence of a causal relationship between provision of quality education and
socio-economic development emanates.
16
2.3. Influence of lecturer student ratio on quality of education
Many administrators believe that the lower the ratio between students and
lecturer/faculty, the greater the learning and personal development that will occur.
In United Kingdom (UK), lecturer student ratio has been used for over half a
century to benchmark, or as a broad guideline in terms of input quality when
accrediting university courses. The increase in faculty student ratio indicates a
sign of increasing quality (Roy &Jamison, 1976).U.S. News surveyed nearly
1,800 colleges and universities for 2013 survey of undergraduate programs which
established that at the 19 National Liberal Arts Colleges with the lowest student-
to-faculty ratios in fall of 2012, there was an average 7.6 students to every faculty
member. This allowed small classes for student interaction with professors and
fellow students making it frustratingly difficult to avoid class discussions and skip
class unnoticed.
2.4. Internet accessibility on provision of quality education
Since the Internet revolution, more focus in relation to ICT is on the impact of
online activities: use of Internet, use of educative online platforms, digital
devices, use of blogs and wikis among others. Chifwepa (2003) discovered a high
use of Internet by the staff of the University of Zambia where 35 out of 37 staff
made use of Internet. Their major motivation for such use is convenience
(82.91%); usefulness (80.05%); free access to information and software (71.4%);
and ease of use (68.6%). Jagdoro (2004) through his research on universities in
Nigeria established that 45.2% of postgraduate students access the Internet at the

17
cyber café in the university where only 8.2% use the library Internet facilities.
While Bao (1998) found out that only 10% of his respondents at the Seton Hall
University do not use the Internet, 40.2 percent of students and researchers use it
on daily basis, 38.3% on weekly basis and 10.7 percent on monthly basis. World
Bank sponsored African Tertiary Institutions Connectivity survey (ATICS, 2004)
established that Internet connectivity in universities in Africa was too little, too
expensive and poorly managed.
2.5. Teaching Learning Resources and Quality Education
Young people are capable of understanding abstract ideas if they are provided
with sufficient materials and concrete experiences with the phenomenon that they
understand (Bolton, 1988 & Mbirithi, 2013). As an integral component of
learning process, adequacy and availability of instructional materials is important.
In his study, Bett (2006) found out that quality of education has direct relevance
to availability or lack of instructional materials and noted that curriculum cannot
be easily implemented without instructional materials. Through their study on
teacher training institutions in Bungoma, Likoko, Mutsotso and Nasongo (2013)
established that, teaching learning resources were higher in higher performing
educational institutions than in low performing ones and that there is a significant
difference in instructional resource availability in the higher performing
educational institutions and low performing ones. These findings also indicate
that most institutions faced with challenges such as lack of adequate facilities like
libraries and inadequate instructional materials tend to have a negative effect on
18
the quality of graduates. As such teaching learning resources form vital
component of institutional inputs that are necessary for quality education.
2.6. Relevance of physical facilities on provision of quality education
Institutional facilities have direct effect on learning and performance of students.
In all levels of learning including higher education institutions, availability of
physical facilities like classrooms, desks, chairs among others had positive
relationship to quality of education. Availability of these facilities creates
conducive learning environment hence enabling students to perform well
(Earthman, 2006). A study carried out by Organization for economic cooperation
and development (OECD, 2011) titled „Well-being at school: does infrastructure
matter?‟ focused on structures, safety of buildings, integration of ICT in the
buildings, and physical comfort of the building. It was established that, there is a
stark contrast in satisfaction levels between students attending schools with good
quality infrastructure as compared with those in schools with poor infrastructure.
2.7. Summary of the literature review
Harbison, (1973), argues that the wealth of a nation depends on their capacity to
develop their human resource and not so much on their physical resources. The
student faculty ratio has implications not only for the cost of education, but also
for quality of education itself.(OECD, 1995). On the other hand, internet
constitutes an input in the student learning process that should help produce better
learning output by making it possible for students to access books and journals,
19
carry out assignments online, make references and stay in touch with lecturers
throughout the learning periods. (Fuchs & Woessman, 2004; Etim, 2006).
Teaching-Learning resources are basic requirement that aids and facilitates
effective teaching and learning comprising audio and visual teaching technology,
resources like projectors, smart boards, office and students‟ computer systems.
(Ugwuanyi, Eze & Obi (2013). With limited studies available, this study intends
to fill this gap by analyzing institutional factors influencing the provision of
quality education in the Faculty of Arts, University of Nairobi.
2.8. Theoretical framework
Theoretical framework for this study is based on the Human Capital Theory
developed by Schultz in 1960. According to this theory, education and training
raises the productivity of workers by imparting useful knowledge and skills,
hence raising workers‟ future income by increasing their lifetime capacity to
produce (Becker, 1994). Shultz postulates that human capital is similar to
"physical means of production", one can invest in human capital (via education
and training) and one's outputs depend partly on the rate of return on the human
capital one owns. In order to have productive citizenry (educational output)
postulated in human capital theory, quality of education is paramount. However,
quality education largely depends on level of investment in institutional capacities
such human resources, physical facilities and infrastructure which the study seeks
to analyze.
20
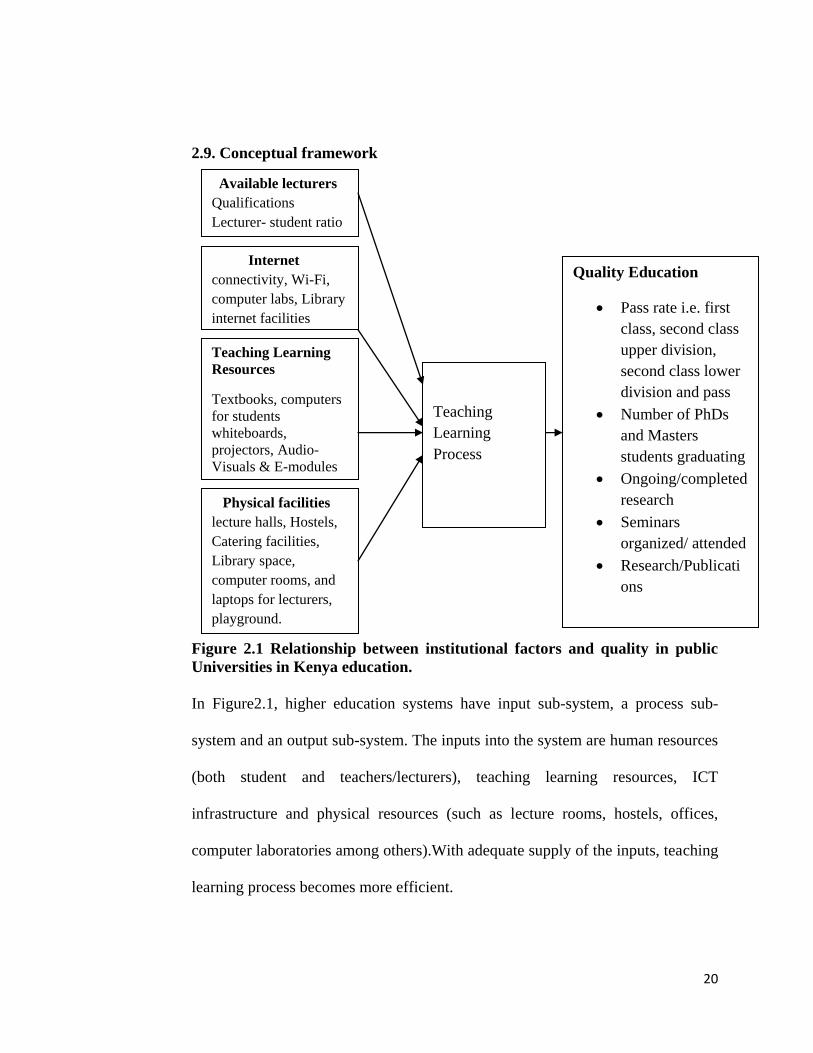
2.9. Conceptual framework
Figure 2.1 Relationship between institutional factors and quality in public
Universities in Kenya education.
In Figure2.1, higher education systems have input sub-system, a process sub-
system and an output sub-system. The inputs into the system are human resources
(both student and teachers/lecturers), teaching learning resources, ICT
infrastructure and physical resources (such as lecture rooms, hostels, offices,
computer laboratories among others).With adequate supply of the inputs, teaching
learning process becomes more efficient.
Available lecturers
Qualifications
Lecturer- student ratio
Internet
connectivity, Wi-Fi,
computer labs, Library
internet facilities
Teaching Learning
Resources
Textbooks, computers
for students
whiteboards,
projectors, Audio-
Visuals & E-modules
Physical facilities
lecture halls, Hostels,
Catering facilities,
Library space,
computer rooms, and
laptops for lecturers,
playground.
Teaching
Learning
Process
Quality Education
Pass rate i.e. first
class, second class
upper division,
second class lower
division and pass
Number of PhDs
and Masters
students graduating
Ongoing/completed
research
Seminars
organized/ attended
Research/Publicati
ons
21
CHAPTER THREE
RESEARCH METHODOLOGY
3.1. Introduction
This section focused on research design, target population, sample size and
sampling procedures, instrument validity and reliability, research instruments,
data collection and procedures, data analysis techniques and consideration of
ethical issues.
3.2. Research design
According to Kothari (2013), a research design refers to the conceptual structure
within which the research will be conducted. This study applied descriptive
survey design. The study aimed at collecting information from respondents on
their opinion in relation to institutional based factors on the provision of quality
education in public universities in Kenya. Therefore, descriptive survey design
was appropriate since according to (Orodho & Kombo, 2002) it allowed the
researcher to collect information by interviewing or administering questionnaire
to the sample of individuals especially when seeking out opinions of people about
something and for collecting generalizable information from any human
population. Further, descriptive survey design was suitable since it deals with
both quantitative and qualitative data which the instruments in this study intended
to gather.
3.3. Target population
According to Kothari (2013), target population refers to all items or collection of
elements under consideration in any field of inquiry. The target population
22
constituted of 8772 students in the categories of: PhD candidates 41, Master of
Arts 1,230, Bachelor of Arts, 7502 and the dean Faculty of Arts. Therefore a total
of 8774 respondents form target population (FoA annual report, 2014).
3.4. Sample size and sampling procedures
According Lapin (1987), sample size refers to collection of observation
representing only a portion of the population.10% of the accessible population is
enough and has proved true even today (Gay, 1992; Mugenda & Mugenda 1999 and
Kasomo, 2006). As such 4 PhD candidates, 123 master‟s students and 750
bachelor‟s students formed student sample and was randomly selected. Dean
Faculty of Arts was purposively picked as head of the Faculty and will be deemed
to be in possession of basic information to be sort by the researcher.
3.5. Research instruments
The researcher used interview schedule, structured questionnaires and observation
schedule to collect data from administrators and students. As indicated by Mitei
(2002), descriptive data are typically collected through interviews, questionnaires
and observations.
Questionnaires were used to collect data from respondents on, lecturer-student
ratio, internet access, availability of teaching learning resources, and adequacy of
physical facilities. Questionnaires were preferred in this study because
respondents of the study were assumed to be literate and quite able to answer
questions asked adequately. Kothari (2004) terms the questionnaire as the most
23
appropriate instrument due to its ability a large amount of information in a quick
span of time.
Interviews provided interactive environment and enables a researcher to cover
the phenomenon under investigation in great depth (Mwanje, 2001). Therefore,
interview schedule was used to collect data from the Faculty dean and as a follow
up on information given in questionnaires to seek more clarifications. In carrying
out observation checklist the researcher moved around lecture halls, libraries,
hostels, dining halls and in the computer laboratories with an aim of observing
and recording the condition of physical facilities, teaching-learning resources and
the learning environment to establish the conditions and adequacy of university
learning resources.
3.6. Validity of Instruments
Instrument validity refers to the extent to which an instrument measures what it is
supposed to. According to (Mugenda & Mugenda, 2009), the usual procedure in
assessing validity of a measure is to use professional or expert in particular field.
As such the researcher sought instrument validation from supervisors and
professionals within the department.
3.7. Reliability of Instrument
Reliability is the measure of the degree to which research adds consistent results
or data after repeated trials (Mugenda &Mugenda, 2009). In this case, reliability
was measured by split-half method to establish the coefficient of internal
consistency of the questionnaires. According to Gay (1992) this method involved
24
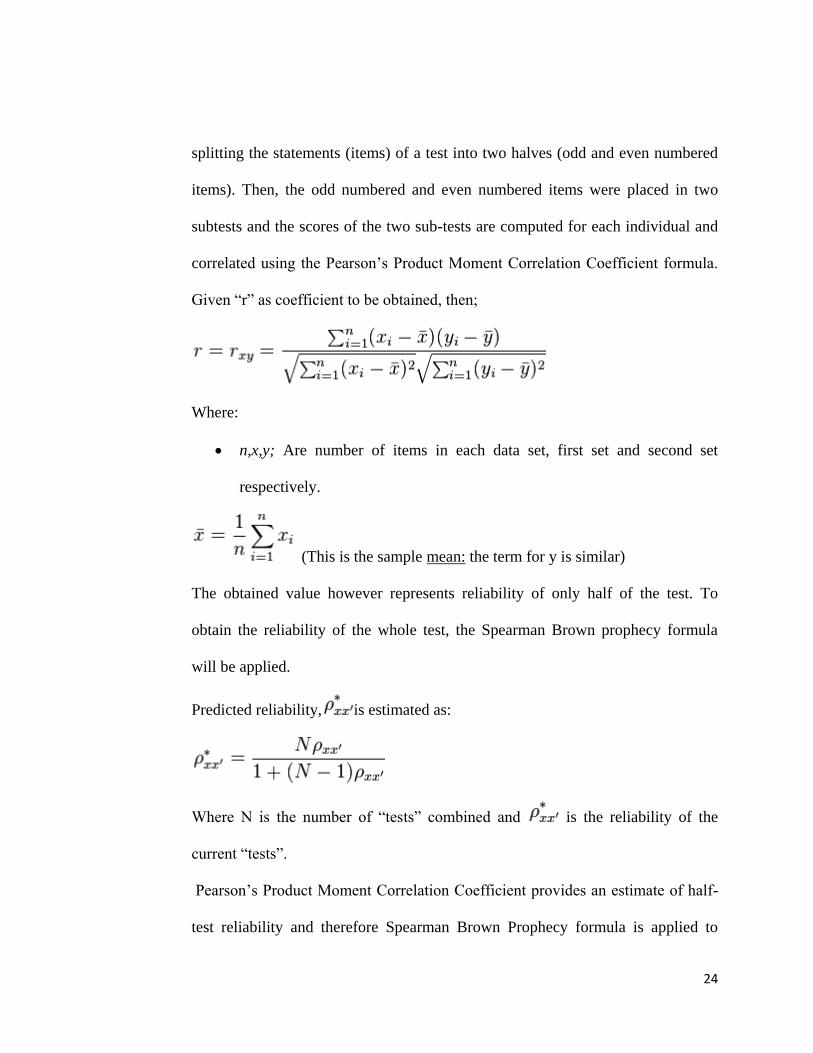
splitting the statements (items) of a test into two halves (odd and even numbered
items). Then, the odd numbered and even numbered items were placed in two
subtests and the scores of the two sub-tests are computed for each individual and
correlated using the Pearson‟s Product Moment Correlation Coefficient formula.
Given “r” as coefficient to be obtained, then;
Where:
n,x,y; Are number of items in each data set, first set and second set
respectively.
(This is the sample mean: the term for y is similar)
The obtained value however represents reliability of only half of the test. To
obtain the reliability of the whole test, the Spearman Brown prophecy formula
will be applied.
Predicted reliability, is estimated as:
Where N is the number of “tests” combined and is the reliability of the
current “tests”.
Pearson‟s Product Moment Correlation Coefficient provides an estimate of half-
test reliability and therefore Spearman Brown Prophecy formula is applied to
25
adjust the half-test reliability to full-test reliability. From the results, a co-efficient
of 0.8 was realized and according to Gay (1992), a desired reliability of 0.7 is
acceptable. Thus the study instruments were very reliable
3.8. Data collection procedures
A letter of introduction was obtained from department which was then taken to
National Commission of Science, Technology and Innovation (NACOSTI) for
research permit. Courtesy call was made to county director of education,
university management, principal College of Humanities and Social Sciences,
dean Faculty of Arts, and departmental heads under the Faculty of Arts. The aim
of a courtesy call was to inform of intended research and to get approval of the
same. Structured questionnaires were administered to respondents and collected
by the researcher the same day. Interview schedule was administered to dean,
Faculty of Arts and responses recorded by the researcher.
In carrying out observation, the researcher moved around lecture halls, libraries,
hostels, dining halls and in the computer laboratories with aim of observing and
recording the condition of physical facilities, teaching-learning resources and the
learning environment to establish the conditions and adequacy of university
learning resources.
3.9. Data analysis techniques
The process of data analysis involved several stages namely; data clean up and
explanation. Data clean-up involved editing, sorting and tabulation in order to
detect any anomalies on the responses. The data was then be coded and checked
26
for any errors and omissions (Kothari, 2004). Responses in the questionnaires
were be tabulated, coded and processed by use of a computer Statistical package
on social science (SPSS) for data analysis. The responses from the open-ended
questions were listed then reported by descriptive narrative. Data was then
presented by use of tables, pie-charts and bar graphs where appropriate and finally
making inference about the whole population.
3.10. Ethical Considerations
The researcher sought the consent of respondents to participate. They were also
informed of their freedom to withdraw from the study. The researcher reassured
respondents of anonymity and that the data was to be used for the study.
27
CHAPTER FOUR
DATA ANALYSIS AND INTERPRETATION
4.1 INTRODUCTION
This chapter presents the findings from the data collected in relation to this study.
With the need to explore the specific objectives upon which this study is pegged
upon, the chapter explores the interrogative aspects that pertains the main
objective and the specific objectives of the study. The findings are expressed in
forms of tables, charts and graphs.
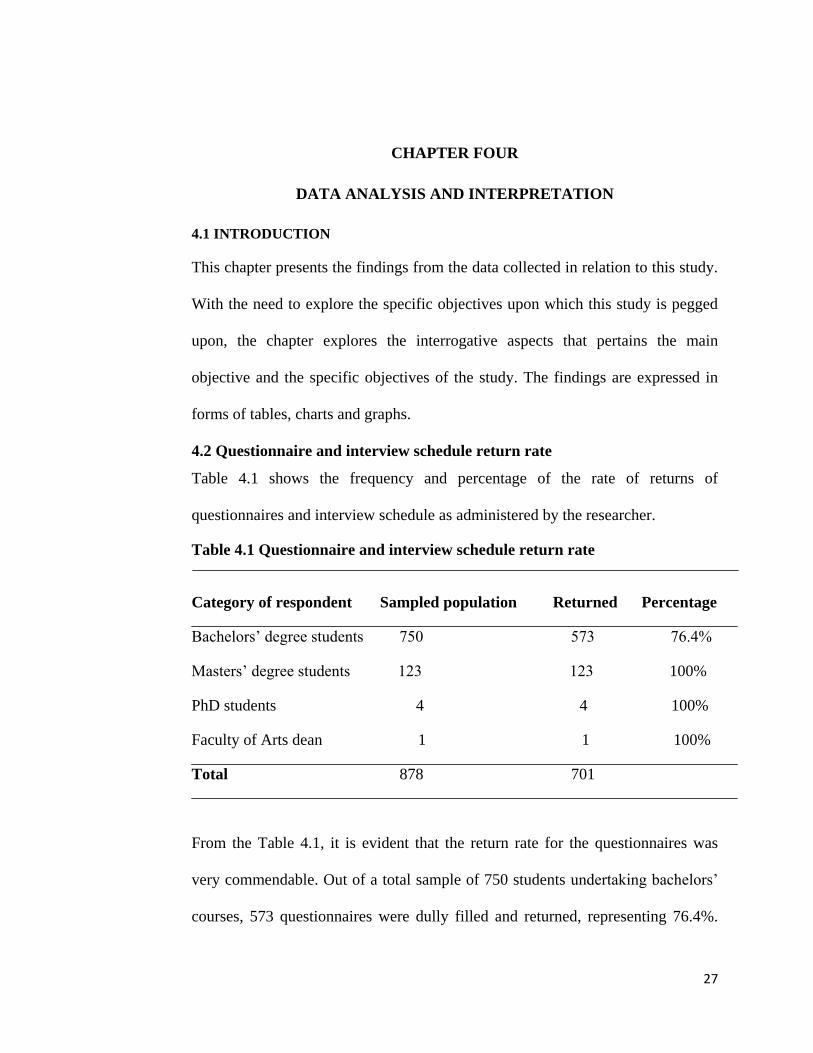
4.2 Questionnaire and interview schedule return rate
Table 4.1 shows the frequency and percentage of the rate of returns of
questionnaires and interview schedule as administered by the researcher.
Table 4.1 Questionnaire and interview schedule return rate
Category of respondent Sampled population Returned Percentage
Bachelors‟ degree students 750 573 76.4%
Masters‟ degree students 123 123 100%
PhD students 4 4 100%
Faculty of Arts dean 1 1 100%
Total 878 701
From the Table 4.1, it is evident that the return rate for the questionnaires was
very commendable. Out of a total sample of 750 students undertaking bachelors‟
courses, 573 questionnaires were dully filled and returned, representing 76.4%.
28
There was 100% return rate for questionnaires administered to masters‟ students.
This shows response rate was favorable according to Mugenda and Mugenda
(2003) in which they assert that 50 percent response rate is adequate, 60 percent is
good and above 70 percent is rated as very well. The interview schedule used for
the Dean was also returned and factored in the analysis.
4.3 Demographic information of Students
The study sought to find out the socio-demographic data of the students so as to
understand the dynamics in terms of gender representation, age of students, the
level of education as well as the year of study. Socio-demographic information
allows the researcher to have an insight into the demographic and social
information of students as well as map on to the larger population.
Gender of students
The need for finding out the gender of students was motivated by the desire to
have an insight into the gender parity of gender distribution of students in the
Faculty of Art, University of Nairobi.
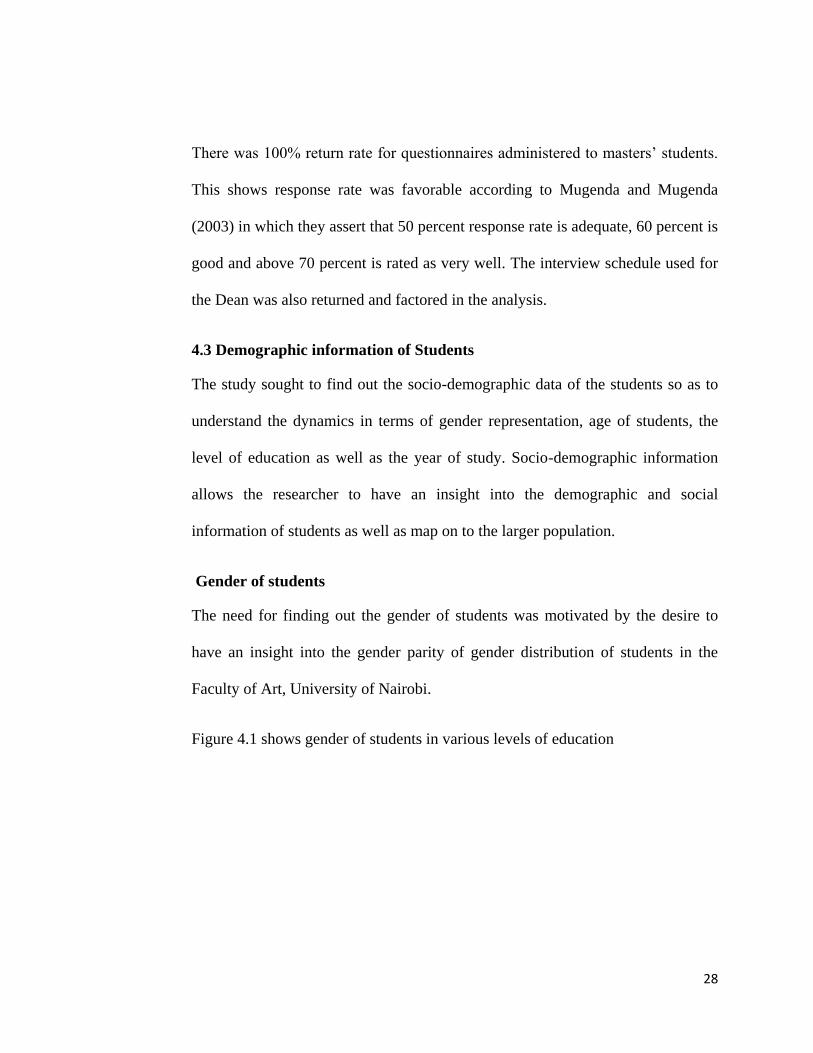
Figure 4.1 shows gender of students in various levels of education
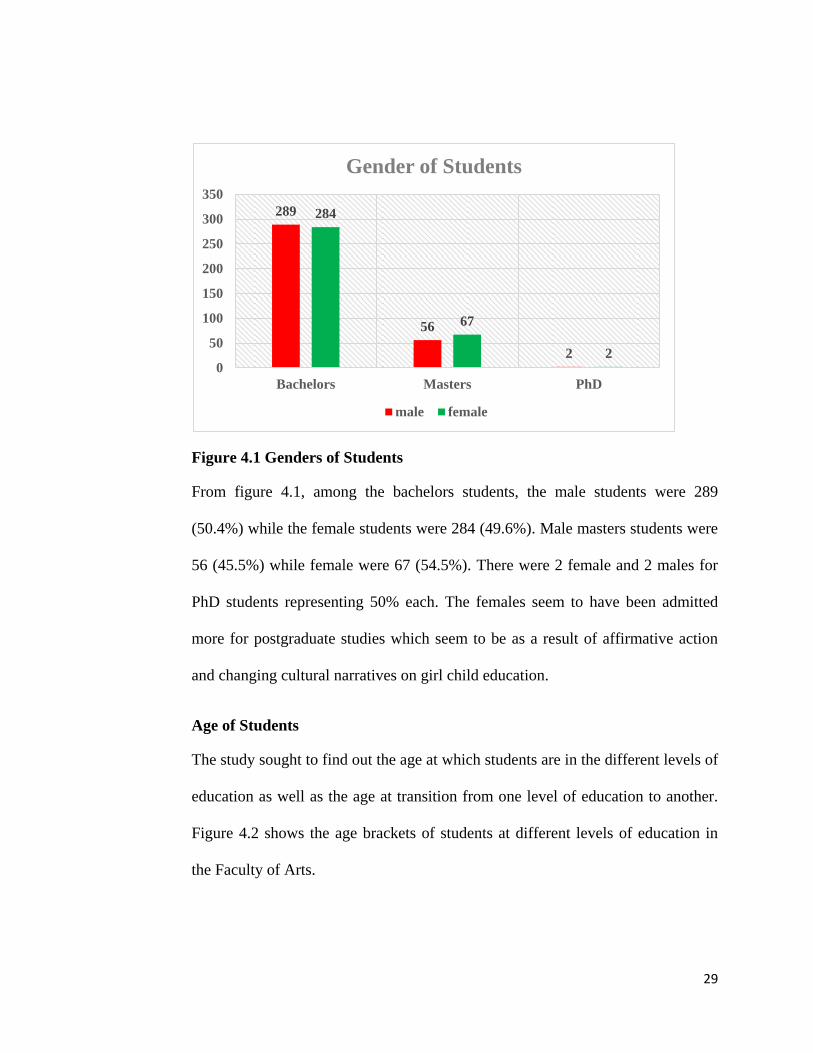
29
Figure 4.1 Genders of Students
From figure 4.1, among the bachelors students, the male students were 289
(50.4%) while the female students were 284 (49.6%). Male masters students were
56 (45.5%) while female were 67 (54.5%). There were 2 female and 2 males for
PhD students representing 50% each. The females seem to have been admitted
more for postgraduate studies which seem to be as a result of affirmative action
and changing cultural narratives on girl child education.
Age of Students
The study sought to find out the age at which students are in the different levels of
education as well as the age at transition from one level of education to another.
Figure 4.2 shows the age brackets of students at different levels of education in
the Faculty of Arts.
289
56
2
284
67
2 0
50
100
150
200
250
300
350
Bachelors Masters PhD
Gender of Students
male female
30
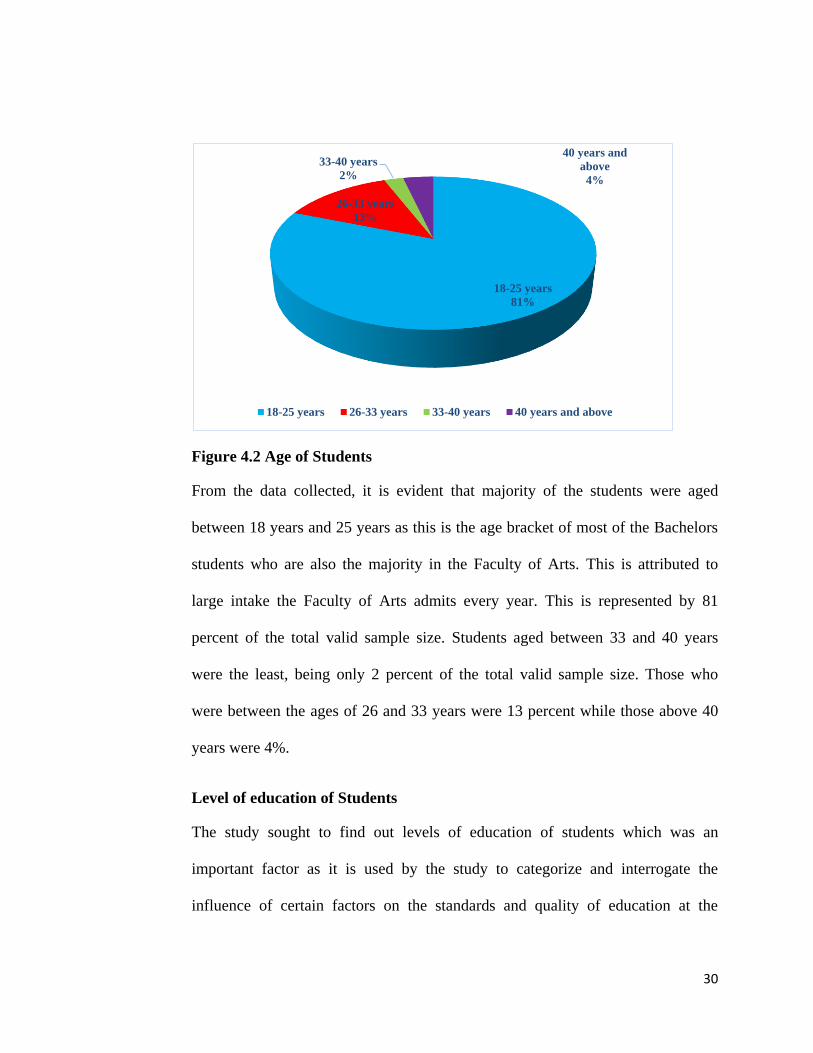
Figure 4.2 Age of Students
From the data collected, it is evident that majority of the students were aged
between 18 years and 25 years as this is the age bracket of most of the Bachelors
students who are also the majority in the Faculty of Arts. This is attributed to
large intake the Faculty of Arts admits every year. This is represented by 81
percent of the total valid sample size. Students aged between 33 and 40 years
were the least, being only 2 percent of the total valid sample size. Those who
were between the ages of 26 and 33 years were 13 percent while those above 40
years were 4%.
Level of education of Students
The study sought to find out levels of education of students which was an
important factor as it is used by the study to categorize and interrogate the
influence of certain factors on the standards and quality of education at the
18-25 years
81%
26-33 years
13%
33-40 years
2%
40 years and
above
4%
18-25 years 26-33 years 33-40 years 40 years and above
31
different levels of study. Table 4.2 shows students at different levels of education
in the Faculty of Arts.
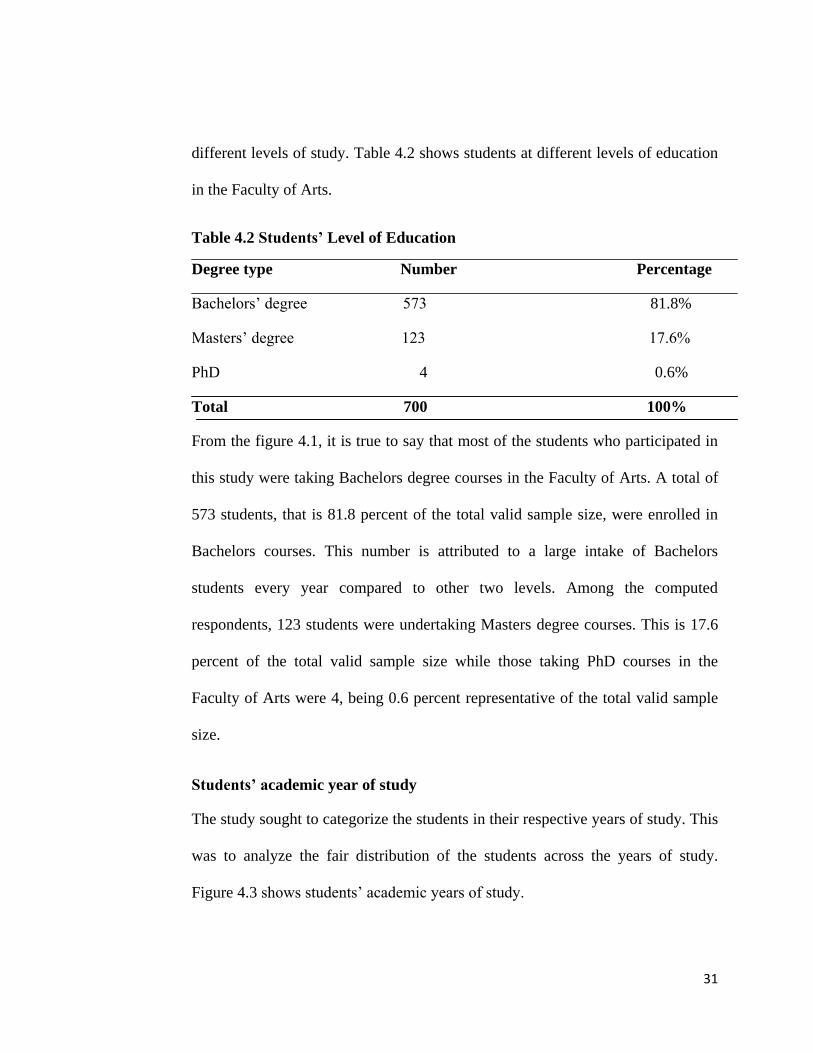
Table 4.2 Students’ Level of Education
Degree type Number Percentage
Bachelors‟ degree 573 81.8%
Masters‟ degree 123 17.6%
PhD 4 0.6%
Total 700 100%
From the figure 4.1, it is true to say that most of the students who participated in
this study were taking Bachelors degree courses in the Faculty of Arts. A total of
573 students, that is 81.8 percent of the total valid sample size, were enrolled in
Bachelors courses. This number is attributed to a large intake of Bachelors
students every year compared to other two levels. Among the computed
respondents, 123 students were undertaking Masters degree courses. This is 17.6
percent of the total valid sample size while those taking PhD courses in the
Faculty of Arts were 4, being 0.6 percent representative of the total valid sample
size.
Students’ academic year of study
The study sought to categorize the students in their respective years of study. This
was to analyze the fair distribution of the students across the years of study.
Figure 4.3 shows students‟ academic years of study.
32
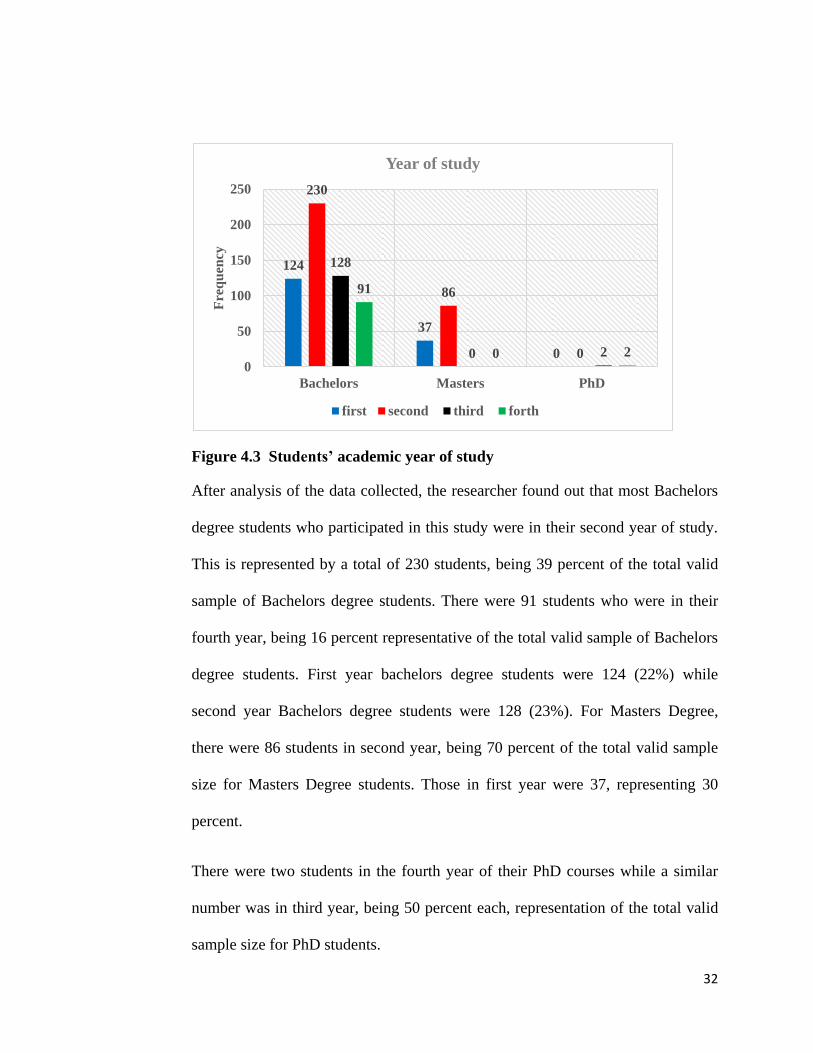
Figure 4.3 Students’ academic year of study
After analysis of the data collected, the researcher found out that most Bachelors
degree students who participated in this study were in their second year of study.
This is represented by a total of 230 students, being 39 percent of the total valid
sample of Bachelors degree students. There were 91 students who were in their
fourth year, being 16 percent representative of the total valid sample of Bachelors
degree students. First year bachelors degree students were 124 (22%) while
second year Bachelors degree students were 128 (23%). For Masters Degree,
there were 86 students in second year, being 70 percent of the total valid sample
size for Masters Degree students. Those in first year were 37, representing 30
percent.
There were two students in the fourth year of their PhD courses while a similar
number was in third year, being 50 percent each, representation of the total valid
sample size for PhD students.
124
37
0
230
86
0
128
0 2
91
0 2 0
50
100
150
200
250
Bachelors Masters PhD
Fre
qu
ency
Year of study
first second third forth

33
4.4 Lecturer-student ratio
In understanding the position of the objectives of this study, the study ventured to
find out the lecturer-student ratio in the Faculty of Arts, University of Nairobi.
The analysis was done individually for Bachelors, Masters and PhD students.
Lecturers availability for individualized assistance and tutorials
The study focused on finding out the level of availability of lecturers for
individualized assistance and tutorials for students as a means of enhance quality
of the learning process for Bachelors students.
Figure 4.4 shows lecturers availability for individualized assistance for Bachelors
students.
Figure 4.4 Lecturer availability for individualized assistance for Bachelors
students
yes
24%
no
76%
Lecturers availability for individualized
assistance
yes no
34
From a total of 573 students, 137 students admitted that lecturers were adequately
available for individualized assistance. This represents 24 percent of the cases
while a whopping 436 students (76%) cited that lecturers were not available for
individualized assistance. This was informed by the fact that the large number of
students enrolled in bachelors degree programmes limits the level of
individualized assistance by lectures. Roy & Jamison, 1976 indicates that this is a
sign of decreasing quality if lecturers are not available for individualized
assistance for bachelors degree students.
Lecturer availability for masters students
The study sought to know from masters degree students if lecturers were available
for individualized assistance. Figure 4.5 shows lecturers availability for
individualized assistance for masters students.
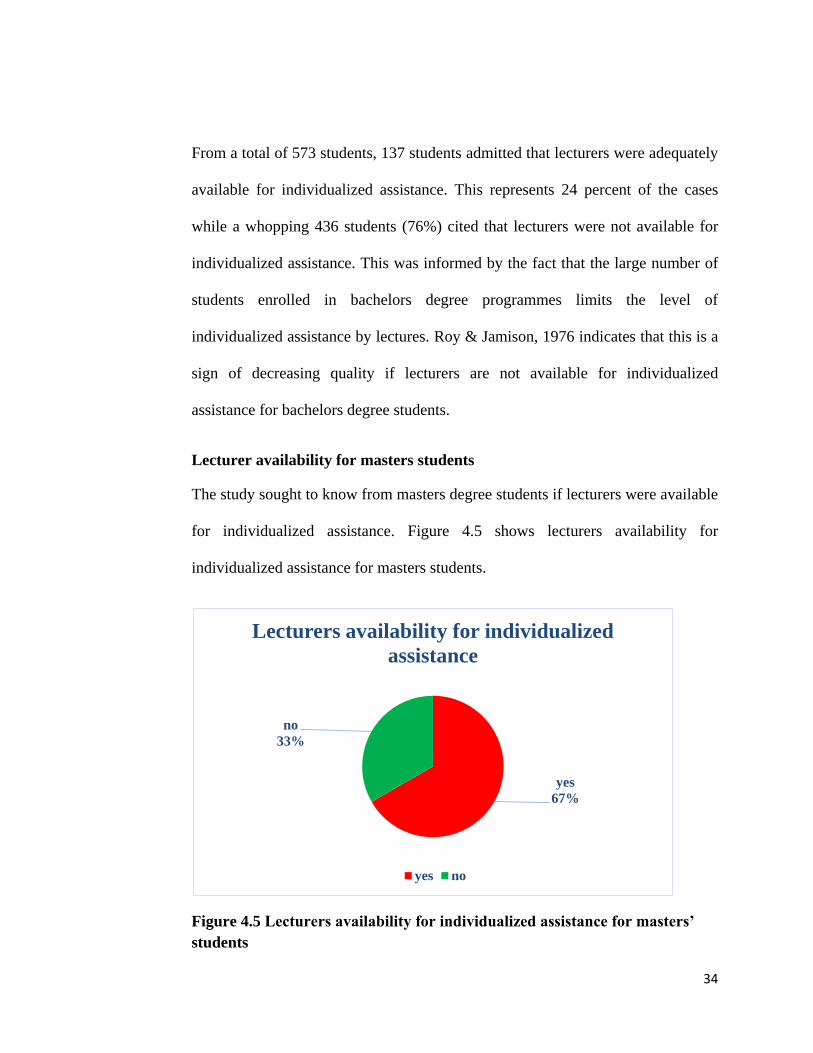
Figure 4.5 Lecturers availability for individualized assistance for masters’
students
yes
67%
no
33%
Lecturers availability for individualized
assistance
yes no
35
Masters students also shared in the sentiments regarding lecturer availability.
From a total of 123 students, 82 students cited the availability of lecturers for
individualized assistance. This is 67 percent representation of the total valid
sample size for masters students. A total of 41 students reported that there were
no lecturers available for individualized assistance. It is worth noting that there
was 100% lecturer availability for individualized assistance for PhD students as
all the PhD students gave positive answers. This denotes that there is more effort
made towards PhD studies in the Faculty of Arts by the respective lecturers.
Lecturer student ratio for postgraduate students varies from 1:1 to about 1:50 to
guarantee quality for the postgraduates (Dean, Faculty of Arts) The increase in
faculty-student ratio indicates a sign of increasing quality (Roy & Jamison, 1976)
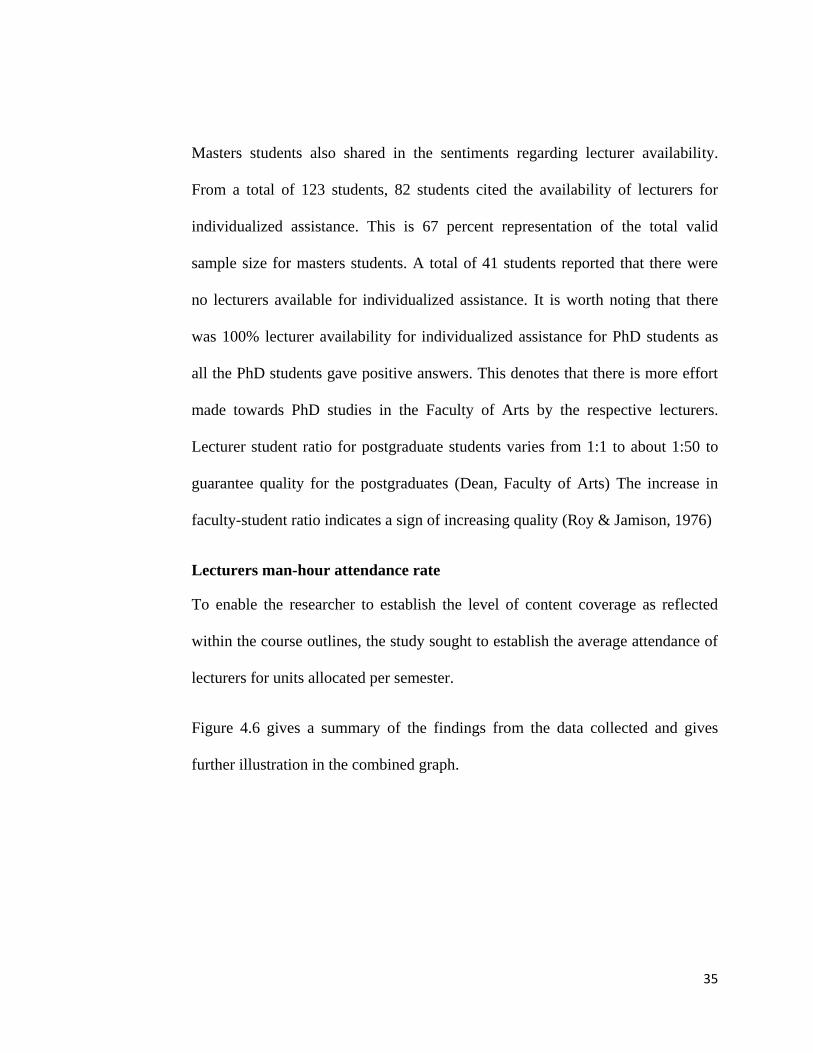
Lecturers man-hour attendance rate
To enable the researcher to establish the level of content coverage as reflected
within the course outlines, the study sought to establish the average attendance of
lecturers for units allocated per semester.
Figure 4.6 gives a summary of the findings from the data collected and gives
further illustration in the combined graph.
36
Figure 4.6 Lecturers man-hour attendance rate
Among the Bachelors students, an analysis of the data shows that 199 students
cited below 50 percent man hour attendance rate by lecturers. This represents
35% of the total sample size for Bachelors students. 374 students or 65 percent of
the total valid sample size cited above 50 percent man-hour attendance rate by
lecturers in the Faculty of Arts, University of Nairobi. Among the masters
students, 29 students cited below 50 percent man-hour attendance rate, being 24
percent representative of the total sample size while 94 students (76%) cited
above 50 percent man-hour attendance rate by lecturers. For the PhD students,
there was excellent man-hour attendance rate among lecturers as all the students
cited above 50 percent man-hour attendance rate. This is a good indication that
more than half of the content was covered which shows that there is quality
education being offered and that lecturers are committed to attending lectures.
199
29 0
374
94
4 0
50
100
150
200
250
300
350
400
Bachelors Masters PhD
Lecturers man-hour attendance rate
Below 50% Above 50%
37
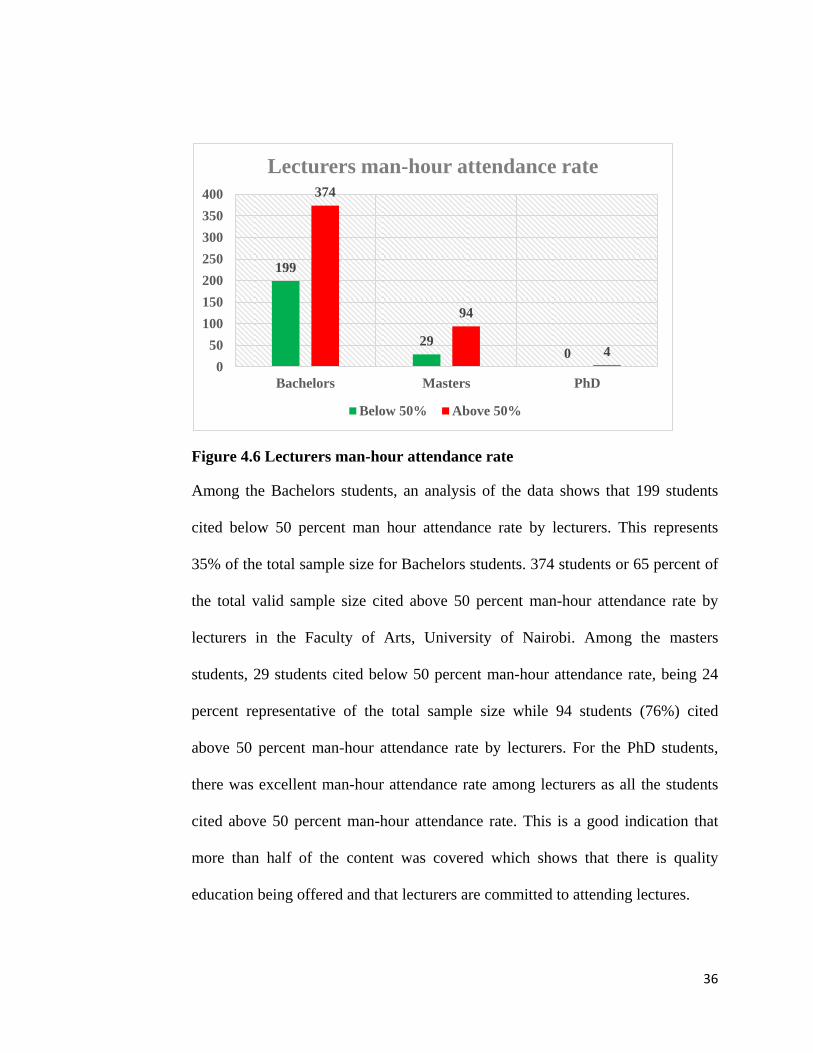
Course content coverage per unit
An analysis of the course content coverage per unit gives insight into how much
amount of the syllabus for each unit is covered and in turn, how does this affect
the overall outcome or performance of the students.
Figure 4.7 shows the course content coverage for Bachelors degree students in the
Faculty of Arts.
Figure 4.7 Course content coverage rating by bachelors degree students
Bachelor students reported on a higher side, average coverage of their course
content. 278 students or 48 percent of the bachelors students rated the course
content on average. On the other hand 136 bachelors students (24 percent) rated
the course content coverage as above average. 159 students (28%) rated the
course content coverage as being below average.
Below average
28%
Average
48%
Above
average
24%
Below average Average Above average

38
Figure 4.8 shows course content coverage rating by masters students.
Figure 4.8 Course content coverage rating by masters students
There was a good rating of the course content coverage with regard to masters
students. From the total sample size, 57 students rated the course content coverage
as average. This was 46 percent of the total sample size. 43 students (35 percent)
rated course content coverage as above average while only 23 students (19
percent) rated course content coverage as below average.
Course content coverage for PhD students
The course content coverage for PhD students was excellent as all the students
rated it as above average. This shows that the lecturers put in more effort in
ensuring that course content coverage per unit is done to maximum completion.
This therefore means that course content coverage was good based on the
cumulative positive scores deducted from the analyzed data of all categories of
students. This also is an indicator of quality education in the Faculty of Arts.
Below average
19%
Average
46%
Above average
35%
Below average Average Above average
39
4.5 Internet access
Access to internet enables one to have at their disposal, tools for accessing online
study and research materials. The study interrogated the level of internet access
among students who participated in this study, and gives the following analysis.
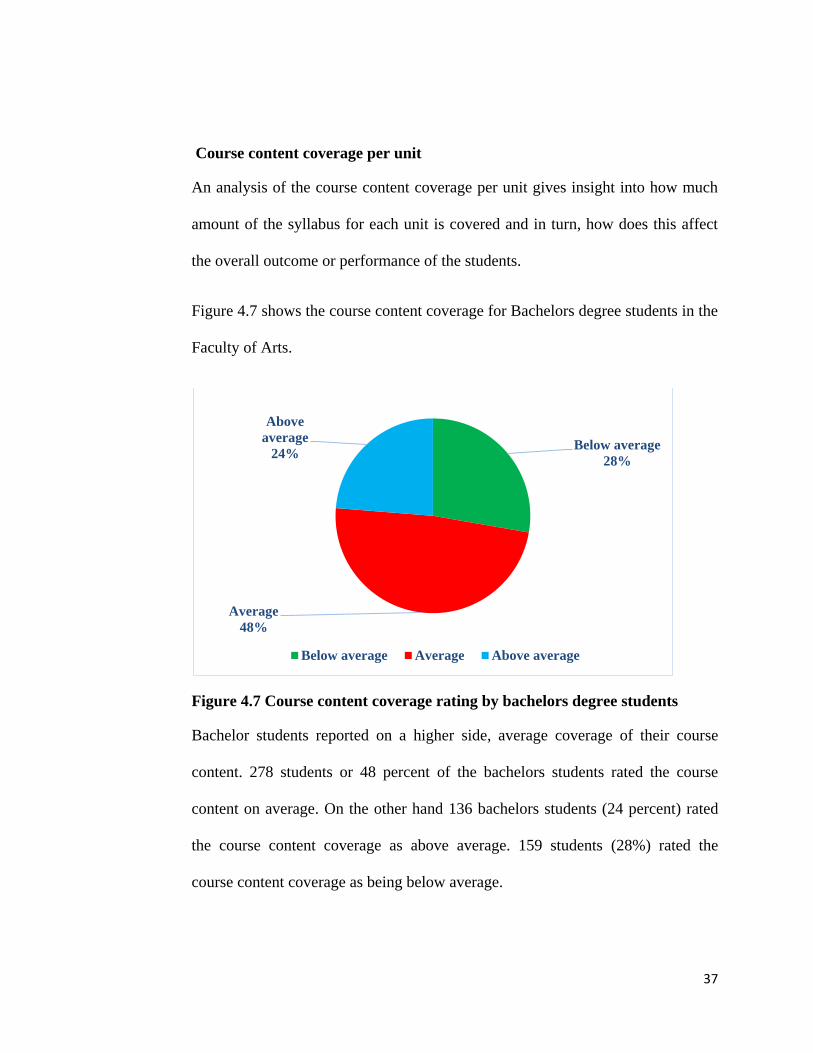
Internet usage frequency
This aspect gives insight into the frequency of internet usage among students in
the Faculty of Arts, University of Nairobi. Internet usage frequency here was
measured in terms of daily usage, weekly, monthly and no usage at all.
Figure 4.9 shows the internet usage frequency among Bachelors degree students
Figure 4.9 Internet usage frequencies among Bachelors degree students.
For bachelors degree students, there was a high number of students who use
internet more frequently on a weekly basis. This was recorded in 322 students,
representing 565 of the total valid sample of bachelors degree students. Those
162
322
73
16
0
50
100
150
200
250
300
350
Dailly Weekly Monthly Not at all
Freq
uen
cy
40
who did not use internet at all were 16, being only 3% of the total valid sample.
Students who used internet on a daily basis were 162 (28%) while those who used
internet on a monthly basis were 73, being 13 percent representation of the total
valid sample size.
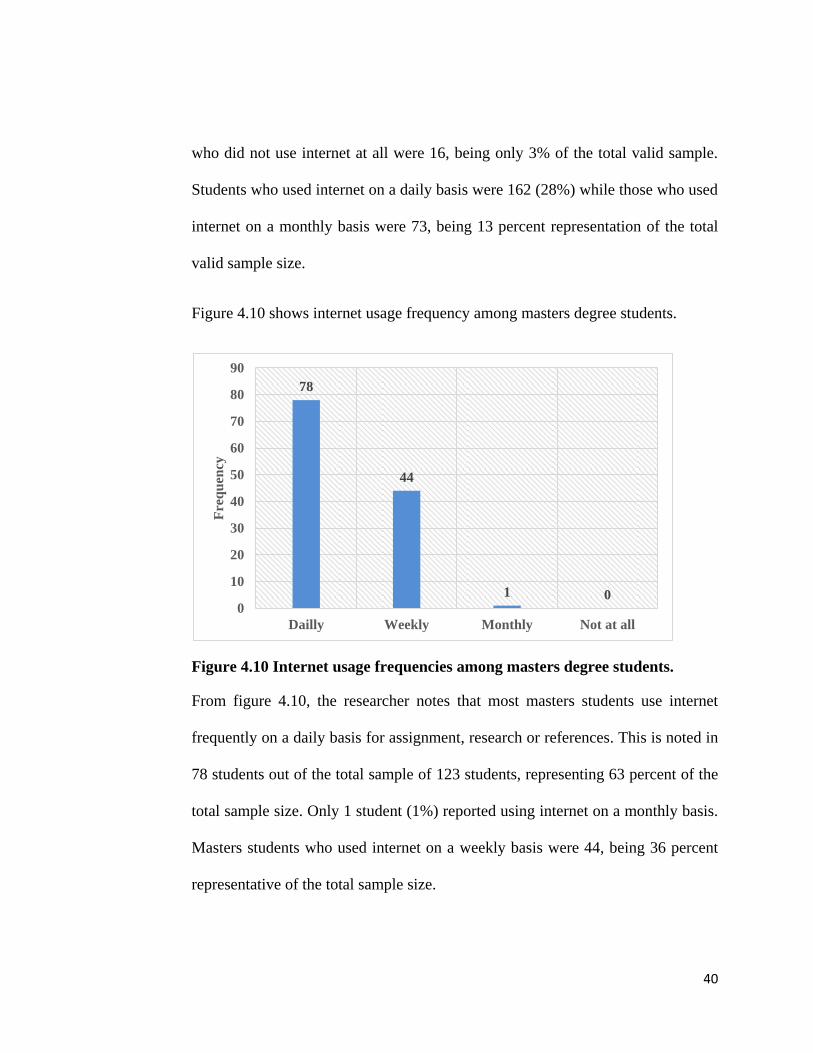
Figure 4.10 shows internet usage frequency among masters degree students.
Figure 4.10 Internet usage frequencies among masters degree students.
From figure 4.10, the researcher notes that most masters students use internet
frequently on a daily basis for assignment, research or references. This is noted in
78 students out of the total sample of 123 students, representing 63 percent of the
total sample size. Only 1 student (1%) reported using internet on a monthly basis.
Masters students who used internet on a weekly basis were 44, being 36 percent
representative of the total sample size.
78
44
1 0 0
10
20
30
40
50
60
70
80
90
Dailly Weekly Monthly Not at all
Fre
qu
ency
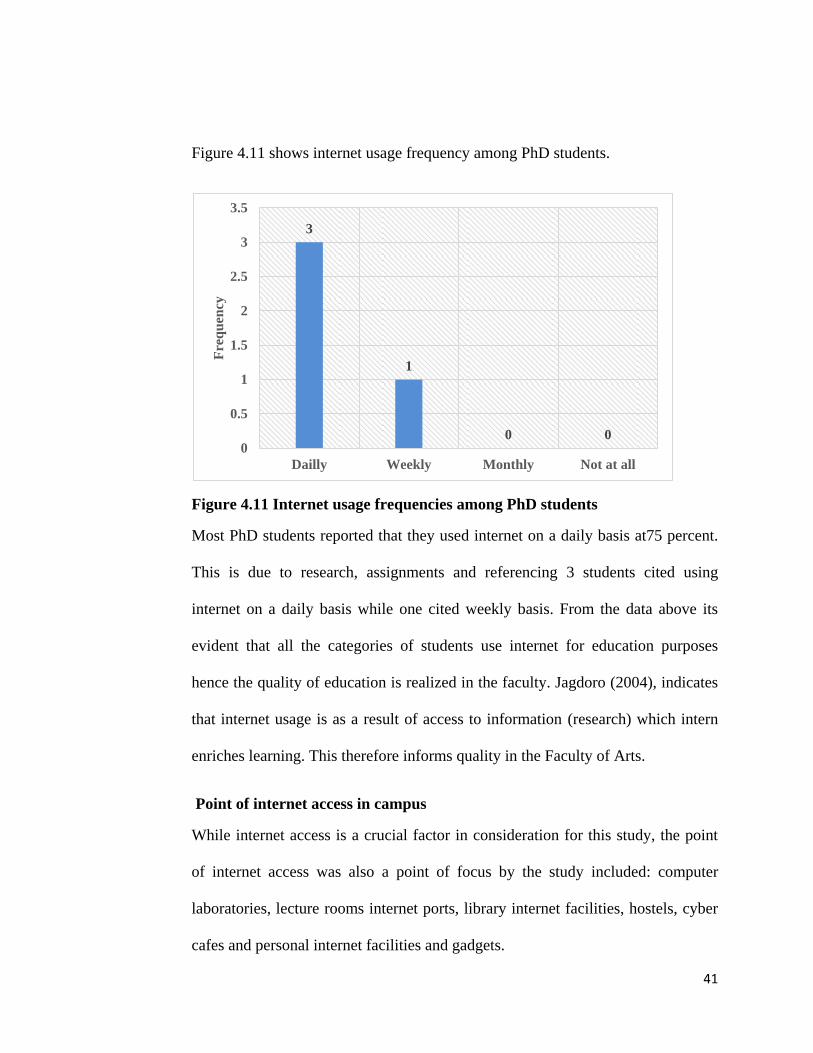
41
Figure 4.11 shows internet usage frequency among PhD students.
Figure 4.11 Internet usage frequencies among PhD students
Most PhD students reported that they used internet on a daily basis at75 percent.
This is due to research, assignments and referencing 3 students cited using
internet on a daily basis while one cited weekly basis. From the data above its
evident that all the categories of students use internet for education purposes
hence the quality of education is realized in the faculty. Jagdoro (2004), indicates
that internet usage is as a result of access to information (research) which intern
enriches learning. This therefore informs quality in the Faculty of Arts.
Point of internet access in campus
While internet access is a crucial factor in consideration for this study, the point
of internet access was also a point of focus by the study included: computer
laboratories, lecture rooms internet ports, library internet facilities, hostels, cyber
cafes and personal internet facilities and gadgets.
3
1
0 0 0
0.5
1
1.5
2
2.5
3
3.5
Dailly Weekly Monthly Not at all
Fre
qu
ency
42
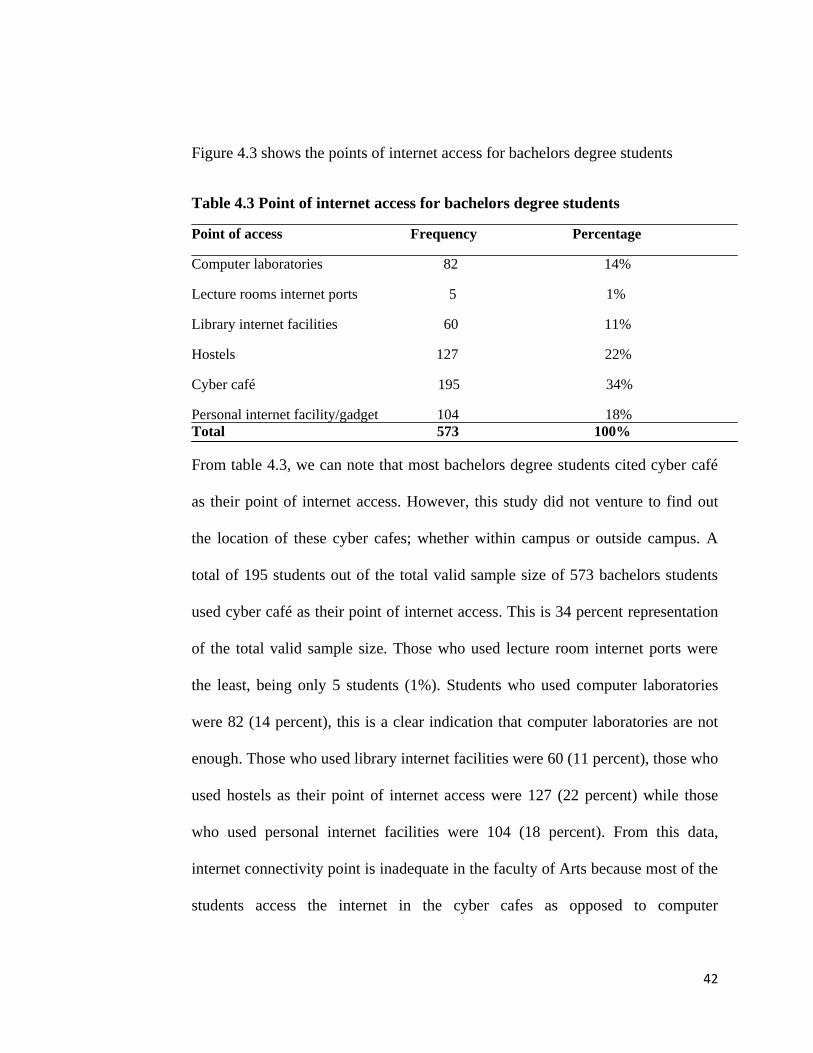
Figure 4.3 shows the points of internet access for bachelors degree students
Table 4.3 Point of internet access for bachelors degree students
Point of access Frequency Percentage
Computer laboratories 82 14%
Lecture rooms internet ports 5 1%
Library internet facilities 60 11%
Hostels 127 22%
Cyber café 195 34%
Personal internet facility/gadget 104 18%
Total 573 100%
From table 4.3, we can note that most bachelors degree students cited cyber café
as their point of internet access. However, this study did not venture to find out
the location of these cyber cafes; whether within campus or outside campus. A
total of 195 students out of the total valid sample size of 573 bachelors students
used cyber café as their point of internet access. This is 34 percent representation
of the total valid sample size. Those who used lecture room internet ports were
the least, being only 5 students (1%). Students who used computer laboratories
were 82 (14 percent), this is a clear indication that computer laboratories are not
enough. Those who used library internet facilities were 60 (11 percent), those who
used hostels as their point of internet access were 127 (22 percent) while those
who used personal internet facilities were 104 (18 percent). From this data,
internet connectivity point is inadequate in the faculty of Arts because most of the
students access the internet in the cyber cafes as opposed to computer
43
laboratories. ACTIC, (2004) indicates that internet connectivity in universities in
Africa was too little, too expensive and poorly managed.
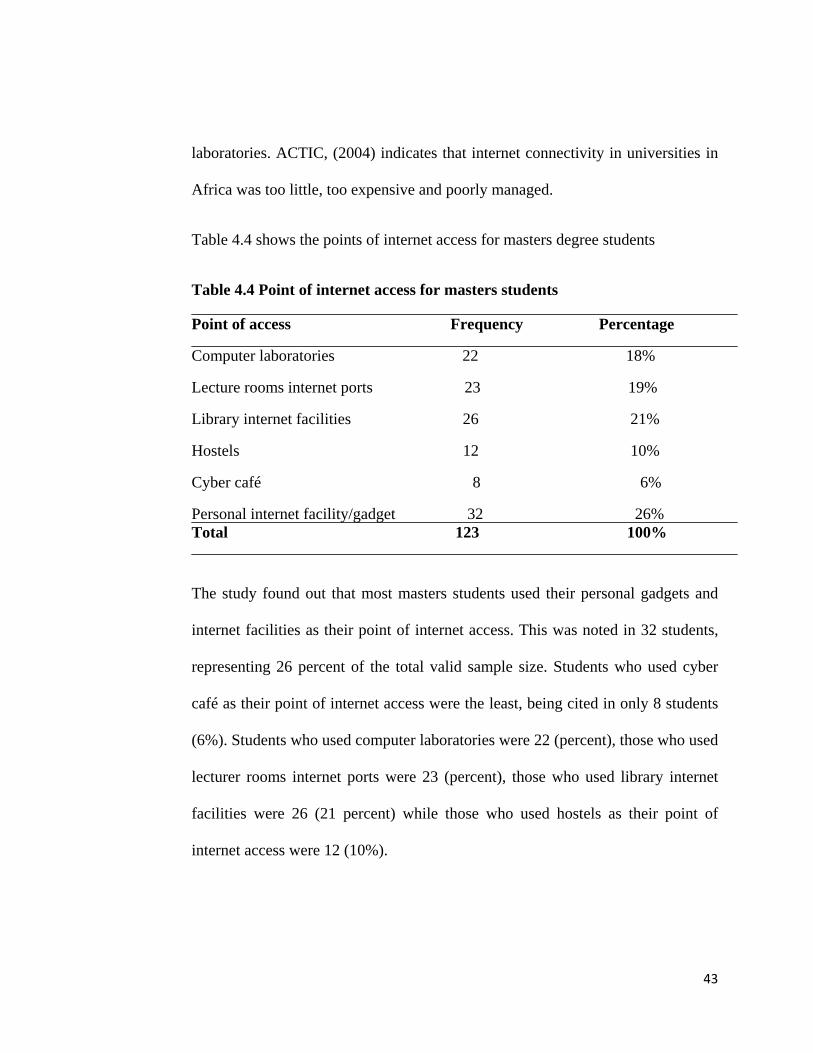
Table 4.4 shows the points of internet access for masters degree students
Table 4.4 Point of internet access for masters students
Point of access Frequency Percentage
Computer laboratories 22 18%
Lecture rooms internet ports 23 19%
Library internet facilities 26 21%
Hostels 12 10%
Cyber café 8 6%
Personal internet facility/gadget 32 26%
Total 123 100%
The study found out that most masters students used their personal gadgets and
internet facilities as their point of internet access. This was noted in 32 students,
representing 26 percent of the total valid sample size. Students who used cyber
café as their point of internet access were the least, being cited in only 8 students
(6%). Students who used computer laboratories were 22 (percent), those who used
lecturer rooms internet ports were 23 (percent), those who used library internet
facilities were 26 (21 percent) while those who used hostels as their point of
internet access were 12 (10%).
44
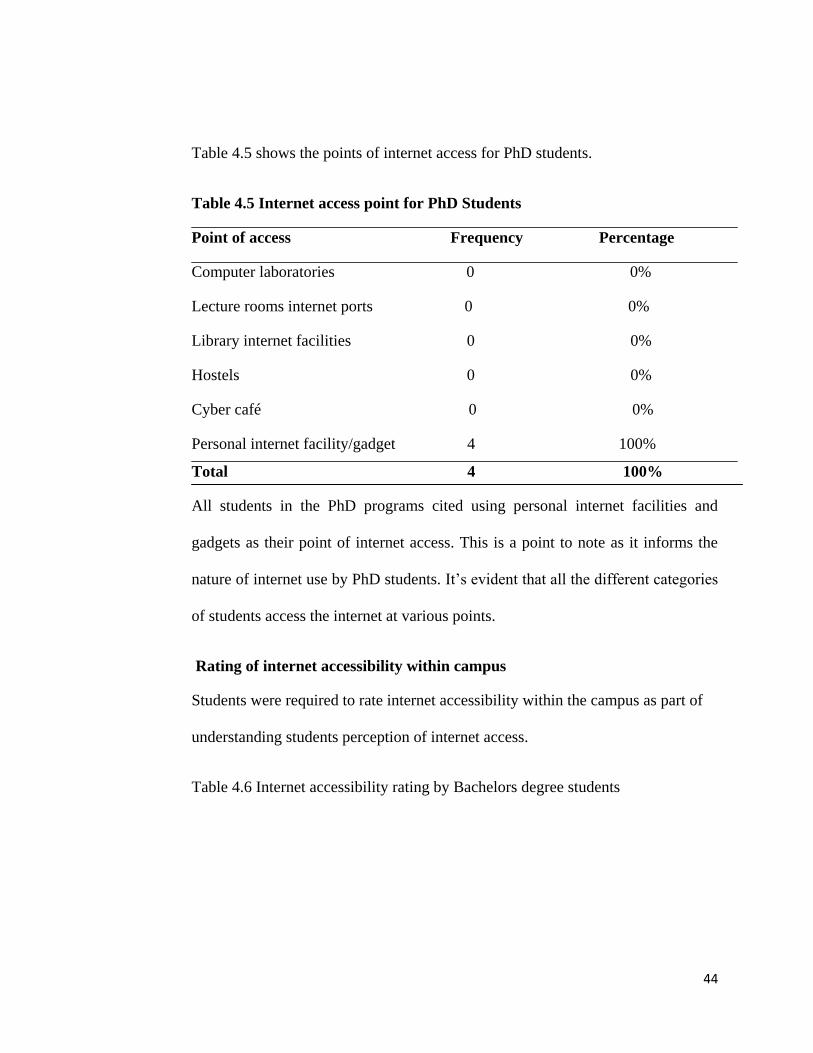
Table 4.5 shows the points of internet access for PhD students.
Table 4.5 Internet access point for PhD Students
Point of access Frequency Percentage
Computer laboratories 0 0%
Lecture rooms internet ports 0 0%
Library internet facilities 0 0%
Hostels 0 0%
Cyber café 0 0%
Personal internet facility/gadget 4 100%
Total 4 100%
All students in the PhD programs cited using personal internet facilities and
gadgets as their point of internet access. This is a point to note as it informs the
nature of internet use by PhD students. It‟s evident that all the different categories
of students access the internet at various points.
Rating of internet accessibility within campus
Students were required to rate internet accessibility within the campus as part of
understanding students perception of internet access.
Table 4.6 Internet accessibility rating by Bachelors degree students
45
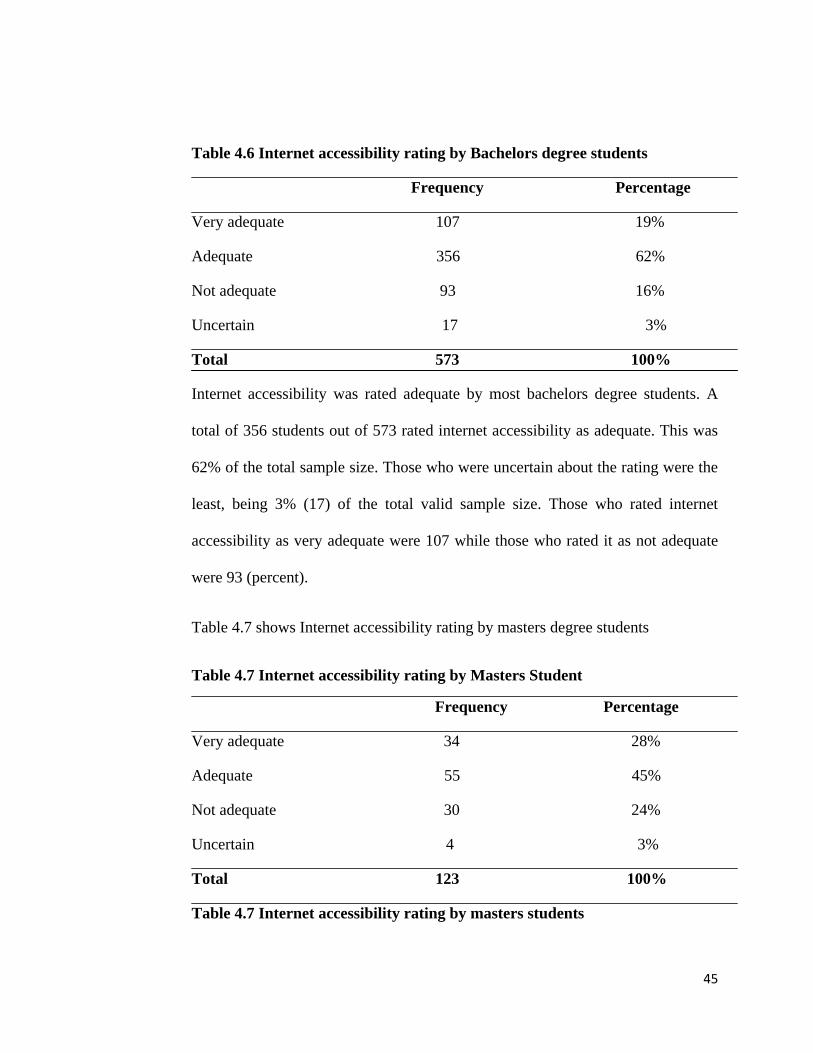
Table 4.6 Internet accessibility rating by Bachelors degree students
Frequency Percentage
Very adequate 107 19%
Adequate 356 62%
Not adequate 93 16%
Uncertain 17 3%
Total 573 100%
Internet accessibility was rated adequate by most bachelors degree students. A
total of 356 students out of 573 rated internet accessibility as adequate. This was
62% of the total sample size. Those who were uncertain about the rating were the
least, being 3% (17) of the total valid sample size. Those who rated internet
accessibility as very adequate were 107 while those who rated it as not adequate
were 93 (percent).
Table 4.7 shows Internet accessibility rating by masters degree students
Table 4.7 Internet accessibility rating by Masters Student
Frequency Percentage
Very adequate 34 28%
Adequate 55 45%
Not adequate 30 24%
Uncertain 4 3%
Total 123 100%
Table 4.7 Internet accessibility rating by masters students
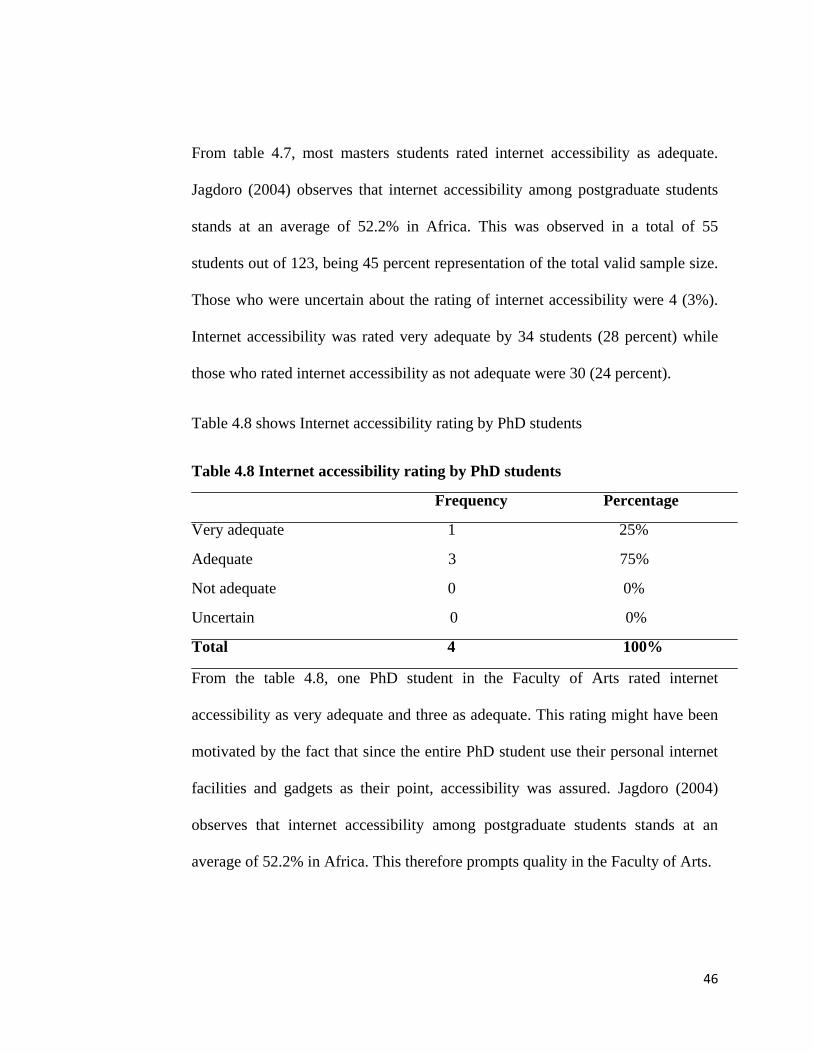
46
From table 4.7, most masters students rated internet accessibility as adequate.
Jagdoro (2004) observes that internet accessibility among postgraduate students
stands at an average of 52.2% in Africa. This was observed in a total of 55
students out of 123, being 45 percent representation of the total valid sample size.
Those who were uncertain about the rating of internet accessibility were 4 (3%).
Internet accessibility was rated very adequate by 34 students (28 percent) while
those who rated internet accessibility as not adequate were 30 (24 percent).
Table 4.8 shows Internet accessibility rating by PhD students
Table 4.8 Internet accessibility rating by PhD students
Frequency Percentage
Very adequate 1 25%
Adequate 3 75%
Not adequate 0 0%
Uncertain 0 0%
Total 4 100%
From the table 4.8, one PhD student in the Faculty of Arts rated internet
accessibility as very adequate and three as adequate. This rating might have been
motivated by the fact that since the entire PhD student use their personal internet
facilities and gadgets as their point, accessibility was assured. Jagdoro (2004)
observes that internet accessibility among postgraduate students stands at an
average of 52.2% in Africa. This therefore prompts quality in the Faculty of Arts.
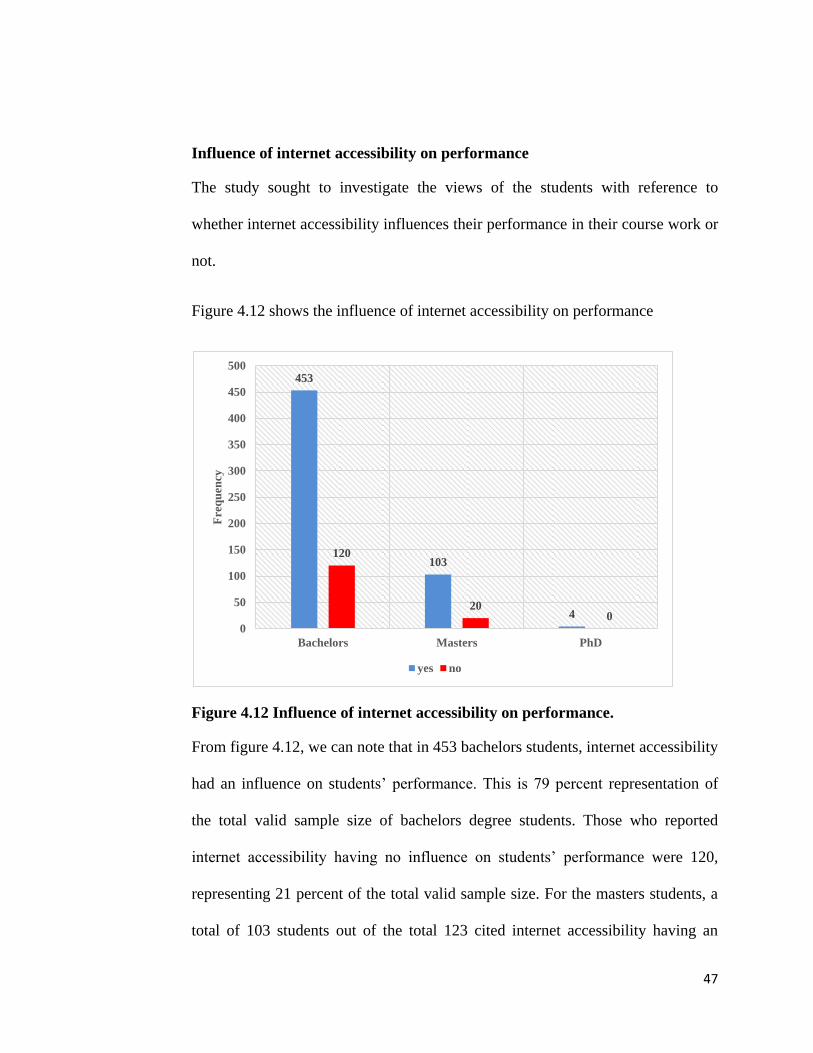
47
Influence of internet accessibility on performance
The study sought to investigate the views of the students with reference to
whether internet accessibility influences their performance in their course work or
not.
Figure 4.12 shows the influence of internet accessibility on performance
Figure 4.12 Influence of internet accessibility on performance.
From figure 4.12, we can note that in 453 bachelors students, internet accessibility
had an influence on students‟ performance. This is 79 percent representation of
the total valid sample size of bachelors degree students. Those who reported
internet accessibility having no influence on students‟ performance were 120,
representing 21 percent of the total valid sample size. For the masters students, a
total of 103 students out of the total 123 cited internet accessibility having an
453
103
4
120
20 0
0
50
100
150
200
250
300
350
400
450
500
Bachelors Masters PhD
Freq
uen
cy
yes no
48
influence on students‟ performance. This was 84 percent of the total sample size.
Those who cited internet accessibility having no influence on students‟
performance were 20 (16 percent). All the PhD students reported that internet
accessibility had an influence on students‟ performance especially for purposes of
research for the postgraduate students. These responses therefore indicate that
there is a strong positive relationship between internet access and knowledge
among all the students. Information and communication technology (ICT)
constitutes an input in the student learning process that should help produce better
learning output by making it possible for students to access books and journals,
carry out assignments online, make references, stay in touch with lecturers
throughout the learning period (Fuchs and Woessman, 2004; Etim, 2006).
4.6 Availability of Teaching-Learning Resources
Students were asked to rate the availability of the various teaching and learning
resources provided by the university. The study sought to know from bachelors
degree students if they had adequate resources.
Table 4.9 shows the availability of Teaching-Learning resources for bachelors
degree students
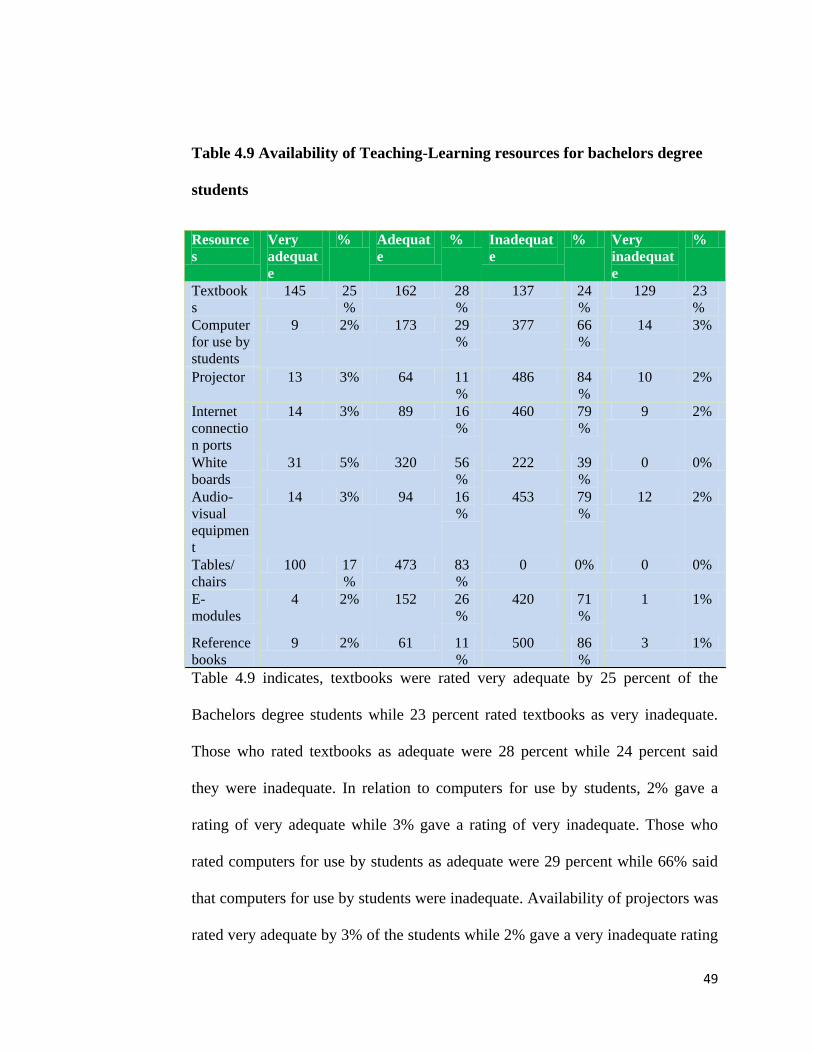
49
Table 4.9 Availability of Teaching-Learning resources for bachelors degree
students
Resource
s
Very
adequat
e
% Adequat
e
% Inadequat
e
% Very
inadequat
e
%
Textbook
s
145 25
%
162 28
%
137 24
%
129 23
%
Computer
for use by
students
9 2% 173 29
%
377 66
%
14 3%
Projector 13 3% 64 11
%
486 84
%
10 2%
Internet
connectio
n ports
14 3% 89 16
%
460 79
%
9 2%
White
boards
31 5% 320 56
%
222 39
%
0 0%
Audio-
visual
equipmen
t
14 3% 94 16
%
453 79
%
12 2%
Tables/
chairs
100 17
%
473 83
%
0 0% 0 0%
E-
modules
4 2% 152 26
%
420 71
%
1 1%
Reference
books
9 2% 61 11
%
500 86
%
3 1%
Table 4.9 indicates, textbooks were rated very adequate by 25 percent of the
Bachelors degree students while 23 percent rated textbooks as very inadequate.
Those who rated textbooks as adequate were 28 percent while 24 percent said
they were inadequate. In relation to computers for use by students, 2% gave a
rating of very adequate while 3% gave a rating of very inadequate. Those who
rated computers for use by students as adequate were 29 percent while 66% said
that computers for use by students were inadequate. Availability of projectors was
rated very adequate by 3% of the students while 2% gave a very inadequate rating
50
of projectors. Those who rated availability of projectors as adequate were 11
percent while 84 percent said projectors were inadequate. Internet connection
ports were rated very adequate by 3% while 2% gave a rating of very inadequate.
Those who rated internet connection ports as adequate were 16 percent while 79
percent said internet connection ports were inadequate. Availability of white
boards was rated as very adequate by 5% of the students while 0% rated the white
boards as very inadequate. 56 percent gave a rating of white boards as adequate
while 39 percent rated the white boards as inadequate. With regard to audio-visual
equipment, 3% of the students cited the audio-visual equipment as very adequate
while 2% rated them as very inadequate. 16 percent rated audio-visual equipment
as adequate while 79 percent said the audio-visual equipment were inadequate.
Tables and chairs were rated as adequate by 17 percent of the students while 0%
rated them as very inadequate. 83 percent rated tables and chairs as adequate
while 0% said they were inadequate. E-modules were rated as very adequate by
2% of the total students while 1% said that e-modules were inadequate. 26 percent
rated e-modules as adequate while 71 percent said that e-modules were
inadequate. Reference books were rated as adequate by 2% while 1% said that
reference books were rated as very inadequate. 11 percent of the students rated
reference books as adequate while 86 percent said reference books were
inadequate. This is attributed to high number of undergraduate students in the
faculty verses few teaching and learning resources. In a nut shell, teaching-
learning resources are inadequate which therefore has an implication of quality
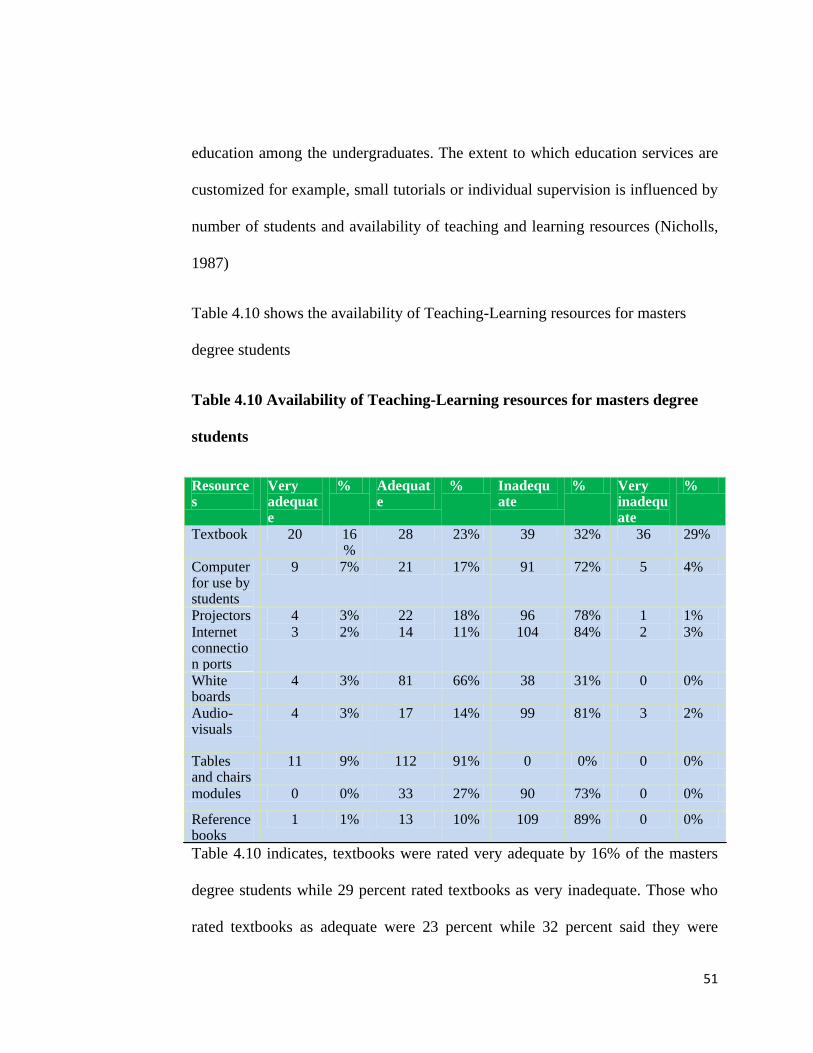
51
education among the undergraduates. The extent to which education services are
customized for example, small tutorials or individual supervision is influenced by
number of students and availability of teaching and learning resources (Nicholls,
1987)
Table 4.10 shows the availability of Teaching-Learning resources for masters
degree students
Table 4.10 Availability of Teaching-Learning resources for masters degree
students
Resources
Very adequate
% Adequate
% Inadequate
% Very inadequate
%
Textbook 20 16%
28 23% 39 32% 36 29%
Computer for use by students
9 7% 21 17% 91 72% 5 4%
Projectors 4 3% 22 18% 96 78% 1 1%
Internet connection ports
3 2% 14 11% 104 84% 2 3%
White boards
4 3% 81 66% 38 31% 0 0%
Audio-visuals
4 3% 17 14% 99 81% 3 2%
Tables and chairs
11 9% 112 91% 0 0% 0 0%
modules 0 0% 33 27% 90 73% 0 0%
Reference books
1 1% 13 10% 109 89% 0 0%
Table 4.10 indicates, textbooks were rated very adequate by 16% of the masters
degree students while 29 percent rated textbooks as very inadequate. Those who
rated textbooks as adequate were 23 percent while 32 percent said they were
52
inadequate. In relation to computers for use by students, 7% gave a rating of very
adequate while 4% gave a rating of very inadequate. Those who rated computers
for use by students as adequate were 17 percent while 72 percent said that
computers for use by students were inadequate. Availability of projectors was
rated very adequate by 3% of the students while 1% gave a very inadequate rating
of projectors. Those who rated availability of projectors as adequate were 18%
while 78% said projectors were inadequate. Internet connection ports were rated
very adequate by 2% while 3% gave a rating of very inadequate. Those who rated
internet connection ports as adequate were 11% while 84% said internet
connection ports were inadequate. Availability of white boards was rated as very
adequate by 3% of the students while 0% rated the white boards as very
inadequate. 66 percent gave a rating of white boards as adequate while 31 percent
rated the white boards as inadequate. With regard to audio-visual equipment, 3%
of the students cited the audio-visual equipment as very adequate while 2% rated
them as very inadequate. 14 percent rated audio-visual equipment as adequate
while 81 percent said the audio-visual equipment were inadequate.
Tables and chairs were rated as adequate by 9% of the students while 0% rated
them as very inadequate. 91 percent rated tables and chairs as adequate while 0%
said they were inadequate. E-modules were rated as very adequate by 0% of the
total students while 0% said that e-modules were inadequate. 27 percent rated e-
modules as adequate while 73 percent said that e-modules were inadequate.
Reference books were rated as adequate by 1% while 0% said that reference
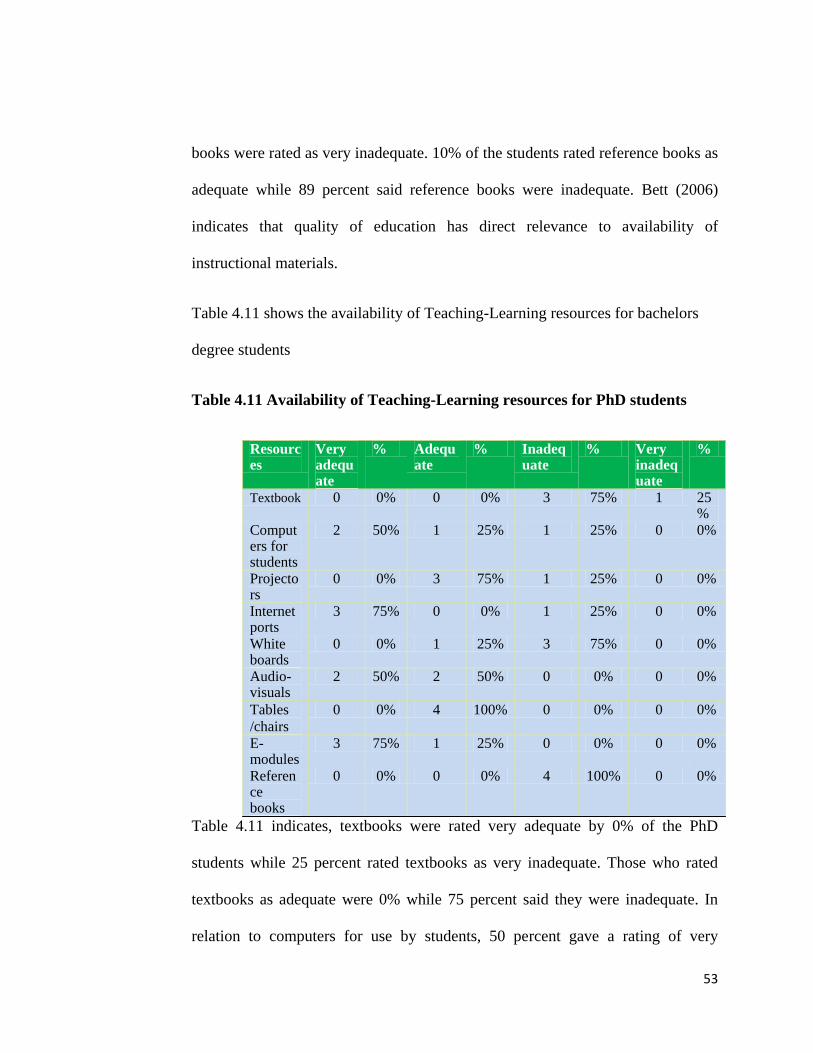
53
books were rated as very inadequate. 10% of the students rated reference books as
adequate while 89 percent said reference books were inadequate. Bett (2006)
indicates that quality of education has direct relevance to availability of
instructional materials.
Table 4.11 shows the availability of Teaching-Learning resources for bachelors
degree students
Table 4.11 Availability of Teaching-Learning resources for PhD students
Resources
Very adequate
% Adequate
% Inadequate
% Very inadequate
%
Textbook 0 0% 0 0% 3 75% 1 25%
Computers for students
2 50% 1 25% 1 25% 0 0%
Projectors
0 0% 3 75% 1 25% 0 0%
Internet ports
3 75% 0 0% 1 25% 0 0%
White boards
0 0% 1 25% 3 75% 0 0%
Audio-visuals
2 50% 2 50% 0 0% 0 0%
Tables
/chairs
0 0% 4 100% 0 0% 0 0%
E-modules
3 75% 1 25% 0 0% 0 0%
Reference books
0 0% 0 0% 4 100% 0 0%
Table 4.11 indicates, textbooks were rated very adequate by 0% of the PhD
students while 25 percent rated textbooks as very inadequate. Those who rated
textbooks as adequate were 0% while 75 percent said they were inadequate. In
relation to computers for use by students, 50 percent gave a rating of very
54
adequate while 0% gave a rating of very inadequate. Those who rated computers
for use by students as adequate were 25 percent while 25 percent said that
computers for use by students were inadequate.
Availability of projectors was rated very adequate by 0% of the students while 0%
gave a very inadequate rating of projectors. Those who rated availability of
projectors as adequate were 75 percent while 25 percent said projectors were
inadequate. Internet connection ports were rated very adequate by 75 percent
while 0% gave a rating of very inadequate. Those who rated internet connection
ports as adequate were 0% while 25 percent said internet connection ports were
inadequate. Availability of white boards was rated as very adequate by 0% of the
students while 0% rated the white boards as very inadequate. 25 percent gave a
rating of white boards as adequate while 75 percent rated the white boards as
inadequate. With regard to audio-visual equipment, 50 percent of the students
cited the audio-visual equipment as very adequate. Tables and chairs were rated
as adequate by 0% of the students while 0% rated them as very inadequate. 100
percent rated tables and chairs as adequate while 0% said they were inadequate.
E-modules were rated as very adequate by 75 percent of the total students while
0% said that e-modules were inadequate. 25 percent rated e-modules as adequate
while 0% said that e-modules were inadequate. Reference books were rated as
adequate by 0% while 0% said that reference books were rated as very
inadequate. 100 percent of the students rated reference books as adequate while
0% said reference books were inadequate.
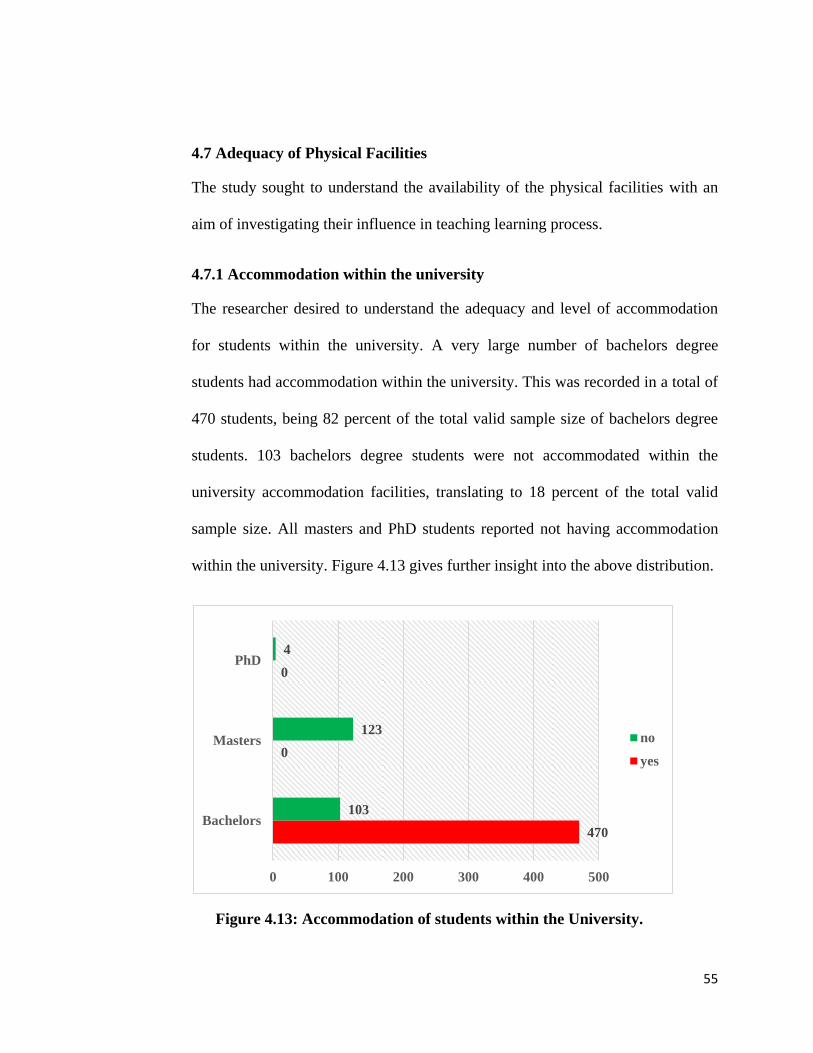
55
4.7 Adequacy of Physical Facilities
The study sought to understand the availability of the physical facilities with an
aim of investigating their influence in teaching learning process.
4.7.1 Accommodation within the university
The researcher desired to understand the adequacy and level of accommodation
for students within the university. A very large number of bachelors degree
students had accommodation within the university. This was recorded in a total of
470 students, being 82 percent of the total valid sample size of bachelors degree
students. 103 bachelors degree students were not accommodated within the
university accommodation facilities, translating to 18 percent of the total valid
sample size. All masters and PhD students reported not having accommodation
within the university. Figure 4.13 gives further insight into the above distribution.
Figure 4.13: Accommodation of students within the University.
470
0
0
103
123
4
0 100 200 300 400 500
Bachelors
Masters
PhD
no
yes

56
4.7.2 How possession of a room affects student’s studies
Having accommodation within the university has an effect on the studies and
performance of students. The study sought to find out the nature of effect of
possessing a room within the university.
Figure 4.14 shows how possession of a room within the university affects
students‟ studies
Figure 4.14: How possession of a room within the university affects students’
studies
Most bachelors degree students reported that possessing a room within the
university had a negative effect on their studies. The study did not venture to find
out the types or kinds of these effects, however, speculation could be that having a
room within the university influences laxity in taking library study session and
promotes socialization within the rooms rather than studying. A total of 445
127
13
3
445
110
1
0 100 200 300 400 500
Bachelors
Masters
PhD
negative
positive
57
bachelors degree students (78 percent) cited negative effects while 127 (22
percent) were of the opinion that having a room within the university has a
positive effect on studies. Among the masters students, 110 students reported
negative effect on studies for those who possessed a room within the university.
This was 89% of the total sample size. Only 13 students (11 percent) cited
positive effects of having a room within the university. Only 1 PhD student
reported negative influence of possessing a room within the university while 3
PhD students were of the opinion that possessing a room within the university had
a positive effect on students‟ studies.
4.7.3 Adequacy of resources in relation to student population
The study ventured to find out the adequacy of resources available in relation to
the population of students within the campus.
Table 4.12 shows Adequacy of resources in relation to Bachelors degree students
population
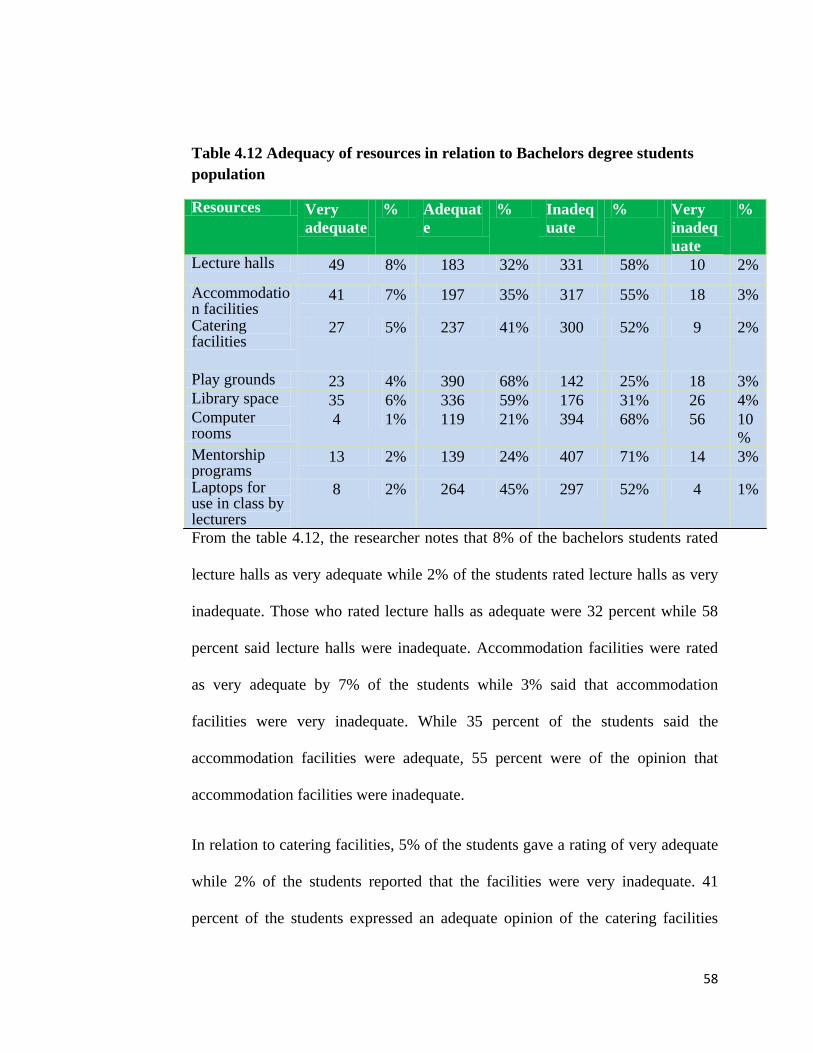
58
Table 4.12 Adequacy of resources in relation to Bachelors degree students
population
Resources Very
adequate
% Adequat
e
% Inadeq
uate
% Very
inadeq
uate
%
Lecture halls 49 8% 183 32% 331 58% 10 2%
Accommodation facilities
41 7% 197 35% 317 55% 18 3%
Catering facilities
27 5% 237 41% 300 52% 9 2%
Play grounds 23 4% 390 68% 142 25% 18 3% Library space 35 6% 336 59% 176 31% 26 4% Computer rooms
4 1% 119 21% 394 68% 56 10
% Mentorship programs
13 2% 139 24% 407 71% 14 3%
Laptops for use in class by lecturers
8 2% 264 45% 297 52% 4 1%
From the table 4.12, the researcher notes that 8% of the bachelors students rated
lecture halls as very adequate while 2% of the students rated lecture halls as very
inadequate. Those who rated lecture halls as adequate were 32 percent while 58
percent said lecture halls were inadequate. Accommodation facilities were rated
as very adequate by 7% of the students while 3% said that accommodation
facilities were very inadequate. While 35 percent of the students said the
accommodation facilities were adequate, 55 percent were of the opinion that
accommodation facilities were inadequate.
In relation to catering facilities, 5% of the students gave a rating of very adequate
while 2% of the students reported that the facilities were very inadequate. 41
percent of the students expressed an adequate opinion of the catering facilities

59
while 52 percent said that the facilities were inadequate. With regard to
playgrounds, 4% of the students felt that playgrounds were very adequate while
3% cited playgrounds to being very inadequate. 68 percent of the students rated
playgrounds as adequate while 25 percent were of the opinion that playgrounds
were inadequate. Library space was rated as very adequate by 6% of the students
while 4% felt that the library space was very inadequate in relation to student
population. 59 percent of the students were of the opinion that library space was
adequate while 31percent felt that library space was inadequate in relation to
student population.
Computer rooms were very adequate to only 1% of the students while 10% felt
that computer rooms were very inadequate. 21 percent of the students rated
computer rooms as adequate while 68 percent were of the opinion that computer
rooms were inadequate. With regard to mentorship programs, 2% of the students
were of the opinion that mentorship programs were very adequate while 3% felt
that mentorship programs were very inadequate. 24 percent rated mentorship
programs as adequate while 71 percent rated them as inadequate. Laptops for
class use by lecturers were rated very adequate by 2% of the students while 1%
were of the opinion that laptops for class use by lecturers were very inadequate.
While 45 percent felt that laptops for class use by lecturers were adequate, 52
percent were of the opinion that they were not adequate in relation to student
population.
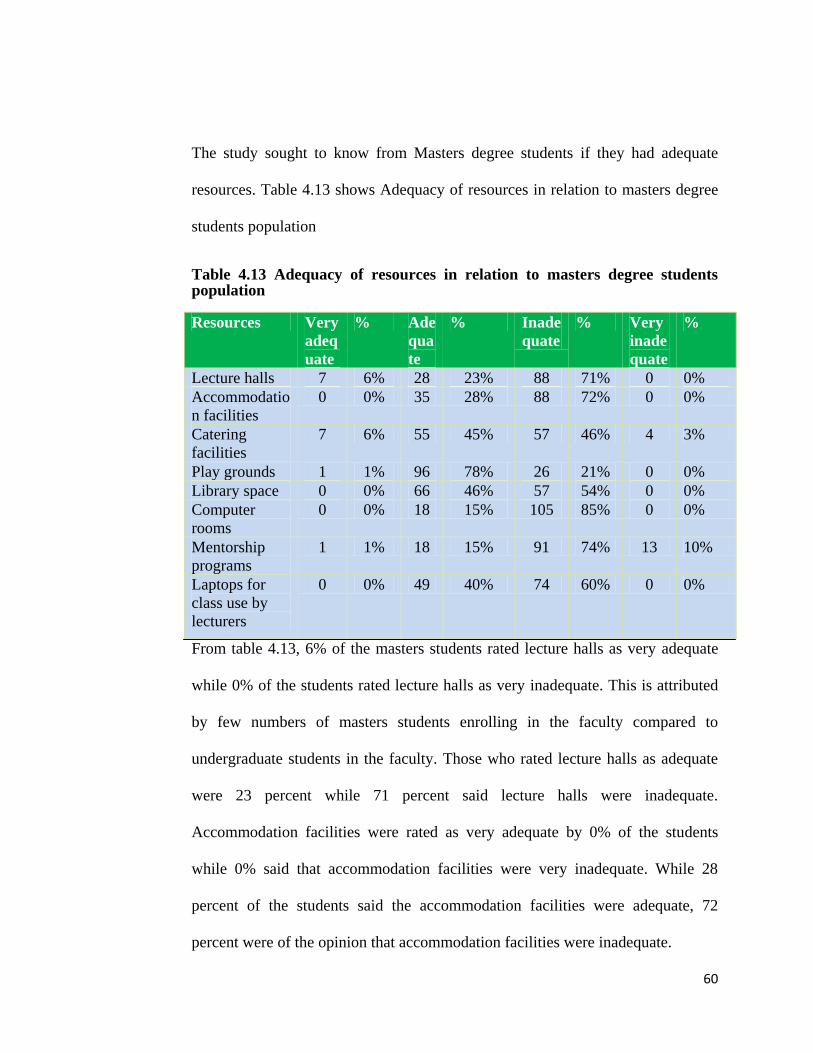
60
The study sought to know from Masters degree students if they had adequate
resources. Table 4.13 shows Adequacy of resources in relation to masters degree
students population
Table 4.13 Adequacy of resources in relation to masters degree students population
Resources Very
adeq
uate
% Ade
qua
te
% Inade
quate
% Very
inade
quate
%
Lecture halls 7 6% 28 23% 88 71% 0 0%
Accommodatio
n facilities
0 0% 35 28% 88 72% 0 0%
Catering
facilities
7 6% 55 45% 57 46% 4 3%
Play grounds 1 1% 96 78% 26 21% 0 0%
Library space 0 0% 66 46% 57 54% 0 0%
Computer
rooms
0 0% 18 15% 105 85% 0 0%
Mentorship
programs
1 1% 18 15% 91 74% 13 10%
Laptops for
class use by
lecturers
0 0% 49 40% 74 60% 0 0%
From table 4.13, 6% of the masters students rated lecture halls as very adequate
while 0% of the students rated lecture halls as very inadequate. This is attributed
by few numbers of masters students enrolling in the faculty compared to
undergraduate students in the faculty. Those who rated lecture halls as adequate
were 23 percent while 71 percent said lecture halls were inadequate.
Accommodation facilities were rated as very adequate by 0% of the students
while 0% said that accommodation facilities were very inadequate. While 28
percent of the students said the accommodation facilities were adequate, 72
percent were of the opinion that accommodation facilities were inadequate.
61
In relation to catering facilities, 6% of the students gave a rating of very adequate
while 3% of the students reported that the facilities were very inadequate. 45
percent of the students expressed an adequate opinion of the catering facilities
while 46 percent said that the facilities were inadequate. With regard to
playgrounds, 1% of the students felt that playgrounds were very adequate while
0% cited playgrounds to being very inadequate. 78% of the students rated
playgrounds as adequate while 21 percent were of the opinion that playgrounds
were inadequate. Library space was rated as very adequate by 0% of the students
while 0% felt that the library space was very inadequate in relation to student
population. 46% of the students were of the opinion that library space was
adequate while 54% felt that library space was inadequate in relation to student
population. Computer rooms were very adequate to only 0% of the students while
0% felt that computer rooms were very inadequate. 15 percent of the students
rated computer rooms as adequate while 85 percent were of the opinion that
computer rooms were inadequate. With regard to mentorship programs, 1% of the
students were of the opinion that mentorship programs were very adequate while
10% felt that mentorship programs were very inadequate. 15 percent rated
mentorship programs as adequate while 74 percent rated them as inadequate.
Laptops for class use by lecturers were rated very adequate by 0% of the students
while 0% were of the opinion that laptops for class use by lecturers were very
inadequate. While 40 percent felt that laptops for class use by lecturers were

62
adequate, 60 percent were of the opinion that they were not adequate in relation to
student population.
Table 4.14 shows adequacy of resources in relation to PhD students population
Table 4.14 Adequacy of resources in relation to PhD students population
Resources Very
adequ
ate
% Adequ
ate
% Inade
quate
% Very
inade
quate
%
Lecture halls 0 0% 1 25% 3 75% 0 0%
Accommodatio
n facilities
0 0% 2 50% 2 50% 0 0%
Catering
facilities
1 25% 2 50% 1 25% 0 0%
Play grounds 0 0% 3 75% 1 25% 0 0%
Library space 0 0% 1 25% 2 50% 1 25%
Computer
rooms
3 75% 0 0% 1 25% 0 0%
Mentorship
programs
4 100% 0 0% 0 0% 0 0%
Laptops for
class use by
lecturers
0 0% 2 50% 2 50% 0 0%
From the table 4.14, the researcher notes that 0% of the PhD students rated lecture
halls as very adequate while 0% of the students rated lecture halls as very
inadequate. Those who rated lecture halls as adequate were 25 percent while 75
percent said lecture halls were inadequate.
Accommodation facilities were rated as very adequate by 0% of the students
while 0% said that accommodation facilities were very inadequate. While 50% of
the students said the accommodation facilities were adequate, 50 percent were of
the opinion that accommodation facilities were inadequate.
63
In relation to catering facilities, 25 percent of the students gave a rating of very
adequate while 0% of the students reported that the facilities were very
inadequate. 50 percent of the students expressed an adequate opinion of the
catering facilities while 25 percent said that the facilities were inadequate. With
regard to playgrounds, 0% of the students felt that playgrounds were very
adequate while 0% cited playgrounds to being very inadequate. 75 percent of the
students rated playgrounds as adequate while 25 percent were of the opinion that
playgrounds were inadequate. Library space was rated as very adequate by 0% of
the students while 25 percent felt that the library space was very inadequate in
relation to student population. 25 percent of the students were of the opinion that
library space was adequate while 50 percent felt that library space was inadequate
in relation to student population.
Computer rooms were very adequate to only 75 percent of the students while 0%
felt that computer rooms were very inadequate. 0% of the students rated computer
rooms as adequate while 25 percent were of the opinion that computer rooms
were inadequate. With regard to mentorship programs, 0% of the students were of
the opinion that mentorship programs were very adequate while 0% felt that
mentorship programs were very inadequate. 0% rated mentorship programs as
adequate while 0% rated them as inadequate. Laptops for class use by lecturers
were rated very adequate by 0% of the students while 0% were of the opinion that
laptops for class use by lecturers were very inadequate. While 50 percent felt that
laptops for class use by lecturers were adequate, 50% were of the opinion that
64
they were not adequate in relation to student population. From the three categories
of students i.e. undergraduate, masters and PhD student point out that the
resources in the faculty of Arts are inadequate. This is therefore a clear indicator
and therefore shows the need for quick action in the provision of most of these
resources as they have an influence on the attitude and learning environment of
students, which in turn affect performance.
65
CHAPTER FIVE
SUMMARY, CONCLUSION AND RECOMMENDATIONS
5.1 Introduction
The main focus of this chapter is on the summary of the study, conclusions,
recommendations and suggestions for further studies.
5.2 Summary of the study
The purpose of the study was to analyze institutional factors influencing provision
of quality education in public universities in Kenya: A case of Faculty of Arts,
University of Nairobi, Kenya. The study was guided by four objectives: To assess
how lecturer-student ratio; Examine how internet access level; To assess how the
availability of teaching-learning resources and to analyze how the adequacy of
physical facilities influences provision of quality education in public universities
in Kenya, a case of Faculty of Arts, University of Nairobi.
The study adopted Human Capital Theory developed by Schultz in 1960 to gather
both qualitative and quantitative data. The target population constituted of 8774
students in the categories of: Master of Arts 1230, bachelor of Arts 7502, PhD
candidates, 41 and the dean Faculty of Arts. Therefore a total of 8774 formed the
target population. Data was collected using questionnaires for undergraduate and
postgraduate students in the Faculty of Arts, interview schedules for the dean and
observation checklist for the learning facilities. Both purposive and simple
random sampling techniques were employed to get the respondents. Descriptive
66
statistical analysis was used for quantitative data analysis and results presented
using tables, pie charts and bar graphs.
5.3 Findings of the study
Lecturer-student ratio and Quality of Education
From the data analyzed, it was established that lecturers are not adequately
available for individualized assistance and tutorials for undergraduate students in
the Faculty of Arts. However for the masters students and the PhD students,
lecturers are available for individualized assistance and tutorials. In both the
undergraduate and postgraduate studies, the lecturer‟s man-hour attendance was
above average. The study also established that the lecturers cover the course
content as planned adequately.
Internet access and Quality of Education
The study concludes that both the undergraduate and postgraduate students use
internet for educational purposes. They access internet in the computer
laboratories, library internet ports, hostels, lecture rooms while others use their
own personal gadgets like mobile devices. The lecturers are able to access internet
in their various offices using either wireless connectivity or internet ports.
Availability of teaching-learning resources and Quality of Education
The teaching-learning resources are inadequate to the required threshold. The
textbooks and computers are just enough to be shared among the students for both
undergraduate and postgraduate students but the ratio of computers to students is
67
way too low. Additionally, there are just enough projectors, whiteboards and
audio visual equipment to be used for very small class sizes. However, large
lecture halls face insufficiency of these facilities.
Adequacy of physical facilities and Quality of Education
Looking at accommodation within the university is inadequate. There are still
some undergraduate students who do not have rooms within the university.
However, all the post-graduate students; masters and PhD in this faculty do not
have rooms within the university. Resources are not adequate to support the
student population. Playgrounds and library space were cumulatively are
adequate. However, computer rooms, laptops for used by lecturers and
mentorship programs are inadequate across all the levels of study.
68
5.4 Conclusion
From the study, the following conclusion can be drawn.
First, it was established that lecturers are not adequately available for
individualized assistance and tutorials for undergraduate students in the Faculty of
Arts. However for the masters students and the PhD students, the lecturers are
available for individualized assistance and tutorials. In both the undergraduate and
postgraduate studies, the lecturer‟s man-hour attendance was above average. The
study also established that the lecturers cover the course content as planned per
unit and as this was ranked above average.
Secondly, the study concludes that both the undergraduate and postgraduate
students use internet for educational purposes. They access internet in the
computer laboratories, library internet ports, hostels, lecture rooms while others
use their own personal gadgets like mobile devices. The lecturers are able to
access internet in their various offices using either wireless connectivity or
internet ports. The study further concludes that internet accessibility is not very
adequate among some levels of study especially the bachelors degree student. The
study also found out that the learners with disabilities have not been well
incorporated into internet accessibility as there were no specialized computers
available for such groups of persons. However, this aspect was not majorly part of
the interrogative part of this study. The study also concludes that internet
accessibility influences the performance of the students.
69
Thirdly, the study concludes that teaching-learning resources are available but not
adequate. The textbooks and computers are just enough to be shared among the
students for both undergraduate and postgraduate students but the ratio of
computers to students is way too low. Additionally, there are just enough
projectors, whiteboards and audio visual equipment to be used for very small
class sizes. However, large lecture halls face insufficiency of these facilities.
Finally, the study concludes that the physical facilities are available but not
adequate. The postgraduate students are not given accommodation in the
university hostels but majority of the undergraduates are. Inadequacy of the hostel
rooms affects the performance of the students negatively as some of the
undergraduate students do not have rooms within the university. The study also
concludes that the library space and playgrounds are adequate for the prevailing
student population. Therefore, the study concludes that lecturer student ratio,
internet access, availability of teaching learning resources and adequacy of
physical facilities as institutional factors influence the provision of quality
education in public universities.
70
5.5 Recommendations on the research findings
Based on the findings of the study, the following recommendations are made;
First, The Government of Kenya through the Ministry of Education ought to
increase budgetary allocation (capitation) to the University of Nairobi and to the
faculty of Arts and also hire qualified lecturers, tutors and trainers for the
University to increase the lecturer student ratio. This will ensure that the students
get individualized and personalized tutorials.
Secondly, the study recommends that there is need for the University council and
the senate to increase funds for staff development. This will see more research
and publications by lecturers within the Faculty of Arts.
The Commission for University Education (CUE) should constantly make better
provisions for the assessment of quality education at the Faculty of Arts of the
University of Nairobi.
The lecturers in the Faculty of Arts of the University of Nairobi should engage
more in research work, publications and conferences as these are the basis for
Faculty ranking as well as the ranking of the University of Nairobi regionally and
internationally.
Students from the Faculty of Arts especially masters and PhD students should
engage more in research work, publications as well as attending conferences.
Parents should also support their students in buying teaching and learning
resources such as book to reduce pressure on the Faculty teaching-learning
resources.
71
5.6 Recommendations for further research
More studies should be done in the following areas;
Firstly, Institutional factors influencing provision of quality education in Public
universities in Kenya
Secondly, Institutional factors influencing provision of quality education in
Private universities in Kenya
Thirdly, Determinants of occupational stress affecting employee performance in
Public Universities in Kenya
72
REFERENCES
Astin, A. (1984). The American freshman national norms for fall 1984. Los
Angeles, Calif.: Higher Education Research Institute, Graduate School of
Education, University of California, Los Angeles.
Bao, X. (1998). Challenges and opportunities: A report of the 1998 library
survey of internet users at Seton Hall University. College and Research
Libraries 59(6): 535-543.
Becker, G. (1994). Human Capital: a theoretical and empirical analysis with
special reference to education. Chicago: The University press.
Bloom, D., & Canning, D. (2006). Higher education and economic development
In Africa. Washington, D.C.: World Bank.
Chacha, N.C. (2005). The university mandate in re-invigorating the university
mandate in a globalizing environment: Challenges, Obstacles and way
forward. DAAD conference proceedings. 26th – 27th May 2005, Kenyatta
University, Nairobi.
CHE and AFRIQAN (2012), AFRIQAN – INQAAHE workshop on good practices
in quality assurance: proceedings of the workshop held at the Kenya
school of monetary studies in Nairobi; assuring quality higher education.
Chifwepa V (2003). The use of the internet and internet by teaching staff of the
University of Zambia. Afr.J. Archives Inf. Sci. 13(2): 119-132.
73
Chua, B. (2004). Port cities in Asia and Europa: Selected papers from the
Workshop 'Port Cities and City-States in Asia and Europe', funded by the
2004/2005 workshop series of the Asia-Europe Foundation (ASEF) and the
European Alliance for Asian Studies; November 2004 at. London [u.a.:
Routledge].
Court S. (2012), analysis of student: staff ratio and academic use of time and
potential links with student satisfaction.
Faculty Of Arts annual report (2014): Source; http://education.uonbi.ac.ke
Felicia, E. (2006). Resource sharing in the digital age: prospects and
problems in African universities: library philosophy and practice Vol.9,
No.1 (Fall 2006)
Fredrick, H. (1973), Human Resources as the Wealth of Nations. New
York: Oxford University Press.
Fores,t F. J. J. & Altbach G. P. (2006), International hand book of higher
education. Part Two: Regions and countries. Springer Dordredit, the
Netherlands
Gay, L.R. (1992). Educational Research: Competencies for Analysis and
Application (4th
Edition). Columbus: Merrill.
George, P. (1988), Education and Development: A Review
Washington, DC: World Bank.
Kothari, C.R.(2013), Research methodology; methods and techniques, 2nd second
edition: new age international publishers.
74
Mbirithi, D. M, (2013). Management challenges facing Kenya’s public universities
and implications for the quality of education. Thesis submitted for the
degree of doctor of philosophy of Kenyatta University
Mitei, E. (2002). Application of Knowledge Management to teacher management
To teacher management in Kenya: A case study approach. Manchester:
University of Manchester
Mugenda, S. O.M & Mugenda, A. G. (2009).Research Methods: qualitative and
quantitative approaches (revised edition). Nairobi: Acts Press.
Mwanje, J.I. (2001). Issues in Social Science Research (Module 1). Addis Ababa:
OSSREA.
OECD (1995), International Indicators Project: Center for Educational Research
and Innovation.
Olaniyan, D.A & Okemakinde (2008). Human capital theory: implications for
educational development. Pakistan journal of social sciences: 479-483.
Medwell.
Orodho, J. and Kombo, D. K. (2002). Research Methods. Nairobi: Kenyatta
University, Institute of Open Learning
Owuor, A.N. (2012), Higher Education in Kenya: The Rising Tension between
Quantity and Quality in the Post-Massification Period; Higher
Education Studies; Vol. 2, No. 4; 2012: Canadian Center of Science
and Education university of Uyo. UyoAkwa-ibom state.
75
Otiato, P. O. (2009). Quality of Education and its Role in National Development:
A Case study of Kenya„s Educational Reforms. Kenya Studies Review:
Trow, M. (1972). The expansion and transformation of higher education.
International Review of Education, 18(1), 61-84.
Oyedum, G., & Nwalo, K. (2011). Perceptions by undergraduate students of the
Environmental conditions and resources availability in selected university
libraries in Nigeria.
Ugwuanyi, A., Eze, M., Obi, I., &E.i, U. (2013). Open Access to Knowledge:
Perceptions of Librarians in Colleges of Education in South-East
Nigeria.Journal of Educational and Social Research.
University of Nairobi annual report (2013). Source: http://www.ac.ke.
Retrieved: 12/10/2015
University of Nairobi strategic plan, 2008 – 2013. Source: http://www.ac.ke
Retrieved: 12/10/2015
UNESCO (2005), Education for all: the quality imperative. Paris: United Nations
Educational Scientific and Cultural Organization.
USAID, (2014). African higher education: opportunities for transformative
Change for sustainable development. Publisher; association for public
and land-grant universities, knowledge center on higher education for
African development.
76
APPENDICES
APPENDIX I
LETTER OF INTRODUCTION
P. O. Box P.O.BOX 92,
KIKUYU
The Dean,
Faculty of Arts, University of Nairobi
Dear Sir,
RE: INVITATION TO PARTICIPATE IN RESEARCH
I am a post graduate student at the University of Nairobi, Department of
Educational Administration and Planning. I am carrying out a research on
“Institutional factors influencing provision of quality education in public
universities in Kenya: A case of Faculty of Arts, University of Nairobi.” Your
institution has been selected to participate in the study. Kindly permit me to collect
data from your Faculty.
The attached questionnaires have been designed to assist the researcher gather
data for academic purpose only. Do not write your name or the name of the
institution as this is confidential. Please, respond to all items honestly.
Thank you in advance for your cooperation.
Yours faithfully
Tom Ochieng‟ Kuja
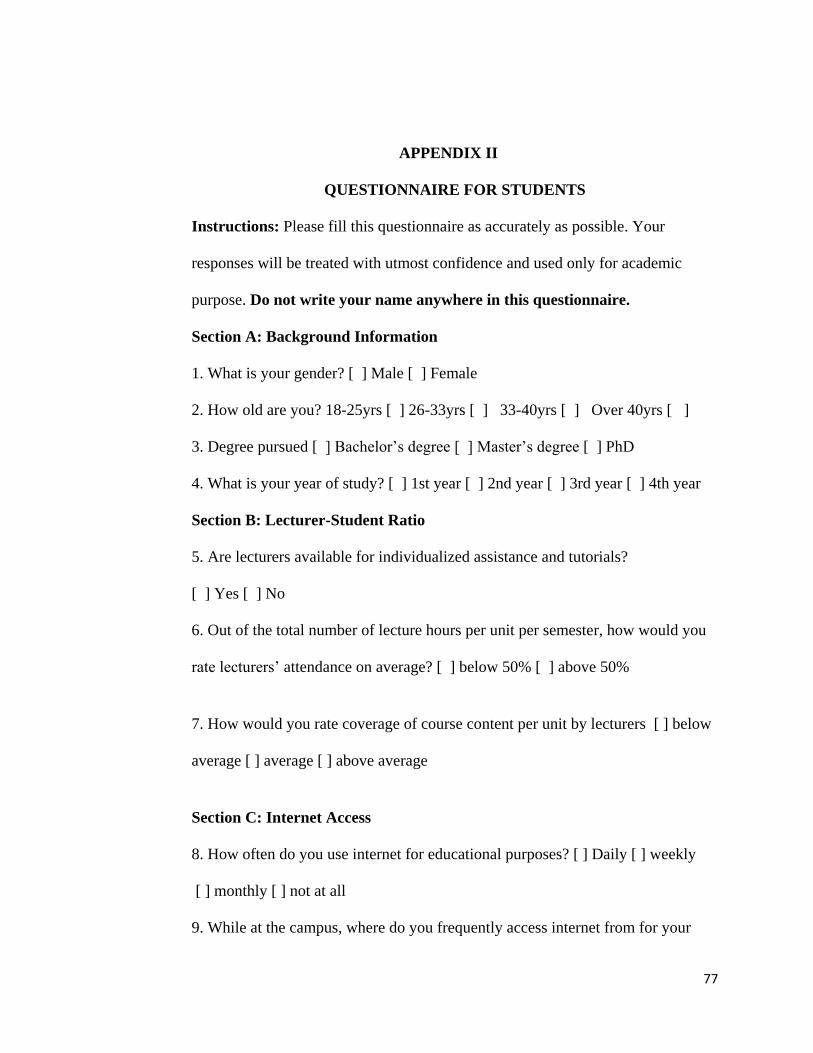
77
APPENDIX II
QUESTIONNAIRE FOR STUDENTS
Instructions: Please fill this questionnaire as accurately as possible. Your
responses will be treated with utmost confidence and used only for academic
purpose. Do not write your name anywhere in this questionnaire.
Section A: Background Information
1. What is your gender? [ ] Male [ ] Female
2. How old are you? 18-25yrs [ ] 26-33yrs [ ] 33-40yrs [ ] Over 40yrs [ ]
3. Degree pursued [ ] Bachelor‟s degree [ ] Master‟s degree [ ] PhD
4. What is your year of study? [ ] 1st year [ ] 2nd year [ ] 3rd year [ ] 4th year
Section B: Lecturer-Student Ratio
5. Are lecturers available for individualized assistance and tutorials?
[ ] Yes [ ] No
6. Out of the total number of lecture hours per unit per semester, how would you
rate lecturers‟ attendance on average? [ ] below 50% [ ] above 50%
7. How would you rate coverage of course content per unit by lecturers [ ] below
average [ ] average [ ] above average
Section C: Internet Access
8. How often do you use internet for educational purposes? [ ] Daily [ ] weekly
[ ] monthly [ ] not at all
9. While at the campus, where do you frequently access internet from for your
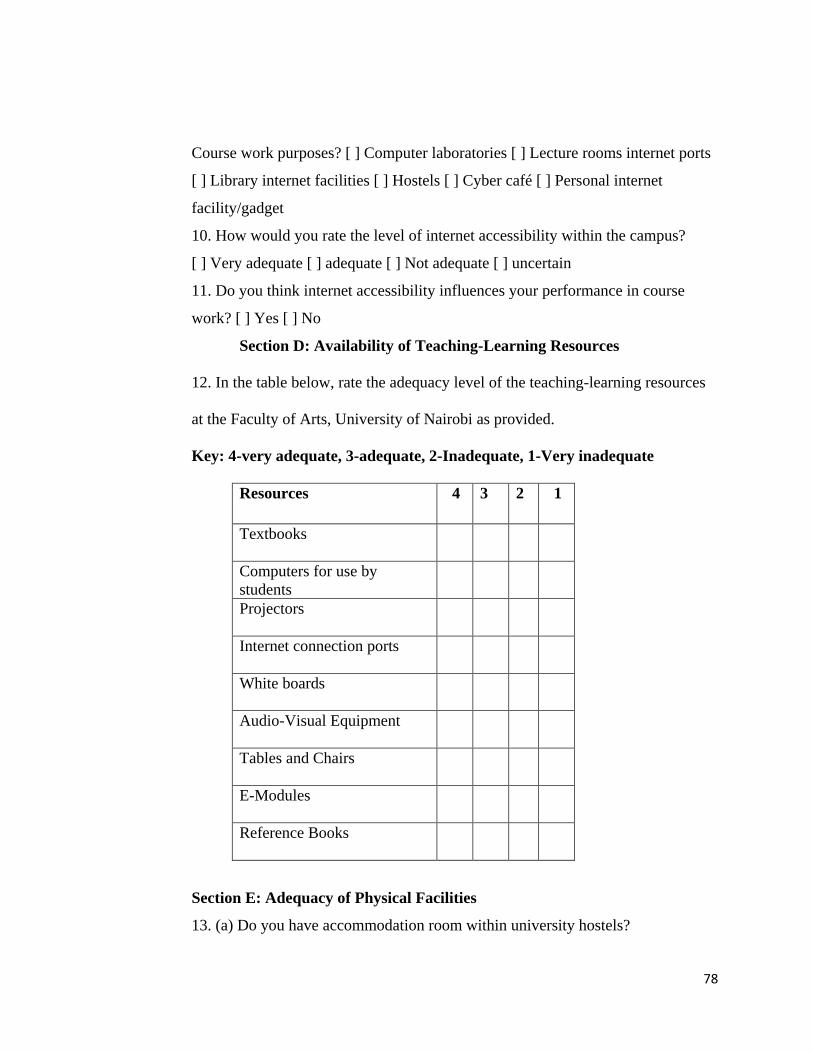
78
Course work purposes? [ ] Computer laboratories [ ] Lecture rooms internet ports
[ ] Library internet facilities [ ] Hostels [ ] Cyber café [ ] Personal internet
facility/gadget
10. How would you rate the level of internet accessibility within the campus?
[ ] Very adequate [ ] adequate [ ] Not adequate [ ] uncertain
11. Do you think internet accessibility influences your performance in course
work? [ ] Yes [ ] No
Section D: Availability of Teaching-Learning Resources
12. In the table below, rate the adequacy level of the teaching-learning resources
at the Faculty of Arts, University of Nairobi as provided.
Key: 4-very adequate, 3-adequate, 2-Inadequate, 1-Very inadequate
Resources
4 3
2
1
Textbooks
Computers for use by
students
Projectors
Internet connection ports
White boards
Audio-Visual Equipment
Tables and Chairs
E-Modules
Reference Books
Section E: Adequacy of Physical Facilities
13. (a) Do you have accommodation room within university hostels?
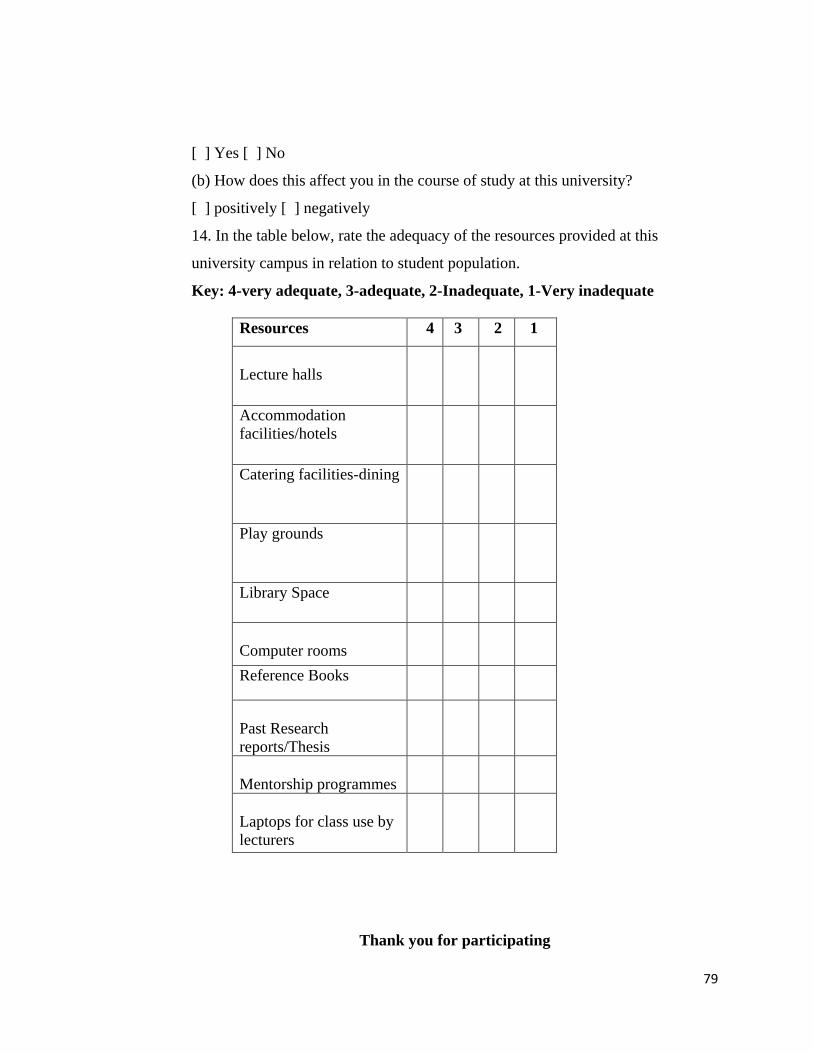
79
[ ] Yes [ ] No
(b) How does this affect you in the course of study at this university?
[ ] positively [ ] negatively
14. In the table below, rate the adequacy of the resources provided at this
university campus in relation to student population.
Key: 4-very adequate, 3-adequate, 2-Inadequate, 1-Very inadequate
Resources 4 3 2 1
Lecture halls
Accommodation
facilities/hotels
Catering facilities-dining
Play grounds
Library Space
Computer rooms
Reference Books
Past Research
reports/Thesis
Mentorship programmes
Laptops for class use by
lecturers
Thank you for participating
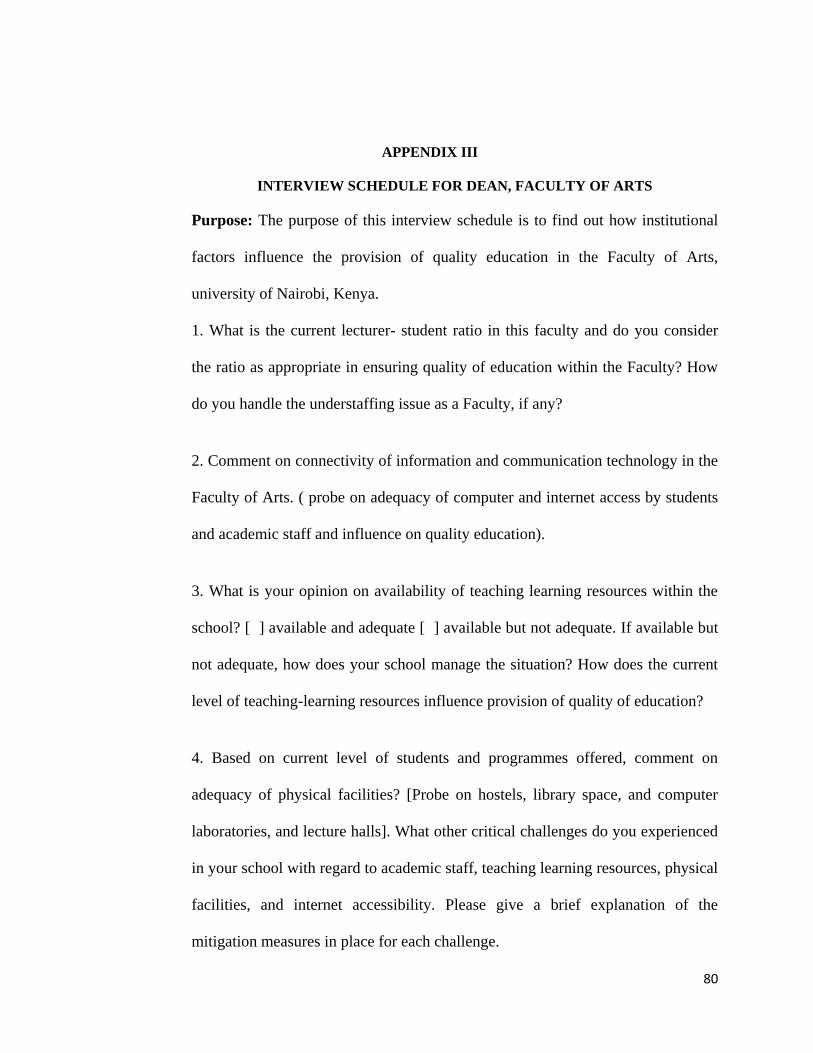
80
APPENDIX III
INTERVIEW SCHEDULE FOR DEAN, FACULTY OF ARTS
Purpose: The purpose of this interview schedule is to find out how institutional
factors influence the provision of quality education in the Faculty of Arts,
university of Nairobi, Kenya.
1. What is the current lecturer- student ratio in this faculty and do you consider
the ratio as appropriate in ensuring quality of education within the Faculty? How
do you handle the understaffing issue as a Faculty, if any?
2. Comment on connectivity of information and communication technology in the
Faculty of Arts. ( probe on adequacy of computer and internet access by students
and academic staff and influence on quality education).
3. What is your opinion on availability of teaching learning resources within the
school? [ ] available and adequate [ ] available but not adequate. If available but
not adequate, how does your school manage the situation? How does the current
level of teaching-learning resources influence provision of quality of education?
4. Based on current level of students and programmes offered, comment on
adequacy of physical facilities? [Probe on hostels, library space, and computer
laboratories, and lecture halls]. What other critical challenges do you experienced
in your school with regard to academic staff, teaching learning resources, physical
facilities, and internet accessibility. Please give a brief explanation of the
mitigation measures in place for each challenge.
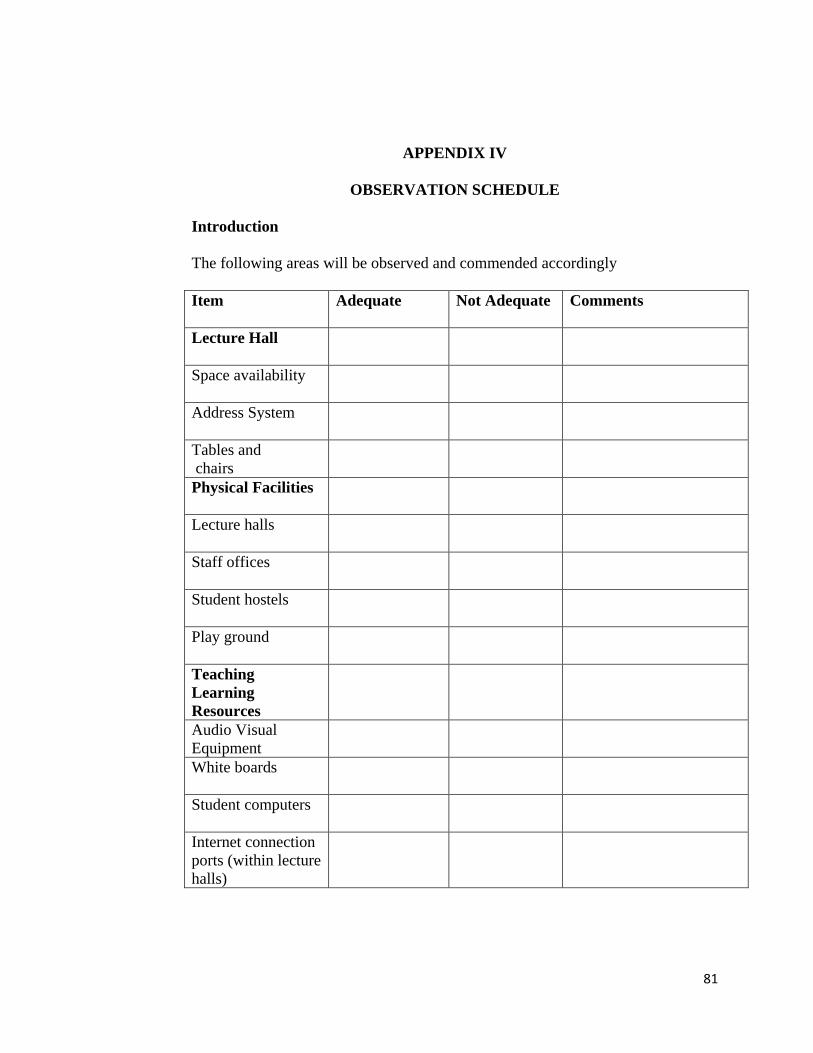
81
APPENDIX IV
OBSERVATION SCHEDULE
Introduction
The following areas will be observed and commended accordingly
Item Adequate Not Adequate Comments
Lecture Hall
Space availability
Address System
Tables and
chairs
Physical Facilities
Lecture halls
Staff offices
Student hostels
Play ground
Teaching
Learning
Resources
Audio Visual
Equipment
White boards
Student computers
Internet connection
ports (within lecture
halls)
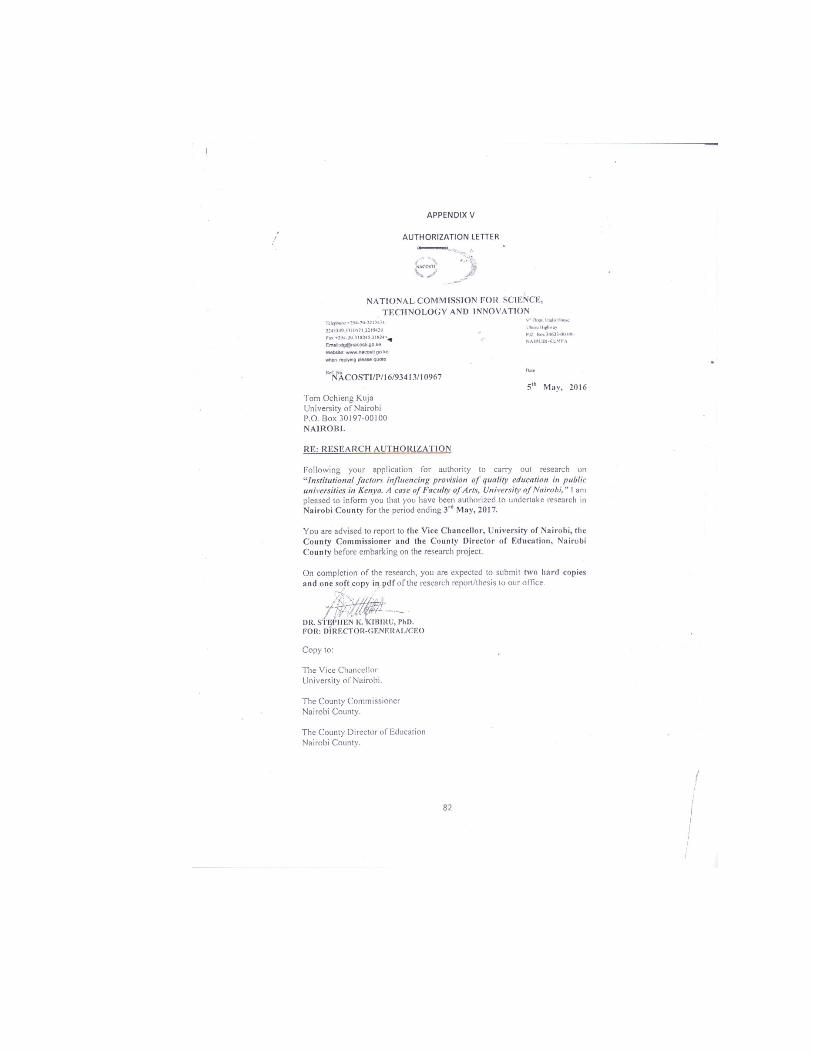
82
83