Embed Size (px)
Citation preview

Page | 1
Institutional framework and decision‐making practices for water management
in Cyprus Towards the development of a strategy for aquifer protection
and management in Pegeia, Paphos
March 2009 Prepared by Aeoliki Ltd
INECO (“Institutional and Economic Instruments for Sustainable Water Management in the Mediterranean Basin”) is a Coordination Action Project supported by the European Commission through the 6th Framework Programme (Contract No: INCO‐CT‐2006‐517673).


Page | 1
PREFACE
The uptake of research results and the achievement of consensus among authorities, end‐users and citizens on water management options, regulations and instruments are major challenges in the global effort towards the sustainable management of water resources. En‐gagement with stakeholders, public consultation and participation are commonly recognized as goals for water‐related research but also for the development and implementation of wa‐ter management policies. It is now widely accepted that the (often) limited success of past efforts was also due to the lack of knowledge on conflicting interests and the inability to ad‐dress the concerns of local authorities, water users and affected communities in a compre‐hensive way. As a result, processes to contribute in building informed and inclusive partici‐pation of stakeholders and citizens have been placed in the focus of empirical research and decision‐making. Participatory planning is becoming a core component of water‐related re‐search, with adopted approaches ranging from simple consultation with stakeholders to more binding, dual‐way learning and communication processes. A common first step is insti‐tutional mapping, i.e. the building of a comprehensive profile of the institutions active within the region and problem of interest. As institutions are defined by rules, and rules create boundaries, it becomes necessary to know where the powers and funding to deliver differ‐ent courses of action lie, and which obstacles need to be overcome for concerted policy im‐plementation.
This volume of the INECO publishable reports outlines the analysis of the institutional framework and decision‐making practices for water management in Cyprus; it highlights the main water management challenges faced in the country today, and focuses on a water management issue of primary importance, groundwater overexploitation. At present, the preservation of the island’s groundwater resources, which can be considered significantly degraded after many years of overexploitation, is one of the main priorities of the Cyprus National Water Policy. Furthermore, the increasing vulnerability of the country to droughts, resulting from the observed reduction of precipitation and the increase of water demand, has rendered groundwater resources a strategic water supply source. Responding to this challenge, the INECO project implemented a participatory approach for achieving consensus on water management options for the management of the coastal aquifer of Pegeia. The aquifer, located west of Paphos town, is used for drinking and irrigation water supply. Al‐though not yet subject to dramatic sea water intrusion, the aquifer is becoming increasingly vulnerable due to the rapidly increasing residential and tourism demand and the lack of in‐frastructure for sewage collection and treatment. The outcomes of this process, which are summarized in the second part of this volume, can provide valuable lessons on how citizen involvement in water management decisions can facilitate the protection of vulnerable wa‐ter bodies.
This volume was prepared by Aeoliki Ltd, on the basis of information that was made availa‐ble through various departments, officers and experts of the Water Development Depart‐ment (WDD) of the Ministry of Agriculture, Natural Resources & Environment of Cyprus. Special thanks are extended to Mr. Christodoulos Artemis, former Director of the Water De‐velopment Department, to Mr. Charis Omorphos and to Dr. Andreas Christodoulides (WDD), not only for their willingness to provide data and relevant information, but also for their con‐tinuous support to the undertaken effort. The authors would also like to thank Mr. Takis

Page | 2
Ioannou for his scientific and personal support in the preparation of this publication and in the public participation process developed in Pegeia. Finally, valuable support was received from the Municipality of Pegeia, and the residents of the region, who very willingly partici‐pated in all workshops and meetings organized in the area.
March 2009
Aeoliki Ltd

Page | 3
TABLE OF CONTENTS
Part I: Water Management in Cyprus: Setting the Scene ............................... 5 General Context .............................................................................................................. 7 Country Overview ............................................................................................................................... 7 Main physical characteristics .............................................................................................................. 9
Geomorphology ........................................................................................................................ 9 Land use ...................................................................................................................................10 Climate .....................................................................................................................................10
Main socio‐economic characteristics .................................................................................................11 Water Resources ................................................................................................................................13
Surface water ...........................................................................................................................13 Groundwater ............................................................................................................................15 Major water development works .............................................................................................17
Major constraints facing the water sector .........................................................................................18 Reduction of available water resources due to prolonged droughts and climate change .........18 Impacts to aquifer recharge resulting from dam construction ..................................................19 The currently adopted cropping patterns .................................................................................19 Water losses in domestic water distribution networks (mainly in rural areas) .........................19 High investment costs for new water development schemes ...................................................19
Sharing Water: Issues & Challenges ............................................................................. 19 Pollution from upstream sources .......................................................................................................19
Discharges of toxic substances .................................................................................................20 Oxygen demanding and microbial pollution compounds ..........................................................21 Nutrient pollution from agricultural sources ............................................................................22
Increasing water scarcity ...................................................................................................................22 Drought problems ....................................................................................................................23 Uneven distribution of rainfall ..................................................................................................25 Conflicts between urban and agricultural use ..........................................................................26 Increased water demand for irrigation and tourism during the summer period .......................27 Inter‐basin water transfer ........................................................................................................28 Illegal borehole drilling and aquifer over‐pumping ...................................................................28 Non‐effective exploitation of many water development schemes ...........................................29 Excessive use of dam water due to the reluctance in using tertiary treated effluent................30
Governing Water: Context & challenges ...................................................................... 31 The institutional setting .....................................................................................................................31
Ownership and responsibility for water management ..............................................................31 Ministries, authorities and institutions at national level with a role in water management .....31
Provision of water services & financing of water sector investments .................................................35 Overview ..................................................................................................................................35 Domestic water supply .............................................................................................................35 Irrigation water supply .............................................................................................................36 Wastewater collection and treatment ......................................................................................37 Recycled water .........................................................................................................................37
Legislation .........................................................................................................................................37 Constraints & Challenges of the Current Governance Setting .............................................................41
Ineffective and inefficient allocation of limited water resources ..............................................41 Difficulties in the implementation of water pricing policies ......................................................41 Weaknesses of existing institutional and organizational structures and fragmentation of responsibility ............................................................................................................................42 Society‐driven conflicts ............................................................................................................42
Page | 4
Valuing water: Issues & Challenges .............................................................................. 42 Cost Recovery ....................................................................................................................................42 Productivity of water uses per sector .................................................................................................44
Concluding Remarks: The Water Framework Directive challenge ............................... 45
Part II: The INECO Cyprus Cαse Study: Increasing vulnerability of the Pegeia Aquifer ............................................................................................... 47
Background and motivation .......................................................................................... 49 The case of the Pegeia Aquifer ..................................................................................... 50 Geology .............................................................................................................................................50 Water table evolution ........................................................................................................................51 Aquifer exploitation patterns .............................................................................................................53
Measures for groundwater monitoring & aquifer protection ...................................... 54 Discussing with local stakeholders – The Approach ........ Error! Bookmark not defined. Problem analysis ........................................................................................................... 56 Defining policy objectives ............................................................................................. 60 Identification and analysis of options for mitigating groundwater overexploitation .. 61
Development of additional water supply sources/Infrastructure development .......................61 Improving efficiency in water use .............................................................................................62 Regulation of groundwater abstractions ..................................................................................63 Awareness and participation ....................................................................................................64
Option Evaluation ......................................................................................................... 65 Prioritization of suggested instruments .............................................................................................65 Further considerations towards option implementation ....................................................................66
Regulation of groundwater abstractions ..................................................................................67 Incentives for water saving .......................................................................................................68 Phasing‐out of specific water uses............................................................................................69 Cost recovery and cost sharing issues ......................................................................................69 Framework for water management ..........................................................................................71 Public participation and enhanced stakeholder involvement ...................................................72
Concluding Remarks ...................................................................................................... 73 Summary of key indicators on the Pegia Aquifer State & Management ...................... 75 References .................................................................................................................... 76

PART I: WATER MANAGEMENT IN CYPRUS: SETTING THE SCENE


Page | 7
GENERAL CONTEXT
Similarly to other Mediterranean countries, Cyprus has a semi‐arid climate and limited water resources. The entire country is considered as being under continuous water stress, with water scarcity being accentuated by periodic droughts. The Water Exploitation Index at na‐tional level1 is equal to 53%, and is by far the greatest among the EU Member States. On av‐erage, 20% of the total water abstraction is used for public water supply, 5% for tourism and 69% in agricultural activities (mostly crop irrigation). The remaining 6% is used for industrial (1%) and environmental purposes (5%) [1].
The country’s water resources are highly developed with the most economically viable projects already implemented, and the further exploitation of the remaining and scarce wa‐ter resources will be very costly. In this regard, the State adopted a comprehensive approach to water management, involving the conjunctive use of surface and groundwater, addressing also interrelations between demands for domestic and irrigation water. Demand manage‐ment is used to control consumption; options applied include pricing, rationing, increased irrigation efficiency through automated irrigation systems and water conservation measures.
Despite all the above efforts, Cyprus continues to face water shortage of increasing severity, due to recurrent drought events and aquifer depletion. If the country continues to rely more on conventional rather than non‐conventional sources of water, impacts will be severe, and possibly, domestic and irrigation water use will have to be curtailed. This in turn, is expected to significantly affect the society, the economy and the environment. On the other hand, it is anticipated that new legislation on water resource protection, along with the gradual im‐plementation of the EU Water Framework Directive will give new impetus to local efforts for improved water management. Furthermore, the institutional reform expected to occur, through the implementation of a new law that will place water resource management under one, single, Directorate for Integrated Water Management, will allow more coordinated and efficient action for addressing current and emerging water management challenges.
COUNTRY OVERVIEW
Cyprus is situated at the north‐eastern part of the Mediterranean Basin, 33o east of Green‐wich and 35o north of the Equator. It is the third largest island in the Mediterranean, with an area of 9,251 km², of which 47% is arable land, 19% is forest land and the remainder 34% is uncultivated.
KY RENIA FAMAGUSTA
LARNACA
LIMASSOL
PAPHOS
NICOSIA
Figure 1: The location of Cyprus and the administrative divisions
1 The Water Exploitation Index (WEI) is defined as the mean annual total demand for freshwater di‐vided by the long‐term average freshwater resources. It illustrates the extent at which the total water demand puts pressure on water resources.

Page | 8
Table 1: Key indicators – National Level
INFORMATION INDICATOR (Units) DATA SOURCE
Geographic cha‐racteristics
Area (km²) 9,252 Forest Dept.
Surface water area (km²) 37.63 Forest Dept.
Dams 13.48 Forest Dept.
Lakes 22.92 Forest Dept.
Reservoirs ‐ Ponds 1.23 Forest Dept.
Land use – Arable (%) 26.5 Forest Dept.
Land use ‐ permanent crops (%) 2.1 Forest Dept.
Land use – urban (%) 4.7 Forest Dept.
Land use – wetlands (%) 0. 36 Forest Dept.
Land use ‐ protected areas (%) 2.22 Forest Dept.
Natural forests 1.7 Forest Dept.
Natural reserves 0.52 Forest Dept.
Land use – other (%) 8.9 Forest Dept.
NATURA 8.9 Forest Dept.
Socio‐Demographic indi‐cators
Total Population (number of people) 703,529 Census 2001
Urban Population (number of persons)
485,304 Census 2001
Rural Population (number of persons)
235,402 Census 2001
Population growth rate (%) 1.3 Census 2001
Population density (Number of people / km²)
76.04 Census 2001
Economy
GDP (mil. €/y) 12,542 Main Economic Indi‐cators 2005
GDP per capita (€/head) 17,000 Main Economic Indi‐cators 2005
GDP in the Tertiary sector (including Services) (%)
4.5 Main Economic Indi‐cators 2005
GDP in the Agricultural sector (%) ‐3.6 Main Economic Indi‐cators 2005
GDP in the Secondary Sector (including industrial sector) (%)
2.7 Main Economic Indi‐cators 2005
Labour force by primary sector (%) 7.8 Labour Statistics 2003
Labour force by secondary sector (%) 21.1 Labour Statistics 2003
Labour force by tertiary sector (%) 71.1 Labour Statistics 2003
Unemployment (%) 3.5 Labour Statistics 2003
The country is divided into six administrative districts: Nicosia, Famagusta, Limassol, Paphos, Larnaca and Kyrenia (Figure 1). At local administrational level in Cyprus, urban residential populations and their localities fall under the jurisdiction of Municipalities, and smaller rural villages and settlements under Local Authorities (named until recently ‘Village Boards’ or ‘Improvement Boards’).

Page | 9
In municipalities, the local policy is formulated by the Municipal Council (elected by the citi‐zens for a period of five years), led by the Mayor, who is the legal representative (and also elected by the citizens for a five‐year term).
The municipality is responsible for the management of the municipal zone, which includes construction and maintenance of buildings, parks and public gardens, street lighting, the protection of public health with waste collection, sanitation and waste disposal and treat‐ment, and the protection of the environment. Where there are sufficient funds available, municipalities are also responsible for promoting their area through the development of tourism, arts and sports.
MAIN PHYSICAL CHARACTERISTICS
Geomorphology
The geomorphology of Cyprus is dominated by two mountain massifs: the Troodos range in the central, southern and western parts of the island, and the Pentadaktylos range, which runs in parallel to the northern coastline (Figure 2). Situated between the two mountain ranges is the Mesaoria Plain. The coastline comprises a mixture of low hills, rocky areas, cliffs and narrow plains. Wider plains exist around river estuaries.
The central part of the Troodos Massif (covering approximately 3,500 km² and rising in the west to nearly 2,000 m) consists of igneous rocks (Troodos Ophiolite Complex). The southern and southwestern fringes consist of autochthonous sedimentary rocks.
High 1950m Low 0
TROODOS MASSIF
PENTADAKTYLOS MOUNTAIN RANGE
MESAORIA PLAIN
High 1950m Low 0
TROODOS MASSIF
PENTADAKTYLOS MOUNTAIN RANGE
MESAORIA PLAIN
Figure 2: Topography of Cyprus
The central and highest part of the ophiolite complex consists of ultramafic rocks (harzbur‐gites, serpentinites) and plutonic rocks (dunites, wehrlites, pyroxenites, gabbros and plagio‐granites). Bordering this is the Sheeted Dyke Complex and, downhill, the volcanic rocks (pil‐low lavas). Autochthonous sedimentary rocks dominate the southern and southwestern pe‐riphery with alternating layers of chalks and marls (Lefkara, Pachna and Kalavassos Forma‐tions).
The Pentadaktylos Mountain Range has retained its limestone covering over the ages. The two mountain ranges were originally separated by a shallow sea, the bed of which is now the Messaoria (or middle) plain, a fertile agricultural region with the capital of Cyprus, Nico‐sia, situated at its centre. The highest peak within the Pentadaktylos Mountain Range is Ky‐

Page | 10
parissovouno (1,024 m), followed by Boufavento (955 m) and Gialas (935m). These moun‐tains consist mostly of allochthonous recrystallized limestones, dolomites and marble.
The Mesaoria Plain (covering 2,500 km²) sits between the two mountain ranges and extends from Morfou Bay to Ammochostos Bay. The topography is dominated by flat or softly undu‐lating areas and scattered, characteristically flat‐topped or conical‐shaped, hills. The altitude reaches up to 300 m. The plain consists mainly of marls, calcarenites, sands and gravels (Lef‐kosia, Athalassa, Kakkaristra and Apalos Formations), as well as alluvial deposits.
Land use
Approximately 47% of the island area is arable land, whereas 34% is uncultivated. Some 19% is covered by forest, most of which is owned by the State. In the Government‐controlled areas, the total agricultural land is approximately 200,000 ha of which 45% are cultivated with annual crops and 21% with perennial crops. Some 5% are under fallow and as grazing land, 25% is uncultivated and some 4% is classified as scrub and deserted. Some 37,000 ha are irrigated, covering approximately 25% of the cultivated land (crop and fallow). These ac‐count for 60‐70% of the total crop production value.
Climate
Cyprus has an intense Mediterranean climate with the typical seasonal rhythm strongly marked with respect to temperature, precipitation and weather in general. Hot dry summers from mid‐May to mid‐September and rainy, rather changeable, winters from November to mid‐March are separated by short autumn and spring seasons of rapid change in weather conditions.
The central Troodos massif, rising to 1951 metres a.m.s.l., and to a less extent the long nar‐row Kyrenia mountain range, with peaks of about 1000 metres a.m.s.l., play an important part in the meteorology of Cyprus. The predominantly clear skies and high sunshine give large seasonal and daily differences between temperatures of the sea and the interior of the island, which also cause considerable local effects especially near the coastline.
During the summer, the island is mainly under the influence of a shallow trough of low pres‐sure extending from the great continental depression centered over southwest Asia. It is a season of high temperatures with almost cloudless skies. Precipitation is almost negligible but sometimes isolated thunderstorms give precipitation amounting to less than 5% of the total in the average year.
During winter, Cyprus is near the track of fairly frequent small depressions that cross the Mediterranean Sea from west to east, between the continental anticyclone of Eurasia and the generally low‐pressure belt of North Africa. These depressions give periods of disturbed weather, usually lasting from one to three days, and produce most of the annual precipita‐tion. The average precipitation from December to February is about 60% of the annual total.
The total yearly average precipitation is about 500 mm (period 1961‐1990). A lowest value of 182 mm was observed in 1972/73 and a highest of 759 mm occurred in 1968/69. Statistical analysis of precipitation in Cyprus reveals a pronounced reduction in the last 30 years. The mean annual precipitation increases up the southwestern windward slopes from 450 mm to nearly 1,100 mm at the top of the central massif of Troodos (Figure 3). On the leeward slopes, precipitation decreases steadily northwards and eastwards to between 300 and

Page | 11
350 mm in the central plain and the flat south eastern parts (the Kokkinochoria area) of the island.
Figure 3: Mean annual precipitation in mm over the period 1971 ‐ 2000
Cyprus can be divided in four main topo‐climatic regions:
• The high altitude areas (500 to 1950 m a.m.s.l.) of the Troodos mountain range that dominates the central part of the island, corresponding to 18% of the total area. The mean annual precipitation is 690 mm, varying from 400 to 700 mm at elevations of 500 m, to 1100 mm at the mountain peak. The mean annual evaporation varies from 1,400 to 1,700 mm at 500 m elevation to 1000 mm at the top. According to the Penmann‐Monteith classification, the region, with an average aridity index of 0.54, can be classified as “dry sub‐humid”.
• The slopes of the Troodos mountain range at altitudes of 200 to 500 m a.m.s.l. (27% of the total island area), with a mean rainfall of 300 to 500 mm at the lower eleva‐tion and 400 to 700 mm at the higher elevations. The rainfall rate is higher at the western and southern slopes. Similarly, the annual evaporation varies from 1600 to 1900 mm at lower elevations to 1400 and 1700 mm at the higher ones. The region has an average aridity index of 0.3, and can be classified as “semi‐arid”.
• The Mesaoria Plain dominating the central eastern part of the island (20% of the isl‐and) at elevations of 0 to 200 m a.m.s.l., with corresponding annual rainfall in the range of 290 to 350 mm, and an annual evaporation rate of 1650 to 1850 mm. The area can be classified as “arid”, with an aridity index of 0.18.
• The coastal areas at 0 to 200 m elevation a.m.s.l., including also the Pentadactylos mountain range along the northern part of the island (35% of the island). The mean annual rainfall varies between 350 and 400 mm in the south‐eastern and southern areas and between 450 to 500 mm in the western and northern areas. The mean annual evaporation is in the range of 1700 to 2000 mm. These areas can be classified as “semi‐arid”, with an aridity index of 0.23.
The overall average aridity index is 0.295, classifying the entire island as Semi‐arid.
MAIN SOCIO‐ECONOMIC CHARACTERISTICS
Cyprus has a population of 703,529 inhabitants, with an estimated annual growth rate of 0.54% (Department of Statistics, July 2005 estimates). More than 50% (485,304) are urban

Page | 12
residents, whereas 218,225 are rural residents. The capital of the country is Lefkosia (Nico‐sia) with a population of 213,500. The second biggest city is Lemessos (Limassol) with a pop‐ulation of 161,2002. Figure 4 presents the distribution of population gender and age in 2001.
0 10 20 30 40
0-4
15-19
30-34
45-49
60-64
75-79
0 10 20 30 40
0-4
15-19
30-34
45-49
60-64
75-79
Males Females
0 10 20 30 40
0-4
15-19
30-34
45-49
60-64
75-79
0 10 20 30 40
0-4
15-19
30-34
45-49
60-64
75-79
0 10 20 30 40
0-4
15-19
30-34
45-49
60-64
75-79
0 10 20 30 40
0-4
15-19
30-34
45-49
60-64
75-79
Males Females
Figure 4: Population by Age and Gender (2001)
The Cypriot economy can be considered strong, with a GDP that reached 26.2 billion € in 2004, but is still susceptible to external shocks. Although the most important economic ac‐tivity in the past was agriculture, the agricultural sector is currently declining and the econ‐omy is now dominated by the service sector, mainly tourism and financial services. Erratic economic growth rates over the past decade reflect this reliance on tourism, which often fluctuates with political instability in the region and economic conditions in Western Europe. During the past few years, slow growth in tourism activities and poor fiscal management have resulted in growing budget deficits since 2001.
Overall, the Cypriot economy continues to expand; 2004 was the year that for the first time since 2000 a higher growth rate was recorded compared to the previous year. Growth in some key sectors over 2004 was the following:
• The sector of Agriculture, Hunting and Forestry is exhibiting a negative growth rate of –0.5% in its value added, compared to 5.6% in 2003.
• Construction continued its expansion for a fourth consecutive year, recording a mar‐ginally reduced 5.2% growth in 2004, compared to 5.3% in 2003.
• The sectors of Wholesale and Retail trade, Transport Storage and Communication and Financial Intermediation recorded exceptionally high growth rates in 2004. Ho‐tels and Restaurants is the only activity in the tertiary sector that showed a negative growth rate for a third consecutive year. In particular, the negative growth rate in 2004 is estimated at –2.8% with –4.2% negative growth rate in 2003.
The main agricultural products of the country include cereal grains, olives, citrus, potatoes, and cotton, as well as deciduous fruits and wine grapes. Sheep, goats, poultry, pigs, and some cattle are bred. There is also a strong manufacturing economy (processed foods and beverages, paper, chemicals, textiles, metal products, and refined petroleum). Mineral re‐sources include copper, pyrites, chrome, asbestos, and gypsum. Timber production is also considered important.3
Due to the small domestic market size and the open nature of the economy of Cyprus, access to international markets is considered to be of high economic importance. As a result, trade has always been one of the most important economic sectors, contributing considera‐
2 www.visitcyprus.org.cy 3 www.encyclopedia.com

Page | 13
bly to the economic growth of the country. In 2003, exports accounted for about 7% of the total GDP. The countries of the European Union are the most important markets for Cyprus, corresponding to 54% (199 mil. €) of exports in 2003. The major EU export market is the United Kingdom, followed by Greece, Germany and the Netherlands. The Arab Countries are the second most important market group, corresponding to 17% of exports in 2003. The ma‐jor markets in this group are Jordan, Lebanon, the United Arab Emirates, Saudi Arabia, Ku‐wait and Egypt.
Imports of intermediate inputs (raw materials) and consumer goods make up for most of total imports, accounting for 31% and 29% of the total imports, respectively. Other imported products are transport equipment (14%), capital goods (11%), and fuels and lubricants (10%). In 2003, the imports of raw materials (intermediate inputs) reached 1,234 mil. € (1,232.5 mil €. in 2002).
Tourism is central to the Cypriot economy. Revenue from tourism reached 193 mil. € in June 2005 compared to 186 mil. € in June 2004, recording an increase of 3,7%. For the period January‐June 2005, revenue from tourism was estimated at 633 mil. € compared to 629 mil. € in the corresponding period of 2004, recording an increase of 0.6%4. Employment in res‐taurants and hotels decreased by 0.5% in 2003 compared to the previous year and reached 32,234 persons, accounting for 9.5% of the total economically active population and 10.2% of the total gainfully employed population.
Civil aircraft landings increased during 2003 and totaled 29,177, compared to 28,810 in 2002. Passenger arrivals through airports decreased to 3,041,409 in 2003, compared to 3,105,818 in 2002.5
WATER RESOURCES
Surface water
Following the definitions of the Water Framework Directive, Cyprus has been identified as one River Basin District. Hydrographically, the island is subdivided into 9 hydrological re‐gions, including 70 watersheds and 387 sub‐watersheds. The area under the control of the Cypriot Government includes 47 watersheds. Cyprus falls within Ecoregion 6 (the Mediterra‐nean Sea), on System A, “Ecoregions for transitional and coastal waters, and the Ecoregion 26: Cyprus on System A, “Ecoregions for rivers and lakes” (Republic of Cyprus Law, 13(I)/2004).
As detailed above, the average annual rainfall is about 500 mm, ranging from 300 mm in the central plain and the southeastern parts of the island, up to 1,100 mm at the top of the Troodos mountains (Figure 3). The variation in rainfall is not only regional but also inter‐annual and often two and even three‐year consecutive droughts are observed. Evapotrans‐piration is high, and on an annual basis, corresponds to about 80% of precipitation. In gener‐al, full irrigation is necessary from late spring to late autumn to sustain production of crops requiring water during this period.
Most rivers originate from the Troodos area. The seasonal distribution of surface run‐off fol‐lows the seasonal precipitation patterns, with minimum values during the summer and max‐imum values during the winter. As a result of the Eastern Mediterranean climate, with long 4 www.mof.gov.cy/mof/cystat/statistics.nsf 5 www.mof.gov.cy/mof/cystat/statistics.nsf/All/

Page | 14
hot summers and a low mean annual precipitation, there are no rivers with perennial flow along their entire length. Most rivers flow 3 to 4 months per year and are dry during the rest. Only the upstream parts of some rivers in the Troodos areas have a continuous flow (rivers of Xeros, Diarizos, Kargotis, Marathasa, Kouris and Germasogeia). Twenty four catchments can be considered of medium size (100 to 1000 km²). All others are classified as small (10 to 100 km2). There are only 5 natural lakes which are brackish or salt. The rest of the surface water bodies are man‐made, resulting from river damming or creation of storage basins.
Figure 5: The river basin district of Cyprus, including watersheds and rivers
The average annual water crop for the period 1961 – 1990 amounted to 780 hm³. Some 65%, or 510 hm³, of the total annual water crop correspond to surface run‐off (Table 2). Of the total surface runoff only 45% (230 hm³ or 29% of the total water crop) is lost to sea, a fact that reveals the high level of utilization and control achieved in Cyprus over the last 35 years. Of the total sea outflow, a large proportion corresponds to overland flow and flow from minor streams, which cannot be regulated or controlled.
Table 2: Surface runoff for each Hydrologic Region
No Region Name
Catchment Area (km²)
Average Rainfall (mm)
Surface Runoff (hm³)
Surface Water Use (hm³)
Spate Irrig.
From dams
To re‐charge
Outflow to sea
1 Pafos 1188 627 125 9 47 20 48
2 Tylliria 745 585 59 2 10 7 39
3 Morfou 1585 429 96 7 6 42 41
4 Kyrenia 455 490 16 0 0 9 7
5 Karpasia 685 463 22 0 0 3 19
6 Mesaoria 1840 381 53 4 6 41 2
7 S.E. Mesaoria 546 341 4 0 1 0 3
8 Larnaka 1050 439 39 4 18 10 7
9 Lemesos 1155 555 96 11 64 9 12
Total 9249 508 37 152 141 178
Since 1960, attention was turned to the systematic study and construction of water devel‐opment works, both for storage and recharge purposes. After a comprehensive survey of the island’s water resources, a long‐term plan for the construction of major development

Page | 15
projects was followed, involving the construction of a large number of dams. The total sto‐rage capacity of surface reservoirs has reached 325.5 hm³ of water from a mere 6 hm³ in 1960. This is a truly impressive achievement when compared to other countries of the same size and level of development as Cyprus. The yield of these reservoirs is about 130‐150 hm3/yr, however, this value is now seldom reached due to the decline in rainfall and hence in runoff.
Currently, in Cyprus there are 106 dams and ponds: 35 large dams with a capacity of 286.1 hm³ of water, of which 4 are groundwater recharge‐flood protection dams, 42 small dams with a capacity of 16.1 hm³ of which 32 are recharge‐flood protection dams, and 26 ponds with a capacity of 2.5 hm³. Eighty‐one percent (81%) of the dams, i.e. 85 in number, are earth fill or rock fill. The remaining 19%, i.e. 20 in number, are concrete dams. Generally, these reservoirs are able to hold two to three times the average annual flow of a stream.
0
50
100
150
200
250
300
350
Tota
l Sto
rage
Cap
acity
(mill
ion
m³)
1961
1963
1965
1967
1969
1971
1973
1975
1977
1979
1981
1983
1985
1987
1989
1991
1993
1995
1997
1999
2001
2003
Figure 6: Total storage capacity (1961 – 2004)
Groundwater
Most of the aquifers are phreatic, developed in river or coastal alluvial deposits. These are the biggest and most dynamic aquifers, replenished mainly by river flows and rainfall. During the last decade, almost all aquifers exhibit trends of depletion. Frequent droughts have re‐duced the direct and indirect groundwater recharge, while the construction of dams affected the recharge of downstream aquifers. At the same time, farmers, in their effort to sustain agricultural production, have continued extracting the same quantities of groundwater, and in most cases have even increased these quantities. All these adverse conditions have re‐sulted in saline water intrusion, and hence to the quality deterioration of coastal aquifers and the depletion of the inland ones.
Direct recharge (from rainfall) of the island’s aquifers is of the order of 270 hm³. An addi‐tional recharge of 140 hm³ corresponds to surface runoff, which infiltrates into riverbed aquifers and coastal alluvial fans (Table 3). Part of this replenishment is extracted through wells and boreholes, and the remainder goes to the sea. 8 % or 40 hm³ of surface runoff is diverted for irrigation in late winter or early spring, and especially during the wet season. Where pumping exceeds recharge, a deficit of 10% or 40 hm³, is created in certain aquifers.

Page | 16
The result of the long‐term over‐pumping has been the sea intrusion in certain major coastal aquifers.
Table 3: Groundwater replenishment (surface runoff and directly from rainfall) and use
No Region Name Ground Water Recharge (hm³) Use by (hm³) Deficit
(hm³) Streams Direct Total Pumping to sea
1 Pafos 20 46 66 18 47 0
2 Tylliria 7 23 30 11 20 0
3 Morfou 42 30 72 89 11 29
4 Kyrenia 9 19 28 11 17 0
5 Karpasia 3 26 29 2 27 0
6 Mesaoria 41 47 88 28 60 0
7 S.E. Mesaoria 0 11 11 35 1 25
8 Larnaka 10 34 44 14 31 0
9 Lemesos 9 37 47 35 15 3
Total 141 273 415 243 229 57
The current level of abstractions from all aquifers is estimated at 130 hm³/yr, of which 10 hm³/yr are available through artificial recharge.
Figure 7: Groundwater abstractions per use sector
The average yield of abstractions for domestic water supply during the period of 1991 – 2000 was approximately 25 hm³/year, for irrigation about 102 hm³/yr and for industrial use around 2.5‐3.0 hm³/yr. During the last years, annual abstraction for domestic water supply decreased to a level of 18‐20 hm³.
Figure 8: Groundwater bodies of Cyprus based on the geology
and the type of each aquifer6
6 Modified from the map of aquifers of Cyprus ‐Assessment of Groundwater Resources WDD/FAO A. Georgiou 2002 and G.S.D data.
Page | 17
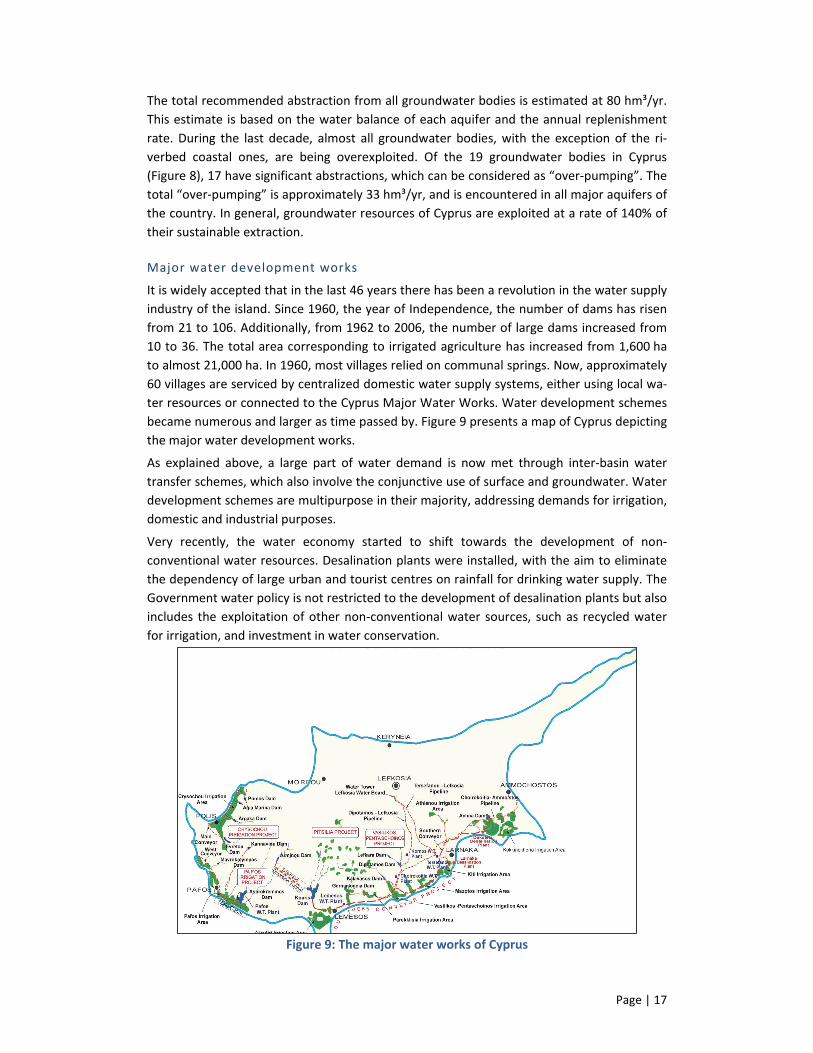
The total recommended abstraction from all groundwater bodies is estimated at 80 hm³/yr. This estimate is based on the water balance of each aquifer and the annual replenishment rate. During the last decade, almost all groundwater bodies, with the exception of the ri‐verbed coastal ones, are being overexploited. Of the 19 groundwater bodies in Cyprus (Figure 8), 17 have significant abstractions, which can be considered as “over‐pumping”. The total “over‐pumping” is approximately 33 hm³/yr, and is encountered in all major aquifers of the country. In general, groundwater resources of Cyprus are exploited at a rate of 140% of their sustainable extraction.
Major water development works
It is widely accepted that in the last 46 years there has been a revolution in the water supply industry of the island. Since 1960, the year of Independence, the number of dams has risen from 21 to 106. Additionally, from 1962 to 2006, the number of large dams increased from 10 to 36. The total area corresponding to irrigated agriculture has increased from 1,600 ha to almost 21,000 ha. In 1960, most villages relied on communal springs. Now, approximately 60 villages are serviced by centralized domestic water supply systems, either using local wa‐ter resources or connected to the Cyprus Major Water Works. Water development schemes became numerous and larger as time passed by. Figure 9 presents a map of Cyprus depicting the major water development works.
As explained above, a large part of water demand is now met through inter‐basin water transfer schemes, which also involve the conjunctive use of surface and groundwater. Water development schemes are multipurpose in their majority, addressing demands for irrigation, domestic and industrial purposes.
Very recently, the water economy started to shift towards the development of non‐conventional water resources. Desalination plants were installed, with the aim to eliminate the dependency of large urban and tourist centres on rainfall for drinking water supply. The Government water policy is not restricted to the development of desalination plants but also includes the exploitation of other non‐conventional water sources, such as recycled water for irrigation, and investment in water conservation.
Figure 9: The major water works of Cyprus

Page | 18
MAJOR CONSTRAINTS FACING THE WATER SECTOR
Reduction of available water resources due to prolonged droughts and climate change
Figure 10 presents the annual rainfall in the island for the last 30 years.
Figure 10: Mean annual rainfall for Cyprus (1987 – 2002)
The statistical analysis of records for the period of hydrological years 1916/17 to 1999/2000 demonstrates a step change or shift around 1970 in precipitation time series. The time series can be divided into two separate stationary periods, with the mean precipitation of the pe‐riod 1987‐2002 being lower than the one of the 1916‐1987 period. Figure 11 presents the differences between the monthly mean of the two periods for the entire island. From the figure, it can be educed that the decrease ranges from 20 to 140 mm and is mainly observed during the December to February period.
No data available since the 1974Turkish invasion and occupation
C E
F
H
G
A B
D
Difference = Mean 1916/17-1969/70 – Mean 1970/71-1999/00
(mm)
-50
-40
-30
-20
-10
0
10
20
O N D J F M A M J J A S
Region A
-50
-40-30
-20
-10
010
20
O N D J F M A M J J A S
Region B
-50
-40-30
-20
-10
010
20
O N D J F M A M J J A S
Region C
-50
-40-30
-20
-10
010
20
O N D J F M A M J J A S
Region D
-50
-40-30
-20
-10
010
20
O N D J F M A M J J A S
Region E
-50
-40-30
-20
-10
010
20
O N D J F M A M J J A S
Region F
-50
-40-30
-20
-10
010
20
O N D J F M A M J J A S
Region G
-50
-40-30
-20
-10
010
20
O N D J F M A M J J A S
Region H
Difference(mm)
-40 to -20-60 to -40-80 to -60
-100 to -80-120 to -100-140 to -120
Figure 11: Differences between the mean of monthly precipitation for the two periods
(1916‐1970 and 1971‐2000)

Page | 19
Impacts to aquifer recharge resulting from dam construction
One of the impacts related to the construction of a large number of dams was the significant reduction of natural recharge in downstream riverbed aquifers, due to the cut‐off effect. At present, this reduction is compensated through dam releases for artificial recharge. Howev‐er, this has not been the case in the past few years, due to the adverse hydrological condi‐tions (Table 4).
Table 4: Artificial recharge from dams in hm³ (2000 – 2004) Dam 2000 2001 2002 2003 2004
Kouris 0.071 0.07 2.6 1 1.9
Germasogia 2.56 4.3 7.6 6.6 6.2
Arminou 3.5 5.2 2.4
TOTAL 2.631 4.37 13.7 12.8 10.5
The currently adopted cropping patterns
The current cropping patterns include water intensive crops, such as citrus (70,893 da; water demand 51.9 hm³), deciduous (24,809 da; water demand 17.3 hm³), olive trees (19,847 da; water demand 8.5 hm³) and annual crops, such as fodders, potatoes, greenhouse cultiva‐tions, open field vegetables (118,724 da; water demand 65.5 hm³). These pose a heavy bur‐den on the water demand in the area and should be substituted with less water intensive crops such as flowers, aromatic plants and winter crops, which rely more on rainfall.
Water losses in domestic water distribution networks (mainly in rural areas)
Water losses in domestic water distribution networks, mainly in rural areas, are quite high. The “unaccounted for” water in the main urban domestic supply distribution networks is estimated in the range of 15 to 20% and about 20 to 30% in the rural areas. Therefore, an additional effort should be made for the timely identification and replacement of defective pipes and for developing a more conscious attitude towards water conservation.
High investment costs for new water development schemes
At present, all economically attractive sites for dam construction have been exploited. From the engineering side, it is possible to construct more; however the venture would entail sig‐nificant investments and it is estimated that the resulting water cost would be higher than the one corresponding to the already developed infrastructure. Additionally, the cost of uti‐lizing alternative water sources, such as desalination or recycled water, is even higher.
SHARING WATER: ISSUES & CHALLENGES
POLLUTION FROM UPSTREAM SOURCES
The environmental condition of surface waters is associated with three main pressures:
• Discharges of dangerous substances (industrial pollution),
• Oxygen demanding and microbial pollution compounds, and
• Nutrient pollution from agricultural sources.
These issues are further elaborated in the following paragraphs.

Page | 20
Discharges of toxic substances
Toxic substances may affect water bodies that are subjected to pressures from: (a) intensive industrial activities, (b) waste disposal sites, (c) mines (abandoned or active) and (d) storm‐water discharges near the large cities and in industrial areas.
The size of industries in Cyprus, according to their production rate and consequently to their wastewater flow rate, is rather small to moderate, when compared to the size of corres‐ponding industries in most European countries. Nevertheless, a large number of small or medium‐size industries are spread all over the country. As can be expected, most of them are developed in areas near major cities (Nicosia, Limassol, Larnaca and Pafos).
Another potential source that could cause pollution of surface waters and is mainly related to the presence of heavy metals (e.g. Fe, Cu, Zn, Mg, Ni), are the mines (either abandoned or in operation) that are spread all over the island. These are located at Skouriotissa (sub‐catchment 3‐3‐4), the Kato and Ano Amiandos villages (sub‐catchment 9‐6‐3), Kalavasos (sub‐catchment 8‐9‐7), Sia and Mathiatis (sub‐catchment 8‐4‐1), Kapedes (sub‐catchment 6‐5‐2), Agrokipia (sub‐catchment 3‐7‐2), sub‐catchment 3‐3‐1, sub‐catchment 3‐5‐4 and sub‐catchment 2‐3‐4. The main water quality problems of water bodies receiving the corres‐ponding effluents and drains are related to acidity, heavy metals (Fe, Cu, Zn, Mg, Ni), high salinity and high chemical oxygen demand, which reduce concentrations of dissolved oxy‐gen.
With respect to solid waste, current practice involves mostly uncontrolled or in some cases semi‐controlled dumping of municipal solid wastes in more than 80 waste disposal sites spread all over the country. The waste disposal sites can contribute to the pollution of sur‐face waters, although the pressure is more significant to groundwater. In cases where the waste disposal sites are close to surface water bodies, the impact is increased. The water bodies potentially at risk are located to watersheds of Chapotami (1‐1), Diarizos (1‐2), Xeros (1‐3, 2‐4, 3‐6, 8‐6), Chrysochou (2‐2), Kochina 2‐5), Serahis (3‐7),Gialias (6‐5), Ammochostos (7‐1), Liopetri (7‐2), Tremithos (8‐4), Germasogeia (9‐2), Garilis (9‐4), Kouris (9‐6), Avdimou (9‐8).
Figure 12: Waste disposal sites in Cyprus

Page | 21
Stormwater discharges may also have a significant influence to the surface water quality near the large cities, Nicosia, Limassol, Larnaca, and Pafos, the industrial areas of each wa‐tershed and the International Airport of Larnaca. The water bodies under pressure are lo‐cated in the sub‐basins 6‐1‐2, 8‐3‐2, and 9‐4‐4.
In Cyprus, the EC Directive 76/464 related to the protection of the aquatic environment from the discharge of dangerous substances is in force, as well as the daughter Directives that specify water quality objectives for dangerous compounds (e.g. lead, cadmium, hexachloro‐benzene), which have to be eliminated in the future.
Based on both the analysis of pressures and monitoring data7, only some rivers can be con‐sidered at the risk (no dams/lakes or coastal waters) of failing the objectives of the WFD due to the presence of toxic substances.
Oxygen demanding and microbial pollution compounds
Oxygen depletion may occur in water bodies, which are subjected to pressures from urba‐nized, highly‐populated areas and from livestock breeding at farms, which are located close to surface water bodies. Furthermore, the organic matter from sanitary landfills that finds its way to leach, as well as conventional pollutants from industrial activity, can also affect water quality in the recipient water bodies.
Based on both the analysis of pressures and monitoring data, both rivers (Xeros, Pediaios, Gialias, Voroklini, Aradippou, Tremithos, Argaki tou Pyrgou, Germasogia, Garylis, Akrotiri, Kouris) and dams/lakes (Polemidia dam) are at the risk of failing the objectives of the WFD due to oxygen depletion. These risks mostly originate from the following sources:
• The 5 urban centres (Nicosia, Limassol, Larnaca, Pafos, Agia Napa) which affect wa‐tersheds 3‐6, 6‐1, 6‐5, 8‐1, 8‐2, 8‐4, 9‐1, 9‐2, 9‐4, 9‐5 and 9‐6;
• The waste disposal sites of Kotsiatis, Vati, Agia Marinouda, Larnaca and Agia Napa, which affect watersheds 6‐1, 6‐5, 9‐5, 1‐4, 8‐1, and 7‐2 (Figure 12);
• Industrial activity near urban areas and in industrial zones (Figure 13).
PolemidhiaDamPolemidhiaDamPolemidhiaDam
Figure 13: Significant industrial point sources
7 Implementation of Articles 5&6 of the Water Framework Directive 2000/60/EC, Volume 4 “Analysis of Impacts”, WDD December 2005

Page | 22
Nutrient pollution from agricultural sources
Nitrogen and phosphorus pollution may potentially affect those water bodies which are sub‐jected to pressures from agricultural activities (cultivation of land or livestock breeding). Based on both the analysis of pressures and monitoring data, the areas with increased loads of nitrogen and phosphorous are located in the eastern part of Cyprus. In this part, the culti‐vated land corresponds to approximately 70% of the total cultivated land of the country. On the other hand, the central and western part of the country consists mainly of forests, which account for 73% of the total forest area of the island and therefore are characterized by sig‐nificantly lower nutrient loads. More specifically, increased loads prevail in basins 1‐3, 3‐6, 3‐7, 6‐1, 6‐5, 7‐1, 7‐2, 8‐1, 8‐2, 8‐4, 8‐7, 9‐2, 9‐4, 9‐5, and 9‐6.
Areas with intensive animal breeding activities are also located in the eastern part of the island, and influence basins 3‐6, 3‐7, 6‐5, 7‐2, 9‐4 and 9‐5. Swine breeding is more intensive in 8 villages, where 70% of the total swine population is concentrated: Orounta, Aradippou, Kato Moni, Meniko, Paliometocho, Monagroulli, Akaki, and Tersefanou. In the Larnaca re‐gion the recorded, intensive, animal breeding is related to all livestock types.
On the basis of both nutrient load and monitoring data analyses, rivers (Kargotis, Xeros, Se‐rachis, Pediaios, Gialias, Voroklini, Aradippou, Tremithos, Germasogia, Akrotiri and Kouris rivers), dams/lakes (Asprokremmos, Achna, Germasogia, Polemidia and Kouris dams) and coastal waters (Limassol, East of Limassol, Vassilikos, Cape Pyla to Paralimni) face the risk of failing the objectives of the WFD due to nutrient pollution. These risks affect watersheds 1‐3, 3‐3, 3‐6, 3‐7, 6‐1, 6‐5, 7‐1, 7‐2, 8‐1, 8‐2, 8‐4, 8‐8, 8‐9, 9‐1, 9‐2, 9‐3, 9‐4, 9‐5 and 9‐6.
INCREASING WATER SCARCITY
The significant drivers and pressures that are connected to water quantity are summarized in Table 5, and are further analysed in the following paragraphs.
Table 5: The significant pressures related to water availability in Cyprus
Pressure Importance [8] Description
Droughts and cli‐mate change
Very Important
Water scarcity is exacerbated by large inter‐annual varia‐tions that can result in two, or even three, consecutive years of drought with rainfall below 300 mm. During the last 30 years a considerable reduction of mean annual rainfall has been experienced in the island (approx. 20%) resulting in a 45% reduction of surface run‐off.
Uneven distribution of rainfall
Important
The variation of rainfall is not only annual but also region‐al. Average annual rainfall is 500 mm but varies from 300 mm in the central plains and the SE parts of the island to 1100 mm in the Troodos mountains and 550 mm in the Kyrenia mountains
Conflicts between urban and agricul‐tural use
Less important
Competing demand and the dynamic competitive tension between agriculture, urban growth including tourism, and the environment are challenging the existing water man‐agement practices of the island.
8 According to the WFD reporting guidance, all significant pressures should be addressed according to their importance within the River Basin District (RBD) : Very Important, Important, Less Important.

Page | 23
Pressure Importance [8] Description
Increased water de‐mand for irrigation and tourism during summer
Very important
There is a pronounced seasonality of demand peaking in the summer period, due to increased irrigation require‐ments and influx of tourists. Certain tourist destination areas experience considerable stress in meeting this de‐mand, as 93% of beds are concentrated along the coast. Tourism further affects the demand for water and sewe‐rage infrastructure. Overall, tourism demand accounts for 21% of total domestic, municipal and industrial water de‐mand.
Inter‐basin water transfer
Important
Existing water infrastructure involves extensive inter‐basin transfers in the south – south‐eastern part of the island (the South Conveyor Project ‐ SCP) and in the southwest to western part of the island (Pafos Irrigation Project) allow‐ing considerable flexibility in the water management in most areas of the island.
Illegal drilling and over‐pumping
Very important
The present level of abstraction for all Cyprus is estimated at 130 hm³/year, whilst the total recommended abstrac‐tion is estimated at 80 hm³/year. As a result, during the last decade almost all the groundwater bodies, except the riverbed coastal aquifers are being overexploited.
Non‐effective exploi‐tation of many wa‐ter development schemes
Important
The need to achieve a sufficiently high internal rate of re‐turn to have a sound project to finance, was accomplished by including new lands for irrigation, thus creating a water demand that did not exist at the initial stage of project design.
Excessive use of fresh water for irri‐gation due to the reluctance in use of tertiary treated wa‐ter
Important
Recycled wastewater acceptance for irrigation is far from certain yet, especially when there is alternative water supply available: early acceptance by the farmers to use tertiary treated effluent (because of the drought period) subsided in the last few years because of the availability of fresh water from the dams.
Drought‐related issues
Cyprus experiences droughts quite often. Statistical analysis of annual rainfall (Figure 10) shows that “dry years” (390 – 470 mm) and “most dry” years (390 mm and less) can be ex‐pected to occur every five years. Drought management includes measures aimed at reducing water supply to water users, water conservation and increase of water availability. Water allocation mechanisms under drought conditions have been established to provide priority to maintaining domestic and municipal water supplies. The second priority is to maintain supplies to perennial crops at 80% of the recommended application levels. Seasonal vegeta‐ble crops are of third priority. Farmers are compensated for the resulting production loss.
During the dry period 1996‐2000, a severe shortage was experienced in all sectors, due to consecutive years of low rainfall. The available water in major dams reached critical low le‐vels and potable water needs were prioritized. It has been estimated that the available sup‐plies of water during this period from all the sources at the areas covered by the Govern‐ment Water Works was on average 87.6 hm3, while the demand for water was calculated at 136 hm3, of which 65 hm3 corresponded to potable water demand in urban and rural areas and 80 hm3 to irrigation (Figure 14).

Page | 24
Due to the limited availability of water resources, priority was given to domestic needs; in agriculture, the irrigation of permanent crops was prioritized, but allocated supply covered only a share of the total water demand. The water allocated to farmers was in the range of 30% to 70% of the normal “average” demand, depending on the type of crop and the availa‐bility of water in each Government project. In some projects, the vegetable area was signifi‐cantly reduced, in order to save water for the irrigation of permanent crops. Various meas‐ures were implemented to face the drought situation, such as water supply restrictions, de‐mand management and supply enhancement.
Figure 14: Water demand & supply balance, 1996 – 2000
Water supply restrictions were imposed on all sectors, leading to a rationalization of water consumption. Eventually, the water shortage was (Savvides, FAO, 2002):
• 23.4% in the domestic sector;
• 37.6% on average in the agricultural sector;
o 49% within the Government projects (20% for the Pafos scheme in the west and 29% for the Southern Conveyor Project in the south and southeast).
o 20% in agriculture outside Government Irrigation Schemes (assumed value).
• 23.4% in the industry and animal breeding activities.
Measures, and especially restrictions in water supply, raised a number of objections from various social groups, and especially by:
• Agricultural organizations, which demanded that the farmers should be compen‐sated by the Government for the lost income due to the unavailability or shortage of water,
• Hotel owners, who demanded that the tourist industry should bear either none or a very small restriction in water supply, and
• Environmental organizations, which argued that reducing the total quantity and the time of access to water supply may not be an effective measure, especially when compared to the dangers these measures inherently have.
The adopted demand management measures that were designed for regulating the demand of the two main water use sectors were the following:

Page | 25
• Domestic sector: (a) Subsidies for the implementation of measures that could save good quality potable water (private borehole drilling, installation of grey water recy‐cling systems in houses, schools, etc.); (b) Distribution (free of charge) of sealed plas‐tic bags to be used as displacers in toilet flush tanks; (c) Reduction of the “unac‐counted for” water in distribution systems; (d) Amendment and strict implementa‐tion of Law 1/91, which prohibits the use of hosepipe for the washing of cars and pavements; (e) Education and awareness campaigns for the need to conserve water.
• Irrigation sector: (a) Subsidies for the installation of rain water collection systems at the roofs of the greenhouses; (b) Subsidies for the installation and use of improved irrigation systems; (c) Application of a quota system for the allocation of govern‐ment irrigation water in combination with penalty charges for overconsumption; (d) No supply of water to new irrigation areas; (e) Educational campaigns for better wa‐ter use and adoption of new less water‐intensive crops.
The adopted supply enhancement measures were related to:
• Desalination, through the expansion of the capacity of existing desalination plant of Dhekelia from 25,000 m³/day to 40,000 m³/day and the acceleration of the process to build and operate a new desalination plant (west of Larnaca) with a capacity of 52,000 m³/day. The main aim of the policy towards desalination was to eliminate the dependency of urban centres and tourist areas on unpredictable rainfall, and thus ensure that water is provided on a continuous basis to households. However, envi‐ronmental NGOs were against this measure due to the high water production costs and environmental concerns.
• Use of recycled water for irrigation. Farmers were initially reluctant to use recycled water for irrigation, as this was the first time recycled water was being used com‐mercially at such large scale. However, the acute water scarcity faded out objec‐tions.
• Emergency measures to temporarily increase the supply of water for drinking pur‐poses in urban and rural areas. This included the drilling of wells, the requisition of private boreholes and water transfer using pipes or trucks.
Uneven distribution of rainfall
Figure 15 displays the mean annual precipitation over the 1970/71‐1999/2000 period. As previously explained, the maximum precipitation levels are recorded in the Troodos moun‐tainous area with values reaching the maximum of 1000 mm/year. The area receiving more than 600 mm of rainfall per year is limited to elevations greater than 500 metres a.m.s.l. on the south‐western slope of the mountain and to elevations greater than 800 metres a.m.s.l. on the north‐eastern slope.
The distribution of the precipitation throughout the year is similar all over the island (Figure 16). Precipitation is recorded during the winter months, whereas the summer months are dry. Mean precipitation increases quickly from August to a maximum in December in the eastern hydrological regions (6, 7, 8). In the central (3, 9) and western (1, 2) hydrological re‐gions the mean precipitation reaches the maximum levels in December and January. The decrease of the mean precipitation is slower than the increase, it spans over eight months from December‐January to a minimum in July‐August.

Page | 26
40 Km20
Scale
0
Hydrological Region Boundary
1
2
9
3
4
6
8
1 Hydrological Region Number
7
5
Ammochostos
Larnaka
Keryneia
Lefkosia
Lemesos
Pafos
Polis
No data available - Area under Turkish occupation
122 rainfall stations whichtime-series include the entire1970/71-1999/2000 period
Mean Annual Rainfall (mm)Time Series 1970/71-1999/2000
1,000 to 1,100
900 to 1,000
800 to 900
700 to 800
600 to 700
500 to 600
400 to 500
300 to 400
200 to 300
ElevationMeters a.m.s.l.
> 18001400 - 18001000 - 1400
600 - 1000200 - 600< 200
Figure 15: 1970/71‐1999/2000 mean annual precipitation in mm
0
5
1 0
1 5
2 0
2 5
O c t N o v D ec J a n F e b M a r A p r M a y J u n J u l A u g S ep
R e g io n 2 R e g io n 1 R e g io n 9
R e g io n 3 R e g io n 6 R e g io n 8R e g io n 7
%
of a
nnua
l mea
n
Figure 16: Average distribution of monthly precipitation through
the year for the period 1971‐2000.
Conflicts between urban and agricultural use
Domestic use and irrigation are the two main water‐consuming sectors in Cyprus. Irrigated agriculture accounts for about 69% of the total water demand whereas the domestic use, which also includes the tourist and industrial demands, corresponds to 25% of the total.
Table 6 presents the projected annual water demand in hm3 for the years 2005, 2010 and 2020. The estimates are based on the following assumptions for the per capita demand:
• 215 l/cap/d for main towns,
• 180 l/cap/d for villages, and
• 465 l/cap/d for tourist demand.

Page | 27
Table 6: Projected annual water demand by main sectors (2000 – 2020) Demand sector/Year 2000 2005 2010 2020
Agricultural Demand 182.4 182.4 182.4 182.4
Annual Crops 71.5 71.5 71.5 71.5
Permanent Crops 102.9 102.9 102.9 102.9
Domestic Demand 68.2 73.1 88.5 107.3
Permanent population 50.6 55.1 59.6 69.5
Tourism 14.1 18.0 22.9 30.8
Industry 3.5 5.,0 6.0 7.0
Environment 12.5 14.0 16.0 20.0
TOTAL (hm³/yr) 263.1 274.5 286.9 309.7
Although agriculture is the major water‐consuming sector, it has a small contribution in the national GDP (2.9% in 2004). On the other hand, tourism activities, which account for only 6% of the total water demand, contribute to the GDP by over 20%.
As a result, and especially during drought, major conflicts arise between the urban and the agricultural sector, which in turn result to serious competition over the allocation of scarce water resources. The situation is worsened by the subsidized water price for irrigation water when compared to the financial cost recovery for domestic supply, as it is strongly believed that this practice does not promote healthy competition and water conservation measures.
Increased water demand for irrigation and tourism during the summer period
There is a pronounced seasonality of domestic and irrigation water demand, which both peak during in the summer period, due to increased influx of tourists and the increased needs for irrigation respectively (Figure 17).
Figure 17: Seasonal water demand (irrigation and domestic water)
for the areas supplied by the Government Water Works
This pronounced seasonality of demand for both uses compromises the ability of the public water system to meet water needs.

Page | 28
Inter‐basin water transfer
Existing water infrastructure involves large inter‐basin transfers in the South‐South‐eastern (South Conveyor Project ‐ SCP) and in the South West‐Western (Pafos Irrigation Project) parts of the island (Figure 9). This allows for considerable flexibility in water management and allocation in most areas.
The Southern Conveyor Project meets water needs in 40% of Cyprus. The project is a multi‐basin, multi‐unit, and multi‐purpose water development scheme, which involves the exploi‐tation of both surface and groundwater. Its aim is to collect, store and redistribute the ru‐noff surplus of the south coast, for providing water for irrigation and domestic use to 80% of the population in the southern and eastern areas. The SCP project also supplies water to the urban centre of Nicosia in the central part of the island. Water availability in the SCP amounts to 65 hm3. Of this amount 26 hm3 is allocated to domestic use and 32 hm3 to irriga‐tion. The principal infrastructure of SCP includes:
(a) The Kouris dam, with a capacity of 115 hm3;
(b) The Dhiarizos diversion (14.5 km), which transfers 21 hm3/year from the Dhiarizos river to the Kouris dam;
(c) The 110 km long Main Conveyor, from the Kouris dam to the Akhna terminal reser‐voir;
(d) The Akhna terminal reservoir with a capacity of 6 hm³;
(e) The Germasogeia dam with a capacity of 13.5 hm³;
(f) The tertiary treatment plant of Lemesos with a capacity of 13 hm3. Outflows are used for irrigation, and future plans concern their use for the artificial recharge of the Ak‐rotiri aquifer;
(g) Irrigated areas of 13,500 ha, with pressurized distribution networks; (h) Two drinking water treatment plants (with a capacity of 100,000 m³/d) which supply
potable water to several urban and tourist areas; and
(i) A telemetry system to monitor and operate the system.
The Paphos Irrigation Project, one of the major projects of Cyprus, had the main objective to develop water resources in the Paphos district for the irrigation of the coastal plain between Khapotami River and Ayios Yeorgios Peyias. Its construction was realized during the period 1976‐1983, and included Asprokremmos dam (capacity of 53 hm³) on Xeropotamos River, the main canal and the western main conveyor, pumping stations, reservoirs, irrigation net‐works and borehole schemes. At present, water from Asprokremmos dam is also used for domestic supply, with water being treated in the respective treatment plant. The project also incorporates the recently constructed dam of Kannaviou (Ezousa River, capacity of 18 hm³).
However, especially during the drought periods, conflicts and demonstrations arise against inter‐basin transfers of water, with local farmers demanding full coverage of their own water needs before any transfer is made.
I llegal borehole drilling and aquifer over‐pumping
Illegal borehole drilling and over‐pumping is a major issue, especially in the south‐eastern part of the island, where groundwater reserves are low, but income from potato production is high. The continuous over‐pumping of aquifer reserves to meet water requirements for sustaining agriculture during the prolonged drought of 1996‐2000 resulted to their depletion

Page | 29
and significant sea intrusion in coastal aquifers, thus diminishing available reserves and re‐ducing the yield of wells. Additionally, the extensive construction of big surface reservoirs has exacerbated the problem, as the natural recharge to the coastal aquifers was reduced, without being followed by an equal reduction in pumping.
Figure 18: Overexploited groundwater bodies
The present level of abstraction in Cyprus is around 130 hm³/yr while the total recommend‐ed abstraction is estimated at 80 hm³/yr at the most. As a result, during the past decade, almost all groundwater bodies, except for riverbed coastal ones are being overexploited (Figure 18). In the majority of groundwater bodies there is a substantial reduction in well yield, which in some cases is of the order of 1/10th of the yield of the previous decade. This is the case of the Kokkinochoria aquifer (Aquifer 1 in Figure 18), where some 5,000 boreholes are in operation today. The yield of these boreholes has been reduced from the average of 10 m³/h in 1980 to 1‐2 m³/h in 2000. During the decade 1991‐2000, the average yield of bo‐reholes used for domestic water supply was estimated at 25 hm³/yr. However, in the past few years there has been a reduction of the order of 5‐7 hm³/yr, with the yield reaching a level of 18 – 20 hm³/yr.
Non‐effective exploitation of many water development schemes
The existing water infrastructure has been the result of master‐plans, extensive and com‐prehensive feasibility studies and sound workmanship.
The implementation of Government Irrigation Schemes resulted in the development of irri‐gation in certain regions, which in turn created a water demand that did not exist before. This development was based on the need to achieve a sufficiently high internal rate of re‐turn, in order to have an economically sound project to finance. However, this policy should have been more prudent in view of the arid to semi‐arid nature of the climate of the island. In addition, the design of water works did not take into account the drought periods expe‐rienced in 1931‐33 and 1970‐73, assuming that the 40‐year interval of average/wet hydro‐logical years was sufficient for the evaluation of the yield of projects aimed at surface water exploitation.

Page | 30
In summary, the design and evaluation of projects was based on the assumption of higher yields and consequently larger areas that could be irrigated by each. Of course, these deci‐sions were not only based on economic evaluation but also on pressures by political lobbies and local farmers. Further to that, the evaluation did not consider the change of cropping patterns, which resulted in the adoption of water‐intensive crops (bananas compared to ta‐ble grapes). The devastating results of the above planning were felt during the intense drought experienced from 1990 and onwards.
In other cases, the decrease of employment in the agricultural sector and the boost in the tourist industry in certain areas did not allow for the development of agriculture as planned, thus limiting the use of water works. The phenomenon was aggravated by the reduced ex‐port prices for certain agricultural products, a fact that also proved that market studies per‐formed during the feasibility studies were not exhaustive or insightful enough.
Excessive use of dam water due to the reluctance in using tertiary treated ef‐fluent
Recycled water is a rapidly emerging alternative water source for Cyprus. Its use was in‐itiated in 1998, when approximately 1.3 hm³ were used in the area of Limassol. Since then, its production and use has increased, and at the end of 2004 almost 5 hm³ were used, re‐placing equal quantities of fresh water (Figure 19).
Figure 19: Irrigation supply sources in the Government Irrigation Schemes
for the period 1991 – 2004 (WDD, 2004)
However, the acceptance of the use of treated effluents in irrigated agriculture is far from certain, especially when alternative sources are available. The demonstrated early positive response of farmers in using treated effluent during recent droughts subsided when the availability of freshwater from storage reservoirs became higher.
The most significant issues relating to water reuse are experienced during the winter, when irrigation demand is minimum or zero. The intention of the Water Development Department is to store the quantities of recycled water produced during the winter either in storage res‐

Page | 31
ervoirs (Polemidhia and Ypsonas reservoir in Limassol) or in aquifers (artificial recharge of the Akrotiri aquifer in Limassol and the Ezousas riverbed aquifer in Pafos), so that it can be used during the peak summer period.
The artificial recharge of the Ezousas aquifer is being implemented since 2003. However, this was not the case for Akrotiri aquifer, due to the objections of the Episkopi Local Authority. As a result, large quantities of recycled water were rejected in the sea of Limassol, depriving the water system of a precious resource.
At this point, there is wide recognition of the need for alternative policies which could strengthen the use of the recycled water in the urban and rural environment (green areas, parks, and forestation), in supporting agricultural water needs, and for the recharge of groundwater reserves.
GOVERNING WATER: CONTEXT & CHALLENGES
THE INSTITUTIONAL SETTING
Ownership and responsibility for water management
Overall, bulk water supply provision for domestic use falls under the responsibility of the Water Development Department (WDD) of the Ministry of Agriculture, Natural Resources and the Environment. The WDD is responsible for the construction, operation, administra‐tion and management of all Government Water Works related to freshwater provision.
At the users’ level, domestic water supplies are managed by the Town Water Boards in the major metropolitan areas of Nicosia, Larnaca, and Limassol, by Municipal Authorities in oth‐er municipalities, and by Community Boards in villages and small communities. The opera‐tion of Water Boards and Community Boards is governed by the “Water Supply (Municipal & Areas) Law (Cap 350)”. This law foresees the establishment of Water Boards and control and management of water supplies in municipal and other purposes, e.g. breaking open streets, entry onto land, installation of pipes, etc. The Boards have the power to impose water rates or charges for the supply of water, but only after the approval of the Council of Ministers and the Parliament of the Republic of Cyprus. Water sources managed by the Boards can be developed by themselves or include bulk water supply from the Government Water Works.
Irrigation water supply in Cyprus is managed by local Irrigation Divisions formed of landown‐ers, and at a lesser extent by Irrigation Associations, formed of water‐rights owners. Almost half of irrigation demand is directly supplied by the Government Water Works.
Ministries, authorities and institutions at national level with a role in water management
At the policy level, the water administration rests with the Council of Ministers that is formed jointly by four Ministries: Agriculture, Finance, Interior and Commerce. At the execu‐tive level, powers are divided between two ministries, the Ministry of Agriculture, Natural Resources and Environment (MANR&E) and the Ministry of Interior. The MANR&E has tech‐nical responsibility for water resources policy, assessment and monitoring, but also for the development of water resources and the provision of bulk water supply to end‐users. The Ministry of the Interior is responsible for the enforcement of water‐related laws, including the issue of groundwater permits. Its representatives act as the chairmen of Municipal Wa‐

Page | 32
ter Boards, Village Water Commissions and local irrigation associations, known as Irrigation Divisions.
The Water Development Department (WDD), which is one of the departments of the Minis‐try of Agriculture National Resources and Environment (MANR&E), is responsible for imple‐menting the water policy of the Ministry, with the overall objective of pursuing the rational development and management of water resources.
At the regional level, the District Administration under the Ministry of Interior plays a key role in the implementation and enforcement of water‐related laws, including the issue of groundwater permits. All municipal water supplies and non‐government irrigation schemes are in principle under the jurisdiction of the Ministry of Interior. Other government depart‐ments are also involved at various aspects of the water industry of the island (Figure 20). Table 7: Responsibilities in water management
Authority Name Role/Main Activities in relation to water man‐
agement
Governmental Institutions
Ministries
Water Development Department (WDD) ‐ Ministry of Agriculture, Natural Resources and the Environment
Technical responsibility for water resources poli‐cy, assessment and monitoring and for devel‐opment of water resources and for the bulk sale of water to end‐users.
District Administration ‐ Ministry of the Interior
Plays a key role in the implementation and en‐forcement of water‐related laws including the issue of groundwater permits. All municipal wa‐ter supplies and non‐government irrigation schemes are in principle under the jurisdiction of the Ministry of Interior
Municipalities Local Municipalities and Communities, Union of Communities
Responsible for water administration at local level.
Other
The Department of Agri‐culture
Department of the Ministry of Agriculture, Natu‐ral Resources and Environment. The Department of Agriculture runs extension services that advise farmers on irrigation methods, fertilizers and other issues.
Environmental Service Department of the Ministry of Agriculture, Natu‐ral Resources and Environment.
Public Utilities
Water Utility Water Boards (WB) Provide waterworks and sewerage services.
Wastewater Utility Sewerage Boards (SB)
Responsibility for water administration at the local level is in the hands of the Municipal Wa‐ter Boards and Village Commissions for domestic water supply, the Irrigation Divisions, Irri‐gation Associations, Waterworks Committees and WDD for irrigation, and the Sewerage Boards for wastewater collection and treatment. All these organizations, except the WDD, are under the jurisdiction of the Ministry of Interior.

Page | 33
Figure 20: The administrative, institutional and political setting
of the water sector in Cyprus
At the user level, farmers have the right to form Irrigation Divisions and Associations to con‐struct and manage irrigation schemes. Villages also have the right to establish their own Commissions for developing local resources for domestic water supply. The authori‐ties/organisations which play a key role in the management of the water resources in the region are presented in Table 7 and Figure 21. Table 6 presents the water resources planning matrix.
Figure 21: The Organisational Chart for Water Resources Management

Page | 34
Table 8: Water resources planning matrix
ACTIVITY WDD District Adminis‐tration
Sewerage Boards
Water Boards
Dept. Of Agricul‐ture
Environ‐mental Service
Surface water Use X X X X X Storage X X Groundwater re‐charge
X
Diversion X Quality monitoring X X X Assessment X X X X
Groundwater Use X X X Storage X Recharge X Quality monitoring X X X Assessment X X X Well permits X
Irrigation networks/infrastructure Rehabilitation X Modernisation X Reuse Drainage water X X X X
Desalination Introduction of technology
X
Efficient water utilisation Domestic X Industrial X Agricultural X
Legislation Regulation and codes
X X X X
Standards X X X X Policy setting X X Enforcement X
Water allocation X X Infrastructure projects Project financing X Project design X Project implemen‐tation
X
Operation and Maintenance
X X X
Pricing (tariffs) X Water data records X X X X

Page | 35
PROVISION OF WATER SERVICES & FINANCING OF WATER SECTOR INVEST‐MENTS
Overview
The policy control of water resource management in Cyprus is at present divided between the Ministry of Interior, the Ministry of Agriculture, Natural Resources and Environment, the Ministry of Finance and the Planning Bureau. Water services in Cyprus can be classified into two broad categories:
• Services provided on the freshwater supply side, i.e. services related to the abstrac‐tion of freshwater, impoundment, storage, treatment, the production of desalinated water, and water distribution;
• Services provided on the wastewater side, i.e. services related to drainage, sewerage collection, treatment, and provision of recycled water (effluent after tertiary treat‐ment).
Table 9 summarises the water services, policy responsibilities and investment responsibili‐ties, while a detailed analysis is presented in the following sections.
The Government, through the Government Water Works that are administered by the Wa‐ter Development Department, is the main provider of freshwater in Cyprus, providing ser‐vices to both domestic users, through the provision of bulk water quantities to Water Boards, Municipal Authorities and Community Boards, and through the provision of irriga‐tion freshwater on a retail basis to farmers, or on a bulk basis to irrigation Divisions and As‐sociations.
The financing of the Government Water Works, the Irrigation Division projects, the village water supplies and the town water supplies are made either through Government funds or through loans from International Financing Institutions, such as the World Bank, The Kuwait Fund or the European Investment Bank. In case of sewerage projects constructed by the Se‐wage Boards or for works carried out by the Water Boards, the plans are prepared and im‐plemented by the respective organizations, and their financing is done by the organizations themselves. Recently, the Build, Own, Operate and Transfer (BOOT) financing method was adopted for the construction and operation of the two desalination plants of the island. This method provides that the successful Contractor will design and construct the plant with its own financial resources and then will own and operate the plant for ten years and sell water (agreed minimum quantities) of a specified quality, to the Government at a rate fixed after international tendering. On the other hand, the Government is obliged to buy the specific minimum quantities of water. At the end of the ten‐year period, the plant ownership shall be transferred to the Government at no additional cost, with the Government also having the right to buy the plant before the end of the ten year period, as was the case with the Dhekelia desalination plant.
Domestic water supply
Currently, the Government Water Works cover more that 80% of the total demand for pota‐ble water, including industrial needs. Water is supplied on a bulk basis to the Town Water Boards (Nicosia, Limassol, Larnaca, Famagusta, and Pafos), Municipal Authorities and Com‐munity Boards. The share of water supplied by Water Boards through the development of own resources is very low (approximately 1% for the Nicosia Water Board and less than 30% for other Water Boards). Water resources allocated to domestic use provided either by the

Page | 36
WDD or by the Water Boards or individual users include (a) Surface water from dams, treated in water treatment plants; and (b) Groundwater, from public and private boreholes.
Recently, desalinated water is purchased by the Government on the basis of Build‐Own‐Operate‐Transfer (BOOT) contracts from private companies, which have undertaken the construction and operation of the two major desalination plants of Dhekelia and Larnaca airport.
Water Boards, Municipalities and Community Boards are responsible for the water distribu‐tion works within the boundaries of their jurisdiction.
Table 9: Water services and responsibilities Service Responsibility (Policy) Responsibility (Investments)
Surface water abstraction, storage, treatment
Water Development Department Water Development Department
Water desalination Water Development Department Private Sector
Groundwater abstraction
Town Water Boards (in the major metropolitan areas), Municipal Authorities (in smaller municipalities) Community Boards (in villages) Irrigation Divisions and Associa‐tions Individual Users Water Development Department
Town Water Boards (in the major metropolitan areas), Municipal Authorities (in smaller municipalities), Community Boards (in villages), Irrigation Divisions/Associations Individual Users Water Development Department
Water distribution in ur‐ban and rural areas
Town Water Boards Municipal Authorities Community Boards
Town Water Boards Municipal Authorities Community Boards
Water supply for crop irrigation
Water Development Department Irrigation Divisions (landowner’s associations) Irrigation Associations (water rights owners associations)
Water Development Department Irrigation Divisions (landowner’s associations) Irrigation Associations (water rights owners associations)
Wastewater collection and secondary treatment in urban and rural areas
Sewerage Boards Sewerage Boards
Tertiary wastewater treatment and recycled water provision
Water Development Department Water Development Department
Industrial wastewater treatment
Environmental Service Water Development Department
Individual Users Water Development Department
Irrigation water supply
Almost half of the irrigation demand is supplied directly by Government, through the Gov‐ernment Water Works. Approximately 60% of the irrigation demand occurs within the Gov‐ernment Irrigation Schemes and is supplied by:
• Surface water from the pertinent dams, which constitutes the main water supply source;
• Groundwater, abstracted from public and private boreholes;

Page | 37
• Recycled water, which is partly stored in Polemidhia dam and consecutively used in the Germasogeia / Polemidhia Irrigation Scheme.
The irrigation water supplies in Cyprus are managed by local Irrigation Divisions, formed by landowners, and to a lesser extent by Irrigation Associations formed by water‐rights owners. The Government, through the WDD, provides fresh or recycled irrigation water on a retail basis to farmers, or on a bulk basis to Irrigation Divisions and Associations.
Wastewater collection and treatment
Currently in Cyprus, the Sewerage Boards of Limassol‐Amathus, the Joint Venture of Sewe‐rage Boards of Ayia Napa and Paralimni, the Sewerage Board of Pafos, the Sewerage Board of Larnaca and the Sewerage Board of Nicosia constitute the main service providers in the field of sewage collection, wastewater treatment and drainage.
Most industries are self‐supplied in terms of wastewater treatment, since according to the current legislation, industries should pre‐treat their effluents before discharging these to the sewerage system. However, a number of industries, characterised as significant with respect to their effluents, discharge to the Government Central Wastewater Treatment Plant of Va‐thia Gonia of the Nicosia District and to the treatment plant of Vati in the district of Limassol. Charges are estimated individually, according to the type and volume of effluents.
Recycled water
Recycled water is a resource that has been given increasing attention during the last few years, due to water supply restrictions applied to irrigation water use. According to the cur‐rent institutional framework, sewage collection and secondary wastewater treatment are responsibility of the Sewerage Boards. However, in addition to the sewerage networks, de‐veloped projects also involve a centralised treatment plant at tertiary degree of purification. By Decision of the Council of Ministers, the cost of tertiary effluent treatment (both capital and operation and maintenance), which renders the water suitable for irrigation of almost all cultivations (except for green leaf vegetables), is undertaken by the Government. The Government has then the right to direct such water to its systems for the irrigation of tree plantations or hotel gardens, as well as any other use requiring non‐potable water.
LEGISLATION
Cyprus, as Member State of the EU, has the responsibility to review the status and characte‐ristics of its water resources and develop its own national strategy for the implementation of the Water Framework Directive (2000/60/EC). The provisions of the Water Framework Di‐rective have been transposed into national legislation through the Water Protection and Management Law 13(I)/2004, which was adopted by the House of Representatives on Feb‐ruary 5th, 2004.
The Water Development Department (WDD) is responsible for implementing the legislative requirements relating to water resources, with the main policy objective being the rational development and management of the water resources of Cyprus. In this context, the re‐sponsibilities of the WDD are wide and diverse, addressing:
• The collection, processing and classification of hydrological, hydrogeological, geo‐technical and other data necessary for the study, maintenance and preservation of existing water development works;
Page | 38
• The study, design, construction, operation and maintenance of works, such as dams, ponds, irrigation, domestic water supply and sewerage schemes, water treatment works, sewage treatment and desalination plants; and
• The protection of water resources from pollution.
The “Water Protection and Management Law [13(I)/2004]” provides for the elimination or reduction and control of water pollution in Cyprus, for the best possible protection of natu‐ral water resources and the health and well‐being of the population. It also provides for the protection and improvement of the environment and water‐dependent ecosystems. The Law defines "what is waste" and vests power in the MANR&E and the Environmental Service to control the disposal of wastewater into surface or groundwater bodies. Additionally, the law includes provisions for the protection of natural water resources from waste disposal and the pollution of water from industrial and domestic pollution sources and wastewater treatment plants. The MANR&E and the Minister of Social Insurance and Labour (MSIL) can issue permits for the disposal of waste or treated waste defining the method, quantities, frequency of disposal, location and concentration of pollutants. The Ministers can also ap‐point "Inspectors" for the examination of permit applications, and for the enforcement of regulations and permit controls.
The “Water Protection and Management Law” also provides for the creation of the “Directo‐rate for Integrated Water Management” within the Government, to undertake the man‐agement of the water resources of Cyprus. The main issues considered are:
• The definition of one authority responsible for the development and management of water resources, i.e. the Minister at the political level and the Directorate Director at the technical and executive level;
• The compliance with European standards and the consideration of both qualitative and quantitative parameters for water bodies;
• The formulation of an Advisory Committee and the “Directorate for Integrated Wa‐ter Management”, which will advise the MANR&E on water resources management issues; and
• The consideration of the European Union Framework Directive and other European directives related to water resources.
This creation of the “Directorate for Integrated Water Management” is promoted by the “Responsibilities of the Directorate for Integrated Water Management Law”, which is ex‐pected to be adopted by the House of Representatives in the near future 9.
Additionally, there are six other important water laws in force, and 15 other laws that in‐clude provisions related to water. They form the basis of resource development, interaction between the Government and users, and the establishment of local water authorities. The legislation addressing groundwater abstraction can be considered as particularly deficient, when taking into account the significant degradation of several aquifers. Illegal drilling of wells has been a quite common phenomenon, and there are cases of aquifers where almost 47% of wells were drilled without a permit. The responsibility for monitoring compliance and
9 The respective Bill was expected to be approved by the Council of Ministers in 2007. Then it will be presented in the House of Representatives to be transposed to the “Responsibilities of the Direc‐torate for Integrated Water Management Law”.

Page | 39
illegal well drilling and control lies within the District Officer of the Ministry of Interior. Table 10 presents the most important legislation for water resources management and protection.
Table 10: Water laws and regulations (Source: Official Gazette of the Cyprus Government) REFERENCE FOCUS CONTENT
Water Protec‐tion and Management Law 13(I)/2004
Reduction and control of wa‐ter pollution
The Water Protection and Management Law provides for the eli‐mination or reduction and control of water pollution in Cyprus, for the best protection possible of natural water resources and the health and well being of the population. It also provides for the protection and improvement of the environment and water‐dependent ecosystems.
The Govern‐ment Water‐works Law (Cap 341)
Groundwater and Surface Waters
The law governs more than 98% of the natural water resources of the island and vests groundwater and all surface water running to waste from any river, spring or water course and all other waste water to the State. The law also empowers the Council of Ministers to plan, design, construct, operate and maintain any water works for the purpose of taking or utilizing water, or replenishing an aqui‐fer or land drainage or protecting land from floods, pollution, or erosion using if necessary compulsory purchase powers, and to sell water at a price calculated according to provisions of the law and the approval of the Parliament. It does not foresee for drought events, but provisions of the law give power to the Government to deal with emergency situations including drought.
Wells Law (Cap 351)
Wells, Bore‐holes, Sunks
The law allows the District Offices to issue permits for the sinking of wells or drilling of boreholes for the abstraction of groundwater. This law was partly improved by the Water Supply (Special Meas‐ures) Law of 1964, which gave to the Government the power to declare and designate areas for groundwater protection against overexploitation.
The Irrigation Division (Vil‐lages) Law (Cap 342)
Irrigation Wa‐ter
This law is administered by the respective District Officer who is empowered to form Irrigation Divisions, at his own instance or upon the written request of not less than 10 land proprietors, for the purpose of carrying out irrigation works. Under this law, the water and the waterworks are linked to the land and not to the proprietors. This law is the third most important law and widely applied for the construction of minor irrigation schemes. The Gov‐ernment promotes the construction of simple, small‐scale irriga‐tion projects through this law by subsidizing a share of the invest‐ment costs and for the maintenance of works. A Committee elected by the members of the Irrigation Division is responsible for the construction, maintenance, operation and management of the irrigation scheme, including the recovery of these costs. The tariff is fixed by the Committee and approved by the District Officer.
Water Supply (Special Measures) Law (32/64, 35/65, 17/75)
Water short‐age / deficien‐cy
The law empowers the Council of Ministers to declare an area “un‐der supervision” on the condition that due to exceptional circums‐tances, a serious shortage or water deficiency is experienced or is likely to incur in the area, and that special measures for the con‐servation of water resources and maintenance of water supplies are necessary for the public interest. Under the Special Measures Law the Director of the WDD is empowered to refuse the issue of a permit for the sinking or construction of wells or drilling of bore‐holes for the abstraction of groundwater, if such action is to affect qualitatively and quantitatively groundwater supplies. This is the second most important law dealing with the protection of ground‐water.

Page | 40
REFERENCE FOCUS CONTENT
The Irrigation (Private Wa‐ter) Associa‐tion Law (Cap 115)
Irrigation Wa‐ter
The law gives the opportunity for at least seven (7) owners that have water rights to form an Association for the construction, im‐provement, maintenance or repair of any irrigation works related to their common water, including the recovery of corresponding costs. The tariff is fixed by the Committee and approved by the District Officer. The Government policy is to discourage the devel‐opment of privately‐ owned water use rights and for this purpose, limits are imposed on the subsidy for such water works.
The Water Supply (Mu‐nicipal and Other Areas) Law (Cap 350)
Drinking Wa‐ter
The law provides for the establishment of Water Boards for the control and management of water supplies in municipal and other areas, under the chairmanship of the District Officer. The law al‐lows the creation of semi‐governmental organizations (Water Boards) responsible for the development, treatment, distribution and provision of potable water within the boundaries of inhabited areas fixed by the Council of Ministers, for domestic and industrial purposes including tourism and recreational uses. Water tariffs are set by the Council of Ministers and approved by the Parliament.
Water (Do‐mestic Pur‐poses) Villag‐es Supplies Law (Cap 349)
Drinking Wa‐ter
The law provides for the establishment of Village Water Commis‐sions for water supply in villages and small communities. A Village Commission is in charge of providing adequate supply of potable water for domestic use and maintains such supply and any water works connected therewith in clean and good condition. The Dis‐trict Officer administers this law, and all requests for studies and construction of water works are submitted to the WDD, which de‐signs and implements the water projects. The responsibility for the management, operation and maintenance of the small schemes is vested to the Village Water Commission headed by the District Officer.
Public Rivers Protection law (Cap 82)
Public Rivers
Under this law, certain offences may be prescribed in relation to rivers declared to be ‘public’ by the President by Order in Council. Such offences include break down or damaging any bank of a river. Similarly by notice in the Gazette, the District Officer can prohibit certain acts, such as the removal of materials from the riverbed and riverbank, the dumping of waste in the vicinity etc.
Sewage and Drainage Law
Sewage efflu‐ent and drai‐nage water
This law provides for the creation of Sewerage Boards for the col‐lection, treatment and disposal of sewage effluent and drainage water (flood) from areas defined by the Council of Ministers as “Sewage and Drainage Law Areas”. The Sewerage Boards are re‐sponsible for the planning, design, construction, operation and maintenance of all required works and for collecting bills for the services offered. The service cost charged to the beneficiaries is made up of two components, the fixed cost, which represents the capital cost and the variable costs, which represent the mainten‐ance, operation, energy and management costs.
The most important law with regard to the management of water resources in the country is the Government Waterworks Law. Nevertheless, it can be considered that the law fails its purpose, since it does not explicitly define one single administrative authority having the effective and overall responsibility for the management of water resources and waterworks. Instead, the law bears the fragmentary nature of responsibility, which is a great impediment to effective water management.

Page | 41
Water management in Cyprus meets several difficulties due to inherent legal and institu‐tional framework deficiencies. Most of these problems have been on the discussion table in the past 40 years, and many proposals and legislation formulations have been forwarded for ratification. Nevertheless, the accession of Cyprus to the European Union gave a new impe‐tus for addressing these problems. However, up to this moment, no final decisions have been taken.
Most problems arise from the fragmentation of jurisdiction in the planning, design, imple‐mentation and control of water management operations. The WDD is responsible at the ex‐ecutive and technical levels for water management; to that end, the situation is very satis‐factory. However, effective decision‐making, project implementation and enforcement is made difficult, as legal and management responsibilities still rest to the District Offices of the Ministry for the Interior. These difficulties lead to considerable delays in project authoriza‐tion, implementation and efficiency. As presented above, the District Officer is the control‐ling authority at the user level, with the WDD and the Department of Agriculture acting as advisors on technical matters. This has proven to be an unsatisfactory arrangement, due to the multiplicity of departments and authorities involved. For example, when there is conflict of interest and purpose, the technical departments are unable to support the implementa‐tion of agricultural policies and to define domestic supply allocation.
However, as presently changes are being considered, a restructuring of the water sector in Cyprus into a more unified set up or single institution is expected. Some existing laws will need to be reviewed and a new water code will have to be enacted, covering all functions associated with water management in its widest context.
CONSTRAINTS & CHALLENGES OF THE CURRENT GOVERNANCE SETTING
Ineffective and inefficient allocation of l imited water resources
Almost 60% of available water resources are currently used in the agricultural sector, which has a minor contribution (less than 5%) in the overall national wealth. The issue is further complicated by the traditional two‐tiered nature of water rights: users of water systems owned by the Government pay the established tariff, while well‐owners do not pay. Under such conditions, an increase in tariffs for public water supply is bound to encourage further overexploitation and mismanagement of groundwater. The concept of equity among far‐mers depending on surface water distribution and those depending on private wells does not exist. The realization of a policy of uniform water rates over the island remains a difficult and conflicting issue.
Difficulties in the implementation of water pricing policies
The introduction of higher irrigation water prices always provokes opposition of the politi‐cally strong agricultural lobby, in spite of the fact that the increase is accompanied by vari‐ous financial compensation measures. The main argument supported by farmers is that agri‐culture is important, because it ensures food security and production of raw materials in the country, thus reducing dependency on imports. For social and even for environmental rea‐sons, agriculture should be further subsidized and not penalized with higher water prices.

Page | 42
Weaknesses of existing institutional and organizational structures and fragmen‐tation of responsibility
The existing institutional setup is rather complex and bureaucratic, with at least four Minis‐tries involved in policy formulation, 15 Governmental Departments dealing with various pol‐icy implementation aspects, and a great number of Water Users’ Organizations, either for domestic or irrigation water supply. Water laws are many and complex, including duplica‐tions. These have been amended from time to time in the past, to address emerging needs, so as to meet requirements of various water‐related interests and authorities. It is widely supported that laws need to be grouped in an organized form or code.
The co‐operation between different agencies and services for the management of water re‐sources can be considered adequate when taking into account the different approaches and goals set by each. However, the fragmentation of responsibility has caused many problems in all sectors. With one department being in charge for water management at the executive level (WDD), management is very efficient on the technical side. However, effective deci‐sion‐making, implementation of projects and legislation enforcement remain difficult, as significant management responsibilities are also allocated to District Officers. For example, by Law, the District Officer is responsible for the issue of drilling and water use permits. Usually but not always, the advice of the Water Development Department is requested. This has repercussions both on the management of the aquifers but also on agricultural activities. Furthermore, the District Officer (appointed by the Ministry of Interior) is the chairman of the Irrigation Divisions and the Town Water Boards, while the representative of the Water Development Department participates as advisor. Although there is generally good coopera‐tion among the District Officer and all the Technical Departments of MANR&E, frequent con‐flicts of interest do not allow for the implementation of clear policies. This, in turn, may re‐sult to non‐sustainable management of scarce water resources.
Society‐driven conflicts
Conflicts and competition over water supply, mostly stemming from the current develop‐ment pattern, greatly affect water management policies. A good example demonstrating the complexity of issues that need to be resolved is encountered in the Limassol region which is one of the most popular tourist destinations in Cyprus. In the same region, there is signifi‐cant irrigation demand: agricultural production accounts for more than 25% of the fruit trees, 6% of vegetables and 20% of the table grapes production of the country. The area is considered water‐rich, when compared to other areas of Cyprus. It also bears the most im‐portant water supply infrastructure works, which, through the Southern Conveyor Project, supply water to almost the entire southern area of the island. As a result, during drought periods, local farmers strongly protest against inter‐basin water transfer, demanding that their water needs are prioritized over domestic and irrigation demands of other areas.
VALUING WATER: ISSUES & CHALLENGES
COST RECOVERY
The Government, through the Government Water Works that are administered by the Wa‐ter Development Department, is the main provider of freshwater in Cyprus providing servic‐es to domestic users, through the provision of bulk water quantities to Water Boards, Munic‐ipal Authorities and Community Boards, and irrigation. Freshwater for crop irrigation is ei‐

Page | 43
ther provided on a retail basis to farmers, or on a bulk basis to Irrigation Divisions and Asso‐ciations.
The WFD describes that the assessment of cost recovery and pricing incentives are required at the river basin district scale for each category of identified water service. Since Cyprus has been identified as one river basin district10 data for financial costs and cost recovery rates are available at that level. In 2005, the total cost for water services of abstraction, construc‐tion, regulation and conveyance of surface waters, by means of large dams, channels and pipelines, and water purchases from desalination units, as well as groundwater exploitation works administered by the WDD was equal to 42.1 million C£.
The cost recovery of water services is analysed for different uses, by considering storage and main transportation, distribution, sewage collection, wastewater treatment and associated environmental and resource costs. The analysed water services include:
• Freshwater provision to domestic use and irrigation, through the Government Wa‐ter Works11. The analysis for this case is conducted for all Government Water Works within the river basin district12. It should be noted that, according to the current in‐stitutional framework, costs (and tariffs) for freshwater provision through the Gov‐ernment Water Works constitute the major factor regulating the imposed end‐user costs, while the Government Water Works currently supply more than 70% of the total freshwater within the river basin district. Domestic uses in this case include both households and industries, since both are serviced through the same con‐veyance and distribution networks;
• Urban wastewater collection and treatment provided by the Sewerage Boards of Limassol‐Amathous, Pafos, Ayia Napa, Paralimni and Larnaca;
• Recycled water provision for irrigation purposes, through the Government Water Works.
The results that are presented in the following paragraphs do not address water distribution through Water Boards, Municipalities and Community Boards for domestic water supply and Irrigation Divisions for irrigation water supply, as well as self‐supplied uses, including private (mostly groundwater) abstractions, industrial wastewater treatment and domestic septic treatment, for which no data exist.
For domestic water provision (households, tourism, industries) through the Government Water Works:
• Financial costs show an increasing trend, mainly due to the increase of operation and maintenance costs. Although several investments have been realised during the period 2001 – 2005, their contribution to the total cost is surpassed by the augmen‐tation of running costs, attributed to the high share of desalinated water in domestic supply sources;
10 WDD, “Implementation of Articles 5&6 of the Water Framework Directive 2000/60/EC – Characteri‐sation of surface water body types”, Vol. 1 – Dec. 2004 11 WDD, “Implementation of Articles 5&6 of the Water Framework Directive 2000/60/EC – Assess‐ment of the current levels of cost recovery of water services”, Vol. 12, WFD December 2004 12 Cyprus is considered as one river basin district. Financial costs and cost recovery levels are esti‐mated at the level of the river basin district.

Page | 44
• Environmental costs have minor contribution in the total costs, since groundwater abstractions from Government water works are only complementary for public do‐mestic supplies;
• Resource costs show a continuous decline, due to the increasing water availability conditions, which minimizes benefits foregone from agricultural water use;
• After the tariff increase effected in 01/01/2004, cost recovery of financial costs is improved, expected to reach approximately 73.1% in 2005.
For irrigation freshwater provision through the Government Water Works:
• Financial costs seem to be stabilized, since in most Government Projects no addi‐tional investments have been realized during the 2001 – 2005 period. At the same time, operation and maintenance costs are more or less constant;
• Environmental costs make a minor contribution to the total cost, since groundwater abstractions from Government water works are only complementary, and surface water from dams is the main water resource used;
• Resource costs are equal to zero, since from 2002 and onwards no deficit is expe‐rienced in domestic water supply;
• Currently after the price increase, recovery of financial costs has considerably im‐proved, reaching 67.4% in 2004, and projected approximately to 77% in 2005. Cost recovery was expected to improve further by 2007, when irrigation tariffs would have reached the final price of 0.11C£ /m3.
For urban wastewater collection and treatment by Sewerage Boards:
• Cost recovery seems to be adequate; high rates ensure to a minimum extent the sustainability of the services provided and a possibility to finance system expansions without incurring extremely high additional costs to consumers;
• It is generally recommended that a more detailed assessment is undertaken after the completion of the majority of the projected sewerage and wastewater treat‐ment projects, in order to be able to assess cost recovery at the river basin district scale;
For recycled water provision through the Government Works, the recovery of financial costs is low, expecting to reach only 15.1% by 2005. However, the assessment has not taken into account the environmental benefits of recycled water use, such as the reduction of urban effluent discharges, and the mitigation of water stress conditions.
In general, after the pricing reform effected by the Government of the Republic of Cyprus, recovery of costs for freshwater provision has improved considerably. However, full cost re‐covery is still not achieved, a fact that contributes considerably to the prolonging of the non‐rational (from an economic point of view) use of the scarce water resources; the water con‐sumption in the agricultural sector (with a contribution of only 4% to the GDP) is 75%, whe‐reas in the industrial sector (22.5% contribution to GDP) the water consumption is only 1.5%.
PRODUCTIVITY OF WATER USES PER SECTOR
In the global debate about increasing water scarcity, agriculture is often associated with in‐efficient, wasteful water use13. This is supported by its poor performance in terms of “water
13 FAO and IFAD, Water : A Shared Responsibility, Chapter 7 : Water for food, agriculture and rural livelihoods.

Page | 45
use efficiency”, a term that was defined as the ratio between the irrigation water absorbed by the plants and the amount of water actually withdrawn from its source for the purpose of irrigation.
The word efficiency, when its value is significant below 100%, implies that water is being wasted. However, from a water balance perspective, water not taken up and transpired by the plants, even if unnecessarily withdrawn from its natural course, is not necessarily wasted. Unused water may be used further downstream in the irrigation system; it can flow back to the river or contribute to the recharge of aquifers. Renewable freshwater is only ef‐fectively lost when it evaporates from the soil, is fatally polluted or when it joins a saltwater body.
This fact does not, by itself, deny justification of programmes aimed at increasing water use efficiency in irrigation. The adoption of water‐saving technologies and improved water man‐agement is justified by the needs of higher equity within irrigation schemes, higher reliability of water service, reduced energy cost in cases that pumping is required, and when water withdrawal jeopardises the sustainability of the ecosystems. Rather than water use efficien‐cy, the concept of water productivity is now widely accepted as a measure of performance in agricultural use. By definition, productivity represents the output of any production process expressed per unit of given input, in this case water. In agriculture, several types of output can be considered. In strict commodity production, the output is usually expressed in vo‐lumes or value for a given agricultural production.
A recent survey of the economic value of water for the irrigation of selected crops portrayed that crops with high water requirements, such as colokasia and fodder, yield a low economic output per unit of water used. For the same selection of crops, the assessment of water costs, other production costs and per hectare generated income for farmers portrayed that these activities were not particularly sensitive to water costs. For example, the water‐greedy colokasia presents a high benefit for a relatively small cost. Greenhouse tomatoes appear to be profitable and little affected by the cost of water but the high incidence of other costs suggests that the farmer may be running high risks. Therefore, in this case, a shift in market prices could lead to a situation similar to that of french beans (large non‐water cost and fi‐nancial loss). Citrus fruits, which account for 32% of irrigation water demand, exhibit a low value‐in‐use of water and modest net benefits, and invite to closer scrutiny in pertinent agri‐cultural policies.
Consequently, in a context of growing water scarcity and increasing water prices, a mix of policies should foster agronomical research and extension services, addressing a large diver‐sity of suitable crops. For the majority of small‐scale farmers, support to collective marketing arrangements can help improve crop planning and reduce the undertaken risks. With evolv‐ing EU policies, and as subsidies for agriculture phase out, other subsidies compatible or even supported with European policies can phase in. These can be designed to support the farming sector to produce high added‐value fresh products for increasingly sophisticated services and tourism sectors, and to enhance the role of farmers and of the rural population in protecting and enhancing natural resources.
CONCLUDING REMARKS: THE WATER FRAMEWORK DIRECTIVE CHALLENGE
The implementation of the Water Framework Directive (WFD) in Cyprus is in progress. An implementation programme has been prepared, whereas required actions have been de‐

Page | 46
fined according to the milestones set by the EU. Contacts have been established with each EC Working Group, with the intention of monitoring the work carried out. Particular impor‐tance has been given to the first stages of the implementation of the Directive, which are considered crucial and important for its effective implementation. The responsible authority for the implementation of the Directive is the Ministry of Agriculture Natural Resources and Environment. The two “Lead Agencies” which will methodically implement the requirements of the Directive are the Water Development Department and the Environmental Service. Other departments will be involved according to the issues under consideration.
The most significant implementation problems which are foreseen in relation to the existing conditions in Cyprus include:
• Insufficient quantitative and qualitative data which are required for the initial crucial steps in implementing the Directive;
• Lack of a rationally organised national network for monitoring and collection of in‐formation, as well as the lack of a unified database;
• Difficulties in the coordination among the responsible authorities and all the other involved agencies;
• Limitation of sufficient expertise and appropriate human potential and necessary technological means;
• The need for inducing behavioural change among water users;
• High implementation costs;
• Fragmentation of responsibilities, jurisdiction and lack of a unified Water Authority;
• Particular difficulties due to extended periods of drought and the fact that the WFD is more adapted to the large water basins of Europe.
• The reduced interest of farmers towards agriculture due to lack of labour and lack of effective marketing of agricultural produce;
• The need for integrated water management, in particular the linkages between irri‐gation and municipal demand and supply;
• The need for demand management through water conservation technologies, pric‐ing, public awareness and water allocation and regulation.
Despite the above limitations and needs for reform, the WFD is perceived as a great oppor‐tunity towards the integrated management of water resources in the country. The recent, accentuated drought events have pointed out the need for developing a water culture among water users, for improving the collaboration among water authorities and service providers, and for pursuing public participation and environmental responsibility among all water use sectors, households, agriculture, industry and tourism, in an effort to protect vul‐nerable water bodies and secure water supplies.

PART II: THE INECO CYPRUS CΑSE STUDY: INCREASING VULNERABILITY OF THE PEGEIA AQUIFER


Page | 49
BACKGROUND AND MOTIVATION
As elaborated in Part I of this report, efficient groundwater management is an important policy priority in Cyprus, mostly due to two reasons:
• It is widely recognized that there is need to reduce borehole abstractions to sustain‐able levels. In the past years, the heavy over‐pumping from groundwater aquifers, to address increasing water demand or to mitigate drought effects has resulted in the depletion of almost all aquifers and seawater intrusion in many coastal ones (13 out of 19 groundwater bodies, or 68%, are at risk from over‐pumping ‐ Figure 22).
• Groundwater resources are considered to be strategic reserves, as they can secure a minimum water supply to respond to highly variable precipitation levels and pro‐longed droughts that diminish available surface water supplies.
On the other hand, it has often been stated that public participation in water planning and water management is insufficiently implemented at the local level. Public involvement is li‐mited and is only implemented for water allocation decisions made by the Water Develop‐ment Department. The WDD seeks irrigators’ views when there is need for rationalizing wa‐ter use, particularly during droughts. However, there are no formal procedures; consulta‐tions regarding water use are also made when planning a new water scheme for irrigation, based on surface water development or groundwater. This consultation is effected through meetings with farmer‐union’s representatives and village chairmen of the area concerned. During the development of several past projects, local farmers also had the opportunity for an in situ description of the current state of local water resources and of the scheme being planned. Such demonstrations are usually carried out by staff of the Water Development and of the Agricultural Department. A similar procedure is followed for consolidating local water management plans. Occasionally, projects are also discussed at meetings with the Par‐liamentary Committee on Agriculture where local Parliamentary Representatives may take particular interest. Meetings with farmers’ representatives and local Water Boards are also made for discussing drought mitigation measures and rationalization of water use.
Figure 22: Groundwater bodies at risk
In the above context, the INECO project in Cyprus attempted to foster constructive dialogue for enhancing groundwater management at local level. As a result of consultation with the

Page | 50
Water Development Department of Cyprus, the limestone aquifer of Pegeia, which is located in the southwestern part of the island, near the town of Paphos, was selected as the case study area. The aquifer of Pegeia is considered a locally important water resource, as it sup‐plies water to the rapidly developing village of Pegeia and the nearby tourist establishments. This rapid development, contributing to an increasing demand for freshwater, increases the vulnerability of the aquifer and raises the question of how to achieve sustainable water management without compromising economic growth.
The following sections of this report present the main outcomes of this Case Study, describ‐ing processes, important outcomes and considerations of stakeholders on options that could improve the effectiveness of current groundwater management policies.
THE CASE OF THE PEGEIA AQUIFER
The Pegeia aquifer is located in the Pegeia village area, west of the town of Pafos. It is a phreatic coastal aquifer, developed in a karstified reef limestone, and in some parts it exhi‐bits semi‐confined conditions. The aquifer area is approximately 20 km², with an average width of 5 km and a length of 4 km (Figure 23).
o1966
o3033 o3918
o2920
o3017 o3009
Figure 23: Location of the Pegeia Limestone Aquifer
There is a hydraulic connection and water interchange with the sea at the southwestern boundary of the aquifer. Outcrops of the reef limestone cover the eastern 8 km² of the area, forming a phreatic aquifer (under water table conditions). The western part is partly con‐fined between marls. On average, its thickness is roughly estimated at 60 m, and varies from a few meters up to about 150 m. However, the thickness of the reef limestone – chalks can reach 300 m. Most of the aquifer’s surface area is part of the Pafos Irrigation Project area.
GEOLOGY
The impervious base of the aquifer consists mainly of Palaeogene (Lefkara formation) marls, chalks and chalky marls, while the Terra member of the Pakhna formation acts as main aqui‐fer in the central plain of the Pegeia area (Figure 24). The marls of the Pakhna formation form the upper limit of the aquifer. With its considerable thickness of tens of meters and its

Page | 51
low permeability, this unit acts to a certain extent as a protection layer from vertical conta‐mination, but also diminishes the recharge from precipitation. Middle Pakhna formation chalks, sandstones, sandy marls and marls cover the northeastern part of the aquifer. It is believed that part of the aquifer’s recharge is coming from this formation.
The ceiling of the confined part of the aquifer along the coastal zone consists of Plio/Pleistocene marls and sandy marls of the Athalassa formation. It is believed that there is a connection and water interchange between the calcarenites of this formation and the reef limestone aquifer.
Figure 24: Geology of the Pegeia Limestone Aquifer
The main water‐bearing units are identified in the Lefkara formation in the upstream area, and in the Terra member of the Pakhna formation.
WATER TABLE EVOLUTION
For a number of years, and since the time that the amount of water supplied from the Pafos Irrigation Project was reduced, the aquifer is under intensive overpumping. The natural rep‐lenishment of the aquifer originates from precipitation only. Table 11 presents precipitation (PPT) and evaporation rates (pan evaporation ‐ EV) measured at the Evretou Dam, located in the vicinity of the aquifer area. Evapotranspiration (EVT) is estimated as 70% of the evapora‐tion rate. The difference (DIF) between precipitation and evapotranspiration rates represents the average rate of potential replenishment.14 In total, the average annual recharge of the aquifer is about 1 hm³. On a yearly basis and due to the high variability of precipitation, annual replenishment can range between 0 and 2.4 hm³/yr. Table 12 indicates the natural replenishment, the extraction and the change in storage as water eleva‐tion difference (Dh) of the aquifer for the period 2001‐2005. Aquifer balance data for 2006‐to date are not yet available. Furthermore, yearly abstraction values reported in
14 The estimation of potential replenishment is based on infiltration capacity as follows: infiltration capacity 3mm/hr, for 4hr/day for 10 days/month = 120mm/month. Recharge volume = A * P (percola‐tion in mm/yr). Percolation is approx. 1 m/year. Therefore, recharge volume = 20 km² * 1 m = 2 hm³.

Page | 52
Table 12 include actual (monitored) extraction for domestic water supply and estimates of water extracted from private boreholes, mostly used for meeting irrigation demand. These estimates are based on type and crop water requirements, taking also into account that part of the irrigation needs of the area are covered with water supplied from the Paphos Irriga‐tion Project. It should be noted that detailed surveys concerning extraction from private bo‐reholes and wells were carried out until 1995; however, since that time information remains scattered and cannot be validated.
Table 11: Precipitation and evaporation rates at Evretou Dam Jan Feb Mar Apr May Jun Jul Aug Sep Oct Nov Dec Total
PPT 68 60 47 25 10 0 0 0.5 6.5 25 67 84 392
EV 50 64 93 132 189 252 282 260 198 143 84 53 1800
EVT 35 45 65 92 132 176 197 182 139 100 59 37 1260
DIF 33 15 7 47 102 Source: Water Development Department
Table 12: Pegeia Aquifer water balance for the period 2001‐2005
Year Replenishment
(hm³) Abstraction
(hm³) Outflow to sea
(hm³) Dh (m)
2001 0.81 2.3 0.025 ‐1
2002 1.3 1.3 0.040 2
2003 2.4 1.5 0.030 0
2004 2.4 1.6 0.030 1
2005 1.2 1.2 0.050 0
Average 1.6 1.64 0.035 Source: Water Development Department
Overall, the data provided in
Table 12 indicate that until 2005 the Pegeia aquifer was nearly in equilibrium, with total re‐charge being equal to to the sum of average extraction and outflow to the sea. In 2001 there was a net decrease of the water table by 1 m (October 2000 – October 2001), a 2 m increase in 2002 and 1 m in 2004, while there was no change in 2003 and 2005. An extensive water level observation network covers the entire area of the aquifer. Water level measurements are taken on a monthly basis and four automatic water level recorders have been installed. The water balance estimates for 2002 depict that there was an overall increase of the water table by 2m, in spite of the fact that replenishment equals abstraction. This discrepancy can‐not be adequately explained with the recorded data available. One possible explanation is that due to the high precipitation and adequate water supply available at the Paphos Irriga‐tion project in 2002, additional water was transferred to local farmers, and thus abstraction was lower than the estimated amount of 1.3 hm³. However, no data are available to support the assumption; furthermore, E. Milnes reports that in that particular year “extraction rates were interpolated, as this was the year when exploitation for irrigation drastically dimi‐nished”. In 2004, which was also a wet year, the Pegeia aquifer was artificially recharged, and pumping for irrigation was reduced, due to the lower demand.
The comparison of water level fluctuations of selected boreholes to rainfall indicates that there is a direct response of the aquifer to precipitation events, with a general time lag of
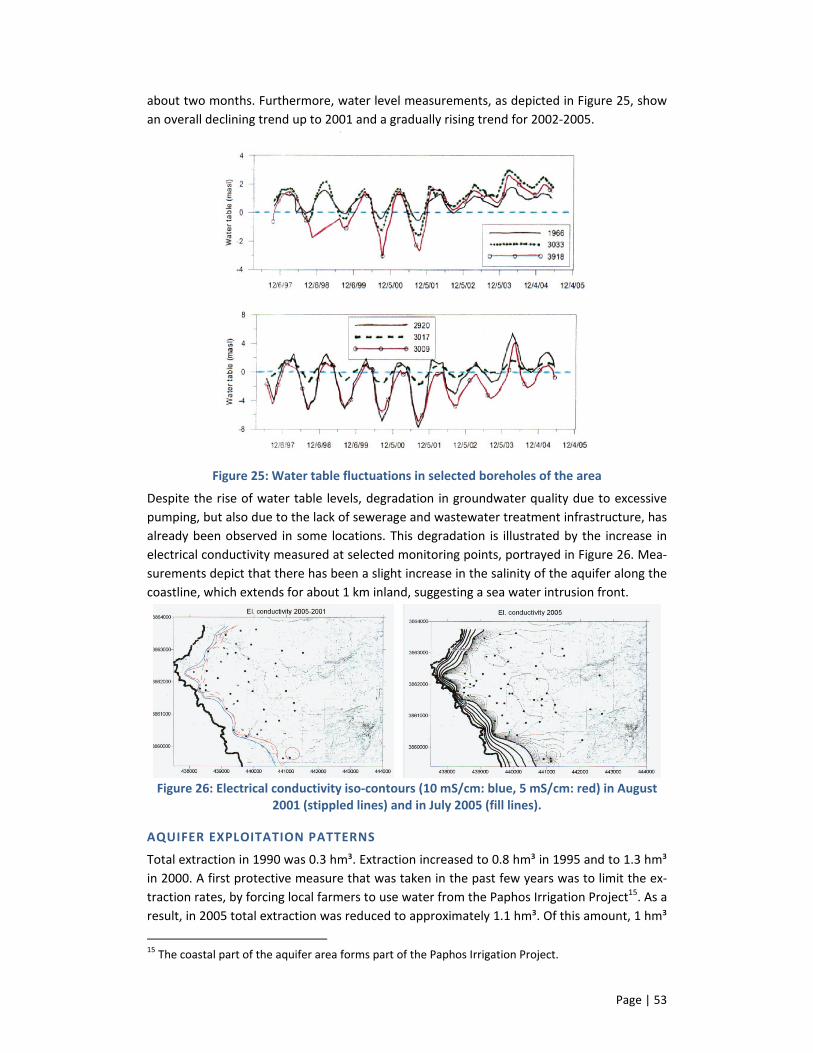
Page | 53
about two months. Furthermore, water level measurements, as depicted in Figure 25, show an overall declining trend up to 2001 and a gradually rising trend for 2002‐2005.
Figure 25: Water table fluctuations in selected boreholes of the area
Despite the rise of water table levels, degradation in groundwater quality due to excessive pumping, but also due to the lack of sewerage and wastewater treatment infrastructure, has already been observed in some locations. This degradation is illustrated by the increase in electrical conductivity measured at selected monitoring points, portrayed in Figure 26. Mea‐surements depict that there has been a slight increase in the salinity of the aquifer along the coastline, which extends for about 1 km inland, suggesting a sea water intrusion front.
Figure 26: Electrical conductivity iso‐contours (10 mS/cm: blue, 5 mS/cm: red) in August
2001 (stippled lines) and in July 2005 (fill lines).
AQUIFER EXPLOITATION PATTERNS
Total extraction in 1990 was 0.3 hm³. Extraction increased to 0.8 hm³ in 1995 and to 1.3 hm³ in 2000. A first protective measure that was taken in the past few years was to limit the ex‐traction rates, by forcing local farmers to use water from the Paphos Irrigation Project15. As a result, in 2005 total extraction was reduced to approximately 1.1 hm³. Of this amount, 1 hm³
15 The coastal part of the aquifer area forms part of the Paphos Irrigation Project.

Page | 54
corresponds to domestic water supply for the Pegeia Community and the adjoining tourist areas, and about 0.1 hm³ for irrigation.
Nowadays the aquifer is mostly used for potable water supply and to a much lesser extent for irrigation. More than 5000 houses and tourist units are supplied through four boreholes, which are located within the main irrigated area. One of these started operating in 2004. In July 2007 three new boreholes were connected to the system. Furthermore, since June 2004, additional water for domestic use is being supplied from Asprokremmos treatment plant.
Figure 27: Annual extraction rates from the Pegeia Limestone Aquifer
However, Pegeia is known for its rapid tourist development. Due to the growth of tourism in the Pegeia area, the demand on water has increased during the last years. An illustrative example is demonstrated in Figure 28, which presents the distribution of water use and wa‐ter consumers per block in the Pegeia Municipality during the high demand season (i.e. the 3rd quarter) of 2006. It is evident that 0.8% of the total number of consumers consumes al‐most 25% of the total freshwater used in the area.
(a) (b) Figure 28: Distribution of water use and water consumers per block in the Pegeia area for
the 3rd quarter of 2006
MEASURES FOR GROUNDWATER MONITORING & AQUIFER PROTECTION
The water table and salinity evolution have been monitored for several years in the Pegeia aquifer. A network with a relatively great number of boreholes is used for measuring water levels on a monthly basis. In four boreholes, automatic water level recorders have been in‐stalled. Equipment was removed from two of these, but the remaining two are still in opera‐tion. Conductivity measurements are also carried out in several selected boreholes, whereas

Page | 55
new ones have been drilled for better monitoring. In these boreholes, electronic equipment for automatic measurements of conductivity and water levels will be installed in the near future.
The local importance of the aquifer has also motivated the implementation of several pro‐tective measures from overexploitation, sea water intrusion and pollution of agricultural and domestic origin. An example of these measures concerns the provision of alternative water supply for irrigation purposes through the Paphos Irrigation Project; through this approach, public authorities managed to achieve a considerable decrease of extracted water quanti‐ties, and limit groundwater usage to domestic water supply alone (Figure 27).
DISCUSSING SHARED PROBLEMS – THE APPROACH
The INECO approach towards the development of a participatory process for discussing al‐ternative institutional and economic instruments to address water management issues was based on the Objective Oriented Project Planning method. The method, which is similar to the Logical Framework Approach, has been suggested as a tool to support urban participa‐tory decision‐making. In INECO, this method has been used to frame discussions with stake‐holders, focusing on a water management problem that is commonly perceived as significant (focal) in the region of interest.
The followed approach is divided in three stages (Figure 29):
1. The first stage, Problem Analysis, involved the identification of stakeholders and the mapping of their key problems, constraints and opportunities, and the definition of the key water management issue in the region of interest. Furthermore, this stage included the identification and analysis of cause and effect relationships between threats and root causes of the issue at hand;
2. Next, the Analysis of objectives concerned the development of policy objectives from the identified problems, and the identification of means‐to‐end relationships;
3. The final stage, Option analysis, concerned the identification of different options that can contribute to the achievement of the agreed objectives. Options were sub‐sequently evaluated by stakeholders to formulate the most suitable strategy for problem mitigation.
Figure 29: The framework for public participation and engagement in INECO
The overall process was articulated through individual (preparatory or consultation) meet‐ings with key stakeholders (decision and policy makers, representatives of key water users), workshops and public meetings open to stakeholders and all citizens concerned, surveys,

Page | 56
discussion fora, and dedicated questionnaires. Emphasis was given to the openness of the process; special care was given to inform stakeholders of all outcomes and replies of other parties, whereas all information collected was made accessible to the public through the distribution and web uploading of material.
The following paragraphs describe the implementation of this approach for deriving policy recommendations towards the protection of the Pegeia aquifer.
PROBLEM ANALYSIS
The first stage of the developed process concerned the identification of key stakeholders, with a role or concern over the management of groundwater resources in the region, these being:
• The Water Development Department (WDD) and its Regional Department in the Dis‐trict of Paphos. As explained in Part I, the WDD, which is the authority responsible for the implementation of the National Water Management Policy in Cyprus, has a key role in the assessment of water resources (including groundwater), the imple‐mentation of water management measures, intersectoral and inter‐regional water allocation, etc.
• The Municipality of Pegeia, which is responsible for the provision of potable water and sewerage services in the area, and for the development of the corresponding in‐frastructure.
• Farmers of the region: Although crop irrigation needs are currently supplied from the Asprokremmos dam, in an effort to protect the Pegeia Aquifer from overexploi‐tation, farmers are greatly concerned over the status of the aquifer, and conse‐quently, hold significant interest in its protection as strategic reserve.
• Citizens of the area: Individual consultation meetings with local residents revealed conflicting interests among foreign residents of Pegeia, who have bought their es‐tates in the few past years, and residents of Cypriot nationality. The former express their concern that current development patterns threaten the sustainability of water resources; the latter support the view that economic growth offers more opportuni‐ties than threats to the local community. Furthermore, there are concerns regarding potential pollution of the aquifer from the use of agrochemicals.
• Hotel owners, who are mostly concerned about securing water supply during the peak summer months, and obtaining reliable freshwater supply at a relatively low price.
• Developers, who support the view that real estate development should continue, and that all relevant infrastructure needs to be provided by the State and the local authorities.
The first workshop, open to all parties, was held on the 26th and 27th October 2007, at the Coral Beach Hotel in Pegeia. The workshop was primarily aimed at discussing the problem with local stakeholders, through the development of a “Problem Tree”, describing the caus‐es and effects of the problem in a qualitative way. This two‐day event also offered the op‐portunity for a first exchange of views on policy objectives and potential options, which are further discussed in the following paragraph. Through a dedicated and simple (non‐technical) questionnaire, stakeholders were also able to express their perception on the sig‐nificance of the problem, its effects and primary causes.

Page | 57
The “Problem Tree” is presented in Figure 31 (page 59), and describes the overall situation regarding groundwater depletion in Cyprus, according to suggestions by local stakeholders and information provided by experts during the workshop.
According to this framework, groundwater depletion is attributed to low recharge and groundwater exploitation patterns, the latter considered the main cause of the problem. Low Recharge of the coastal aquifers can be mainly attributed to limited and variable rainfall as well as high evapotranspiration (corresponding to as much as 82% of the total annual pre‐cipitation) as a result of the pertaining climate conditions. Due to these climate conditions the Government of Cyprus embarked in 1960 into an ambitious programme of exploiting surface run‐off by constructing many dams for storing water for drinking and irrigation needs. This, however, resulted to the reduction of the natural replenishment of downstream (riverbed) aquifers. Further pressures resulted from the non‐effective exploitation of many water development schemes, which also included the development of new irrigated areas, which helped in achieving economic sustainability for these new projects, but also created new demands that did not exist before. At present, competing demands and tension be‐tween different dynamic economic sectors (agriculture, urban growth including tourism) and the environment are also challenging the existing water management practices in the island. Finally, water reuse in agriculture is still far from accepted, especially when alternative (fresh) water supply is available.
Overexploitation of groundwater resources can be mainly attributed to the uncoordinated groundwater management framework, which often leads to ineffective and conflicting deci‐sions, social pressures from user groups during the processes of boreholes permit issuing and application of penalties for overabstraction. Equity among farmers that depend on surface water from the public water supply system and those that depend solely on groundwater from private boreholes does not exist, especially when water tariffs for surface water supply are increased. Such increases encourage further exploitation and mismanagement of groundwater resources, as groundwater extraction costs are still lower than surface water tariffs. As environmental concerns were not key priorities during the 1960s and 1980s, when most waterworks were developed, impacts to downstream users and the environment were not accurately valuated, whereas public participation and efforts for integrating interests of all those concerned were minimal. This further affected the degree and way of involvement of farmers in the development of projects and fostered their adherence to traditional prac‐tices (water intensive cropping patterns, groundwater abstractions etc.). Finally the limited institutional capacity within the governmental departments, and especially in the Water De‐velopment Department, as a result of the retirement and non‐substitution of the staff that took part in the aforementioned projects has rendered management decisions, operations and implementation of the water policy and regulation and control much more difficult than before.
Replies to the workshop questionnaire were also a helpful tool in revealing the perceptions of stakeholders as to the significance of causes and effects to the problem. Answers as per the causes of the problem are presented in Figure 30.
According to the perception of most respondents, the key cause of groundwater depletion is “wasteful water use”; respondents also point out that water availability is lower than local needs. When participants were asked to define all underlying causes (without selecting one in particular), most point out the lack of joint planning, the lack of citizen and user aware‐

Page | 58
ness on water saving practices and the fact that the general public is not mobilized enough towards water saving, environmental protection and participation. Similarly, there is belief that there are administrative barriers which inhibit the effective implementation of solu‐tions, mostly in reference to the fragmentation of responsibility and the need for better re‐gulating groundwater extraction from both public and private boreholes.
Figure 30: Stakeholder answers on the “most important” and the “underlying causes” of
groundwater depletion in Pegeia
A common issue that emerged during this “Problem analysis” workshop concerned the need for the disclosure of information regarding the state of the aquifer; although information is shared among authorities, most citizens were unaware of the fact that information on the vulnerability of groundwater bodies (as required from Art. 5 of the Water Framework Direc‐tive) has been made available to the general public, and that the Government of Cyprus pro‐vides important incentives for water conservation. Additional issues, as identified by partici‐pants for discussion and elaboration concerned the following:
• Building permits exceed the capacity to provide water in Pegia and will affect the depletion of the aquifer.
• The effect of the currently applied agricultural practices in the region (in terms of quantity required and nitrate concentrations) needs further analysis.
• There is need to change local cropping patterns, which are currently highly water consumptive.
• The seasonal variation of water demand and its impact on the exploitation of the aquifer is an issue that requires further analysis.
• There is lack of awareness and education of local residents on water conservation.
• There is lack of information on water issues in the area.
• The quality of the water in the aquifer is not only affected by the current agricultural practices, but also from the lack of a sewerage system.
• There is need to take measures in order to reduce water losses in the distribution system (according to estimates, losses presently account for approximately 40% of water extracted).
These formed the basis for the discussion on policy objectives and potential options, de‐scribed in the following sections.

Page | 59
Figure 31: Problem
tree an
alysis fo
r aq
uifer de
pletion in Cyprus
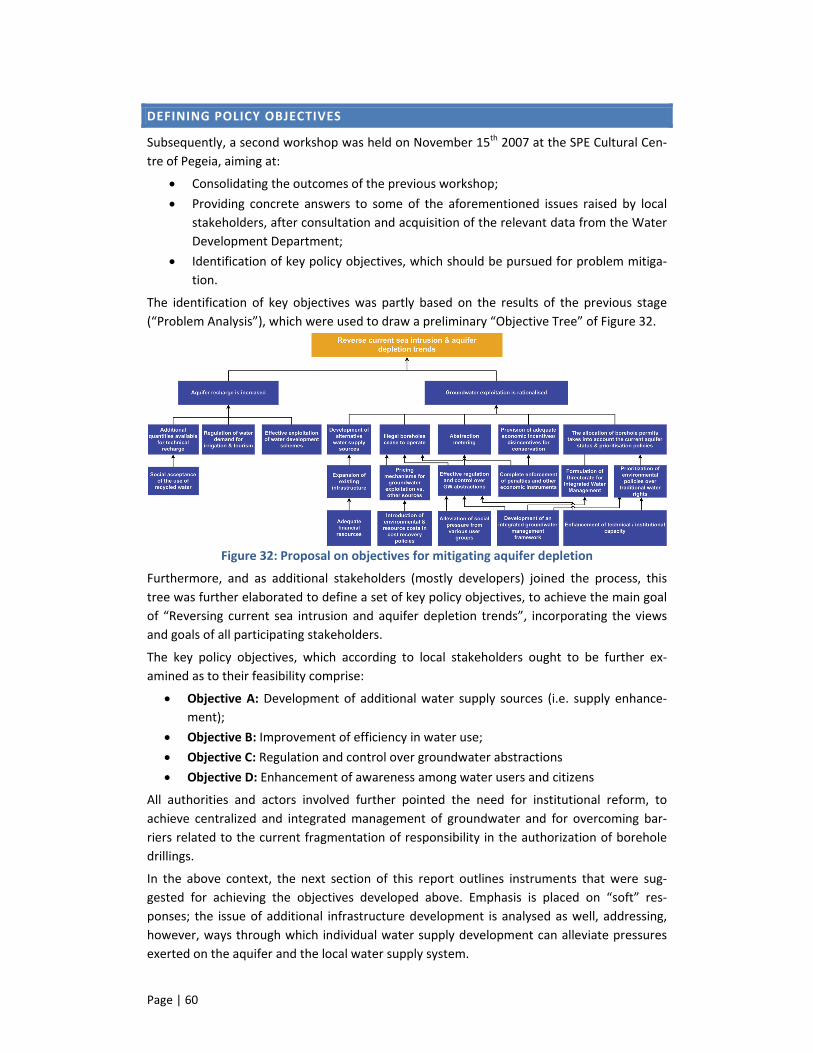
Page | 60
DEFINING POLICY OBJECTIVES
Subsequently, a second workshop was held on November 15th 2007 at the SPE Cultural Cen‐tre of Pegeia, aiming at:
• Consolidating the outcomes of the previous workshop;
• Providing concrete answers to some of the aforementioned issues raised by local stakeholders, after consultation and acquisition of the relevant data from the Water Development Department;
• Identification of key policy objectives, which should be pursued for problem mitiga‐tion.
The identification of key objectives was partly based on the results of the previous stage (“Problem Analysis”), which were used to draw a preliminary “Objective Tree” of Figure 32.
Figure 32: Proposal on objectives for mitigating aquifer depletion
Furthermore, and as additional stakeholders (mostly developers) joined the process, this tree was further elaborated to define a set of key policy objectives, to achieve the main goal of “Reversing current sea intrusion and aquifer depletion trends”, incorporating the views and goals of all participating stakeholders.
The key policy objectives, which according to local stakeholders ought to be further ex‐amined as to their feasibility comprise:
• Objective A: Development of additional water supply sources (i.e. supply enhance‐ment);
• Objective B: Improvement of efficiency in water use;
• Objective C: Regulation and control over groundwater abstractions
• Objective D: Enhancement of awareness among water users and citizens
All authorities and actors involved further pointed the need for institutional reform, to achieve centralized and integrated management of groundwater and for overcoming bar‐riers related to the current fragmentation of responsibility in the authorization of borehole drillings.
In the above context, the next section of this report outlines instruments that were sug‐gested for achieving the objectives developed above. Emphasis is placed on “soft” res‐ponses; the issue of additional infrastructure development is analysed as well, addressing, however, ways through which individual water supply development can alleviate pressures exerted on the aquifer and the local water supply system.

Page | 61
IDENTIFICATION AND ANALYSIS OF OPTIONS FOR MITIGATING GROUNDWATER OVEREXPLOITATION
The work towards deriving policy recommendations focused on the suggestion of alternative (institutional and economic) options to achieve the outlined objectives. These suggestions, subject to evaluation, were used to formulate a roadmap towards strategies suitable for achieving the wider goal. To facilitate discussions with local stakeholders, and in accordance with policy objectives, potential options were grouped into four (4) categories, as follows:
• Options relating to the development of additional water supply sources, with the aim to substitute groundwater use;
• Options to improve the efficiency in water use in the domestic sector and in irrigated agriculture, as part of the overall policy for water conservation;
• Options aimed at the regulation of individual abstractions from private boreholes;
• Options to raise public participation and awareness on water‐related issues, and fos‐ter the development of a new water culture at local and possibly at national level.
The following paragraphs present in more detail the suggested options. The analysis also outlines barriers that have inhibited the (effective) implementation of past policies, as well as associated issues that need to be considered and evaluated to achieve sustainable solu‐tions to the problem at hand. Identified issues pertain to the three main functions: (a) water service provision (Operational function); (b) River Basin level/Aquifer management (Organ‐izational function); (c) National water policy and law (Constitutional function).
Development of additional water supply sources/Infrastructure development
Efforts for the protection of the Pegeia aquifer and the reduction of abstractions to sustain‐able levels involved the “phasing‐out” of the use of groundwater for crop irrigation in the area. Farmers were forced to use water from the Paphos Irrigation Project (Asprokremmos dam) instead of water from the aquifer.
However, additional efforts for introducing new, alternative water supply, in the area are currently being pursued. The Municipality of Pegeia, in collaboration with the WDD has in‐itiated the process for the construction of a sewerage network and wastewater treatment infrastructure. In addition to pollution prevention, treated wastewater could be further used for crop irrigation, especially during drought. Furthermore, the WDD has initiated the proce‐dure for the construction of a desalination plant to meet the drinking water needs of the Paphos district. It is expected that the introduction of desalination will improve the reliability of freshwater supply in the town of Paphos and the areas in its vicinity, and alleviate the pressures exerted on local surface and groundwater bodies.
Furthermore, many hotels and tourist units are assessing the option of developing their own desalination facilities, given the severe impact of the accentuated drought of the past few years. Overall, cost recovery issues do not seem to raise concern. It is widely recognized that further development of the area requires infrastructure development. So far, water charges are affordable and even if full recovery is effected, the share of household income spent on water services will remain below the threshold of 1.5%.
Suggestions of local stakeholders however, focus more on small‐scale decentralized solu‐tions to meet the increasing demand (Figure 33). Rainwater harvesting, as well as the con‐struction of small interception dams are often advocated as a potential solution. Water recy‐

Page | 62
cling and reuse, at the neighbourhood level, to meet municipal and garden irrigation de‐mand is also an option that gains momentum among citizens of foreign nationality. An addi‐tional suggestion concerns the reduction of losses in the drinking water distribution net‐work, which currently are estimated in the range of 30 %. Taking into account the example of the Limassol Water Board, which embarked on a leakage reduction programme to reduce losses to only 15%, the Municipality of Pegeia could examine similar programmes, depend‐ing on financing and joint agreement on how such costs can be recovered.
Figure 33: Suggested options – Development of additional water supply sources
Improving efficiency in water use
Water conservation and improvement of efficiency in water use are core components of the National Water Policy of Cyprus. Measures range from awareness campaigning, financial and fiscal incentives and legislative mandates concerning the entire range of water use sectors, with particular focus on crop irrigation and domestic water usage.
In the above context, the WDD has embarked on a Strategic Plan, providing financial incen‐tives for the promotion of technological adjustments aimed at water conservation. These include subsidies for borehole drilling to safeguard public water supply, introduction of im‐proved irrigation systems, or installation of grey water reuse systems for lavatories and gar‐den irrigation.
Figure 34: Suggested options – Improving efficiency in water use
Furthermore, the pertinent legislation also includes mandates and different forms of sanc‐tion for wasteful water use, especially in the domestic sector. For example, the “Water Con‐servation (Special measures)” Law of 1991 applied within Water Board areas, Municipalities
Page | 63
and Village water supply areas states that “any person using water through a hose for wash‐ing sidewalks or streets, verandas and vehicles is guilty of a criminal offence and could be imprisoned for up to 3 months and or be fined up to 1000 € or both. Policemen or other li‐censed persons (WDD personnel) having grounds to believe that a person is committing such an offence could issue a fine of up to 110 € in lieu of taking this person to court”. These pro‐visions, however, are applied sporadically, and mostly in times of drought and limited water availability.
A common feature that emerged during all INECO events and surveys is that although finan‐cial incentives towards water conservation are available, these are not known to the citizens of Pegeia. Measures proposed comprise:
• The increase of water tariffs (especially volumetric rates), to achieve adequate re‐covery of water service costs; this in turn raises the question of how additional costs will be allocated to consumers. Suggestions include increased tariffs for the hotel sector, in case that additional infrastructure will be required to meet the peak water demand, and for large scale water users.
• Introduction of seasonal water rates, to account for the costs of infrastructure aimed at meeting peak (tourism‐induced) water demands.
• Introduction of mandates for regular water audits for large consumers (e.g. hotels) or cases where there is “excessive” water use. Water audits, already compulsory in many countries facing water shortage problems, could be the solution for depicting potential improvements, installation of water saving equipment, early identification of leakages and awareness enhancement.
• Additional incentives for conservation in the home and in tourist establishments, such further rebates or tax exemptions for the installation of water saving equip‐ment.
It should be noted that although crop irrigation does not presently contribute to groundwa‐ter overexploitation (as noted, the farmers of Pegeia are using water from the storage reser‐voir of Asprokremmos), proposals were made towards the change of cropping patterns, in an effort to also conserve surface water and rationalize water use.
Regulation of groundwater abstractions
Legislation aimed at the protection of groundwater resources from overexploitation is sum‐marized in the Wells Law (Cap 351), which requires the issue of the relevant permit by the corresponding District Officer for borehole drilling. However, as the authority vests within a body that does not have the technical capacity to assess the potential for further groundwa‐ter exploitation in relation to sustainable extraction limits, the Law has resulted in the exis‐tence of a large number of boreholes and wells that have not been properly assessed in terms of environmental impact. Furthermore, and with regard to compliance to the extrac‐tion limits defined in permits, authorities and citizens often point out that supervision and control are “relaxed”, especially concerning private boreholes. In addition, penalties and fines imposed in case of overabstraction are relatively low.
In the above perspective, and as described in Figure 35, options towards the regulation of groundwater abstractions mainly focus on borehole monitoring and extraction control, and the enforcement of stricter penalties and fines for overabstraction. Questions arise as to the feasibility of such measures; the monitoring of the large number of private boreholes oper‐

Page | 64
ating throughout the country, would require significant technical and human capacity. In turn this would incur high financial and social cost, without probably having tangible effects in the near future.
Figure 35: Suggested options – Regulation of groundwater abstractions
For the particular case of Pegeia, and as groundwater is solely used for drinking water supply (domestic and tourism sectors), suggestions also include measures aimed at reducing groundwater usage for domestic purposes.
In addition to the aforementioned forms of encouragement for conservation measures in the home and in tourist units, policies could also foster the construction of small‐scale desa‐lination schemes for the large hotels of the area (i.e. schemes for encouraging large con‐sumers to shift from public water supply). Appropriate incentives could comprise the in‐crease of tariffs currently faced by the hotel sector, so as to render desalination an economi‐cally attractive option. Other forms of fiscal and financial instruments (e.g. low interest loans) could also be applied. Such changes could also be effected through regulation: cur‐rently the licensing of new golf courses also requires the installation of a desalination plant, in order to ensure that the irrigation of the golf course is not supplied by the Public Water Supply System or by individual boreholes.
Awareness and participation
Making water users more aware of the importance of water ‐related issues is a key objective for decision‐makers and citizens at large. Awareness campaigns on water saving are an eve‐ryday reality in Cyprus, as there is strong need to rationalize and curtail water use to meet available supply during drought. Furthermore, the WDD, within the framework of the WFD implementation process, has initiated public participation processes on the draft River Basin Management Plan. Means employed involve presentations, public meetings, dedicated questionnaires and information sharing on the outcomes of the WFD analyses.
However, all these initiatives towards public participation do not seem to reach water users at the local level. Suggested options towards enhancing awareness and participation are summarized in Figure 36 and include:
• Awareness campaigning, focusing not only on general measures towards water con‐servation, but also on incentives available at the local level;
• More information sharing through specifically targeted local meetings and public hearings at the municipality level for issues of local concern. Information disclosure would be more effective if non‐technical terms are used, so that information, ac‐

Page | 65
tions taken and proposals are easily understood by citizens who do not have scientif‐ic background on water management issues.
Finally, efforts to establish deliberation processes, through citizen panels, could be of signifi‐cant benefit to local decision‐makers, as they would give citizens the opportunity to freely express their views and questions on issues of local importance and become more informed on the scope of current decisions and offered incentives.
Figure 36: Suggested options – Enhancement of awareness & participation
OPTION EVALUATION
PRIORITIZATION OF SUGGESTED INSTRUMENTS
The first step towards the evaluation of suggested responses, based on a set of predefined criteria common to all the INECO Case Studies, was the main priority of local stakeholders. The step was implemented from February to June 2008, and included the:
• Distribution and completion of a survey for ranking ten (10) broad categories of in‐struments. The survey was aimed at evaluating the feasibility and applicability of economic and institutional instruments, taking into account the local and the na‐tional water management context, current conditions and priorities, and future chal‐lenges;
• Further consultation meetings and discussion sessions with key user groups and de‐cision‐makers to discuss the outcomes of the prioritisation “exercise” and elaborate on potential options.
In total, 50 questionnaires were distributed; 20 responses were received, representing all key stakeholders and user groups, whereas support was provided in the dedicated discus‐sion sessions.
As depicted from the spider chart of Figure 37, which summarizes results, the instruments that emerge as most relevant and applicable comprise water pricing, financial incentives and voluntary programmes towards water conservation, strict enforcement of liability rules and regulations, and enhanced public participation.
Furthermore, opinions and suggestions of stakeholders, as articulated in the corresponding survey and events, can be summarized in the following:
• Encouragement of water users through the enhanced provision of financial incen‐tives and voluntary programmes is clearly preferred as means to address both cur‐rent and future water management challenges;

Page | 66
• Similarly, disincentives that could be offered through water pricing reforms (high rates for “excessive” water use or groundwater abstraction charges) are positively evaluated;
• Stakeholders underline the need towards enhanced public participation, as means to raise awareness, promote civic engagement and foster the development of a new water culture on “responsible” water use;
• As the overall performance of the water sector is positively evaluated, further de‐centralization is not considered required;
• The most relevant approach to the mitigation of groundwater overexploitation prob‐lems is the strict enforcement of the pertinent legislation combined with the intro‐duction of stricter liability rules for individual groundwater abstractions.
Figure 37: Prioritization of instruments for addressing current and
future water management challenges
Outcomes formulated the basis for a more in‐depth analysis of the implications of potential instruments. Emphasis was given on identifying ways for enabling the effective implementa‐tion of suggested responses.
FURTHER CONSIDERATIONS TOWARDS OPTION IMPLEMENTATION
The process of identifying pathways towards the effective implementation of suggested in‐struments was implemented through individual interviews with Municipal Authorities, Wa‐ter Authorities, water & environmental experts, and citizens and professionals from the tar‐get region. The interviews were formulated in five (5) main thematic areas: (a) cost recovery issues and cost sharing principles, (b) means for regulating abstractions, (c) ways of enhanc‐ing incentives towards water conservation, (d) improvement of the current framework for water management, especially with regard to the provision of water services, and (e) ways of enabling public participation and enhancing stakeholder involvement in decision‐making.
Results are discussed in the following sections.

Page | 67
Regulation of groundwater abstractions
The effective implementation of regulatory approaches for individual groundwater abstrac‐tions, combined with a simplification of the overall framework for the issue of groundwater abstraction permits is seen as an appropriate way of mitigating groundwater overexploita‐tion. However, in areas with existing numerous private boreholes the exercise of proper con‐trol requires strong regulatory capacity and sufficient financial and human resources to regu‐larly monitor adherence to permits. In this regard, the stricter enforcement of existing regu‐lations on groundwater abstractions in Pegeia and in Cyprus as a whole is analysed in terms of:
• Feasibility, applicability and effectiveness of bans on water abstractions and police control of discharges;
• Empowerment and political willingness of the State to strictly enforce legislation on the above issues;
• Acceptability of compensation for potential environmental damage through the set‐ting of relevant environmental taxes and charges, and ways through which charges could be defined;
• Development of collective schemes for water supply, so as to provide alternatives to individual water supply, and ways through which the costs for the development of such systems would be recovered.
A summary of stakeholder responses on the above issues is portrayed in Figure 38.
Figure 38: Stakeholder views on alternative approaches to regulating
groundwater abstractions
The potentiation of a command‐and‐control approach, entailing the ban of groundwater ab‐stractions in vulnerable areas, is very positively regarded by the vast majority (90%) of con‐sulted stakeholders. However, efforts towards better educating water users and fostering civic engagement are also regarded of equal or more importance. Opinions are, however, diverse on the empowerment and willingness of the pertinent authorities to enforce regula‐tions. Several respondents perceive that the acute water stress problems faced today com‐pel State authorities to take action for protecting strategic groundwater reserves, freshwater supply and income from tourism activities. Others however, question capacity and political willingness; reservations are also founded on the fact that the lack of alternative water sup‐
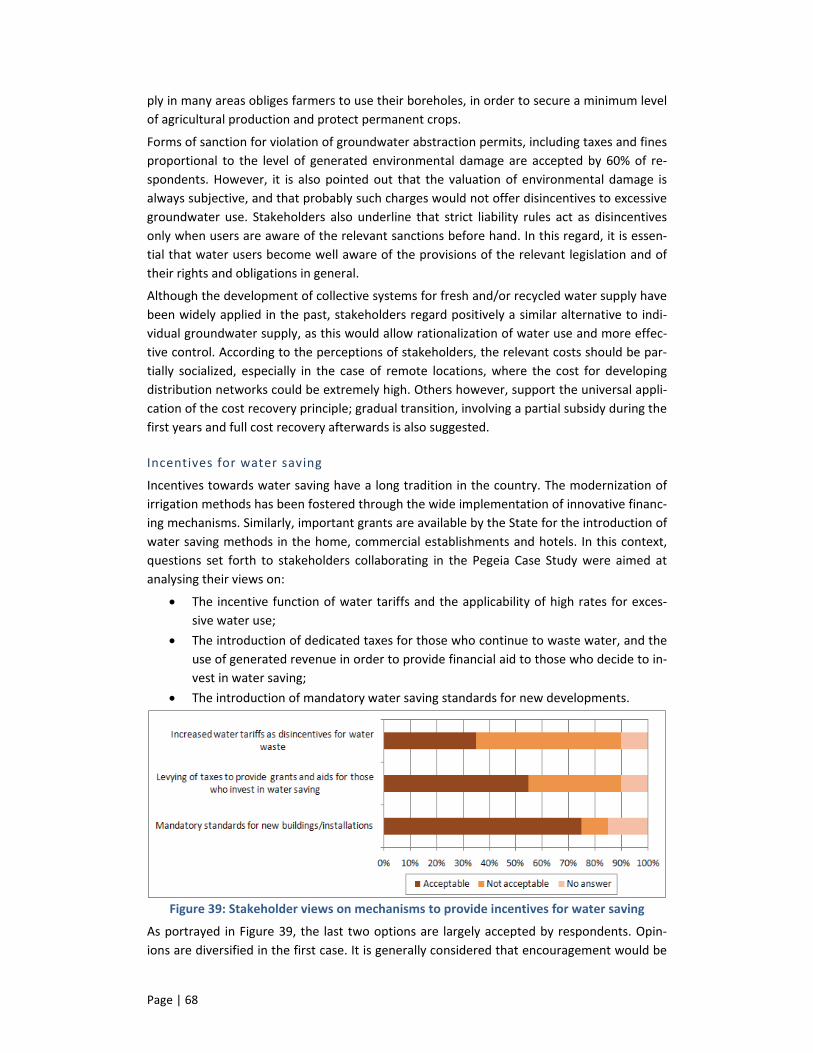
Page | 68
ply in many areas obliges farmers to use their boreholes, in order to secure a minimum level of agricultural production and protect permanent crops.
Forms of sanction for violation of groundwater abstraction permits, including taxes and fines proportional to the level of generated environmental damage are accepted by 60% of re‐spondents. However, it is also pointed out that the valuation of environmental damage is always subjective, and that probably such charges would not offer disincentives to excessive groundwater use. Stakeholders also underline that strict liability rules act as disincentives only when users are aware of the relevant sanctions before hand. In this regard, it is essen‐tial that water users become well aware of the provisions of the relevant legislation and of their rights and obligations in general.
Although the development of collective systems for fresh and/or recycled water supply have been widely applied in the past, stakeholders regard positively a similar alternative to indi‐vidual groundwater supply, as this would allow rationalization of water use and more effec‐tive control. According to the perceptions of stakeholders, the relevant costs should be par‐tially socialized, especially in the case of remote locations, where the cost for developing distribution networks could be extremely high. Others however, support the universal appli‐cation of the cost recovery principle; gradual transition, involving a partial subsidy during the first years and full cost recovery afterwards is also suggested.
Incentives for water saving
Incentives towards water saving have a long tradition in the country. The modernization of irrigation methods has been fostered through the wide implementation of innovative financ‐ing mechanisms. Similarly, important grants are available by the State for the introduction of water saving methods in the home, commercial establishments and hotels. In this context, questions set forth to stakeholders collaborating in the Pegeia Case Study were aimed at analysing their views on:
• The incentive function of water tariffs and the applicability of high rates for exces‐sive water use;
• The introduction of dedicated taxes for those who continue to waste water, and the use of generated revenue in order to provide financial aid to those who decide to in‐vest in water saving;
• The introduction of mandatory water saving standards for new developments.
Figure 39: Stakeholder views on mechanisms to provide incentives for water saving
As portrayed in Figure 39, the last two options are largely accepted by respondents. Opin‐ions are diversified in the first case. It is generally considered that encouragement would be
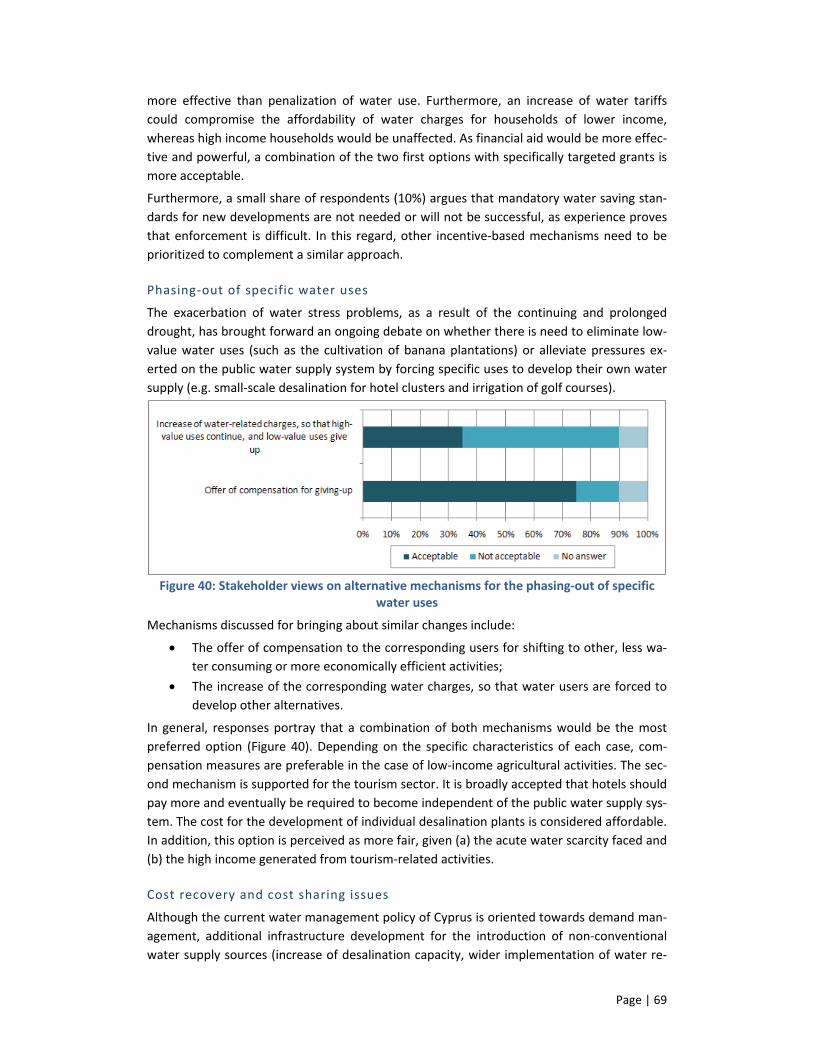
Page | 69
more effective than penalization of water use. Furthermore, an increase of water tariffs could compromise the affordability of water charges for households of lower income, whereas high income households would be unaffected. As financial aid would be more effec‐tive and powerful, a combination of the two first options with specifically targeted grants is more acceptable.
Furthermore, a small share of respondents (10%) argues that mandatory water saving stan‐dards for new developments are not needed or will not be successful, as experience proves that enforcement is difficult. In this regard, other incentive‐based mechanisms need to be prioritized to complement a similar approach.
Phasing‐out of specific water uses
The exacerbation of water stress problems, as a result of the continuing and prolonged drought, has brought forward an ongoing debate on whether there is need to eliminate low‐value water uses (such as the cultivation of banana plantations) or alleviate pressures ex‐erted on the public water supply system by forcing specific uses to develop their own water supply (e.g. small‐scale desalination for hotel clusters and irrigation of golf courses).
Figure 40: Stakeholder views on alternative mechanisms for the phasing‐out of specific
water uses
Mechanisms discussed for bringing about similar changes include:
• The offer of compensation to the corresponding users for shifting to other, less wa‐ter consuming or more economically efficient activities;
• The increase of the corresponding water charges, so that water users are forced to develop other alternatives.
In general, responses portray that a combination of both mechanisms would be the most preferred option (Figure 40). Depending on the specific characteristics of each case, com‐pensation measures are preferable in the case of low‐income agricultural activities. The sec‐ond mechanism is supported for the tourism sector. It is broadly accepted that hotels should pay more and eventually be required to become independent of the public water supply sys‐tem. The cost for the development of individual desalination plants is considered affordable. In addition, this option is perceived as more fair, given (a) the acute water scarcity faced and (b) the high income generated from tourism‐related activities.
Cost recovery and cost sharing issues
Although the current water management policy of Cyprus is oriented towards demand man‐agement, additional infrastructure development for the introduction of non‐conventional water supply sources (increase of desalination capacity, wider implementation of water re‐
Page | 70
cycling and reuse schemes) remains one of the main responses for coping with increasing water stress and attenuating the impacts of droughts. Current mechanisms for cost sharing, especially with regard to hydraulic infrastructure have been defined several years ago. They involve the allocation of costs for joint infrastructure (i.e. infrastructure for supplying both domestic and irrigation costs) on the basis of the quantities supplied to each sector. Fur‐thermore, and in line with the WFD implementation requirements, the Government is grad‐ually pursuing the achievement of full financial cost recovery for bulk freshwater supply pro‐vided for domestic and irrigation purposes.
Despite the already established policies, there is great diversity on the mechanisms that need to be applied at local and national level for sharing the costs relating to the rehabilita‐tion of existing and the development of new infrastructure. In this regard, the questions that were set forth to the different user groups and decision‐makers were aimed at mapping opi‐nions on:
• Ways of distributing costs among different consumer categories (households, indus‐try, tourist sector and agriculture);
• Transparency, fairness and equity of the current tariff system, and ways through which these can be improved;
• Water pricing as means to achieve recovery of costs for water service provision and the financing of the water system;
• Willingness to accept an increase of the applied water rates, provided that this would mean provision of improved water services;
• Willingness‐to‐pay more for maintaining the current level of water service provision, despite increasing water stress;
• Potential differentiation of water tariffs according to the type of use, with the aim to generate cross‐subsidies among different water users.
With regard to cost allocation issues, responses span the entire range of potential alterna‐tives. Several stakeholders consider that the equitable way of distributing costs would be according to the relative consumption share of each major water use sector. Others com‐ment that proportionality principles need to be adjusted to address national economic de‐velopment priorities for tourism and agriculture. Several respondents also underline the need of differentiating between residential water use and consumption in production sec‐tors. For the latter, principles for cost allocation need to take into account generated income and wider social, economic and environmental benefits to local societies.
On the other hand, there is agreement on objectives and principles for the definition of wa‐ter tariffs, at least at local level (Figure 41). It is generally considered that full cost recovery through water tariffs is the appropriate and fair way for financing water services. Half of res‐pondents perceive that the current framework for their definition is transparent enough and that the water bill they are paying is appropriate for the quality of water services received. Enhancements could involve the regular publication (e.g. through the internet) of informa‐tion concerning the calculation of the applied water rates, so that required data can be re‐trieved from those concerned.
The majority (75%) would be willing to pay more for an improved service. A similarly high share (65%) would be willing to pay more for ensuring that the current level of water service can continue despite increasing stress on the natural resource side. However, it is also sup‐ported that costs for coping with increasing water scarcity should not be passed on to

Page | 71
households. Instead, they should be allocated to the major water consuming economic sec‐tors.
Figure 41: Stakeholder views on cost recovery and cost sharing issues
Along the same line, it is believed that some users need to be charged more than others, according to their relative ability to pay and the externalities they are producing. It is broadly accepted that the tourism sector should pay more, and eventually be required to provide water supply on its own. Similarly, industrial and commercial premises need to be charged in a different way, taking into account the pressures they exert on water bodies and the water quantities they demand from the public system.
Framework for water management
The water sector of Cyprus is significantly developed, both in terms of infrastructure (new technologies are broadly implemented and promoted) and in terms of institutional organiza‐tion (in their majority, water services are provided by independent institutions, under the regulation and control of the State and local authorities). Successful public‐private partner‐ships have also been developed in the past, through BOT schemes for desalination units and individual contracts for infrastructure development. Partnerships are still being pursued for addressing new policy requirements (e.g. development of sewage collection and treatment schemes), and for enhancing management skills and facilitating technology transfer, where these are required.
In this perspective, and given (a) the current framework for water service provision in Pege‐ia, and (b) broader water management challenges, stakeholders were asked to comment on:
• Existing water and sanitation undertakings, in relation to meeting current demands and securing environmental protection;
• Margins for improvement, within the framework of the current institutional and or‐ganisational framework;
• Further potential contribution and involvement of the private sector;
• Enhanced private sector involvement in the provision of water services.

Page | 72
Responses are portrayed in Figure 42.
Figure 42: Stakeholder views concerning the framework for water management and
provision of water services
Despite progress made, current water supply and especially sanitation undertakings in Pege‐ia are evaluated negatively by the majority (60%) of stakeholders, given that local sewage collection and treatment schemes are still under development and that water scarcity is be‐coming more and more severe throughout Cyprus. Stakeholders perceive that there is signif‐icant delay and that network developments cannot keep up with rapid development. Fur‐thermore, decentralization and on‐site or neighbourhood water reuse needs to be promoted instead of traditional, centralized systems. However, only 40% perceives that improvement of the system would require significant institutional reforms and organizational transforma‐tions. Although the implementation of technological innovations is considered rather slow, several stakeholders evaluate positively technology uptake and implementation. Private sec‐tor involvement is accepted and viewed necessary for improving the quality of water servic‐es by 65% of stakeholders, but it is not necessarily considered of first priority.
Public participation and enhanced stakeholder involvement
The enhanced involvement of stakeholders and citizens in decision‐making is a policy objec‐tive that is being strongly pursued by all State and local authorities involved in water man‐agement in Cyprus. Public participation and civic engagement are not only considered a reg‐ulatory requirement imposed by the Water Framework Directive, but are also regarded as a required response for raising awareness on the current water management crisis.
Strategies towards public participation are currently in status of implementation; however, users’ perceptions on the deficiencies of the followed approach can provide recommenda‐tions on how pursued processes could be further strengthened. In this context, issues that were considered important for further analysis included:
• Perceptions on how participatory processes could be further enhanced;
• Ways through which water users could become more involved in decision‐making;
• Actual accessibility to information on water management issues of common interest;
• Impartiality and objectivity of decisions taken, as it is often commented that deci‐sion‐making processes are influenced by specific user groups.
The stakeholders that were asked to comment on the above pointed out the need for more deliberative processes that would give citizens a true opportunity to express their views on water management decisions and policies. Such processes need to be founded on enhanced awareness and improved accessibility to background information regarding available re‐

Page | 73
sources, limitations, real costs of water provision, impact of current practices, as well as pro‐posed mitigation strategies and their implications, costs and effects. Despite the fact that information on water‐related issues is readily available for public consultation and comment, most citizens comment that only a small amount of this information is actually understanda‐ble. This is considered a major impediment to enhanced involvement and awareness on local environmental issues, as well as to broader behavioural changes regarding water usage. It is therefore suggested that efforts should be made to share information in a non‐technical way that would allow individuals to form their own views and become more involved and aware of how water management problems affect people, the economy and the environment. Carefully scheduled, open and inclusive public hearings are proposed as means to share in‐formation and offer opportunities for discussion and exchange of views. Other suggestions include awareness campaigning, wider use of the mass media and the internet, dedicated local information desks etc.
Several stakeholders stated that decisions taken are not always impartial, and tend to bene‐fit specific user groups, at least on what concerns the management of the Pegeia aquifer. Therefore, it can also be supported that concerted efforts towards enhanced access to in‐formation could ameliorate current water management processes: the articulation and con‐sideration of informed views, diverse interests and public scrutiny over decisions‐taken would improve the effectiveness of adopted responses and improve their acceptability among social groups.
CONCLUDING REMARKS
The enhancement of public participation processes for water management in Cyprus has been the focus of several projects, funded by the EC and by the Government of Cyprus, in view of the WFD implementation process. INECO, as a Coordination Action project, fostered a similar process at local level; the participatory approach for the management of the Pegeia Aquifer managed to bring together stakeholders and citizens of the area, to discuss the state of the aquifer, current policies and potential mitigation options. This process has resulted in the identification and assessment of options related to: (a) the development of additional water supply sources, such as decentralised wastewater treatment and reuse, (b) the effi‐ciency in water use in the domestic sector and in irrigated agriculture, (c) regulation of indi‐vidual groundwater abstractions, (d) raising public awareness and participation.
A key requirement that emerged from INECO was the need for improving information shar‐ing patterns; it became apparent that despite the significant efforts and resources invested, information regarding water management does not reach the general public, especially at local level. Within the framework of the project, the provision of information on the state of the aquifer and on current policies regarding water management in Cyprus managed to fos‐ter the active involvement of citizens, highlighting the importance of instruments for en‐couraging water conservation and developing a new culture on “responsible” water use. Along this line, it is generally perceived that public involvement at the local level needs to be further enhanced through open and inclusive public hearings, awareness campaigns, partici‐pation in round table discussions and other means to support exchange of views and ideas.
Recommendations regarding the potential for the adoption of technical options could also be drawn based on the INECO experience. These include the maximisation of water recycling and reuse in agriculture and in the domestic sector. Such efforts have been supported by the

Page | 74
WDD through a series of incentives. The encouragement of conservation measures in the home and in tourist units through intensification of these efforts is seen as a vital solution to water stress issues. In addition, the construction of small‐scale desalination units for hotels and the engagement into stricter standards for water saving could enhance water conserva‐tion and alleviate pressures exerted in the public water supply system by large‐scale con‐sumers and rapidly developing sectors.

Page | 75
KEY INDICATORS FOR THE PEGIA AQUIFER STATE & MANAGEMENT
General data Groundwater vulnerability Groundwater in the area was until 2005 in nearly equilibrium state; however the low rate of replenishment, the high extraction rates, the application of fertilizers and the increasing tourism development make the aquifer vulnerable to pollu‐tion due to sea intrusion and seepage of domestic wastewater.
Water level decline (m) Until 2005, there has been increase of the water level.
Sustainable and Developed groundwater yield (m³/yr) Extraction should not exceed 1 hm³/yr. The annual amount that can be extracted from boreholes is about 2 – 2.4 hm³ but this should be considered as strategic reserve.
Groundwater treatment requirements No treatment required at present, as quality meets drinking water quality stan‐dards.
Sharing water Total groundwater abstraction / Groundwater recharge (%): 105% Estimate based on long‐term average data
Total groundwater use (m³/yr) Data are provided in Figure 27.
Groundwater as a percentage of total use of drinking water in the re‐gion(%): 100%
Valuing water Range of cost of groundwater extraction (£CY/m³): 0.02‐ 0.05
Groundwater abstraction charges/levies Groundwater abstraction charges are not practiced.
Governing water Groundwater Extraction Monitoring Monthly water level measurements – monthly abstraction measurements from water supply boreholes, water quality measurements twice a year (full ionic analysis and nitrates). It has become top priority to monitor all boreholes in the area and to equip them with water metres.
Groundwater Extraction Permit issuing A permit is needed from the District Office to drill a well. No regulations exist with respect to depths to drill which aquifers to penetrate and from which aqui‐fer to pump water. Following the drilling of a well no further control is exercised by the District Office.
Participation in decision‐making Until now, water management decisions in the region were not based on partici‐patory processes.

Page | 76
REFERENCES
[1] Water Framework Directive – March 2005 Report – Republic of Cyprus
[2] Water Development Department, “Implementation of Articles 5& 6 of the Water Framework Directive 2000/60/EC” , December 2005.
[3] Iacovos Iacovides, “Water resources management and patterns of water use in Cyprus”, Wa‐ter on Mediterranean Islands: Advanced Study Course SUSTAINS, Edited and published by Centre for Environment Research, 2005.
[4] Charis Omorphos, “Coping with drought – The experiences of Cyprus”, ARID Cluster Interna‐tional Conference, Coping with Drought and Water Deficiency: From Research to Policy Mak‐ing, Lemesos Cyprus, May 2005.
[5] Demetriou, Ch., Georgiou, A. “Management of Groundwater Resources in Cyprus – Harmoni‐sation with the EU Water Framework Directive”, BALWOIS Conference on Water Observation and Information System for Decision Support, Ohrid, FY Republic of Macedonia, 25‐19 May, 2004.
[6] Developing Strategies for Integrated Water Resources Management in Water Deficient Re‐gions – Methodological Approach and Case Studies”, WaterStrategyMan Project, June 2005.
[7] Guidelines for Integrated Water Management – Regional Experiences and Management Me‐thods Applicable to Water Stress Regions”, WaterStrategyMan Project, March 2005.
[8] Simulation of Ground water flow conditions in the coastal aquifer of Pegeia’ .E. Minles. P.
Perrochet, C.Zambaz, university of Neuchatel, Dec, 2005
[9] V. Markantonis, P. Getimis, D. Zikos, “Current status of water sector liberalization in Cyprus”, Sustainable Management and Quality of Water Project, 2002.
[10] Water Development Department, “Annual Report 2002” [11] Water Development Department, “Annual Report 2003” [12] Water Development Department, “Annual Report 2004” [13] Water Development Department, “Annual Report 2004” [14] Water Development Department, “Annual Report 2004” [15] I. Iacovides, “The Cyprus experience in planning water resources management: Past and Fu‐
ture”, The ARID Conference: Coping with drought and water deficiencies – from research to policy making, May 12‐13 2005.
[16] Developing Strategies for Integrated Water Resources Management in Water Deficient Re‐gions – Methodological Approach and Case Studies”, WaterStrategyMan Project, June 2005.