Embed Size (px)
Citation preview

Institutional Ownership, Cost of Capital, and Corporate Investment
Baruch Lev New York University
Stern School of Business (212) 998-0028
and
Doron Nissim Columbia University
Graduate School of Business (212) 854-4249
May 8, 2003 We gratefully acknowledge the research assistance of Shai Levi. We thank Brian Bushee for providing us with his institutional classification data.

Institutional Ownership, Cost of Capital, and Corporate Investment
Abstract Neoclassical models postulate that firms’ investment is determined by expected profitability and the cost of capital. Capital market imperfections, caused by information asymmetries and agency costs, lead to a modified investment scenario, where the external cost of capital is higher than the cost of internal funds. This, in turn, leads to the well-known result of underinvestment by firms. We hypothesize in this study that institutional investors alleviate some of the capital market frictions by their relatively efficient information processing and managerial monitoring activities, thereby mitigating the underinvestment problem. In support of this hypothesis, we provide evidence indicating that: (1) The size of institutional ownership in public companies is positively related to the rate of investment in fixed assets, corporate acquisitions, and R&D; (2) institutions that trade frequently attempting to exploit short-term mispricings are more effective in reducing information asymmetries and enhancing corporate investment than other institutions; and (3) institutional investors eliminate the documented mispricing of securities associated with business investments. Taken together, these findings suggest that institutional investors alleviate market imperfections, thereby mitigating the underinvestment problem.

1
Neoclassical investment theory identifies two major determinants of firms’ investment: expected
return on investment, and the cost of capital. These investment determinants are crystallized in
Tobin's (1969) well-known q-theory, postulating a positive relation between the firm’s q ratio—
market value divided by the replacement cost of assets—and its rate of investment. The q ratio
reflects both expected profitability and cost of capital, as perceived by investors. Indeed,
extensive empirical testing corroborated the q ratio-investment rate association (Hubbard, 1998).
The firm’s investment decision becomes more nuanced and complicated when capital
market frictions are admitted, particularly information asymmetries (between managers,
investors and creditors) and agency costs. With these frictions, the cost of external funds will
generally be higher than the cost if internal funds:
“In the presence of incentive problems and costly monitoring of managerial actions, external suppliers of funds to firms require a higher return to compensate them for these monitoring costs and the potential moral hazard associated with managers’ control over the allocation of investment funds” (Hubbard, 1998, pp. 194-95).
The existence of market frictions leads to a substantial modification of the neoclassical
investment model, predicting: (a) information asymmetries and/or agency costs will result in
underinvestment relative to the first-best benchmark,1 and (b) increases in the availability of the
lower-cost internal funds will positively affect the firm’s investment rate. Empirical work
corroborated these predictions (see research surveyed by Hubbard, 1998). In particular, measures
of available funds (financial slack) were found to be positively associated with the firm’s rate of
investment, given the q ratio and other fundamentals (e.g., Fazzari et al., 1988). In the
1 Firm underinvestment is predicted most clearly by the Myers and Majluf (1984) model. As stated by Stein (2001,p. 6): “To the extent that managers favor their current stockholders at the expense of potential future investors, they will wish to sell new shares at times when their private information suggests that these new shares are most overvalued. As a result, equity issues are rationally interpreted by the market as bad news … which in turn make managers of good firms reluctant to sell equity in the first place. The bottom line is that even firms who are badly in need of new equity--say because they have good investment opportunities but scarce internal resources--may be unable or unwilling to raise it.”

2
neoclassical, frictionless investment model, internal funds should not affect the investment
decision.
We focus in this study on the role of institutional investors in reducing the cost of
external funds via monitoring managers’ activities. Institutional investors frequently participate
in board activities and occasionally intervene in firms’ decisions to prevent self-serving
managerial behavior.2 Such monitoring can be expected to alleviate investors’ concerns with
agency issues, thereby reducing the cost of external funds. Perhaps more importantly,
institutional investors gather, analyze, disseminate and trade upon valuation-relevant information
on the firm, thereby improving price accuracy. This decrease in information asymmetry mitigates
underinvestment and deters managers from taking actions that are not in the best interest of
shareholders, as they realize that doing so would cause an immediate decrease in firm value. We
thus hypothesize that institutional investors’ activities narrow the wedge between the costs of
internal and external funds, thereby improving the underinvestment problem.
We predict that: (a) Other things equal, the larger the share of institutional ownership in
the firm (lowering the cost of external funds), the higher will be the rate of capital investment.
(b) The importance of internal funds in mitigating the adverse effect of market frictions on firm
investment, documented extensively by earlier research, should decrease in institutional
ownership which reduces the wedge between the cost of internal and external funds. (c)
Documented price inefficiencies associated with capital investments will decrease in institutional
ownership, because institutions decrease information asymmetries between managers and
external suppliers of funds. And (d) the role of institutions in mitigating underinvestment should
be more pronounced for “active” institutions, which contribute to price efficiency (and hence
2 The corporate governance interventions of CALPERS and TIAA-CREF, for example, get wide media coverage.
3
decrease information asymmetries) more than “passive” institutions. Our empirical findings for
investments in fixed assets, corporate acquisitions, and R&D corroborate all four predictions.
Thus, this study postulates and comprehensively documents the vital positive role of
institutional investors in firms’ investment decisions. These findings are particularly timely in
the current scandal-ridden environment, where multiple and costly laws and regulations are
enacted to improve the monitoring of managers. The free-market impact of institutional investors
on mitigating information asymmetries and agency costs documented here is an obvious
complement and perhaps even a partial substitute for regulation.3
The paper is organized as follows. Section 1 contains a literature review. Section 2
describes the data and research methodology. Section 3 presents the empirical results. Section 4
examines an alternative interpretation of the results, and Section 5 concludes the paper.
1. Relevant Research
In the neoclassical, frictionless scenario, the firm’s investment should be strongly associated with
Tobin’s q, since the latter reflects investors’ perceptions about expected profitability and cost of
capital. This association has indeed been corroborated by empirical research, but it was not found
to be as strong and pervasive as suggested by the neoclassical model (e.g., Morck, Shleifer, and
Vishny (1990)). Further, research has documented that other factors in addition to Tobin’s q
play an important role in the investment decision. Prominent among the factors are those
reflecting the availability of internal funds (e.g., cash in hand), the ability to borrow (e.g.,
3 Stein (2001) links underinvestment to earnings management, arguing that managers will underinvest in assets which are difficult for investors to monitor (e.g., R&D and maintenance), thereby inflating short-term earnings. There is some evidence supporting such behavior (e.g., Dechow and Sloan, 1991).

4
leverage), and the wedge between the cost of external and internal funds (e.g., information
asymmetries and underwriting costs).4
In his review of research on the effects of capital-market imperfections on corporate
investments, Hubbard (1998, p. 201) suggests that “… to be useful in empirical tests, sorting
criteria should focus on a firm’s characteristics that are associate with information costs. That is,
these criteria should attempt to identify firms likely to face a significant spread between the cost
of external financing and internal financing.” Our focus in this study on institutional investors
can be considered in Hubbard’s spirit as a sorting of firms by information costs. Institutional
investors gather, analyze, disseminate and trade upon valuation-relevant information on the firm,
and should therefore mitigate information asymmetries and reduce the gap between the costs of
internal and external funds.5 This, in turn, should alleviate underinvestment by the firm, lead to a
smaller effect of financial slack on firm investment, and cause higher share price accuracy. These
predictions are tested in the current study.
Although many prior studies find that institutions reduce information asymmetry and
improve price accuracy (see footnote 5), some show that institutional investments may actually
contribute to price inefficiency and induce myopic behavior by managers. Articles in the
financial press suggest that institutional investors are overly focused on current profitability, and
empirical research provides some support.6 Bushee (1998) demonstrates that the short-term focus
of many institutional investors induces some firms to reduce R&D when earnings are expected to
4 See references in Stein (2001, p. 24). 5 Institutional investors have relatively low marginal costs of gathering information (Lev (1988)) and enjoy increasing returns to scale in processing information (Wilson (1975)). Empirical research generally finds that institutional investors are on average more sophisticated than other investors (e.g., Hand (1990), Walter (1997), Utama and Cready (1997), Bushee (1998) and Jiambalvo et al. (2002)). 6 See Jiambalvo et al. (2002) for examples of media articles, and Hessel and Norman (1992), Potter (1992) and Bushee (2001) for empirical evidence.

5
decline. Research has also demonstrated that the preferences of institutional investors for certain
stock characteristics (e.g., large firm size) have a distorting effect on institutions’ contribution to
price efficiency (e.g., Gompers and Metrick (2001)). Moreover, several studies find that
institutional ownership increases stock return volatility (e.g., Potter (1992), Sias (1996), Bushee
and Noe (2000)), which may increase the cost of equity capital and reduce corporate investment.
Thus, the extent to which institutional investors mitigate firm underinvestment is an empirical
question, which this study addresses.
Our study is related to Richardson (2002), which finds that managers of firms with large
institutional ownership are less likely to overinvest surplus cash, due to the monitoring
(corporate governance) activities of institutions.7 We instead focus on the instance of
underinvestment by companies and extend the contribution of Richardson (2002) in several
directions. First, controlling for financial slack (cash) and investment opportunities, we find that
the level of institutional ownership positively affects firm investment. Second, we document and
explain similarities and differences in the effects of institutional ownership on different types of
corporate investments (property, plant & equipment, corporate acquisition, and R&D). Third, we
demonstrate that the positive effect of institutional ownership on firm underinvestment varies
considerably across institution type. Fourth, we show that institutional investors improve stock
mispricing associated with corporate investment. These extensions to available research are
important especially because they lead us to a different inference: Institutional ownership
reduces firm underinvestment, and this effect is primarily due to the reduction in information
asymmetries (rather than to corporate governance activities). Nevertheless, our findings are not
7 As discussed in Section 4 below, prior research has demonstrated that some firms invest in negative present value projects. This phenomenon is referred to as “overinvestment.” Note, however, that firms may simultaneously overinvest in some projects (e.g., corporate jets and other “perks” or projects that achieve diversification but destroy shareholder value) and underinvest in others (e.g., new machines or R&D).
6
contradicting those of Richardson (2002). Indeed, as discussed in Section 4, the results of the
stock return tests suggest that firms with high levels of institutional ownership are less likely to
overinvest in addition to being less prone to underinvest.
2. Research Methodology and Data
Our primary research design involves regressions of firm rates of investment on the previous
year’s levels of proxies for investment opportunities, financial slack, institutional ownership, the
interaction of institutional ownership and financial slack, and the “activism” of the institutions
holding the firm’s shares. As discussed above, to the extent that institutions reduce agency costs
and/or mitigate information asymmetries, we expect firm investment to (1) increase in the level
of institutional ownership, (2) decrease in the interaction between institutional ownership and
financial slack (which becomes less important with institutional ownership), and (3) increase in
institutional activism. We next discuss the data and variables, and then present the regression
models.
To construct the sample, we merge data from three sources: Accounting (financial
statement) numbers are derived from the COMPUSTAT industrial, full coverage, and research
files; stock returns and listing data are obtained from the Center for Research in Securities Prices
(CRSP) monthly files; and institutional 13(f) common stock holding data from Thomson
Financial Securities Data. Because institutional holding data are available only for the end-of-
calendar quarters, we restrict the sample to firm-year observations with December fiscal year-
end.
Firms increase or maintain operating capacity by acquiring fixed assets (capital
expenditures), or by purchasing other companies (business acquisitions). For many companies,

7
operating capacity is also acquired by investing in intangible assets, typically reported as
research and development (R&D) expenditures in the financial statements. Accordingly, we
measure the dependent variable (rate of total investment) as the sum of capital expenditures,
business acquisitions, and research and development during the year, divided by total assets at
the beginning of the year. As the three investment types may have different sensitivities to
institutional ownership, we also estimate regressions focusing on each type of investment
separately.8
Institutional ownership (IO) is measured as the fraction of shares outstanding held by
“large” institutional investors (institutions with more than $100 million of securities under
discretionary management, which are subject to the 13(f) disclosure requirements).9 Institutional
holding data are available from the first quarter of 1980 through the fourth quarter of 2000. As
we measure institutional ownership at the beginning of the year, our sample period is therefore
1981 through 2001.
Following previous studies (see the literature reviews in Hubbard (1998) and Stein
(2001)), we control for investment opportunities using Tobin’s q (Q), measured as the ratio of
the market value of equity plus the book value of debt to the sum of their book values.
Investment opportunities are also related to the average stage in the life cycle of the firm’s
products: All else equal, mature companies are expected to have lower investment opportunities,
8 Examining business acquisitions and research and development separately is important also because of the following measurement issue. Research and development expenditures are extracted from the income statement and many times include purchased in-process R&D (i.e., the amount allocated to the value of in-process R&D purchased in business acquisitions). Business acquisitions are extracted from the cash flow statement and include the amount of cash paid for in-process R&D. Consequently, the measure of total firm investment double-counts investments in in-process R&D for some firms. 9 When the number of outstanding shares was missing in Thomson (either due to missing data or to absence of institutional ownership), we extracted the information from CRSP. For shares not included in Thomson, we assumed zero institutional ownership.
8
and hence lower rates of investment. We use the log of total assets (LOGTA) and the number of
years since the start of coverage period by CRSP (AGE) as proxies for firm maturity.
Firms invest to exploit new investment opportunities, and also to maintain physical
capital. We control for capital maintenance investment using the ratio of depreciation and
amortization to total assets (DEP). We measure financial slack using the ratio of cash plus
marketable securities to total assets (CASH), and we also control for the ratio of debt to the sum
of debt and equity (LEV). Leverage reduces the amount of cash available for investment (due to
debt servicing costs) and it restricts the ability to borrow additional funds.
Institutional investors differ in their intensity of trading on fundamental information and
in their involvement in corporate governance activities. Accordingly, the effect of institutional
ownership on agency costs, information asymmetry, and hence on firm investment is likely to
vary across institution type. Bushee (1998) classifies institutional investors into three groups:
Institutions that hold large positions for a long period of time (“dedicated institutions”),
institutions that follow indexing strategies (“quasi-indexers”), and institutions that trade
frequently in stocks attempting to profit from short term price changes (“transient
institutions”).10 Ownership by dedicated institutions may mitigate the concerns of other investors
and creditors that management may waste their funds, and is therefore expected to reduce the
wedge between the costs of internal and external capital and increase firm investment. Transient
institutions trade quickly upon valuation-relevant information, and are therefore expected to
improve price accuracy and mitigate information asymmetries more than other institutions (e.g.,
Collins et al. (2003), Lev and Nissim (2003)). We therefore construct two variables in order to
capture the “activism” of institutions in reducing capital market frictions: The ratio of ownership
10 Bushee’s (1998) classification of institutional investors is based on their past investment patterns, as reflected in portfolio turnover, diversification, and momentum trading.

9
by dedicated institutions to total institutional ownership (IO_DED), and the ratio of ownership
by transient institutions to total institutional ownership (IO_TRA).11
Our proxies for investment opportunities, financial slack and institutional ownership are
not likely to fully capture the time series and cross-sectional variation in the factors influencing
corporate investments. To mitigate the effect of correlated omitted variables and to reduce
potential overstatement of t-statistics due to autocorrelation in the disturbance, we include fixed
year (αy) and industry (αind) effects in the regressions. The regression model we use is:
INVtj = αy + αind + β1 IOt-1j + β2 Qt-1j + β3 LOGTAt-1j + β4 AGEt-1j
+ β5 DEPt-1j + β6 LEVt-1j + β7 CASHt-1j + β8 IOt-1j × CASHt-1j
+ β9 IO_DEDt-1j + β10 IO_TRAt-1j + εtj (1)
where INVt is firm’s investment in year t (as discussed above, we use several measures of
investment), divided by total assets at t-1. All other variables are as defined above.
If institutional ownership mitigates market frictions caused by agency costs and/or
information asymmetries, we expect a positive coefficient on institutional ownership (β1) and a
negative coefficient on the interaction between institutional ownership and financial slack (β8). If
institutional ownership reduces agency costs, we expect a positive coefficient on IO_DED (β9),
and if institutional ownership mitigates information asymmetries, we expect a positive
coefficient for IO_TRA (β10).
We then conduct a more direct test of whether the relationship between firm investment
and institutional ownership is due to the effect of institutions on information asymmetry. Prior
11 Classification data are available for the years 1981–1999 and are missing only for a relatively few observations. For the year 2000, we used the 1999 classification. The measurement error due to this assumption is likely to be small because the time-series correlation in the classification scheme exceeds 80%. However, the frequency of missing classifications is larger for 2000 due to the unavailability of classification data for institutions that were added in 2000. We obtained similar results to those reported when excluding the year 2000 data.

10
research has shown that capital expenditures and business acquisitions are associated with
negative subsequent abnormal returns (mispricing).12 If institutional investors reduce information
asymmetry, the abnormal returns following capital expenditures and business acquisitions should
be less negative for firms with high levels of institutional ownership than with low levels. To
examine this hypothesis, each year we identify firms with high levels of capital expenditures or
business acquisitions (the top quintile of the empirical cross-sectional distribution), partition
these firms based on the level of institutional ownership into two equal-size groups, and examine
the subsequent abnormal returns for each group. We expect that the abnormal returns for the high
institutional ownership group will be lower in absolute value (i.e., less negative) than the
abnormal returns for the low institutional ownership group.
We perform the same test for research and developments expenditures. Unlike capital
expenditures and business acquisitions, R&D is associated with positive subsequent abnormal
returns (e.g., Lev and Sougiannis (1996)), although the pervasiveness of these returns has been
questioned (e.g., Chan et al. (2001)). If institutional ownership reduces information asymmetry,
the abnormal returns following the R&D investment should be smaller for high institutional
ownership firms. However, to the extent that institutional investors are better than other investors
in identifying firms with profitable R&D projects, the abnormal returns may actually be
positively related to the level of institutional ownership. Hence, unlike for capital expenditures
and business acquisitions, in the R&D case, the implications of the information advantage of
institutional investors for subsequent stock returns are not clear.
12 For evidence on the negative association between capital expenditures and subsequent stock returns, see, for example, Abarbanell and Bushee (1998), Titman at el. (2001), and Beneish at el. (2001). The research on the (negative) relationship between business acquisitions and subsequent stock returns is voluminous (see Stein (2001) for review).
11
3. Empirical Results
3.1 Institutional Ownership and Firm Investment
Table 1 presents the estimates of Equation (1) with total firm investment (fixed assets,
acquisitions, and R&D) as the dependent variable, for four five-year periods: 1982–1986, 1987–
1991, 1992–1996, and 1997–2001.13 It is evident that the estimated coefficient on institutional
ownership (IO) is positive and significant (see t-values below the coefficients) in all four periods,
consistent with the hypothesis that institutional investors mitigate the effects of capital market
imperfections on firms’ investments, namely reduce the cost of external capital. The magnitude
and significance of the IO coefficient are larger in the last two periods (the 1990s) relative to the
first two periods (the 1980s), consistent with evidence that the capital markets impact of
institutions has increased considerably during the 1990s (e.g., Gompers and Metrick (2001)). We
further examine this trend in the IO coefficient in subsequent analyses.
The sign and significance of the coefficients on the control variables are generally
consistent with expectations. Specifically, in each of the four time periods, investment is
positively and strongly related to Tobin’s q (Q), and to depreciation (DEP), and negatively
related to firm’s age (AGE) and leverage (LEV). In addition, the relationship of investment with
the level of cash (CASH) is positive and significant in three of the four periods, and the
relationship with firm size (LOGTA) is negative and significant in two periods.
The coefficient on the interaction variable (between institutional ownership and financial
slack) is negative and at least marginally significant in each of the four periods. This result
supports the hypothesis that the effect of financial slack in mitigating underinvestment is smaller
for firms with high levels of institutional ownership, which in turn implies that institutional
13 We delete all observations for which any of the variables used in the regressions lies outside the 0.5% to 99.5% range of its empirical distribution.

12
investors reduce the negative effect of capital market imperfections on corporate investments.
Again, this effect is larger and more significant in the 1990s. We are not the first to document
this relationship. Richardson (2002) reports a similar result and interprets it as evidence that
institutional ownership reduces firm overinvestment. As discussed in Section 4, based on
evidence from several different tests, we suggest an alternative interpretation: Institutional
investors mitigate underinvestment by reducing firms’ dependence on financial slack.
The results for institutional activism are somewhat mixed. In each of the four periods, the
coefficient on the intensity of ownership by transient institutions (IO_TRA) is positive and
highly significant, indicating that institutions that trade frequently in stocks attempting to profit
from short term price changes mitigate information asymmetries more than other institutions.
However, the coefficient on the intensity of ownership by dedicated (long-term) institutions
(IO_DED) is generally insignificant, suggesting that corporate governance activities by
institutional investors have a limited impact on firms’ investment.
We next examine whether the effects of institutional ownership, financial slack and
institutional activism in mitigating market frictions vary by the type of corporate investment.
Table 2 presents estimation results for capital expenditures (Panel A), business acquisitions
(Panel B), and R&D (Panel C). For capital expenditures, all the results are similar to those
reported in Table 1 for total firm investments, except that now there are no apparent time trends
in the IO and IO_TRA coefficients.
The results for business acquisitions (in Panel B of Table 2) differ in various respects
from those of fixed assets (Panel A): The average R-squared for the business acquisitions
regressions is about 10 percent compared with 55 percent for capital expenditures. This is not
surprising, given the lump sum nature of business acquisitions. Accordingly, the t-statistics for
13
the coefficients are generally smaller than for the corresponding coefficients in the capital
expenditures regressions. However, for the variables of interest, the coefficients have the same
signs as in the capital expenditures regressions and are generally significant. In particular,
institutional ownership and the intensity of ownership by transient institutions are both positively
related to business acquisitions, and the interaction term (institutional ownership and cash) is
negative. The only major difference with fixed assets is that the IO coefficient in the business
acquisitions regressions has a strong positive time trend: The coefficient is about three times
larger in the 1990s relative to the 1980s.
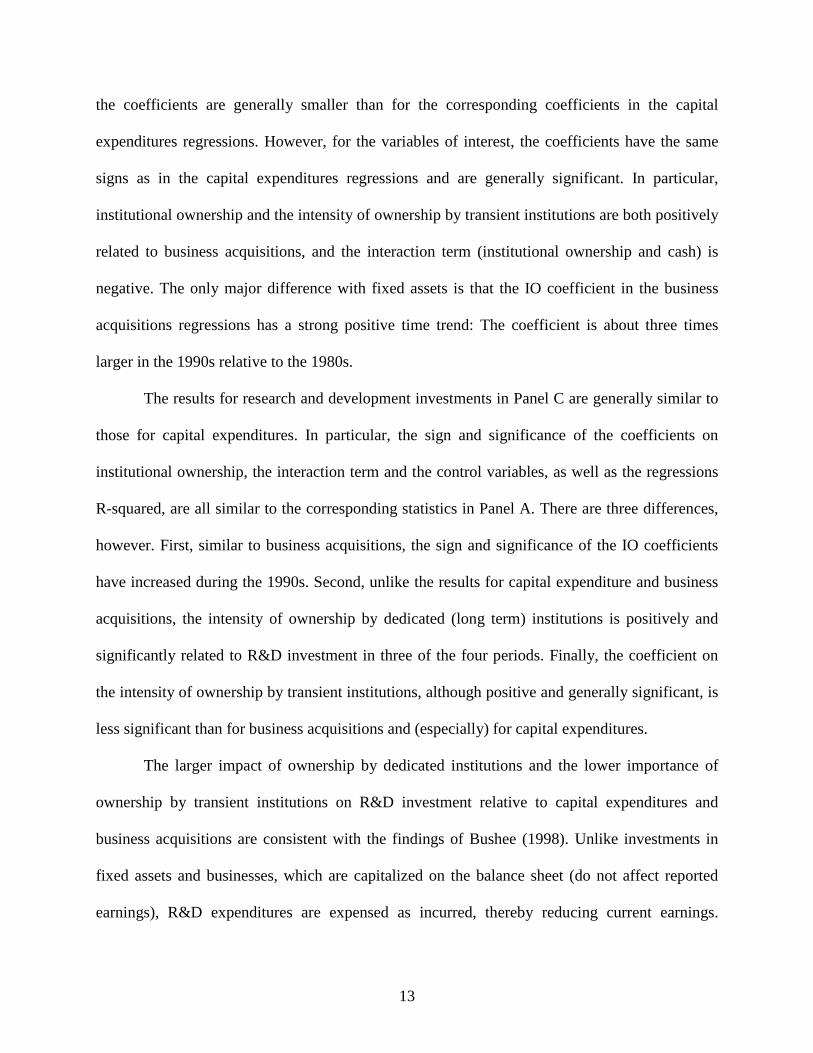
The results for research and development investments in Panel C are generally similar to
those for capital expenditures. In particular, the sign and significance of the coefficients on
institutional ownership, the interaction term and the control variables, as well as the regressions
R-squared, are all similar to the corresponding statistics in Panel A. There are three differences,
however. First, similar to business acquisitions, the sign and significance of the IO coefficients
have increased during the 1990s. Second, unlike the results for capital expenditure and business
acquisitions, the intensity of ownership by dedicated (long term) institutions is positively and
significantly related to R&D investment in three of the four periods. Finally, the coefficient on
the intensity of ownership by transient institutions, although positive and generally significant, is
less significant than for business acquisitions and (especially) for capital expenditures.
The larger impact of ownership by dedicated institutions and the lower importance of
ownership by transient institutions on R&D investment relative to capital expenditures and
business acquisitions are consistent with the findings of Bushee (1998). Unlike investments in
fixed assets and businesses, which are capitalized on the balance sheet (do not affect reported
earnings), R&D expenditures are expensed as incurred, thereby reducing current earnings.

14
Bushee (1998) demonstrates that ownership by dedicated (transient) institutions decreases
(increases) the probability that managers reduce R&D when earnings are expected to decline. We
focus on all firms (not just those that are expected to report earnings declines), and hence this
effect is likely to be smaller for our sample. Nevertheless, consistent with the findings of Bushee
(1998), our results suggest that the short-term focus of transient institutions reduces their
effectiveness in mitigating firm underinvestment in R&D.
Searching for an explanation to the distinct trends over the sample period in the IO
coefficients documented in Table 2 (strong positive trends for business acquisitions and R&D
versus no trend for capital expenditures), we report in Table 3 the mean values of each type of
investment (deflated by total assets at the beginning of the year), for each of the four sample
periods. It is evident that the intensity of business acquisitions and R&D has increased
substantially during the 1990s, while the intensity of capital expenditures has slightly declined.
These results suggest that the strengthening of the association of institutional ownership with
business acquisitions and R&D during the 1990s is at least in part due to the increase in the
importance of these investment forms.
Equation (1) simultaneously tests three different hypotheses using four terms that are all
calculated based on the level of institutional ownership (IO, IO×CASH, IO_DED, IO_TRA).
This raises the concern that some of the results may be spurious. For example, the coefficient on
IO may be non-zero because it is affected by non-linearity in the relationship between firm
investment and IO×CASH. We therefore re-estimate equation (1) using subsets of the four IO
terms to check the robustness of the results. We obtain similar results to those reported above in
all cases. For example, when we exclude the interaction term, we find that the coefficients on IO

15
and IO_TRA are positive and highly significant in each of the four periods, and the coefficient
on IO_DED is generally insignificant.
Summarizing, we document that institutional investors, particularly the active ones,
enhance the rate of corporate investment, likely because they alleviate market imperfections.
Consistent with this we find that the role of internal funds in firms’ investment decreases with
institutional ownership. For investments in R&D and business acquisitions, which increased
significantly in the 1990s, we document a similar enhanced effect of institutional investors on
corporate investment.
3.2 Future Returns
In this section we present direct evidence on the contribution of institutions to share price
accuracy and in turn to the reduction of capital market frictions. Specifically, we examine the
association between future abnormal stock returns and the level of institutional ownership for
firms with high levels of capital investments. Prior research has demonstrated that capital
investments are on average followed by negative abnormal stock returns, implying investors’
mispricing of securities around corporate investments. Hence, to the extent that institutions are
relatively sophisticated investors, capital investments by firms with high levels of institutional
ownership should be followed by less negative abnormal returns than investments by firms with
lower institutional ownership.
To examine this prediction, we perform the following analysis. In each of the 20 years
between 1980 and 1999 (referred to as year t), we select the 20 percent of firms with the largest
ratio of capital expenditures to total assets and, for these observations, construct two equal-size

16
portfolios based on the level of institutional ownership (IO).14 We then examine the annual
return from May 1 of year t+1 through April 30 of year t+2 for each portfolio, and test the
significance of the difference in abnormal returns between the two portfolios.
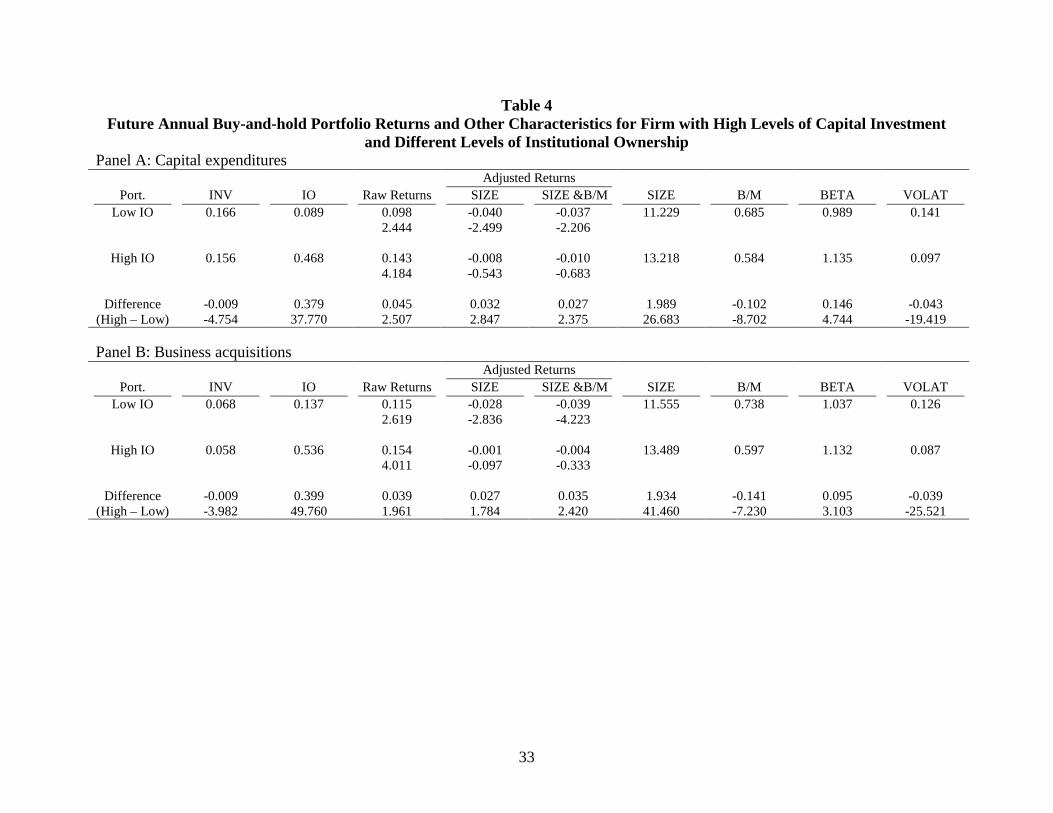
The results of this analysis are reported in Panel A of Table 4. Panels B and C report the
results of similar analyses for investments in business acquisitions and R&D, respectively. For
each portfolio (low IO, high IO), we report the time-series mean of each year’s cross-sectional
mean for investment (INV), institutional ownership (IO), three measures of subsequent portfolio
returns (raw returns, and two measures of abnormal, risk-adjusted returns: size-adjusted returns,
and returns adjusted for both size and book-to-market), and four firm and stock return
characteristics (SIZE, B/M, BETA, and VOLAT). For the three portfolio return measures, we
also report the t-statistics associated with the time-series distribution of the cross-sectional
means. At the bottom of each panel we report the time-series means and t-statistics for the
differences in the mean portfolio returns and the various characteristics between the high and low
IO portfolios.
The first measure of subsequent returns in Table 4 (Raw Returns) is the one-year ahead
(subsequent to investment) buy-and-hold return. The second measure (SIZE Adjusted Returns) is
calculated by deducting the contemporaneous size-decile return from the firm’s raw return. The
third measure (SIZE & B/M Adjusted Returns) is calculated as the difference between the firm’s
return and the contemporaneous return on a matched portfolio based on size (five quintiles) and
book-to-market (five quintiles for each size quintile). In effect, we construct 25 benchmark
14 We cannot use fiscal years after 1999 for this analysis, since the CRSP files we use contain data through December, 2001. As discussed below, we measure abnormal returns from the beginning of May of the subsequent year, and cumulate returns until April of the following year.

17
portfolios, and subtract the return of the corresponding benchmark portfolio from the firm’s raw
return.15
The benchmark size and book-to-market returns are calculated using all firms with
available data on CRSP. SIZE is measured as the log of the market value of equity at the end of
April in year t+1. The book-to-market ratio (B/M) is calculated using the market and book values
of common equity at the end of the year t. The returns include all distributions to shareholders.
For securities that delist during the one-year holding period, proceeds from the issue are invested
in the NYSE, AMEX, and NASDAQ value-weighted index until the end of the holding period.
Consistent with prior evidence (see footnote 12), the estimates in Panel A of Table 4
indicate that capital expenditures are associated with negative subsequent abnormal returns (e.g.,
-4% size-adjusted return for low IO firms). However, these negative returns are large and
significant only for firms with low levels of institutional ownership, and, as predicted, are
insignificant for the high IO portfolio. More importantly, the differences in returns between the
high and low IO portfolios are positive and significant for all three measures of returns (raw,
size-adjusted, and size and book-to-market adjusted). The mean SIZE (B/M) for the high
institutional ownership group is larger (smaller) than that of the low IO firms, indicating that
mismeasurement of risk related to size and book-to-market is unlikely to induce a spurious
positive relation between IO and abnormal returns. Accordingly, these results suggest that
institutional investors price the stocks of firms with high levels of capital expenditures more
accurately than other investors, which is consistent with our hypothesis that institutional
ownership reduces firm underinvestment by decreasing information asymmetry.
15 We obtained similar results to those reported below when controlling for size and book-to-market using 100 (=10×10) portfolios.

18
The two columns on the right of Table 4 report two additional characteristics that may be
related to risk: BETA and stock volatility (VOLAT). BETA is estimated using monthly stock
returns and the CRSP value-weighted returns (including all distributions) during the five years
that end in April of year t+1 (at least 30 observations are required). VOLAT, which reflects
idiosyncratic risk, is the root mean squared error from the BETA regression. As shown, the mean
value of VOLAT for the high IO portfolio is significantly smaller than that for the low IO
portfolio. Thus, differences in idiosyncratic risk cannot explain the differences in returns
between high and low IO portfolios (firms with low levels of institutional ownership have more
idiosyncratic risk and still generate smaller returns). However, consistent with prior evidence
(e.g., O’Brien and Bhushan, 1990), the relationship between BETA and institutional ownership
is positive and significant, which is consistent with a mismeasured risk explanation for our
results. Fama and French (1992) show that after controlling for SIZE and B/M (as we do in the
SIZE & B/M adjusted returns), BETA becomes insignificant, implying that differences in BETA
cannot explain our results. In any case, we show below using cross-sectional regressions that IO
is positively related to abnormal returns even after controlling for all the firm and stock
characteristics from Table 4, including BETA.
Panel B of Table 4 presents the results for business acquisitions. Consistent with prior
research (see footnote 12), we find that business acquisitions are associated with negative
subsequent abnormal returns (i.e., mispricing at time of acquisition), but, similar to the capital
expenditures results, the negative returns are significant only for firms with low levels of
institutional ownership. Also similar to the capital expenditures results, the differences in returns
between the two IO groups are significant for all three measures of returns, and the signs of the
differences in the firm and stock characteristics are positive for SIZE and BETA and negative for

19
B/M and VOLAT. Thus, this analysis provides further support for the hypothesis that
institutional ownership leads to more accurate securities’ pricing and in turn to lower levels of
firm underinvestment.
The results of the R&D analysis are presented in Panel C of Table 4. Unlike capital
expenditures and business acquisitions, R&D expenditures are followed by positive abnormal
returns of approximately five percent for each of the IO groups. These abnormal returns appear
inconsistent with the hypothesis that institutional ownership reduces information asymmetry and
increases price accuracy. However, the causal effect of institutional ownership in improving
price accuracy may be offset in the cross section by the following association effect: if
institutional investors are better than other investors in identifying profitable R&D projects,
firms with high levels of institutional ownership may be more likely to outperform other firms.
Moreover, as none of the abnormal return measures are statistically significant, they may simply
reflect the high stock price volatility associated with R&D activities.
Table 5 presents summary statistics from cross-sectional regressions of the following
equation:
Rt+1j = β0 + β1 IOtj + β2 SIZEtj + β3 B/Mtj
+ β4 BETAtj + β5 VOLATtj + β6 INVtj + εt+1j, (2)
where all variables are as defined above (Rt+1 is the “Raw Returns” measure from Table 4).16 The
statistics reported are the time series means of the annual cross-sectional coefficients and the
associated t-statistics (the ratio of the mean of the cross-sectional coefficients to its standard
error). The advantage of this approach relative to the portfolio analysis reported in Table 4 is that
it allows us to explicitly and simultaneously control for all the firm and stock characteristics in
16 To mitigate the effects of outliers (see Knez and Ready, 1997), we delete observations with values outside the 0.5%-99.5% range of the pooled empirical distribution of any of the explanatory variables.

20
Table 4. This is important because institutional ownership is positively related to BETA and
negatively related to investment. (Although we focus on high investment firms, the difference in
investment between the high and low IO groups is negative and significant for each of the three
investment types.) The regression results in table 5 are consistent with those of the portfolio
analysis: Institutional ownership significantly reduces the magnitude of the (negative) abnormal
returns associated with capital expenditures and business acquisitions, but it does not affect the
returns associated with R&D.
Summarizing, we documented here that institutional investors alleviate the widespread
mispricing of securities associated with corporate investment. This provides direct support for
our hypothesis that the positive impact of institutional investors on the rate of corporate
investment documented in Section 3.1 is mainly due to improved price efficiency brought about
by the activities of institutions.
4. Less Underinvestment or More Overinvestment?
While we focus in this study on firm underinvestment, prior research suggests that many firms
invest in negative present value projects and label this phenomenon as “overinvestment” (e.g.,
Shleifer and Vishny, 1997). Examples include investments in corporate jets and other “perks,”
diversification activities that reduce shareholders value (shareholders are typically less concerned
about idiosyncratic risk than managers), and empire building activities. This evidence implies an
alternative explanation for the positive relationship we document between firm investment and
institutional ownership: Firms with high levels of institutional ownership are more likely to
overinvest (rather than being less likely to underinvest). In this section we examine and provide
evidence contradicting this explanation.

21
First, the overinvestment literature typically associates overinvestment with the
availability of surplus cash (e.g., Richardson, 2002). This suggests that investments by firms that
are prone to overinvest should be more sensitive to surplus cash. But the evidence in Richardson
(2002) and in Tables 1 and 2 of this study indicates that investment by firms with high
institutional ownership is less sensitive to financial slack, which implies that these firms are less
likely to overinvest.
Second, to the extent that investors do not fully recognize in a timely manner the value
implications of overinvestment, corporate investments should be negatively related to subsequent
stock returns, as investors realize over time the negative consequences of overinvestment. Yet,
we document in Tables 4 and 5 that the magnitude of negative stock returns following large
investments is substantially smaller for high institutional ownership firms, which suggests that
these firms are less likely to overinvest. However, our future stock returns results cannot rule out
the possibility that the negative value implications of overinvestment are immediately
impounded in the stock prices of high institutional ownership firms, but are reflected in the
prices of low institutional ownership firms with a lag. We next examine this possibility.
To compare the market reaction to corporate investments for firms with high versus low
institutional ownership, we rerun equation (2) measuring investment (INV) during year t+1 (i.e.,
the stock return period) instead of year t. That is, each year, we estimate the following equation:
Rt+1j = β0 + β1 IOtj + β2 SIZEtj + β3 B/Mtj
+ β4 BETAtj + β5 VOLATtj + β6 INVt+1j + εt+1j, (3)
22
focusing on firms with values for INVt+1 (capital expenditures, business acquisitions or R&D) in
the upper quintile of the cross-sectional distribution.17 If firms with high levels of institutional
ownership overinvest, and if market prices of such firms are more accurate than those of low
institutional ownership firms (i.e., investors react in a more timely manner to overinvestment by
high institutional ownership firms than to overinvestment by low institutional ownership firms),
the coefficient on IO should be negative. Table 6 reports summary statistics from the cross-
sectional regressions. As shown, for each of the three investment types, the coefficient on IO is
insignificant, indicating that the market reaction to corporate investments is not stronger for high
institutional ownership firms.
Thus, the evidence in Tables 4, 5, and 6 indicates that the contemporaneous market
reaction to investments by high institutional ownership firms is similar to that for investments by
low institutional ownership firms, while the subsequent year returns are larger for high
institutional ownership firms. These results, in turn, suggest that firms with high levels of
institutional ownership are less likely to overinvest relative to other firms (overall, the market
reacts less negatively to investments by high institutional ownership firms). The positive
relationship between corporate investments and institutional ownership (Tables 1 and 2) suggests
that high institutional ownership firms are also less likely to underinvest, and that the reduction
in firm underinvestment due to institutional ownership is greater than the reduction in firm
overinvestment (hence the positive association between firm investment and institutional
ownership).
17 As discussed in Section 3.2, we include INV as an explanatory variable because, although we focus on high INV firms, there are still cross-sectional differences in INV, which may be correlated with IO. However, we obtain very similar results (in terms of the IO coefficient) when excluding INV.

23
5. Conclusion
This study examines whether stock ownership by institutional investors mitigates the
detrimental effects of capital market imperfections on firms’ investments. Stated differently, we
examine whether institutions reduce the cost of external capital by processing information
efficiently and monitoring managers’ activities. In particular, the study examines whether,
controlling for investment opportunities and financial slack, firm investment is (1) positively
related to the level of institutional ownership, (2) negatively related to the interaction between
financial slack and institutional ownership, and (3) positively related to the degree of activism of
the institutions holding the firms’ shares. As a direct test of the effect of institutional investors on
information asymmetry, we also examine whether stock price efficiency with respect to firm
capital investments is increasing in the level of institutional ownership.
We find that stock ownership by institutional investors, especially active ones, mitigates
firm underinvestment by lowering market frictions. The lower level of market frictions, in turn,
decreases the effect of financial slack on firm investment, a result also documented by
Richardson (2002). These findings hold for each of the three types of investments examined:
capital expenditures, business acquisitions, and research and development. The institutions that
contribute most to the reduction in firm underinvestment are those that invest for the short term,
attempting to profit from securities’ mispricing. We find that the effect of “dedicated (long term)
institutions” (which are more likely to engage in corporate governance activities) on corporate
investment is rather limited. Moreover, we provide direct evidence that institutional ownership
mitigates information asymmetries, by showing that it alleviates documented mispricings
associated with corporate investments. These findings suggest that institutional investors

24
mitigate firm underinvestment, primarily by reducing information asymmetries, which in turn
reduce the wedge between the cost of internal and external funds.

25
References
Abarbanell, J. and B. Bushee. (1998). “Abnormal returns to a fundamental analysis strategy.” The Accounting Review 73, 19-45.
Beneish, M. D., C. M. C. Lee and R. L. Tarpley. (2001). “Contextual fundamental analysis in the prediction of extreme returns.” Review of Accounting Studies 6, 165-189.
Bushee, B. (1998). “The influence of institutional investors on myopic R&D investment behavior.” Accounting Review 73, 305-33.
Bushee, B. (2001). “Do institutional investors prefer near-term earnings over long-run value?” Contemporary Accounting Research 18, 207-246.
Bushee, B. and C. F. Noe. (2000). “Corporate disclosure practices, institutional investors, and stock return volatility.” Journal of Accounting Research 38, 171-207.
Chan, L. C. K., J. Lakonishok and T. Sougiannis. (2001). “The stock market valuation of research and development expenditure.” Journal of Finance 56, 2431-2456.
Collins, D., G. Gong and P. Hribar. (2003). “Investor sophistication and the mispricing of accruals.” Working Paper, University of Iowa.
Cready, W. M. (1994). “Determinants of relative investor demand for common stocks.” Journal of Accounting, Auditing, and Finance 10, 487-507.
Dechow, P. and R. Sloan. (1991). “Executive Incentives and the Horizon Problem: An Empirical Investigation.” Journal of Accounting and Economics 14: 51-89.
Fairfield, P. M., J. S. Whisenant and T. L. Yohn. (2001). “Accrued Earnings and Growth: Implications for Earnings Persistence and Market Mispricing.” Working Paper, Georgetown University.
Fama, E. F. and K. R. French. (1992). “The cross-section of expected stock returns.” Journal of Finance 47, 427-465.
Fazzari, S. M., R. G. Hubbard and B.C. Petersen. (1988). “Financing constraints and corporate investment.” Brookings Papers on Economic Activity, 141-195.
Gompers, P. and A. Metrick. (2001). “Institutional investors and equity prices.” Quarterly Journal of Economics 116, 229-259.
Hand, J. (1990). “A test of the extended functional fixation hypothesis.” Accounting Review 65, 740-763.
Hessel, C. and M. Norman. (1992). “Financial characteristics of neglected and institutionally held stocks.” Journal of Accounting, Auditing, and Finance 7, 313-334.

26
Hubbard, R. G. (1998). “Capital-Market Imperfections and Investment.” Journal of Economic Literature 36, 193-225.
Jiambalvo, J., S. Rajgopal and M. Venkatachalam. (2002). “Institutional ownership and the extent to which stock prices reflect future earnings.” Contemporary Accounting Research 19, 117-145.
Knez, P. J. and M. J. Ready. (1997). “On the robustness of SIZE and book-to-market in cross-sectional regressions.” Journal of Finance 52, 1355-1382.
Lev, B. (1988). “Toward a theory of equitable and efficient accounting policy.” The Accounting Review 63, 1-22.
Lev, B. and D. Nissim. (2003). “Institutional Investors and Share Price Accuracy.” Working Paper, Columbia University.
Lev, B. and T. Sougiannis. (1996). “The capitalization, amortization, and value-relevance of R&D.” Journal of Accounting & Economics 21, 107-138.
Morck, R., A. Shleifer and R. Vishny. (1990a). “The Stock Market and Investment: Is the Market a Sideshow?” Brookings Papers on Economic Activity, 157-215.
Myers, S. C. and N. C. Majluf. (1984). “Corporate Financing and Investment Decisions when Firms Have Information that Investors Do Not Have”, Journal of Financial Economics 13, 187-222.
O’Brien, P. and R. Bhushan. (1990). “Analyst following and institutional ownership.” Journal of Accounting Research 28, 55-82.
Potter, G. (1992). “Accounting earnings announcements, institutional investor concentration, and common stock returns.” Journal of Accounting Research 30, 146-155.
Pruitt, S. W. and K. C. J. Wei. (1989). “Institutional ownership and changes in the S&P 500.” Journal of Finance 44, 509-513.
Richardson, S. (2002). “Corporate Governance and the Over-investment of Surplus Cash.” Working Paper, University of Pennsylvania.
Richardson, S. A., R. G. Sloan, M. Soliman and A. I. Tuna. (2002). “Information in accruals about earnings persistence and future stock returns.” Working paper, University of Pennsylvania.
Sias, R. (1996). “Volatility and the institutional investor.” Financial Analysts Journal 52, 13-20.
Stein, J. C. (2001). “Agency, Information and Corporate Investment.” Working Paper, NBER.
Tobin, J. (1969). “A General Equilibrium Approach to Monetary Theory.” Journal of Money Credit & Banking 1, 15-29.

27
Utama, S. and W. Cready. (1997). “Institutional ownership, differential predisclosure precision and trading volume at announcement dates.” Journal of Accounting and Economics 24, 124-50.
Walther, B. R. (1997). “Investor sophistication and market earnings expectations.” Journal of Accounting Research 35, 157-179.
White, H. (1980). “A heteroskedasticity-consistent covariance matrix estimator and a direct test for heteroskedasticity.” Econometrica 48, 817-838.
Wilson, R. (1975). “Informational economies of scale.” Bell Journal of Economics 6, 658-667.

28
Table 1 Fixed Effect (Year and Industry) Regressions of Firm Investment
on the Previous Year Values of Institutional Ownership and Control Variables
Exp. Sign 1982-1986 1987-1991 1992-1996 1997-2001 IO + 0.072 0.039 0.097 0.118 4.046 4.318 10.833 13.722 Q + 0.031 0.015 0.015 0.015 9.339 9.303 13.571 19.058
LOGTA – -0.002 -0.001 -0.006 -0.011 -1.483 -0.867 -7.564 -12.435
AGE – -0.001 -0.001 -0.001 -0.001 -5.841 -10.853 -13.561 -12.616
DEP + 0.920 0.923 0.999 0.836 8.410 12.748 14.067 12.999
LEV – -0.035 -0.043 -0.035 -0.010 -3.711 -7.977 -6.578 -1.887
CASH + -0.001 0.045 0.096 0.114 -0.033 4.523 10.523 13.210
IO × CASH – -0.110 -0.055 -0.112 -0.176
-1.555 -2.292 -5.360 -8.887
IO_DED + 0.007 -0.014 0.006 0.013 0.913 -2.178 0.985 1.741
IO_TRA + 0.036 0.034 0.062 0.037 4.169 4.139 7.559 5.455
R2
0.549 0.552 0.582 0.573
N 6208 9031 13668 17305 Notes: For each variable, the first row reports the coefficient and the second row reports White’s (1980) t-statistic. The dependent variable, firm investment, is measured as the total of capital expenditures, business acquisitions and research and development expenditure during the year, deflated by the book value of total assets at the beginning of the year. All the explanatory variables are measured as of the end of the previous year. IO is the fraction of outstanding shares held by institutional investors. Tobin’s q (Q) is the ratio of the market value of equity plus the book value of debt to the sum of their book values. LOGTA is the log of total assets. AGE is the number of years since the start of coverage period by CRSP. DEP is the ratio of depreciation and amortization to total assets. LEV is the ratio of debt to the sum of debt and equity. CASH is the ratio of cash plus marketable securities to total assets. IO_DED (IO_TRA) is the ratio of ownership by transient (dedicated) institutions to total institutional ownership.

29
Table 2 Fixed Effect (Year and Industry) Regressions of Different Types of Firm Investment
on the Previous Year Values of Institutional Ownership and Control Variables Panel A: Capital expenditures
Exp. Sign 1982-1986 1987-1991 1992-1996 1997-2001 IO + 0.038 0.028 0.036 0.032 4.436 5.354 8.140 8.523 Q + 0.015 0.006 0.005 0.005 8.721 8.248 9.982 15.826
LOGTA – -0.001 0.001 -0.001 -0.002 -1.394 1.194 -1.450 -4.714
AGE – 0.000 -0.001 -0.001 0.000 -5.860 -9.624 -13.640 -11.224
DEP + 0.652 0.629 0.691 0.463 10.664 13.266 16.435 14.596
LEV – -0.023 -0.027 -0.029 -0.010 -4.519 -8.182 -10.548 -4.418
CASH + -0.033 -0.017 -0.004 -0.005 -3.885 -3.667 -0.932 -1.534
IO × CASH – -0.020 -0.023 -0.023 -0.020
-0.948 -1.962 -2.505 -2.822
IO_DED + 0.002 -0.013 -0.002 -0.003 0.523 -3.954 -0.701 -1.004
IO_TRA + 0.022 0.020 0.035 0.014 4.816 3.913 8.272 5.061
R2
0.621 0.574 0.572 0.566
N 6210 9040 13692 17405

30
Panel B: Business acquisitions Exp. Sign 1982-1986 1987-1991 1992-1996 1997-2001 IO + 0.018 0.008 0.040 0.051 1.863 1.480 7.099 9.452 Q + 0.000 -0.001 0.000 0.001 0.041 -1.396 0.686 2.326
LOGTA – 0.001 0.000 -0.001 0.000 1.169 -0.402 -2.756 -0.607
AGE – 0.000 0.000 0.000 -0.001 -2.714 -4.403 -5.436 -7.578
DEP + 0.037 -0.038 -0.068 -0.127 0.723 -1.288 -2.576 -4.467
LEV – -0.009 -0.001 -0.001 -0.004 -1.935 -0.349 -0.519 -1.402
CASH + 0.019 0.005 -0.002 -0.016 1.816 1.020 -0.650 -3.881
IO × CASH – -0.050 0.002 -0.046 -0.062
-2.110 0.148 -4.446 -6.245
IO_DED + 0.001 0.000 -0.001 -0.001 0.177 0.089 -0.190 -0.259
IO_TRA + 0.008 0.011 0.016 0.012 1.863 2.525 3.793 3.676
R2
0.100 0.086 0.127 0.142
N 6204 9014 13651 17242

31
Panel C: Research and development Exp. Sign 1982-1986 1987-1991 1992-1996 1997-2001 IO + 0.006 0.009 0.009 0.015 1.857 3.151 3.390 5.912 Q + 0.008 0.007 0.007 0.008 7.332 6.967 12.247 16.713
LOGTA – 0.001 -0.001 -0.002 -0.006 1.987 -3.515 -6.340 -15.332
AGE – 0.000 0.000 0.000 0.000 -0.097 -3.784 -4.594 -3.137
DEP + 0.132 0.277 0.305 0.334 5.990 9.457 10.190 11.696
LEV – -0.010 -0.010 -0.008 -0.005 -5.035 -4.342 -4.330 -2.100
CASH + 0.022 0.050 0.097 0.120 4.138 9.459 17.523 24.132
IO × CASH – -0.044 -0.032 -0.031 -0.056
-3.863 -2.796 -2.694 -5.431
IO_DED + 0.004 -0.002 0.011 0.014 2.046 -0.755 3.929 4.120
IO_TRA + 0.004 0.006 0.007 0.003 1.741 1.953 2.050 1.070
R2
0.568 0.532 0.597 0.612
N 6241 9054 13721 17382 Notes: For each variable, the first row reports the coefficient and the second row reports White’s (1980) t-statistic. The dependent variables in Panels A, B and C are capital expenditures, business acquisitions and research and development expenditure during the year, respectively, deflated by the book value of total assets at the beginning of the year. All the explanatory variables are measured as of the end of the previous year. IO is the fraction of outstanding shares held by institutional investors. Tobin’s q (Q) is the ratio of the market value of equity plus the book value of debt to the sum of their book values. LOGTA is the log of total assets. AGE is the number of years since the start of coverage period by CRSP. DEP is the ratio of depreciation and amortization to total assets. LEV is the ratio of debt to the sum of debt and equity. CASH is the ratio of cash plus marketable securities to total assets. IO_DED (IO_TRA) is the ratio of ownership by transient (dedicated) institutions to total institutional ownership.

32
Table 3 Mean Firm Investment Over Time
Investment Type 1982-1986 1987-1991 1992-1996 1997-2001
Capital expenditure 0.079 0.066 0.065 0.061
Business acquisitions 0.017 0.016 0.021 0.029
Research & Development 0.020 0.025 0.036 0.046
Total investment 0.117 0.107 0.122 0.135
N 7721 10013 14106 17825 The table reports the mean values of different types of annual investments during four sub-periods. All variables are deflated by total assets. Total investment is the sum of capital expenditures, business acquisitions and research and development expenditures.
33
Table 4 Future Annual Buy-and-hold Portfolio Returns and Other Characteristics for Firm with High Levels of Capital Investment
and Different Levels of Institutional Ownership Panel A: Capital expenditures
Adjusted Returns Port. INV IO Raw Returns SIZE SIZE &B/M SIZE B/M BETA VOLAT
Low IO 0.166 0.089 0.098 -0.040 -0.037 11.229 0.685 0.989 0.141
2.444 -2.499 -2.206
High IO 0.156 0.468 0.143 -0.008 -0.010 13.218 0.584 1.135 0.097
4.184 -0.543 -0.683
Difference -0.009 0.379 0.045 0.032 0.027 1.989 -0.102 0.146 -0.043 (High – Low) -4.754 37.770 2.507 2.847 2.375 26.683 -8.702 4.744 -19.419 Panel B: Business acquisitions
Adjusted Returns Port. INV IO Raw Returns SIZE SIZE &B/M SIZE B/M BETA VOLAT
Low IO 0.068 0.137 0.115 -0.028 -0.039 11.555 0.738 1.037 0.126
2.619 -2.836 -4.223
High IO 0.058 0.536 0.154 -0.001 -0.004 13.489 0.597 1.132 0.087
4.011 -0.097 -0.333
Difference -0.009 0.399 0.039 0.027 0.035 1.934 -0.141 0.095 -0.039 (High – Low) -3.982 49.760 1.961 1.784 2.420 41.460 -7.230 3.103 -25.521

34
Panel C: Research and development Adjusted Returns
Port. INV IO Raw Returns SIZE SIZE &B/M SIZE B/M BETA VOLAT Low IO 0.123 0.079 0.177 0.037 0.051 10.603 0.611 1.212 0.170
2.287 0.802 1.287
High IO 0.092 0.477 0.206 0.056 0.057 13.004 0.571 1.286 0.111
3.006 1.206 1.352
Difference -0.031 0.398 0.029 0.019 0.006 2.401 -0.040 0.075 -0.060 (High – Low) -9.205 74.561 1.309 0.986 0.337 30.758 -2.123 2.461 -17.947 Notes: The numbers reported in each cell are the time-series mean of the cross sectional means of those variables for each quintile. For the three return measures, we also report the t-statistic associated with the time-series distribution of the cross-sectional means. The number of cross-sections (i.e., years) is 20, from 1980 through 1999. The annual returns are measured from May 1 of year t+1 through April 30 of year t+2. INV is investment (capital expenditures in Panel A, business acquisitions in Panel B, and research and development expenditure in Panel C) in year t, deflated by the book value of total assets. IO is the fraction of outstanding shares held by institutional investors at the end of year t. SIZE (log of market value of equity) is measured at the end of April in year t+1. B/M is the book-to-market ratio at the end of year t. BETA is estimated using monthly stock returns and the CRSP value-weighted returns including all distributions during the five years that end in April of year t+1 (at least 30 observations are required). VOLAT is the root mean squared error from the BETA regression.

35
Table 5 Cross-sectional Regressions of Future Annual Stock Returns on
Corporate Investment, Institutional Ownership and Risk Factors, Focusing on Firms with High Levels of Investments
Investment Type Int. IO SIZE B/M BETA VOLAT INV R2 N
Capital expenditure 0.238 0.068 -0.004 0.041 -0.028 -0.181 -0.345 0.079 453 2.138 1.764 -0.516 2.341 -0.855 -0.478 -2.382 Business acquisitions 0.302 0.058 -0.008 0.023 -0.001 -0.865 -0.240 0.076 434 2.483 2.092 -1.108 1.101 -0.050 -3.443 -2.205 Research & Development 0.226 0.018 -0.005 0.114 0.004 -0.755 0.388 0.064 453 2.421 0.411 -0.815 5.525 0.146 -2.988 1.672 Notes: The first row reports the time-series mean of each statistic (coefficients, R2 and N). The second row reports the t-statistic for the time series distribution of each coefficient (mean coefficient divided by its standard error). The number of regressions (i.e., years) is 20, from 1980 (i.e., returns from May 1981 through April 1982) through 1999 (returns from May 2000 through April 2001). The dependent variable in all regressions is the annual buy-and-hold stock return, measured from May 1 of year t+1 through April 30 of year t+2. INV is investment (capital expenditures, business acquisitions, and research and development expenditure) in year t, deflated by the book value of total assets. IO is the fraction of outstanding shares held by institutional investors at the end of year t. SIZE (log of market value of equity) is measured at the end of April in year t+1. B/M is the book-to-market ratio at the end of year t. BETA is estimated using monthly stock returns and the CRSP value-weighted returns including all distributions during the five years that end in April of year t+1 (at least 30 observations are required). VOLAT is the root mean squared error from the BETA regression.

36
Table 6 Cross-sectional Regressions of Annual Stock Returns on Corporate Investment
and the Previous Year Levels of Institutional Ownership and Risk Factors, Focusing on Firms with High Levels of Investments
Investment Type Int. IO SIZE B/M BETA VOLAT INV R2 N
Capital expenditure 0.204 0.024 -0.005 0.080 -0.020 -0.121 -0.191 0.084 418 2.142 0.580 -0.893 3.200 -0.509 -0.335 -1.154 Business acquisitions 0.371 0.001 -0.013 0.039 -0.030 -0.650 0.181 0.078 404 1.894 0.051 -1.065 1.549 -1.159 -2.585 1.869 Research & Development 0.274 0.009 -0.008 0.065 0.012 -0.486 -0.060 0.065 419 3.267 0.247 -1.236 4.284 0.377 -1.778 -0.301 Notes: The first row reports the time-series mean of each statistic (coefficients, R2 and N). The second row reports the t-statistic for the time series distribution of each coefficient (mean coefficient divided by its standard error). All variables are as defined in Table 5, except that investment is measured concurrent with the stock return period (rather than in the prior year).