Embed Size (px)
Citation preview

Institutional Presentation
November/December 2010
Success Track Record
Foundation Strengthening/Expansion
10.6%
1983 1986 1989 1992 1995 1996 1997 1998 1999 2000 2001 2002
9.8%
10.0%
8.4%
6.5%
11010698
63
3524
17
(1) EBITDA Margin excludes extraordinary expenses.
ProprietaryTechnology
Startup ofMicrosiga
Franchising System
ISO 9001
Argentina
ISO 9001: 2000(Franchises)
MexicoFocus on
Managementand results
Growth in Margin
Gro
ss R
eve
nu
e(R
$ M
illio
n)
and
EBIT
DA
Mar
gin
(%)
¹
CMMI 12.4%
IPO
13.9%
392
247
173
18.4%
490
21.9%
2004 2005 2006 2007 2008
Acquisition
Acquisition
Midbyte and BCSAcquisitions
760
20.6%
33x EBITDA11x Revenue
2009
12.4%
126
2003
3
25.2%1,080
LTM
Operating Leverage1,205
GROWTH:17x EBITDA
8,5x Revenue

Cross-Selling
Structure of Business Model
(1) Does not include close to 5,000 employees of our franchises(2) Includes Infrastructure, HR BPO, Education and Service Desk
CoreSynergies Synergies
TOTVS Customer Service and Relationship
Software – Base and New Clients ServicesExpanded Business
Technology
ERP CRMBusiness
Intelligence
VerticalModules
Consulting
Value-Added Service2
4
TOTVS
74 Full TOTVS Distribution Channels
+ 26,200 customers~ 5,000 direct employees¹
Flexible Technology
Digital TV

7th worldwide in ERP-Suite* and 1st in growth
5
184
210
216
280
308
360
848
1,145
1,366
2,414
5,183
Epicor (USA)
Cegid (FRA)
Exact (NED)
Unit4 (NED)
TOTVS (BRA)
Lawson (USA)
Microsoft (USA)
Infor (USA)
Sage (UK)
Oracle (USA)
SAP (GER)
Source: Gartner - ERP Software, Worldwide, 2009
Market Update
-6.6%
0.8%
-12.3%
-1.3%
8.6%
-7.0%
-4.7%
-12.8%
-5.3%
-11.2%
-9.6%
*Licenses e Maintenance Revenues, in US$ million 2008 vs. 2009 Evolution
ERP-Suite Worldwide Ranking 2009

15.0%
26.8%
31.2%
27.0%
Market Share – Leadership in Latin America
6
Market Update
GARTNER (2009 – full year)
Source: Gartner – Market Share ERP Software, Worldwide, 2009
A
B
#4 Portugal
#1 Brazil#3 Argentina#3 Mexico
Others

Market Share – Absolute leader in Brazil
Source: IDC Latin America Semiannual ERM Applications Tracker 2009
7
Market Update
IDC (2009)
32.9%34.4%
37.9%
42.7%
33.2% 34.1%32.0%
29.9%
10.5%8.8% 8.3% 7.3%
2006 2007 2008 2009
A
B
GARTNER (2009)
1.7%1.1%
6.8%
24.4%
49.1%
16.9%A
B
CD
Source: Gartner – Market Share ERP Software. Worldwide. 2009
Others

Fundamentals and Business Model
8
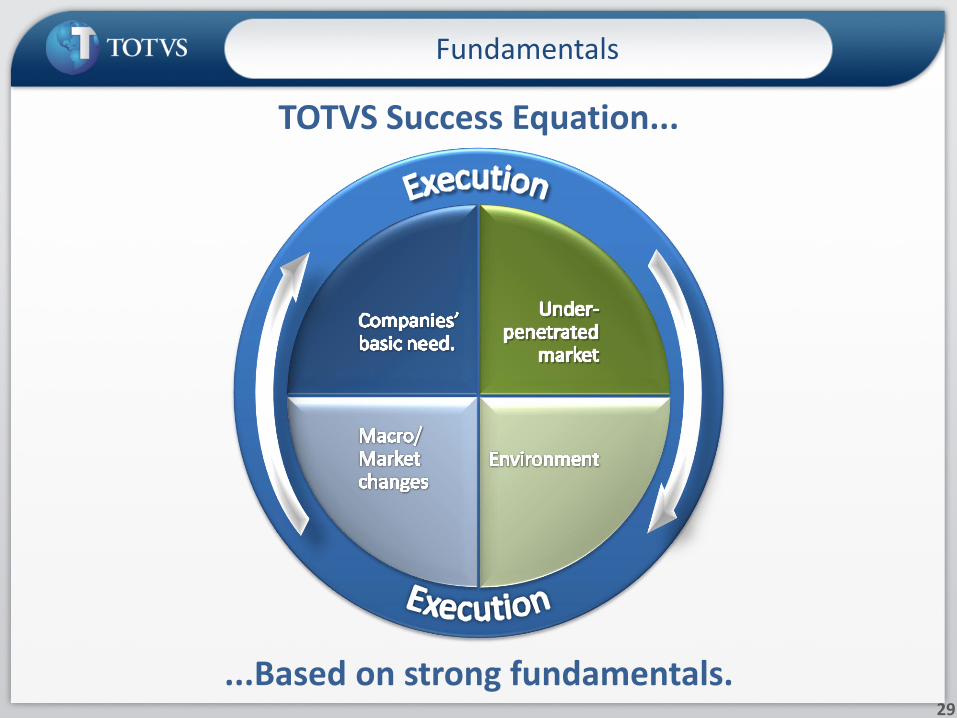
TOTVS’ Differentials
Software = Basic Need
Underpenetrated Market
Environment
Macro / Market Changes
Target Market
Technology &
Product
Distribution
Licenses
Maintenance
Services
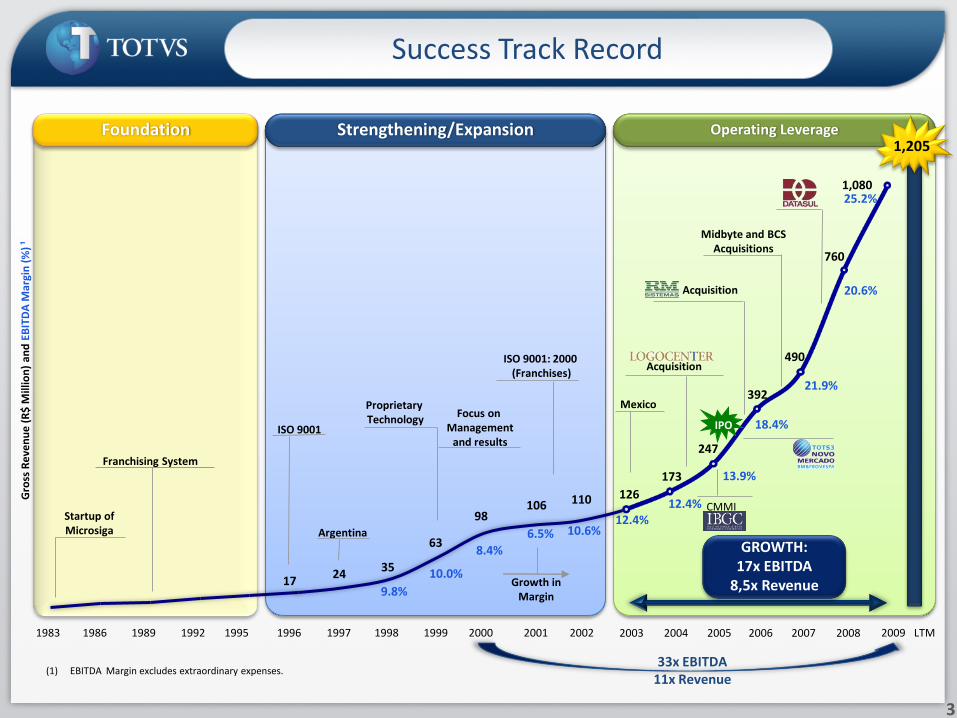
(1) IBGE estimates about the Brazilian market. (2) Source: Gartner “Dataquest Insight: TOTVS and the Brazilian SMB ERP Landscape”, mar’09
646
468,000
5,297,000
250 +
50 - 250
0 - 5
Large
Medium
Small
Micro
5 - 50(revenues of over
R$15 million/ year)
9
Brazilian Market
Positioning Users # Companies1
~ 26,200Active Customers
65.6%Market Share(2)
~ 39,900‘using’ ERP
468,000SMB market size(1)
~ 8.5%Penetrated
Penetration
Gartner Estimates²7.0%
penetrated

Revenue/Business Model
New Customers
Base Customers
NewCustomers
BasicImplementation
Base Customers
New Licenses
New Modules
Consultingand
VAS+
Licenses
Services
Maintenance
New Licenses
CorporateModel
TOTVS’ Business
10
Updates Upgrades(New version)
Help-desk
0.34 0.34 0.34 0.34 0.34 0.34 0.341.00
0.34
2.00
Y0 Y1 Y2 Y3 Y4 Y5 Y6 Y7 Y8
Traditional model Corporate model
Recurring Fees by Metric1 new licensesold per year
Y0 Y1 Y2 Y3 Y4 Y5 Y6 Y7 Y8 Y9 Y10 Y11 Y12… …

Diversified client base
Datasul and RM Sistemas contributed to diversify even more the company’s client base
(1) Based on TOTVS Brazil 2009 revenue.
Client Breakdown by Sector 1 Revenue Concentration 1
11-100 Largest
12%
Others82%
10 Largest
6%
11
TOTVS’ Business
Manufacturing39%
Services16%
Distribution and Logistics
12%
FinancialServices
8%
Construction and projects
7%
Others18%

Série 1
Segment and Size Approach
TOTVS 1 Services
TOTVS –Digital TV
Seri
es
T
TOTV
S A
grib
usi
ne
ss
TOTV
S M
anu
fact
uri
ng
TOTV
S Ed
uca
tio
nal
TOTV
S H
eal
th
TOTV
S C
on
stru
ctio
n &
Pro
ject
s
TOTV
S Fi
nan
cial
Se
rvic
es
TOTV
S Le
gal
TOTV
S Se
rvic
es
TOTV
S D
istr
ibu
tio
n &
Lo
gist
ics
TOTV
S R
eta
il
Seri
es
1Se
rie
s C
TOTVS Manufaturing1 TOTVS 1 Retail
Seri
es
3 TOTVS 3 RetailTOTVS
Manufacturing 3
12
Offering by Segment Offering by Size
Definition
Series 3
Series 1
Series T
TOTVS 1 Health
Size
Complexity
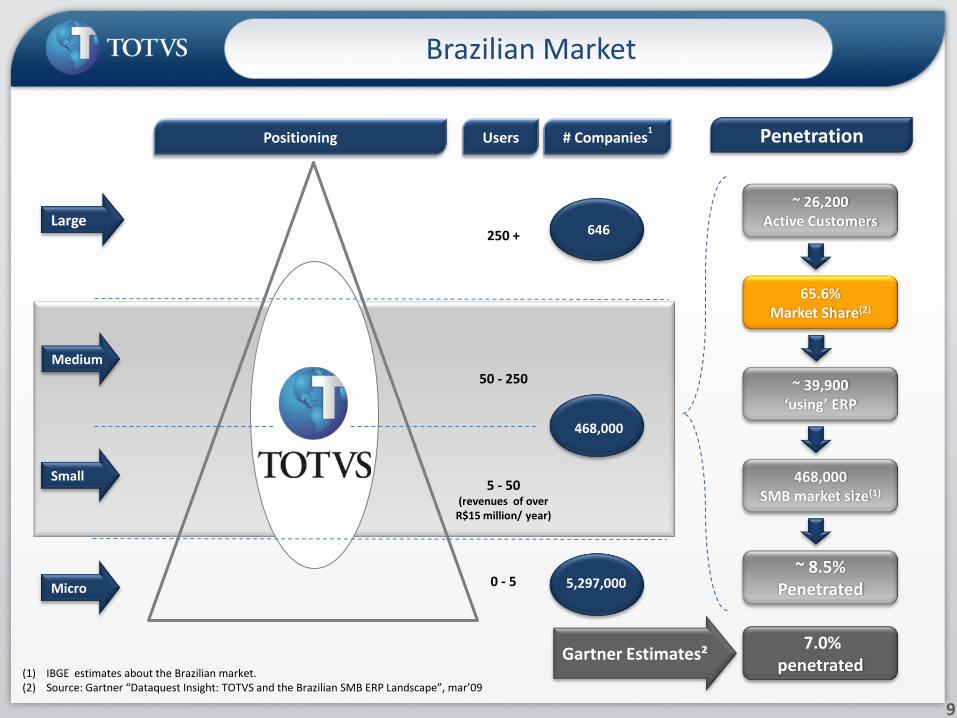
Segment Facts
13
+1,110 extractive and processing customers, +1,000 metal and plastic, +1,400 capital goods
Manufacturing
+900 department stores, +140 supermarkets, +280 building materials distributorsRetail
2,300 services providers, 400 Utilities providers, 470 travel and passengers transportationServices
12 million lives, +9,700 beds, medical registers to 35 specialties
Health
7 out of 10 top law firms, 10,000 lawyers
Legal
50 out of 100 Brazilian biggest comps. and 20 international builders, 450engineering and design customers Construction
and Projects
+200 sugar cane producers = 50% national crop, 120 grain producers,
1.5 million hectaresAgribusiness
+1,600 wholesaler distributors, 20% of shippers customers use our CRM
Distribution and Logistics
22k portfolios, 4k funds, 120k/dayconsumer credit transactions, R$1.5
trillion assets under custody, LA Financial Market Top provider
Financial Services
+700 Brazilian institutions, +1.5 million students, choice of 67% of the
consolidating groups Educational

Comprehensive Portfolio
14

TOTVS product architecture and platform
15
Technology

16
Innovative Model with Results
SaaS
PaaS
IaaS
Application
Framework
Middleware
Database
Op. System
Hardware
TCP/IP Protocol
Vanguard Growth Profitability
Public / Private Cloud
Series 1 Cloud
Series T Corporate Model
(iSaaS)byYouESB
byYouECM
Datacenter &Service Desk

17
Distribution
Presence and Dominance
Other Geographies
Latin America
Subsidiaries
Products only
Franchises
►1 Branch + 1 Franchise, Portugal
►1 Franchise, Angola
►+50 clients, over 8 countries
►Gartner: TOTVS’ ERP Market Share: 31.2% in 2009 - 1st company!
►IDC: TOTVS’ SMB Market Share: 34.25% in 2009 vs. 29.7% in 2008 – 1st company!
►Products over 15 countries
►Excluding Brazil:
+400 clients, +300 direct employees
+13 Full TOTVS distribution channels
Brazil Latin America
►Distribution Channels: 6 Branches + 52 Franchisees
►≈40 complementary channels working with TOTVS distribution network
►+27,000 clients
►49.1% Market share (Gartner)
►42.7% Market share (IDC)
►+4,700 Direct employees
18
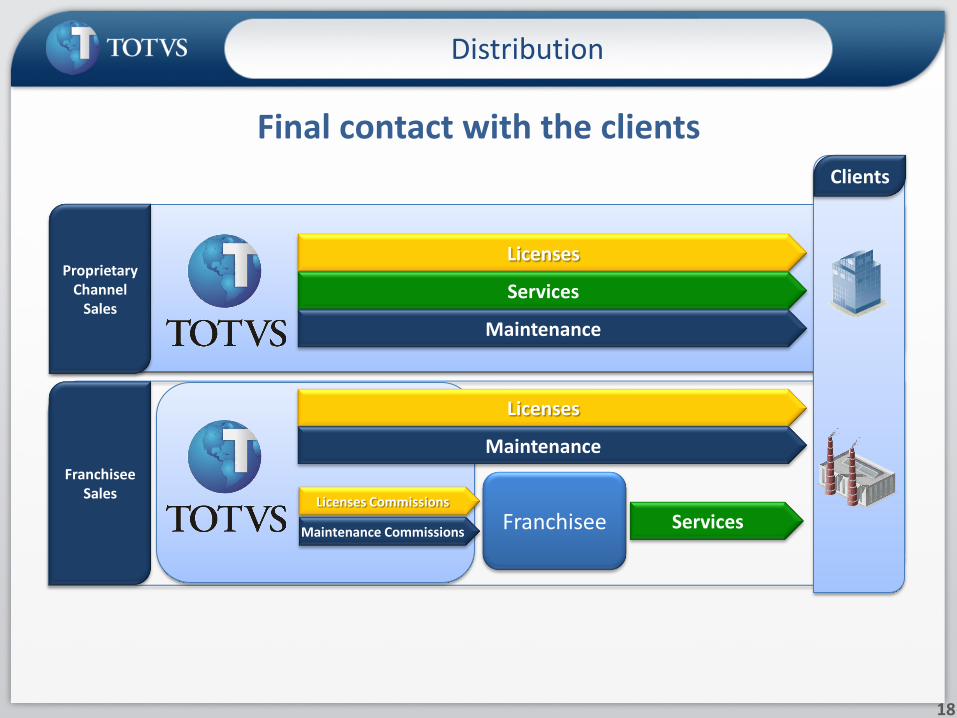
Distribution
Final contact with the clients
Franchisee
Licenses
Services
Maintenance
Services
Licenses
Maintenance
Licenses Commissions
Maintenance Commissions
Proprietary Channel
Sales
FranchiseeSales
Clients

Results 3Q10
Operational Highlights
Financials Highlights
► Net Revenue: historical record, reached R$303.201 million, a 20.0% over 3Q10.
► Licenses Fees Revenue: historical record, 44.5% over 3Q09.
► Services Revenue: 7.6% growth (3Q10 vs. 3Q09).
► Maintenance Fees Revenue: historical record, R$140.125 million. Growth of 13.7% over
3Q09.
► EBITDA: R$88.186 million record in 3Q10, a 32.7% growth against 3Q09.
► Margin: 29.1% record in the quarter, 280 b.p. over 3Q09.
► Adjusted Net Income: R$50.095 million in 3Q10, 21.5% over 3Q09.
► 854 new clients in 3Q10, 14.6% growth over 2Q10, new historical record.
► Licenses sales to 4,523 clients (new + base) in the quarter, 5.5% over 2Q10.
► Acquisition of FDES ( Development Franchises).
► Sale of state of Paraná customer portfolio, allowing 2 “Full TOTVS” franchises creation in
the region.
► 306,870 share issuance for 15% of debentures conversion .
Recent Events
19th consecutive quarter of double-digit organic growth...
19

Gross and Net Revenue (R$ million) 1
120.2
136.2
168.5
218.6
252.6
303.2
136.5152.2
187.6
242.6
276.1
328.8
3Q05 3Q06 3Q07 3Q08 3Q09 3Q10
Net Revenue Gross Revenue
...presenting a consistent revenue growth
(1) Values are pro forma as they include the number of RM Sistemas, acquired in April 2006, and Datasul, consolidated in September 2008 in the period analyzed.
Financial Performance
20
344.2
397.4
477.4
611.4
721.3
833.8
386.5
444.6
529.5
680.9
788.4
913.4
9M05 9M06 9M07 9M08 9M09 9M10
Net Revenue Gross Revenue
New Record
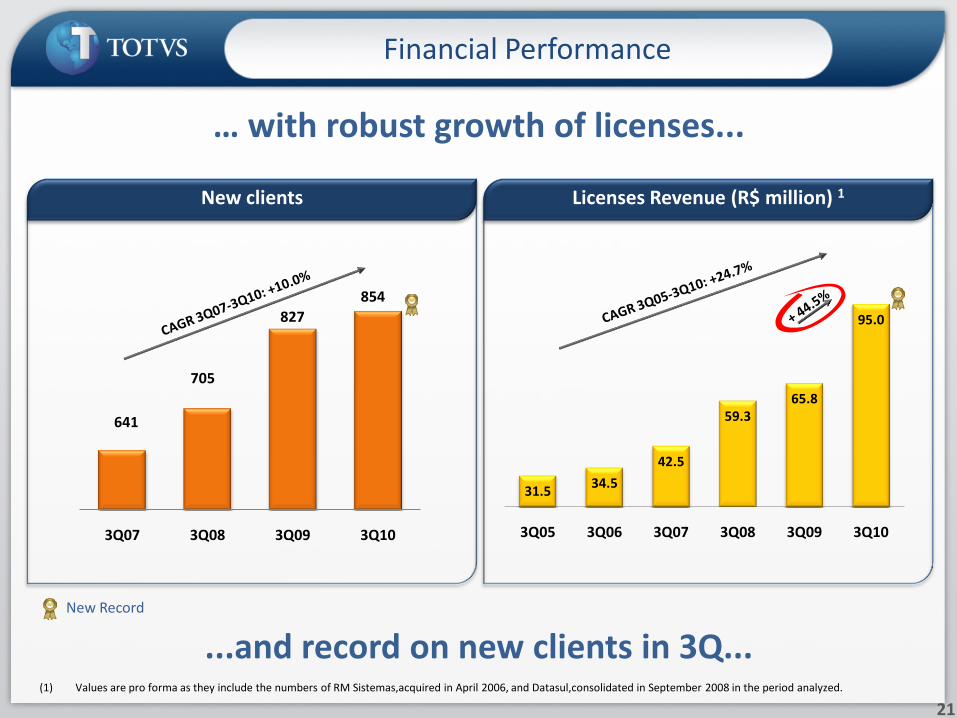
31.534.5
42.5
59.365.8
95.0
3Q05 3Q06 3Q07 3Q08 3Q09 3Q10
… with robust growth of licenses...
(1) Values are pro forma as they include the numbers of RM Sistemas,acquired in April 2006, and Datasul,consolidated in September 2008 in the period analyzed.
Financial Performance
21
New clients
...and record on new clients in 3Q...
641
705
827
854
3Q07 3Q08 3Q09 3Q10
Licenses Revenue (R$ million) 1
New Record

… and services / maintenance improvements.
70.375.2
88.4
108.1
123.3
140.1
3Q05 3Q06 3Q07 3Q08 3Q09 3Q10
34.8
42.5
56.6
75.2
87.1 93.7
3Q05 3Q06 3Q07 3Q08 3Q09 3Q10
Maintenance Revenue (R$ million) 1Services Revenue (R$ million) 1
Financial Performance
22
New Record
(1) Values are pro forma as they include the numbers of RM Sistemas, acquired in April 2006, and Datasul,consolidated in September 2008 in the period analyzed.

2005 2006 2007 2008 2009
530.3
940.8
734.0
611.9
23.8%
24.6%
51.6%
27.3%
24.0%
48.7%
23.3%
29.4%
47.3%44.9%
30.3%
24.8%
1,080.3
23.1%
30.7%
46.2%
Gross Revenue (R$ million) 1
Gross Revenue Breakdown
Financial Performance
23
3Q09 3Q10
44.7%
31.5%
28.5%
42.6%
23.8%
28.9%
328.8
276.1
(1) Values are pro forma as they include the numbers of RM Sistemas,acquired in April 2006, and Datasul,consolidated in September 2008 in the period analyzed.
Licenses Services Maintenance

87.9109.0
12.2%
13.1%
9M09 9M10
32.339.3
12.8% 13.0%
3Q09 3Q10
8.110.0
3.2% 3.3%
3Q09 3Q10
536.2622.0
9M09 9M10
(1) Excluding depreciation, amortization expenses and non –recurring expenses.
Costs and Expenses Dashboard ¹
17.5 18.5
6.9%6.1%
3Q09 3Q10
57.0 54.7
7.9%
6.6%
9M09 9M10
20.424.5
2.8%2.9%
9M09 9M10
186.1 215.0
3Q09 3Q10
R&D (R$ million) x R&D / NR
Marketing Expenses (R$ million) x Mkt. Exp. / NRG&A (R$ million) x G&A / NR
Costs and Expenses ¹ (R$ million)
Financial Performance
24

423 494
628
718
825
526
629
796
955
1,101
3Q06 3Q07 3Q08 3Q09 3Q10
Operational Leverage
Financial Performance
25
EBITDA - 12M (R$ million)1 and 2
Costs and ExpensesEBITDANet Revenue
G&A / NR 1
14.7%
12.1%
9.7%
8.6%
6.9%6.1%
3Q05 3Q06 3Q07 3Q08 3Q09 3Q10
(1) Values are pro forma as they include the numbers of RM Sistemas,acquired in April 2006, and Datasul,consolidated in September 2008 in the period analyzed.(2) Last 12 months.

18.1%
17.0%
22.1%
20.0%
19.2%
20.8%
20.4%
22.4%
21.9%
22.2%
21.0%
21.3%
20.3%
22.1%
26.2%
24.4%
26.3%
24.0%
23.4%
23.2%
29.1%
3Q05 3Q06 3Q07 3Q08 3Q09 3Q10
EBITDA and Margin
Financial Performance
26
EBITDA and Margin (R$ million) 1
New Record
21.826.1
37.0
44.4
66.5
88.2
18.1%19.2%
21.9%
20.3%
26.3%
29.1%
0,10
0,15
0,20
0,25
0,30
0
20
40
60
80
100
120
3Q05 3Q06 3Q07 3Q08 3Q09 3Q10
EBITDA EBITDA Margin
EBITDA Margin Behavior 1
(1) Values are pro forma as they include the numbers of RM Sistemas,acquired in April 2006, and Datasul,consolidated in September 2008 in the period analyzed.
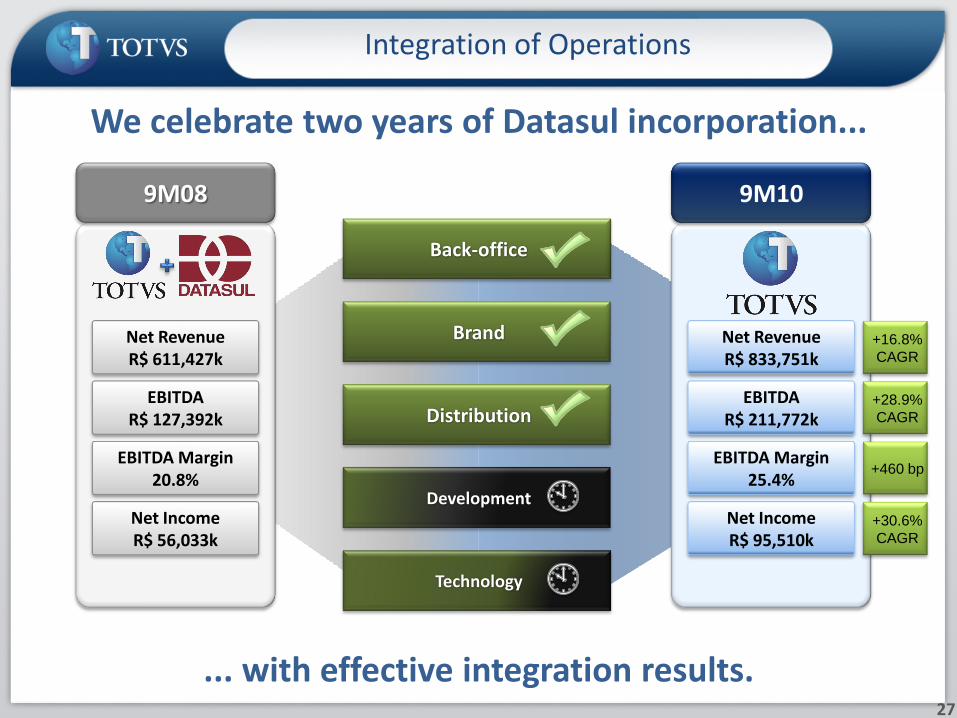
Integration of Operations
9M08
Net RevenueR$ 611,427k
Net RevenueR$ 833,751k
EBITDAR$ 127,392k
Net IncomeR$ 56,033k
EBITDAR$ 211,772k
Net IncomeR$ 95,510k
EBITDA Margin20.8%
EBITDA Margin25.4%
Brand
Distribution
Development
Technology
9M10
Back-office
We celebrate two years of Datasul incorporation...
... with effective integration results.27
+28.9%
CAGR
+460 bp
+30.6%
CAGR
+16.8%
CAGR
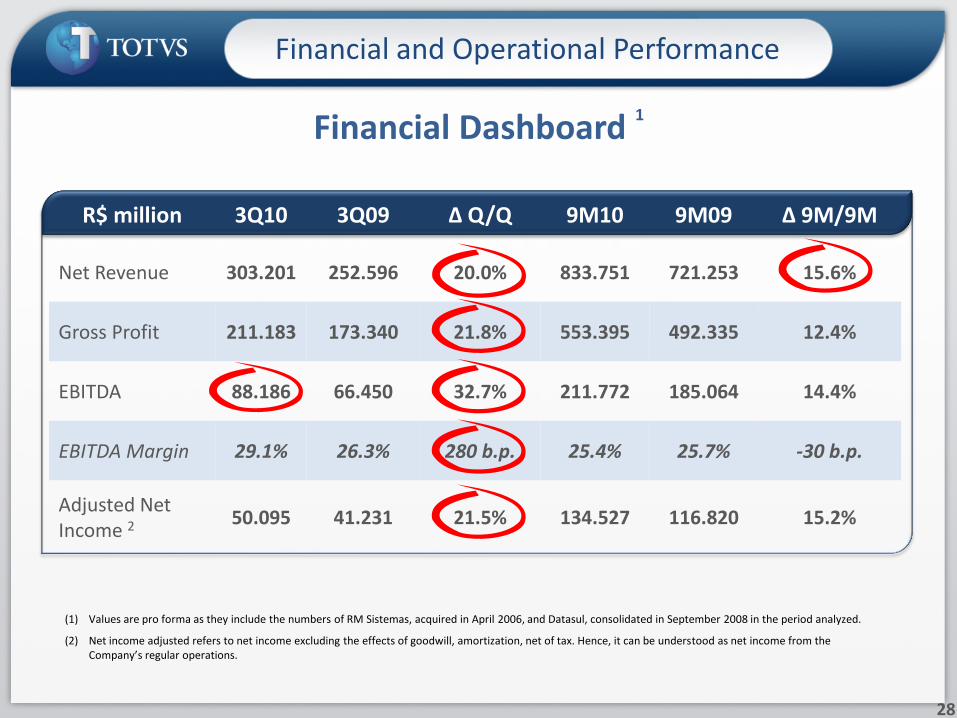
R$ million 3Q10 3Q09 Δ Q/Q 9M10 9M09 Δ 9M/9M
Net Revenue 303.201 252.596 20.0% 833.751 721.253 15.6%
Gross Profit 211.183 173.340 21.8% 553.395 492.335 12.4%
EBITDA 88.186 66.450 32.7% 211.772 185.064 14.4%
EBITDA Margin 29.1% 26.3% 280 b.p. 25.4% 25.7% -30 b.p.
Adjusted Net Income 2 50.095 41.231 21.5% 134.527 116.820 15.2%
Financial Dashboard 1
Financial and Operational Performance
28
(1) Values are pro forma as they include the numbers of RM Sistemas, acquired in April 2006, and Datasul, consolidated in September 2008 in the period analyzed.
(2) Net income adjusted refers to net income excluding the effects of goodwill, amortization, net of tax. Hence, it can be understood as net income from the Company’s regular operations.
29
Fundamentals
TOTVS Success Equation...
...Based on strong fundamentals.
The material that follows is a presentation of general background information about TOTVS activities as of the date of the presentation
in November 2010.
It is information given in summary form and does not purport to be complete. It is not intended to be relied upon as advice to potential
investors.
This presentation may contain statements that express management’s expectations and/or forecasts about future events.
These expectations and/or forecasts involve risks and uncertainties that could cause actual results to differ materially from those
projected in such forward-looking statements. Therefore, the future results of the company may differ from current expectations and
readers must not base their expectations exclusively on the information presented herein.
No representation or warranty, express or implied, is made concerning, and no reliance should be placed on the accuracy, fairness, or completeness of the information presented herein.
This document does not constitute an offer, or invitation, or solicitation of an offer, to subscribe for or purchase any securities.
Neither this document nor anything contained herein shall form the basis of any contract or commitment whatsoever.
Contacts
www.totvs.com/ir
QUESTIONS
Safe harbor
30