Embed Size (px)
Citation preview

INSTITUTIONAL REPORT 2012
TRACKING THE LIVES AND CAREERS OF ARTS GRADUATES
Sample University

Introduction to the SNAAP Sample Report
This is a Sample Report from the 2012 SNAAP administration. The report is based on actual responses from arts alumni from several different institutions. It is intended to illustrate the kind of information a participating institution can expect to receive following the administration of the SNAAP questionnaire.
Section 1 contains some background information about SNAAP including some notes on how to interpret the results found within the report. The content is exactly the same as what participating institutions receive in their Institutional Reports.
Sections 2 and 3 show alumni responses to the items on the SNAAP questionnaire. As noted earlier, the information in this section is a compilation of response from alumni who graduated from several schools that participated in the 2012 administration. Aggregating the data in this way makes it possible to illustrate what a participating institution will receive without revealing the identity of any individual school.
The alumni comments found in Sections 2 and 3 are actual comments provided by respondents when answering the open-ended question on the 2012 questionnaire. Words or phrases were excised if they identified the institution the respondent attended.

May 1, 2013
Sample University 123 Any Road Anytown, USA
Dear Name,
We are pleased to present your institution’s results from the 2012 Strategic National Arts Alumni Project (SNAAP). First off, I would like to thank you for participating in this important national effort. Between the 2011 and 2012 administrations, we have collected data from nearly 70,000 arts graduates from American institutions. Together we are learning more about the educational experiences and career paths of arts alumni.
In this report, you will find both your confidential data as well as aggregate findings from peer institutions. Before delving into your school’s results beginning in Section 2, we encourage you to review Section 1, SNAAP Overview and Interpretation, which includes a suggested approach to reviewing the extensive data contained in the report.
Your SNAAP data – both quantitative and qualitative– contain rich insights and most likely some actionable findings. You can determine the reliability of your data based on the number of total alumni who responded, your school’s overall response rate, and the sampling error. This information can be found in the Respondent Characteristics report(s).
In addition to your PDF report, we provide you with a full dataset of identifiable information. While you are free to use and publicize your data as you wish, please remember that individual responses are to be treated confidentially and that individual respondents should never be publicly identified.
To assist you in sharing and using your SNAAP data on campus, we provide a number of tools on our web site, including information about what other institutions are doing with their data. Please let me know if you would like further assistance, including customized consulting services on using your data.
Registration is now open for SNAAP 2013, and the deadline to register is July 15. Although most will not participate annually, about 12% of the 2011 institutions returned in 2012 to gain further data and insights into their arts alumni. We welcome the opportunity to discuss how multi-year participation can help you build on the data we are providing you today. More information is available at www.snaap.indiana.edu including the participation fee scale.
Finally, we are currently at work on our third Annual Report of national findings which will be available in June. As a participating institution, you will see this report before it is released publicly.
Best wishes,
Sally Gaskill Director

Table of Contents
Section 1: SNAAP Overview and InterpretationAbout SNAAPInterpreting Your Results
Section 2: Undergraduate AlumniData Highlights Recent Graduates Comparison Groups Respondent Characteristics Frequency ReportAlumni Comments
Section 3: Graduate AlumniData Highlights Recent Graduates Comparison Groups Respondent Characteristics Frequency ReportAlumni Comments
2012 Institutional Report

Section 1: SNAAP Overview and Interpretation
About SNAAP
Interpreting Your SNAAP Results

What is the Strategic National Arts Alumni Project (SNAAP)?
The Strategic National Arts Alumni Project (SNAAP) is an annual online survey, data management, and institutional improvement system designed to enhance the quality of arts-school education. SNAAP is generating rich, detailed information about the lives and careers of people with intensive training in the arts, broadly defined. SNAAP data can identify ways to better connect arts training to artistic careers, making it possible for arts leaders, educators, and researchers to understand and address the systemic factors that help or hinder the career paths of alumni, whether they work as artists or pursue other paths. SNAAP data allows participating schools to compare themselves with similar schools on multiple dimensions. The annual findings also provide insight into national patterns and trends resulting from detailed analyses of employment, career outcomes, and institutional experiences by artistic discipline, region of the country, cohort, and degree type.
SNAAP grew out of the Surdna Foundation’s interest in helping arts training institutions across the country learn more about their graduates. Following several years of planning, three field tests of the survey were conducted beginning in 2008, and the first national administration occurred in fall 2011.
Why is SNAAP important now?
Arts education institutions have expressed an urgent need for high quality, actionable data. The information SNAAP provides is especially timely given the changing environment in which arts training institutions operate: career opportunities are shifting, competition for both students and resources is on the rise, and a generational shift in leadership is under way. Institutions require comprehensive information to respond and plan effectively. Accreditation requirements also increasingly require information about alumni paths.
How can key stakeholder groups benefit from SNAAP?
For leaders at educational institutions with degree-granting arts programs, SNAAP results can help:
~ inform, develop, and reform curriculum by discovering what aspiring young artists need to advance in rapidly changing arts fields
~ compare their training to that of similar institutions to identify relative strengths and areas needing attention
~ strengthen alumni engagement and support ~ clarify what students learned and how it has been
used in both arts and non-arts contexts ~ address student and alumni career needs ~ enhance recruitment, public relations, marketing,
strategic planning, and development efforts ~ provide evidence for the value of an arts education
and alternative measures of success, including school and work satisfaction, for alumni working both inside and outside the arts
MISSION: The Strategic National Arts Alumni Project (SNAAP) investigates the educational experiences and career paths of arts graduates nationally. SNAAP provides the findings to educators, policy makers, and philanthropic organizations to improve arts training, inform cultural policy, and support artists.
About SNAAP
2

For policy makers, community development professionals, and funders, SNAAP’s national reports point to:
~ opportunities and barriers, including debt, school networks, internships, and mentors, that influenced the career pathways of arts graduates
~ contributions of people who have been educated intensively in the arts to the creative economy nationally
~ local and regional arts workforce issues and market patterns for community developers and planners
~ gaps in the arts training ecology, across disciplines, at different training junctures and across various geographic locales
~ support mechanisms and resources needed to encourage and sustain artists in their most vulnerable five years after school and beyond
~ the complex nature of creative careers in a contingent economy marked by high rates of self-employment, entrepreneurship, and work across disciplines and sectors
For parents and students considering intensive arts education, SNAAP’s national reports can provide information about:
~ career patterns of arts graduates in the arts and in other fields
~ learning outcomes of arts graduates, in terms of skills and competencies that were acquired in arts school and are particularly valued by individuals who work both in and outside the arts
~ influence of professional relationships and networks on career outcomes
~ obstacles to achieving arts training and professional goals
~ career satisfaction across different occupations and types of employment
~ different experiences and training for students who go to arts schools
Who is surveyed?
All arts graduates of institutions that participate in SNAAP are invited to complete SNAAP’s online questionnaire.
What kinds of questions are asked?
~ satisfaction with curricular and co-curricular experiences
~ current and past education and employment ~ skills acquired at the institution and their
importance in the workplace ~ relevance of arts education to work and further
education ~ turning points, obstacles, critical relationships, and
opportunities ~ support and resources needed after graduation ~ types of art practiced and how often ~ arts engagement with the local community ~ income and support, student debt, and other
financial issues
How is SNAAP administered?
SNAAP is a Web-based survey that collects data from alumni through questions with checkboxes and open-ended responses. The user-friendly, adaptive questionnaire was developed to be sensitive and responsive to the diverse pathways and experiences of arts graduates.
What does it cost to participate in SNAAP?
Thanks to the generous support of our funders, three field tests (2008, 2009, 2010) were conducted at no cost to participating institutions. To become a self-sustaining resource for the arts field, participating institutions now share the survey administration costs. Fees are based on institutional size and range from $1,300 to $2,800 for high schools, and $3,300 to $7,800 for postsecondary institutions. Institutions that conduct alumni surveys on their own typically spend far more on such projects without having access to the rich, informative comparison data SNAAP provides.
3

SNAAP 2011 and 2012Participating Institutions
The 2011 and 2012 institutions are located in 37 states, the District of Columbia, and two Canadian provinces. Of the 70 institutions that participated in 2012, half administered SNAAP for the first time.
In this list, institutions that participated in 2011 are italicized and 2012 institutions appear in regular font.
United StatesAlaskaUniversity of Alaska Anchorage*
ArizonaArizona State University Herberger Institute for Design and the Arts, Tempe*
CaliforniaArt Center College of Design, Pasadena*California Baptist University, Riverside*California College of the Arts, San Francisco*California Institute of the Arts (CalArts), Valencia*California Lutheran University, Thousand Oaks*Chapman University College of Performing Arts, OrangeThe Colburn School, Los Angeles*Idyllwild Arts Academyα
Los Angeles County High School for the Artsα
Otis College of Art and Design, Los Angeles*San Francisco Art Institute*University of California-Berkeley* University of California-Davis* University of California-Irvine*University of California-Los Angeles School of the Arts and Architecture*University of California-Merced† University of California-Riverside*University of California-San Diego* University of California-Santa Barbara* University of California-Santa Cruz*Woodbury University, Burbank*†
ColoradoUniversity of Colorado at Boulder College of Music* University of Northern Colorado, Greeley*
ConnecticutUniversity of Hartford, The Hartt School and Hartford Art School*
FloridaDouglas Anderson School of the Arts, Jacksonvilleα
Florida Atlantic University, Boca Raton*Florida International University College of Architecture and the Arts, Miami*Ringling College of Art and Design, SarasotaStetson University, DeLand
GeorgiaGeorgia Southern University, Statesboro* Georgia State University, Atlanta*Valdosta State University Department of Art*
IdahoBrigham Young University-Idaho College of Performing and Visual Arts, Rexburg†
IllinoisColumbia College Chicago* DePaul University, Chicago*Knox College, GalesburgSchool of the Art Institute of Chicago*University of Illinois at Urbana-Champaign College of Fine and Applied Arts*
IndianaButler University Jordan College of the Arts, Indianapolis*Herron School of Art and Design, Indiana University–Purdue University Indianapolis*Indiana University Jacobs School of Music, Bloomington*Indiana University Art Education Program, Bloomington*Purdue University, West Lafayette*
KansasPittsburg State University*The University of Kansas School of the Arts, Lawrence*
KentuckyBellarmine University, LouisvilleWestern Kentucky University Potter College of Arts & Letters, Bowling Green*
Louisiana Louisiana School for Math, Science, and the Arts, Natchitochesα
Louisiana State University College of Music and Dramatic Arts, Baton Rouge*The University of Louisiana at Monroe School of Visual and Performing Arts*The University of New Orleans*
MaineMaine College of Art, Portland*
MarylandBaltimore School for the Artsα
Maryland Institute College of Art, Baltimore*
MassachusettsThe Art Institute of Boston at Lesley University*Boston Arts Academyα
Massachusetts College of Art and Design, Boston*School of the Museum of Fine Arts, Boston*University of Massachusetts, Amherst*University of Massachusetts-Dartmouth*Walnut Hill School for the Arts, Natickα
MichiganAlbion CollegeInterlochen Arts Academyα
Kendall College of Art and Design at Ferris State University, Big Rapids*Oakland University, Rochester*University of Michigan School of Art & Design, Ann Arbor*Western Michigan University, Kalamazoo*
MinnesotaCollege of Visual Arts, Saint PaulMinneapolis College of Art and Design*St. Cloud State University*
4

MissouriEvangel University, SpringfieldKansas City Art InstituteUniversity of Missouri-Kansas City*
New JerseySeton Hall University, South Orange*
New MexicoSanta Fe University of Art and Design
New YorkAlfred University*The City College of New York*† The Cooper Union for the Advancement of Science and Art, New YorkHamilton College, ClintonManhattan School of Music, New York*New York University Tisch School of the Arts*Pace University, Briarcliffe Manor*Pratt Institute, Brooklyn*School of Visual Arts, New York*State University of New York at New Paltz*†Syracuse University*
North CarolinaUniversity of North Carolina at Charlotte*
North DakotaNorth Dakota State University Division of Fine Arts, Fargo*
OhioCase Western Reserve University, Cleveland*Cleveland Institute of Art*Columbus College of Art & Design, Columbus*Kent State University *Miami University, Oxford*Ohio Northern University, AdaThe Ohio State University, Columbus*
OregonPacific Northwest College of Art, Portland*
PennsylvaniaBloomsburg University of Pennsylvania*Indiana University of Pennsylvania College of Fine Arts*Lehigh Valley Charter High School for the Performing Arts, Bethlehemα
Marywood University, Scranton*Moore College of Art and Design, PhiladelphiaPennsylvania Academy of the Fine Arts, Philadelphia*The University of the Arts, Philadelphia*
Rhode IslandRhode Island School of Design, Providence*†
South CarolinaCoker College, HartsvilleCollege of Charleston School of the Arts*South Carolina Governor’s School for the Arts and Humanities, Greenvilleα
University of South Carolina Columbia*†
South DakotaNorthern State University, Aberdeen*
TennesseeMemphis College of Art, Memphis*
TexasHigh School for the Performing and Visual Arts, Houstonα
Southern Methodist University Meadows School of the Arts, Dallas*Texas State University College of Fine Arts and Communication, San Marcos*University of Houston*The University of Texas at Austin*
Utah Utah State University Caine College of the Arts, Logan*
VirginiaJames Madison University, Harrisonburg*Virginia Commonwealth University School of the Arts, Richmond*University of Richmond
WashingtonPacific Lutheran University, Tacoma*
Washington D.C. Corcoran College of Art + Design*
West VirginiaWest Virginia University College of Creative Arts, Morgantown*
WisconsinMilwaukee Institute of Art & DesignUniversity of Wisconsin-Whitewater*
CanadaAlberta College of Art + Design, CalgaryOCAD University, Toronto, Ontario*
* Institution with graduate-level alumni responding to the survey
† Institution excluded from analysis (including comparison groups) due to limited numbers of cohort years
α Arts high school
5

SNAAP StaffIndiana University
DirectorSally Gaskill
Senior AdvisorGeorge D. Kuh
Project CoordinatorRebecca F. Houghton
Research Analysts Amber D. Lambert Angie L. Miller Rick Shoup
Project AssociateLauren Hime
Vanderbilt University Curb Center for Art, Enterprise, and Public Policy
SNAAP Research DirectorAssociate Director, Curb Center Associate Professor of SociologySteven J. Tepper
SNAAP Postdoctoral FellowDanielle J. Lindemann
SNAAP Research AssociateJennifer Lena
Indiana University Center for Postsecondary Research
DirectorVasti Torres
Finance ManagerMarilyn Gregory
Web DeveloperHien Nguyen
Office CoordinatorBarbara Stewart
Office SecretaryKatie Noel
Indiana University Center for Survey Research
DirectorAshley Bowers
Senior Research DirectorJohn Kennedy
Director, Survey Technologies Kevin Tharp
Associate Director, Research Data Management ServicesErica Moore
Senior Web ProgrammerJason Francis
National Advisory BoardKenneth C. Fischer, ChairPresident, University Musical SocietyUniversity of MichiganAnn Arbor, Michigan
Antonia ControExecutive Director, MarwenChicago, Illinois
Sarah Bainter CunninghamExecutive Director of Research, School of the Arts, Virginia Commonwealth UniversityRichmond, Virginia
Douglas DempsterDean of Fine Arts, The University of Texas at AustinAustin, Texas
Chris FordDirector, Baltimore School for the ArtsBaltimore, Maryland
Barbara HauptmanAssistant Professor, Arts Administration, Purchase CollegeFormer Executive Director, Society of Stage Directors and Choreographers Purchase, New York
6

Samuel HoiPresident, Otis College of Art and DesignLos Angeles, California
Steven LavinePresident, California Institute of the ArtsValencia, California
Abel LopezAssociate Producing Director, GALA Hispanic Theatre Washington, D.C.
Ann R. Markusen Director, Arts Economy InitiativeHubert H. Humphrey Institute of Public Affairs University of Minnesota Minneapolis, Minnesota
Carlos Martinez Principal and Global Design Leader, Gensler Chicago, Illinois
M. Lee PeltonPresident, Emerson CollegeBoston, Massachusetts
Stephanie PerrinPreviously Head, Walnut Hill SchoolOrleans, Massachusetts
Susan PetryChair, Department of Dance, Ohio State UniversityColumbus, Ohio
Robert SirotaComposerNew York, New York
James UndercoflerArtistic Director, National Orchestral InstituteIthaca, New York
Funders
Lead funding provided by:Surdna Foundation
Major partnership support from:Houston EndowmentBarr FoundationNational Endowment for the ArtsCleveland FoundationEducational Foundation of America
Photo Credits
Cover: Evangel University, The Ohio State University, and Marywood University
Section Dividers: Moore College of Art and Design, The Colburn School, and New York University Tisch School of the Arts
Page 2: Moore College of Art and Design
Page 3: Pace University
Page 4: Kansas City Art Institute
Page 5: Pace University
Page 6: Cleveland Art Institute
Pages 7 and 8: Marywood University
Page 9: School of the Museum of Fine Arts, Boston
Page 11: Knox College
Page 12: San Francisco Art Institute
7

Interpreting Your ResultsSNAAP 2012 marks the second national administration of the project. In this report, the results of the 2011 and 2012 administrations are combined to provide more meaningful information about arts graduates.
Q: What were the response rates for the 2011 and 2012 administrations?
A: There are several ways to calculate response rates of large scale surveys involving multiple institutions. Table 1 displays the two primary ways that SNAAP calculates response rates. The “overall response rate” is the total number of respondents divided by the total number of alumni contacted. The “average response rate” takes the response rate for each institution and averages those rates. Both of these rate calculations include partially completed surveys in the total response rates and are adjusted to exclude nondeliverable mailing addresses and alumni for whom contact information was not provided by the institution.
Q: How does SNAAP contact your alumni?
A: SNAAP sends up to five email messages to the alumni you provided in your population file, plus the additional email addresses provided through SNAAP’s contract with Harris Connect, an alumni contact service (when applicable; all but one institution participated in the Harris Connect service in 2012).
Table 1: SNAAP Response Rates (Combined 2011 and 2012)
Disposition NumberOverall
Response Rate*
Average Response
Rate**Total # of records provided by institutions 751,593 N/A N/ARecords without email addresses 322,945 N/A N/ABad email addresses: bounced back or undeliverable 40,851 N/A N/ATotal number of email invitations sent 428,648 N/A N/AContact by email but nothing returned 319,185 82.3% 80.6%Refusals 2,775 0.7% 0.7%Partially completed surveys 11,995 3.1% 3.5%Completed Surveys 53,842 13.9% 14.9%Total Response Rate*** N/A 17.0% 18.4%
* Overall Response Rate is derived by dividing the total number of respondents by the total number of alumni contacted (minus undeliverable emails).
** Average Response Rate is derived by calculating the response rate for each institution and averaging those response rates.
*** Response rates are adjusted for non-deliverable email addresses and alumni for whom contact information was not available.
8

Q: Who responded to the SNAAP survey in 2011 and 2012?
A: SNAAP defines arts graduates to include individuals with degrees in architecture, art, creative writing, dance, design, film, media arts, music and theater. Arts alumni of all ages are invited to participate in the SNAAP survey. A total of 53,842 arts alumni from 120 different institutions completed the online questionnaire. Another 11,995 partially completed the questionnaire for a total of 65,837 respondents.1
Overall, approximately 17% of all invited alumni participated in SNAAP in 2011 and 2012. About one percent of those contacted indicated that they had no interest in participating. The remaining 82% are alumni from whom we had no response. Of this large group, we do not know how many actually received the invitation and ignored it, or did not receive the invitation because of incorrect email addresses.
Approximately 74% of SNAAP respondents were graduates of undergraduate programs; 21% were graduate program alumni; and 5% were arts high school alumni.
Figure 1 shows the overall response rate by graduation year. Generally, alumni from earlier graduation years have a higher rate of response for SNAAP than those from more recent cohorts. Response rate calculations are based on those for whom a current email address is available (adjusted for those individuals whose email addresses are found to be undeliverable).
Figure 1. Response Rates by Graduation Year
14.4% 14.3% 15.1%16.3%
18.5%
21.4%
0.0%
5.0%
10.0%
15.0%
20.0%
25.0%
2008 ‐ 2012 2003 ‐ 2007 1998 ‐ 2002 1993 ‐ 1997 1983 ‐ 1992 1982 & Before
Respon
se Rate
Cohort Response Rate
1 The data throughout this report do not include responses from seven institutions that chose to limit the number of cohorts to be surveyed. Since their data were incomplete, we were unable to include those institutions in the comparison groups or aggregate results.
9

Figure 3. 2011 and 2012 SNAAP Institutions by Region1
Q: Are the data from SNAAP reliable enough to draw conclusions about my institution?
A: When interpreting data and drawing conclusions, each institution should evaluate its own response rates, taking into consideration the overall number of respondents as well as the margin of error. This information is found at the beginning of the Respondent Characteristics report(s).
While response rates ranged from a high of 37% to a low of 6%, more than half of participating institutions have a response rate between 15% and 30%.
In the absence of other data that corroborate SNAAP findings, institutions with very small numbers of alumni respondents should exercise caution, as their results may be unreliable due to an unacceptably high sampling error. This is explained in more detail on the Respondent Characteristics page of your report.
Response bias is another factor that must be considered. That is, there may be systematic differences between the 17% of the alumni who responded and the 83% who either failed to complete the survey, refused, or were never heard from. When response rates are very low, the nature of the possible bias must be determined before being able to have confidence that the results are an accurate reflection of the average views and experiences of all alumni. The SNAAP research team is continuing to examine the nature of survey response bias. However, a study based on the 2009 field-test data did not discover significant biases that would prevent schools from drawing conclusions from their data. Furthermore, a 2010 SNAAP study found that respondents to alumni surveys are just as representative as student surveys, which are commonly used for purposes of assessment. For more information, consult Lambert & Miller, 2012.
2Midwest includes IA, IL, IN, KS, MI, MN, MO, ND, NE, OH, PA (western half), SD, WI.Northeast includes CT, MA, ME, NH, NJ, NY, PA (eastern half), RI, VT.South includes AL, AR, DC, DE, FL, GA, KY, LA, MD, MS, NC, OK, SC, TN, TX, VA, WV. West includes AK, AZ, CA, CO, HI, ID, MT, NM, NV, OR, UT, WA, WY.
Figure 2. 2011 and 2012 SNAAP Institutions by Carnegie Class
SNAAP respondents received their arts degrees from a wide range of institutions. Figures 2 and 3 provide an overview of the types of institutions that participated in SNAAP 2011 and 2012 and their geographic regions.
2%
30%
21%
26%
23%
Canada
Midwest
Northeast
South
West
Research Universi6es (very high research ac6vity)
Research Universi6es (very high research ac6vity)
27%
8%
24%
8%
11%
22% Independent Arts Schools
Baccalaureate Colleges
Master's Colleges and Universi@es
Doctoral/Research Universi@es
Research Universi@es (high research ac@vity)
Research Universi@es (very high research ac@vity)
2%
30%
21%
26%
23%
Canada
Midwest
Northeast
South
West
10

Q: If my institution’s response rate was low, does that mean this institutional report does not really tell me anything about my alumni?
A: In most instances, it’s reasonable to consider your institution’s results to be suggestive, although not necessarily conclusive. At the same time, SNAAP results comprise the single largest data set of arts alumni ever assembled. The comparisons of your alumni responses to those from other institutions may be especially informative. Taken together, the
information from all participating institutions yields instructive
and provocative insights into the nature of the educational and work experiences of arts alumni.
In addition, your Alumni Comments section provides
unedited feedback from your alumni to open-ended questions.
Q: Can my institution’s response rate be improved so that institutional results will be more reliable?
A: SNAAP has tested a number of approaches to improve response rates. We revised and shortened the questionnaire, enhanced the design and interface of the online questionnaire, encouraged participating institutions to inform their alumni directly about SNAAP through social media and other means, researched and created new invitation messages for the alumni, contracted with a national data research firm (Harris Connect) to add and verify alumni email addresses, and alternated sending plain text and HTML invitation messages. We also conducted a special “shadow study” with alumni from five institutions to test incentives and response bias. This study demonstrated that there were no significant differences in responses between alumni who completed the survey via alternate modes (telephone and mail) and those who responded to a shortened questionnaire. It also indicated that incentives have little impact on response rates. For more information, consult Kennedy, Tepper, & Lambert, 2010.
The most important step an institution can take to obtain more information from its graduates is to improve its alumni database. We encourage you to begin contacting alumni well in advance of your next fall survey administration to let them know that you
value their opinion and that you need a valid email address for them to participate. Institutions have successfully used Facebook, LinkedIn and other social media to locate lost alumni as well as to make alumni aware that a SNAAP survey invitation will arrive in their email inbox in the fall.
Q: What can my institution learn from SNAAP?
A: Your SNAAP data contain rich insights and probably some actionable findings. Some lines of inquiry include:
~ Whether the skills and training alumni received at your school are relevant to their current work, regardless of whether they work as an artist, or as a doctor, lawyer, teacher, or business executive.
~ How satisfied alumni are with various aspects of their institutional experience, providing feedback to schools on both areas of weakness and strength.
~ What your graduates think your school could have done better to prepare them for work or further education.
~ Whether alumni went on to pursue additional degrees, what kinds, and from what types of institutions.
~ Alternative measures of alumni success, such as levels of satisfaction with current primary jobs.
~ Whether the arts are an important part of the lives of those alumni who are not currently working as artists.
~ What barriers do graduates face as they pursue work and what can institutions do better to support the careers of alumni.
The SNAAP research team is committed to continuous improvement. We regularly ask our institutional participants for feedback on our products and services through online surveys, focus groups, and other means, and revise our services and methodologies accordingly. Toward this end, we welcome comments and suggestions about how this report could be improved as well as other aspects of our work.
Q: How should my institution approach its SNAAP Institutional Report?
A: After reading Section 1 (About SNAAP and Interpreting Your Report), we suggest you begin with the Data Highlights report that presents results by cohort years and by the work status of your alumni.
11

New for 2012 is a Recent Graduates report. This report features key findings based on data from your most recent alumni, whose institutional experiences may be most relevant in your considerations of curricular, programmatic, or other types of institutional changes. For postsecondary institutions, we include responses from graduates from the last five years, and for arts high schools we include alumni from the last ten years.
Then, review your Comparison Groups report to familiarize yourself with which institutions fall into two of your three comparison groups.
Next, review the Respondent Characteristics report to see at a glance who is represented in your data. This report includes a variety of information including overall response rates, sampling error, and demographic information such as gender, cohort years, and race/ethnicity for both your alumni and your comparison groups. If your report includes both undergraduate and graduate data, you will have two of these reports.
The Frequency report provides you with the number and percentage of alumni that responded to each survey question for both your institution and your comparison groups.
A note about the columns of data in the Respondent Characteristics and Frequency reports:
~ The first column represents your own alumni responses at the High School, Undergraduate, or Graduate level.
~ The middle two columns contain the data from the institutions in your two comparison groups, each of which is listed in the Comparison Group report.
~ The final column contains all SNAAP 2011 and 2012 respondents at the undergraduate, graduate, or high school level, excluding your own institution’s data; the full list of institutions is contained on pages 4 to 5 of About SNAAP in the first section of this report.
Finally, the Alumni Comments, which are unedited, lets you hear directly from your alumni. We provide you with some basic information on each comment to help you put the comments into context.
If some comments are cut off on your PDF report, you can access the full responses in the Excel version that we provide.
In addition to the complete PDF copy of your Institutional Report, SNAAP provides you with the complete dataset with identifiable data, which you can manage using SPSS or similar software. We also include editable Excel versions of many of the reports, which provide you with a template for display and allow you to develop your own analyses.
Q: Will the SNAAP staff provide ongoing resources to help my institution use its
data?
A: Yes! During the coming year, we will host webinars and workshops to explain how to interpret and use your data. We also welcome your questions at any time at [email protected] or 812-856-5824. We are also happy to discuss specialized
consultation arrangements for institutions that would like more direct, one-on-one
services including special reports of your data.
Q: When can we expect to learn about aggregate or national findings from SNAAP?
A: The SNAAP research team will publish its third annual report on findings from the 2012 survey administration in summer 2013. As a participating institution, you will receive an advance copy. Previous national reports are available for download at http://snaap.indiana.edu/snaapshot/findings.cfm.
REFERENCESKennedy, J., Tepper, S., & Lambert, A. D. (2010, September).
An analysis of mode effects in three survey modes in the Strategic National Arts Alumni Project. Paper presented at the 2nd International Workshop on Internet Survey Methods, Daejeon, South Korea.
Lambert, A.D., & Miller, A.L. (2012, April). Lower response rates on alumni surveys might not mean lower response representativeness. Paper presented at the Annual Meeting of the American Educational Research Association, Vancouver, British Columbia.
12

Section 2: Undergraduate Alumni
Data Highlights
Recent Graduates
Comparison Groups
Respondent Characteristics
Frequency Report
Alumni Comments

• Excellent - 47%
•
•
•
44%
•
•
• 27%
• Clear writing 19%
• 18%
27%
31%
56%
• Very well - 24%
• Fairly well - 26%
• Not too well - 9% 5%
• Not well at all - 3%
• Did not pursue further education - 39%
17%
Teaching skills 15%
% Very Satisfied
44%
• Had serious conversations with students who are different
21% from themselves in terms of their ethnicity, religious
• Worked with a faculty member on a project - 72%
• Worked with an artist in the community - 48%
39% • Study abroad - 18%
49% • Internship - 40%
• Complete a portfolio - 81%
a Participated refers to those who responded "often", "sometimes", or "rarely" in question 15.
Entrepreneurial skills
15%
Interpersonal relations and
working collaboratively
Leadership skills
Networking and relationship
building
8%28%
38%
How alumni (n = 980) rated their overall experience at
Sample University:
Alumni (n = 949) reporting Sample University helped them
develop the following skills and abilities:
Persuasive speaking
Good - 44%
55% 1%Fair - 8%
% Very
Much
% Not
at All
Critical thinking and analysis of
arguments and informationPoor - 1%
Broad knowledge and education
This Data Highlights Report features key findings based on your institutional data, including some information about different
subgroups of your alumni. More extensive information, including comparisons to other SNAAP institutions, can be found in the
Frequency Report. Throughout the Data Highlights, "n" refers to the number of alumni responding to a particular question. Schools
that participated in both 2011 and 2012 have combined data for the two years.
Institutional Experiences Institutional Experiences (cont.)
1%
5%
Probably yes - 35%
8%
Research skillsUncertain - 17%
Alumni (n = 979) who would attend Sample University if they
could start over again:
67% 1%Creative thinking and problem
solving
Definitely yes - 33%
Improved work based on
feedback from others57% 1%
12%
Probably no - 10%
11%
How well Sample University prepared alumni (n = 956) for
2% 38%
further education:
Definitely no - 4%
7%
1%
Project management skills
Technological skills
Artistic technique
Financial and business
management skills
very satisfied with these aspects of their time at
Sample University:
15% 16%Alumni (n = 955) reporting their level of satisfaction as
25%
beliefs, political opinions, or personal values - 97%
Opportunities to network with alumni and
others15%
Opportunities to perform, exhibit, or
present your work41%
• Participated in co-curricular activities (organizations,
sorority, sports) - 74%
Opportunities to take non-arts classes
• Participated in community service - 64%
participateda in the following activities:
While enrolled at Sample University, alumni (n = 935)
Freedom and encouragement to take risks
Sense of belonging and attachment
SNAAP 2012 Data Highlights
Sample University
Undergraduate Level
Academic advising
Advising about career or further
education12%
Alumni (n = 938) who did the following activities while at
Sample University:
Opportunities for degree-related
internships or work15%
Opportunities to work in different artistic
disciplines from your own46%
campus publications, student government, fraternity or
Instructors in classrooms, labs, and
studios49%
14

Alumni who have ever been a(n):
•
% Selected as •
Importantb• Unpaid intern (n = 814) - 33%
96%
94%
98%
91%
90%
90%
95%
95%
83%
76% •
70% •
•
•
90%
93%
71%
Alumni (n = 908) who: Arts Fieldse
• Currently work as a professional artist - 58% (n = 500)
• 43%
61%
• Never worked as a professional artist - 23% 27%
Alumni (n = 906) who:
• Currently work as a teacher of the arts - 17%
•
• Never worked as a teacher of the arts - 53%
• Currently are self-employed - 46% 50%
•
• Never have been self-employed - 20%
Current professional artists (n = 516) who: • Closely related - 58%
• • Somewhat related - 23%
• • Not related - 19%
•
• Never have been self-employed at all - 10%
b Important refers to those who responded "very important" or "somewhat important" in question 39.
c Non-arts fields refers to occupational fields 24-44 listed in Appendix C of the Codebook.
d Respondents could select more than one response option.
e Arts fields refers to occupational fields 1-23 listed in Appendix C of the Codebook.
Founder of a nonprofit or for-profit organization
(n = 823) - 15%
skills and abilities were important in their profession or work
life:
35%
290Communications
Those who currently spend a majority of their time in
non-arts fields (n = 217) and find their arts training at
Sample University:
Very relevant - 11%
Relevant - 26%
264
28%
37%
(n = 216)
44%Previously worked as a professional artist
(but not currently) - 19%
Non-arts Fieldsc
Income
Alumni who have worked directly after leaving Sample
University (n = 785) reporting how closely related their first
job was to their arts training:
Balance between work and
non-work life
44%
39%
Opportunity to contribute
to the greater good
Overall job satisfaction
58% 38%Work reflects their values,
personality, and interests
Opportunity for career
advancement28% 27%
Career Career (cont.)
Those who have ever worked (n = 873) said the following
The top non-arts occupational fieldsc for alumni currently or in
the past:
317
# of Alumnid
Paid intern (n = 823) - 32%
Education, training, and library
26%
25%
Alumni who are very satisfied with certain aspects of the
current job in which they spend the majority of their work
time:
Opportunity to be creative
Job security
Networking and relationship building
Teaching skills
Leadership skills
Sales
Somewhat relevant - 33%
Not at all relevant - 30%
Previously have been self-employed as a professional
artist (but not currently) - 25%
Previously worked as a teacher of the arts
(but not currently) - 30%
Alumni (n = 898) who:
Never have been self-employed as a professional
artist - 2%
Currently are self-employed as a professional artist - 62%
Previously have been self-employed
(but not currently) - 34%
Critical thinking and analysis of arguments
and information
Broad knowledge and education
Research skills
Persuasive speaking
95%
96%
Improved work based on feedback from others
Creative thinking and problem solving
Clear writing
Interpersonal relations and working
collaboratively
Project management skills
Technological skills
Entrepreneurial skills
Financial and business management skills
Artistic technique
c
15

% Selected
Reasond•
Artistic work not available 44% • Good - 31%
Higher pay or steadier income in other fields 55% • Fair - 16%
Current location not conducive to artistic career 16% • Poor - 7%
Change in interests 29% • Very poor - 2%
Family-related reasons 24%
Debt (including student loans) 29%
•
• 2 jobs - 32%
• 3 jobs - 8%
• 4 jobs - 1%
• More than 4 jobs - 1%
•
• Serving on the board of an arts organization - 15%
% Reported • Volunteering to teach the arts - 18%
Resource • Donating money to an arts organization or artist - 44%
Importantd• Attending an arts event - 86%
Loans, investment capital 29%
Prizes, grants, or commissions 46%
Strong network of peers and colleagues 73%
61% •
Material resources 62% • Serving on the board of an arts organization - 12%
Mentors and teachers 65% • Volunteering to teach the arts - 17%
Additional training 45% • Donating money to an arts organization or artist - 32%
• Attending an arts event - 79%
•
% Reported •
Resource •
Lackingd•
Loans, investment capital 29% •
Prizes, grants, or commissions 33% •
Strong network of peers and colleagues 32%
33%
Material resources 32%
Mentors and teachers 29%
Additional training 27%
d Respondents could select more than one response option.
f Not currently professional artists are identified as those who did not select "yes, I do this currently" in question 25.
Opportunity to live in an artistically vital
location22%
Waysd those who are not currently professional artists
f
(n = 354) supported the arts in the past 12 months:
Volunteering at an arts organization - 19%
2003-2007 cohorts (n = 41) - 90%
Publicity or acknowledgement of work
2008-2012 cohorts (n = 58) - 76%
24%
(n = 488) supported the arts in the past 12 months:
Volunteering at an arts organization - 28%
Waysd those who are currently professional artists
How current professional artists (n = 483) rated the area where
they currently live and/or work as a place to pursue their
artistic career:
Very good - 45%
Alumni (n = 794) who participated in these types of arts
training during their lifetime:
Community sponsored classes,
workshops, or events
Lack of access to important networks and
people
Lack of social support from family and
friends10%
Current professional artists (n = 489) who currently hold:
1 job - 57%
46%
% Reported
Participatingd
25%
70%
19%
Current or past professional artists (n = 685) who indicated
that the following resources and opportunities were very
important for success in their artistic career:
Career (cont.) Arts Engagement
Those who are past artists, or intended to be artists and never
were (n = 271), and gave the following reasons:
Summer arts program
Arts high school
Arts courses offered at high school
After-school program
Private lessons
41%
22%
Publicity or acknowledgement of work
Current or past professional artists (n = 638) who indicated
that the following resources and opportunities were
insufficient to achieving success in their artistic career: 1982 cohort and earlier (n = 132) - 73%
1983-1992 cohorts (n = 53) - 68%
1993-1997 cohorts (n = 38) - 71%
1998-2002 cohorts (n = 42) - 79%
Those not currently professional artistsf who make or perform
art in their personal (not work-related) time:
Opportunity to live in an artistically vital
location51%
16

•
•
•
• 1998-2002 cohorts (n = 79) - $45,000
Craft Arts • 2003-2007 cohorts (n = 110) - $45,000
Creative Writing • 2008-2012 cohorts (n = 133) - $15,000
Culinary Arts
•
Film/Media Arts •
•
• 1998-2002 cohorts (n = 74) - $90,000
• 2003-2007 cohorts (n = 108) - $55,000
• 2008-2012 cohorts (n = 118) - $25,000
• % of Time % of Income
• (n = 540) (n = 506)
• Less than 20% 21% 33%
• 21% to 40% 10% 7%
41% to 60% 10% 6%
All alumni who make or perform art in their personal 9% 4%
(not work-related) time (n = 689) who indicated that it was: 50% 50%
•
•
• loan debt on career or educational decisions:
• •
•
•
•
• •
• •
•
•
d Respondents could select more than one response option.
g Median income values are calculated using the midpoints of income ranges as values.
Private patron, foundation, or government grant - 20%
Continuously in public or online - 14%
3 or more times a year - 12%
1 or 2 times a year - 19%
Less than once a year - 19%
financial support from these sourcesd:
Do not perform or exhibit in public - 37%
Family and friends - 24%
1982 cohort and earlier (n = 195) - $75,000
% Reported
Practicingd
1983-1992 cohorts (n = 105) - $95,000
Very important - 66%
17%
For those who make or perform art in their personal (not work-
related) time (n = 691), how frequently they do so:
Daily - 19%
Several times a week - 34%
1993-1997 cohorts (n = 65) - $55,000
Dance 7% Median household incomeg in 2011:
Design
45%
Those who make or perform art in their personal
(not work-related) time (n = 691), practiced the following art
forms:
Arts Engagement (cont.) Income and Debt
1982 cohort and earlier (n = 202) - $50,000
26%
23%
Several times a month - 32%
A few times a year or less - 15%
Fine Arts (painting, sculpting, drawing)
For those who make or perform art in their personal
(not work-related) time (n = 689), how often they publicly
perform or exhibit:
Major impact - 35%
Some impact - 32%
No impact - 34%
81% to 100%
For those who acquired debt (n = 495), the impact of student
Current or past professional artists (n = 642), who have
61% to 80%
Important - 24%
Somewhat important - 9%
Not at all important - 1%
Median individual incomeg in 2011:
1993-1997 cohorts (n = 62) - $125,00065%
Music 19%
Photography 50%
For professional artists in 2011, the percentage of work time
or income from work as a professional artist:
Theater 4%
1983-1992 cohorts (n = 115) - $55,000
48%
17

2012 Recent Graduates Report
Sample University
Undergraduate Level

•
•
•
•
•
• Study abroad - 28%
• Internship - 72%
• Complete a portfolio - 93%
• Very well - 15%
• Fairly well - 28%
• Not too well - 6%
• Not well at all - 2% • Yes - 80%
• Did not pursue further education - 48% • No - 20%
Recent alumni (n = 184) who would attend Sample University
if they could start over again:
Recent alumni (n = 174) reporting their level of satisfaction
as very satisfied with these aspects of their time at
Sample University:
% Very Satisfied
How recent alumni (n = 184) rated their overall experience at
Sample University:
Opportunities to perform, exhibit, or present
your work
Opportunities to take non-arts classes
40%
48%
36%
25%
19%
Instructors in classrooms, labs, and studios 42%
Advising about career or further education
SNAAP 2012 Recent Graduates
Sample University
Undergraduate Level
Academic advising
Opportunities for degree-related internships or
work
Opportunities to work in different artistic
disciplines from your own
This Recent Graduates Report features key findings based on your data from your most recent alumni. SNAAP defines "recent
alumni" as those who graduated in the last 5 years for postsecondary institutions, and in the last 10 years for arts high schools.
Throughout the Recent Graduates Report, "n" refers to the number of alumni responding to a particular question. If you also
participated in 2011, responses for 2011 and 2012 have been combined.
Institutional Experiences Institutional Experiences (cont.)
20%
16%
Opportunities to network with alumni and
others
Comparing the % of alumni who say a skill is very important to their work to the % who say that they acquired that skill very much
while at Sample University:
Recent alumni (n = 167) who participated in the following
activities while at Sample University:
Sense of belonging and attachment 40%
Freedom and encouragement to take risks 48%Probably yes - 35%
Uncertain - 14%
Whether recent alumni (n = 183) would recommend Sample
University to other students like themselves:
Definitely yes - 31%
Probably no - 17%
How well Sample University prepared recent alumni (n = 172) for
further education:
Definitely no - 4%
Poor
3% Fair
10%
Good
49%
Excellent
38%
76%
60%
73%
88%
49% 58% 56%
80% 75%
51%
38% 33%
68%
51%
62%
32%
57%
39%
61% 68%
33%
22% 23%
42% 32%
47%
2% 8%
37% 30% 27%
16%
0%10%20%30%40%50%60%70%80%90%
100%
Skill is very important to work (n = 146)Acquired skill in school (very much) (n = 173)
19

• Currently are self-employed - 45%
•
•
• Never have been self-employed - 27% • Good - 32%
• Fair - 18%
• Poor - 13%
• Very poor - 2%
•
• Serving on the board of an arts organization - 7%
• Volunteering to teach the arts - 15%
• Donating money to an arts organization or artist - 23%
• Attending an arts event - 85%
• Currently work as a professional artist - 60%
•
• Never worked as a professional artist - 33%
Artistic work not available 60%
Higher pay or steadier income in other fields 53%
Current location not conducive to artistic career 11%
Change in interests 29%
Family-related reasons 11%
24%
49%
13%
Reasond
Lack of access to important networks and people
Debt (including student loans)
Lack of social support from family and friends
Career Arts Engagement
Recent alumni (n = 154) who:
Previously have been self-employed
(but not currently) - 28%
How current professional artists (n = 84) rated the area where
they currently live and/or work as a place to pursue their
artistic career:
Very good - 35%
Comparing recent alumni working in arts fieldsa to those in
non-arts fieldsb who report they are very satisfied with certain
aspects of the current job in which they spend the majority of
their work time:
Previously worked as a professional artist
(but not currently) - 7%
Median individual and household incomee in 2011 by
graduating year:
Income and Debt
Ways recent alumni (n = 141) supported the arts in the
past 12 monthsd:
Volunteering at an arts organization - 23%
% Selected
Recent alumni (n = 157) who:
Reasons why recent alumni (n = 45) are not currently pursuing
careers as professional artistsc:
For recent alumni who acquired student loan debt at Sample
University (n = 110), impact on life decisions:
a Arts fields refers to occupational fields 1-23 listed in Appendix C of the Codebook.
b Non-arts fields refers to occupational fields 24-44 listed in Appendix C of the Codebook.
c Does not include those who were never artists and never intended to be.
d Respondents could select more than one response option.
e Median income values are calculated using the midpoints of income ranges as values.
Major
impact
56%
Some impact
35%
No impact
9%
38%
5%
17%
19%
17%
21%
24%
41%
49%
27%
28%
29%
46%
40%
0% 20% 40% 60% 80% 100%
Job security
Opportunity to
be creative
Income
Work and
life balance
Career
advancement
Work reflects
interests
Overall job
satisfaction
Arts fields (n = 90)
Non-arts fields (n = 42)
$0
$5,000
$10,000
$15,000
$20,000
$25,000
$30,000
$35,000
$40,000
$45,000
$50,000
2011
(n = 25)
2010
(n = 32)
2009
(n = 17)
2008
(n = 33)
2007
(n = 22)
Household
Individual
20
2012 Comparison Groups
Sample University
Undergraduate Level

Number of Institutions: 61
City State
1. Alberta College of Art + Design Calgary AB
2. Arizona State University (School of Art) Tempe AZ
3. Art Center College of Design Pasadena CA
4. Art Institute of Boston at Lesley University Boston MA
5. CalArts (School of Art) Valencia CA
6. CalArts (School of Film/Video) Valencia CA
7. California College of the Arts Oakland CA
8. Cleveland Institute of Art Cleveland OH
9. College of Visual Arts Saint Paul MN
10. Columbus College of Art & Design Columbus OH
11. Cooper Union (School of Art) New York NY
12. Corcoran College of Art + Design Washington DC
13. DePaul University (College of Computing & Digital Media) Chicago IL
14. DePaul University (College of Liberal Arts and Social Sciences) Chicago IL
15. Herron School of Art and Design, IUPUI Indianapolis IN
16. Indiana University (Art Education) Bloomington IN
17. Indiana University of Pennsylvania (Dept. of Art) Indiana PA
18. Kansas City Art Institute Kansas City MO
19. Kendall College of Art and Design at Ferris State University Big Rapids MI
20. Kent State University (Fashion Design & Merchandising) Kent OH
21. Maine College of Art Portland ME
22. Maryland Institute College of Art Baltimore MD
23. Massachusetts College of Art and Design Boston MA
24. Memphis College of Art Memphis TN
25. Miami University-Oxford (Architecture) Oxford OH
26. Miami University-Oxford (Art) Oxford OH
27. Milwaukee Institute of Art & Design Milwaukee WI
28. Minneapolis College of Art and Design Minneapolis MN
29. Moore College of Art and Design Philadelphia PA
30. North Dakota State University (Visual Arts Program) Fargo ND
31. OCAD University Toronto ON
32. Otis College of Art and Design Los Angeles CA
33. Pacific Northwest College of Art Portland OR
34. Pennsylvania Academy of the Fine Arts Philadelphia PA
35. Pittsburg State University (Dept. of Art) Pittsburg KS
36. Pratt Institute Brooklyn NY
37. Ringling College of Art and Design Sarasota FL
38. San Francisco Art Institute San Francisco CA
Institution Name
2012 Comparison Groups
Sample University
Undergraduate Level
Comparison Group 1 Selection
Art, Design, & Media
SNAAP Default
Group Name:
Selection Method:
The SNAAP Institutional Report displays your institution’s results along with three comparison groups. Your institution had
the option of selecting two comparison groups; those two groups could be pre-formed by SNAAP or created and named by
your institution. You were allowed to select institutions from both the 2011 and 2012 administrations. The third comparison
group is composed of all SNAAP schools at the appropriate level (high school, undergraduate, or graduate). A complete list of
these institutions can be found in Section 1.
22

Number of Institutions: 61
City StateInstitution Name
Comparison Group 1 Selection
Art, Design, & Media
SNAAP Default
Group Name:
Selection Method:
39. School of the Art Institute of Chicago Chicago IL
40. School of the Museum of Fine Arts, Boston Boston MA
41. School of Visual Arts New York NY
42. Seton Hall University South Orange NJ
43. Southern Methodist University (Art) Dallas TX
44. Southern Methodist University (Film and Media Arts) Dallas TX
45. University of Alaska Anchorage (Art) Anchorage AK
46. University of Hartford (Hartford Art School) West Hartford CT
47. University of Houston (Art) Houston TX
48. University of Illinois (Dept. of Landscape Architecture) Champaign IL
49. University of Illinois (Dept. of Urban & Regional Planning) Champaign IL
50. University of Illinois (School of Architecture) Champaign IL
51. University of Illinois (School of Art + Design) Champaign IL
52. University of Massachusetts, Amherst (Art, Architecture & Art History) Amherst MA
53. University of Michigan (School of Art & Design) Ann Arbor MI
54. University of New Orleans (Fine Arts) New Orleans LA
55. University of Northern Colorado (School of Art & Design) Greeley CO
56. University of Texas at Austin (Art and Art History) Austin TX
57. University of Texas at Austin (School of Architecture) Austin TX
58. University of the Arts (College of Art, Media + Design) Philadelphia PA
59. Valdosta State University (Dept. of Art) Valdosta GA
60. Western Kentucky University (Art) Bowling Green KY
61. Western Michigan University (Frostic School of Art) Kalamazoo MI
23

Number of Institutions: 56
City State
1. Albion College Albion MI
2. Butler University (Jordan College of the Arts) Indianapolis IN
3. Case Western Reserve University Cleveland OH
4. Cleveland Institute of Art Cleveland OH
5. College of Visual Arts Saint Paul MN
6. Columbia College Chicago Chicago IL
7. Columbus College of Art & Design Columbus OH
8. DePaul University (College of Computing & Digital Media) Chicago IL
9. DePaul University (College of Liberal Arts and Social Sciences) Chicago IL
10. DePaul University (School of Music) Chicago IL
11. DePaul University (Theatre School) Chicago IL
12. Evangel University Springfield MO
13. Herron School of Art and Design, IUPUI Indianapolis IN
14. Indiana University (Art Education) Bloomington IN
15. Indiana University (Jacobs School of Music) Bloomington IN
16. Indiana University of Pennsylvania (Dept. of Art) Indiana PA
17. Indiana University of Pennsylvania (Dept. of Music) Indiana PA
18. Indiana University of Pennsylvania (Dept. of Theater and Dance) Indiana PA
19. Kansas City Art Institute Kansas City MO
20. Kendall College of Art and Design at Ferris State University Big Rapids MI
21. Kent State University (Art, Music, & Theatre & Dance) Kent OH
22. Kent State University (Fashion Design & Merchandising) Kent OH
23. Knox College Galesburg IL
24. Miami University-Oxford (Architecture) Oxford OH
25. Miami University-Oxford (Art) Oxford OH
26. Miami University-Oxford (Music) Oxford OH
27. Miami University-Oxford (Theatre) Oxford OH
28. Milwaukee Institute of Art & Design Milwaukee WI
29. Minneapolis College of Art and Design Minneapolis MN
30. North Dakota State University (Music) Fargo ND
31. North Dakota State University (Theatre Arts) Fargo ND
32. North Dakota State University (Visual Arts Program) Fargo ND
33. Northern State University Aberdeen SD
34. Oakland University Rochester MI
35. Ohio Northern University Ada OH
36. Ohio State University Columbus OH
37. Pittsburg State University (Dept. of Art) Pittsburg KS
38. Purdue University (Art and Design, Theatre) West Lafayette IN
39. Purdue University (Creative Writing) West Lafayette IN
40. School of the Art Institute of Chicago Chicago IL
41. St. Cloud State University Saint Cloud MN
42. University of Illinois (Dept. of Dance) Champaign IL
43. University of Illinois (Dept. of Landscape Architecture) Champaign IL
44. University of Illinois (Dept. of Theatre) Champaign IL
Midwest
Selection Method: SNAAP Default
Institution Name
2012 Comparison Groups
Sample University
Undergraduate Level
Comparison Group 2 Selection
Group Name:
24

Number of Institutions: 56
City State
Midwest
Selection Method: SNAAP Default
Institution Name
Comparison Group 2 Selection
Group Name:
45. University of Illinois (Dept. of Urban & Regional Planning) Champaign IL
46. University of Illinois (School of Architecture) Champaign IL
47. University of Illinois (School of Art + Design) Champaign IL
48. University of Illinois (School of Music) Champaign IL
49. University of Kansas Lawrence KS
50. University of Michigan (School of Art & Design) Ann Arbor MI
51. University of Missouri-Kansas City Kansas City MO
52. University of Wisconsin-Whitewater Whitewater WI
53. Western Michigan University (Dance) Kalamazoo MI
54. Western Michigan University (Frostic School of Art) Kalamazoo MI
55. Western Michigan University (School of Music) Kalamazoo MI
56. Western Michigan University (Theatre) Kalamazoo MI
25

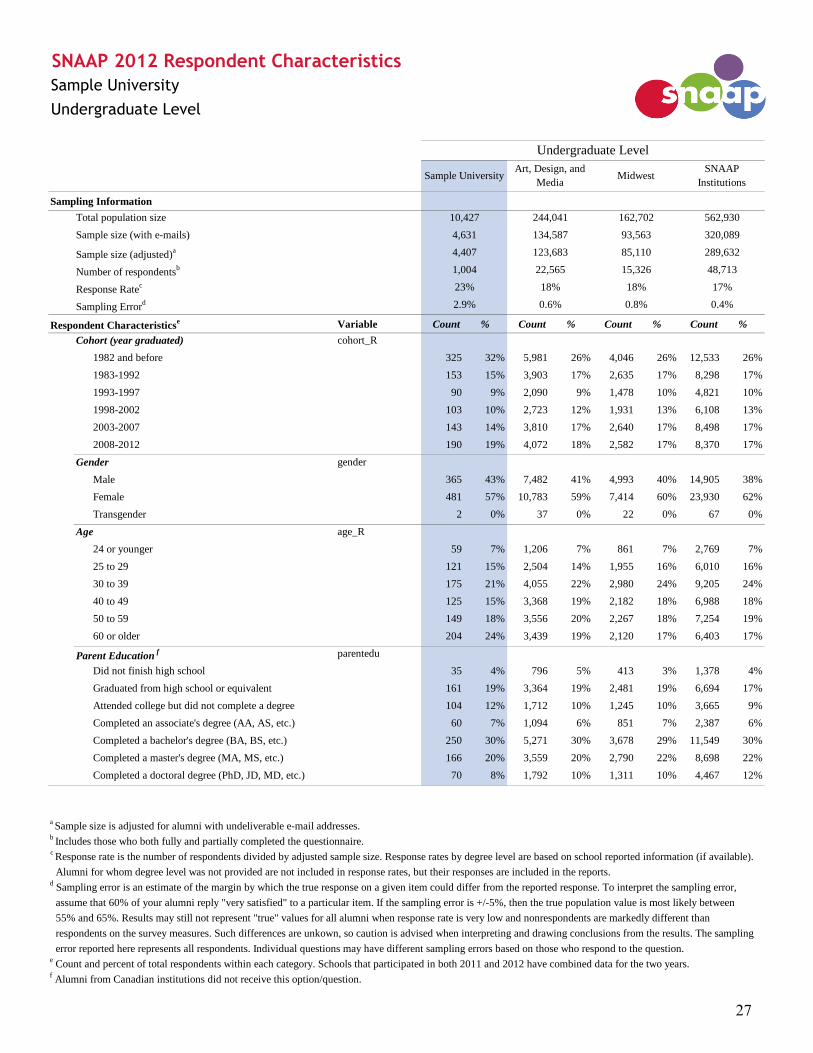
2012 Respondent Characteristics
Sample University
Undergraduate Level
Sampling Information
Total population size
Sample size (with e-mails)
Sample size (adjusted)a
Number of respondentsb
Response Ratec
Sampling Errord
Respondent Characteristicse Variable Count % Count % Count % Count %
Cohort (year graduated) cohort_R
1982 and before 325 32% 5,981 26% 4,046 26% 12,533 26%
1983-1992 153 15% 3,903 17% 2,635 17% 8,298 17%
1993-1997 90 9% 2,090 9% 1,478 10% 4,821 10%
1998-2002 103 10% 2,723 12% 1,931 13% 6,108 13%
2003-2007 143 14% 3,810 17% 2,640 17% 8,498 17%
2008-2012 190 19% 4,072 18% 2,582 17% 8,370 17%
Gender gender
Male 365 43% 7,482 41% 4,993 40% 14,905 38%
Female 481 57% 10,783 59% 7,414 60% 23,930 62%
Transgender 2 0% 37 0% 22 0% 67 0%
Age age_R
24 or younger 59 7% 1,206 7% 861 7% 2,769 7%
25 to 29 121 15% 2,504 14% 1,955 16% 6,010 16%
30 to 39 175 21% 4,055 22% 2,980 24% 9,205 24%
40 to 49 125 15% 3,368 19% 2,182 18% 6,988 18%
50 to 59 149 18% 3,556 20% 2,267 18% 7,254 19%
60 or older 204 24% 3,439 19% 2,120 17% 6,403 17%
parentedu
Did not finish high school 35 4% 796 5% 413 3% 1,378 4%
Graduated from high school or equivalent 161 19% 3,364 19% 2,481 19% 6,694 17%
Attended college but did not complete a degree 104 12% 1,712 10% 1,245 10% 3,665 9%
Completed an associate's degree (AA, AS, etc.) 60 7% 1,094 6% 851 7% 2,387 6%
Completed a bachelor's degree (BA, BS, etc.) 250 30% 5,271 30% 3,678 29% 11,549 30%
Completed a master's degree (MA, MS, etc.) 166 20% 3,559 20% 2,790 22% 8,698 22%
Completed a doctoral degree (PhD, JD, MD, etc.) 70 8% 1,792 10% 1,311 10% 4,467 12%
e Count and percent of total respondents within each category. Schools that participated in both 2011 and 2012 have combined data for the two years.
2.9% 0.6% 0.8% 0.4%
Parent Educationf
b Includes those who both fully and partially completed the questionnaire.
a Sample size is adjusted for alumni with undeliverable e-mail addresses.
d Sampling error is an estimate of the margin by which the true response on a given item could differ from the reported response. To interpret the sampling error,
respondents on the survey measures. Such differences are unkown, so caution is advised when interpreting and drawing conclusions from the results. The sampling
assume that 60% of your alumni reply "very satisfied" to a particular item. If the sampling error is +/-5%, then the true population value is most likely between
c Response rate is the number of respondents divided by adjusted sample size. Response rates by degree level are based on school reported information (if available).
Alumni for whom degree level was not provided are not included in response rates, but their responses are included in the reports.
23% 18% 18% 17%
4,407 123,683 85,110 289,632
1,004 22,565 15,326 48,713
134,587 93,563 320,089
f Alumni from Canadian institutions did not receive this option/question.
55% and 65%. Results may still not represent "true" values for all alumni when response rate is very low and nonrespondents are markedly different than
error reported here represents all respondents. Individual questions may have different sampling errors based on those who respond to the question.
SNAAP 2012 Respondent Characteristics
Sample University
Undergraduate Level
Undergraduate Level
Sample UniversityArt, Design, and
MediaMidwest
SNAAP
Institutions
10,427 244,041 162,702 562,930
4,631
27

Respondent Characteristics (continued)e Variable Count % Count % Count % Count %
Marital Status marital
Single (never married) 260 31% 5,861 32% 3,773 30% 12,786 32%
Married or domestic partner 480 57% 10,489 57% 7,656 60% 22,687 57%
Divorced/separated 86 10% 1,839 10% 1,076 8% 3,565 9%
Widowed 20 2% 354 2% 223 2% 693 2%
Number of Dependents children
0 511 68% 11,668 71% 8,201 69% 25,432 70%
1 115 15% 2,194 13% 1,513 13% 4,798 13%
2 95 13% 1,984 12% 1,551 13% 4,564 13%
3 or more 34 5% 629 4% 578 5% 1,565 4%
Race/Ethnicityf,g
White or Caucasian race_white 774 92% 14,976 86% 11,663 92% 33,813 88%
Black or African American race_blck 15 2% 508 3% 331 3% 1,181 3%
Hispanic, Latino, or Spanish origin race_hisp 24 3% 881 5% 323 3% 1,847 5%
American Indian or Alaska Native race_amerind 8 1% 236 1% 121 1% 483 1%
Native Hawaiian or other Pacific Islander race_haw 5 1% 76 0% 31 0% 193 1%
Asian race_asian 33 4% 1,029 6% 340 3% 1,833 5%
Other race_oth 11 1% 531 3% 295 2% 1,071 3%
U.S. Citizen (while at institution)f citizen 827 97% 16,706 95% 12,497 98% 37,525 97%
Type of Device Used for Surveyh device
PC 353 35% 5,215 34% 3,508 50% 9,899 41%
Mac 532 53% 8,075 53% 2,707 38% 10,965 46%
Smart Phone 74 7% 1,136 7% 496 7% 1,915 8%
Tablet 41 4% 667 4% 336 5% 1,114 5%
SNAAP 2012 Respondent Characteristics
Sample University
Undergraduate Level
Undergraduate Level
Sample UniversityArt, Design, and
MediaMidwest
SNAAP
Institutions
e Count and percent of total respondents within each category. Schools that participated in both 2011 and 2012 have combined data for the two years.
f Alumni from Canadian institutions did not receive this option/question.
h Information only available for 2012 respondents.
g The count and percent of alumni who selected that race/ethnicity. Alumni could select more than one category, so percentages may not equal 100%.
28

2012 Frequency Report
Sample University
Undergraduate Level

Variable Response Options Count % Count % Count % Count %
part_none I have not supported the arts in the past 12 months 95 86% 256 76% 382 84% 1,206 80%
part_vol Volunteered at an arts organization 45 41% 56 17% 76 17% 345 23%
part_brd Served on the board of an arts organization 33 30% 98 29% 107 23% 556 37%
part_tch Volunteered to teach the arts 56 51% 93 28% 98 21% 523 35%
part_donate Donated money to an arts organization or an artist 83 75% 255 76% 273 60% 980 65%
part_attd Attended an arts event 48 44% 38 11% 112 25% 681 45%
part_oth Other 22 20% 67 20% 89 19% 178 12%
Totala
- - - - - - - -Do not make or perform art in personal time 111 23% 272 20% 215 36% 525 24%
I do not perform or exhibit in public 0 0% 1 0% 0 0% 1 0%
Less than once a year 25 5% 74 5% 43 7% 129 6%
1 or 2 times a year 44 9% 92 7% 52 9% 158 7%
3 or more times a year 107 22% 372 27% 103 17% 524 24%
Continuously in public or online 206 42% 563 41% 184 31% 828 38%
Total 493 100% 1,374 100% 597 100% 2,165 100%
Understanding the Frequency ReportThe Frequency Report contains questions with fixed response options. For more detailed information, the Codebook contains a complete
list of variables, survey questions, response options, and the logic used to determine which alumni received each question.
SNAAP 2012 Frequency Report • Arts EngagementSample Institution
Undergraduate Level
Undergraduate Level
Sample
Institution
Comparison
Group 1
Comparison
Group 2
SNAAP
Aggregate
53. The ways in which you
have supported the arts in the
past 12 months (other than
performing, creating, or
exhibiting your own artwork)
58. How often do you
publicly perform or exhibit art
in your personal (not work-
related) time?d
exhibit
Comparison Groups The number and percentage of alumni at all institutions in each of the three comparison groups. The first two columns are selected groups and the third is all SNAAP schools at this level. You were allowed to select institutions from both the 2011 and 2012 SNAAP administrations. All three comparison groups exclude your alumni. For more details regarding institutions included in each column, see your "Comparison Group" Report.
Topic Area Each section represents a different topic area of the SNAAP Questionnaire.
Your Respondents The number and percentage of your alumni selecting a certain response for each
question. If you also participated in 2011, responses for 2011 and 2012 have been combined.
Variable
These variable names are labels assigned to each survey question in the data set. The variable name allows easy reference to the Codebook, which includes each variable name, the complete questions asked, the response options available, and the logic determining which alumni received each question.
Questions An abbreviated version of the questions on the SNAAP Questionnaire.
Response Options Response options for each particular question.
Dashes For questions where alumni could check more than one response option, dashes are used because percentages can total more than 100%.
Italicized Response Options Due to the dynamic nature of the SNAAP Questionnaire, not all alumni received every question. This italicized line (or lines) indicates the number and percentage of alumni who did not receive the question and why they did not receive it. For more detailed information on why they did not receive each item, please see the Codebook.
Education Level Your report is representative of a specific education level (High School, Undergraduate, or Graduate).
Skipped Numbers This indicates open-ended questions which can be found in the "Alumni Comments" Report or demographic items found on the "Respondent Characteristics" Report.
How to Interpret Percentages All percentages are presented as the percent of all alumni at a given education level, including those that did not receive the question. For example, here we might say that 9% of all Sample Institution's undergraduate alumni publicly perform or exhibit their art in their personal time 1 or 2 times per year. This includes the 23% that did not receive the question because they do not make or perform art in their personal time. Frequencies for some questions (marked with footnote "d") have been reproduced with only those respondents who received the question. These can be found in the "Data Highlights" Report.
30

Undergraduate Level
Variable Response Options Count % Count % Count % Count %
instdeg_hs High School Diploma 163 16% 2,354 10% 880 6% 3,283 7%
instdeg_Cert Certificate 40 4% 1,136 5% 450 3% 1,701 3%
instdeg_BA BA 60 6% 2,602 11% 3,927 26% 13,449 28%
instdeg_BArch B Arch 0 0% 996 4% 556 4% 1,473 3%
instdeg_BFA BFA 911 91% 16,247 72% 6,845 45% 24,299 50%
instdeg_BM BM or B Mus 0 0% 20 0% 1,488 10% 4,014 8%
instdeg_BS BS 31 3% 1,207 5% 2,007 13% 3,559 7%
instdeg_othUG Other undergraduate degree 10 1% 953 4% 984 6% 2,396 5%
instdeg_AD Artist Diplomab 10 1% 298 1% 109 1% 385 1%
instdeg_MA MA 8 1% 306 1% 396 3% 1,004 2%
instdeg_MArch M Arch 0 0% 47 0% 52 0% 121 0%
instdeg_MFA MFA 17 2% 498 2% 255 2% 908 2%
instdeg_MM MM or M Mus 0 0% 11 0% 230 2% 522 1%
instdeg_DMA DMA 0 0% 6 0% 14 0% 62 0%
instdeg_PhD PhD 2 0% 36 0% 48 0% 177 0%
instdeg_othGR Other graduate degree 19 2% 576 3% 452 3% 1,481 3%
Totala - - - - - - - -
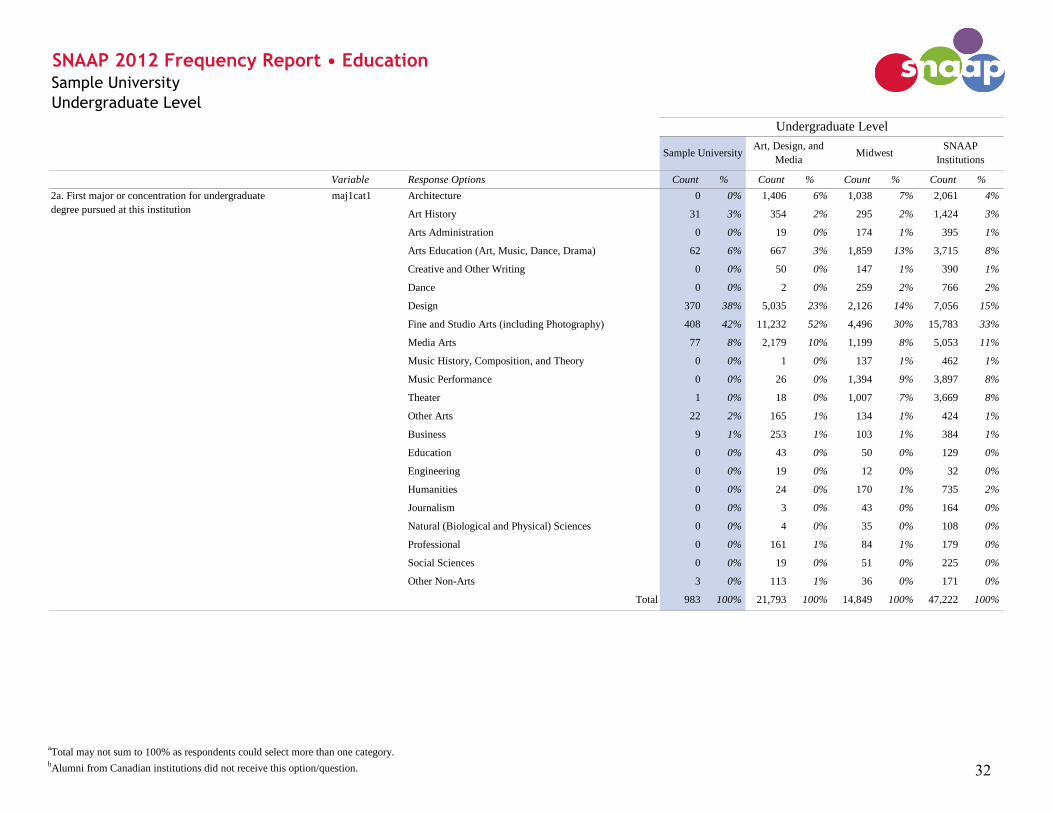
SNAAP 2012 Frequency Report • EducationSample University
Undergraduate Level
Sample UniversityArt, Design, and
MediaMidwest
SNAAP
Institutions
1. Degree(s) or credential(s) pursued at this institution
aTotal may not sum to 100% as respondents could select more than one category.
bAlumni from Canadian institutions did not receive this option/question. 31
Undergraduate Level
Variable Response Options Count % Count % Count % Count %
SNAAP 2012 Frequency Report • EducationSample University
Undergraduate Level
Sample UniversityArt, Design, and
MediaMidwest
SNAAP
Institutions
maj1cat1 Architecture 0 0% 1,406 6% 1,038 7% 2,061 4%
Art History 31 3% 354 2% 295 2% 1,424 3%
Arts Administration 0 0% 19 0% 174 1% 395 1%
Arts Education (Art, Music, Dance, Drama) 62 6% 667 3% 1,859 13% 3,715 8%
Creative and Other Writing 0 0% 50 0% 147 1% 390 1%
Dance 0 0% 2 0% 259 2% 766 2%
Design 370 38% 5,035 23% 2,126 14% 7,056 15%
Fine and Studio Arts (including Photography) 408 42% 11,232 52% 4,496 30% 15,783 33%
Media Arts 77 8% 2,179 10% 1,199 8% 5,053 11%
Music History, Composition, and Theory 0 0% 1 0% 137 1% 462 1%
Music Performance 0 0% 26 0% 1,394 9% 3,897 8%
Theater 1 0% 18 0% 1,007 7% 3,669 8%
Other Arts 22 2% 165 1% 134 1% 424 1%
Business 9 1% 253 1% 103 1% 384 1%
Education 0 0% 43 0% 50 0% 129 0%
Engineering 0 0% 19 0% 12 0% 32 0%
Humanities 0 0% 24 0% 170 1% 735 2%
Journalism 0 0% 3 0% 43 0% 164 0%
Natural (Biological and Physical) Sciences 0 0% 4 0% 35 0% 108 0%
Professional 0 0% 161 1% 84 1% 179 0%
Social Sciences 0 0% 19 0% 51 0% 225 0%
Other Non-Arts 3 0% 113 1% 36 0% 171 0%
Total 983 100% 21,793 100% 14,849 100% 47,222 100%
2a. First major or concentration for undergraduate
degree pursued at this institution
aTotal may not sum to 100% as respondents could select more than one category.
bAlumni from Canadian institutions did not receive this option/question. 32

Undergraduate Level
Variable Response Options Count % Count % Count % Count %
SNAAP 2012 Frequency Report • EducationSample University
Undergraduate Level
Sample UniversityArt, Design, and
MediaMidwest
SNAAP
Institutions
maj2cat1 Architecture 0 0% 52 1% 39 1% 96 1%
Art History 12 8% 212 5% 149 5% 416 5%
Arts Administration 0 0% 17 0% 23 1% 58 1%
Arts Education (Art, Music, Dance, Drama) 11 8% 185 5% 204 7% 510 6%
Creative and Other Writing 0 0% 42 1% 60 2% 119 1%
Dance 0 0% 1 0% 16 1% 81 1%
Design 21 14% 484 12% 204 7% 618 7%
Fine and Studio Arts (including Photography) 78 53% 2,044 53% 928 32% 2,632 32%
Media Arts 15 10% 347 9% 203 7% 668 8%
Music History, Composition, and Theory 0 0% 1 0% 35 1% 79 1%
Music Performance 0 0% 23 1% 260 9% 603 7%
Theater 0 0% 19 0% 103 3% 287 3%
Other Arts 2 1% 60 2% 44 1% 103 1%
Business 1 1% 86 2% 76 3% 204 2%
Education 1 1% 64 2% 110 4% 258 3%
Engineering 0 0% 20 1% 23 1% 44 1%
Humanities 2 1% 64 2% 214 7% 663 8%
Journalism 0 0% 8 0% 25 1% 70 1%
Natural (Biological and Physical) Sciences 0 0% 19 0% 46 2% 132 2%
Professional 0 0% 13 0% 17 1% 44 1%
Social Sciences 2 1% 46 1% 115 4% 469 6%
Other Non-Arts 1 1% 66 2% 52 2% 154 2%
Total 146 100% 3,873 100% 2,946 100% 8,308 100%
2b. Second major or concentration for undergraduate
degree pursued at this institution
aTotal may not sum to 100% as respondents could select more than one category.
bAlumni from Canadian institutions did not receive this option/question. 33

Undergraduate Level
Variable Response Options Count % Count % Count % Count %
SNAAP 2012 Frequency Report • EducationSample University
Undergraduate Level
Sample UniversityArt, Design, and
MediaMidwest
SNAAP
Institutions
min1cat1 Architecture 3 2% 51 1% 36 1% 74 1%
Art History 12 7% 672 15% 410 10% 1,297 11%
Arts Administration 0 0% 38 1% 45 1% 111 1%
Arts Education (Art, Music, Dance, Drama) 0 0% 70 2% 89 2% 199 2%
Creative and Other Writing 1 1% 91 2% 86 2% 215 2%
Dance 0 0% 8 0% 48 1% 115 1%
Design 20 12% 448 10% 246 6% 607 5%
Fine and Studio Arts (including Photography) 81 48% 1,858 41% 974 23% 2,418 21%
Media Arts 4 2% 300 7% 230 5% 687 6%
Music History, Composition, and Theory 0 0% 2 0% 25 1% 66 1%
Music Performance 1 1% 25 1% 337 8% 698 6%
Theater 0 0% 23 1% 93 2% 269 2%
Other Arts 2 1% 79 2% 43 1% 97 1%
Business 8 5% 212 5% 381 9% 777 7%
Education 1 1% 55 1% 125 3% 329 3%
Engineering 1 1% 13 0% 17 0% 29 0%
Humanities 11 6% 270 6% 506 12% 1,760 15%
Journalism 0 0% 4 0% 38 1% 77 1%
Natural (Biological and Physical) Sciences 3 2% 47 1% 118 3% 318 3%
Professional 0 0% 18 0% 28 1% 68 1%
Social Sciences 16 9% 145 3% 280 7% 1,077 9%
Other Non-Arts 6 4% 126 3% 117 3% 347 3%
Total 170 100% 4,555 100% 4,272 100% 11,635 100%
3. Minor for undergraduate degree pursued at this
institution
aTotal may not sum to 100% as respondents could select more than one category.
bAlumni from Canadian institutions did not receive this option/question. 34

Undergraduate Level
Variable Response Options Count % Count % Count % Count %
SNAAP 2012 Frequency Report • EducationSample University
Undergraduate Level
Sample UniversityArt, Design, and
MediaMidwest
SNAAP
Institutions
No 5 1% 695 3% 215 1% 955 2%
Yes 979 99% 21,380 97% 14,802 99% 46,687 98%
Total 984 100% 22,075 100% 15,017 100% 47,642 100%
xtimeinstdeg Did not complete degree pursued at this institution 5 1% 682 3% 212 1% 938 2%
No 665 68% 15,425 70% 9,353 62% 31,869 67%
Yes, 1 semester longer 134 14% 2,416 11% 2,129 14% 5,763 12%
Yes, 2 semesters longer 127 13% 1,981 9% 1,923 13% 5,212 11%
Yes, 3 semesters longer 14 1% 383 2% 448 3% 1,131 2%
Yes, 2 years longer 17 2% 451 2% 456 3% 1,181 2%
Yes, more than 2 years longer 16 2% 655 3% 466 3% 1,391 3%
Total 978 100% 21,993 100% 14,987 100% 47,485 100%
4. Did you complete your undergraduate degree pursued
at this institution?
compinstdeg
5. Did you spend more than the recommended time to
complete your undergraduate degree from this
institution?
aTotal may not sum to 100% as respondents could select more than one category.
bAlumni from Canadian institutions did not receive this option/question. 35

Undergraduate Level
Variable Response Options Count % Count % Count % Count %
SNAAP 2012 Frequency Report • EducationSample University
Undergraduate Level
Sample UniversityArt, Design, and
MediaMidwest
SNAAP
Institutions
outdeg_none Did not pursue any degrees outside of this institution 459 49% 9,434 44% 6,193 43% 19,813 43%
outdeg_Cert Certificate 106 11% 2,259 11% 1,303 9% 4,672 10%
outdeg_Assoc Associate Degree 49 5% 1,754 8% 934 6% 3,297 7%
outdeg_BA BA 46 5% 1,665 8% 768 5% 2,744 6%
outdeg_BArch B Arch 1 0% 115 1% 56 0% 168 0%
outdeg_BFA BFA 54 6% 1,262 6% 427 3% 1,670 4%
outdeg_BM BM or B Mus 0 0% 16 0% 81 1% 236 1%
outdeg_BS BS 21 2% 685 3% 424 3% 1,200 3%
outdeg_othUG Other undergraduate degree 15 2% 709 3% 421 3% 1,376 3%
outdeg_AD Artist Diplomab 0 0% 83 0% 75 1% 220 0%
outdeg_MA MA 90 10% 1,449 7% 1,423 10% 4,361 9%
outdeg_MArch M Arch 2 0% 290 1% 211 1% 461 1%
outdeg_MBA MBA 17 2% 326 2% 361 2% 949 2%
outdeg_MFA MFA 112 12% 2,233 10% 1,228 8% 3,748 8%
outdeg_MM MM or M Mus 1 0% 7 0% 717 5% 1,645 4%
outdeg_MS MS 25 3% 573 3% 580 4% 1,682 4%
outdeg_DMA DMA 0 0% 2 0% 127 1% 335 1%
outdeg_JD JD 4 0% 106 0% 146 1% 540 1%
outdeg_MD MD or DO 0 0% 37 0% 32 0% 128 0%
outdeg_PhD PhD 16 2% 287 1% 344 2% 1,052 2%
outdeg_othGR Other graduate degree 51 5% 1,237 6% 1,138 8% 3,513 8%
Totala - - - - - - - -
6. Degrees or credentials pursued during lifetime at an
institution other than this institution
aTotal may not sum to 100% as respondents could select more than one category.
bAlumni from Canadian institutions did not receive this option/question. 36

Undergraduate Level
Variable Response Options Count % Count % Count % Count %
SNAAP 2012 Frequency Report • EducationSample University
Undergraduate Level
Sample UniversityArt, Design, and
MediaMidwest
SNAAP
Institutions
compoutCert Did not pursue any degrees outside of this institution 457 49% 9,396 44% 6,172 43% 19,728 43%
Did not pursue a certificate 371 40% 9,554 45% 7,006 48% 21,454 47%
No 18 2% 344 2% 167 1% 632 1%
Yes 84 9% 1,761 8% 1,018 7% 3,689 8%
In progress 9 1% 163 1% 118 1% 386 1%
Total 939 100% 21,218 100% 14,481 100% 45,889 100%
Did not pursue any degrees outside of this institution 457 49% 9,396 44% 6,172 43% 19,728 43%
Did not pursue an associate degree 428 45% 10,047 47% 7,372 51% 22,800 50%
No 15 2% 384 2% 202 1% 663 1%
Yes 42 4% 1,413 7% 730 5% 2,695 6%
In progress 0 0% 48 0% 41 0% 110 0%
Total 942 100% 21,288 100% 14,517 100% 45,996 100%
Did not pursue any degrees outside of this institution 457 48% 9,396 44% 6,172 43% 19,728 43%
Did not pursue a BA 431 46% 10,133 48% 7,535 52% 23,344 51%
No 39 4% 814 4% 479 3% 1,598 3%
Yes 17 2% 900 4% 316 2% 1,249 3%
In progress 0 0% 32 0% 14 0% 54 0%
Total 944 100% 21,275 100% 14,516 100% 45,973 100%
Did not pursue any degrees outside of this institution 457 48% 9,396 44% 6,172 43% 19,728 43%
Did not pursue a B Arch 476 50% 11,669 55% 8,239 57% 25,902 56%
No 11 1% 190 1% 84 1% 298 1%
Yes 0 0% 30 0% 16 0% 50 0%
In progress 0 0% 0 0% 1 0% 1 0%
Total 944 100% 21,285 100% 14,512 100% 45,979 100%
7.3. BA compoutBA
7. Did you complete this degree pursued at another
institution?
7.1. Certificate
7.2. Associate Degree compoutAssoc
7.4. B Arch compoutBArch
aTotal may not sum to 100% as respondents could select more than one category.
bAlumni from Canadian institutions did not receive this option/question. 37

Undergraduate Level
Variable Response Options Count % Count % Count % Count %
SNAAP 2012 Frequency Report • EducationSample University
Undergraduate Level
Sample UniversityArt, Design, and
MediaMidwest
SNAAP
Institutions
Did not pursue any degrees outside of this institution 457 48% 9,396 44% 6,172 43% 19,728 43%
Did not pursue a BFA 423 45% 10,534 49% 7,872 54% 24,415 53%
No 56 6% 906 4% 329 2% 1,266 3%
Yes 10 1% 436 2% 129 1% 547 1%
In progress 0 0% 17 0% 6 0% 23 0%
Total 946 100% 21,289 100% 14,508 100% 45,979 100%
Did not pursue any degrees outside of this institution 457 48% 9,396 44% 6,172 43% 19,728 43%
Did not pursue a BM or B Mus 477 51% 11,762 55% 8,209 57% 25,825 56%
No 9 1% 116 1% 96 1% 346 1%
Yes 0 0% 1 0% 27 0% 61 0%
In progress 0 0% 0 0% 1 0% 2 0%
Total 943 100% 21,275 100% 14,505 100% 45,962 100%
compoutBS Did not pursue any degrees outside of this institution 457 48% 9,396 44% 6,172 43% 19,728 43%
Did not pursue a BS 456 48% 11,096 52% 7,866 54% 24,861 54%
No 21 2% 365 2% 221 2% 643 1%
Yes 9 1% 383 2% 215 1% 643 1%
In progress 0 0% 29 0% 34 0% 76 0%
Total 943 100% 21,269 100% 14,508 100% 45,951 100%
Did not pursue any degrees outside of this institution 457 48% 9,396 44% 6,172 43% 19,728 43%
Did not pursue another undergraduate degree 462 49% 11,069 52% 7,865 54% 24,678 54%
No 13 1% 290 1% 155 1% 517 1%
Yes 11 1% 426 2% 249 2% 848 2%
In progress 1 0% 46 0% 27 0% 92 0%
Total 944 100% 21,227 100% 14,468 100% 45,863 100%
7. Did you complete this degree pursued at another
institution? (continued)
7.5. BFA
compoutBFA
7.6. BM or B Mus compoutBM
7.7. BS
7.8. Other undergraduate degree compoutothUG
aTotal may not sum to 100% as respondents could select more than one category.
bAlumni from Canadian institutions did not receive this option/question. 38

Undergraduate Level
Variable Response Options Count % Count % Count % Count %
SNAAP 2012 Frequency Report • EducationSample University
Undergraduate Level
Sample UniversityArt, Design, and
MediaMidwest
SNAAP
Institutions
Did not pursue any degrees outside of this institution 457 48% 8,944 45% 6,172 43% 19,276 43%
Did not pursue an Artist Diploma 477 51% 10,957 55% 8,204 57% 25,091 56%
No 9 1% 123 1% 56 0% 215 0%
Yes 0 0% 58 0% 57 0% 167 0%
In progress 0 0% 1 0% 3 0% 11 0%
Total 943 100% 20,083 100% 14,492 100% 44,760 100%
Did not pursue any degrees outside of this institution 457 49% 9,396 44% 6,172 43% 19,728 43%
Did not pursue an MA 389 41% 10,324 49% 6,857 47% 21,685 47%
No 17 2% 242 1% 212 1% 633 1%
Yes 70 7% 1,069 5% 1,056 7% 3,268 7%
In progress 9 1% 220 1% 188 1% 607 1%
Total 942 100% 21,251 100% 14,485 100% 45,921 100%
Did not pursue any degrees outside of this institution 457 48% 9,396 44% 6,172 43% 19,728 43%
Did not pursue an M Arch 475 50% 11,481 54% 8,063 56% 25,570 56%
No 10 1% 131 1% 59 0% 232 1%
Yes 1 0% 225 1% 165 1% 354 1%
In progress 0 0% 33 0% 28 0% 55 0%
Total 943 100% 21,266 100% 14,487 100% 45,939 100%
Did not pursue any degrees outside of this institution 457 48% 9,396 44% 6,172 43% 19,728 43%
Did not pursue an MBA 460 49% 11,443 54% 7,913 55% 25,082 55%
No 14 1% 166 1% 100 1% 335 1%
Yes 7 1% 213 1% 251 2% 634 1%
In progress 5 1% 50 0% 52 0% 151 0%
Total 943 100% 21,268 100% 14,488 100% 45,930 100%
7.10. MA compoutMA
7. Did you complete this degree pursued at another
institution? (continued)
7.9. Artist Diplomab
compoutAD
7.11. M Arch compoutMArch
7.12. MBA compoutMBA
aTotal may not sum to 100% as respondents could select more than one category.
bAlumni from Canadian institutions did not receive this option/question. 39

Undergraduate Level
Variable Response Options Count % Count % Count % Count %
SNAAP 2012 Frequency Report • EducationSample University
Undergraduate Level
Sample UniversityArt, Design, and
MediaMidwest
SNAAP
Institutions
Did not pursue any degrees outside of this institution 457 49% 9,396 44% 6,172 43% 19,728 43%
Did not pursue an MFA 365 39% 9,540 45% 7,045 49% 22,285 49%
No 25 3% 304 1% 175 1% 553 1%
Yes 92 10% 1,800 8% 958 7% 2,934 6%
In progress 3 0% 211 1% 138 1% 417 1%
Total 942 100% 21,251 100% 14,488 100% 45,917 100%
Did not pursue any degrees outside of this institution 457 48% 9,396 44% 6,172 43% 19,728 43%
Did not pursue an MM or M Mus 476 50% 11,758 55% 7,553 52% 24,376 53%
No 9 1% 106 0% 110 1% 346 1%
Yes 1 0% 4 0% 590 4% 1,309 3%
In progress 0 0% 0 0% 57 0% 161 0%
Total 943 100% 21,264 100% 14,482 100% 45,920 100%
Did not pursue any degrees outside of this institution 457 49% 9,396 44% 6,172 43% 19,728 43%
Did not pursue an MS 452 48% 11,192 53% 7,686 53% 24,335 53%
No 13 1% 152 1% 100 1% 332 1%
Yes 19 2% 438 2% 445 3% 1,258 3%
In progress 1 0% 79 0% 76 1% 252 1%
Total 942 100% 21,257 100% 14,479 100% 45,905 100%
Did not pursue any degrees outside of this institution 457 48% 9,396 44% 6,172 43% 19,728 43%
Did not pursue a DMA 477 51% 11,762 55% 8,138 56% 25,675 56%
No 9 1% 104 0% 62 0% 230 1%
Yes 0 0% 0 0% 80 1% 210 0%
In progress 0 0% 0 0% 29 0% 69 0%
Total 943 100% 21,262 100% 14,481 100% 45,912 100%
7. Did you complete this degree pursued at another
institution? (continued)
7.13. MFA
compoutMFA
7.14. MM or M Mus compoutMM
7.15. MS compoutMS
7.16. DMA compoutDMA
aTotal may not sum to 100% as respondents could select more than one category.
bAlumni from Canadian institutions did not receive this option/question. 40

Undergraduate Level
Variable Response Options Count % Count % Count % Count %
SNAAP 2012 Frequency Report • EducationSample University
Undergraduate Level
Sample UniversityArt, Design, and
MediaMidwest
SNAAP
Institutions
Did not pursue any degrees outside of this institution 457 48% 9,396 44% 6,172 43% 19,728 43%
Did not pursue a JD 473 50% 11,658 55% 8,118 56% 25,469 55%
No 9 1% 116 1% 56 0% 227 0%
Yes 4 0% 81 0% 121 1% 425 1%
In progress 0 0% 11 0% 14 0% 67 0%
Total 943 100% 21,262 100% 14,481 100% 45,916 100%
Did not pursue any degrees outside of this institution 457 48% 9,396 44% 6,172 43% 19,728 43%
Did not pursue an MD or DO 477 51% 11,727 55% 8,232 57% 25,880 56%
No 9 1% 111 1% 48 0% 195 0%
Yes 0 0% 17 0% 20 0% 72 0%
In progress 0 0% 6 0% 5 0% 28 0%
Total 943 100% 21,257 100% 14,477 100% 45,903 100%
Did not pursue any degrees outside of this institution 457 48% 9,396 44% 6,172 43% 19,728 43%
Did not pursue a PhD 461 49% 11,477 54% 7,920 55% 24,955 54%
No 11 1% 139 1% 81 1% 311 1%
Yes 11 1% 141 1% 193 1% 590 1%
In progress 3 0% 106 0% 109 1% 317 1%
Total 943 100% 21,259 100% 14,475 100% 45,901 100%
Did not pursue any degrees outside of this institution 457 49% 9,396 44% 6,172 43% 19,728 43%
Did not pursue another graduate degree 426 45% 10,532 50% 7,128 49% 22,498 49%
No 13 1% 216 1% 144 1% 500 1%
Yes 39 4% 883 4% 850 6% 2,574 6%
In progress 6 1% 179 1% 148 1% 491 1%
Total 941 100% 21,206 100% 14,442 100% 45,791 100%
7.20. Other graduate degree compoutothGR
7. Did you complete this degree pursued at another
institution? (continued)
7.17. JD
compoutJD
7.18. MD or DO compoutMD
7.19. PhD compoutPhD
aTotal may not sum to 100% as respondents could select more than one category.
bAlumni from Canadian institutions did not receive this option/question. 41

Undergraduate Level
Variable Response Options Count % Count % Count % Count %
Poor 14 1% 289 1% 168 1% 554 1%
Fair 81 8% 1,759 8% 1,103 7% 3,442 7%
Good 427 44% 8,961 41% 6,062 41% 18,846 40%
Excellent 458 47% 10,844 50% 7,524 51% 24,250 51%
Total 980 100% 21,853 100% 14,857 100% 47,092 100%
Definitely no 41 4% 637 3% 397 3% 1,223 3%
Probably no 102 10% 1,750 8% 1,223 8% 3,691 8%
Uncertain 170 17% 3,436 16% 2,258 15% 6,980 15%
Probably yes 342 35% 7,060 32% 5,102 34% 15,564 33%
Definitely yes 324 33% 9,019 41% 5,902 40% 19,710 42%
Total 979 100% 21,902 100% 14,882 100% 47,168 100%
No 155 16% 2,878 13% 1,931 13% 5,845 12%
Yes 813 84% 18,836 87% 12,852 87% 41,029 88%
Total 968 100% 21,714 100% 14,783 100% 46,874 100%
Very dissatisfied 29 3% 950 4% 515 4% 1,772 4%
Somewhat dissatisfied 94 10% 2,610 12% 1,517 10% 4,945 11%
Somewhat satisfied 391 41% 8,614 40% 5,462 37% 17,217 37%
Very satisfied 390 41% 8,132 38% 6,436 44% 19,728 43%
Not relevant 51 5% 1,044 5% 638 4% 2,395 5%
Total 955 100% 21,350 100% 14,568 100% 46,057 100%
Very dissatisfied 35 4% 1,022 5% 521 4% 2,086 5%
Somewhat dissatisfied 81 9% 2,449 11% 1,645 11% 5,712 12%
Somewhat satisfied 360 38% 7,314 34% 5,276 36% 16,347 36%
Very satisfied 435 46% 9,511 45% 5,842 40% 18,016 39%
Not relevant 34 4% 1,003 5% 1,245 9% 3,778 8%
Total 945 100% 21,299 100% 14,529 100% 45,939 100%
SNAAP 2012 Frequency Report • Institutional Experiences
Sample UniversityArt, Design, and
MediaMidwest
SNAAP
Institutions
Undergraduate Level
Sample University
9. Overall, how would you rate your experience at this
institution while pursuing your undergraduate degree?
instexp
10. If you could start over again, would you attend this
institution?
sameinst
11. Would you recommend this institution to another
student like you?
instadisc12.2. Opportunities to work in different artistic
disciplines from your own
recinst
instperform12. At this institution, satisfaction with:
12.1. Opportunities to perform, exhibit, or
present your work
cResponse options collapsed. See Codebook for details. 42

Undergraduate Level
Variable Response Options Count % Count % Count % Count %
SNAAP 2012 Frequency Report • Institutional Experiences
Sample UniversityArt, Design, and
MediaMidwest
SNAAP
Institutions
Undergraduate Level
Sample University
Very dissatisfied 61 6% 1,184 6% 478 3% 1,760 4%
Somewhat dissatisfied 122 13% 3,220 15% 1,503 10% 4,971 11%
Somewhat satisfied 301 32% 7,927 37% 5,037 35% 15,640 34%
Very satisfied 416 44% 6,952 33% 6,622 46% 20,486 45%
Not relevant 51 5% 1,981 9% 876 6% 3,043 7%
Total 951 100% 21,264 100% 14,516 100% 45,900 100%
Very dissatisfied 43 5% 489 2% 319 2% 943 2%
Somewhat dissatisfied 67 7% 1,565 7% 1,091 8% 3,324 7%
Somewhat satisfied 368 39% 8,018 38% 5,730 39% 17,332 38%
Very satisfied 471 49% 11,166 52% 7,337 51% 24,144 53%
Not relevant 3 0% 56 0% 45 0% 177 0%
Total 952 100% 21,294 100% 14,522 100% 45,920 100%
Very dissatisfied 134 14% 2,845 13% 1,860 13% 5,712 12%
Somewhat dissatisfied 223 23% 5,069 24% 3,334 23% 10,238 22%
Somewhat satisfied 366 38% 7,601 36% 5,191 36% 16,647 36%
Very satisfied 197 21% 4,590 22% 3,622 25% 11,448 25%
Not relevant 32 3% 1,183 6% 534 4% 1,897 4%
Total 952 100% 21,288 100% 14,541 100% 45,942 100%
Very dissatisfied 235 25% 5,092 24% 3,011 21% 9,873 22%
Somewhat dissatisfied 289 30% 6,341 30% 4,076 28% 13,288 29%
Somewhat satisfied 274 29% 5,844 28% 4,550 31% 13,562 30%
Very satisfied 110 12% 2,715 13% 2,218 15% 6,779 15%
Not relevant 45 5% 1,249 6% 636 4% 2,299 5%
Total 953 100% 21,241 100% 14,491 100% 45,801 100%
instcareer
instclass
12.6. Advising about career or further education
12. At this institution, satisfaction with: (continued)
12.3. Opportunities to take non-arts classes
12.4. Instructors in classrooms, labs, and studios
12.5. Academic advising
instlab
instacad
cResponse options collapsed. See Codebook for details. 43

Undergraduate Level
Variable Response Options Count % Count % Count % Count %
SNAAP 2012 Frequency Report • Institutional Experiences
Sample UniversityArt, Design, and
MediaMidwest
SNAAP
Institutions
Undergraduate Level
Sample University
Very dissatisfied 231 24% 4,816 23% 2,923 20% 9,517 21%
Somewhat dissatisfied 254 27% 5,663 27% 3,776 26% 12,158 27%
Somewhat satisfied 237 25% 5,012 24% 3,595 25% 11,052 24%
Very satisfied 140 15% 3,407 16% 2,586 18% 7,877 17%
Not relevant 91 10% 2,341 11% 1,630 11% 5,269 11%
Total 953 100% 21,239 100% 14,510 100% 45,873 100%
Very dissatisfied 153 16% 3,216 15% 2,093 14% 6,763 15%
Somewhat dissatisfied 251 26% 5,682 27% 3,906 27% 12,285 27%
Somewhat satisfied 319 34% 7,197 34% 4,954 34% 15,281 33%
Very satisfied 138 15% 3,449 16% 2,265 16% 7,389 16%
Not relevant 88 9% 1,664 8% 1,273 9% 4,104 9%
Total 949 100% 21,208 100% 14,491 100% 45,822 100%
Very dissatisfied 92 10% 1,889 9% 1,041 7% 3,631 8%
Somewhat dissatisfied 117 12% 3,325 16% 1,999 14% 6,612 14%
Somewhat satisfied 362 38% 7,785 37% 5,114 35% 16,002 35%
Very satisfied 370 39% 7,881 37% 6,151 42% 18,905 41%
Not relevant 13 1% 444 2% 232 2% 810 2%
Total 954 100% 21,324 100% 14,537 100% 45,960 100%
Very dissatisfied 47 5% 1,013 5% 699 5% 2,244 5%
Somewhat dissatisfied 93 10% 2,072 10% 1,536 11% 4,873 11%
Somewhat satisfied 318 33% 6,906 32% 5,265 36% 15,647 34%
Very satisfied 470 49% 10,807 51% 6,613 46% 21,836 48%
Not relevant 22 2% 492 2% 399 3% 1,281 3%
Total 950 100% 21,290 100% 14,512 100% 45,881 100%
instnetwk
instattach
12.8. Opportunities to network with alumni and
others
12.9. Sense of belonging and attachment
instintn12. At this institution, satisfaction with: (continued)
12.7. Opportunities for degree-related
internships or work
12.10. Freedom and encouragement to take
risks
instfreedom
cResponse options collapsed. See Codebook for details. 44

Undergraduate Level
Variable Response Options Count % Count % Count % Count %
SNAAP 2012 Frequency Report • Institutional Experiences
Sample UniversityArt, Design, and
MediaMidwest
SNAAP
Institutions
Undergraduate Level
Sample University
Not well at all 26 3% 695 3% 360 2% 1,238 3%
Not too well 86 9% 1,849 9% 1,077 7% 3,491 8%
Fairly well 244 26% 5,025 23% 3,591 25% 11,339 25%
Very well 227 24% 5,565 26% 4,898 34% 14,372 31%
Did not pursue further education 373 39% 8,255 39% 4,661 32% 15,684 34%
Total 956 100% 21,389 100% 14,587 100% 46,124 100%
Not at all 10 1% 505 2% 272 2% 1,006 2%
Very little 71 7% 1,956 9% 1,298 9% 4,120 9%
Some 344 36% 7,838 37% 5,961 41% 17,856 39%
Very much 524 55% 10,816 51% 6,883 48% 22,535 50%
Total 949 100% 21,115 100% 14,414 100% 45,517 100%
Not at all 11 1% 442 2% 197 1% 726 2%
Very little 91 10% 2,485 12% 1,129 8% 3,999 9%
Some 431 46% 9,632 46% 5,857 41% 18,805 41%
Very much 412 44% 8,485 40% 7,216 50% 21,910 48%
Total 945 100% 21,044 100% 14,399 100% 45,440 100%
Not at all 13 1% 251 1% 187 1% 549 1%
Very little 59 6% 1,447 7% 981 7% 3,070 7%
Some 336 36% 7,520 36% 5,784 40% 17,221 38%
Very much 535 57% 11,849 56% 7,422 52% 24,539 54%
Total 943 100% 21,067 100% 14,374 100% 45,379 100%
Not at all 8 1% 201 1% 154 1% 500 1%
Very little 46 5% 972 5% 799 6% 2,554 6%
Some 254 27% 5,533 26% 4,683 32% 13,902 31%
Very much 636 67% 14,420 68% 8,782 61% 28,559 63%
Total 944 100% 21,126 100% 14,418 100% 45,515 100%
13. How well did this institution prepare you for your
further education?
edprep
14. How much this institution helped you acquire or
develop:
14.1. Critical thinking and analysis of
arguments and information
instanaly
14.2. Broad knowledge and education instbroad
14.3. Improved work based on feedback from
others
instrev
14.4. Creative thinking and problem solving instcreative
cResponse options collapsed. See Codebook for details. 45

Undergraduate Level
Variable Response Options Count % Count % Count % Count %
SNAAP 2012 Frequency Report • Institutional Experiences
Sample UniversityArt, Design, and
MediaMidwest
SNAAP
Institutions
Undergraduate Level
Sample University
Not at all 52 5% 1,333 6% 699 5% 2,444 5%
Very little 217 23% 4,904 23% 3,007 21% 9,713 21%
Some 423 45% 9,089 43% 6,468 45% 19,739 43%
Very much 258 27% 5,782 27% 4,234 29% 13,619 30%
Total 950 100% 21,108 100% 14,408 100% 45,515 100%
Not at all 71 8% 2,429 12% 921 6% 3,503 8%
Very little 289 31% 6,304 30% 3,174 22% 10,592 23%
Some 406 43% 8,422 40% 6,268 44% 18,913 42%
Very much 180 19% 3,938 19% 4,039 28% 12,458 27%
Total 946 100% 21,093 100% 14,402 100% 45,466 100%
Not at all 116 12% 2,992 14% 1,356 9% 5,007 11%
Very little 287 30% 6,394 30% 3,898 27% 12,684 28%
Some 378 40% 7,738 37% 5,910 41% 17,473 38%
Very much 166 18% 3,978 19% 3,245 23% 10,321 23%
Total 947 100% 21,102 100% 14,409 100% 45,485 100%
Not at all 102 11% 2,779 13% 1,403 10% 4,997 11%
Very little 228 24% 5,167 24% 3,154 22% 10,348 23%
Some 360 38% 7,615 36% 5,552 39% 16,980 37%
Very much 261 27% 5,531 26% 4,288 30% 13,119 29%
Total 951 100% 21,092 100% 14,397 100% 45,444 100%
Not at all 63 7% 1,618 8% 1,163 8% 4,279 10%
Very little 170 19% 3,742 18% 2,912 21% 9,540 21%
Some 398 43% 8,400 41% 5,999 42% 18,185 41%
Very much 287 31% 6,807 33% 4,088 29% 12,555 28%
Total 918 100% 20,567 100% 14,162 100% 44,559 100%
14.7. Persuasive speaking instspeak
14.8. Project management skills instmanag
14. How much this institution helped you acquire or
develop: (continued)
14.5. Research skills
instresearch
14.6. Clear writing instwrite
14.9. Technological skills insttech
cResponse options collapsed. See Codebook for details. 46

Undergraduate Level
Variable Response Options Count % Count % Count % Count %
SNAAP 2012 Frequency Report • Institutional Experiences
Sample UniversityArt, Design, and
MediaMidwest
SNAAP
Institutions
Undergraduate Level
Sample University
Not at all 13 1% 275 1% 192 1% 828 2%
Very little 61 7% 1,116 5% 814 6% 2,673 6%
Some 330 36% 6,291 31% 4,554 32% 14,219 32%
Very much 512 56% 12,843 63% 8,571 61% 26,744 60%
Total 916 100% 20,525 100% 14,131 100% 44,464 100%
Not at all 352 38% 8,746 42% 5,024 35% 16,993 38%
Very little 388 42% 8,169 40% 5,821 41% 17,876 40%
Some 167 18% 3,137 15% 2,755 19% 8,022 18%
Very much 16 2% 552 3% 553 4% 1,671 4%
Total 923 100% 20,604 100% 14,153 100% 44,562 100%
Not at all 348 38% 7,954 39% 4,886 35% 16,059 36%
Very little 336 37% 7,890 39% 5,663 40% 17,270 39%
Some 186 20% 3,644 18% 2,793 20% 8,645 19%
Very much 45 5% 993 5% 735 5% 2,366 5%
Total 915 100% 20,481 100% 14,077 100% 44,340 100%
Not at all 71 8% 1,800 9% 808 6% 2,910 7%
Very little 193 21% 4,303 21% 2,222 16% 7,408 17%
Some 400 43% 9,018 44% 6,007 42% 18,467 41%
Very much 256 28% 5,480 27% 5,137 36% 15,825 35%
Total 920 100% 20,601 100% 14,174 100% 44,610 100%
Not at all 132 15% 3,488 17% 1,449 10% 5,476 12%
Very little 262 29% 5,917 29% 3,151 22% 10,574 24%
Some 364 40% 7,653 37% 5,737 41% 17,316 39%
Very much 152 17% 3,520 17% 3,812 27% 11,185 25%
Total 910 100% 20,578 100% 14,149 100% 44,551 100%
instentr
14.13. Interpersonal relations and working
collaboratively
instwkoth
14.14. Leadership skills instleader
14. How much this institution helped you acquire or
develop: (continued)
14.10. Artistic technique
instartistic
14.11. Financial and business management skills instbus
14.12. Entrepreneurial skills
cResponse options collapsed. See Codebook for details. 47

Undergraduate Level
Variable Response Options Count % Count % Count % Count %
SNAAP 2012 Frequency Report • Institutional Experiences
Sample UniversityArt, Design, and
MediaMidwest
SNAAP
Institutions
Undergraduate Level
Sample University
Not at all 143 16% 3,355 16% 1,699 12% 5,986 13%
Very little 284 31% 6,276 30% 3,992 28% 12,557 28%
Some 352 38% 7,689 37% 5,627 40% 17,238 39%
Very much 140 15% 3,284 16% 2,847 20% 8,822 20%
Total 919 100% 20,604 100% 14,165 100% 44,603 100%
Not at all 230 25% 5,336 26% 2,567 18% 9,098 20%
Very little 283 31% 5,974 29% 3,554 25% 11,726 26%
Some 274 30% 6,142 30% 4,614 33% 14,357 32%
Very much 134 15% 3,124 15% 3,412 24% 9,363 21%
Total 921 100% 20,576 100% 14,147 100% 44,544 100%
Never 335 36% 8,032 39% 4,124 29% 14,130 32%
Rarely 311 33% 6,189 30% 4,340 31% 13,217 30%
Sometimes 222 24% 4,820 23% 4,144 29% 12,415 28%
Often 67 7% 1,776 9% 1,602 11% 5,032 11%
Total 935 100% 20,817 100% 14,210 100% 44,794 100%
Never 243 26% 8,306 40% 3,961 28% 13,894 31%
Rarely 251 27% 5,302 26% 3,094 22% 10,274 23%
Sometimes 226 24% 4,085 20% 3,229 23% 9,737 22%
Often 213 23% 3,054 15% 3,899 27% 10,771 24%
Total 933 100% 20,747 100% 14,183 100% 44,676 100%
Never 32 3% 1,343 6% 702 5% 2,387 5%
Rarely 165 18% 3,116 15% 2,353 17% 6,901 15%
Sometimes 395 42% 7,495 36% 5,409 38% 16,563 37%
Often 346 37% 8,887 43% 5,757 40% 18,983 42%
Total 938 100% 20,841 100% 14,221 100% 44,834 100%
14. How much this institution helped you acquire or
develop: (continued)
14.15. Networking and relationship building
instnetrel
14.16. Teaching skills instteach
15. How often you did the following while enrolled at
this institution:
15.1. Participated in community service
actcomser
15.2. Participated in co-curricular activities
(organizations, campus publications, student
government, fraternity or sorority, sports)
actcocurr
15.3. Had serious conversations with students who
are different from you in terms of their ethnicity,
religious beliefs, political opinions, or personal
values
actdiv
cResponse options collapsed. See Codebook for details. 48
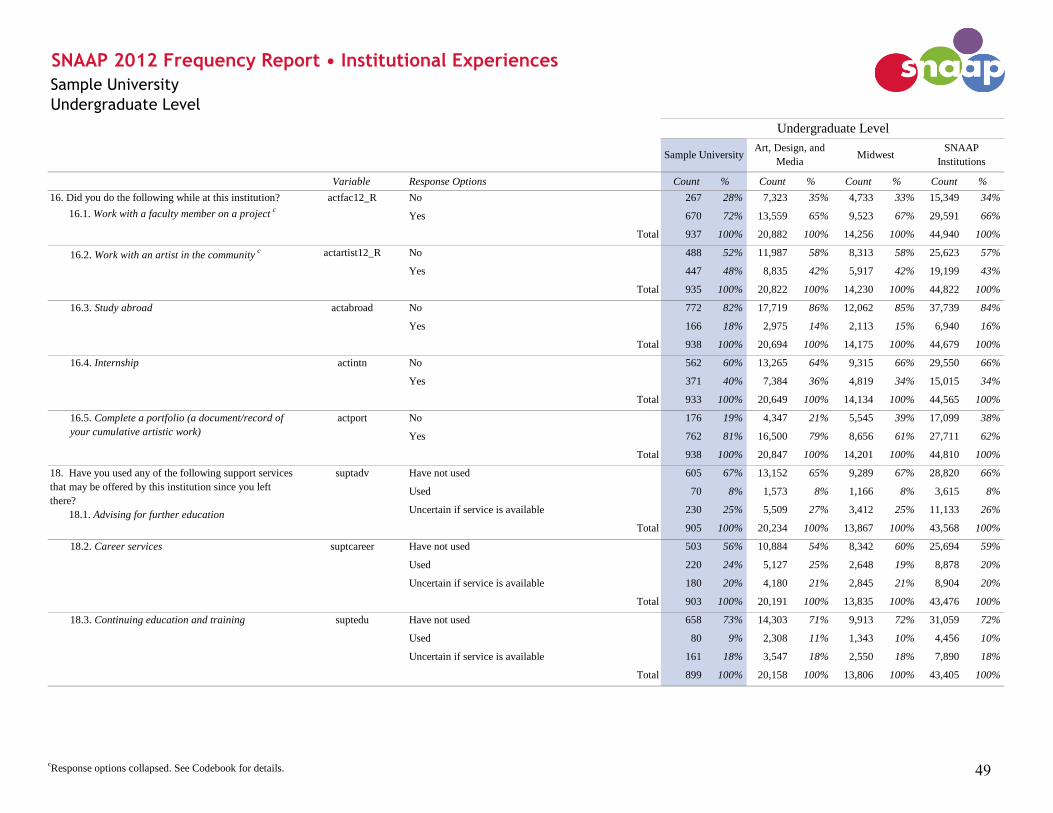
Undergraduate Level
Variable Response Options Count % Count % Count % Count %
SNAAP 2012 Frequency Report • Institutional Experiences
Sample UniversityArt, Design, and
MediaMidwest
SNAAP
Institutions
Undergraduate Level
Sample University
No 267 28% 7,323 35% 4,733 33% 15,349 34%
Yes 670 72% 13,559 65% 9,523 67% 29,591 66%
Total 937 100% 20,882 100% 14,256 100% 44,940 100%
No 488 52% 11,987 58% 8,313 58% 25,623 57%
Yes 447 48% 8,835 42% 5,917 42% 19,199 43%
Total 935 100% 20,822 100% 14,230 100% 44,822 100%
No 772 82% 17,719 86% 12,062 85% 37,739 84%
Yes 166 18% 2,975 14% 2,113 15% 6,940 16%
Total 938 100% 20,694 100% 14,175 100% 44,679 100%
No 562 60% 13,265 64% 9,315 66% 29,550 66%
Yes 371 40% 7,384 36% 4,819 34% 15,015 34%
Total 933 100% 20,649 100% 14,134 100% 44,565 100%
No 176 19% 4,347 21% 5,545 39% 17,099 38%
Yes 762 81% 16,500 79% 8,656 61% 27,711 62%
Total 938 100% 20,847 100% 14,201 100% 44,810 100%
suptadv Have not used 605 67% 13,152 65% 9,289 67% 28,820 66%
Used 70 8% 1,573 8% 1,166 8% 3,615 8%
Uncertain if service is available 230 25% 5,509 27% 3,412 25% 11,133 26%
Total 905 100% 20,234 100% 13,867 100% 43,568 100%
suptcareer Have not used 503 56% 10,884 54% 8,342 60% 25,694 59%
Used 220 24% 5,127 25% 2,648 19% 8,878 20%
Uncertain if service is available 180 20% 4,180 21% 2,845 21% 8,904 20%
Total 903 100% 20,191 100% 13,835 100% 43,476 100%
suptedu Have not used 658 73% 14,303 71% 9,913 72% 31,059 72%
Used 80 9% 2,308 11% 1,343 10% 4,456 10%
Uncertain if service is available 161 18% 3,547 18% 2,550 18% 7,890 18%
Total 899 100% 20,158 100% 13,806 100% 43,405 100%
18. Have you used any of the following support services
that may be offered by this institution since you left
there?
18.1. Advising for further education
18.2. Career services
18.3. Continuing education and training
16. Did you do the following while at this institution?
16.1. Work with a faculty member on a projectc
16.5. Complete a portfolio (a document/record of
your cumulative artistic work)
actport
16.4. Internship actintn
actfac12_R
16.2. Work with an artist in the communityc actartist12_R
16.3. Study abroad actabroad
cResponse options collapsed. See Codebook for details. 49

Undergraduate Level
Variable Response Options Count % Count % Count % Count %
SNAAP 2012 Frequency Report • Institutional Experiences
Sample UniversityArt, Design, and
MediaMidwest
SNAAP
Institutions
Undergraduate Level
Sample University
suptnetwk Have not used 484 54% 10,526 52% 7,505 55% 23,481 54%
Used 239 27% 5,784 29% 3,821 28% 12,050 28%
Uncertain if service is available 174 19% 3,809 19% 2,437 18% 7,751 18%
Total 897 100% 20,119 100% 13,763 100% 43,282 100%
suptart Have not used 542 60% 11,936 59% 8,615 63% 26,408 61%
Used 123 14% 3,090 15% 1,686 12% 5,434 13%
Uncertain if service is available 236 26% 5,108 25% 3,477 25% 11,508 27%
Total 901 100% 20,134 100% 13,778 100% 43,350 100%
suptteach Have not used 453 50% 9,267 46% 6,249 45% 19,808 46%
Used 249 28% 5,941 30% 4,764 35% 14,054 32%
Uncertain if service is available 199 22% 4,923 24% 2,772 20% 9,473 22%
Total 901 100% 20,131 100% 13,785 100% 43,335 100%
18.6. Continued access to mentors and teachers
18. Have you used any of the following support services
that may be offered by this institution since you left
there? (continued)
18.4. Networking opportunities
18.5. Opportunities or resources to present artistic
work
cResponse options collapsed. See Codebook for details. 50

Undergraduate Level
Variable Response Options Count % Count % Count % Count %
jobtime Obtained work prior to leaving this institution 251 28% 6,296 31% 4,109 30% 12,960 30%
Obtained work in less than four months 286 32% 6,228 31% 4,371 32% 13,865 32%
Obtained work in four to twelve months 164 18% 3,118 15% 2,007 14% 6,610 15%
Obtained work after more than a year 77 9% 1,652 8% 1,026 7% 3,118 7%
Have not yet found work 23 3% 656 3% 386 3% 1,145 3%
Did not search for work after leaving program 20 2% 501 2% 271 2% 949 2%
Pursued further education 83 9% 1,791 9% 1,706 12% 4,953 11%
Total 904 100% 20,242 100% 13,876 100% 43,600 100%
jobtrain Have not yet found work 23 3% 650 3% 382 3% 1,134 3%
Did not search for work after leaving program 20 2% 499 2% 271 2% 943 2%
Pursued further education 82 9% 1,784 9% 1,701 12% 4,932 11%
Not related 149 16% 3,093 15% 2,243 16% 7,923 18%
Somewhat related 184 20% 4,523 22% 2,541 18% 8,601 20%
Closely related 452 50% 9,757 48% 6,764 49% 20,155 46%
Total 910 100% 20,306 100% 13,902 100% 43,688 100%
20. After leaving your program at this institution, how
long did it take for you to obtain your first job or work
experience?
21. How closely related was your first job or work
experience to your training at this institution?d
SNAAP 2012 Frequency Report • Career
Sample UniversityArt, Design, and
MediaMidwest
SNAAP
Institutions
Undergraduate Level
Sample University
aTotal may not sum to 100% since respondents could select more than one category.
dFor the frequencies of only those who received this question, see the "Data Highlights" Report. 51

Undergraduate Level
Variable Response Options Count % Count % Count % Count %
SNAAP 2012 Frequency Report • Career
Sample UniversityArt, Design, and
MediaMidwest
SNAAP
Institutions
Undergraduate Level
Sample University
nartjob_none Never worked outside of the arts 157 17% 3,369 17% 1,836 13% 5,876 14%
nartjob_maintn Building, maintenance, installation, and repair 124 14% 2,939 15% 1,725 13% 5,053 12%
nartjob_comm Communications 290 32% 5,810 29% 3,802 28% 12,740 30%
nartjob_comput Computer and mathematics 95 11% 1,649 8% 1,200 9% 3,897 9%
nartjob_construct Construction 97 11% 2,869 14% 1,592 12% 4,755 11%
nartjob_edu Education, training, and library 317 35% 6,939 35% 5,171 38% 16,472 38%
nartjob_engocc Engineering and science 33 4% 705 4% 468 3% 1,306 3%
nartjob_farm Farming, fishing, and forestry 35 4% 853 4% 493 4% 1,516 4%
nartjob_finan Financial and other business services 59 7% 1,258 6% 1,146 8% 3,581 8%
nartjob_food Food preparation related 189 21% 4,936 25% 3,366 25% 10,459 24%
nartjob_hlthtech Healthcare 60 7% 1,216 6% 967 7% 3,040 7%
nartjob_humres Human resources 26 3% 564 3% 552 4% 1,715 4%
nartjob_legal Legal 13 1% 476 2% 399 3% 1,602 4%
nartjob_manag Management 124 14% 2,952 15% 2,145 16% 6,755 16%
nartjob_manfact Manufacturing 81 9% 1,584 8% 978 7% 2,679 6%
nartjob_military Military and protective services 35 4% 554 3% 464 3% 1,221 3%
nartjob_office Office and administrative support 172 19% 4,741 24% 3,528 26% 11,944 28%
nartjob_sales Sales 264 29% 5,952 30% 4,313 31% 13,015 30%
nartjob_care Services and personal care 78 9% 1,960 10% 1,385 10% 4,503 10%
nartjob_socialser Social services 52 6% 1,063 5% 894 7% 2,717 6%
nartjob_transport Transportation and material moving 28 3% 772 4% 492 4% 1,455 3%
nartjob_othnart Other occupations outside of the arts 145 16% 3,189 16% 2,211 16% 7,086 16%
Totala - - - - - - - -
22. Occupations outside of the arts in which you have
worked, now or in the past
aTotal may not sum to 100% since respondents could select more than one category.
dFor the frequencies of only those who received this question, see the "Data Highlights" Report. 52

Undergraduate Level
Variable Response Options Count % Count % Count % Count %
SNAAP 2012 Frequency Report • Career
Sample UniversityArt, Design, and
MediaMidwest
SNAAP
Institutions
Undergraduate Level
Sample University
Yes, I do this currently 155 17% 3,806 19% 3,312 24% 9,596 22%
Yes, I have done it in the past, but no longer do 268 30% 6,007 30% 4,001 29% 12,761 29%
No, I have not done this 483 53% 10,355 51% 6,491 47% 20,990 48%
Total 906 100% 20,168 100% 13,804 100% 43,347 100%
Yes, I do this currently 117 13% 3,049 15% 2,169 16% 6,635 15%
Yes, I have done it in the past, but no longer do 179 20% 3,933 20% 2,656 19% 8,502 20%
No, I have not done this 606 67% 13,094 65% 8,935 65% 28,072 65%
Total 902 100% 20,076 100% 13,760 100% 43,209 100%
Yes, I do this currently 523 58% 12,180 60% 7,167 52% 22,979 53%
Yes, I have done it in the past, but no longer do 177 19% 3,870 19% 2,883 21% 9,116 21%
No, I have not done this 208 23% 4,143 21% 3,762 27% 11,309 26%
Total 908 100% 20,193 100% 13,812 100% 43,404 100%
24. Have you ever worked, either full- or part-time,
managing or administering programs or people for an
arts or arts-related organization or business?
artsrel
25. Have you ever worked, either full- or part-time, in an
occupation as an artist (where you create or perform your
art)?
artist
23. Have you ever worked as a full- or part-time teacher
of the arts (i.e., classroom setting or private lessons)?
teach
aTotal may not sum to 100% since respondents could select more than one category.
dFor the frequencies of only those who received this question, see the "Data Highlights" Report. 53

Undergraduate Level
Variable Response Options Count % Count % Count % Count %
SNAAP 2012 Frequency Report • Career
Sample UniversityArt, Design, and
MediaMidwest
SNAAP
Institutions
Undergraduate Level
Sample University
26. Occupations associated with the arts in which you
have worked, now or in the past artjob_none Never worked in an occupation associated with the arts 64 7% 941 5% 1,056 8% 3,115 7%
Architecture: artjob_arch Architect 23 3% 1,920 10% 1,060 8% 2,804 7%
Arts Administration: artjob_artadm Arts administrator or manager 115 13% 2,800 14% 2,096 15% 6,795 16%
artjob_curator Museum or gallery worker, including curator 129 14% 3,518 18% 1,543 11% 5,392 13%
Design: artjob_graphicdes Graphic designer, illustrator, or art director 470 52% 9,416 47% 4,010 29% 13,969 33%
artjob_intdes Interior designer 60 7% 1,976 10% 910 7% 2,926 7%
artjob_webdes Web designer 191 21% 3,361 17% 1,553 11% 5,578 13%
artjob_othdes Other designer 159 18% 3,082 15% 1,551 11% 4,803 11%
Education: artjob_tchhied Higher education arts educator 161 18% 3,519 18% 2,218 16% 6,698 16%
artjob_tchk12 K-12 arts educator 152 17% 3,169 16% 3,071 22% 8,765 20%
artjob_prvttch Private teacher of the arts 108 12% 2,822 14% 2,969 22% 8,495 20%
artjob_othtch Other arts educator 79 9% 2,102 11% 1,245 9% 4,048 9%
Fine and Media Arts: artjob_craft Craft artist 132 15% 3,452 17% 1,593 12% 5,225 12%
artjob_finart Fine artist 273 30% 6,895 34% 2,787 20% 9,483 22%
artjob_film Film, TV, video artist 111 12% 2,455 12% 1,261 9% 5,157 12%
artjob_animator Multi-media artist or animator 87 10% 1,903 10% 742 5% 2,896 7%
artjob_photo Photographer 202 22% 4,225 21% 1,807 13% 6,455 15%
Performance: artjob_actor Actor 27 3% 706 4% 1,010 7% 3,659 9%
artjob_choreo Dancer or choreographer 10 1% 337 2% 602 4% 1,922 4%
artjob_sound Engineer or technician (sound, light, other) 21 2% 449 2% 526 4% 1,643 4%
artjob_musician Musician 38 4% 1,053 5% 2,738 20% 7,281 17%
artjob_stage Theater and stage director or producer 20 2% 438 2% 800 6% 2,643 6%
Writing: artjob_writer Writer, author, or editor 166 18% 3,608 18% 2,217 16% 7,974 19%
Other: artjob_othart Other arts occupation 103 11% 2,847 14% 1,795 13% 5,993 14%
Totala - - - - - - - -
aTotal may not sum to 100% since respondents could select more than one category.
dFor the frequencies of only those who received this question, see the "Data Highlights" Report. 54

Undergraduate Level
Variable Response Options Count % Count % Count % Count %
SNAAP 2012 Frequency Report • Career
Sample UniversityArt, Design, and
MediaMidwest
SNAAP
Institutions
Undergraduate Level
Sample University
intart No 74 8% 1,613 8% 2,439 18% 7,184 17%
Yes 830 92% 18,478 92% 11,309 82% 35,957 83%
Total 904 100% 20,091 100% 13,748 100% 43,141 100%
stp_curart Currently a professional artist 521 64% 12,106 65% 7,131 55% 22,828 56%
stp_nevint Never intended to work as an artist and never did 28 3% 832 4% 1,314 10% 3,908 10%
stp_nowk Artistic work not available 119 15% 2,617 14% 1,804 14% 5,812 14%
stp_pay Higher pay or steadier income in other fields 150 18% 3,158 17% 2,392 18% 7,838 19%
stp_city Current location not conducive to artistic career 44 5% 985 5% 840 6% 2,500 6%
stp_inter Change in interests 79 10% 1,306 7% 1,238 10% 3,703 9%
stp_fam Family-related reasons 65 8% 1,030 6% 871 7% 2,703 7%
stp_netwk Lack of access to important networks and people 67 8% 1,552 8% 989 8% 3,484 9%
stp_debt Debt (including student loans) 79 10% 1,863 10% 1,142 9% 3,669 9%
stp_suppt Lack of social support from family and friends 28 3% 578 3% 321 2% 1,252 3%
Totala - - - - - - - -
yrsart Never worked as a professional artist 204 23% 4,077 20% 3,704 27% 11,145 26%
Less than one year 36 4% 959 5% 668 5% 2,099 5%
1 to less than 3 years 86 10% 1,866 9% 1,261 9% 4,079 10%
3 to less than 5 years 73 8% 1,529 8% 1,014 7% 3,394 8%
5 to less than 10 years 112 13% 2,469 12% 1,642 12% 5,136 12%
10 to less than 15 years 61 7% 1,966 10% 1,205 9% 3,939 9%
15 or more years 322 36% 7,037 35% 4,131 30% 12,983 30%
Total 894 100% 19,903 100% 13,625 100% 42,775 100%
wkself Yes, I do this currently 410 46% 10,136 51% 5,803 43% 19,481 45%
Yes, I have done it in the past, but no longer do 308 34% 6,311 32% 4,069 30% 13,053 30%
No, I have not done this 180 20% 3,499 18% 3,779 28% 10,312 24%
Total 898 100% 19,946 100% 13,651 100% 42,846 100%
31. Have you ever been self-employed, an independent
contractor, or a freelance worker?
28. Why did you either stop working in an occupation as
an artist or choose not to pursue work as an artist?d
27. When you began at this institution did you intend to
work eventually in an occupation as an artist?
30. Approximately how many years have you worked (or
did you work) in an occupation as an artist (where you
create or perform your art)?
aTotal may not sum to 100% since respondents could select more than one category.
dFor the frequencies of only those who received this question, see the "Data Highlights" Report. 55

Undergraduate Level
Variable Response Options Count % Count % Count % Count %
SNAAP 2012 Frequency Report • Career
Sample UniversityArt, Design, and
MediaMidwest
SNAAP
Institutions
Undergraduate Level
Sample University
Never worked as a professional artist 115 13% 2,356 12% 1,631 12% 5,420 13%
Never been self-employed 91 10% 1,783 9% 1,708 13% 4,591 11%
Never self-employed and never a professional artist 89 10% 1,715 9% 2,064 15% 5,709 13%
Yes, I do this currently 356 40% 8,740 44% 4,862 36% 16,250 38%
Yes, I have done it in the past, but no longer do 220 25% 4,914 25% 3,055 22% 9,788 23%
No, I have not done this 23 3% 374 2% 307 2% 974 2%
Total 894 100% 19,882 100% 13,627 100% 42,732 100%
wkfd No 703 85% 15,326 85% 11,011 86% 33,755 85%
Yes 120 15% 2,794 15% 1,767 14% 5,952 15%
Total 823 100% 18,120 100% 12,778 100% 39,707 100%
wkpdint No 557 68% 12,242 67% 9,045 71% 28,043 70%
Yes 266 32% 6,080 33% 3,782 29% 11,775 30%
Total 823 100% 18,322 100% 12,827 100% 39,818 100%
wkupdint No 545 67% 12,097 67% 8,973 71% 26,379 67%
Yes 269 33% 5,909 33% 3,664 29% 13,208 33%
Total 814 100% 18,006 100% 12,637 100% 39,587 100%
artwkfd Never founder of a nonprofit or for-profit organization 698 82% 15,256 80% 10,945 83% 33,568 81%
No 49 6% 1,278 7% 772 6% 2,566 6%
Yes 108 13% 2,562 13% 1,530 12% 5,193 13%
Total 855 100% 19,096 100% 13,247 100% 41,327 100%
artwkpdint Never worked as a paid intern 552 65% 12,172 64% 8,981 68% 27,847 68%
No 45 5% 1,080 6% 870 7% 2,739 7%
Yes 252 30% 5,784 30% 3,309 25% 10,493 26%
Total 849 100% 19,036 100% 13,160 100% 41,079 100%
artwkupdint Never worked as an unpaid intern 538 64% 12,009 64% 8,886 68% 26,141 64%
No 49 6% 1,035 6% 782 6% 2,593 6%
Yes 254 30% 5,656 30% 3,321 26% 11,954 29%
Total 841 100% 18,700 100% 12,989 100% 40,688 100%
artwkself
33. Are you now or have you ever been a(n):
33.1. Founder of a nonprofit or for-profit
organization
33.2. Paid intern
33.3. Unpaid intern
32. In your capacity as an artist, have you ever been self-
employed, an independent contractor, or a freelance
worker?d
34. Was any of your work as a founder of a nonprofit or
for-profit organization arts-related?
35. Was any of your work as a paid intern arts-related?
36. Was any of your work as an unpaid intern arts-
related?
aTotal may not sum to 100% since respondents could select more than one category.
dFor the frequencies of only those who received this question, see the "Data Highlights" Report. 56

Undergraduate Level
Variable Response Options Count % Count % Count % Count %
SNAAP 2012 Frequency Report • Career
Sample UniversityArt, Design, and
MediaMidwest
SNAAP
Institutions
Undergraduate Level
Sample University
hlp_dnrq Never worked as a professional artist 202 23% 3,998 20% 3,622 27% 10,916 26%
hlp_none None of the below is/was very important 45 5% 1,011 5% 858 6% 2,453 6%
hlp_capital Loans, investment capital 197 22% 5,147 26% 2,753 20% 8,805 21%
hlp_grants Prizes, grants, or commissions 315 36% 7,550 38% 3,973 29% 12,913 30%
hlp_netwk Strong network of peers and colleagues 501 56% 11,224 57% 6,556 49% 21,576 51%
hlp_pub Publicity or acknowledgement of your work 416 47% 9,168 46% 4,887 36% 16,305 38%
hlp_space Material resources (e.g., equipment, space) 424 48% 8,790 45% 4,559 34% 15,186 36%
hlp_mentor Mentors and teachers 443 50% 9,901 50% 6,216 46% 19,892 47%
hlp_train Additional training 309 35% 6,927 35% 4,199 31% 13,737 32%
hlp_city Opportunity to live in an artistically vital location 349 39% 8,158 41% 4,716 35% 15,909 38%
hlp_oth Other 35 4% 1,028 5% 578 4% 1,934 5%
Totala - - - - - - - -
bar_dnrq Never worked as a professional artist 202 24% 3,998 21% 3,622 27% 10,916 26%
bar_none None of the below is/was lacking 140 17% 3,359 18% 2,394 18% 7,150 17%
bar_capital Loans, investment capital 185 22% 5,114 27% 2,831 21% 9,866 24%
bar_grants Prizes, grants, or commissions 208 25% 5,452 29% 3,149 24% 10,773 26%
bar_netwk Strong network of peers and colleagues 204 24% 4,877 25% 2,801 21% 9,155 22%
bar_pub Publicity or acknowledgement of your work 208 25% 4,902 26% 2,758 21% 9,349 23%
bar_space Material resources (e.g., equipment, space) 205 24% 5,093 27% 3,062 23% 10,083 24%
bar_mentor Mentors and teachers 184 22% 4,014 21% 2,198 17% 7,541 18%
bar_train Additional training 173 21% 4,047 21% 2,326 18% 7,696 19%
bar_city Opportunity to live in an artistically vital location 138 16% 3,179 17% 2,196 17% 6,569 16%
bar_oth Other 31 4% 819 4% 495 4% 1,680 4%
Totala - - - - - - - -
37. Which of the following resources are very important
for success in your artistic career now or in the past?d
38. Which of these resources have been insufficient,
posing significant barriers to achieving success in your
artistic career (now or in the past)?d
aTotal may not sum to 100% since respondents could select more than one category.
dFor the frequencies of only those who received this question, see the "Data Highlights" Report. 57

Undergraduate Level
Variable Response Options Count % Count % Count % Count %
SNAAP 2012 Frequency Report • Career
Sample UniversityArt, Design, and
MediaMidwest
SNAAP
Institutions
Undergraduate Level
Sample University
wkskillanaly Never worked in any occupation 0 0% 23 0% 14 0% 41 0%
Not at all important 14 2% 247 1% 145 1% 475 1%
Only a little important 24 3% 632 3% 395 3% 1,380 3%
Somewhat important 125 14% 2,859 15% 2,053 15% 6,473 15%
Very important 710 81% 15,713 81% 10,723 80% 33,393 80%
Total 873 100% 19,474 100% 13,330 100% 41,762 100%
wkskillbroad Never worked in any occupation 0 0% 23 0% 14 0% 41 0%
Not at all important 8 1% 190 1% 97 1% 363 1%
Only a little important 26 3% 639 3% 374 3% 1,308 3%
Somewhat important 190 22% 4,287 22% 2,833 21% 9,064 22%
Very important 645 74% 14,291 74% 9,986 75% 30,932 74%
Total 869 100% 19,430 100% 13,304 100% 41,708 100%
wkskillrev Never worked in any occupation 0 0% 23 0% 14 0% 41 0%
Not at all important 8 1% 185 1% 75 1% 309 1%
Only a little important 44 5% 863 4% 378 3% 1,330 3%
Somewhat important 220 25% 4,461 23% 2,568 19% 8,053 19%
Very important 594 69% 13,807 71% 10,226 77% 31,806 77%
Total 866 100% 19,339 100% 13,261 100% 41,539 100%
wkskillcreative Never worked in any occupation 0 0% 23 0% 14 0% 41 0%
Not at all important 5 1% 103 1% 66 0% 212 1%
Only a little important 9 1% 193 1% 149 1% 466 1%
Somewhat important 63 7% 1,240 6% 968 7% 3,022 7%
Very important 798 91% 17,922 92% 12,126 91% 38,042 91%
Total 875 100% 19,481 100% 13,323 100% 41,783 100%
39.4. Creative thinking and problem solving
39.2. Broad knowledge and education
39.3. Improved work based on feedback from
others
39. The importance of the following to perform
effectively in your profession or work life:d
39.1. Critical thinking and analysis of
arguments and information
aTotal may not sum to 100% since respondents could select more than one category.
dFor the frequencies of only those who received this question, see the "Data Highlights" Report. 58

Undergraduate Level
Variable Response Options Count % Count % Count % Count %
SNAAP 2012 Frequency Report • Career
Sample UniversityArt, Design, and
MediaMidwest
SNAAP
Institutions
Undergraduate Level
Sample University
wkskillresearch Never worked in any occupation 0 0% 23 0% 14 0% 41 0%
Not at all important 18 2% 322 2% 261 2% 786 2%
Only a little important 61 7% 1,396 7% 1,301 10% 3,683 9%
Somewhat important 285 33% 5,617 29% 4,162 31% 12,801 31%
Very important 508 58% 12,058 62% 7,551 57% 24,330 58%
Total 872 100% 19,416 100% 13,289 100% 41,641 100%
wkskillwrite Never worked in any occupation 0 0% 23 0% 14 0% 41 0%
Not at all important 21 2% 465 2% 273 2% 925 2%
Only a little important 64 7% 1,583 8% 926 7% 3,126 8%
Somewhat important 222 25% 4,958 26% 3,303 25% 10,123 24%
Very important 564 65% 12,346 64% 8,752 66% 27,392 66%
Total 871 100% 19,375 100% 13,268 100% 41,607 100%
wkskillspeak Never worked in any occupation 0 0% 23 0% 14 0% 41 0%
Not at all important 24 3% 415 2% 257 2% 796 2%
Only a little important 65 8% 1,338 7% 856 6% 2,735 7%
Somewhat important 210 24% 4,617 24% 3,190 24% 9,899 24%
Very important 567 65% 13,000 67% 8,968 68% 28,172 68%
Total 866 100% 19,393 100% 13,285 100% 41,643 100%
wkskillmanag Never worked in any occupation 0 0% 23 0% 14 0% 41 0%
Not at all important 22 3% 344 2% 224 2% 724 2%
Only a little important 22 3% 648 3% 432 3% 1,516 4%
Somewhat important 136 16% 2,881 15% 2,077 16% 6,760 16%
Very important 690 79% 15,497 80% 10,525 79% 32,569 78%
Total 870 100% 19,393 100% 13,272 100% 41,610 100%
39. The importance of the following to perform
effectively in your profession or work life: (continued)d
39.5. Research skills
39.7. Persuasive speaking
39.8. Project management skills
39.6. Clear writing
aTotal may not sum to 100% since respondents could select more than one category.
dFor the frequencies of only those who received this question, see the "Data Highlights" Report. 59
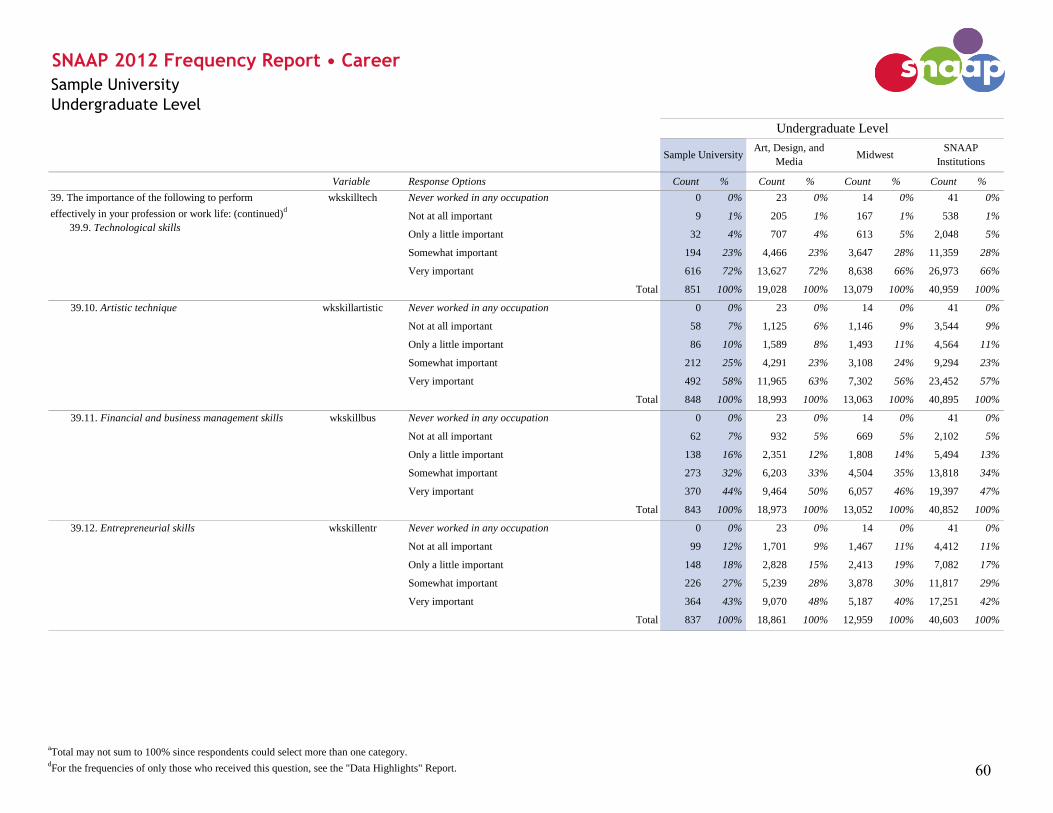
Undergraduate Level
Variable Response Options Count % Count % Count % Count %
SNAAP 2012 Frequency Report • Career
Sample UniversityArt, Design, and
MediaMidwest
SNAAP
Institutions
Undergraduate Level
Sample University
wkskilltech Never worked in any occupation 0 0% 23 0% 14 0% 41 0%
Not at all important 9 1% 205 1% 167 1% 538 1%
Only a little important 32 4% 707 4% 613 5% 2,048 5%
Somewhat important 194 23% 4,466 23% 3,647 28% 11,359 28%
Very important 616 72% 13,627 72% 8,638 66% 26,973 66%
Total 851 100% 19,028 100% 13,079 100% 40,959 100%
wkskillartistic Never worked in any occupation 0 0% 23 0% 14 0% 41 0%
Not at all important 58 7% 1,125 6% 1,146 9% 3,544 9%
Only a little important 86 10% 1,589 8% 1,493 11% 4,564 11%
Somewhat important 212 25% 4,291 23% 3,108 24% 9,294 23%
Very important 492 58% 11,965 63% 7,302 56% 23,452 57%
Total 848 100% 18,993 100% 13,063 100% 40,895 100%
wkskillbus Never worked in any occupation 0 0% 23 0% 14 0% 41 0%
Not at all important 62 7% 932 5% 669 5% 2,102 5%
Only a little important 138 16% 2,351 12% 1,808 14% 5,494 13%
Somewhat important 273 32% 6,203 33% 4,504 35% 13,818 34%
Very important 370 44% 9,464 50% 6,057 46% 19,397 47%
Total 843 100% 18,973 100% 13,052 100% 40,852 100%
wkskillentr Never worked in any occupation 0 0% 23 0% 14 0% 41 0%
Not at all important 99 12% 1,701 9% 1,467 11% 4,412 11%
Only a little important 148 18% 2,828 15% 2,413 19% 7,082 17%
Somewhat important 226 27% 5,239 28% 3,878 30% 11,817 29%
Very important 364 43% 9,070 48% 5,187 40% 17,251 42%
Total 837 100% 18,861 100% 12,959 100% 40,603 100%
39.12. Entrepreneurial skills
39.10. Artistic technique
39. The importance of the following to perform
effectively in your profession or work life: (continued)d
39.9. Technological skills
39.11. Financial and business management skills
aTotal may not sum to 100% since respondents could select more than one category.
dFor the frequencies of only those who received this question, see the "Data Highlights" Report. 60

Undergraduate Level
Variable Response Options Count % Count % Count % Count %
SNAAP 2012 Frequency Report • Career
Sample UniversityArt, Design, and
MediaMidwest
SNAAP
Institutions
Undergraduate Level
Sample University
wkskillwkoth Never worked in any occupation 0 0% 23 0% 14 0% 41 0%
Not at all important 11 1% 187 1% 92 1% 307 1%
Only a little important 33 4% 692 4% 352 3% 1,107 3%
Somewhat important 174 20% 3,627 19% 2,040 16% 6,525 16%
Very important 632 74% 14,461 76% 10,561 81% 32,952 81%
Total 850 100% 18,990 100% 13,059 100% 40,932 100%
wkskillleader Never worked in any occupation 0 0% 23 0% 14 0% 41 0%
Not at all important 18 2% 378 2% 174 1% 643 2%
Only a little important 63 7% 1,264 7% 673 5% 2,262 6%
Somewhat important 230 27% 4,986 26% 3,008 23% 9,885 24%
Very important 530 63% 12,311 65% 9,196 70% 28,041 69%
Total 841 100% 18,962 100% 13,065 100% 40,872 100%
wkskillnetrel Never worked in any occupation 0 0% 23 0% 14 0% 41 0%
Not at all important 13 2% 293 2% 197 2% 572 1%
Only a little important 49 6% 997 5% 610 5% 1,906 5%
Somewhat important 222 26% 4,468 24% 3,033 23% 9,251 23%
Very important 565 67% 13,213 70% 9,217 71% 29,137 71%
Total 849 100% 18,994 100% 13,071 100% 40,907 100%
wkskillteach Never worked in any occupation 0 0% 23 0% 14 0% 41 0%
Not at all important 69 8% 1,616 9% 805 6% 2,871 7%
Only a little important 177 21% 3,982 21% 2,292 18% 7,517 18%
Somewhat important 274 33% 5,967 32% 3,864 30% 12,310 30%
Very important 323 38% 7,349 39% 6,075 47% 18,097 44%
Total 843 100% 18,937 100% 13,050 100% 40,836 100%
39. The importance of the following to perform
effectively in your profession or work life: (continued)d
39.13. Interpersonal relations and working
collaboratively
39.14. Leadership skills
39.15. Networking and relationship building
39.16. Teaching skills
aTotal may not sum to 100% since respondents could select more than one category.
dFor the frequencies of only those who received this question, see the "Data Highlights" Report. 61

Undergraduate Level
Variable Response Options Count % Count % Count % Count %
SNAAP 2012 Frequency Report • Career
Sample UniversityArt, Design, and
MediaMidwest
SNAAP
Institutions
Undergraduate Level
Sample University
infclassmt No influence 291 33% 6,218 32% 4,595 35% 14,179 34%
Minor influence 309 35% 7,191 37% 5,022 38% 15,385 37%
Major influence 242 28% 5,320 28% 3,195 24% 10,550 26%
Not applicable 29 3% 586 3% 383 3% 1,258 3%
Total 871 100% 19,315 100% 13,195 100% 41,372 100%
inffac No influence 220 25% 4,838 25% 3,423 26% 10,850 26%
Minor influence 305 35% 6,106 32% 4,130 31% 13,204 32%
Major influence 317 37% 7,798 40% 5,277 40% 16,137 39%
Not applicable 26 3% 537 3% 337 3% 1,122 3%
Total 868 100% 19,279 100% 13,167 100% 41,313 100%
infstaff No influence 434 50% 9,748 51% 6,432 49% 20,611 50%
Minor influence 286 33% 6,211 32% 4,295 33% 13,257 32%
Major influence 95 11% 2,199 11% 1,841 14% 5,291 13%
Not applicable 49 6% 1,004 5% 577 4% 1,946 5%
Total 864 100% 19,162 100% 13,145 100% 41,105 100%
infartist No influence 425 49% 9,003 47% 6,758 51% 20,679 50%
Minor influence 282 33% 6,138 32% 3,915 30% 12,362 30%
Major influence 96 11% 2,532 13% 1,453 11% 4,792 12%
Not applicable 62 7% 1,531 8% 1,021 8% 3,339 8%
Total 865 100% 19,204 100% 13,147 100% 41,172 100%
infalum No influence 465 54% 10,067 53% 7,221 55% 22,550 55%
Minor influence 253 29% 5,924 31% 3,993 30% 12,218 30%
Major influence 80 9% 1,894 10% 1,159 9% 3,696 9%
Not applicable 67 8% 1,255 7% 737 6% 2,555 6%
Total 865 100% 19,140 100% 13,110 100% 41,019 100%
40.5. Alumni
40. How much influence has each of the following
networks developed at this institution had on your
career?
40.1. Classmates
40.2. Faculty or instructors
40.3. Staff members or advisors
40.4. Guest artists
aTotal may not sum to 100% since respondents could select more than one category.
dFor the frequencies of only those who received this question, see the "Data Highlights" Report. 62
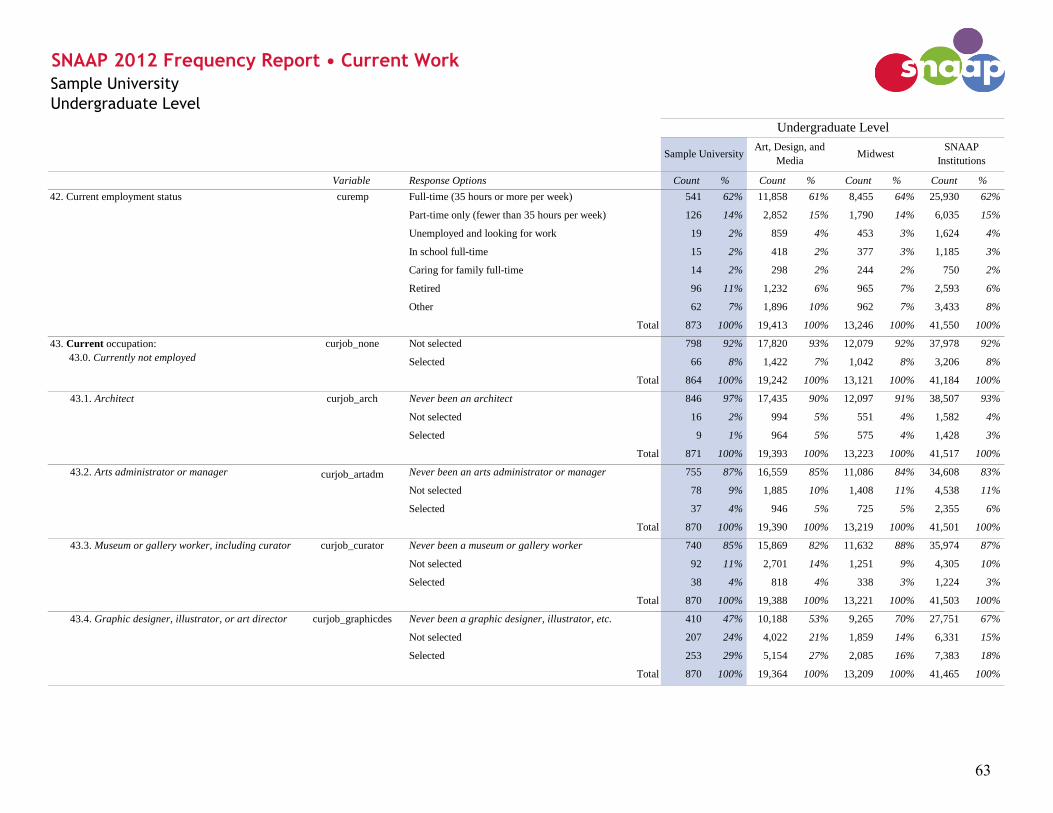
Undergraduate Level
Variable Response Options Count % Count % Count % Count %
curemp Full-time (35 hours or more per week) 541 62% 11,858 61% 8,455 64% 25,930 62%
Part-time only (fewer than 35 hours per week) 126 14% 2,852 15% 1,790 14% 6,035 15%
Unemployed and looking for work 19 2% 859 4% 453 3% 1,624 4%
In school full-time 15 2% 418 2% 377 3% 1,185 3%
Caring for family full-time 14 2% 298 2% 244 2% 750 2%
Retired 96 11% 1,232 6% 965 7% 2,593 6%
Other 62 7% 1,896 10% 962 7% 3,433 8%
Total 873 100% 19,413 100% 13,246 100% 41,550 100%
curjob_none Not selected 798 92% 17,820 93% 12,079 92% 37,978 92%
Selected 66 8% 1,422 7% 1,042 8% 3,206 8%
Total 864 100% 19,242 100% 13,121 100% 41,184 100%
curjob_arch Never been an architect 846 97% 17,435 90% 12,097 91% 38,507 93%
Not selected 16 2% 994 5% 551 4% 1,582 4%
Selected 9 1% 964 5% 575 4% 1,428 3%
Total 871 100% 19,393 100% 13,223 100% 41,517 100%
curjob_artadm Never been an arts administrator or manager 755 87% 16,559 85% 11,086 84% 34,608 83%
Not selected 78 9% 1,885 10% 1,408 11% 4,538 11%
Selected 37 4% 946 5% 725 5% 2,355 6%
Total 870 100% 19,390 100% 13,219 100% 41,501 100%
curjob_curator Never been a museum or gallery worker 740 85% 15,869 82% 11,632 88% 35,974 87%
Not selected 92 11% 2,701 14% 1,251 9% 4,305 10%
Selected 38 4% 818 4% 338 3% 1,224 3%
Total 870 100% 19,388 100% 13,221 100% 41,503 100%
curjob_graphicdes Never been a graphic designer, illustrator, etc. 410 47% 10,188 53% 9,265 70% 27,751 67%
Not selected 207 24% 4,022 21% 1,859 14% 6,331 15%
Selected 253 29% 5,154 27% 2,085 16% 7,383 18%
Total 870 100% 19,364 100% 13,209 100% 41,465 100%
43.1. Architect
43.2. Arts administrator or manager
43.3. Museum or gallery worker, including curator
43.4. Graphic designer, illustrator, or art director
SNAAP 2012 Frequency Report • Current Work
Sample UniversityArt, Design, and
MediaMidwest
SNAAP
Institutions
Undergraduate Level
42. Current employment status
Sample University
43. Current occupation:
43.0. Currently not employed
63

Undergraduate Level
Variable Response Options Count % Count % Count % Count %
SNAAP 2012 Frequency Report • Current Work
Sample UniversityArt, Design, and
MediaMidwest
SNAAP
Institutions
Undergraduate Level
Sample University
curjob_intdes Never been an interior designer 811 93% 17,380 90% 12,238 93% 38,380 92%
Not selected 35 4% 1,214 6% 649 5% 1,956 5%
Selected 24 3% 797 4% 339 3% 1,171 3%
Total 870 100% 19,391 100% 13,226 100% 41,507 100%
curjob_webdes Never been a web designer 683 78% 16,044 83% 11,632 88% 35,853 86%
Not selected 96 11% 1,740 9% 834 6% 3,085 7%
Selected 92 11% 1,619 8% 762 6% 2,588 6%
Total 871 100% 19,403 100% 13,228 100% 41,526 100%
curjob_othdes Never been any other designer 716 82% 16,307 84% 11,616 88% 36,574 88%
Not selected 65 7% 1,306 7% 723 5% 2,252 5%
Selected 88 10% 1,779 9% 883 7% 2,680 6%
Total 869 100% 19,392 100% 13,222 100% 41,506 100%
curjob_tchhied Never been a higher education arts educator 712 82% 15,849 82% 10,962 83% 34,677 84%
Not selected 101 12% 2,140 11% 1,350 10% 4,045 10%
Selected 56 6% 1,397 7% 906 7% 2,777 7%
Total 869 100% 19,386 100% 13,218 100% 41,499 100%
curjob_tchk12 Never been a K-12 arts educator 722 83% 16,226 84% 10,159 77% 32,758 79%
Not selected 88 10% 2,028 10% 1,792 14% 5,288 13%
Selected 59 7% 1,122 6% 1,257 10% 3,413 8%
Total 869 100% 19,376 100% 13,208 100% 41,459 100%
curjob_prvttch Never been a private teacher of the arts 765 88% 16,547 85% 10,245 78% 32,982 80%
Not selected 71 8% 2,001 10% 1,887 14% 5,422 13%
Selected 35 4% 837 4% 1,081 8% 3,076 7%
Total 871 100% 19,385 100% 13,213 100% 41,480 100%
curjob_othtch Never been any other arts educator 792 91% 17,236 89% 11,907 90% 37,267 90%
Not selected 53 6% 1,480 8% 897 7% 2,882 7%
Selected 26 3% 676 3% 419 3% 1,357 3%
Total 871 100% 19,392 100% 13,223 100% 41,506 100%
43. Current occupation: (continued)
43.5. Interior designer
43.6. Web designer
43.7. Other designer
43.8. Higher education arts educator
43.9. K-12 arts educator
43.10. Private teacher of the arts
43.11. Other arts educator
64

Undergraduate Level
Variable Response Options Count % Count % Count % Count %
SNAAP 2012 Frequency Report • Current Work
Sample UniversityArt, Design, and
MediaMidwest
SNAAP
Institutions
Undergraduate Level
Sample University
curjob_craft Never been a craft artist 741 85% 15,946 82% 11,577 88% 36,152 87%
Not selected 74 9% 1,928 10% 928 7% 3,126 8%
Selected 52 6% 1,508 8% 716 5% 2,218 5%
Total 867 100% 19,382 100% 13,221 100% 41,496 100%
curjob_finart Never been a fine artist 602 69% 12,590 65% 10,427 79% 32,024 77%
Not selected 104 12% 2,410 12% 1,130 9% 3,698 9%
Selected 163 19% 4,359 23% 1,645 12% 5,746 14%
Total 869 100% 19,359 100% 13,202 100% 41,468 100%
curjob_film Never been a film, TV, or video artist 763 88% 16,927 87% 11,919 90% 36,263 87%
Not selected 60 7% 1,408 7% 816 6% 3,026 7%
Selected 45 5% 1,063 5% 491 4% 2,216 5%
Total 868 100% 19,398 100% 13,226 100% 41,505 100%
curjob_animator Never been a multi-media artist or animator 783 90% 17,438 90% 12,397 94% 38,400 92%
Not selected 55 6% 1,148 6% 529 4% 1,941 5%
Selected 32 4% 818 4% 304 2% 1,182 3%
Total 870 100% 19,404 100% 13,230 100% 41,523 100%
curjob_photo Never been a photographer 676 78% 15,179 78% 11,373 86% 34,966 84%
Not selected 111 13% 2,229 12% 1,031 8% 3,676 9%
Selected 80 9% 1,972 10% 815 6% 2,852 7%
Total 867 100% 19,380 100% 13,219 100% 41,494 100%
curjob_actor Never been an actor 841 97% 18,595 96% 12,145 92% 37,685 91%
Not selected 27 3% 682 4% 810 6% 2,785 7%
Selected 2 0% 130 1% 271 2% 1,040 3%
Total 870 100% 19,407 100% 13,226 100% 41,510 100%
curjob_choreo Never been a dancer or choreographer 858 99% 18,959 98% 12,549 95% 39,378 95%
Not selected 13 1% 379 2% 500 4% 1,574 4%
Selected 0 0% 72 0% 182 1% 578 1%
Total 871 100% 19,410 100% 13,231 100% 41,530 100%
43.14. Film, TV, video artist
43.15. Multi-media artist or animator
43.16. Photographer
43.18. Dancer or choreographer
43.17. Actor
43. Current occupation: (continued)
43.12. Craft artist
43.13. Fine artist
65

Undergraduate Level
Variable Response Options Count % Count % Count % Count %
SNAAP 2012 Frequency Report • Current Work
Sample UniversityArt, Design, and
MediaMidwest
SNAAP
Institutions
Undergraduate Level
Sample University
curjob_sound Never been an engineer or technician 847 97% 18,853 97% 12,608 95% 39,609 95%
Not selected 18 2% 463 2% 460 3% 1,463 4%
Selected 6 1% 95 0% 161 1% 461 1%
Total 871 100% 19,411 100% 13,229 100% 41,533 100%
curjob_musician Never been a musician 831 95% 18,269 94% 10,463 79% 34,183 82%
Not selected 30 3% 751 4% 1,298 10% 3,563 9%
Selected 10 1% 384 2% 1,454 11% 3,750 9%
Total 871 100% 19,404 100% 13,215 100% 41,496 100%
curjob_stage Never been a theater and stage director or producer 848 97% 18,857 97% 12,336 93% 38,637 93%
Not selected 16 2% 462 2% 637 5% 2,112 5%
Selected 7 1% 91 0% 254 2% 770 2%
Total 871 100% 19,410 100% 13,227 100% 41,519 100%
curjob_writer Never been a writer, author, or editor 706 81% 15,765 81% 10,967 83% 33,478 81%
Not selected 89 10% 1,956 10% 1,282 10% 4,379 11%
Selected 72 8% 1,663 9% 962 7% 3,615 9%
Total 867 100% 19,384 100% 13,211 100% 41,472 100%
curjob_othart Never been in any other arts occupation 771 89% 16,526 85% 11,394 86% 35,418 85%
Not selected 45 5% 1,373 7% 896 7% 3,004 7%
Selected 55 6% 1,492 8% 927 7% 3,067 7%
Total 871 100% 19,391 100% 13,217 100% 41,489 100%
curjob_maintn Never worked in bldg., maint., installation, or repair 749 86% 16,350 84% 11,443 87% 36,311 88%
Not selected 104 12% 2,611 13% 1,545 12% 4,513 11%
Selected 17 2% 424 2% 233 2% 673 2%
Total 870 100% 19,385 100% 13,221 100% 41,497 100%
curjob_comm Never worked in communications 584 67% 13,583 70% 9,456 72% 28,964 70%
Not selected 209 24% 4,251 22% 2,715 21% 8,932 22%
Selected 74 9% 1,535 8% 1,033 8% 3,549 9%
Total 867 100% 19,369 100% 13,204 100% 41,445 100%
43.21. Theater and stage director or producer
43. Current occupation: (continued)
43.19. Engineer or technician (sound, light, other)
43.20. Musician
43.22. Writer, author, or editor
43.23. Other occupation associated with the arts
43.25. Communications
43.24. Building, maintenance, installation, and
repair
66

Undergraduate Level
Variable Response Options Count % Count % Count % Count %
SNAAP 2012 Frequency Report • Current Work
Sample UniversityArt, Design, and
MediaMidwest
SNAAP
Institutions
Undergraduate Level
Sample University
curjob_comput Never worked in a computer or mathematics occupation 774 89% 17,590 91% 11,959 90% 37,432 90%
Not selected 67 8% 1,330 7% 854 6% 2,783 7%
Selected 29 3% 478 2% 417 3% 1,304 3%
Total 870 100% 19,398 100% 13,230 100% 41,519 100%
curjob_construct Never worked in construction 773 89% 16,419 85% 11,569 88% 36,596 88%
Not selected 82 9% 2,476 13% 1,405 11% 4,147 10%
Selected 15 2% 483 2% 246 2% 753 2%
Total 870 100% 19,378 100% 13,220 100% 41,496 100%
curjob_edu Never worked in education, training, or library 560 65% 12,506 65% 8,123 62% 25,373 61%
Not selected 238 27% 5,523 29% 3,907 30% 12,233 30%
Selected 69 8% 1,315 7% 1,158 9% 3,785 9%
Total 867 100% 19,344 100% 13,188 100% 41,391 100%
curjob_engocc Never worked in engineering or science 837 96% 18,501 95% 12,655 96% 39,896 96%
Not selected 22 3% 713 4% 423 3% 1,236 3%
Selected 11 1% 190 1% 155 1% 405 1%
Total 870 100% 19,404 100% 13,233 100% 41,537 100%
curjob_farm Never worked in farming, fishing, or forestry 833 96% 18,355 95% 12,621 95% 39,698 96%
Not selected 31 4% 905 5% 514 4% 1,585 4%
Selected 6 1% 141 1% 98 1% 247 1%
Total 870 100% 19,401 100% 13,233 100% 41,530 100%
curjob_finan Never worked in financial or other business services 808 93% 17,951 93% 11,991 91% 37,681 91%
Not selected 53 6% 1,157 6% 920 7% 2,885 7%
Selected 10 1% 286 1% 311 2% 949 2%
Total 871 100% 19,394 100% 13,222 100% 41,515 100%
curjob_food Never worked in a food preparation related occupation 681 78% 14,457 75% 9,897 75% 31,176 75%
Not selected 175 20% 4,538 23% 3,060 23% 9,456 23%
Selected 15 2% 388 2% 263 2% 845 2%
Total 871 100% 19,383 100% 13,220 100% 41,477 100%
43.32. Food preparation related
43.29. Engineering and science
43.30. Farming, fishing, and forestry
43.31. Financial and other business services
43. Current occupation: (continued)
43.26. Computer and mathematics
43.27. Construction
43.28. Education, training, and library
67

Undergraduate Level
Variable Response Options Count % Count % Count % Count %
SNAAP 2012 Frequency Report • Current Work
Sample UniversityArt, Design, and
MediaMidwest
SNAAP
Institutions
Undergraduate Level
Sample University
curjob_hlthtech Never worked in healthcare 808 93% 18,012 93% 12,177 92% 38,253 92%
Not selected 51 6% 1,035 5% 724 5% 2,226 5%
Selected 12 1% 352 2% 321 2% 1,037 2%
Total 871 100% 19,399 100% 13,222 100% 41,516 100%
curjob_humres Never worked in human resources 840 97% 18,635 96% 12,562 95% 39,496 95%
Not selected 26 3% 672 3% 576 4% 1,692 4%
Selected 4 0% 91 0% 92 1% 337 1%
Total 870 100% 19,398 100% 13,230 100% 41,525 100%
curjob_legal Never worked in a legal occupation 853 98% 18,715 96% 12,709 96% 39,600 95%
Not selected 12 1% 543 3% 365 3% 1,353 3%
Selected 6 1% 145 1% 159 1% 577 1%
Total 871 100% 19,403 100% 13,233 100% 41,530 100%
curjob_manag Never worked in management 746 86% 16,311 84% 11,017 83% 34,623 83%
Not selected 89 10% 2,071 11% 1,429 11% 4,490 11%
Selected 34 4% 995 5% 762 6% 2,363 6%
Total 869 100% 19,377 100% 13,208 100% 41,476 100%
curjob_manfact Never worked in manufacturing 788 91% 17,647 91% 12,150 92% 38,557 93%
Not selected 61 7% 1,462 8% 940 7% 2,506 6%
Selected 20 2% 286 1% 140 1% 461 1%
Total 869 100% 19,395 100% 13,230 100% 41,524 100%
curjob_military Never worked in military or protective services 833 96% 18,631 96% 12,643 96% 39,948 96%
Not selected 33 4% 707 4% 514 4% 1,394 3%
Selected 4 0% 62 0% 72 1% 188 0%
Total 870 100% 19,400 100% 13,229 100% 41,530 100%
curjob_office Never worked in office or administrative support 698 80% 14,587 75% 9,714 74% 29,682 72%
Not selected 139 16% 3,913 20% 2,836 21% 9,528 23%
Selected 34 4% 878 5% 655 5% 2,245 5%
Total 871 100% 19,378 100% 13,205 100% 41,455 100%
43. Current occupation: (continued)
43.33. Healthcare
43.38. Military and protective services
43.37. Manufacturing
43.39. Office and administrative support
43.34. Human resources
43.35. Legal
43.36. Management
68

Undergraduate Level
Variable Response Options Count % Count % Count % Count %
SNAAP 2012 Frequency Report • Current Work
Sample UniversityArt, Design, and
MediaMidwest
SNAAP
Institutions
Undergraduate Level
Sample University
curjob_sales Never worked in sales 613 71% 13,463 70% 8,970 68% 28,744 69%
Not selected 204 23% 4,928 25% 3,470 26% 10,504 25%
Selected 52 6% 976 5% 766 6% 2,189 5%
Total 869 100% 19,367 100% 13,206 100% 41,437 100%
curjob_care Never worked in a services or personal care occupation 790 91% 17,289 89% 11,769 89% 36,831 89%
Not selected 77 9% 1,840 9% 1,271 10% 4,077 10%
Selected 4 0% 266 1% 187 1% 601 1%
Total 871 100% 19,395 100% 13,227 100% 41,509 100%
curjob_socialser Never worked in social services 815 94% 18,151 94% 12,238 93% 38,543 93%
Not selected 35 4% 948 5% 719 5% 2,173 5%
Selected 20 2% 296 2% 269 2% 801 2%
Total 870 100% 19,395 100% 13,226 100% 41,517 100%
curjob_transport Never worked in transportation or material moving 839 96% 18,432 95% 12,621 95% 39,743 96%
Not selected 29 3% 876 5% 544 4% 1,606 4%
Selected 3 0% 93 0% 70 1% 181 0%
Total 871 100% 19,401 100% 13,235 100% 41,530 100%
curjob_othnart Never worked in any other occupation outside the arts 725 83% 16,098 83% 10,973 83% 34,346 83%
Not selected 94 11% 2,181 11% 1,421 11% 4,492 11%
Selected 50 6% 1,097 6% 824 6% 2,632 6%
Total 869 100% 19,376 100% 13,218 100% 41,470 100%
curjob_oth Not selected 796 92% 17,541 91% 11,943 91% 37,494 91%
Selected 68 8% 1,701 9% 1,178 9% 3,689 9%
Total 864 100% 19,242 100% 13,121 100% 41,183 100%
43.45. Other
43. Current occupation: (continued)
43.40. Sales
43.41. Services and personal care
43.42. Social services
43.43. Transportation and material moving
43.44. Other occupations outside of the arts
69

Undergraduate Level
Variable Response Options Count % Count % Count % Count %
SNAAP 2012 Frequency Report • Current Work
Sample UniversityArt, Design, and
MediaMidwest
SNAAP
Institutions
Undergraduate Level
Sample University
multijob Currently not employed 66 8% 1,422 7% 1,042 8% 3,205 8%
No, I do not hold multiple jobs 513 59% 10,691 56% 7,411 57% 23,075 57%
Yes, I hold 2 jobs 213 25% 4,879 26% 3,263 25% 10,250 25%
Yes, I hold 3 jobs 55 6% 1,534 8% 989 8% 3,161 8%
Yes, I hold 4 jobs 8 1% 215 1% 161 1% 547 1%
Yes, I hold more than 4 jobs 8 1% 298 2% 162 1% 588 1%
Total 863 100% 19,039 100% 13,028 100% 40,826 100%
majtimejob_R Currently not employed 66 8% 1,422 7% 1,042 8% 3,205 8%
Architect 1 0% 673 4% 431 3% 1,020 3%
Arts administrator or manager 12 1% 347 2% 324 2% 982 2%
Museum or gallery worker, including curator 15 2% 322 2% 142 1% 505 1%
Graphic designer, illustrator, or art director 148 17% 2,877 15% 1,148 9% 4,024 10%
Interior designer 10 1% 335 2% 145 1% 521 1%
Web designer 23 3% 325 2% 166 1% 542 1%
Other designer 54 6% 1,065 6% 516 4% 1,509 4%
Higher education arts educator 29 3% 711 4% 504 4% 1,470 4%
K-12 arts educator 47 5% 841 4% 1,047 8% 2,674 7%
Private teacher of the arts 4 0% 95 0% 202 2% 591 1%
Other arts educator 10 1% 192 1% 127 1% 418 1%
Craft artist 12 1% 359 2% 164 1% 507 1%
Fine artist 71 8% 1,633 9% 569 4% 2,021 5%
Film, TV, video artist 18 2% 408 2% 168 1% 923 2%
Multi-media artist or animator 7 1% 195 1% 48 0% 243 1%
Photographer 24 3% 479 3% 175 1% 639 2%
Actor 0 0% 11 0% 65 1% 241 1%
Dancer or choreographer 0 0% 7 0% 44 0% 114 0%
Engineer or technician (light, sound, other) 0 0% 7 0% 31 0% 94 0%
Musician 1 0% 26 0% 394 3% 1,007 2%
Theater and stage director or producer 1 0% 11 0% 26 0% 105 0%
46. The occupation in which you spend the majority of
your work time:
45. Are you currently working at two or more jobs?
70

Undergraduate Level
Variable Response Options Count % Count % Count % Count %
SNAAP 2012 Frequency Report • Current Work
Sample UniversityArt, Design, and
MediaMidwest
SNAAP
Institutions
Undergraduate Level
Sample University
majtimejob_R Writer, author, or editor 9 1% 205 1% 142 1% 565 1%
Other occupation associated with the arts 28 3% 854 4% 516 4% 1,736 4%
Building, maintenance, installation, and repair 7 1% 101 1% 59 0% 161 0%
Communications 24 3% 381 2% 360 3% 1,230 3%
Computer and mathematics 13 2% 200 1% 217 2% 694 2%
Construction 5 1% 113 1% 69 1% 197 0%
Education, training, and library 36 4% 545 3% 553 4% 1,821 4%
Engineering and science 6 1% 70 0% 84 1% 192 0%
Farming, fishing, and forestry 0 0% 37 0% 20 0% 61 0%
Financial and other business services 6 1% 138 1% 189 1% 539 1%
Food preparation related 6 1% 203 1% 149 1% 440 1%
Healthcare 3 0% 192 1% 190 1% 598 1%
Human resources 3 0% 24 0% 40 0% 151 0%
Legal 3 0% 90 0% 123 1% 436 1%
Management 17 2% 447 2% 374 3% 1,107 3%
Manufacturing 5 1% 81 0% 51 0% 137 0%
Military and protective services 3 0% 36 0% 40 0% 108 0%
Office and administrative support 15 2% 428 2% 355 3% 1,151 3%
Sales 21 2% 432 2% 372 3% 1,027 3%
Services and personal care 2 0% 113 1% 81 1% 242 1%
Social services 13 2% 147 1% 137 1% 422 1%
Transportation and material moving 3 0% 31 0% 25 0% 66 0%
Other occupation outside of the arts 29 3% 621 3% 516 4% 1,639 4%
Other 54 6% 1,209 6% 847 7% 2,620 6%
Total 864 100% 19,039 100% 12,987 100% 40,695 100%
46. The occupation in which you spend the majority of
your work time: (continued)
71

Undergraduate Level
Variable Response Options Count % Count % Count % Count %
SNAAP 2012 Frequency Report • Current Work
Sample UniversityArt, Design, and
MediaMidwest
SNAAP
Institutions
Undergraduate Level
Sample University
sector Currently not employed 66 8% 1,422 8% 1,042 8% 3,205 8%
For-profit and commercial 403 47% 9,235 49% 5,314 41% 17,486 43%
Nonprofit (including schools) 190 22% 3,560 19% 3,615 28% 10,373 26%
Government (including military) 21 2% 606 3% 500 4% 1,611 4%
Mix of the above 108 13% 2,254 12% 1,489 12% 4,525 11%
Not relevant 73 8% 1,853 10% 980 8% 3,329 8%
Total 861 100% 18,930 100% 12,940 100% 40,529 100%
timetrainrel Currently not employed 66 8% 1,422 8% 1,042 8% 3,205 8%
Not at all relevant 88 10% 2,031 11% 1,692 13% 5,292 13%
Somewhat relevant 153 18% 3,364 18% 2,338 18% 7,810 19%
Relevant 178 21% 3,892 21% 2,557 20% 8,152 20%
Very relevant 370 43% 8,163 43% 5,282 41% 15,958 39%
Total 855 100% 18,872 100% 12,911 100% 40,417 100%
timejobsec Currently not employed 66 8% 1,422 8% 1,042 8% 3,205 8%
Very dissatisfied 59 7% 1,558 8% 843 7% 2,927 7%
Somewhat dissatisfied 101 12% 2,400 13% 1,444 11% 4,716 12%
Somewhat satisfied 279 33% 6,517 35% 4,336 34% 13,864 35%
Very satisfied 331 40% 6,597 36% 5,046 40% 15,017 38%
Total 836 100% 18,494 100% 12,711 100% 39,729 100%
timecreative Currently not employed 66 8% 1,422 8% 1,042 8% 3,205 8%
Very dissatisfied 47 6% 1,136 6% 765 6% 2,351 6%
Somewhat dissatisfied 90 11% 1,870 10% 1,376 11% 4,277 11%
Somewhat satisfied 254 30% 5,433 29% 3,788 30% 12,147 30%
Very satisfied 390 46% 8,847 47% 5,827 46% 18,055 45%
Total 847 100% 18,708 100% 12,798 100% 40,035 100%
49. Overall, how relevant is your arts training at this
institution to your current work in the occupation where
you spend the majority of your work time?
48. In terms of your work in the occupation in which you
spend the majority of your work time, in what sector do
you do most of your work:
50. Level of satisfaction with each of the following
aspects of your current work in the occupation where you
spend the majority of your work time:
50.1. Job security
50.2. Opportunity to be creative
72

Undergraduate Level
Variable Response Options Count % Count % Count % Count %
SNAAP 2012 Frequency Report • Current Work
Sample UniversityArt, Design, and
MediaMidwest
SNAAP
Institutions
Undergraduate Level
Sample University
timeincome Currently not employed 66 8% 1,422 8% 1,042 8% 3,205 8%
Very dissatisfied 94 11% 2,318 13% 1,386 11% 4,563 11%
Somewhat dissatisfied 144 17% 3,754 20% 2,511 20% 7,915 20%
Somewhat satisfied 328 39% 7,017 38% 4,887 39% 15,478 39%
Very satisfied 205 24% 4,001 22% 2,865 23% 8,553 22%
Total 837 100% 18,512 100% 12,691 100% 39,714 100%
timebalance Currently not employed 66 8% 1,422 8% 1,042 8% 3,205 8%
Very dissatisfied 42 5% 1,071 6% 703 6% 2,188 5%
Somewhat dissatisfied 134 16% 3,017 16% 2,071 16% 6,496 16%
Somewhat satisfied 328 39% 7,087 38% 4,815 38% 15,251 38%
Very satisfied 273 32% 5,983 32% 4,101 32% 12,703 32%
Total 843 100% 18,580 100% 12,732 100% 39,843 100%
timegood Currently not employed 66 8% 1,422 8% 1,042 8% 3,205 8%
Very dissatisfied 48 6% 1,234 7% 696 5% 2,285 6%
Somewhat dissatisfied 129 15% 2,592 14% 1,490 12% 5,050 13%
Somewhat satisfied 269 32% 6,166 33% 4,049 32% 12,728 32%
Very satisfied 327 39% 7,158 39% 5,469 43% 16,595 42%
Total 839 100% 18,572 100% 12,746 100% 39,863 100%
timecareer Currently not employed 66 8% 1,422 8% 1,042 8% 3,205 8%
Very dissatisfied 79 10% 1,767 10% 1,107 9% 3,527 9%
Somewhat dissatisfied 143 17% 3,475 19% 2,379 19% 7,426 19%
Somewhat satisfied 322 39% 6,773 37% 4,776 38% 14,929 38%
Very satisfied 210 26% 4,815 26% 3,267 26% 10,202 26%
Total 820 100% 18,252 100% 12,571 100% 39,289 100%
50.6. Opportunity for career advancement
50. Level of satisfaction with each of the following
aspects of your current work in the occupation where you
spend the majority of your work time: (continued)
50.3. Income
50.4. Balance between work and non-work life
50.5. Opportunity to contribute to the greater good
73

Undergraduate Level
Variable Response Options Count % Count % Count % Count %
SNAAP 2012 Frequency Report • Current Work
Sample UniversityArt, Design, and
MediaMidwest
SNAAP
Institutions
Undergraduate Level
Sample University
timework Currently not employed 66 8% 1,422 8% 1,042 8% 3,205 8%
Very dissatisfied 54 6% 1,082 6% 720 6% 2,261 6%
Somewhat dissatisfied 83 10% 2,023 11% 1,292 10% 4,127 10%
Somewhat satisfied 233 28% 5,296 28% 3,534 28% 11,258 28%
Very satisfied 406 48% 8,843 47% 6,189 48% 19,140 48%
Total 842 100% 18,666 100% 12,777 100% 39,991 100%
timesat Currently not employed 66 8% 1,422 8% 1,042 8% 3,205 8%
Very dissatisfied 26 3% 674 4% 412 3% 1,331 3%
Somewhat dissatisfied 73 9% 1,715 9% 1,123 9% 3,564 9%
Somewhat satisfied 322 38% 7,039 38% 4,777 37% 15,221 38%
Very satisfied 353 42% 7,761 42% 5,404 42% 16,559 42%
Total 840 100% 18,611 100% 12,758 100% 39,880 100%
50. Level of satisfaction with each of the following
aspects of your current work in the occupation where you
spend the majority of your work time: (continued)
50.7. Work that reflects my personality, interests,
and values
50.8. Overall job satisfaction
74

Undergraduate Level
Variable Response Options Count % Count % Count % Count %
SNAAP 2012 Frequency Report • Current Work
Sample UniversityArt, Design, and
MediaMidwest
SNAAP
Institutions
Undergraduate Level
Sample University
mfuljob_R Currently not employed 66 8% 1,422 8% 1,042 8% 3,205 8%
Architect 2 0% 695 4% 446 3% 1,044 3%
Arts administrator or manager 7 1% 224 1% 229 2% 684 2%
Museum or gallery worker, including curator 13 2% 219 1% 110 1% 389 1%
Graphic designer, illustrator, or art director 157 19% 2,745 15% 1,112 9% 3,917 10%
Interior designer 5 1% 338 2% 152 1% 533 1%
Web designer 23 3% 213 1% 128 1% 372 1%
Other designer 52 6% 1,005 5% 516 4% 1,456 4%
Higher education arts educator 19 2% 512 3% 346 3% 1,029 3%
K-12 arts educator 33 4% 672 4% 872 7% 2,182 5%
Private teacher of the arts 7 1% 122 1% 228 2% 598 1%
Other arts educator 15 2% 194 1% 141 1% 447 1%
Craft artist 10 1% 517 3% 246 2% 730 2%
Fine artist 115 14% 2,983 16% 1,070 8% 3,795 9%
Film, TV, video artist 23 3% 421 2% 182 1% 992 2%
Multi-media artist or animator 9 1% 203 1% 66 1% 274 1%
Photographer 29 3% 719 4% 267 2% 976 2%
Actor 0 0% 29 0% 141 1% 527 1%
Dancer or choreographer 0 0% 19 0% 81 1% 262 1%
Engineer or technician (light, sound, other) 0 0% 6 0% 33 0% 88 0%
Musician 4 0% 112 1% 764 6% 2,018 5%
Theater and stage director or producer 0 0% 16 0% 78 1% 240 1%
Writer, author, or editor 12 1% 303 2% 213 2% 916 2%
Other occupation associated with the arts 32 4% 768 4% 524 4% 1,656 4%
51. The occupation that is the most personally fulfilling
to you:
75

Undergraduate Level
Variable Response Options Count % Count % Count % Count %
SNAAP 2012 Frequency Report • Current Work
Sample UniversityArt, Design, and
MediaMidwest
SNAAP
Institutions
Undergraduate Level
Sample University
mfuljob_R Building, maintenance, installation, and repair 6 1% 42 0% 28 0% 80 0%
Communications 15 2% 274 1% 286 2% 934 2%
Computer and mathematics 9 1% 144 1% 155 1% 518 1%
Construction 1 0% 78 0% 54 0% 134 0%
Education, training, and library 30 4% 466 2% 485 4% 1,606 4%
Engineering and science 6 1% 64 0% 75 1% 181 0%
Farming, fishing, and forestry 1 0% 41 0% 25 0% 65 0%
Financial and other business services 4 0% 102 1% 145 1% 415 1%
Food preparation related 3 0% 110 1% 73 1% 240 1%
Healthcare 4 0% 161 1% 161 1% 523 1%
Human resources 2 0% 21 0% 37 0% 128 0%
Legal 2 0% 72 0% 98 1% 355 1%
Management 12 1% 284 2% 283 2% 794 2%
Manufacturing 4 0% 54 0% 35 0% 89 0%
Military and protective services 2 0% 32 0% 40 0% 98 0%
Office and administrative support 12 1% 222 1% 197 2% 599 1%
Sales 18 2% 269 1% 234 2% 648 2%
Services and personal care 2 0% 80 0% 62 0% 171 0%
Social services 10 1% 135 1% 124 1% 380 1%
Transportation and material moving 2 0% 23 0% 12 0% 38 0%
Other occupation outside of the arts 23 3% 526 3% 440 3% 1,363 3%
Other 47 6% 1,045 6% 753 6% 2,332 6%
Total 848 100% 18,702 100% 12,789 100% 40,021 100%
51. The occupation that is the most personally fulfilling
to you: (continued)
76

Undergraduate Level
Variable Response Options Count % Count % Count % Count %
trn_summer Summer arts program 325 41% 7,458 42% 5,692 47% 17,146 46%
trn_arths Arts high school 177 22% 5,111 29% 3,091 26% 9,517 25%
trn_hscourse Arts courses offered at your high school 553 70% 12,012 68% 8,215 68% 25,161 67%
trn_aftsch After-school program 148 19% 4,381 25% 3,256 27% 10,470 28%
trn_lesson Private lessons 190 24% 5,418 31% 5,635 47% 16,979 45%
trn_college College-level arts classes 672 85% 14,215 81% 9,863 82% 30,564 81%
trn_comm Community sponsored classes, workshops, or events 365 46% 7,795 44% 5,983 50% 18,112 48%
Totala - - - - - - - -
part_none I have not supported the arts in the past 12 months 101 12% 2,140 12% 1,264 10% 4,067 10%
part_vol Volunteered at an arts organization 202 24% 4,568 25% 3,476 27% 10,226 26%
part_brd Served on the board of an arts organization 114 14% 2,284 12% 1,690 13% 4,964 12%
part_tch Volunteered to teach the arts 145 17% 3,249 17% 2,368 19% 7,229 18%
part_donate Donated money to an arts organization or an artist 330 39% 6,982 38% 5,287 42% 15,972 40%
part_attd Attended an arts event 699 83% 15,412 83% 10,839 85% 33,819 85%
part_oth Other 54 6% 1,713 9% 1,015 8% 3,304 8%
Totala - - - - - - - -
perform No 165 19% 3,828 20% 3,290 26% 10,030 25%
Yes 690 81% 14,990 80% 9,562 74% 30,234 75%
Total 855 100% 18,818 100% 12,852 100% 40,264 100%
SNAAP 2012 Frequency Report • Arts Engagement
Undergraduate Level
Sample UniversityArt, Design, and
MediaMidwest
SNAAP
Institutions
Sample University
52. Arts training you have received during your lifetime
53. The ways in which you have supported the arts in
the past 12 months (other than performing, creating, or
exhibiting your own artwork)
55. Do you make or perform art in your personal (not
work-related) time?
aTotal may not sum to 100% as respondents could select more than one category.
dFor the frequencies of only those who received this question, see the "Data Highlights" Report. 77

Undergraduate Level
Variable Response Options Count % Count % Count % Count %
SNAAP 2012 Frequency Report • Arts Engagement
Undergraduate Level
Sample UniversityArt, Design, and
MediaMidwest
SNAAP
Institutions
Sample University
prac_dnrq Do not make or perform art in personal time 163 19% 3,821 20% 3,288 26% 10,015 25%
prac_craft Craft Arts 308 36% 6,434 34% 3,729 29% 11,777 29%
prac_crwri Creative Writing 182 21% 4,135 22% 2,402 19% 8,471 21%
prac_cul Culinary Arts 159 19% 3,825 20% 2,282 18% 7,551 19%
prac_dance Dance 48 6% 946 5% 762 6% 2,682 7%
prac_design Design 330 39% 6,208 33% 3,036 24% 9,796 24%
prac_film Film/Media Arts 118 14% 2,290 12% 1,072 8% 4,307 11%
prac_finart Fine Arts (painting, sculpting, drawing) 451 53% 10,466 56% 4,744 37% 15,889 39%
prac_music Music 128 15% 2,564 14% 3,565 28% 9,935 25%
prac_photo Photography 344 40% 7,019 37% 3,659 28% 12,273 30%
prac_thea Theater 25 3% 594 3% 963 7% 2,925 7%
prac_oth Other 63 7% 1,262 7% 677 5% 2,122 5%
Totala - - - - - - - -
tmpractice Do not make or perform art in personal time 163 19% 3,821 20% 3,288 26% 10,015 25%
A few times a year or less 104 12% 1,716 9% 1,105 9% 3,564 9%
Several times a month 219 26% 4,877 26% 3,247 25% 10,026 25%
Several times a week 238 28% 5,158 28% 3,314 26% 10,428 26%
Daily 130 15% 3,160 17% 1,866 15% 6,051 15%
Total 854 100% 18,732 100% 12,820 100% 40,084 100%
improduce Do not make or perform art in personal time 163 19% 3,821 20% 3,288 26% 10,015 25%
Not at all important 9 1% 107 1% 68 1% 219 1%
Somewhat important 60 7% 1,247 7% 1,011 8% 2,866 7%
Important 167 20% 3,245 17% 2,289 18% 6,994 17%
Very important 453 53% 10,320 55% 6,163 48% 19,995 50%
Total 852 100% 18,740 100% 12,819 100% 40,089 100%
57. About how often do you practice art in your personal
(not work-related) time?d
58. How important is it to you to be able to make or
produce art in your personal (not work-related) time?d
56. The art forms you practice in your personal (not
work-related) timed
aTotal may not sum to 100% as respondents could select more than one category.
dFor the frequencies of only those who received this question, see the "Data Highlights" Report. 78

Undergraduate Level
Variable Response Options Count % Count % Count % Count %
SNAAP 2012 Frequency Report • Arts Engagement
Undergraduate Level
Sample UniversityArt, Design, and
MediaMidwest
SNAAP
Institutions
Sample University
exhibit Do not make or perform art in personal time 163 19% 3,821 20% 3,288 26% 10,015 25%
I do not perform or exhibit in public 253 30% 5,127 27% 2,886 23% 9,587 24%
Less than once a year 130 15% 2,733 15% 1,435 11% 4,843 12%
1 or 2 times a year 128 15% 2,867 15% 1,693 13% 5,439 14%
3 or more times a year 82 10% 1,741 9% 1,821 14% 5,039 13%
Continuously in public or online 96 11% 2,413 13% 1,683 13% 5,123 13%
Total 852 100% 18,702 100% 12,806 100% 40,046 100%
59. How often do you publicly perform or exhibit art in
your personal (not work-related) time?d
aTotal may not sum to 100% as respondents could select more than one category.
dFor the frequencies of only those who received this question, see the "Data Highlights" Report. 79

Undergraduate Level
Variable Response Options Count % Count % Count % Count %
income $10,000 or less 90 11% 2,172 12% 1,420 11% 4,460 11%
$10,001 to $20,000 91 11% 1,727 9% 1,204 9% 3,685 9%
$20,001 to $30,000 78 9% 1,809 10% 1,248 10% 3,801 10%
$30,001 to $40,000 89 11% 1,738 9% 1,441 11% 4,142 10%
$40,001 to $50,000 75 9% 1,688 9% 1,339 11% 3,966 10%
$50,001 to $60,000 74 9% 1,471 8% 1,115 9% 3,464 9%
$60,001 to $70,000 36 4% 1,103 6% 822 6% 2,488 6%
$70,001 to $80,000 34 4% 903 5% 625 5% 1,947 5%
$80,001 to $90,000 28 3% 642 3% 408 3% 1,328 3%
$90,001 to $100,000 22 3% 530 3% 313 2% 1,080 3%
$100,001 to $150,000 54 6% 989 5% 628 5% 2,084 5%
More than $150,000 33 4% 695 4% 340 3% 1,327 3%
I prefer not to answer 141 17% 3,117 17% 1,828 14% 6,012 15%
Total 845 100% 18,584 100% 12,731 100% 39,784 100%
$10,000 or less 38 5% 890 5% 567 4% 1,790 5%
$10,001 to $20,000 53 6% 954 5% 629 5% 1,991 5%
$20,001 to $30,000 42 5% 1,064 6% 702 6% 2,222 6%
$30,001 to $40,000 64 8% 1,202 7% 918 7% 2,635 7%
$40,001 to $50,000 58 7% 1,150 6% 875 7% 2,567 6%
$50,001 to $60,000 49 6% 1,064 6% 770 6% 2,431 6%
$60,001 to $70,000 44 5% 985 5% 770 6% 2,234 6%
$70,001 to $80,000 36 4% 1,040 6% 803 6% 2,369 6%
$80,001 to $90,000 39 5% 874 5% 694 5% 2,019 5%
$90,001 to $100,000 36 4% 1,009 5% 725 6% 2,198 6%
$100,001 to $150,000 111 13% 2,285 12% 1,701 13% 5,289 13%
More than $150,000 92 11% 1,969 11% 1,234 10% 4,188 11%
I prefer not to answer 180 21% 3,994 22% 2,287 18% 7,629 19%
Total 842 100% 18,480 100% 12,675 100% 39,562 100%
60. What was your individual annual income in 2011?
(Do not include spousal income or interest on jointly-
owned assets.)
61. In 2011, what was your total household income
from all sources?
hhincome
Sample University
SNAAP 2012 Frequency Report • Facts and Figures
Undergraduate Level
Sample UniversityArt, Design, and
MediaMidwest
SNAAP
Institutions
aTotal may not sum to 100% as respondents could select more than one category.
dFor the frequencies of only those who received this question, see the "Data Highlights" Report. 80

Undergraduate Level
Variable Response Options Count % Count % Count % Count %
Sample University
SNAAP 2012 Frequency Report • Facts and Figures
Undergraduate Level
Sample UniversityArt, Design, and
MediaMidwest
SNAAP
Institutions
percincome Never worked as a professional artist 195 23% 3,843 21% 3,475 27% 10,457 27%
I did not work as an artist in 2011 133 16% 2,640 14% 1,948 15% 6,147 16%
Less than 20% 168 20% 4,324 24% 2,782 22% 8,568 22%
21% to 40% 35 4% 854 5% 482 4% 1,648 4%
41% to 60% 31 4% 753 4% 450 4% 1,448 4%
61% to 80% 18 2% 584 3% 342 3% 1,124 3%
81% to 100% 254 30% 5,401 29% 3,163 25% 10,062 26%
Total 834 100% 18,399 100% 12,642 100% 39,454 100%
perctime Never worked as a professional artist 195 23% 3,843 21% 3,475 27% 10,457 26%
I did not work as an artist in 2011 103 12% 2,134 12% 1,706 13% 5,254 13%
Less than 20% 111 13% 2,331 13% 1,699 13% 5,198 13%
21% to 40% 56 7% 1,533 8% 878 7% 2,882 7%
41% to 60% 55 7% 1,399 8% 766 6% 2,453 6%
61% to 80% 46 5% 1,217 7% 667 5% 2,230 6%
81% to 100% 272 32% 5,991 32% 3,486 27% 11,102 28%
Total 838 100% 18,448 100% 12,677 100% 39,576 100%
hrspd Currently not employed 66 8% 1,409 8% 1,031 8% 3,179 8%
I do not do paid work 86 10% 1,760 10% 982 8% 3,138 8%
Less than 20 hours 111 13% 2,373 13% 1,539 12% 5,041 13%
20 to less than 35 hours 99 12% 2,700 15% 1,670 13% 5,562 14%
35 to less than 60 hours 442 52% 9,020 49% 6,616 53% 19,999 51%
60 hours or more 40 5% 1,046 6% 752 6% 2,371 6%
Total 844 100% 18,308 100% 12,590 100% 39,290 100%
finsup_dnrq Never worked as a professional artist 195 23% 3,840 21% 3,473 28% 10,451 27%
finsup_none Did not receive financial support 407 49% 8,791 48% 5,678 45% 17,700 45%
finsup_fam Support from family and friends 151 18% 3,889 21% 2,422 19% 7,989 20%
finsup_patron Support from patron, foundation, or government grant 128 15% 2,907 16% 1,677 13% 5,309 14%
finsup_oth Other 16 2% 535 3% 311 2% 992 3%
Totala - - - - - - - -
64. Have you ever received financial support (gifts,
grants, or loans) from any of the following sources to
live and work as an artist (not including support for
school)?d
62. The approximate percentage of your personal (not
family) income that came from your work as an artist in
2011d
63. The approximate percentage of your work time you
spent working as an artist in 2011d
64. On average, how many hours a week do you
currently do paid work?
aTotal may not sum to 100% as respondents could select more than one category.
dFor the frequencies of only those who received this question, see the "Data Highlights" Report. 81
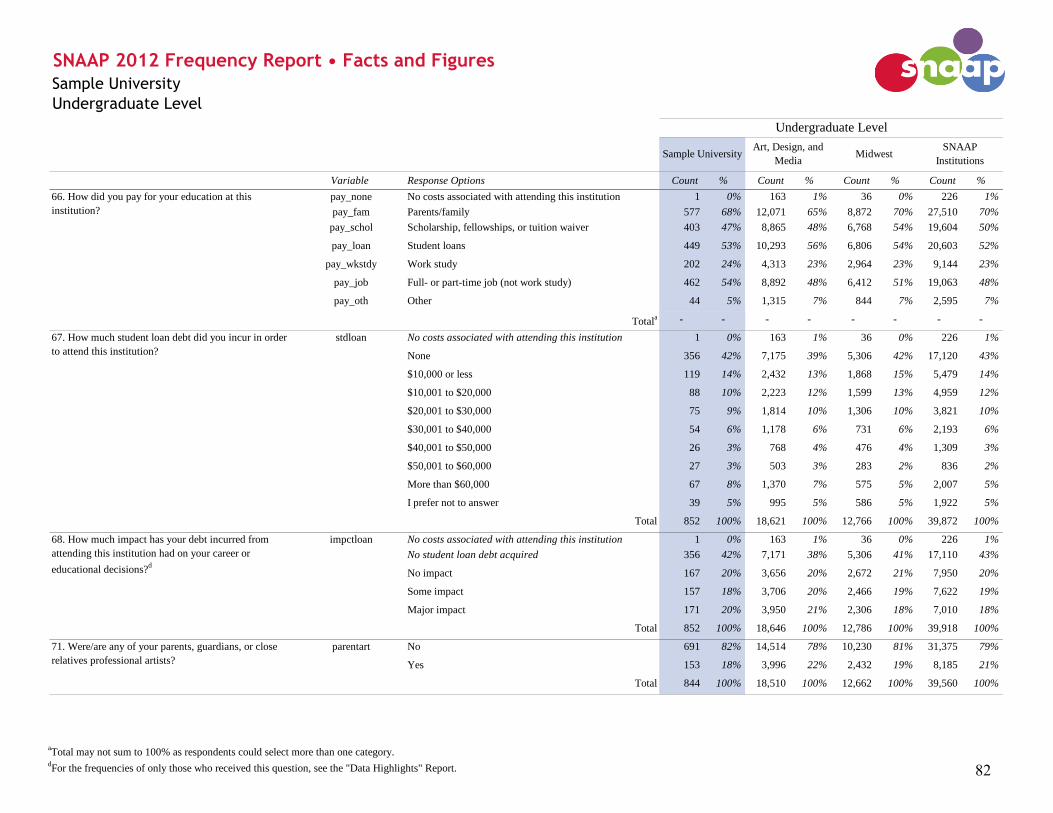
Undergraduate Level
Variable Response Options Count % Count % Count % Count %
Sample University
SNAAP 2012 Frequency Report • Facts and Figures
Undergraduate Level
Sample UniversityArt, Design, and
MediaMidwest
SNAAP
Institutions
pay_none No costs associated with attending this institution 1 0% 163 1% 36 0% 226 1%
pay_fam Parents/family 577 68% 12,071 65% 8,872 70% 27,510 70%
pay_schol Scholarship, fellowships, or tuition waiver 403 47% 8,865 48% 6,768 54% 19,604 50%
pay_loan Student loans 449 53% 10,293 56% 6,806 54% 20,603 52%
pay_wkstdy Work study 202 24% 4,313 23% 2,964 23% 9,144 23%
pay_job Full- or part-time job (not work study) 462 54% 8,892 48% 6,412 51% 19,063 48%
pay_oth Other 44 5% 1,315 7% 844 7% 2,595 7%
Totala - - - - - - - -
stdloan No costs associated with attending this institution 1 0% 163 1% 36 0% 226 1%
None 356 42% 7,175 39% 5,306 42% 17,120 43%
$10,000 or less 119 14% 2,432 13% 1,868 15% 5,479 14%
$10,001 to $20,000 88 10% 2,223 12% 1,599 13% 4,959 12%
$20,001 to $30,000 75 9% 1,814 10% 1,306 10% 3,821 10%
$30,001 to $40,000 54 6% 1,178 6% 731 6% 2,193 6%
$40,001 to $50,000 26 3% 768 4% 476 4% 1,309 3%
$50,001 to $60,000 27 3% 503 3% 283 2% 836 2%
More than $60,000 67 8% 1,370 7% 575 5% 2,007 5%
I prefer not to answer 39 5% 995 5% 586 5% 1,922 5%
Total 852 100% 18,621 100% 12,766 100% 39,872 100%
impctloan No costs associated with attending this institution 1 0% 163 1% 36 0% 226 1%
No student loan debt acquired 356 42% 7,171 38% 5,306 41% 17,110 43%
No impact 167 20% 3,656 20% 2,672 21% 7,950 20%
Some impact 157 18% 3,706 20% 2,466 19% 7,622 19%
Major impact 171 20% 3,950 21% 2,306 18% 7,010 18%
Total 852 100% 18,646 100% 12,786 100% 39,918 100%
parentart No 691 82% 14,514 78% 10,230 81% 31,375 79%
Yes 153 18% 3,996 22% 2,432 19% 8,185 21%
Total 844 100% 18,510 100% 12,662 100% 39,560 100%
66. How did you pay for your education at this
institution?
71. Were/are any of your parents, guardians, or close
relatives professional artists?
68. How much impact has your debt incurred from
attending this institution had on your career or
educational decisions?d
67. How much student loan debt did you incur in order
to attend this institution?
aTotal may not sum to 100% as respondents could select more than one category.
dFor the frequencies of only those who received this question, see the "Data Highlights" Report. 82

Undergraduate Level
Variable Response Options Count % Count % Count % Count %
Sample University
SNAAP 2012 Frequency Report • Facts and Figures
Undergraduate Level
Sample UniversityArt, Design, and
MediaMidwest
SNAAP
Institutions
artcity Past professional artist (but not currently) 168 20% 3,572 19% 2,650 21% 8,341 21%
Never worked as a professional artist 195 23% 3,808 21% 3,458 27% 10,370 26%
Very poor 8 1% 229 1% 125 1% 394 1%
Poor 32 4% 706 4% 404 3% 1,261 3%
Fair 79 9% 2,236 12% 1,413 11% 4,143 10%
Good 148 17% 3,441 19% 2,192 17% 6,598 17%
Very good 216 26% 4,534 24% 2,484 20% 8,613 22%
Total 846 100% 18,526 100% 12,726 100% 39,720 100%
insttown No 526 63% 9,887 54% 8,497 67% 24,399 62%
Yes 314 37% 8,545 46% 4,170 33% 15,122 38%
Total 840 100% 18,432 100% 12,667 100% 39,521 100%
79. How would you rate the current area where you live
and/or work as a place to pursue your artistic career?d
80. Within the first five years after leaving this
institution, did you take up residency in the town/city
where this institution is located to pursue your career?
aTotal may not sum to 100% as respondents could select more than one category.
dFor the frequencies of only those who received this question, see the "Data Highlights" Report. 83

2012 Alumni Comments
Sample University
Undergraduate Level

Understanding the Alumni Comments
Work as Work as Arts Work as Arts Undergraduate Level
Artistb
Teacherb
Administratorb Comment
1995 Current Current NeverMore research and writing opportunities.
2000 Current Current Past I would have like interdisciplinary arts collaborations. I studied in both the art and
the dance departments, and never did either encourage us to work with students
from other programs.
2000 Past Never CurrentTeach an artist how to price their services.
2005 Past Past Never Offer career counseling and internships with area artist or artist outside the
community.
2005 Never Never Never The relationship between the advisor and the student is very critical. Everything
possible should have been done to foster that relationship.
2006 Never Current No ResponseProvide guidance on business aspects related to a career in a creative field.
Cohort
The Alumni Comments Report contains all responses to open-ended questions. See the Codebook for a complete list of variables, survey
questions, response options, and the logic used to determine which alumni received each question.
SNAAP 2012 Alumni Comments • Institutional Experiences
Sample InstitutionUndergraduate Level
Is there anything that this institution could have done better to prepare you for further education or for your career? Please
describe.c
Column Headers
Columns present cohort and
basic work experience
characteristics for alumni who
submitted comments. These
characteristics were derived
from specific variables on the
survey. Each column is a
specific variable. The variable
names corresponding to each
column header are as follows:
Cohort = cohort Work as Artist = artist Work as Arts Teacher = teach Work as Arts Administrator = artsrel
Question The questions asked of alumni are found here.
Alumni Comment The alumni comment column includes the responses from each alumni to the respective question, with a limit of 8,000 characters. If you participated in 2011, responses for 2011 and 2012 have been combined. All available responses are provided. Not all alumni provided a response to each question. These responses are not screened or edited in the reports of participating institutions. Responses in this sample report are screened to ensure confidentiality.
Response Value Respondents had three response options regarding their involvement in three capacities (Work as Artist, Work as Arts Teacher, Work as Arts Administrator) as follows: Current = Yes, I do this currently. Past = Yes, I have done it in the past, but no longer do. Never = No, I have not done this. No Response = Alumnus/alumna left this question blank
Topic Area Each comment question comes from a different topic area of the SNAAP Questionnaire.
85

Work as Work as Arts Work as Arts Undergraduate Level
Artistb Teacherb AdministratorbComment
2012 No Response No Response No Response Laguna College of Art and Design
2011 Current Never Never Parsons The New School for Design
2011 Current Never Never Stanford University
2010 Current Past Never Centro de Diseño, Cine y Televisión (México) - Certificate in Interior Design
2010 Current Never Current City College of New York, CUNY
2010 Never Never Current University of Illinois Springfield, Department of History
2009 Current Never Never National Academy of Sports Medicine via Lifetime Academy
2009 Current Never Never I took a class on becoming an English teacher in China. It was a TEFL program.
2008 Current Current Never SCAD
2008 Current Never Never Minneapolis Technical College
2008 Current Never Never Cranbrook Academy of Art
2008 Past Never Never MBA Indiana University
2008 Never Current Never Academy of Art University, San Francisco
2008 Never Never Past Carnegie Mellon University-Heinz School of Public Policy and Management
2007 Current Current Never Augsburg College
2007 Never Never Current I took the entire graphic design curriculum offered at South Dakota State University, without getting the
certificate.2007 Never Never Never Harper College, Palatine, IL
2006 Current Current Never The State University of New York at Buffalo
2006 Current Past Past Syracuse University, MFA Painting program
2006 Current Past Never California College of the Arts , pursuing an MBA in Design Strategy.
1999 Past Past Never London College of Communication
1985 Current Past Never California Institute of the Arts
1981 Current Current Never Ohio State University, Columbus, OH
1967 Never Past No Response Pratt Institute, Brookyn NY, graduate program
University of Minnesota, graduate degree1962 Past Past Past Columbia College Chicago
SNAAP 2012 Alumni Comments • Education
Sample University
Undergraduate Level
Please list the names of any educational institutions that you attended after leaving this institution.a
Cohort
aAsked of all alumni who pursued at least one degree at another institution. Variable name in Codebook is otherinsts.
bSee "Understanding the Alumni Comments" page for details.
86

Work as Work as Arts Work as Arts Undergraduate Level
Artistb Teacherb AdministratorbComment
2012 Current Never Never There should be some kind of class that explicitly teaches Photoshop, Illustrator, InDesign, Flash, etc.
Most of the classes didn't cover any tutorial on any of the above programs. Full disclosure though, the art
program works very well for certain people, and I may have attempted to get the wrong degree. I will say
that this institution had a lot of great professors with scintillating wit and profound insight. The art history
program was amazing, in my opinion. And some of the studio art classes gave me a greater appreciation of
my own craft. The Graphic Design program, however, is competitive and has very little room for people
who need to explore where they are going in life. It is not a nurturing program, but it does aptly prepare
people for how people treat art outside of a classroom.
2012 Never Never Never I believe the students should have a strong say in which Professors are allowed to have tenure. I have
found that many of the Professors I believe to be tenure-worthy were not accepted, but others were granted
the opportunity without deserving so. Also, I think that students need to learn more technology based
design, and need a strong marketing and business class incorporated into one of the necessary studio
classes. I found that these skills are crucial, and I did not find these elements in my classes.
2011 Current Never Never As an Art History major now pursuing a graduate degree in the field, I think some of the art history classes
are pitched too low. I especially think the Senior Seminar should be more practical in terms of providing a
strong writing sample (for grad school applications) and more options/seminars for professional
development.
2011 Never Never Never I felt like the professional practice class should have been a bit longer, or more thorough. I feel a little
under prepared and overwhelmed trying to freelance. I think that other opportunities other than
freelancing where not talked about enough (in-house illustration opportunities etc.). We were also
required to do an internship to graduate and prepare us for the real world, which is an awesome idea, but I
had many many problems desperately trying to find something, which was very stressful. I felt that this
institution could have helped out more with internship placement, especially since it is required to
graduate. I know a couple of classmates who did not graduate on time because they were unable to find
internships.
SNAAP 2012 Alumni Comments • Institutional Experiences
Sample University
Undergraduate Level
Is there anything that this institution could have done better to prepare you for further education or for your career? Please describe.c
Cohort
bSee "Understanding the Alumni Comments" page for details.
cAsked of all alumni. Variable name in Codebook is edpreptxt.
87

Work as Work as Arts Work as Arts Undergraduate Level
Artistb Teacherb AdministratorbComment
Cohort
2009 Current Never Current Some of the professors were AMAZING, others were just okay. But the general attention to career
preparation, working with local companies on real projects to gain experience while in school, and having
students teach each other and work in teams was just incredible and extremely helpful in my career.
2006 Current Never Current Mandatory internships. More front end development skills for the graphic design program. More school /
life balance for the classes. The ability to minor in graphic design or industrial design. The ability to take
industrial design courses while in another program. More business-minded dialog from teachers.
Mandatory business classes (graduating with a BFA and not many basic office business skills really sucked
and made my first 2 years out of school quite difficult.)
2006 Past Never Past More access to courses outside of major. More course offerings. Printmaking was never offered although I
was a Painting major. I felt a great deficit in knowledge of different art practices. In my MFA program the
vast majority of painters were very knowledgeable of printmaking techniques and methods. I also work in a
3D format now and I never received much instruction in sculpture techniques (casting, woodworking, etc)
which has added to my struggle with the sculptural elements of my work.
There weren't many opportunities for non-majors to take graphic design courses. I would suggest offering
Photoshop and Web Design courses for non-majors.
More opportunities to take courses focused on technique. The most virtuoso painter in the department
never taught foundational painting courses like Figure Painting, Methods and Materials. I felt that was a
major missed opportunity to improve my painting.
If Graduate students are going to teach a course by themselves, then they need good training on pedagogy
and curriculum planning. I found courses taught by graduate students the least beneficial due to their lack
of experience or lack of interest in teaching.
More explicit teaching and modeling for critique. I left with a gap in my abilities to speak about work. I
believe this was a major factor in not being accepted into the top-ranked MFA Painting program in the
country.
2005 Current Never Never That is a difficult question to answer. I don't believe I was well prepared for a "real world" career in many
ways - but I also do not lay much of the blame on this institution, I came out of this institution with my
BFA in Graphic Design and that degree and my education have served me EXTREMELY well in both
acquiring work and securing creative careers. I think it is just one of those things that you need to learn
much of on the fly. It is hard to be prepared (and, I imagine, prepare a student) for careers in the "real
world."
bSee "Understanding the Alumni Comments" page for details.
cAsked of all alumni. Variable name in Codebook is edpreptxt.
88

Work as Work as Arts Work as Arts Undergraduate Level
Artistb Teacherb AdministratorbComment
Cohort
2005 Past Past Past Create a better system for major selection. It was a crap shoot with very little time in advance to
experience new mediums and majors before we were all competing for select slots. Once we were herded
into majors and some students left for other opportunities, it was demoralizing to hear several students
mention that they received exceptions to their select major after private 1 on 1s were completed; despite
being originally turned down.
2004 Past Never Never They could've told me to get a practical degree so my children don't starve, and that I should save my
hundred thousand dollars, so that I would not be in this hellish cycle of trying to pay back debt that I
cannot afford.
2004 Never Never Never I can't seem to remember a big push for technological teachings, or to go to grad school, or to go get an
internship. I remember a lot of people in my class being self-motivated to learn programs and get jobs in
the industry, and while I did a few interviews, I didn't go forth and pursue further education until I'd been
out of school for a few years. I also have never worked in the design industry (although I would have liked
to). When I came back from studying abroad, I felt like I had missed a big part of education that moved my
classmates forward, even though I had invaluable experience from my abroad program. I also felt like I
almost needed a second bachelor degree in order to really be successful in the professional world.
2003 Past Never Never There is a serious lack of understanding of learning disabilities and how to address them as a professor. I
had some professors who didn't understand at all and had to educate them that my need for support was a
right and not a privilege. Other professors, especially in Art History, were very supportive of my needs and
allowed me to take my exams with Department of Rehab Education Services or have an alternative
formatted test (ex: oral exam) depending on the assignment. I was successful when given flexibility and
options to demonstrate my mastery of course content.
2002 Current Past Never I loved the focus on conceptual and critical thinking, but there was very little taught about "real world"
experiences. After graduation it was somewhat tough adjusting to a real work environment and
understanding the business and financial goals associated with a creative company, especially within
advertising. It would've been great to have a faculty member or two who worked within a more realistic
setting to offer advice and examples of real world experiences. My experiences are mostly focused in
design and advertising, so I can't necessarily speak to other majors or creative industries.
2002 Current Never Never More professional practice- how to freelance, what to charge, portfolio prep, taxes, resume writing and
website creation2002 Past Never Never As far as artistic training, no.
However, I could have STRONGLY used some business and management skills post undergrad. I came
out of this institution with no knowledge of how and artist should/could/would survive in the "real world."
Had I know or been advised to pursue some basic business courses, I believe I would have had much
greater success as an artist trying to survive outside of the academic realm. This is and will always be my
greatest complaint about my undergraduate education at this institution.
1999 Past Past Never Better professional practice preparation courses and arts-related business acumen training.
bSee "Understanding the Alumni Comments" page for details.
cAsked of all alumni. Variable name in Codebook is edpreptxt.
89

Work as Work as Arts Work as Arts Undergraduate Level
Artistb Teacherb AdministratorbComment
Cohort
1998 Past Past Past Better work/paid oriented opportunities
1993 Never Never Never Study of the financial aspect of Art
1987 Current Never Current When I attended, the experience was different than it is now. When I attended, I felt we needed more
instruction in the areas of design that would make us more employable once we left. We needed to learn
more about working with mentors & peers, learning how to manage projects within a workday, accepting
and learning from critique, and managing our business as a freelancer. A little ego-management may have
been handy as well.
1974 Current Current Past Majored in fine art Photography. It gave me the ability to create my own vision in what I wanted to do over
the next 30 yrs. of my career in being a Photographer. Excellent foundation for me. I never looked back.
1968 Current Never Never Information on building a portfolio and job hunting/networking.
bSee "Understanding the Alumni Comments" page for details.
cAsked of all alumni. Variable name in Codebook is edpreptxt.
90

Work as Work as Arts Work as Arts Undergraduate Level
Artistb Teacherb AdministratorbComment
2012 Current Never Never the support services offered by this institution to alumni are more then adequate, but based on how I was
treated by my advisors while I was there I don't really trust that I will be listened to and feel I am better off
using outside resources to help me build my professional career.
2011 Current Past Past Better Job positions. There is a lack of global agencies which I have had to seek out myself, so it would be
nice to have access to these types of places for future students. More opportunities overseas are a must that
career services should include.
2010 Current Current Never I'd be interested in advising for further education -- aside from speaking with my personal mentors in the
industry, it would be great to be able to come to someone at this institution with questions around pursuing
an MFA one day. I'm also unsure of alumni networking opportunities -- it would be great if we had mini
Alumni chapters in major US cities across the country. I'd be happy to host a dinner/drinks event for fellow
alumni in my current city.
2010 Current Past Never I wish that there was a mentorship program between current students and recent to past alumni. Again
offering a hands on relationship where a student could get a sense of the world post graduating and can
also network as well.
2006 Past Past Never If there is a support services center for students with learning disabilities, it might help to make the
availability better known; I am unsure whether one exists but it might need to be made a little more
obvious if so, so that those in need could know what their resources are for getting help keeping up with
their peers.
2004 Current Past Current The presence of the school in the city and its ability to network through its alumni and help promote real
world opportunities to its students is rather pathetic. Compared to other schools, this institution could do a
much better job at helping its students find jobs.
2000 Current Past Past A basic and easy way to find out what existing services I am entitled to would be a great place to start.
1998 Current Past Never Would suggest a cont. ed course in "changing careers" - I went from animation to design and I had little
design training at the time. It would have been helpful to be in a class with others transitioning from one
artistic, creative career to another.
Please describe any support services you need, but are not offered by this institution.d
Cohort
SNAAP 2012 Alumni Comments • Institutional Experiences
Sample University
Undergraduate Level
bSee "Understanding the Alumni Comments" page for details.
dAsked of all alumni. Variable name in Codebook is supttxt.
91

Work as Work as Arts Work as Arts Undergraduate Level
Artistb Teacherb AdministratorbComment
Cohort
1994 Past Never Current Ongoing professional development opportunities, and PROFESSIONAL networking opportunities, are
always welcome. I am not at all interested in alumni activities that are primarily focused on sports or
general socializing.
1993 Current Current Never The most difficult thing after graduation for me and many of my peers is access to a studio. If this
institution could support their students by helping them gain access to studio time and space in the post
college world, it would help so many people get a better, more productive start. Networking only partially
solves this problem. But, it is not a solution in and of itself. It took me 20 years to "earn" a studio
commensurate with the studios I had access to while at this institution.
1990 Current Current Past I am not aware of any calls for public art opportunities. I knew there used to be a gallery run by the school
that alumni could show at, but I don't know if that still exists.
1987 Current Past Never Like many people, I kind of keep my head down and plow ahead. It would be prudent of me to do more
exploration of opportunities, especially in this economic climate and my stage of life. Sorry if this answer
was a digression from your question.
1986 Past No Response Never Perhaps coursework on making art and selling in in the contemporary art market so as to make a living, if
possible, being an artist. Exposure to art markets and how all of that works.1985 Current Never Never I am encouraged to see the above options offered and may explore them. I would say I have not been
aware of these options until very recently.1984 Current Current Current Critiques with professional artists
People to review proposals for grants (willing to pay!)
List of photographers who can document my art
How to market
How to do the social marketing1981 Current Past Never I could have used support for my hearing impairment. I graduated over 30 years ago and figured out how
to cope on my own, but it has definitely impaired my earning potential.
1977 Past Past Never I would like to take a course(s) on using web 2.0 or current tools for teachers in teaching in a computer lab
elementary school. I heard that the University offers this now to teachers.
1973 Past Past Past I would like to do more research from home but I have had difficulty gaining online access to the library
through the Alumni Association. Quite a runaround, so I've given up and drive to campus when I need to.
1971 Current Current Past I love the magazine the institution used to send out and I used to send in things like notifications of grants
or awards that I received once in a while. As an artist and college professor who gets 300 emails a day, I
cant spend any more time on the internet without sacrificing my work time. I wish that the current faculty
had a presence at the College Art Association, either by running for the board of participating more on
panels etc.
bSee "Understanding the Alumni Comments" page for details.
dAsked of all alumni. Variable name in Codebook is supttxt.
92

Cohort Work as Work as Arts Work as Arts Undergraduate Level
Artistb Teacherb AdministratorbComment
2011 Never Never Never There are too many people with Art degrees than there are jobs available.
2010 Never Never Never I graduated with a degree in both Art Education and Painting, and was hoping to find a job as a K-12 art
teacher, however this was in 2010 and many art teaching jobs were being cut at the time. I instead worked
in bilingual education (as I had a Spanish minor), and spent a year traveling. When I came back, art
teaching jobs were still sparse, so I took a job as a 3rd grade bilingual teacher instead.
2008 Never Past Never My personal interests have always been a combination of technology and art. That, extremely high student
loans, and high paying technology/web jobs ultimately pushed me towards becoming a full time web
developer.
2004 Never Never Never I applied to several jobs but could not get hired in an art related field.
2001 Past Past Current I got away from being an artist per se as I got more into management then ultimately sales. When I decided
to take time off for health as well as child rearing reasons I forayed into other areas more directly pertinent
to my life and skill set. Also, it's hard to project manage from home!
1999 Never Never Never I was training to be an art therapist, however graduate studies were required. As a fine art/psychology
student, jobs that I was seeking were human service related with the ability to use my Fine Art background
as a method to engage others in therapy services.
1996 Never Current Current I pursued work in arts administration because it was an ideal mix of my interest in art and psychology. I
always knew that I would be most comfortable with a steady paycheck. I consider doing independent
artwork after my son finishes college. Until then, I want a steady income - and, for the most part, I like my
job.
1993 Never Never Never I had no idea how to seek employment. A few of my classmates were picked for internships as students,
they are the only ones I know who have careers in their chosen field.
1991 Past Never Past I was laid off and couldn't find work as a graphic designer in print plus industry has changed where many
companies require designers to have knowledge and computer skills in both print and web.
1984 Never Never Never For the first number of years I pursued an intense religious training: along with needing to work full time to
pay off the student loans, it left little time for art making or art career advancement. After a time I married
and had children. Children had major health issues.
SNAAP 2012 Alumni Comments • Career
Sample University
Undergraduate Level
If there was another reason why you either stopped working in an occupation as an artist or chose not to pursue work as an artist, please
describe that below.e
bSee "Understanding the Alumni Comments" page for details.
eAsked of alumni who were never or past professional artists but intended to be when attending this institution. Variable name in Codebook is stp_othtxt.
93

Cohort Work as Work as Arts Work as Arts Undergraduate Level
Artistb Teacherb AdministratorbComment
1981 Never Past Never Artistic work not available' doesn't quite describe the situation I encountered after obtaining my MFA.
Academia in the late 1980's and 90's was a shrinking field of employment opportunity for artists, while the
number of qualified persons seeking those positions was exploding. Of the entry level teaching positions I
applied for where statistics were returned, no offering had fewer than 200 applicants and many had over
400. The overwhelming majority of offerings were non-tenure track temporary positions, salary levels were
discouragingly low and many were already filled by in place people who were simply re-applying for the
temporary position they were already in. I don't suppose I ever thought I might get rich or that money was
the motivating factor in choosing a discipline in the arts, but living the cliché of a starving artist is not, in
the long term, a healthy life style!
1973 Past Past Past I developed my graphic arts/marketing free-lance business while my children were growing up....When I
became a single mom, I needed the protection of a job that provided a steady predictable income and
healthcare benefits. I was fortunate to find a new career path in not for profit management. I was able to
wear many hats...my fine arts training and creativity was utilized as I helped brand the agency visually and
present the compelling messages of the work of its mission and service to the community
1970 Past Never Past I worked as an art director for 6 years. I then moved into management and later became an account
manager and worked on teams with art directors and copywriters. I worked at an ad agency for the last 11
years of my career. I retired early and my husband & I started a landscape tree farm. I also took up
woodturning and enjoy that greatly.
1957 Past Past Past I have officially retired from the active profession of Advertising where I served as an Executive Creative
Director and Art Director. Since retiring, I began another career as a sculptor where I specialize in both
figurative and contemporary work.
bSee "Understanding the Alumni Comments" page for details.
eAsked of alumni who were never or past professional artists but intended to be when attending this institution. Variable name in Codebook is stp_othtxt.
94

Work as Work as Arts Work as Arts Undergraduate Level
Artistb Teacherb AdministratorbComment
2007 Never Current Never My student teaching co-operating teachers had a great impact on my career. My student teaching cohort
was also very influential.
2004 Current Never Never My career was started when I was hired as a Junior Designer by a faculty instructor. Friends/peers and
instructors are possibly the greatest asset this institution possesses in terms of job hunting and networking.
1995 Past Never Never I used local advertising professionals in the community. The time I spent with them as mentors was crucial
to my success. this institution had zero part in creating that network.
1993 Current Never Never Full time faculty!! They are the life-blood of a genuine, effective education. Period. I would not consider
returning to this institution at this time due to a lack of full-time faculty. Having "adjunct" is simply not the
same. It's all about the teachers - not the VP's (of which you have WAY too many), administration, or
visiting artists; all of which serve a role, but NONE as vital as the full-time professors, who should be
leading the organization.
1977 Past Past Never Other faculty that were not at this institution influenced me more than in my college. I wish they were more
involved with me as a student and took an active interest as an individual. Too distant, too cold.
1965 Never Never Never An alum helped me with entrance admission and scholarship funding, which was very valuable.
My graduate school networks were more important later.
If there are any other networks associated with this institution that have had an influence on your career, please describe them below.f
Cohort
SNAAP 2012 Alumni Comments • Career
Sample University
Undergraduate Level
bSee "Understanding the Alumni Comments" page for details.
fAsked of all alumni. Variable name in Codebook is infothtxt.
95

Work as Work as Arts Work as Arts Undergraduate Level
Artistb Teacherb AdministratorbComment
2012 Current Never Never Very relevant. I was able to work from being an intern to account manager is less than a month because of
hard work and a skill in creative problem solving.
2012 Current Never Never A lot of the visual illustration courses were extremely helpful to my skills, and knowledge of how to take
critique, and use it to improve. This helps not only in my costuming, but my color theory, and other 2D
commissions. I wish a little more time had been spent on the business aspect of things; however, I am
employed, not self-employed, so thankfully, I can survive on a preset standard. Casting and mixed media
was directly related, I am now doing mostly just that. I wish that there were also medium courses that
taught more than a traditional paintbrush, like what the masters used.
2012 Current Never Never I developed as an artist and designer while going to this school. Learning formal techniques was very
important as well as the encouragement of presenting work in front of my peers. It was an introduction to
the formal art world.
2012 Current Never Never I'm a full time freelance illustrator, working in children's books, editorial, advertising, fashion, and a
million other areas, and I also sell prints of my work in galleries and online. My arts training as an
illustrator was relevant in pretty much every way... From the individual classes I took, to the skills we were
taught, to the professional guidance provided.
2012 Never Never Never My training is relevant because I use programs like the Adobe Suite. I feel my training is not relevant
because I do not have the job I currently want. While this may be because of the economy, I think the
effort I put towards in my education should reflect in my current career, however, it does not. I studied
abroad, I had multiple paid internships, I studied and graduated from two arts degrees, I come highly
recommended from my Professors. Still, I cannot find a job. I think this is partially because I did not
receive web-based training, and this is severely hurting my chances of finding a career.
2011 Current Never Never Adobe Suite skills and web design skills learned at this institution were essential to become a Front End
Developer. Illustration and Comic Arts technique, and portfolio, were quite essential to landing a paid
webcomic gig.
2011 Never Never Never The only thing that is relevant is I know how to use a roller and brush.
Please describe how your arts training is or is not relevant to your current work.g
Cohort
SNAAP 2012 Alumni Comments • Current Work
Sample University
Undergraduate Level
bSee "Understanding the Alumni Comments" page for details.
gAsked of all alumni who are currently working. Variable name in Codebook is wktraintxt.
96

Work as Work as Arts Work as Arts Undergraduate Level
Artistb Teacherb AdministratorbComment
Cohort
2010 Current Past Never My arts training is directly relevant to my fine arts practice; I am using technical, critical thinking, and
professional practice skills I learned at this institution. It is indirectly related to my job as a barista; I use
my attention to detail and the idea that craft is very important.
2010 Past Past Never I know how to manage a project overall, maintain professionalism, and use materials properly. These help
me successfully execute odd jobs here and there. But in my own work this institution taught me how to
manage to do whatever I want to do and not look like a bum. Arts training (lets say its the entire undergrad
experience at this institution) is relevant, though I could have pursued my own research and training with
help from someone who has gone through a program like this institution.
2010 Never Never Never My training in art education was very relevant to my current work as an elementary school teacher. The art
education program offered me many opportunities to develop my teaching and planning skills with many
age groups. However, my training focused on arts education, so the content I am working with currently is
very different from what I studied. My painting training is not relevant to my current work at all.
2009 Current Never Never As a bench jeweler I am required to be attentive to detail constantly, know how to follow shapes of rings
when parts are missing, and required to know when to stop working on individual projects to keep my time
managed and customers happy. In reference to specific skills and techniques learned while in school, only
a small portion of them are used daily. For example, sanding, filing, minor wax work. My arts training
does not specifically apply to my work as a vet tech/assistant however general work skills are still relevant.
2008 Current Never Never My "arts related career" is separate from my sales career. I work full time in an arts and craft store to pay
my loans and support my family. Currently my art career is making a webcomic and attending conventions
in hope that I may someday be completely self employed.
2008 Never Never Never When thinking about large technology projects before we (co-workers and I) start them, I can pull from
what I learned when working on my large art projects. For instance, if I didn't plan ahead much on an art
project, the results were never as polished and complete as the times I thought through the whole process
before diving in.
2007 Never Never Current Critical thinking, creative strategy, and explaining the concept and process is a daily part of my current
work.2006 Past Never Past It is not relevant. I am confined to a cubicle, sorting paperwork, nothing creative, and no room for
advancement. Creative thinkers are frowned upon at the job I currently hold, but it is steady work, that
offers benefits.
2002 Current Never Never Industrial design really taught me to look for creative, strategic solutions and that's pretty much 100% of
what my company does. What the arts didn't train me for is how to run a business of my own and how to
market myself and company.
bSee "Understanding the Alumni Comments" page for details.
gAsked of all alumni who are currently working. Variable name in Codebook is wktraintxt.
97

Work as Work as Arts Work as Arts Undergraduate Level
Artistb Teacherb AdministratorbComment
Cohort
2002 Never Never Never The things I learned at this institution are completely irrelevant to becoming a good painter. The only thing
I learned that has been of value is stretching my own canvas. I am also quite adapt at searching the web for
topics like "learn how to paint in oil."
2001 Current Never Never Gave me critical eye for design, even though I was in drawing/comics classes. Good ability to give
feedback on work, improve my own work based on others feedback.2000 Current Past Current My arts training provides a crucial background for my career as co-founding principal of a 10-person
graphic design studio specializing in work in the cultural sector.2000 Current Past Never Daily, I have to perceive though my eyes, process / analyze with my mind, communicate / translate to
others with my voice and create with my body.1998 Never Never Never My artistic training has come in handy when working with art therapy techniques as a therapist. It also
helped with exploiting my creativity and how to use that with clients, how to express myself in an abstract
way, and how to continue to use my artistic talent as self-care when I need it.
1997 Past Never Current I am currently pursuing a PhD in Education (Higher Education) after working in higher arts education for
over 10 years. So my arts training is vital to my current work in content knowledge, understanding of
context, student characteristics...so many ways. Not to mention, my arts education has benefited me as a
researcher as I am comfortable with and enjoy making sense of the "mess" of data, perhaps more so than
my non-arts peers.
1993 Current Never Never The graphic design training I had at this institution still relates to the design projects that I presently work
on 18 years later.1993 Never Never Never I use it to design brochures. Not at all what I was hoping for.
1990 Current Past Never My arts training was in graphic design and illustration. I found myself very prepared to do well in
illustration, though not so much with graphic design. I work primarily as an illustrator now so this is OK.
My illustration teachers gave me advice about how to put together a portfolio, find contacts and seek work
as an illustrator. This has been invaluable. In addition, I've branched out on my own to author a few books
as well. I had some good writing teachers at this institution who helped me attain the skills I need to do this
kind of work. My occasional work in music is unrelated.
1987 Current Never Current My arts training has always been relevant to my work. The creative problem solving skills I learned have
been valuable to me all the way along. The critique skills developed during my studio classes have always
enabled me to take and deliver criticism productively, and largely without offense. I have also gotten old
enough now in my career to be able to identify my particular creative process and articulate it. That is
rewarding to me personally, but also allows me to be a good mentor for young people who wish to pursue a
creative career. Maturing has its rewards.
1987 Past Past Never Emphasis on developing computer skills started in college has stayed with me throughout my professional
life. Critical thinking skills developed in college continue to be very important in my current career as IT
professional.
bSee "Understanding the Alumni Comments" page for details.
gAsked of all alumni who are currently working. Variable name in Codebook is wktraintxt.
98

Work as Work as Arts Work as Arts Undergraduate Level
Artistb Teacherb AdministratorbComment
Cohort
1987 Past Never Never Liberal arts background, spatial thinking, divergent problem solving, and a technical foundation give me
an enormous advantage as a software and systems architect.
1986 Current Never Current My graphic design degree has enabled me to make a living for many years as a creative director, designer,
consultant in advertising and marketing, as well as given me the skills to curate art galleries and shows in
my community. I sit on several non profit boards for arts and culture.
1985 Current Current Past The broad range of art, design and communication skills I learned at this institution have allowed me the
versatility and flexibility to offer a broad range of services to my clients and former employers over my 25
year career. That my degree in Industrial design demanded I learn to sketch & draw, draft, graphic design,
render and prototype allows me the ability to better survive the booms and busts of the economy by having
the ability to provide so many skills and services.
1985 Past Never Never A good design sensibility is applicable in all aspects of work and life in general, and it informs my current
work. Critical thinking and problem solving skills taught through the design program are still invaluable, as
were the general rigors of dealing with bureaucracy and standards.
1984 Current Never Past As a student of Fine Arts, this institution gave me the capacity to understand a broader perspective of the
arts that I use today. I do not directly use the actual study, such as large drawing of the nude, but the whole
picture is applicable.
1984 Never Past Current I do think the critical thinking skills and creativity I enhanced at school have been extremely useful for my
work in museums.1983 Current Never Never As a self-employed designer/inventor, my ability to conceive products, refine them, build them, sell and/or
license them, and make them appealing, manufacturable, profitable, and successful are all rooted in visual
and tactile design skills I have learned and mastered over the years.
1981 Never Past Never My most valuable skills are my ability to learn new things and a determination to succeed. My education in
the arts taught me how to be resourceful, how to question and not merely answer, and to persevere. The
arts have taught me how to learn and given me the confidence to know that I can adapt and survive and
find a place in our economy.
1974 Current Never Never In my current job as a Horticultural Therapist (which I was funded to design the structure for and then
implement), I use my creativity each and every day. With my elder clients, I design raised pots, beds and
gardens for four facilities, and then facilitate their planting, tending and maintenance. Training my eye was
crucial to this current job. Being creative (perhaps ambiguous but nevertheless REAL) is something that I
am grateful for daily! I wouldn't be able to function without a constant flow of new and improved ideas!
1962 Current Past Past My arts training has helped me in designing and in working with other designers in advertising my
business. Organizational skills, interpersonal communication and guidance of clients are all part of the
many skills I use daily as I develop and maintain and work with a client base to meet their needs and goals.
bSee "Understanding the Alumni Comments" page for details.
gAsked of all alumni who are currently working. Variable name in Codebook is wktraintxt.
99

Work as Work as Arts Work as Arts Undergraduate Level
Artistb Teacherb AdministratorbComment
2012 Current Never Never Graphic designer, illustrator, or art
director
Design Fellow, work in house at a studio to design print and some
online materials for an educational institution and other clients, often
non profit or local.
2012 Current Never Never Graphic designer, illustrator, or art
director
I am a freelance designer & illustrator, working with children's books,
editorial, advertising, etc., for clients such as Nike, Wired Magazine,
Anthropologie, Target, Houghton Mifflin Harcourt, and many small
businesses.
2012 Current Never Never Communications Account Manager: I manage an account for a high end men's fashion
line. My work is communicating between the client and our agency to
ensure a level quality in our work. On top of this, I manage the in
house product photography as well as rental of our photo studio.
2012 Never Never Never Other designer Associate User Experience Designer. I work within a design team of
8 people. We do research & discovery, design ideation, planning and
design strategy for interactive projects of almost any type.
1998 Never Never Never Social services I am a private practitioner as a Licensed Professional Counselor and
addictions counselor. I work with children, families, teens and adults
struggling with mental health and addictions.
1996 Never Never Current Museum or gallery worker,
including curator
I am currently a Collections Manager. I care for a collection of over
3,000 scientific instruments, works on paper and rare books. I support
curatorial work, outreach and interpretation.
Cohort
Please provide your job title and brief description of your work in the occupation in which you spend the majority of your work time.h
SNAAP 2012 Alumni Comments • Current Work
Sample University
Undergraduate Level
Occupationi
bSee "Understanding the Alumni Comments" page for details.
hAsked of all alumni who are currently working. Variable name in Codebook is majtimetxt.
iOccupation for majority of work time. Variable name in Codebook is majtimejob_R.
100

Work as Work as Arts Work as Arts Undergraduate Level
Artistb Teacherb AdministratorbComment
Cohort Occupationi
1993 Current Current Never Computer and mathematics Most recently with regard to employment, I was a Sr. Program
Manager specializing in business intelligence and data analysis on the
Microsoft Office Excel team. Prior to this, I was a Sr. Program
Manager for SharePoint. In general, my job at Microsoft was to
invent and engineer new technology, develop intellectual property,
conduct research, define and implement next-generation software,
collaborate broadly across the company, and represent Microsoft
technology to the general public.
1993 Current Never Never Other I am a self employed, independent Social Media Consultant with a
background in User Interface Design and Multimedia disciplines. I
stay up on communication and design trends, and I'm excited about
the pace of change across social media networks and making sure our
clients are in the know (Facebook, Twitter, Google+, LinkedIn, and
more.)
1993 Never Never Never Other occupation outside of the arts My current title is Implementation Project Manager. I work with
external clients to implement my company's products and services for
their business needs.
1992 Current Past Never Graphic designer, illustrator, or art
director
Principal, Graphic Designer, Owner. I own a small, full-services
design boutique offering design services to a variety of non-profit arts
related clients.
1987 Current Past Current Graphic designer, illustrator, or art
director
I am currently a co-owner of a small graphic design firm. My clients
range in scale from one of the largest non-for-profit organizations in
the United States, Ford Foundation, to one of the most creative, New
York Public Radio. I am the primary manager and creative director in
my firm, where I typically direct a staff of 3-5 designers throughout
the year.
bSee "Understanding the Alumni Comments" page for details.
hAsked of all alumni who are currently working. Variable name in Codebook is majtimetxt.
iOccupation for majority of work time. Variable name in Codebook is majtimejob_R.
101

Work as Work as Arts Work as Arts Undergraduate Level
Artistb Teacherb AdministratorbComment
Cohort Occupationi
1985 Current Current Past Graphic designer, illustrator, or art
director
I spent 25 years designing retail and themed-entertainment
environments, including VP/Creative Director roles at several design
firms nation-wide. I managed the design, production and oversaw
construction of countless multi-million $$ projects all over the world
working with clients like Macy's, Bloomingdales, Wanamakers,
Neiman Marcus and Saks as well as House of Frasier (UK), Tangs
(Hong Kong), Central (Thailand), Metro (Indonesia) and Seibu
(Japan) were I designed the architecture of their stores along with all
the furnishing and fixtures and ALWAYS did all my own
presentation renderings and presentations. I also provided private-
label branding/identity/graphic design services as well as designing
signage programs.
1985 Current Past Never Fine artist I describe myself as a drawing-based, mixed-media installation artist
and object maker. I am presently learning a completely new medium
from scratch: clay. I don't really make a terribly commercially viable
'product' per se, and I have found gallery representation is not really
for me. I depend heavily on grants and other sources of funding to
finance my projects. As a mid career artist, I find getting exhibition
opportunities to be much more difficult than when I was a somewhat
'in vogue' younger, emerging artist. I don't think I'm alone in these
circumstances, and it's too bad this institution doesn't do more to help
it's alumni by providing an exhibition forum for them.
1985 Current Never Past Graphic designer, illustrator, or art
director
In my career I have held the following job titles: Design Manager,
Design Director, Creative Director, Design Production Manager, Art
Director, Senior Graphic Designer & Graphic Designer.
1982 Never Never Never Other Painting, Illustration, decor, and mixed media work for sale through
myself, commission, gallery or online.1981 Current Past Current Graphic designer, illustrator, or art
director
Graphic Design consultancy offering wide range of services
including: branding/identity, print communications, web design and
environmental graphics.
1981 Never Never Never Other Currently, I teach self-contained and inclusion high school English
classes for students with various disabilities (i.e. learning,
emotional/behavioral, cognitively impaired, autistic, etc.) ranging
from non-readers and writers through twelfth grade in the same class
setting. In the past I have worked as a case manager conducting
cognitive and academic assessments.
bSee "Understanding the Alumni Comments" page for details.
hAsked of all alumni who are currently working. Variable name in Codebook is majtimetxt.
iOccupation for majority of work time. Variable name in Codebook is majtimejob_R.
102

Work as Work as Arts Work as Arts Undergraduate Level
Artistb Teacherb AdministratorbComment
Cohort Occupationi
1980 Current Past Never Other designer I am a self employed painter, mostly of signs with an emphasis on
signs with pictorials. That work leads to mural jobs and all kinds of
other types of painting. I have commissions for oil paintings, private
murals both interior and exterior. I have recently started a second
business that has me working with communities to create murals.
1979 Current Never Never Graphic designer, illustrator, or art
director
I currently work as a interface usability specialist, but I provide
design, illustration, photography, writing, media and creative
brainstorming assistance where needed.
1978 Past Current Past Craft artist I make retail craft artworks out of post-consumer recyclable plastics
and teach techniques for doing this consistent with my book on the
same subject.
1977 Current Never Current Photographer I am a self employed free lance photographer.
1976 Current Never Current Other As Director of Marketing, my position is two-fold. I am also the
Creative Director and oversee and direct almost all art, video,
tradeshow displays, web site content and a wide variety of other
media campaigns. As part of my duties, I have been the Business
Development Director, India. Have traveled to India on many trips
promoting the industrialization of housing construction through the
use of products sold by the company I work for, Western Forms.
Western Forms also has other sister companies that I am involved
with, directing a multitude of marketing endeavors.
1975 Current Current Past Fine artist As an artist I explore and interpret ideas, emotions and experiences.
A multilayered artwork can create a dialogue between the artist and
the viewer and can be enjoyed on many levels. I look for the essential
element or elements of a subject and find visual symbols for these
elements and create a narrative. Some symbols are obvious universal
symbols, some are personal symbols that I hope speak to the
universal psyche, and many introduce themselves intuitively and can
only be understood on an emotional level.
1970 Past Past Never Education, training, and library I taught in an elementary school as a Title I reading and math teacher
K-8 and later as a first grade teacher for a total of 24 years.
1969 Current Never Current Communications Creative Director. Work for non-profit arts organizations. Skills used
include art direction, writing, and management. Also write and edit
for websites, documentaries, and publications.
bSee "Understanding the Alumni Comments" page for details.
hAsked of all alumni who are currently working. Variable name in Codebook is majtimetxt.
iOccupation for majority of work time. Variable name in Codebook is majtimejob_R.
103

Work as Work as Arts Work as Arts Undergraduate Level
Artistb Teacherb AdministratorbComment
Cohort Occupationi
1964 Past Past No Response Education, training, and library Ph.D. in Education—course development, curriculum development,
faculty development programs, teaching, adult education
1962 Past Past Past Graphic designer, illustrator, or art
director
Graphic Designer designing corporate identity, signage, annual
reports, product literature, educational materials, exhibits, packaging,
book design and private book publishing.
bSee "Understanding the Alumni Comments" page for details.
hAsked of all alumni who are currently working. Variable name in Codebook is majtimetxt.
iOccupation for majority of work time. Variable name in Codebook is majtimejob_R.
104

Work as Work as Arts Work as Arts Undergraduate Level
Artistb Teacherb AdministratorbComment
2006 Current Current Current I feel a combination of both my college and work experience has been relevant to my participation in civic
and community life. However when I was a student I didn't see or get opportunities to take part in that. I
know now that this institution has several opportunities for students that I didn't have- which is good.
2006 Current Never Current My art history degree increased my knowledge and comfort level with diversity, politics, literature, and
world affairs. This has served me well in helping me be a more engaged and productive member of my
community at home and abroad.
2006 Past Current Never This institution cultivates a very competitive, self-centric approach to art making, not conducive to
community building or foraging future professional relationships or peer networks.
2006 Never Current Never My arts training is relevant in that it allowed me to further develop artistic skills and concepts to then pass
on to others in the community. Critiques of artwork taught me how to openly communicate with others
about the arts.
2005 Current Never Never My civic and community interests lie outside of my arts training for the most part.
2004 Current Current Never I have never enjoyed the community because my work isn't usually accepted in a fine art environment. At
least that's what I have gained from the years. So I choose not to engage.
2003 Current Current Never I think this institution teaches students to become involved in their arts communities. They breed the type
of people that want to be involved and make a positive impact on the community around them.
2002 Current Past Never I think that I've learned leadership skills, teamwork, self-discipline and empathy for others during my work
experience over the past 9 years. These are important life skills that I lacked after graduation.
2001 Current Current Never Most, if not all of my civic and community life is directly related to my career as an artist and arts
educator. I have volunteered for local museums and art centers that offer summer programs to children. I
have created artwork for local businesses or organizations, and on occasion, I donate money as alumni of
institutions and residencies.
2001 Never Never Never While I participate in many civic activities, and volunteer over 100 hours per year to non-profits, they are
not directly related to receiving arts training. They are related to other things I am passionate about: youth
sports, faith, and youth mentoring.
SNAAP 2012 Alumni Comments • Arts Engagement
Sample University
Undergraduate Level
Describe how your arts training at this institution is or is not relevant to your participation in civic and community life.j
Cohort
bSee "Understanding the Alumni Comments" page for details.
jAsked of all alumni. Variable name in Codebook is contcomm.
105

Work as Work as Arts Work as Arts Undergraduate Level
Artistb Teacherb AdministratorbComment
Cohort
1999 Current Past Past Through my studies I became aware of how influential a still or moving image can be in changing the way
people perceive the world around them and I remember this every time I turn down or accept a job that I
feel will impact human social behavior.
1998 Never Never Never It makes me more aware of what is available in my community and provides a level of diversity to see
many things from exhibits to plays.
1997 Past Never Current It is very relevant as I volunteer at our local community arts organization and mentor young artists on
higher arts education.1995 Current Current Past Not particularly. I don't remember my teachers doing much in terms of charity. However, I learned myself
that the more you give to an arts community the more you ultimately receive.1995 Never Never Never I don't think it is relevant. I attended classes, but did not learn how to participate in the life of an arts
community.
1993 Current Current Never Art and creative expression is an essential to my involvement in both my community and civic life. In
addition to framing my world view, it also provides the vehicle by which I can communicate, and interact
with others around me.
1991 Current Never Never I'm a patron of the arts. I am a member of two local museum organizations. I make an effort to see art.
When I travel abroad I make a specific effort to visit international museums.1987 Current Past Never It is only not relevant because I don't make time to do more of these things. Ideally, it would be quite
relevant. I need to get off my ass and do more in the community.
1985 Current Never Past My arts education and training expanded my world view, made me open to new ideas, tolerant and
respectful of other viewpoints and has influenced my life in almost every aspect.
1983 Current Past Never It is relevant in many of the community projects I've spent time on -- I give art and design help. I've
volunteered in these ways for the Alzheimer's Assn., local library promotions, skating fundraisers, and
other groups, and even at work I've volunteered t-shirt designs, posters, etc. for various causes. I've helped
friends and small business owners understand art and design to help them with their own careers.
1981 Current Current Never It has helped create my community of friends, peers and mentors and the kind of purposes and people I
want to be involved with.
1981 Never Past Never My arts education has instilled in me a life-long identity of being an artist, regardless of whether I am
employed in the arts or going through a period of low productivity in my studio. So, when I have an
opportunity, I try to also be a supporter of the arts, through purchasing art objects or donating to arts
organizations. I also often donate work for charitable art auctions that support either arts communities,
schools or people in need.
bSee "Understanding the Alumni Comments" page for details.
jAsked of all alumni. Variable name in Codebook is contcomm.
106

Work as Work as Arts Work as Arts Undergraduate Level
Artistb Teacherb AdministratorbComment
Cohort
1975 Never Never Never I am involved in civic and community life through work and personal commitment to positive youth
development through various non profit organizations that our company works with but also provides
much pro bono direction, design and support. I also sit on the board of directors for a new non profit
organization dealing with the de-stigmatization of mental illness. I also work with families moving forward
and the homeless. I feel my arts training has provided me with the vision that all people have creativity
and when supported and encouraged, it is a way to heal, to learn, to change, to make your voice heard. It is
a way of boosting self esteem, confidence, and personal satisfaction/happiness through the arts.
1973 Current Never Never My training in graphic arts has given me the ability to donate, for more than 20 years, much needed design
and print production assistance to several nonprofit organizations.
1966 Current Never Past My training at this institution made me a person who is dependable, thinks, believes in community, and
lives a creative life which is reflected in the neighborhood.
1965 Current Past Never Exposing children to the fine arts is a passion of mine. Arts programs are being dropped in schools like
hot cakes and you need fighters to keep the art flame in the fore front. We need the other vision of looking
at the world not just the corporate view of life.
1964 Past Past No Response My participation in community life is more related to my advanced degrees and experience in Education,
not from my BFA.
1963 Current Never Never Expanding your horizons as to the multitude of expressions that are available. What a great world!!!
1962 Past Past Past Having developed the skills to create meaningful design solutions for a broad range of projects, I have the
confidence to interface with anyone at any level at any time and address design problems.
1958 Past Never Never Most of my current contributions to my community and civic life are based upon skills learned at this
institution.
bSee "Understanding the Alumni Comments" page for details.
jAsked of all alumni. Variable name in Codebook is contcomm.
107

Work as Work as Arts Work as Arts Undergraduate Level
Artistb Teacherb AdministratorbComment
2012 Current Never Never Yes, if you could allow students to dream big, and go for the larger companies like Disney and Pixar, and
Dreamworks, or Universal, EA, Blizzard, and so on.... encourage them to contact large companies. Yes,
prepare them for rejection, but don't stick a local in their face. it makes us feel like we'll be stuck in a small
town forever. Not a bad thing, but some of us aren't done traveling yet, or experiencing the world, and
seeing if we can get even better on our own credentials.
2012 Never Never Never My biggest complaint about my time at this institution was the overall safety of students on campus. There
was and still is many incidents where students have been mugged or even injured and nothing seems to
ever be done about it. Several of the public safety employees have poor attitudes and are completely rude
and do not seem to have any consideration for the well being of students. This should be addressed before
someone gets seriously injured or worse on the campus grounds or surrounding. I have personally been
hassled more than once ON school grounds in broad daylight by non-students and really feared for my own
safety only to immediately report the incidents to public safety who did not take me serious and told me
there was nothing they could do.
2010 Current Never Never While there is no one factor to blame for this (this institution, the economy, etc.) I think it's important to
bring up that I had a really hard time finding a job after graduating. I was an over-achiever during college
and did a lot of networking... people were/are surprised that it took me as long as it did to find a related
job. It was extremely upsetting to me for a long time.... but I can't put my finger on something specific that
this institution should have done differently... just more support I guess.
2009 Current Current Never I cannot overstate the negative impact that student loans have had on my post-college life and choices.
Many people encouraged me to take on the student loans and told me that the college degree would be
worth it. While I had a great college experience, none of my current jobs would have turned me away had I
lacked a BFA. This debt is crippling.
2009 Current Past Past I switched into sales simply because I could not find an artistic opportunity that offered the monetary
benefit and involvement with people that I was looking for. Perhaps that is one thing this institution could
have done better - let me know what my options were based on what my interests were.
If there are additional things you would like to tell us about your education, life, and/or career that were not adequately covered on the
survey, please do so here.k
Cohort
SNAAP 2012 Alumni Comments • Facts and Figures
Sample University
Undergraduate Level
bSee "Understanding the Alumni Comments" page for details.
kAsked of all alumni. Variable name in Codebook is finalcomments.
108

Work as Work as Arts Work as Arts Undergraduate Level
Artistb Teacherb AdministratorbComment
Cohort
2006 Current Never Never In general I am happy with my career as a graphic designer. If I had it over to do again I would have done
something in finance because there aren't that many great opportunities to make money as a designer. And
I say this as one of the most (financially) successful graphic designers I know.
2005 Past Past Past I learned more out of the classroom than in the classroom for day to day work skills and survival. Painting
professor was excellent and many other professors were wonderful influences and well respected. Should
probably keep teaching assistants away from teaching classes by themselves as they were absolutely
useless in comparison. T.A.s were more interested in having personal relationships than furthering along
any students.
2004 Never Never Never I would not attend this institution again because of the high cost and amount of debt I now carry.
2002 Current Past Never I loved the fine arts professors. They were extremely generous with their time and attention. I do
occasionally question my decision to attend this institution because of the expense associated with it. My
parents were not able to assist me with financing my education. The debt that has followed me since
graduation has greatly impacted many of my decisions. I'm not sure that I would recommend this
institution to a young person in the financial situation that I was in.
2002 Past Never Never Good survey. Please stress the importance of preparing young artists to survive financially outside of the
college environment.
1999 Current Past Past I was lucky to have exceptional professors that went above and beyond. When I graduated I started
assisting for other photographers. I feel that I should have an opportunity to receive a Masters Degree for
this experience. I would definitely consider myself a Master in my field.
1998 Current Past Never I feel that a more information about the overlap between artistic and scientific interests could lead to better
artists, better scientists and other new fields. In my career I derive the most satisfaction not from purely
creative efforts or purely technical solutions, but from creative problem solving which pulls from
knowledge of the classical arts, training in design and scientific research.
1998 Never Never Never Overall I loved my experience and education at this institution. I wanted to be an art major because I
wanted to enjoy college and not put any pressure on myself while there. I have always been an artist and
always will be - what I do for a living will never impact that. As an artist you have to think outside the box
- am I going to pursue this and make photos for money or am I going to find a job that lets me live my life
and make photos for me? I chose the latter.
1995 Current Current Past I enjoyed my education. I wish I had learned more about the tremendous art education program and
pursued dual degree programs. However, I found my way and have directly benefitted from going to a
large comprehensive undergraduate school with a variety of courses. I loved taking philosophy, Judaism,
poetry and anthropology while studying art. I enjoyed the eclectic nature of my student life and loved
school. I was a good student although horribly rebellious.
bSee "Understanding the Alumni Comments" page for details.
kAsked of all alumni. Variable name in Codebook is finalcomments.
109

Work as Work as Arts Work as Arts Undergraduate Level
Artistb Teacherb AdministratorbComment
Cohort
1993 Current Past Never I think it's important that this institution and art education in general do not focus on commercial
applications and financial success. I know people don't want to go to college and graduate with debts and
no career preparedness, but the more students invest in their creative discoveries, the more of a career
investment they will be making for themselves. Technology and markets will constantly change so focusing
on any current standard too much will render the education obsolete. The only renewable source of value
to an arts education that I see is to foster our own creative process and imaginative tool box. It is the least
tangible aspect of our education, but the most future proof and rewarding.
1988 Never Past Past Considering the difficulty of finding work in the arts, the university needs to be proactive in providing
students with the skills, knowledge and networking needed to find work in their fields. At age 21, students
do not have enough knowledge of the world to know what to do. The university where I currently work has
a required course for career design.
1987 Current Never Current Graduating from this institution has allowed me to be an artist & designer for my entire career. Even
though the experience wasn't perfect, I was able to create a great life of work out of that education, and for
that I am really grateful.
1983 Current Never Never I've had quite a fascinating and varied career, which has led me to now taking it to a higher level, and into
new or hybrid design mediums I hope to share soon. One of the great tragedies of industrial design, is that
to commercialize a great idea, through licensing it to a manufacturer, is that it must be done in secrecy,
which is why I don't enjoy it day-to-day as I wish I could. But to make a living, and fulfill the needs of
properly protecting an idea, this must be done, and at great cost for the very real and costly fear of being
"knocked-off".
1981 Current Current Never This institution provided great diversity and resource outside the art department. Great programs all around
and a great living environment.
1979 Current Never Never One of the biggest challenges that I found after college was being adequately compensated for my work.
As a woman and a mother, I found that many employers felt they were doing me a favor by employing me
and by making me feel that I owed them for the privilege of working, they did not need to compensate me
adequately. Consequently, I feel that my salary has not risen to where it should be at this point in my
career. With the current economic situation employers now have the attitude that we should be grateful just
to have a job and that compensation for doing that job well is not worth rewarding.
1978 Current Never Never I feel the Graphic Design training I received was good preparation for working for someone else. I do not
feel there was any preparation for someone who wanted to go out on their own or freelance. There was no
business training, which would have been useful no matter what your major is.
bSee "Understanding the Alumni Comments" page for details.
kAsked of all alumni. Variable name in Codebook is finalcomments.
110

Work as Work as Arts Work as Arts Undergraduate Level
Artistb Teacherb AdministratorbComment
Cohort
1974 Past Never Never A couple of my teachers were skilled designers and problem solvers. Our department head (Graphic
Design) was very old though and had not kept current with the industry so most everything he taught was
irrelevant and a waste of time. I can imagine that it must be even more difficult now to hire people whose
skills are contemporary with technological developments but even when I was there, it was not ideal.
1972 Current Current Never I am very happy being a photographer, have an interesting ever changing, productive artistic life. I am
grateful for this. I think besides my creative abilities, I have this life because I learned to understand
business, and I am and have been stubborn in pursuing my dreams.
1971 Never Current Past My responses to this institution: part of my higher education are not as relevant as those of my two
graduate degrees. For them, the skills and educational components were more specific and carried more
weight. Also, I came to this institution as a transfer student my junior year of college. Nevertheless, my
education was measureable to me.
1965 Past Past Past All in all I felt I received a very comprehensive education, much better than many of my strictly art school
peers in the work place.
1965 Never Never Never Sorry that my degree did not include training in what to expect when applying for jobs in the business
world. I had no idea of the types of work that would be available to me after graduating in Industrial
Design. I was not able to identify companies that might use designers and had no training in resume
writing, networking, interviewing, & job search methodology.
1960 Past Past Never I appreciated--and continue to appreciate--the fact that my education at this institution was serious,
traditional, and demanding. There was absolutely no pop culture involved, a problem we face with so
much higher education today. My undergraduate education in Art History prepared me to compete at the
highest level of graduate work .I achieved Masters degrees in Music History and also in Ancient History
and Archaeology, the latter being in a very prestigious graduate program.
1957 Past Past Past My education was responsible for me to pursue a highly successful career in Advertising and to further
prepare me for a rewarding personal experience in sculpture since retiring.
bSee "Understanding the Alumni Comments" page for details.
kAsked of all alumni. Variable name in Codebook is finalcomments.
111

Work as Work as Arts Work as Arts Undergraduate Level
Artistb Teacherb AdministratorbComment
2010 Current Never Never I think this is a really cool and interesting initiative and I can't wait to see the results.
2006 Current Never Current I'm glad my school is reaching out to its alumni. I wish there was a greater sense of community among
graduates, teachers and current students. I hope its useful! Artists can be awfully critical... and this is a
very difficult profession and personality type to work with!!
2000 Current Past Past This Survey was too long. I had to pause several times to complete this, and the only reason I slogged
through it is because I'm an Alumni Board member, and felt more obligated to finish. I think a lot of
people will have given up part way through due to the length and complexity of this survey.
1997 Current Never Never You could ask whether our current life is anything like what we envisioned it as students at this institution.
Furthermore, have we accomplished what we thought we would following our time at this institution.
1991 Current Never Never My job entails both art direction, design, and web design. Your survey does not allow for that combination
as a career so my responses to some of the questions are not completely accurate when I was forced to
choose between the two. My real answer would have been BOTH.
1981 Current Past Never You did not ask about obstacles to careers in the arts. Personal/family interests or financial challenges can
kill an arts career. I would be interested to know what obstacles people would report, including ways they
overcome them.
1976 Current Never Current I would suggest the school spend more time trying to get students into the real world with exhibitions and
internships as soon as possible. And not just a chosen few, but I would encourage the school to carefully
examine and work with each student and make it mandatory that they all hold private exhibitions and
receive internships before graduating. This would complete all students training in a more professional
manner and better prepare them for the real world.
1976 Never Never Never I think it's a great survey to see where the impact that art education has in alumni careers , current culture
and economy as spiritual enrichment us so paramount in human evolution.
1975 Current Never Never Confusing questions about status working as an artist. Majority of artists self-employed. If person is
working as an artist, they should specify if that work is primarily for commercial/industrial use or if is the
work more speculative, intended to be sold in the future to some individual or gallery.
If you have any additional comments or feedback that you’d like to share about this project or the questionnaire you just completed,
please do so here.l
Cohort
SNAAP 2012 Alumni Comments • Facts and Figures
Sample University
Undergraduate Level
bSee "Understanding the Alumni Comments" page for details.
lAsked of all alumni. Variable name in Codebook is survcomments.
112

Work as Work as Arts Work as Arts Undergraduate Level
Artistb Teacherb AdministratorbComment
Cohort
1970 Current Past Past I appreciate your goals with this questionnaire, and will be looking forward to seeing the results. I also
appreciate the availability of places (like this box) to expand on my answers; questionnaires that are strictly
multiple-choice are often frustrating, because the available answers do not reflect the answers I would like
to provide.
1966 Past Past Past I think you should take into account those designers and artists who are retired early in your questionnaire.
My answers seemed to indicate that I was professionally involved in the "arts" and then left at some point.
The reality is that I retired from teaching at a prestigious University and basically shut down my consulting
business after I retired and started to travel extensively.
1965 Past Never Never I appreciate the opportunity to express my thoughts about the program. While I did not take optimal
advantage of a program that could have been better, those 4 years were wonderful for me in terms of
learning and broadening my world.
bSee "Understanding the Alumni Comments" page for details.
lAsked of all alumni. Variable name in Codebook is survcomments.
113

Section 3: Graduate Alumni
Data Highlights
Recent Graduates
Comparison Groups
Respondent Characteristics
Frequency Report
Alumni Comments

• Excellent - 49%
•
•
•
47%
•
•
• 45%
• Clear writing 33%
• 26%
31%
30%
44%
• Very well - 33%
• Fairly well - 15%
• Not too well - 5% 3%
• Not well at all - 2%
• Did not pursue further education - 46%
29%
Teaching skills 43%
% Very Satisfied
35%
• Had serious conversations with students who are different
33% from themselves in terms of their ethnicity, religious
• Worked with a faculty member on a project - 81%
• Worked with an artist in the community - 57%
38% • Study abroad - 9%
50% • Internship - 20%
• Complete a portfolio - 66%
a Participated refers to those who responded "often", "sometimes", or "rarely" in question 15.
Freedom and encouragement to take risks
Sense of belonging and attachment
SNAAP 2012 Data Highlights
Sample University
Graduate Level
Academic advising
Advising about career or further
education20%
Alumni (n = 186) who did the following activities while at
Sample University:
Opportunities for degree-related
internships or work28%
Opportunities to work in different artistic
disciplines from your own41%
campus publications, student government, fraternity or
Instructors in classrooms, labs, and
studios52%
beliefs, political opinions, or personal values - 95%
Opportunities to network with alumni and
others19%
Opportunities to perform, exhibit, or
present your work34%
• Participated in co-curricular activities (organizations,
sorority, sports) - 56%
Opportunities to take non-arts classes
• Participated in community service - 63%
participateda in the following activities:
While enrolled at Sample University, alumni (n = 193)
very satisfied with these aspects of their time at
Sample University:
20% 15%Alumni (n = 195) reporting their level of satisfaction as
8%
11%
Probably no - 8%
13%
How well Sample University prepared alumni (n = 195) for
2% 45%
further education:
Definitely no - 2%
11%
6%
Project management skills
Technological skills
Artistic technique
Financial and business
management skills
3%
4%
Probably yes - 38%
9%
Research skillsUncertain - 16%
Alumni (n = 199) who would attend Sample University if they
could start over again:
60% 2%Creative thinking and problem
solving
Definitely yes - 36%
Improved work based on
feedback from others56% 1%
This Data Highlights Report features key findings based on your institutional data, including some information about different
subgroups of your alumni. More extensive information, including comparisons to other SNAAP institutions, can be found in the
Frequency Report. Throughout the Data Highlights, "n" refers to the number of alumni responding to a particular question. Schools
that participated in both 2011 and 2012 have combined data for the two years.
Institutional Experiences Institutional Experiences (cont.)
How alumni (n = 198) rated their overall experience at
Sample University:
Alumni (n = 194) reporting Sample University helped them
develop the following skills and abilities:
Persuasive speaking
Good - 40%
59% 1%Fair - 10%
% Very
Much
% Not
at All
Critical thinking and analysis of
arguments and informationPoor - 1%
Broad knowledge and education
Entrepreneurial skills
13%
Interpersonal relations and
working collaboratively
Leadership skills
Networking and relationship
building
10%28%
46%
115

Alumni who have ever been a(n):
•
% Selected as •
Importantb• Unpaid intern (n = 163) - 28%
98%
94%
98%
92%
92%
91%
94%
98%
85%
74% •
66% •
•
•
88%
93%
88%
Alumni (n = 190) who: Arts Fieldse
• Currently work as a professional artist - 63% (n = 135)
• 46%
63%
• Never worked as a professional artist - 19% 28%
Alumni (n = 189) who:
• Currently work as a teacher of the arts - 50%
•
• Never worked as a teacher of the arts - 15%
• Currently are self-employed - 47% 54%
•
• Never have been self-employed - 28%
Current professional artists (n = 117) who: • Closely related - 79%
• • Somewhat related - 16%
• • Not related - 5%
•
• Never have been self-employed at all - 17%
b Important refers to those who responded "very important" or "somewhat important" in question 39.
c Non-arts fields refers to occupational fields 24-44 listed in Appendix C of the Codebook.
d Respondents could select more than one response option.
e Arts fields refers to occupational fields 1-23 listed in Appendix C of the Codebook.
Critical thinking and analysis of arguments
and information
Broad knowledge and education
Research skills
Persuasive speaking
92%
97%
Improved work based on feedback from others
Creative thinking and problem solving
Clear writing
Interpersonal relations and working
collaboratively
Project management skills
Technological skills
Entrepreneurial skills
Financial and business management skills
Artistic technique
Previously have been self-employed as a professional
artist (but not currently) - 13%
Previously worked as a teacher of the arts
(but not currently) - 35%
Alumni (n = 188) who:
Never have been self-employed as a professional
artist - 4%
Currently are self-employed as a professional artist - 66%
Previously have been self-employed
(but not currently) - 25%
Networking and relationship building
Teaching skills
Leadership skills
Food preparation related
Somewhat relevant - 29%
Not at all relevant - 33%
29%
13%
Alumni who are very satisfied with certain aspects of the
current job in which they spend the majority of their work
time:
Opportunity to be creative
Job security
The top non-arts occupational fieldsc for alumni currently or in
the past:
99
# of Alumnid
Paid intern (n = 170) - 22%
Education, training, and library
Career Career (cont.)
Those who have ever worked (n = 182) said the following
Alumni who have worked directly after leaving Sample
University (n = 167) reporting how closely related their first
job was to their arts training:
Balance between work and
non-work life
50%
35%
Opportunity to contribute
to the greater good
Overall job satisfaction
67% 25%Work reflects their values,
personality, and interests
Opportunity for career
advancement35% 13%
Founder of a nonprofit or for-profit organization
(n = 169) - 15%
skills and abilities were important in their profession or work
life:
29%
36Communications
Those who currently spend a majority of their time in
non-arts fields (n = 24) and find their arts training at
Sample University:
Very relevant - 17%
Relevant - 21%
32
42%
52%
(n = 24)
42%Previously worked as a professional artist
(but not currently) - 17%
Non-arts Fieldsc
Income
c
116

% Selected
Reasond•
Artistic work not available 31% • Good - 36%
Higher pay or steadier income in other fields 46% • Fair - 18%
Current location not conducive to artistic career 23% • Poor - 7%
Change in interests 31% • Very poor - 3%
Family-related reasons 20%
Debt (including student loans) 17%
•
• 2 jobs - 30%
• 3 jobs - 14%
• 4 jobs - 2%
• More than 4 jobs - 2%
•
• Serving on the board of an arts organization - 30%
% Reported • Volunteering to teach the arts - 36%
Resource • Donating money to an arts organization or artist - 56%
Importantd• Attending an arts event - 91%
Loans, investment capital 27%
Prizes, grants, or commissions 67%
Strong network of peers and colleagues 75%
73% •
Material resources 70% • Serving on the board of an arts organization - 11%
Mentors and teachers 75% • Volunteering to teach the arts - 27%
Additional training 51% • Donating money to an arts organization or artist - 46%
• Attending an arts event - 94%
•
% Reported •
Resource •
Lackingd•
Loans, investment capital 25% •
Prizes, grants, or commissions 35% •
Strong network of peers and colleagues 33%
29%
Material resources 34%
Mentors and teachers 21%
Additional training 20%
d Respondents could select more than one response option.
f Not currently professional artists are identified as those who did not select "yes, I do this currently" in question 25.
Publicity or acknowledgement of work
Current or past professional artists (n = 141) who indicated
that the following resources and opportunities were
insufficient to achieving success in their artistic career: 1982 cohort and earlier (n = 21) - 62%
1983-1992 cohorts (n = 14) - 79%
1993-1997 cohorts (n = 5) - 60%
1998-2002 cohorts (n = 6) - 67%
Those not currently professional artistsf who make or perform
art in their personal (not work-related) time:
Opportunity to live in an artistically vital
location62%
Current or past professional artists (n = 151) who indicated
that the following resources and opportunities were very
important for success in their artistic career:
Career (cont.) Arts Engagement
Those who are past artists, or intended to be artists and never
were (n = 35), and gave the following reasons:
Summer arts program
Arts high school
Arts courses offered at high school
After-school program
Private lessons
42%
19%
How current professional artists (n = 116) rated the area where
they currently live and/or work as a place to pursue their
artistic career:
Very good - 36%
Alumni (n = 172) who participated in these types of arts
training during their lifetime:
Community sponsored classes,
workshops, or events
Lack of access to important networks and
people
Lack of social support from family and
friends6%
Current professional artists (n = 115) who currently hold:
1 job - 52%
52%
% Reported
Participatingd
29%
62%
18%
24%
(n = 117) supported the arts in the past 12 months:
Volunteering at an arts organization - 45%
Waysd those who are currently professional artists
Opportunity to live in an artistically vital
location28%
Waysd those who are not currently professional artists
f
(n = 63) supported the arts in the past 12 months:
Volunteering at an arts organization - 29%
2003-2007 cohorts (n = 6) - 67%
Publicity or acknowledgement of work
2008-2012 cohorts (n = 11) - 55%
117

•
•
•
• 1998-2002 cohorts (n = 14) - $50,000
Craft Arts • 2003-2007 cohorts (n = 28) - $45,000
Creative Writing • 2008-2012 cohorts (n = 30) - $25,000
Culinary Arts
•
Film/Media Arts •
•
• 1998-2002 cohorts (n = 13) - $85,000
• 2003-2007 cohorts (n = 25) - $65,000
• 2008-2012 cohorts (n = 30) - $35,000
• % of Time % of Income
• (n = 123) (n = 119)
• Less than 20% 25% 52%
• 21% to 40% 20% 10%
41% to 60% 9% 3%
All alumni who make or perform art in their personal 15% 7%
(not work-related) time (n = 150) who indicated that it was: 31% 29%
•
•
• loan debt on career or educational decisions:
• •
•
•
•
• •
• •
•
•
d Respondents could select more than one response option.
g Median income values are calculated using the midpoints of income ranges as values.
Median individual incomeg in 2011:
1993-1997 cohorts (n = 16) - $90,00077%
Music 11%
Photography 37%
For professional artists in 2011, the percentage of work time
or income from work as a professional artist:
Theater 3%
1983-1992 cohorts (n = 30) - $70,000
31%
61% to 80%
Important - 23%
Somewhat important - 5%
Not at all important - 1%
For those who make or perform art in their personal
(not work-related) time (n = 150), how often they publicly
perform or exhibit:
Major impact - 27%
Some impact - 38%
No impact - 36%
81% to 100%
For those who acquired debt (n = 98), the impact of student
Current or past professional artists (n = 144), who have
23%
19%
Several times a month - 33%
A few times a year or less - 11%
Fine Arts (painting, sculpting, drawing)
Those who make or perform art in their personal
(not work-related) time (n = 150), practiced the following art
forms:
Arts Engagement (cont.) Income and Debt
1982 cohort and earlier (n = 33) - $65,000
1982 cohort and earlier (n = 30) - $90,000
% Reported
Practicingd
1983-1992 cohorts (n = 28) - $125,000
Very important - 72%
13%
For those who make or perform art in their personal (not work-
related) time (n = 150), how frequently they do so:
Daily - 21%
Several times a week - 35%
1993-1997 cohorts (n = 16) - $55,000
Dance 4% Median household incomeg in 2011:
Design
35%
Private patron, foundation, or government grant - 38%
Continuously in public or online - 13%
3 or more times a year - 23%
1 or 2 times a year - 26%
Less than once a year - 23%
financial support from these sourcesd:
Do not perform or exhibit in public - 15%
Family and friends - 26%
118
2012 Recent Graduates Report
Sample University
Graduate Level

•
•
•
•
•
• Study abroad - 5%
• Internship - 14%
• Complete a portfolio - 76%
• Very well - 27%
• Fairly well - 8%
• Not too well - 8%
• Not well at all - 3% • Yes - 72%
• Did not pursue further education - 54% • No - 28%
19%
Opportunities to network with alumni and
others
Comparing the % of alumni who say a skill is very important to their work to the % who say that they acquired that skill very much
while at Sample University:
Recent alumni (n = 37) who participated in the following
activities while at Sample University:
Sense of belonging and attachment 38%
Freedom and encouragement to take risks 43%Probably yes - 43%
Uncertain - 16%
Whether recent alumni (n = 36) would recommend Sample
University to other students like themselves:
Definitely yes - 27%
Probably no - 11%
How well Sample University prepared recent alumni (n = 37) for
further education:
Definitely no - 3%
SNAAP 2012 Recent Graduates
Sample University
Graduate Level
Academic advising
Opportunities for degree-related internships or
work
Opportunities to work in different artistic
disciplines from your own
This Recent Graduates Report features key findings based on your data from your most recent alumni. SNAAP defines "recent
alumni" as those who graduated in the last 5 years for postsecondary institutions, and in the last 10 years for arts high schools.
Throughout the Recent Graduates Report, "n" refers to the number of alumni responding to a particular question. If you also
participated in 2011, responses for 2011 and 2012 have been combined.
Institutional Experiences Institutional Experiences (cont.)
16%
Recent alumni (n = 37) who would attend Sample University if
they could start over again:
Recent alumni (n = 37) reporting their level of satisfaction
as very satisfied with these aspects of their time at
Sample University:
% Very Satisfied
How recent alumni (n = 37) rated their overall experience at
Sample University:
Opportunities to perform, exhibit, or present
your work
Opportunities to take non-arts classes
30%
43%
35%
33%
24%
Instructors in classrooms, labs, and studios 43%
Advising about career or further education
Poor
0% Fair
19%
Good
46%
Excellent
35%
82% 73%
52%
82%
64%
76%
58% 67%
59% 56%
22% 28%
59%
47%
69% 78%
57%
38%
54% 57% 49%
43%
27% 35% 33%
28%
6% 8%
22% 31%
19%
31%
0%10%20%30%40%50%60%70%80%90%
100%
Skill is very important to work (n = 33)Acquired skill in school (very much) (n = 37)
120

• Currently are self-employed - 49%
•
•
• Never have been self-employed - 29% • Good - 27%
• Fair - 18%
• Poor - 9%
• Very poor - 9%
•
• Serving on the board of an arts organization - 12%
• Volunteering to teach the arts - 21%
• Donating money to an arts organization or artist - 42%
• Attending an arts event - 94%
• Currently work as a professional artist - 63%
•
• Never worked as a professional artist - 20%
Artistic work not available 56%
Higher pay or steadier income in other fields 44%
Current location not conducive to artistic career 33%
Change in interests 22%
Family-related reasons 11%
33%
44%
11%
a Arts fields refers to occupational fields 1-23 listed in Appendix C of the Codebook.
b Non-arts fields refers to occupational fields 24-44 listed in Appendix C of the Codebook.
c Does not include those who were never artists and never intended to be.
d Respondents could select more than one response option.
e Median income values are calculated using the midpoints of income ranges as values.
Comparing recent alumni working in arts fieldsa to those in
non-arts fieldsb who report they are very satisfied with certain
aspects of the current job in which they spend the majority of
their work time:
Previously worked as a professional artist
(but not currently) - 17%
Median individual and household incomee in 2011 by
graduating year:
Income and Debt
Ways recent alumni (n = 33) supported the arts in the
past 12 monthsd:
Volunteering at an arts organization - 33%
% Selected
Recent alumni (n = 35) who:
Reasons why recent alumni (n = 9) are not currently pursuing
careers as professional artistsc:
For recent alumni who acquired student loan debt at Sample
University (n = 25), impact on life decisions:
Arts Engagement
Recent alumni (n = 35) who:
Previously have been self-employed
(but not currently) - 23%
How current professional artists (n = 22) rated the area where
they currently live and/or work as a place to pursue their
artistic career:
Very good - 36%
Reasond
Lack of access to important networks and people
Debt (including student loans)
Lack of social support from family and friends
Career
Major
impact
52%
Some impact
44%
No impact
4%
0%
0%
0%
20%
0%
0%
0%
17%
52%
9%
22%
22%
61%
35%
0% 20% 40% 60% 80% 100%
Job security
Opportunity to
be creative
Income
Work and
life balance
Career
advancement
Work reflects
interests
Overall job
satisfaction
Arts fields (n = 23)
Non-arts fields (n = 5)
$0
$10,000
$20,000
$30,000
$40,000
$50,000
$60,000
$70,000
$80,000
$90,000
2011
(n = 5)
2010
(n = 8)
2009
(n = 7)
2008
(n = 5)
2007
(n = 7)
Household
Individual
121

2012 Comparison Groups
Sample University
Graduate Level

Number of Institutions: 51
City State
1. Arizona State University (School of Art) Tempe AZ
2. Art Center College of Design Pasadena CA
3. Art Institute of Boston at Lesley University Boston MA
4. CalArts (School of Art) Valencia CA
5. CalArts (School of Film/Video) Valencia CA
6. California College of the Arts Oakland CA
7. Cleveland Institute of Art Cleveland OH
8. Columbus College of Art & Design Columbus OH
9. Corcoran College of Art + Design Washington DC
10. DePaul University (College of Computing & Digital Media) Chicago IL
11. DePaul University (College of Liberal Arts and Social Sciences) Chicago IL
12. Herron School of Art and Design, IUPUI Indianapolis IN
13. Indiana University (Art Education) Bloomington IN
14. Indiana University of Pennsylvania (Dept. of Art) Indiana PA
15. Kendall College of Art and Design at Ferris State University Big Rapids MI
16. Maine College of Art Portland ME
17. Maryland Institute College of Art Baltimore MD
18. Massachusetts College of Art and Design Boston MA
19. Memphis College of Art Memphis TN
20. Miami University-Oxford (Architecture) Oxford OH
21. Miami University-Oxford (Art) Oxford OH
22. Minneapolis College of Art and Design Minneapolis MN
23. OCAD University Toronto ON
24. Otis College of Art and Design Los Angeles CA
25. Pacific Northwest College of Art Portland OR
26. Pennsylvania Academy of the Fine Arts Philadelphia PA
27. Pittsburg State University (Dept. of Art) Pittsburg KS
28. Pratt Institute Brooklyn NY
29. San Francisco Art Institute San Francisco CA
30. School of the Art Institute of Chicago Chicago IL
31. School of the Museum of Fine Arts, Boston Boston MA
32. School of Visual Arts New York NY
33. Seton Hall University South Orange NJ
34. Southern Methodist University (Art) Dallas TX
35. Southern Methodist University (Film and Media Arts) Dallas TX
36. University of Hartford (Hartford Art School) West Hartford CT
37. University of Houston (Art) Houston TX
38. University of Illinois (Dept. of Landscape Architecture) Champaign IL
Institution Name
2012 Comparison Groups
Sample University
Graduate Level
Comparison Group 1 Selection
Art, Design, & Media
SNAAP Default
Group Name:
Selection Method:
The SNAAP Institutional Report displays your institution’s results along with three comparison groups. Your institution had
the option of selecting two comparison groups; those two groups could be pre-formed by SNAAP or created and named by
your institution. You were allowed to select institutions from both the 2011 and 2012 administrations. The third comparison
group is composed of all SNAAP schools at the appropriate level (high school, undergraduate, or graduate). A complete list of
these institutions can be found in Section 1.
123

Number of Institutions: 51
City StateInstitution Name
Comparison Group 1 Selection
Art, Design, & Media
SNAAP Default
Group Name:
Selection Method:
39. University of Illinois (Dept. of Urban & Regional Planning) Champaign IL
40. University of Illinois (School of Architecture) Champaign IL
41. University of Illinois (School of Art + Design) Champaign IL
42. University of Massachusetts, Amherst (Art, Architecture & Art History) Amherst MA
43. University of Michigan (School of Art & Design) Ann Arbor MI
44. University of New Orleans (Fine Arts) New Orleans LA
45. University of Northern Colorado (School of Art & Design) Greeley CO
46. University of Texas at Austin (Art and Art History) Austin TX
47. University of Texas at Austin (School of Architecture) Austin TX
48. University of the Arts (College of Art, Media + Design) Philadelphia PA
49. Valdosta State University (Dept. of Art) Valdosta GA
50. Western Kentucky University (Art) Bowling Green KY
51. Western Michigan University (Frostic School of Art) Kalamazoo MI
124

Number of Institutions: 44
City State
1. Butler University (Jordan College of the Arts) Indianapolis IN
2. Case Western Reserve University Cleveland OH
3. Cleveland Institute of Art Cleveland OH
4. Columbia College Chicago Chicago IL
5. Columbus College of Art & Design Columbus OH
6. DePaul University (College of Computing & Digital Media) Chicago IL
7. DePaul University (College of Liberal Arts and Social Sciences) Chicago IL
8. DePaul University (School of Music) Chicago IL
9. DePaul University (Theatre School) Chicago IL
10. Herron School of Art and Design, IUPUI Indianapolis IN
11. Indiana University (Art Education) Bloomington IN
12. Indiana University (Jacobs School of Music) Bloomington IN
13. Indiana University of Pennsylvania (Dept. of Art) Indiana PA
14. Indiana University of Pennsylvania (Dept. of Music) Indiana PA
15. Kendall College of Art and Design at Ferris State University Big Rapids MI
16. Kent State University (Art, Music, & Theatre & Dance) Kent OH
17. Miami University-Oxford (Architecture) Oxford OH
18. Miami University-Oxford (Art) Oxford OH
19. Miami University-Oxford (Music) Oxford OH
20. Miami University-Oxford (Theatre) Oxford OH
21. Minneapolis College of Art and Design Minneapolis MN
22. North Dakota State University (Music) Fargo ND
23. North Dakota State University (Theatre Arts) Fargo ND
24. Northern State University Aberdeen SD
25. Oakland University Rochester MI
26. Ohio State University Columbus OH
27. Pittsburg State University (Dept. of Art) Pittsburg KS
28. Purdue University (Art and Design, Theatre) West Lafayette IN
29. Purdue University (Creative Writing) West Lafayette IN
30. School of the Art Institute of Chicago Chicago IL
31. St. Cloud State University Saint Cloud MN
32. University of Illinois (Dept. of Dance) Champaign IL
33. University of Illinois (Dept. of Landscape Architecture) Champaign IL
34. University of Illinois (Dept. of Theatre) Champaign IL
35. University of Illinois (Dept. of Urban & Regional Planning) Champaign IL
36. University of Illinois (School of Architecture) Champaign IL
37. University of Illinois (School of Art + Design) Champaign IL
38. University of Illinois (School of Music) Champaign IL
39. University of Kansas Lawrence KS
40. University of Michigan (School of Art & Design) Ann Arbor MI
41. University of Missouri-Kansas City Kansas City MO
42. University of Wisconsin-Whitewater Whitewater WI
43. Western Michigan University (Frostic School of Art) Kalamazoo MI
44. Western Michigan University (School of Music) Kalamazoo MI
Selection Method: SNAAP Default
Institution Name
2012 Comparison Groups
Sample University
Graduate Level
Comparison Group 2 Selection
Group Name: Midwest
125

2012 Respondent Characteristics
Sample University
Graduate Level

Sampling Information
Total population size
Sample size (with e-mails)
Sample size (adjusted)a
Number of respondentsb
Response Ratec
Sampling Errord
Respondent Characteristicse Variable Count % Count % Count % Count %
Cohort (year graduated) cohort_R
1982 and before 53 26% 1,103 19% 1,173 25% 2,796 21%
1983-1992 37 18% 915 16% 902 20% 2,442 18%
1993-1997 26 13% 639 11% 499 11% 1,479 11%
1998-2002 18 9% 664 11% 531 12% 1,618 12%
2003-2007 31 15% 1,029 18% 724 16% 2,324 17%
2008-2012 37 18% 1,525 26% 784 17% 2,871 21%
Gender gender
Male 67 37% 1,922 41% 1,767 47% 4,756 44%
Female 112 63% 2,783 59% 2,004 53% 5,984 56%
Transgender 0 0% 10 0% 2 0% 13 0%
Age age_R
24 or younger 1 1% 17 0% 10 0% 43 0%
25 to 29 13 8% 443 10% 311 8% 954 9%
30 to 39 35 21% 1,333 29% 864 23% 2,741 26%
40 to 49 30 18% 960 21% 736 20% 2,177 21%
50 to 59 36 21% 943 20% 858 23% 2,367 22%
60 or older 55 32% 920 20% 956 26% 2,332 22%
parentedu
Did not finish high school 7 4% 210 4% 185 5% 473 4%
Graduated from high school or equivalent 47 26% 771 16% 725 19% 1,853 17%
Attended college but did not complete a degree 19 11% 361 8% 352 9% 937 8%
Completed an associate's degree (AA, AS, etc.) 12 7% 229 5% 177 5% 527 5%
Completed a bachelor's degree (BA, BS, etc.) 41 23% 1,207 25% 963 25% 2,700 24%
Completed a master's degree (MA, MS, etc.) 33 18% 1,186 25% 914 23% 2,742 25%
Completed a doctoral degree (PhD, JD, MD, etc.) 21 12% 815 17% 594 15% 1,864 17%
f Alumni from Canadian institutions did not receive this option/question.
55% and 65%. Results may still not represent "true" values for all alumni when response rate is very low and nonrespondents are markedly different than
error reported here represents all respondents. Individual questions may have different sampling errors based on those who respond to the question.
SNAAP 2012 Respondent Characteristics
Sample University
Graduate Level
Graduate Level
Sample UniversityArt, Design, and
MediaMidwest
SNAAP
Institutions
2,152 50,756 41,196 132,533
930 30,417 23,110 77,556
22% 21% 22% 19%
905 28,080 21,257 70,349
202 5,880 4,611 13,543
e Count and percent of total respondents within each category. Schools that participated in both 2011 and 2012 have combined data for the two years.
6.6% 1.2% 1.4% 0.8%
Parent Educationf
b Includes those who both fully and partially completed the questionnaire.
a Sample size is adjusted for alumni with undeliverable e-mail addresses.
d Sampling error is an estimate of the margin by which the true response on a given item could differ from the reported response. To interpret the sampling error,
respondents on the survey measures. Such differences are unkown, so caution is advised when interpreting and drawing conclusions from the results. The sampling
assume that 60% of your alumni reply "very satisfied" to a particular item. If the sampling error is +/-5%, then the true population value is most likely between
c Response rate is the number of respondents divided by adjusted sample size. Response rates by degree level are based on school reported information (if available).
Alumni for whom degree level was not provided are not included in response rates, but their responses are included in the reports.
127

Respondent Characteristics (continued)e Variable Count % Count % Count % Count %
Marital Status marital
Single (never married) 31 17% 1,291 27% 858 22% 2,789 25%
Married or domestic partner 126 70% 2,880 60% 2,601 67% 6,944 63%
Divorced/separated 19 11% 523 11% 361 9% 1,127 10%
Widowed 4 2% 69 1% 68 2% 189 2%
Number of Dependents children
0 105 68% 2,825 67% 2,436 69% 6,839 68%
1 27 17% 644 15% 479 13% 1,480 15%
2 20 13% 610 14% 470 13% 1,324 13%
3 or more 3 2% 133 3% 169 5% 360 4%
Race/Ethnicityf,g
White or Caucasian race_white 154 88% 3,889 83% 3,391 88% 9,392 86%
Black or African American race_blck 4 2% 156 3% 106 3% 340 3%
Hispanic, Latino, or Spanish origin race_hisp 6 3% 249 5% 123 3% 497 5%
American Indian or Alaska Native race_amerind 4 2% 62 1% 41 1% 136 1%
Native Hawaiian or other Pacific Islander race_haw 0 0% 21 0% 10 0% 43 0%
Asian race_asian 9 5% 375 8% 203 5% 668 6%
Other race_oth 5 3% 182 4% 117 3% 368 3%
U.S. Citizen (while at institution)f citizen 169 93% 4,235 89% 3,563 91% 10,015 90%
Type of Device Used for Surveyh device
PC 70 35% 1,327 34% 1,184 53% 2,555 41%
Mac 119 59% 2,130 55% 834 37% 2,988 48%
Smart Phone 6 3% 241 6% 118 5% 379 6%
Tablet 6 3% 171 4% 98 4% 283 5%
e Count and percent of total respondents within each category. Schools that participated in both 2011 and 2012 have combined data for the two years.
f Alumni from Canadian institutions did not receive this option/question.
h Information only available for 2012 respondents.
g The count and percent of alumni who selected that race/ethnicity. Alumni could select more than one category, so percentages may not equal 100%.
SNAAP 2012 Respondent Characteristics
Sample University
Graduate Level
Graduate Level
Sample UniversityArt, Design, and
MediaMidwest
SNAAP
Institutions
128

2012 Frequency Report
Sample University
Graduate Level

Variable Response Options Count % Count % Count % Count %
part_none I have not supported the arts in the past 12 months 95 86% 256 76% 382 84% 1,206 80%
part_vol Volunteered at an arts organization 45 41% 56 17% 76 17% 345 23%
part_brd Served on the board of an arts organization 33 30% 98 29% 107 23% 556 37%
part_tch Volunteered to teach the arts 56 51% 93 28% 98 21% 523 35%
part_donate Donated money to an arts organization or an artist 83 75% 255 76% 273 60% 980 65%
part_attd Attended an arts event 48 44% 38 11% 112 25% 681 45%
part_oth Other 22 20% 67 20% 89 19% 178 12%
Totala
- - - - - - - -Do not make or perform art in personal time 111 23% 272 20% 215 36% 525 24%
I do not perform or exhibit in public 0 0% 1 0% 0 0% 1 0%
Less than once a year 25 5% 74 5% 43 7% 129 6%
1 or 2 times a year 44 9% 92 7% 52 9% 158 7%
3 or more times a year 107 22% 372 27% 103 17% 524 24%
Continuously in public or online 206 42% 563 41% 184 31% 828 38%
Total 493 100% 1,374 100% 597 100% 2,165 100%
53. The ways in which you
have supported the arts in the
past 12 months (other than
performing, creating, or
exhibiting your own artwork)
58. How often do you
publicly perform or exhibit art
in your personal (not work-
related) time?d
exhibit
SNAAP 2012 Frequency Report • Arts EngagementSample Institution
Graduate Level
Graduate Level
Sample
Institution
Comparison
Group 1
Comparison
Group 2
SNAAP
Aggregate
Understanding the Frequency ReportThe Frequency Report contains questions with fixed response options. For more detailed information, the Codebook contains a complete
list of variables, survey questions, response options, and the logic used to determine which alumni received each question.
Comparison Groups The number and percentage of alumni at all institutions in each of the three comparison groups. The first two columns are selected groups and the third is all SNAAP schools at this level. You were allowed to select institutions from both the 2011 and 2012 SNAAP administrations. All three comparison groups exclude your alumni. For more details regarding institutions included in each column, see your "Comparison Group" Report.
Topic Area Each section represents a different topic area of the SNAAP Questionnaire.
Your Respondents The number and percentage of your alumni selecting a certain response for each
question. If you also participated in 2011, responses for 2011 and 2012 have been combined.
Variable
These variable names are labels assigned to each survey question in the data set. The variable name allows easy reference to the Codebook, which includes each variable name, the complete questions asked, the response options available, and the logic determining which alumni received each question.
Questions An abbreviated version of the questions on the SNAAP Questionnaire.
Response Options Response options for each particular question.
Dashes For questions where alumni could check more than one response option, dashes are used because percentages can total more than 100%.
Italicized Response Options Due to the dynamic nature of the SNAAP Questionnaire, not all alumni received every question. This italicized line (or lines) indicates the number and percentage of alumni who did not receive the question and why they did not receive it. For more detailed information on why they did not receive each item, please see the Codebook.
Education Level Your report is representative of a specific education level (High School, Undergraduate, or Graduate).
Skipped Numbers This indicates open-ended questions which can be found in the "Alumni Comments" Report or demographic items found on the "Respondent Characteristics" Report.
How to Interpret Percentages All percentages are presented as the percent of all alumni at a given education level, including those that did not receive the question. For example, here we might say that 9% of all Sample Institution's undergraduate alumni publicly perform or exhibit their art in their personal time 1 or 2 times per year. This includes the 23% that did not receive the question because they do not make or perform art in their personal time. Frequencies for some questions (marked with footnote "d") have been reproduced with only those respondents who received the question. These can be found in the "Data Highlights" Report.
130

Graduate Level
Variable Response Options Count % Count % Count % Count %
instdeg_hs High School Diploma 18 9% 354 6% 145 3% 513 4%
instdeg_Cert Certificate 14 7% 233 4% 88 2% 335 2%
instdeg_BA BA 9 4% 238 4% 159 3% 602 4%
instdeg_BArch B Arch 3 1% 135 2% 127 3% 153 1%
instdeg_BFA BFA 36 18% 584 10% 223 5% 841 6%
instdeg_BM BM or B Mus 0 0% 2 0% 308 7% 598 4%
instdeg_BS BS 5 2% 179 3% 250 5% 333 2%
instdeg_othUG Other undergraduate degree 2 1% 126 2% 156 3% 299 2%
instdeg_AD Artist Diplomab 0 0% 158 3% 46 1% 227 2%
instdeg_MA MA 79 39% 835 14% 907 20% 2,195 16%
instdeg_MArch M Arch 1 0% 609 10% 391 8% 809 6%
instdeg_MFA MFA 116 57% 3,352 57% 1,318 29% 5,584 41%
instdeg_MM MM or M Mus 0 0% 6 0% 1,133 25% 2,514 19%
instdeg_DMA DMA 0 0% 4 0% 390 8% 754 6%
instdeg_PhD PhD 12 6% 80 1% 317 7% 740 5%
instdeg_othGR Other graduate degree 8 4% 1,040 18% 670 15% 1,789 13%
Totala - - - - - - - -
1. Degree(s) or credential(s) pursued at this institution
SNAAP 2012 Frequency Report • EducationSample University
Graduate Level
Sample UniversityArt, Design, and
MediaMidwest
SNAAP
Institutions
aTotal may not sum to 100% as respondents could select more than one category.
bAlumni from Canadian institutions did not receive this option/question. 131

Graduate Level
Variable Response Options Count % Count % Count % Count %
SNAAP 2012 Frequency Report • EducationSample University
Graduate Level
Sample UniversityArt, Design, and
MediaMidwest
SNAAP
Institutions
maj1cat1 Architecture 2 1% 572 10% 382 9% 775 6%
Art History 28 14% 224 4% 187 4% 458 4%
Arts Administration 0 0% 131 2% 88 2% 207 2%
Arts Education (Art, Music, Dance, Drama) 44 22% 320 6% 540 12% 1,096 8%
Creative and Other Writing 0 0% 95 2% 88 2% 285 2%
Dance 0 0% 5 0% 53 1% 208 2%
Design 28 14% 487 9% 134 3% 634 5%
Fine and Studio Arts (including Photography) 81 41% 2,471 44% 765 17% 3,117 24%
Media Arts 4 2% 654 12% 167 4% 1,034 8%
Music History, Composition, and Theory 0 0% 2 0% 231 5% 625 5%
Music Performance 0 0% 26 0% 1,145 26% 2,668 21%
Theater 0 0% 18 0% 374 8% 1,083 8%
Other Arts 10 5% 197 4% 78 2% 247 2%
Business 0 0% 20 0% 16 0% 27 0%
Education 0 0% 25 0% 24 1% 62 0%
Engineering 0 0% 12 0% 5 0% 13 0%
Humanities 0 0% 48 1% 48 1% 139 1%
Journalism 0 0% 2 0% 1 0% 4 0%
Natural (Biological and Physical) Sciences 0 0% 3 0% 1 0% 9 0%
Professional 0 0% 211 4% 107 2% 218 2%
Social Sciences 0 0% 13 0% 9 0% 36 0%
Other Non-Arts 0 0% 19 0% 12 0% 26 0%
Total 197 100% 5,555 100% 4,455 100% 12,971 100%
2a. First major or concentration for graduate degree
pursued at this institution
aTotal may not sum to 100% as respondents could select more than one category.
bAlumni from Canadian institutions did not receive this option/question. 132

Graduate Level
Variable Response Options Count % Count % Count % Count %
SNAAP 2012 Frequency Report • EducationSample University
Graduate Level
Sample UniversityArt, Design, and
MediaMidwest
SNAAP
Institutions
maj2cat1 Architecture 1 2% 47 5% 43 6% 59 3%
Art History 2 4% 49 5% 23 3% 77 4%
Arts Administration 0 0% 20 2% 21 3% 42 2%
Arts Education (Art, Music, Dance, Drama) 9 20% 39 4% 57 8% 135 7%
Creative and Other Writing 0 0% 9 1% 9 1% 29 1%
Dance 0 0% 2 0% 4 1% 17 1%
Design 3 7% 52 6% 23 3% 71 4%
Fine and Studio Arts (including Photography) 26 57% 421 45% 146 19% 524 27%
Media Arts 3 7% 107 11% 35 5% 147 8%
Music History, Composition, and Theory 0 0% 4 0% 50 7% 104 5%
Music Performance 0 0% 11 1% 162 21% 329 17%
Theater 0 0% 11 1% 38 5% 104 5%
Other Arts 0 0% 30 3% 15 2% 43 2%
Business 0 0% 20 2% 19 3% 28 1%
Education 1 2% 15 2% 22 3% 50 3%
Engineering 0 0% 20 2% 21 3% 23 1%
Humanities 1 2% 10 1% 18 2% 35 2%
Journalism 0 0% 0 0% 1 0% 1 0%
Natural (Biological and Physical) Sciences 0 0% 1 0% 4 1% 9 0%
Professional 0 0% 33 4% 18 2% 45 2%
Social Sciences 0 0% 13 1% 12 2% 37 2%
Other Non-Arts 0 0% 21 2% 16 2% 42 2%
Total 46 100% 935 100% 757 100% 1,951 100%
2b. Second major or concentration for graduate degree
pursued at this institution
aTotal may not sum to 100% as respondents could select more than one category.
bAlumni from Canadian institutions did not receive this option/question. 133

Graduate Level
Variable Response Options Count % Count % Count % Count %
SNAAP 2012 Frequency Report • EducationSample University
Graduate Level
Sample UniversityArt, Design, and
MediaMidwest
SNAAP
Institutions
min1cat1 Architecture 0 0% 31 5% 29 3% 39 2%
Art History 3 13% 79 14% 51 6% 119 7%
Arts Administration 2 9% 10 2% 14 2% 26 2%
Arts Education (Art, Music, Dance, Drama) 1 4% 16 3% 63 7% 101 6%
Creative and Other Writing 0 0% 4 1% 5 1% 17 1%
Dance 0 0% 0 0% 2 0% 3 0%
Design 1 4% 34 6% 15 2% 49 3%
Fine and Studio Arts (including Photography) 10 43% 218 38% 87 10% 272 16%
Media Arts 0 0% 41 7% 19 2% 59 3%
Music History, Composition, and Theory 0 0% 0 0% 206 23% 269 16%
Music Performance 0 0% 4 1% 216 24% 305 18%
Theater 0 0% 3 1% 22 2% 53 3%
Other Arts 1 4% 6 1% 6 1% 16 1%
Business 0 0% 8 1% 10 1% 21 1%
Education 0 0% 16 3% 15 2% 49 3%
Engineering 0 0% 5 1% 4 0% 6 0%
Humanities 2 9% 27 5% 59 7% 107 6%
Journalism 0 0% 1 0% 0 0% 2 0%
Natural (Biological and Physical) Sciences 0 0% 6 1% 3 0% 14 1%
Professional 0 0% 16 3% 13 1% 27 2%
Social Sciences 1 4% 14 2% 22 2% 54 3%
Other Non-Arts 2 9% 40 7% 35 4% 89 5%
Total 23 100% 579 100% 896 100% 1,697 100%
3. Minor for graduate degree pursued at this institution
aTotal may not sum to 100% as respondents could select more than one category.
bAlumni from Canadian institutions did not receive this option/question. 134

Graduate Level
Variable Response Options Count % Count % Count % Count %
SNAAP 2012 Frequency Report • EducationSample University
Graduate Level
Sample UniversityArt, Design, and
MediaMidwest
SNAAP
Institutions
No 2 1% 170 3% 77 2% 335 3%
Yes 196 99% 5,567 97% 4,449 98% 12,908 97%
Total 198 100% 5,737 100% 4,526 100% 13,243 100%
xtimeinstdeg Did not complete degree pursued at this institution 2 1% 169 3% 75 2% 333 3%
No 138 69% 4,307 75% 3,135 70% 9,524 72%
Yes, 1 semester longer 20 10% 566 10% 383 8% 1,106 8%
Yes, 2 semesters longer 23 12% 357 6% 363 8% 927 7%
Yes, 3 semesters longer 1 1% 57 1% 76 2% 201 2%
Yes, 2 years longer 10 5% 115 2% 156 3% 398 3%
Yes, more than 2 years longer 6 3% 164 3% 321 7% 723 5%
Total 200 100% 5,735 100% 4,509 100% 13,212 100%
4. Did you complete your graduate degree pursued at
this institution?
compinstdeg
5. Did you spend more than the recommended time to
complete your graduate degree from this institution?
aTotal may not sum to 100% as respondents could select more than one category.
bAlumni from Canadian institutions did not receive this option/question. 135
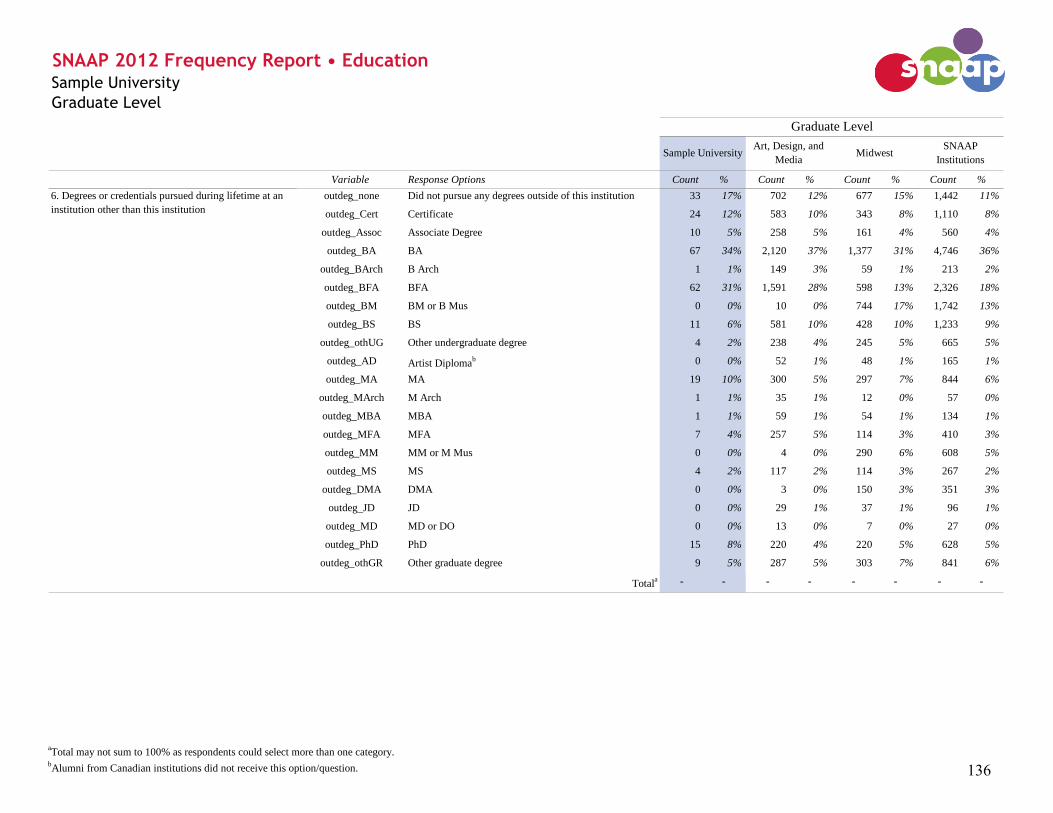
Graduate Level
Variable Response Options Count % Count % Count % Count %
SNAAP 2012 Frequency Report • EducationSample University
Graduate Level
Sample UniversityArt, Design, and
MediaMidwest
SNAAP
Institutions
outdeg_none Did not pursue any degrees outside of this institution 33 17% 702 12% 677 15% 1,442 11%
outdeg_Cert Certificate 24 12% 583 10% 343 8% 1,110 8%
outdeg_Assoc Associate Degree 10 5% 258 5% 161 4% 560 4%
outdeg_BA BA 67 34% 2,120 37% 1,377 31% 4,746 36%
outdeg_BArch B Arch 1 1% 149 3% 59 1% 213 2%
outdeg_BFA BFA 62 31% 1,591 28% 598 13% 2,326 18%
outdeg_BM BM or B Mus 0 0% 10 0% 744 17% 1,742 13%
outdeg_BS BS 11 6% 581 10% 428 10% 1,233 9%
outdeg_othUG Other undergraduate degree 4 2% 238 4% 245 5% 665 5%
outdeg_AD Artist Diplomab 0 0% 52 1% 48 1% 165 1%
outdeg_MA MA 19 10% 300 5% 297 7% 844 6%
outdeg_MArch M Arch 1 1% 35 1% 12 0% 57 0%
outdeg_MBA MBA 1 1% 59 1% 54 1% 134 1%
outdeg_MFA MFA 7 4% 257 5% 114 3% 410 3%
outdeg_MM MM or M Mus 0 0% 4 0% 290 6% 608 5%
outdeg_MS MS 4 2% 117 2% 114 3% 267 2%
outdeg_DMA DMA 0 0% 3 0% 150 3% 351 3%
outdeg_JD JD 0 0% 29 1% 37 1% 96 1%
outdeg_MD MD or DO 0 0% 13 0% 7 0% 27 0%
outdeg_PhD PhD 15 8% 220 4% 220 5% 628 5%
outdeg_othGR Other graduate degree 9 5% 287 5% 303 7% 841 6%
Totala - - - - - - - -
6. Degrees or credentials pursued during lifetime at an
institution other than this institution
aTotal may not sum to 100% as respondents could select more than one category.
bAlumni from Canadian institutions did not receive this option/question. 136

Graduate Level
Variable Response Options Count % Count % Count % Count %
SNAAP 2012 Frequency Report • EducationSample University
Graduate Level
Sample UniversityArt, Design, and
MediaMidwest
SNAAP
Institutions
compoutCert Did not pursue any degrees outside of this institution 33 17% 697 12% 675 15% 1,431 11%
Did not pursue a certificate 140 72% 4,361 78% 3,439 77% 10,490 81%
No 3 2% 63 1% 31 1% 103 1%
Yes 18 9% 451 8% 279 6% 895 7%
In progress 0 0% 31 1% 16 0% 55 0%
Total 194 100% 5,603 100% 4,440 100% 12,974 100%
Did not pursue any degrees outside of this institution 33 17% 697 12% 675 15% 1,431 11%
Did not pursue an associate degree 154 78% 4,683 83% 3,619 81% 11,034 85%
No 1 1% 38 1% 21 0% 68 1%
Yes 10 5% 222 4% 138 3% 490 4%
In progress 0 0% 3 0% 4 0% 9 0%
Total 198 100% 5,643 100% 4,457 100% 13,032 100%
Did not pursue any degrees outside of this institution 33 17% 697 12% 675 15% 1,431 11%
Did not pursue a BA 97 49% 2,825 50% 2,406 54% 6,860 53%
No 2 1% 92 2% 66 1% 187 1%
Yes 65 33% 2,020 36% 1,299 29% 4,544 35%
In progress 0 0% 1 0% 0 0% 1 0%
Total 197 100% 5,635 100% 4,446 100% 13,023 100%
Did not pursue any degrees outside of this institution 33 17% 697 12% 675 15% 1,431 11%
Did not pursue a B Arch 163 82% 4,785 85% 3,716 83% 11,368 87%
No 1 1% 23 0% 13 0% 32 0%
Yes 1 1% 138 2% 50 1% 194 1%
In progress 0 0% 0 0% 0 0% 0 0%
Total 198 100% 5,643 100% 4,454 100% 13,025 100%
7.4. B Arch compoutBArch
7.3. BA compoutBA
7. Did you complete this degree pursued at another
institution?
7.1. Certificate
7.2. Associate Degree compoutAssoc
aTotal may not sum to 100% as respondents could select more than one category.
bAlumni from Canadian institutions did not receive this option/question. 137

Graduate Level
Variable Response Options Count % Count % Count % Count %
SNAAP 2012 Frequency Report • EducationSample University
Graduate Level
Sample UniversityArt, Design, and
MediaMidwest
SNAAP
Institutions
Did not pursue any degrees outside of this institution 33 17% 697 12% 675 15% 1,431 11%
Did not pursue a BFA 102 52% 3,345 59% 3,176 71% 9,257 71%
No 4 2% 85 2% 30 1% 126 1%
Yes 59 30% 1,501 27% 572 13% 2,198 17%
In progress 0 0% 2 0% 1 0% 3 0%
Total 198 100% 5,630 100% 4,454 100% 13,015 100%
Did not pursue any degrees outside of this institution 33 17% 697 12% 675 15% 1,431 11%
Did not pursue a BM or B Mus 164 83% 4,918 87% 3,029 68% 9,835 76%
No 1 1% 14 0% 30 1% 62 0%
Yes 0 0% 7 0% 711 16% 1,684 13%
In progress 0 0% 0 0% 1 0% 2 0%
Total 198 100% 5,636 100% 4,446 100% 13,014 100%
compoutBS Did not pursue any degrees outside of this institution 33 17% 697 12% 675 15% 1,431 11%
Did not pursue a BS 153 77% 4,349 77% 3,343 75% 10,337 79%
No 1 1% 27 0% 21 0% 60 0%
Yes 11 6% 557 10% 408 9% 1,173 9%
In progress 0 0% 3 0% 1 0% 5 0%
Total 198 100% 5,633 100% 4,448 100% 13,006 100%
Did not pursue any degrees outside of this institution 33 17% 697 12% 675 15% 1,431 11%
Did not pursue another undergraduate degree 160 81% 4,686 83% 3,525 79% 10,899 84%
No 3 2% 31 1% 23 1% 61 0%
Yes 2 1% 204 4% 210 5% 566 4%
In progress 0 0% 3 0% 1 0% 8 0%
Total 198 100% 5,621 100% 4,434 100% 12,965 100%
7. Did you complete this degree pursued at another
institution? (continued)
7.5. BFA
compoutBFA
7.6. BM or B Mus compoutBM
7.7. BS
7.8. Other undergraduate degree compoutothUG
aTotal may not sum to 100% as respondents could select more than one category.
bAlumni from Canadian institutions did not receive this option/question. 138

Graduate Level
Variable Response Options Count % Count % Count % Count %
SNAAP 2012 Frequency Report • EducationSample University
Graduate Level
Sample UniversityArt, Design, and
MediaMidwest
SNAAP
Institutions
Did not pursue any degrees outside of this institution 33 17% 697 12% 675 15% 1,431 11%
Did not pursue an Artist Diploma 164 83% 4,864 87% 3,722 84% 11,389 88%
No 1 1% 26 0% 14 0% 46 0%
Yes 0 0% 32 1% 38 1% 123 1%
In progress 0 0% 1 0% 2 0% 7 0%
Total 198 100% 5,620 100% 4,451 100% 12,996 100%
Did not pursue any degrees outside of this institution 33 17% 697 12% 675 15% 1,431 11%
Did not pursue an MA 145 73% 4,624 82% 3,473 78% 10,718 82%
No 4 2% 64 1% 54 1% 149 1%
Yes 15 8% 229 4% 230 5% 660 5%
In progress 1 1% 18 0% 15 0% 45 0%
Total 198 100% 5,632 100% 4,447 100% 13,003 100%
Did not pursue any degrees outside of this institution 33 17% 697 12% 675 15% 1,431 11%
Did not pursue an M Arch 163 82% 4,889 87% 3,756 84% 11,500 88%
No 1 1% 26 0% 12 0% 38 0%
Yes 1 1% 19 0% 7 0% 32 0%
In progress 0 0% 1 0% 1 0% 2 0%
Total 198 100% 5,632 100% 4,451 100% 13,003 100%
Did not pursue any degrees outside of this institution 33 17% 697 12% 675 15% 1,431 11%
Did not pursue an MBA 163 82% 4,865 86% 3,714 83% 11,422 88%
No 1 1% 31 1% 25 1% 45 0%
Yes 0 0% 36 1% 33 1% 91 1%
In progress 1 1% 5 0% 5 0% 16 0%
Total 198 100% 5,634 100% 4,452 100% 13,005 100%
7.11. M Arch compoutMArch
7.12. MBA compoutMBA
7.10. MA compoutMA
7. Did you complete this degree pursued at another
institution? (continued)
7.9. Artist Diplomab
compoutAD
aTotal may not sum to 100% as respondents could select more than one category.
bAlumni from Canadian institutions did not receive this option/question. 139

Graduate Level
Variable Response Options Count % Count % Count % Count %
SNAAP 2012 Frequency Report • EducationSample University
Graduate Level
Sample UniversityArt, Design, and
MediaMidwest
SNAAP
Institutions
Did not pursue any degrees outside of this institution 33 17% 697 12% 675 15% 1,431 11%
Did not pursue an MFA 157 79% 4,669 83% 3,654 82% 11,149 86%
No 3 2% 119 2% 45 1% 166 1%
Yes 5 3% 128 2% 73 2% 227 2%
In progress 0 0% 7 0% 2 0% 16 0%
Total 198 100% 5,620 100% 4,449 100% 12,989 100%
Did not pursue any degrees outside of this institution 33 17% 697 12% 675 15% 1,431 11%
Did not pursue an MM or M Mus 164 83% 4,919 87% 3,477 78% 10,946 84%
No 1 1% 15 0% 31 1% 79 1%
Yes 0 0% 1 0% 266 6% 540 4%
In progress 0 0% 1 0% 4 0% 12 0%
Total 198 100% 5,633 100% 4,453 100% 13,008 100%
Did not pursue any degrees outside of this institution 33 17% 697 12% 675 15% 1,431 11%
Did not pursue an MS 160 81% 4,807 85% 3,653 82% 11,289 87%
No 2 1% 28 0% 23 1% 49 0%
Yes 3 2% 92 2% 84 2% 201 2%
In progress 0 0% 9 0% 10 0% 24 0%
Total 198 100% 5,633 100% 4,445 100% 12,994 100%
Did not pursue any degrees outside of this institution 33 17% 697 12% 675 15% 1,431 11%
Did not pursue a DMA 164 83% 4,920 87% 3,618 81% 11,204 86%
No 1 1% 15 0% 34 1% 78 1%
Yes 0 0% 0 0% 92 2% 211 2%
In progress 0 0% 0 0% 27 1% 76 1%
Total 198 100% 5,632 100% 4,446 100% 13,000 100%
7.14. MM or M Mus compoutMM
7.15. MS compoutMS
7.16. DMA compoutDMA
7. Did you complete this degree pursued at another
institution? (continued)
7.13. MFA
compoutMFA
aTotal may not sum to 100% as respondents could select more than one category.
bAlumni from Canadian institutions did not receive this option/question. 140

Graduate Level
Variable Response Options Count % Count % Count % Count %
SNAAP 2012 Frequency Report • EducationSample University
Graduate Level
Sample UniversityArt, Design, and
MediaMidwest
SNAAP
Institutions
Did not pursue any degrees outside of this institution 33 17% 697 12% 675 15% 1,431 11%
Did not pursue a JD 164 83% 4,894 87% 3,729 84% 11,456 88%
No 1 1% 16 0% 8 0% 26 0%
Yes 0 0% 22 0% 28 1% 73 1%
In progress 0 0% 2 0% 5 0% 13 0%
Total 198 100% 5,631 100% 4,445 100% 12,999 100%
Did not pursue any degrees outside of this institution 33 17% 697 12% 675 15% 1,431 11%
Did not pursue an MD or DO 164 83% 4,910 87% 3,759 85% 11,525 89%
No 1 1% 14 0% 8 0% 24 0%
Yes 0 0% 6 0% 4 0% 13 0%
In progress 0 0% 3 0% 2 0% 5 0%
Total 198 100% 5,630 100% 4,448 100% 12,998 100%
Did not pursue any degrees outside of this institution 33 17% 697 12% 675 15% 1,431 11%
Did not pursue a PhD 149 75% 4,703 83% 3,547 80% 10,926 84%
No 7 4% 38 1% 47 1% 125 1%
Yes 7 4% 100 2% 124 3% 322 2%
In progress 2 1% 96 2% 57 1% 198 2%
Total 198 100% 5,634 100% 4,450 100% 13,002 100%
Did not pursue any degrees outside of this institution 33 17% 697 12% 675 15% 1,431 11%
Did not pursue another graduate degree 155 78% 4,638 83% 3,465 78% 10,712 83%
No 3 2% 49 1% 38 1% 103 1%
Yes 6 3% 198 4% 228 5% 614 5%
In progress 1 1% 29 1% 24 1% 84 1%
Total 198 100% 5,611 100% 4,430 100% 12,944 100%
7.20. Other graduate degree compoutothGR
7. Did you complete this degree pursued at another
institution? (continued)
7.17. JD
compoutJD
7.18. MD or DO compoutMD
7.19. PhD compoutPhD
aTotal may not sum to 100% as respondents could select more than one category.
bAlumni from Canadian institutions did not receive this option/question. 141

Graduate Level
Variable Response Options Count % Count % Count % Count %
Poor 2 1% 96 2% 63 1% 228 2%
Fair 20 10% 544 10% 340 8% 1,117 9%
Good 79 40% 2,318 41% 1,600 36% 4,943 38%
Excellent 97 49% 2,722 48% 2,485 55% 6,809 52%
Total 198 100% 5,680 100% 4,488 100% 13,097 100%
Definitely no 4 2% 152 3% 128 3% 382 3%
Probably no 16 8% 478 8% 332 7% 1,040 8%
Uncertain 31 16% 872 15% 615 14% 1,834 14%
Probably yes 76 38% 1,963 35% 1,500 33% 4,509 34%
Definitely yes 72 36% 2,224 39% 1,921 43% 5,362 41%
Total 199 100% 5,689 100% 4,496 100% 13,127 100%
No 27 14% 835 15% 633 14% 1,906 15%
Yes 168 86% 4,775 85% 3,810 86% 11,076 85%
Total 195 100% 5,610 100% 4,443 100% 12,982 100%
Very dissatisfied 1 1% 218 4% 123 3% 426 3%
Somewhat dissatisfied 24 12% 588 11% 331 8% 1,093 9%
Somewhat satisfied 84 43% 2,211 40% 1,444 33% 4,425 35%
Very satisfied 66 34% 2,139 39% 2,186 50% 6,089 48%
Not relevant 20 10% 371 7% 320 7% 779 6%
Total 195 100% 5,527 100% 4,404 100% 12,812 100%
Very dissatisfied 5 3% 263 5% 176 4% 622 5%
Somewhat dissatisfied 19 10% 644 12% 514 12% 1,618 13%
Somewhat satisfied 59 31% 1,718 31% 1,287 29% 3,950 31%
Very satisfied 78 41% 2,191 40% 1,397 32% 4,065 32%
Not relevant 31 16% 695 13% 1,017 23% 2,523 20%
Total 192 100% 5,511 100% 4,391 100% 12,778 100%
11. Would you recommend this institution to another
student like you?
instadisc12.2. Opportunities to work in different artistic
disciplines from your own
recinst
instperform12. At this institution, satisfaction with:
12.1. Opportunities to perform, exhibit, or
present your work
9. Overall, how would you rate your experience at this
institution while pursuing your graduate degree?
instexp
10. If you could start over again, would you attend this
institution?
sameinst
SNAAP 2012 Frequency Report • Institutional Experiences
Sample UniversityArt, Design, and
MediaMidwest
SNAAP
Institutions
Graduate Level
Sample University
cResponse options collapsed. See Codebook for details. 142

Graduate Level
Variable Response Options Count % Count % Count % Count %
SNAAP 2012 Frequency Report • Institutional Experiences
Sample UniversityArt, Design, and
MediaMidwest
SNAAP
Institutions
Graduate Level
Sample University
Very dissatisfied 6 3% 283 5% 158 4% 628 5%
Somewhat dissatisfied 15 8% 713 13% 502 11% 1,640 13%
Somewhat satisfied 61 31% 1,631 30% 1,211 28% 3,575 28%
Very satisfied 68 35% 1,497 27% 1,333 30% 3,282 26%
Not relevant 44 23% 1,352 25% 1,178 27% 3,591 28%
Total 194 100% 5,476 100% 4,382 100% 12,716 100%
Very dissatisfied 4 2% 144 3% 92 2% 334 3%
Somewhat dissatisfied 17 9% 474 9% 298 7% 985 8%
Somewhat satisfied 70 36% 2,129 39% 1,559 36% 4,611 36%
Very satisfied 101 52% 2,680 49% 2,377 54% 6,653 52%
Not relevant 3 2% 76 1% 55 1% 169 1%
Total 195 100% 5,503 100% 4,381 100% 12,752 100%
Very dissatisfied 18 9% 555 10% 371 8% 1,199 9%
Somewhat dissatisfied 30 16% 1,039 19% 702 16% 2,211 17%
Somewhat satisfied 67 35% 1,966 36% 1,545 35% 4,502 35%
Very satisfied 63 33% 1,515 28% 1,507 34% 4,020 32%
Not relevant 14 7% 426 8% 251 6% 815 6%
Total 192 100% 5,501 100% 4,376 100% 12,747 100%
Very dissatisfied 36 19% 1,120 20% 698 16% 2,301 18%
Somewhat dissatisfied 45 23% 1,456 27% 993 23% 3,067 24%
Somewhat satisfied 56 29% 1,624 30% 1,320 30% 3,809 30%
Very satisfied 38 20% 802 15% 970 22% 2,413 19%
Not relevant 19 10% 489 9% 396 9% 1,138 9%
Total 194 100% 5,491 100% 4,377 100% 12,728 100%
instcareer
instclass
12.6. Advising about career or further education
12. At this institution, satisfaction with: (continued)
12.3. Opportunities to take non-arts classes
12.4. Instructors in classrooms, labs, and studios
12.5. Academic advising
instlab
instacad
cResponse options collapsed. See Codebook for details. 143

Graduate Level
Variable Response Options Count % Count % Count % Count %
SNAAP 2012 Frequency Report • Institutional Experiences
Sample UniversityArt, Design, and
MediaMidwest
SNAAP
Institutions
Graduate Level
Sample University
Very dissatisfied 27 14% 879 16% 569 13% 1,936 15%
Somewhat dissatisfied 36 19% 1,264 23% 816 19% 2,640 21%
Somewhat satisfied 39 20% 1,395 25% 1,033 24% 3,067 24%
Very satisfied 54 28% 1,098 20% 1,082 25% 2,742 22%
Not relevant 36 19% 849 15% 880 20% 2,349 18%
Total 192 100% 5,485 100% 4,380 100% 12,734 100%
Very dissatisfied 36 19% 702 13% 495 11% 1,567 12%
Somewhat dissatisfied 47 24% 1,333 24% 951 22% 2,887 23%
Somewhat satisfied 53 27% 1,956 36% 1,522 35% 4,398 35%
Very satisfied 37 19% 1,126 21% 913 21% 2,694 21%
Not relevant 21 11% 369 7% 490 11% 1,179 9%
Total 194 100% 5,486 100% 4,371 100% 12,725 100%
Very dissatisfied 22 11% 572 10% 385 9% 1,218 10%
Somewhat dissatisfied 35 18% 830 15% 586 13% 1,810 14%
Somewhat satisfied 58 30% 2,018 37% 1,544 35% 4,410 35%
Very satisfied 75 38% 1,957 36% 1,794 41% 5,055 40%
Not relevant 5 3% 133 2% 80 2% 279 2%
Total 195 100% 5,510 100% 4,389 100% 12,772 100%
Very dissatisfied 11 6% 239 4% 232 5% 694 5%
Somewhat dissatisfied 23 12% 471 9% 470 11% 1,264 10%
Somewhat satisfied 56 29% 1,585 29% 1,358 31% 3,769 30%
Very satisfied 96 50% 3,041 55% 2,104 48% 6,519 51%
Not relevant 7 4% 159 3% 203 5% 484 4%
Total 193 100% 5,495 100% 4,367 100% 12,730 100%
12.10. Freedom and encouragement to take
risks
instfreedom
instnetwk
instattach
12.8. Opportunities to network with alumni and
others
12.9. Sense of belonging and attachment
instintn12. At this institution, satisfaction with: (continued)
12.7. Opportunities for degree-related
internships or work
cResponse options collapsed. See Codebook for details. 144

Graduate Level
Variable Response Options Count % Count % Count % Count %
SNAAP 2012 Frequency Report • Institutional Experiences
Sample UniversityArt, Design, and
MediaMidwest
SNAAP
Institutions
Graduate Level
Sample University
Not well at all 3 2% 111 2% 79 2% 244 2%
Not too well 9 5% 294 5% 169 4% 585 5%
Fairly well 29 15% 944 17% 718 16% 2,136 17%
Very well 64 33% 1,221 22% 1,388 31% 3,452 27%
Did not pursue further education 90 46% 2,957 54% 2,054 47% 6,401 50%
Total 195 100% 5,527 100% 4,408 100% 12,818 100%
Not at all 2 1% 123 2% 83 2% 349 3%
Very little 9 5% 388 7% 341 8% 1,065 8%
Some 69 36% 1,853 34% 1,591 36% 4,499 36%
Very much 114 59% 3,108 57% 2,353 54% 6,755 53%
Total 194 100% 5,472 100% 4,368 100% 12,668 100%
Not at all 5 3% 138 3% 83 2% 364 3%
Very little 15 8% 660 12% 375 9% 1,387 11%
Some 84 43% 2,338 43% 1,705 39% 5,181 41%
Very much 92 47% 2,321 43% 2,201 50% 5,711 45%
Total 196 100% 5,457 100% 4,364 100% 12,643 100%
Not at all 1 1% 85 2% 62 1% 210 2%
Very little 21 11% 413 8% 278 6% 914 7%
Some 62 32% 2,028 37% 1,652 38% 4,651 37%
Very much 109 56% 2,922 54% 2,354 54% 6,834 54%
Total 193 100% 5,448 100% 4,346 100% 12,609 100%
Not at all 3 2% 84 2% 70 2% 262 2%
Very little 10 5% 316 6% 306 7% 913 7%
Some 65 34% 1,704 31% 1,497 34% 4,095 32%
Very much 116 60% 3,359 61% 2,485 57% 7,380 58%
Total 194 100% 5,463 100% 4,358 100% 12,650 100%
13. How well did this institution prepare you for your
further education?
edprep
14. How much this institution helped you acquire or
develop:
14.1. Critical thinking and analysis of
arguments and information
instanaly
14.2. Broad knowledge and education instbroad
14.3. Improved work based on feedback from
others
instrev
14.4. Creative thinking and problem solving instcreative
cResponse options collapsed. See Codebook for details. 145
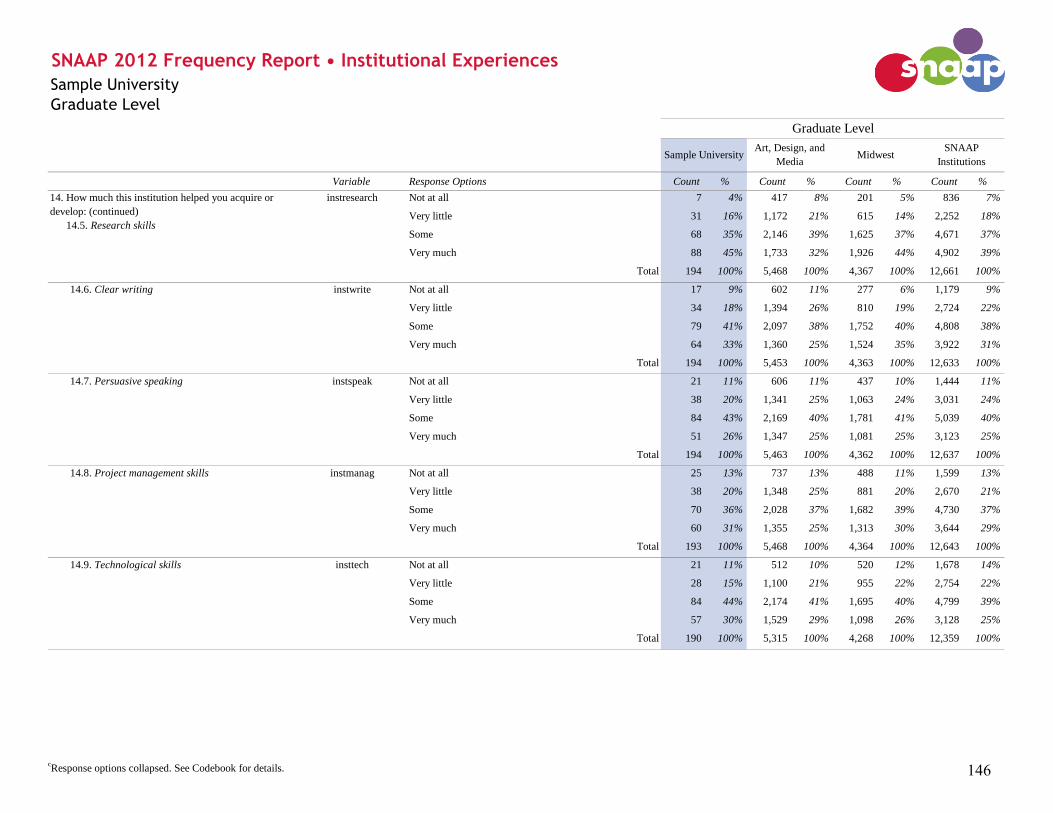
Graduate Level
Variable Response Options Count % Count % Count % Count %
SNAAP 2012 Frequency Report • Institutional Experiences
Sample UniversityArt, Design, and
MediaMidwest
SNAAP
Institutions
Graduate Level
Sample University
Not at all 7 4% 417 8% 201 5% 836 7%
Very little 31 16% 1,172 21% 615 14% 2,252 18%
Some 68 35% 2,146 39% 1,625 37% 4,671 37%
Very much 88 45% 1,733 32% 1,926 44% 4,902 39%
Total 194 100% 5,468 100% 4,367 100% 12,661 100%
Not at all 17 9% 602 11% 277 6% 1,179 9%
Very little 34 18% 1,394 26% 810 19% 2,724 22%
Some 79 41% 2,097 38% 1,752 40% 4,808 38%
Very much 64 33% 1,360 25% 1,524 35% 3,922 31%
Total 194 100% 5,453 100% 4,363 100% 12,633 100%
Not at all 21 11% 606 11% 437 10% 1,444 11%
Very little 38 20% 1,341 25% 1,063 24% 3,031 24%
Some 84 43% 2,169 40% 1,781 41% 5,039 40%
Very much 51 26% 1,347 25% 1,081 25% 3,123 25%
Total 194 100% 5,463 100% 4,362 100% 12,637 100%
Not at all 25 13% 737 13% 488 11% 1,599 13%
Very little 38 20% 1,348 25% 881 20% 2,670 21%
Some 70 36% 2,028 37% 1,682 39% 4,730 37%
Very much 60 31% 1,355 25% 1,313 30% 3,644 29%
Total 193 100% 5,468 100% 4,364 100% 12,643 100%
Not at all 21 11% 512 10% 520 12% 1,678 14%
Very little 28 15% 1,100 21% 955 22% 2,754 22%
Some 84 44% 2,174 41% 1,695 40% 4,799 39%
Very much 57 30% 1,529 29% 1,098 26% 3,128 25%
Total 190 100% 5,315 100% 4,268 100% 12,359 100%
14.6. Clear writing instwrite
14.9. Technological skills insttech
14.7. Persuasive speaking instspeak
14.8. Project management skills instmanag
14. How much this institution helped you acquire or
develop: (continued)
14.5. Research skills
instresearch
cResponse options collapsed. See Codebook for details. 146

Graduate Level
Variable Response Options Count % Count % Count % Count %
SNAAP 2012 Frequency Report • Institutional Experiences
Sample UniversityArt, Design, and
MediaMidwest
SNAAP
Institutions
Graduate Level
Sample University
Not at all 12 6% 371 7% 247 6% 751 6%
Very little 24 13% 718 14% 373 9% 1,230 10%
Some 68 37% 2,067 39% 1,350 32% 3,972 32%
Very much 82 44% 2,130 40% 2,294 54% 6,386 52%
Total 186 100% 5,286 100% 4,264 100% 12,339 100%
Not at all 85 45% 2,268 43% 1,767 41% 5,306 43%
Very little 72 38% 1,947 37% 1,521 36% 4,445 36%
Some 28 15% 871 16% 798 19% 2,121 17%
Very much 4 2% 216 4% 185 4% 468 4%
Total 189 100% 5,302 100% 4,271 100% 12,340 100%
Not at all 87 46% 2,166 41% 1,697 40% 4,957 40%
Very little 61 32% 1,804 34% 1,457 34% 4,134 34%
Some 35 19% 978 19% 846 20% 2,437 20%
Very much 6 3% 312 6% 232 5% 718 6%
Total 189 100% 5,260 100% 4,232 100% 12,246 100%
Not at all 19 10% 486 9% 299 7% 962 8%
Very little 38 20% 1,034 19% 610 14% 1,981 16%
Some 81 42% 2,202 41% 1,784 42% 5,016 41%
Very much 53 28% 1,586 30% 1,588 37% 4,414 36%
Total 191 100% 5,308 100% 4,281 100% 12,373 100%
Not at all 25 13% 802 15% 426 10% 1,521 12%
Very little 51 27% 1,290 24% 773 18% 2,501 20%
Some 59 31% 2,064 39% 1,743 41% 4,871 39%
Very much 55 29% 1,134 21% 1,320 31% 3,443 28%
Total 190 100% 5,290 100% 4,262 100% 12,336 100%
14. How much this institution helped you acquire or
develop: (continued)
14.10. Artistic technique
instartistic
14.11. Financial and business management skills instbus
14.12. Entrepreneurial skills instentr
14.13. Interpersonal relations and working
collaboratively
instwkoth
14.14. Leadership skills instleader
cResponse options collapsed. See Codebook for details. 147

Graduate Level
Variable Response Options Count % Count % Count % Count %
SNAAP 2012 Frequency Report • Institutional Experiences
Sample UniversityArt, Design, and
MediaMidwest
SNAAP
Institutions
Graduate Level
Sample University
Not at all 29 15% 703 13% 492 12% 1,537 12%
Very little 56 30% 1,268 24% 1,033 24% 2,930 24%
Some 66 35% 2,151 41% 1,727 40% 4,995 40%
Very much 38 20% 1,178 22% 1,014 24% 2,888 23%
Total 189 100% 5,300 100% 4,266 100% 12,350 100%
Not at all 15 8% 814 15% 373 9% 1,443 12%
Very little 28 15% 1,135 21% 668 16% 2,154 17%
Some 65 34% 1,924 36% 1,501 35% 4,399 36%
Very much 82 43% 1,441 27% 1,733 41% 4,377 35%
Total 190 100% 5,314 100% 4,275 100% 12,373 100%
Never 71 37% 2,088 39% 1,450 34% 4,648 37%
Rarely 59 31% 1,518 28% 1,247 29% 3,456 28%
Sometimes 48 25% 1,295 24% 1,151 27% 3,130 25%
Often 15 8% 482 9% 458 11% 1,222 10%
Total 193 100% 5,383 100% 4,306 100% 12,456 100%
Never 84 44% 2,429 45% 1,916 45% 6,018 48%
Rarely 48 25% 1,384 26% 1,059 25% 3,067 25%
Sometimes 36 19% 993 19% 818 19% 2,183 18%
Often 22 12% 537 10% 500 12% 1,141 9%
Total 190 100% 5,343 100% 4,293 100% 12,409 100%
Never 10 5% 319 6% 305 7% 902 7%
Rarely 31 16% 705 13% 659 15% 1,822 15%
Sometimes 81 42% 1,994 37% 1,661 39% 4,588 37%
Often 70 36% 2,362 44% 1,688 39% 5,143 41%
Total 192 100% 5,380 100% 4,313 100% 12,455 100%
instteach
15. How often you did the following while enrolled at
this institution:
15.1. Participated in community service
actcomser
15.2. Participated in co-curricular activities
(organizations, campus publications, student
government, fraternity or sorority, sports)
actcocurr
15.3. Had serious conversations with students who
are different from you in terms of their ethnicity,
religious beliefs, political opinions, or personal
values
actdiv
14. How much this institution helped you acquire or
develop: (continued)
14.15. Networking and relationship building
instnetrel
14.16. Teaching skills
cResponse options collapsed. See Codebook for details. 148

Graduate Level
Variable Response Options Count % Count % Count % Count %
SNAAP 2012 Frequency Report • Institutional Experiences
Sample UniversityArt, Design, and
MediaMidwest
SNAAP
Institutions
Graduate Level
Sample University
No 36 19% 1,418 26% 905 21% 2,895 23%
Yes 156 81% 3,962 74% 3,409 79% 9,579 77%
Total 192 100% 5,380 100% 4,314 100% 12,474 100%
No 82 43% 2,931 55% 2,194 51% 6,262 50%
Yes 107 57% 2,434 45% 2,098 49% 6,176 50%
Total 189 100% 5,365 100% 4,292 100% 12,438 100%
No 169 91% 4,597 86% 3,723 87% 10,959 89%
Yes 17 9% 722 14% 559 13% 1,414 11%
Total 186 100% 5,319 100% 4,282 100% 12,373 100%
No 150 80% 3,583 67% 3,159 74% 9,193 74%
Yes 38 20% 1,731 33% 1,121 26% 3,167 26%
Total 188 100% 5,314 100% 4,280 100% 12,360 100%
No 65 34% 1,580 29% 2,229 52% 5,508 44%
Yes 126 66% 3,787 71% 2,062 48% 6,918 56%
Total 191 100% 5,367 100% 4,291 100% 12,426 100%
suptadv Have not used 141 75% 3,596 69% 3,057 73% 8,501 70%
Used 7 4% 281 5% 253 6% 696 6%
Uncertain if service is available 40 21% 1,330 26% 893 21% 2,876 24%
Total 188 100% 5,207 100% 4,203 100% 12,073 100%
suptcareer Have not used 123 66% 3,006 58% 2,615 62% 7,311 60%
Used 35 19% 1,221 23% 875 21% 2,532 21%
Uncertain if service is available 29 16% 983 19% 717 17% 2,246 19%
Total 187 100% 5,210 100% 4,207 100% 12,089 100%
suptedu Have not used 135 72% 3,662 71% 3,058 73% 8,618 72%
Used 22 12% 543 10% 424 10% 1,139 9%
Uncertain if service is available 31 16% 986 19% 710 17% 2,275 19%
Total 188 100% 5,191 100% 4,192 100% 12,032 100%
16.5. Complete a portfolio (a document/record of
your cumulative artistic work)
actport
16.4. Internship actintn
actfac12_R
16.2. Work with an artist in the communityc actartist12_R
16.3. Study abroad actabroad
18. Have you used any of the following support services
that may be offered by this institution since you left
there?
18.1. Advising for further education
18.2. Career services
18.3. Continuing education and training
16. Did you do the following while at this institution?
16.1. Work with a faculty member on a projectc
cResponse options collapsed. See Codebook for details. 149

Graduate Level
Variable Response Options Count % Count % Count % Count %
SNAAP 2012 Frequency Report • Institutional Experiences
Sample UniversityArt, Design, and
MediaMidwest
SNAAP
Institutions
Graduate Level
Sample University
suptnetwk Have not used 102 55% 2,476 48% 2,195 52% 6,031 50%
Used 47 25% 1,818 35% 1,300 31% 3,952 33%
Uncertain if service is available 38 20% 894 17% 694 17% 2,051 17%
Total 187 100% 5,188 100% 4,189 100% 12,034 100%
suptart Have not used 98 52% 2,874 55% 2,569 61% 6,799 56%
Used 45 24% 1,046 20% 686 16% 2,285 19%
Uncertain if service is available 44 24% 1,281 25% 939 22% 2,959 25%
Total 187 100% 5,201 100% 4,194 100% 12,043 100%
suptteach Have not used 71 38% 1,956 38% 1,543 37% 4,262 35%
Used 84 45% 2,224 43% 2,077 50% 5,829 48%
Uncertain if service is available 32 17% 1,017 20% 564 13% 1,939 16%
Total 187 100% 5,197 100% 4,184 100% 12,030 100%
18.6. Continued access to mentors and teachers
18. Have you used any of the following support services
that may be offered by this institution since you left
there? (continued)
18.4. Networking opportunities
18.5. Opportunities or resources to present artistic
work
cResponse options collapsed. See Codebook for details. 150
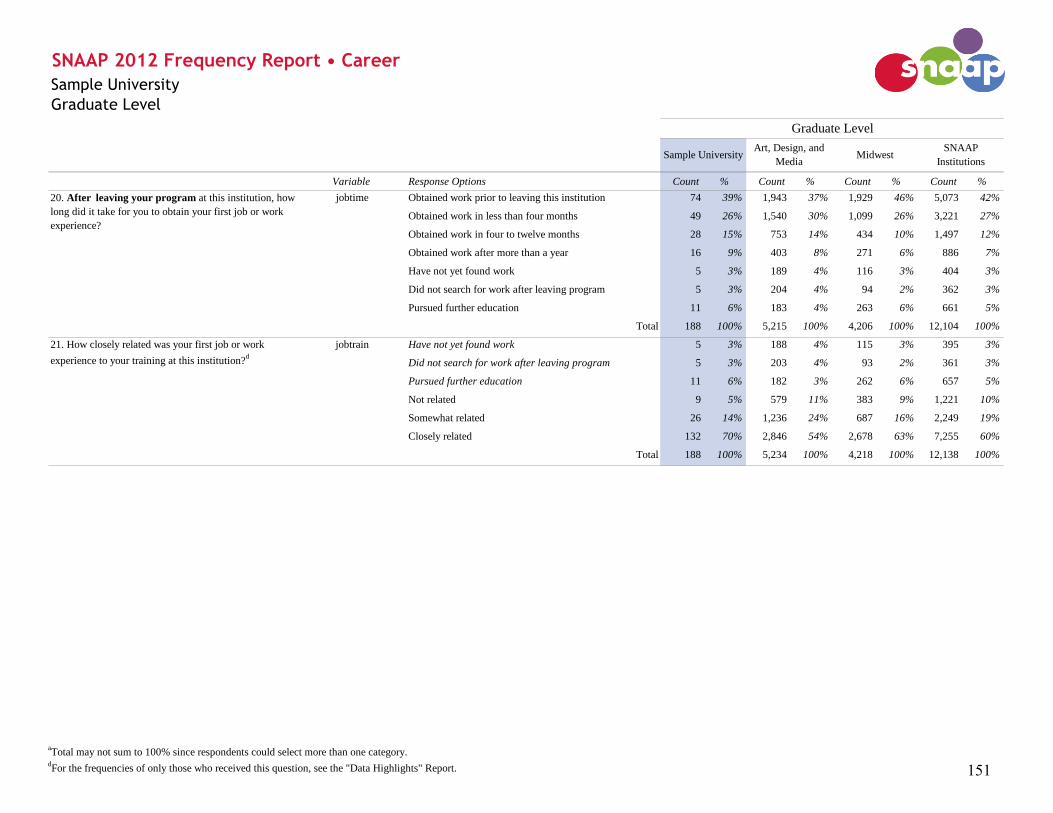
Graduate Level
Variable Response Options Count % Count % Count % Count %
jobtime Obtained work prior to leaving this institution 74 39% 1,943 37% 1,929 46% 5,073 42%
Obtained work in less than four months 49 26% 1,540 30% 1,099 26% 3,221 27%
Obtained work in four to twelve months 28 15% 753 14% 434 10% 1,497 12%
Obtained work after more than a year 16 9% 403 8% 271 6% 886 7%
Have not yet found work 5 3% 189 4% 116 3% 404 3%
Did not search for work after leaving program 5 3% 204 4% 94 2% 362 3%
Pursued further education 11 6% 183 4% 263 6% 661 5%
Total 188 100% 5,215 100% 4,206 100% 12,104 100%
jobtrain Have not yet found work 5 3% 188 4% 115 3% 395 3%
Did not search for work after leaving program 5 3% 203 4% 93 2% 361 3%
Pursued further education 11 6% 182 3% 262 6% 657 5%
Not related 9 5% 579 11% 383 9% 1,221 10%
Somewhat related 26 14% 1,236 24% 687 16% 2,249 19%
Closely related 132 70% 2,846 54% 2,678 63% 7,255 60%
Total 188 100% 5,234 100% 4,218 100% 12,138 100%
SNAAP 2012 Frequency Report • Career
Sample UniversityArt, Design, and
MediaMidwest
SNAAP
Institutions
Graduate Level
Sample University
20. After leaving your program at this institution, how
long did it take for you to obtain your first job or work
experience?
21. How closely related was your first job or work
experience to your training at this institution?d
aTotal may not sum to 100% since respondents could select more than one category.
dFor the frequencies of only those who received this question, see the "Data Highlights" Report. 151

Graduate Level
Variable Response Options Count % Count % Count % Count %
SNAAP 2012 Frequency Report • Career
Sample UniversityArt, Design, and
MediaMidwest
SNAAP
Institutions
Graduate Level
Sample University
nartjob_none Never worked outside of the arts 39 21% 821 16% 766 18% 1,961 16%
nartjob_maintn Building, maintenance, installation, and repair 28 15% 838 16% 504 12% 1,574 13%
nartjob_comm Communications 36 19% 1,531 30% 972 23% 3,187 27%
nartjob_comput Computer and mathematics 17 9% 437 8% 329 8% 1,064 9%
nartjob_construct Construction 24 13% 806 16% 451 11% 1,381 12%
nartjob_edu Education, training, and library 99 53% 2,582 50% 2,067 50% 6,210 52%
nartjob_engocc Engineering and science 6 3% 262 5% 179 4% 428 4%
nartjob_farm Farming, fishing, and forestry 4 2% 199 4% 150 4% 447 4%
nartjob_finan Financial and other business services 7 4% 307 6% 289 7% 847 7%
nartjob_food Food preparation related 32 17% 1,156 22% 828 20% 2,608 22%
nartjob_hlthtech Healthcare 10 5% 317 6% 256 6% 713 6%
nartjob_humres Human resources 8 4% 148 3% 137 3% 403 3%
nartjob_legal Legal 3 2% 152 3% 135 3% 425 4%
nartjob_manag Management 19 10% 752 15% 618 15% 1,703 14%
nartjob_manfact Manufacturing 11 6% 290 6% 184 4% 555 5%
nartjob_military Military and protective services 5 3% 95 2% 115 3% 276 2%
nartjob_office Office and administrative support 28 15% 1,323 26% 1,080 26% 3,298 28%
nartjob_sales Sales 31 16% 1,193 23% 905 22% 2,730 23%
nartjob_care Services and personal care 20 11% 433 8% 327 8% 1,074 9%
nartjob_socialser Social services 14 7% 345 7% 277 7% 793 7%
nartjob_transport Transportation and material moving 2 1% 212 4% 126 3% 447 4%
nartjob_othnart Other occupations outside of the arts 25 13% 811 16% 603 14% 1,763 15%
Totala - - - - - - - -
22. Occupations outside of the arts in which you have
worked, now or in the past
aTotal may not sum to 100% since respondents could select more than one category.
dFor the frequencies of only those who received this question, see the "Data Highlights" Report. 152

Graduate Level
Variable Response Options Count % Count % Count % Count %
SNAAP 2012 Frequency Report • Career
Sample UniversityArt, Design, and
MediaMidwest
SNAAP
Institutions
Graduate Level
Sample University
Yes, I do this currently 95 50% 1,817 35% 1,888 45% 5,346 44%
Yes, I have done it in the past, but no longer do 66 35% 1,797 35% 1,509 36% 4,201 35%
No, I have not done this 28 15% 1,587 31% 802 19% 2,508 21%
Total 189 100% 5,201 100% 4,199 100% 12,055 100%
Yes, I do this currently 42 22% 1,071 21% 1,029 25% 2,734 23%
Yes, I have done it in the past, but no longer do 60 32% 1,294 25% 1,092 26% 3,054 25%
No, I have not done this 87 46% 2,815 54% 2,058 49% 6,224 52%
Total 189 100% 5,180 100% 4,179 100% 12,012 100%
Yes, I do this currently 120 63% 3,047 59% 2,384 57% 7,226 60%
Yes, I have done it in the past, but no longer do 33 17% 931 18% 925 22% 2,418 20%
No, I have not done this 37 19% 1,227 24% 890 21% 2,417 20%
Total 190 100% 5,205 100% 4,199 100% 12,061 100%
artsrel
25. Have you ever worked, either full- or part-time, in an
occupation as an artist (where you create or perform your
art)?
artist
23. Have you ever worked as a full- or part-time teacher
of the arts (i.e., classroom setting or private lessons)?
teach
24. Have you ever worked, either full- or part-time,
managing or administering programs or people for an
arts or arts-related organization or business?
aTotal may not sum to 100% since respondents could select more than one category.
dFor the frequencies of only those who received this question, see the "Data Highlights" Report. 153

Graduate Level
Variable Response Options Count % Count % Count % Count %
SNAAP 2012 Frequency Report • Career
Sample UniversityArt, Design, and
MediaMidwest
SNAAP
Institutions
Graduate Level
Sample University
26. Occupations associated with the arts in which you
have worked, now or in the past artjob_none Never worked in an occupation associated with the arts 4 2% 186 4% 126 3% 324 3%
Architecture: artjob_arch Architect 8 4% 747 14% 423 10% 1,012 8%
Arts Administration: artjob_artadm Arts administrator or manager 34 18% 1,025 20% 960 23% 2,722 23%
artjob_curator Museum or gallery worker, including curator 61 32% 1,443 28% 603 14% 2,076 17%
Design: artjob_graphicdes Graphic designer, illustrator, or art director 56 29% 1,589 31% 553 13% 2,314 19%
artjob_intdes Interior designer 4 2% 374 7% 149 4% 552 5%
artjob_webdes Web designer 21 11% 662 13% 277 7% 1,134 9%
artjob_othdes Other designer 18 9% 526 10% 285 7% 1,041 9%
Education: artjob_tchhied Higher education arts educator 110 58% 2,055 40% 1,934 46% 5,342 45%
artjob_tchk12 K-12 arts educator 52 27% 1,147 22% 1,163 28% 3,214 27%
artjob_prvttch Private teacher of the arts 31 16% 846 16% 1,311 31% 3,539 30%
artjob_othtch Other arts educator 20 11% 605 12% 400 10% 1,213 10%
Fine and Media Arts: artjob_craft Craft artist 36 19% 676 13% 321 8% 1,069 9%
artjob_finart Fine artist 102 54% 2,152 42% 768 18% 2,955 25%
artjob_film Film, TV, video artist 12 6% 686 13% 334 8% 1,321 11%
artjob_animator Multi-media artist or animator 8 4% 527 10% 206 5% 825 7%
artjob_photo Photographer 30 16% 1,008 19% 347 8% 1,452 12%
Performance: artjob_actor Actor 5 3% 207 4% 384 9% 1,116 9%
artjob_choreo Dancer or choreographer 3 2% 116 2% 153 4% 543 5%
artjob_sound Engineer or technician (sound, light, other) 4 2% 116 2% 157 4% 504 4%
artjob_musician Musician 6 3% 257 5% 1,601 38% 3,707 31%
artjob_stage Theater and stage director or producer 1 1% 121 2% 399 10% 1,093 9%
Writing: artjob_writer Writer, author, or editor 50 26% 1,266 24% 984 24% 3,010 25%
Other: artjob_othart Other arts occupation 22 12% 764 15% 582 14% 1,631 14%
Totala - - - - - - - -
aTotal may not sum to 100% since respondents could select more than one category.
dFor the frequencies of only those who received this question, see the "Data Highlights" Report. 154
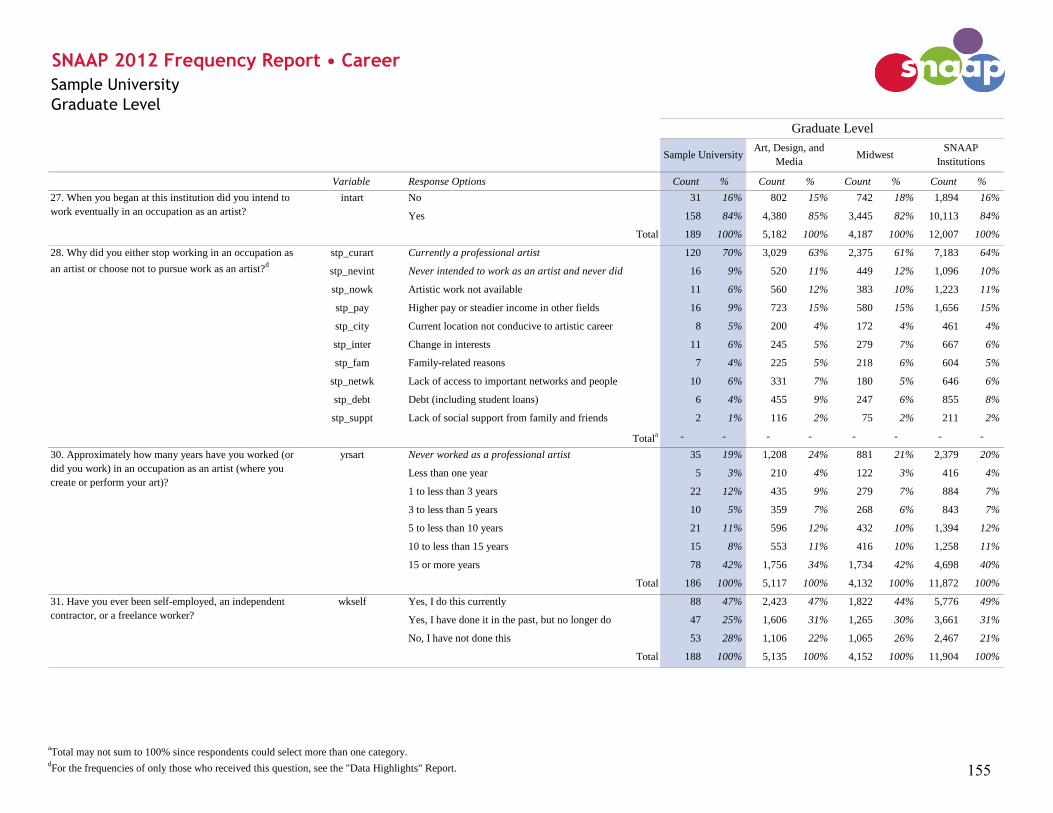
Graduate Level
Variable Response Options Count % Count % Count % Count %
SNAAP 2012 Frequency Report • Career
Sample UniversityArt, Design, and
MediaMidwest
SNAAP
Institutions
Graduate Level
Sample University
intart No 31 16% 802 15% 742 18% 1,894 16%
Yes 158 84% 4,380 85% 3,445 82% 10,113 84%
Total 189 100% 5,182 100% 4,187 100% 12,007 100%
stp_curart Currently a professional artist 120 70% 3,029 63% 2,375 61% 7,183 64%
stp_nevint Never intended to work as an artist and never did 16 9% 520 11% 449 12% 1,096 10%
stp_nowk Artistic work not available 11 6% 560 12% 383 10% 1,223 11%
stp_pay Higher pay or steadier income in other fields 16 9% 723 15% 580 15% 1,656 15%
stp_city Current location not conducive to artistic career 8 5% 200 4% 172 4% 461 4%
stp_inter Change in interests 11 6% 245 5% 279 7% 667 6%
stp_fam Family-related reasons 7 4% 225 5% 218 6% 604 5%
stp_netwk Lack of access to important networks and people 10 6% 331 7% 180 5% 646 6%
stp_debt Debt (including student loans) 6 4% 455 9% 247 6% 855 8%
stp_suppt Lack of social support from family and friends 2 1% 116 2% 75 2% 211 2%
Totala - - - - - - - -
yrsart Never worked as a professional artist 35 19% 1,208 24% 881 21% 2,379 20%
Less than one year 5 3% 210 4% 122 3% 416 4%
1 to less than 3 years 22 12% 435 9% 279 7% 884 7%
3 to less than 5 years 10 5% 359 7% 268 6% 843 7%
5 to less than 10 years 21 11% 596 12% 432 10% 1,394 12%
10 to less than 15 years 15 8% 553 11% 416 10% 1,258 11%
15 or more years 78 42% 1,756 34% 1,734 42% 4,698 40%
Total 186 100% 5,117 100% 4,132 100% 11,872 100%
wkself Yes, I do this currently 88 47% 2,423 47% 1,822 44% 5,776 49%
Yes, I have done it in the past, but no longer do 47 25% 1,606 31% 1,265 30% 3,661 31%
No, I have not done this 53 28% 1,106 22% 1,065 26% 2,467 21%
Total 188 100% 5,135 100% 4,152 100% 11,904 100%
27. When you began at this institution did you intend to
work eventually in an occupation as an artist?
30. Approximately how many years have you worked (or
did you work) in an occupation as an artist (where you
create or perform your art)?
31. Have you ever been self-employed, an independent
contractor, or a freelance worker?
28. Why did you either stop working in an occupation as
an artist or choose not to pursue work as an artist?d
aTotal may not sum to 100% since respondents could select more than one category.
dFor the frequencies of only those who received this question, see the "Data Highlights" Report. 155

Graduate Level
Variable Response Options Count % Count % Count % Count %
SNAAP 2012 Frequency Report • Career
Sample UniversityArt, Design, and
MediaMidwest
SNAAP
Institutions
Graduate Level
Sample University
Never worked as a professional artist 11 6% 698 14% 453 11% 1,330 11%
Never been self-employed 29 16% 594 12% 637 15% 1,415 12%
Never self-employed and never a professional artist 24 13% 509 10% 428 10% 1,048 9%
Yes, I do this currently 82 45% 2,088 41% 1,575 38% 5,070 43%
Yes, I have done it in the past, but no longer do 30 16% 1,086 21% 932 23% 2,695 23%
No, I have not done this 8 4% 126 2% 103 2% 267 2%
Total 184 100% 5,101 100% 4,128 100% 11,825 100%
wkfd No 144 85% 3,723 80% 3,144 81% 8,846 80%
Yes 25 15% 903 20% 750 19% 2,231 20%
Total 169 100% 4,626 100% 3,894 100% 11,077 100%
wkpdint No 133 78% 2,820 61% 2,744 71% 7,672 70%
Yes 37 22% 1,812 39% 1,103 29% 3,258 30%
Total 170 100% 4,632 100% 3,847 100% 10,930 100%
wkupdint No 118 72% 2,848 62% 2,832 76% 7,651 71%
Yes 45 28% 1,734 38% 909 24% 3,112 29%
Total 163 100% 4,582 100% 3,741 100% 10,763 100%
artwkfd Never founder of a nonprofit or for-profit organization 143 79% 3,704 76% 3,123 78% 8,801 77%
No 12 7% 328 7% 199 5% 606 5%
Yes 25 14% 850 17% 700 17% 2,083 18%
Total 180 100% 4,882 100% 4,022 100% 11,490 100%
artwkpdint Never worked as a paid intern 132 74% 2,801 58% 2,722 68% 7,626 67%
No 11 6% 431 9% 260 7% 776 7%
Yes 36 20% 1,612 33% 992 25% 2,927 26%
Total 179 100% 4,844 100% 3,974 100% 11,329 100%
artwkupdint Never worked as an unpaid intern 117 67% 2,816 59% 2,804 72% 7,586 68%
No 11 6% 344 7% 248 6% 700 6%
Yes 46 26% 1,614 34% 847 22% 2,902 26%
Total 174 100% 4,774 100% 3,899 100% 11,188 100%
34. Was any of your work as a founder of a nonprofit or
for-profit organization arts-related?
35. Was any of your work as a paid intern arts-related?
36. Was any of your work as an unpaid intern arts-
related?
artwkself
33. Are you now or have you ever been a(n):
33.1. Founder of a nonprofit or for-profit
organization
33.2. Paid intern
33.3. Unpaid intern
32. In your capacity as an artist, have you ever been self-
employed, an independent contractor, or a freelance
worker?d
aTotal may not sum to 100% since respondents could select more than one category.
dFor the frequencies of only those who received this question, see the "Data Highlights" Report. 156

Graduate Level
Variable Response Options Count % Count % Count % Count %
SNAAP 2012 Frequency Report • Career
Sample UniversityArt, Design, and
MediaMidwest
SNAAP
Institutions
Graduate Level
Sample University
hlp_dnrq Never worked as a professional artist 35 19% 1,178 23% 868 21% 2,335 20%
hlp_none None of the below is/was very important 3 2% 145 3% 148 4% 384 3%
hlp_capital Loans, investment capital 41 22% 1,378 27% 911 22% 3,008 26%
hlp_grants Prizes, grants, or commissions 101 54% 2,445 48% 1,672 41% 5,211 44%
hlp_netwk Strong network of peers and colleagues 113 61% 2,936 58% 2,316 56% 6,968 59%
hlp_pub Publicity or acknowledgement of your work 110 59% 2,593 51% 1,826 44% 5,617 48%
hlp_space Material resources (e.g., equipment, space) 105 56% 2,371 47% 1,500 37% 4,835 41%
hlp_mentor Mentors and teachers 113 61% 2,697 53% 2,407 59% 6,884 58%
hlp_train Additional training 77 41% 1,546 30% 1,322 32% 3,842 33%
hlp_city Opportunity to live in an artistically vital location 93 50% 2,306 45% 1,714 42% 5,384 46%
hlp_oth Other 11 6% 286 6% 199 5% 633 5%
Totala - - - - - - - -
bar_dnrq Never worked as a professional artist 35 20% 1,178 24% 868 22% 2,335 20%
bar_none None of the below is/was lacking 33 19% 660 13% 836 21% 1,922 17%
bar_capital Loans, investment capital 35 20% 1,276 26% 869 22% 2,946 26%
bar_grants Prizes, grants, or commissions 49 28% 1,704 34% 1,153 29% 3,852 33%
bar_netwk Strong network of peers and colleagues 47 27% 1,313 26% 856 21% 2,765 24%
bar_pub Publicity or acknowledgement of your work 41 23% 1,521 31% 940 23% 3,297 29%
bar_space Material resources (e.g., equipment, space) 48 27% 1,427 29% 929 23% 3,196 28%
bar_mentor Mentors and teachers 29 16% 1,023 21% 618 15% 2,055 18%
bar_train Additional training 28 16% 824 17% 510 13% 1,724 15%
bar_city Opportunity to live in an artistically vital location 40 23% 883 18% 785 20% 2,234 19%
bar_oth Other 7 4% 224 5% 177 4% 534 5%
Totala - - - - - - - -
37. Which of the following resources are very important
for success in your artistic career now or in the past?d
38. Which of these resources have been insufficient,
posing significant barriers to achieving success in your
artistic career (now or in the past)?d
aTotal may not sum to 100% since respondents could select more than one category.
dFor the frequencies of only those who received this question, see the "Data Highlights" Report. 157
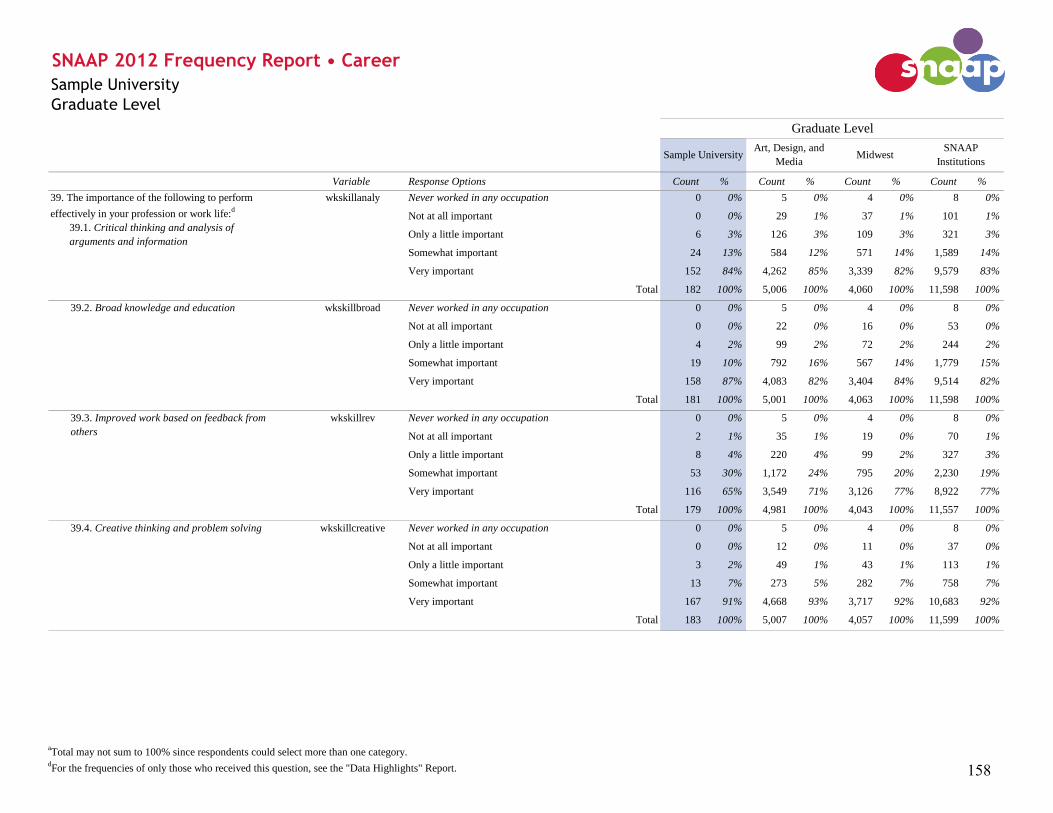
Graduate Level
Variable Response Options Count % Count % Count % Count %
SNAAP 2012 Frequency Report • Career
Sample UniversityArt, Design, and
MediaMidwest
SNAAP
Institutions
Graduate Level
Sample University
wkskillanaly Never worked in any occupation 0 0% 5 0% 4 0% 8 0%
Not at all important 0 0% 29 1% 37 1% 101 1%
Only a little important 6 3% 126 3% 109 3% 321 3%
Somewhat important 24 13% 584 12% 571 14% 1,589 14%
Very important 152 84% 4,262 85% 3,339 82% 9,579 83%
Total 182 100% 5,006 100% 4,060 100% 11,598 100%
wkskillbroad Never worked in any occupation 0 0% 5 0% 4 0% 8 0%
Not at all important 0 0% 22 0% 16 0% 53 0%
Only a little important 4 2% 99 2% 72 2% 244 2%
Somewhat important 19 10% 792 16% 567 14% 1,779 15%
Very important 158 87% 4,083 82% 3,404 84% 9,514 82%
Total 181 100% 5,001 100% 4,063 100% 11,598 100%
wkskillrev Never worked in any occupation 0 0% 5 0% 4 0% 8 0%
Not at all important 2 1% 35 1% 19 0% 70 1%
Only a little important 8 4% 220 4% 99 2% 327 3%
Somewhat important 53 30% 1,172 24% 795 20% 2,230 19%
Very important 116 65% 3,549 71% 3,126 77% 8,922 77%
Total 179 100% 4,981 100% 4,043 100% 11,557 100%
wkskillcreative Never worked in any occupation 0 0% 5 0% 4 0% 8 0%
Not at all important 0 0% 12 0% 11 0% 37 0%
Only a little important 3 2% 49 1% 43 1% 113 1%
Somewhat important 13 7% 273 5% 282 7% 758 7%
Very important 167 91% 4,668 93% 3,717 92% 10,683 92%
Total 183 100% 5,007 100% 4,057 100% 11,599 100%
39. The importance of the following to perform
effectively in your profession or work life:d
39.1. Critical thinking and analysis of
arguments and information
39.2. Broad knowledge and education
39.3. Improved work based on feedback from
others
39.4. Creative thinking and problem solving
aTotal may not sum to 100% since respondents could select more than one category.
dFor the frequencies of only those who received this question, see the "Data Highlights" Report. 158

Graduate Level
Variable Response Options Count % Count % Count % Count %
SNAAP 2012 Frequency Report • Career
Sample UniversityArt, Design, and
MediaMidwest
SNAAP
Institutions
Graduate Level
Sample University
wkskillresearch Never worked in any occupation 0 0% 5 0% 4 0% 8 0%
Not at all important 2 1% 47 1% 56 1% 165 1%
Only a little important 12 7% 311 6% 329 8% 897 8%
Somewhat important 47 26% 1,340 27% 1,217 30% 3,423 30%
Very important 122 67% 3,289 66% 2,443 60% 7,080 61%
Total 183 100% 4,992 100% 4,049 100% 11,573 100%
wkskillwrite Never worked in any occupation 0 0% 5 0% 4 0% 8 0%
Not at all important 2 1% 57 1% 60 1% 195 2%
Only a little important 13 7% 242 5% 207 5% 682 6%
Somewhat important 33 18% 1,022 20% 859 21% 2,489 22%
Very important 134 74% 3,668 73% 2,916 72% 8,195 71%
Total 182 100% 4,994 100% 4,046 100% 11,569 100%
wkskillspeak Never worked in any occupation 0 0% 5 0% 4 0% 8 0%
Not at all important 4 2% 55 1% 50 1% 161 1%
Only a little important 13 7% 214 4% 179 4% 558 5%
Somewhat important 46 25% 1,050 21% 870 21% 2,501 22%
Very important 118 65% 3,667 73% 2,947 73% 8,352 72%
Total 181 100% 4,991 100% 4,050 100% 11,580 100%
wkskillmanag Never worked in any occupation 0 0% 5 0% 4 0% 8 0%
Not at all important 2 1% 56 1% 62 2% 209 2%
Only a little important 9 5% 151 3% 161 4% 445 4%
Somewhat important 39 22% 840 17% 737 18% 2,077 18%
Very important 130 72% 3,929 79% 3,080 76% 8,802 76%
Total 180 100% 4,981 100% 4,044 100% 11,541 100%
39.6. Clear writing
39. The importance of the following to perform
effectively in your profession or work life: (continued)d
39.5. Research skills
39.7. Persuasive speaking
39.8. Project management skills
aTotal may not sum to 100% since respondents could select more than one category.
dFor the frequencies of only those who received this question, see the "Data Highlights" Report. 159

Graduate Level
Variable Response Options Count % Count % Count % Count %
SNAAP 2012 Frequency Report • Career
Sample UniversityArt, Design, and
MediaMidwest
SNAAP
Institutions
Graduate Level
Sample University
wkskilltech Never worked in any occupation 0 0% 5 0% 4 0% 8 0%
Not at all important 1 1% 41 1% 48 1% 142 1%
Only a little important 3 2% 235 5% 243 6% 687 6%
Somewhat important 58 33% 1,364 28% 1,400 35% 3,769 33%
Very important 115 65% 3,234 66% 2,274 57% 6,754 59%
Total 177 100% 4,879 100% 3,969 100% 11,360 100%
wkskillartistic Never worked in any occupation 0 0% 5 0% 4 0% 8 0%
Not at all important 13 7% 331 7% 292 7% 738 7%
Only a little important 13 7% 486 10% 404 10% 1,028 9%
Somewhat important 28 16% 1,208 25% 778 20% 2,272 20%
Very important 122 69% 2,836 58% 2,501 63% 7,296 64%
Total 176 100% 4,866 100% 3,979 100% 11,342 100%
wkskillbus Never worked in any occupation 0 0% 5 0% 4 0% 8 0%
Not at all important 7 4% 210 4% 164 4% 495 4%
Only a little important 39 22% 610 13% 537 14% 1,486 13%
Somewhat important 61 34% 1,779 37% 1,568 40% 4,325 38%
Very important 70 40% 2,266 47% 1,689 43% 5,018 44%
Total 177 100% 4,870 100% 3,962 100% 11,332 100%
wkskillentr Never worked in any occupation 0 0% 5 0% 4 0% 8 0%
Not at all important 21 12% 418 9% 383 10% 1,017 9%
Only a little important 39 22% 798 17% 808 21% 1,987 18%
Somewhat important 52 30% 1,491 31% 1,270 32% 3,530 31%
Very important 64 36% 2,123 44% 1,476 37% 4,714 42%
Total 176 100% 4,835 100% 3,941 100% 11,256 100%
39.11. Financial and business management skills
39.12. Entrepreneurial skills
39.10. Artistic technique
39. The importance of the following to perform
effectively in your profession or work life: (continued)d
39.9. Technological skills
aTotal may not sum to 100% since respondents could select more than one category.
dFor the frequencies of only those who received this question, see the "Data Highlights" Report. 160

Graduate Level
Variable Response Options Count % Count % Count % Count %
SNAAP 2012 Frequency Report • Career
Sample UniversityArt, Design, and
MediaMidwest
SNAAP
Institutions
Graduate Level
Sample University
wkskillwkoth Never worked in any occupation 0 0% 5 0% 4 0% 8 0%
Not at all important 5 3% 44 1% 24 1% 73 1%
Only a little important 10 6% 152 3% 67 2% 259 2%
Somewhat important 37 21% 931 19% 558 14% 1,715 15%
Very important 125 71% 3,740 77% 3,325 84% 9,314 82%
Total 177 100% 4,872 100% 3,978 100% 11,369 100%
wkskillleader Never worked in any occupation 0 0% 5 0% 4 0% 8 0%
Not at all important 3 2% 79 2% 36 1% 141 1%
Only a little important 18 10% 314 6% 145 4% 534 5%
Somewhat important 46 26% 1,186 24% 830 21% 2,541 22%
Very important 110 62% 3,272 67% 2,955 74% 8,126 72%
Total 177 100% 4,856 100% 3,970 100% 11,350 100%
wkskillnetrel Never worked in any occupation 0 0% 5 0% 4 0% 8 0%
Not at all important 4 2% 45 1% 34 1% 117 1%
Only a little important 8 5% 190 4% 141 4% 393 3%
Somewhat important 39 22% 1,149 24% 917 23% 2,513 22%
Very important 125 71% 3,477 71% 2,878 72% 8,324 73%
Total 176 100% 4,866 100% 3,974 100% 11,355 100%
wkskillteach Never worked in any occupation 0 0% 5 0% 4 0% 8 0%
Not at all important 7 4% 284 6% 128 3% 480 4%
Only a little important 15 8% 723 15% 370 9% 1,257 11%
Somewhat important 24 14% 1,309 27% 850 21% 2,524 22%
Very important 131 74% 2,545 52% 2,630 66% 7,093 62%
Total 177 100% 4,866 100% 3,982 100% 11,362 100%
39.15. Networking and relationship building
39.16. Teaching skills
39. The importance of the following to perform
effectively in your profession or work life: (continued)d
39.13. Interpersonal relations and working
collaboratively
39.14. Leadership skills
aTotal may not sum to 100% since respondents could select more than one category.
dFor the frequencies of only those who received this question, see the "Data Highlights" Report. 161

Graduate Level
Variable Response Options Count % Count % Count % Count %
SNAAP 2012 Frequency Report • Career
Sample UniversityArt, Design, and
MediaMidwest
SNAAP
Institutions
Graduate Level
Sample University
infclassmt No influence 60 33% 1,286 26% 1,089 27% 3,047 27%
Minor influence 68 37% 1,932 39% 1,692 42% 4,601 40%
Major influence 48 26% 1,627 33% 1,137 28% 3,588 31%
Not applicable 6 3% 109 2% 99 2% 255 2%
Total 182 100% 4,954 100% 4,017 100% 11,491 100%
inffac No influence 32 18% 894 18% 616 15% 1,814 16%
Minor influence 53 29% 1,713 35% 1,233 31% 3,652 32%
Major influence 91 51% 2,255 46% 2,101 52% 5,843 51%
Not applicable 4 2% 88 2% 72 2% 183 2%
Total 180 100% 4,950 100% 4,022 100% 11,492 100%
infstaff No influence 75 41% 2,149 44% 1,634 41% 4,840 42%
Minor influence 66 36% 1,782 36% 1,488 37% 4,271 37%
Major influence 31 17% 739 15% 683 17% 1,778 16%
Not applicable 11 6% 246 5% 191 5% 514 5%
Total 183 100% 4,916 100% 3,996 100% 11,403 100%
infartist No influence 75 41% 1,926 39% 1,689 42% 4,589 40%
Minor influence 65 36% 1,831 37% 1,403 35% 4,183 37%
Major influence 23 13% 760 15% 565 14% 1,780 16%
Not applicable 18 10% 420 9% 352 9% 897 8%
Total 181 100% 4,937 100% 4,009 100% 11,449 100%
infalum No influence 111 62% 2,392 49% 1,951 49% 5,604 49%
Minor influence 45 25% 1,681 34% 1,369 34% 3,831 34%
Major influence 12 7% 513 10% 391 10% 1,200 11%
Not applicable 12 7% 324 7% 266 7% 740 7%
Total 180 100% 4,910 100% 3,977 100% 11,375 100%
40.5. Alumni
40. How much influence has each of the following
networks developed at this institution had on your
career?
40.1. Classmates
40.2. Faculty or instructors
40.3. Staff members or advisors
40.4. Guest artists
aTotal may not sum to 100% since respondents could select more than one category.
dFor the frequencies of only those who received this question, see the "Data Highlights" Report. 162

Graduate Level
Variable Response Options Count % Count % Count % Count %
curemp Full-time (35 hours or more per week) 112 61% 2,956 59% 2,464 61% 6,999 61%
Part-time only (fewer than 35 hours per week) 27 15% 907 18% 617 15% 2,006 17%
Unemployed and looking for work 6 3% 228 5% 115 3% 442 4%
In school full-time 5 3% 75 2% 86 2% 206 2%
Caring for family full-time 3 2% 64 1% 53 1% 131 1%
Retired 28 15% 295 6% 415 10% 839 7%
Other 2 1% 459 9% 290 7% 933 8%
Total 183 100% 4,984 100% 4,040 100% 11,556 100%
curjob_none Not selected 168 92% 4,613 93% 3,723 93% 10,743 94%
Selected 15 8% 343 7% 290 7% 730 6%
Total 183 100% 4,956 100% 4,013 100% 11,473 100%
curjob_arch Never been an architect 175 96% 4,258 85% 3,629 90% 10,557 91%
Not selected 5 3% 318 6% 163 4% 460 4%
Selected 3 2% 412 8% 257 6% 550 5%
Total 183 100% 4,988 100% 4,049 100% 11,567 100%
curjob_artadm Never been an arts administrator or manager 151 83% 3,983 80% 3,104 77% 8,891 77%
Not selected 21 11% 634 13% 575 14% 1,636 14%
Selected 11 6% 367 7% 364 9% 1,023 9%
Total 183 100% 4,984 100% 4,043 100% 11,550 100%
curjob_curator Never been a museum or gallery worker 124 68% 3,564 72% 3,450 85% 9,507 82%
Not selected 47 26% 1,090 22% 437 11% 1,566 14%
Selected 12 7% 329 7% 157 4% 484 4%
Total 183 100% 4,983 100% 4,044 100% 11,557 100%
curjob_graphicdes Never been a graphic designer, illustrator, etc. 128 70% 3,439 69% 3,503 87% 9,296 80%
Not selected 22 12% 901 18% 344 9% 1,351 12%
Selected 33 18% 640 13% 199 5% 905 8%
Total 183 100% 4,980 100% 4,046 100% 11,552 100%
42. Current employment status
Sample University
43. Current occupation:
43.0. Currently not employed
SNAAP 2012 Frequency Report • Current Work
Sample UniversityArt, Design, and
MediaMidwest
SNAAP
Institutions
Graduate Level
43.1. Architect
43.2. Arts administrator or manager
43.3. Museum or gallery worker, including curator
43.4. Graphic designer, illustrator, or art director
163

Graduate Level
Variable Response Options Count % Count % Count % Count %
Sample University
SNAAP 2012 Frequency Report • Current Work
Sample UniversityArt, Design, and
MediaMidwest
SNAAP
Institutions
Graduate Level
curjob_intdes Never been an interior designer 179 98% 4,611 92% 3,892 96% 10,993 95%
Not selected 3 2% 237 5% 108 3% 381 3%
Selected 1 1% 139 3% 50 1% 191 2%
Total 183 100% 4,987 100% 4,050 100% 11,565 100%
curjob_webdes Never been a web designer 162 89% 4,338 87% 3,769 93% 10,435 90%
Not selected 12 7% 386 8% 173 4% 691 6%
Selected 9 5% 264 5% 106 3% 438 4%
Total 183 100% 4,988 100% 4,048 100% 11,564 100%
curjob_othdes Never been any other designer 166 91% 4,469 90% 3,758 93% 10,526 91%
Not selected 10 5% 247 5% 141 3% 482 4%
Selected 7 4% 272 5% 149 4% 554 5%
Total 183 100% 4,988 100% 4,048 100% 11,562 100%
curjob_tchhied Never been a higher education arts educator 76 42% 2,971 60% 2,152 53% 6,338 55%
Not selected 45 25% 955 19% 858 21% 2,357 20%
Selected 62 34% 1,052 21% 1,025 25% 2,838 25%
Total 183 100% 4,978 100% 4,035 100% 11,533 100%
curjob_tchk12 Never been a K-12 arts educator 133 73% 3,867 78% 2,919 72% 8,430 73%
Not selected 30 16% 740 15% 752 19% 1,991 17%
Selected 20 11% 376 8% 367 9% 1,125 10%
Total 183 100% 4,983 100% 4,038 100% 11,546 100%
curjob_prvttch Never been a private teacher of the arts 153 84% 4,153 83% 2,767 68% 8,105 70%
Not selected 22 12% 600 12% 733 18% 1,977 17%
Selected 8 4% 233 5% 540 13% 1,462 13%
Total 183 100% 4,986 100% 4,040 100% 11,544 100%
curjob_othtch Never been any other arts educator 164 90% 4,388 88% 3,648 90% 10,354 90%
Not selected 13 7% 384 8% 235 6% 729 6%
Selected 6 3% 214 4% 162 4% 475 4%
Total 183 100% 4,986 100% 4,045 100% 11,558 100%
43.6. Web designer
43.7. Other designer
43.8. Higher education arts educator
43.9. K-12 arts educator
43.10. Private teacher of the arts
43.11. Other arts educator
43. Current occupation: (continued)
43.5. Interior designer
164

Graduate Level
Variable Response Options Count % Count % Count % Count %
Sample University
SNAAP 2012 Frequency Report • Current Work
Sample UniversityArt, Design, and
MediaMidwest
SNAAP
Institutions
Graduate Level
curjob_craft Never been a craft artist 149 81% 4,312 87% 3,723 92% 10,481 91%
Not selected 25 14% 406 8% 184 5% 641 6%
Selected 9 5% 263 5% 141 3% 437 4%
Total 183 100% 4,981 100% 4,048 100% 11,559 100%
curjob_finart Never been a fine artist 84 46% 2,881 58% 3,294 81% 8,651 75%
Not selected 27 15% 607 12% 288 7% 955 8%
Selected 72 39% 1,487 30% 463 11% 1,942 17%
Total 183 100% 4,975 100% 4,045 100% 11,548 100%
curjob_film Never been a film, TV, or video artist 172 94% 4,309 86% 3,713 92% 10,256 89%
Not selected 7 4% 380 8% 194 5% 751 6%
Selected 4 2% 298 6% 141 3% 548 5%
Total 183 100% 4,987 100% 4,048 100% 11,555 100%
curjob_animator Never been a multi-media artist or animator 175 96% 4,460 89% 3,840 95% 10,728 93%
Not selected 4 2% 323 6% 127 3% 513 4%
Selected 4 2% 207 4% 82 2% 328 3%
Total 183 100% 4,990 100% 4,049 100% 11,569 100%
curjob_photo Never been a photographer 155 85% 3,993 80% 3,705 92% 10,121 88%
Not selected 15 8% 533 11% 208 5% 820 7%
Selected 13 7% 458 9% 135 3% 617 5%
Total 183 100% 4,984 100% 4,048 100% 11,558 100%
curjob_actor Never been an actor 178 97% 4,772 96% 3,667 91% 10,450 90%
Not selected 4 2% 181 4% 263 6% 790 7%
Selected 1 1% 36 1% 120 3% 323 3%
Total 183 100% 4,989 100% 4,050 100% 11,563 100%
curjob_choreo Never been a dancer or choreographer 180 98% 4,860 97% 3,889 96% 11,004 95%
Not selected 3 2% 112 2% 100 2% 384 3%
Selected 0 0% 17 0% 61 2% 178 2%
Total 183 100% 4,989 100% 4,050 100% 11,566 100%
43.18. Dancer or choreographer
43.17. Actor
43. Current occupation: (continued)
43.12. Craft artist
43.13. Fine artist
43.14. Film, TV, video artist
43.15. Multi-media artist or animator
43.16. Photographer
165

Graduate Level
Variable Response Options Count % Count % Count % Count %
Sample University
SNAAP 2012 Frequency Report • Current Work
Sample UniversityArt, Design, and
MediaMidwest
SNAAP
Institutions
Graduate Level
curjob_sound Never been an engineer or technician 180 98% 4,857 97% 3,883 96% 11,034 95%
Not selected 2 1% 117 2% 123 3% 414 4%
Selected 1 1% 16 0% 42 1% 116 1%
Total 183 100% 4,990 100% 4,048 100% 11,564 100%
curjob_musician Never been a musician 179 98% 4,721 95% 2,480 62% 7,946 69%
Not selected 1 1% 188 4% 522 13% 1,246 11%
Selected 3 2% 80 2% 1,030 26% 2,349 20%
Total 183 100% 4,989 100% 4,032 100% 11,541 100%
curjob_stage Never been a theater and stage director or producer 182 99% 4,856 97% 3,650 90% 10,467 91%
Not selected 1 1% 111 2% 266 7% 719 6%
Selected 0 0% 23 0% 134 3% 377 3%
Total 183 100% 4,990 100% 4,050 100% 11,563 100%
curjob_writer Never been a writer, author, or editor 136 74% 3,747 75% 3,079 76% 8,618 75%
Not selected 27 15% 654 13% 494 12% 1,483 13%
Selected 20 11% 581 12% 468 12% 1,441 12%
Total 183 100% 4,982 100% 4,041 100% 11,542 100%
curjob_othart Never been in any other arts occupation 163 89% 4,234 85% 3,471 86% 9,943 86%
Not selected 8 4% 326 7% 232 6% 698 6%
Selected 12 7% 425 9% 342 8% 917 8%
Total 183 100% 4,985 100% 4,045 100% 11,558 100%
curjob_maintn Never worked in bldg., maint., installation, or repair 153 84% 4,133 83% 3,509 87% 9,915 86%
Not selected 27 15% 756 15% 486 12% 1,485 13%
Selected 3 2% 96 2% 52 1% 157 1%
Total 183 100% 4,985 100% 4,047 100% 11,557 100%
curjob_comm Never worked in communications 147 80% 3,470 70% 3,060 76% 8,367 73%
Not selected 31 17% 1,164 23% 768 19% 2,462 21%
Selected 5 3% 346 7% 212 5% 710 6%
Total 183 100% 4,980 100% 4,040 100% 11,539 100%
43.22. Writer, author, or editor
43.23. Other occupation associated with the arts
43.25. Communications
43.24. Building, maintenance, installation, and
repair
43.21. Theater and stage director or producer
43. Current occupation: (continued)
43.19. Engineer or technician (sound, light, other)
43.20. Musician
166

Graduate Level
Variable Response Options Count % Count % Count % Count %
Sample University
SNAAP 2012 Frequency Report • Current Work
Sample UniversityArt, Design, and
MediaMidwest
SNAAP
Institutions
Graduate Level
curjob_comput Never worked in a computer or mathematics occupation 165 90% 4,519 91% 3,681 91% 10,414 90%
Not selected 15 8% 343 7% 264 7% 806 7%
Selected 3 2% 126 3% 101 2% 341 3%
Total 183 100% 4,988 100% 4,046 100% 11,561 100%
curjob_construct Never worked in construction 157 86% 4,157 83% 3,555 88% 10,089 87%
Not selected 23 13% 706 14% 419 10% 1,288 11%
Selected 3 2% 122 2% 72 2% 178 2%
Total 183 100% 4,985 100% 4,046 100% 11,555 100%
curjob_edu Never worked in education, training, or library 84 46% 2,462 49% 2,015 50% 5,500 48%
Not selected 81 44% 2,032 41% 1,540 38% 4,698 41%
Selected 18 10% 480 10% 473 12% 1,318 11%
Total 183 100% 4,974 100% 4,028 100% 11,516 100%
curjob_engocc Never worked in engineering or science 175 96% 4,682 94% 3,824 94% 11,018 95%
Not selected 8 4% 235 5% 176 4% 443 4%
Selected 0 0% 71 1% 50 1% 105 1%
Total 183 100% 4,988 100% 4,050 100% 11,566 100%
curjob_farm Never worked in farming, fishing, or forestry 177 97% 4,744 95% 3,848 95% 10,998 95%
Not selected 5 3% 217 4% 181 4% 511 4%
Selected 1 1% 26 1% 18 0% 51 0%
Total 183 100% 4,987 100% 4,047 100% 11,560 100%
curjob_finan Never worked in financial or other business services 174 95% 4,636 93% 3,712 92% 10,607 92%
Not selected 7 4% 284 6% 281 7% 779 7%
Selected 2 1% 66 1% 56 1% 173 1%
Total 183 100% 4,986 100% 4,049 100% 11,559 100%
curjob_food Never worked in a food preparation related occupation 149 81% 3,824 77% 3,201 79% 8,929 77%
Not selected 31 17% 1,111 22% 808 20% 2,512 22%
Selected 3 2% 46 1% 35 1% 109 1%
Total 183 100% 4,981 100% 4,044 100% 11,550 100%
43. Current occupation: (continued)
43.26. Computer and mathematics
43.27. Construction
43.28. Education, training, and library
43.32. Food preparation related
43.29. Engineering and science
43.30. Farming, fishing, and forestry
43.31. Financial and other business services
167

Graduate Level
Variable Response Options Count % Count % Count % Count %
Sample University
SNAAP 2012 Frequency Report • Current Work
Sample UniversityArt, Design, and
MediaMidwest
SNAAP
Institutions
Graduate Level
curjob_hlthtech Never worked in healthcare 173 95% 4,623 93% 3,744 92% 10,736 93%
Not selected 7 4% 297 6% 257 6% 675 6%
Selected 3 2% 67 1% 47 1% 149 1%
Total 183 100% 4,987 100% 4,048 100% 11,560 100%
curjob_humres Never worked in human resources 174 95% 4,786 96% 3,861 95% 11,034 95%
Not selected 8 4% 174 3% 170 4% 476 4%
Selected 1 1% 24 0% 15 0% 51 0%
Total 183 100% 4,984 100% 4,046 100% 11,561 100%
curjob_legal Never worked in a legal occupation 178 97% 4,783 96% 3,862 95% 11,011 95%
Not selected 5 3% 175 4% 148 4% 447 4%
Selected 0 0% 31 1% 39 1% 105 1%
Total 183 100% 4,989 100% 4,049 100% 11,563 100%
curjob_manag Never worked in management 164 90% 4,204 84% 3,395 84% 9,771 85%
Not selected 11 6% 555 11% 466 12% 1,270 11%
Selected 8 4% 225 5% 183 5% 511 4%
Total 183 100% 4,984 100% 4,044 100% 11,552 100%
curjob_manfact Never worked in manufacturing 171 93% 4,653 93% 3,813 94% 10,887 94%
Not selected 12 7% 300 6% 218 5% 611 5%
Selected 0 0% 32 1% 17 0% 61 1%
Total 183 100% 4,985 100% 4,048 100% 11,559 100%
curjob_military Never worked in military or protective services 176 96% 4,838 97% 3,880 96% 11,159 97%
Not selected 7 4% 144 3% 153 4% 381 3%
Selected 0 0% 7 0% 16 0% 23 0%
Total 183 100% 4,989 100% 4,049 100% 11,563 100%
curjob_office Never worked in office or administrative support 155 85% 3,662 74% 2,950 73% 8,257 72%
Not selected 24 13% 1,126 23% 944 23% 2,828 24%
Selected 4 2% 193 4% 151 4% 461 4%
Total 183 100% 4,981 100% 4,045 100% 11,546 100%
43.39. Office and administrative support
43.34. Human resources
43.35. Legal
43.36. Management
43. Current occupation: (continued)
43.33. Healthcare
43.38. Military and protective services
43.37. Manufacturing
168

Graduate Level
Variable Response Options Count % Count % Count % Count %
Sample University
SNAAP 2012 Frequency Report • Current Work
Sample UniversityArt, Design, and
MediaMidwest
SNAAP
Institutions
Graduate Level
curjob_sales Never worked in sales 150 82% 3,777 76% 3,116 77% 8,802 76%
Not selected 25 14% 1,069 21% 820 20% 2,445 21%
Selected 8 4% 131 3% 106 3% 295 3%
Total 183 100% 4,977 100% 4,042 100% 11,542 100%
curjob_care Never worked in a services or personal care occupation 162 89% 4,513 91% 3,676 91% 10,401 90%
Not selected 21 11% 431 9% 342 8% 1,050 9%
Selected 0 0% 39 1% 29 1% 103 1%
Total 183 100% 4,983 100% 4,047 100% 11,554 100%
curjob_socialser Never worked in social services 168 92% 4,598 92% 3,724 92% 10,657 92%
Not selected 12 7% 318 6% 270 7% 749 6%
Selected 3 2% 69 1% 49 1% 148 1%
Total 183 100% 4,985 100% 4,043 100% 11,554 100%
curjob_transport Never worked in transportation or material moving 179 98% 4,729 95% 3,869 96% 10,995 95%
Not selected 4 2% 238 5% 163 4% 525 5%
Selected 0 0% 22 0% 17 0% 44 0%
Total 183 100% 4,989 100% 4,049 100% 11,564 100%
curjob_othnart Never worked in any other occupation outside the arts 157 86% 4,143 83% 3,408 84% 9,715 84%
Not selected 19 10% 549 11% 407 10% 1,204 10%
Selected 7 4% 290 6% 229 6% 631 5%
Total 183 100% 4,982 100% 4,044 100% 11,550 100%
curjob_oth Not selected 171 93% 4,509 91% 3,680 92% 10,486 91%
Selected 12 7% 447 9% 333 8% 987 9%
Total 183 100% 4,956 100% 4,013 100% 11,473 100%
43.45. Other
43. Current occupation: (continued)
43.40. Sales
43.41. Services and personal care
43.42. Social services
43.43. Transportation and material moving
43.44. Other occupations outside of the arts
169

Graduate Level
Variable Response Options Count % Count % Count % Count %
Sample University
SNAAP 2012 Frequency Report • Current Work
Sample UniversityArt, Design, and
MediaMidwest
SNAAP
Institutions
Graduate Level
multijob Currently not employed 15 8% 342 7% 290 7% 728 6%
No, I do not hold multiple jobs 101 55% 2,578 53% 2,118 53% 5,710 50%
Yes, I hold 2 jobs 45 25% 1,351 28% 1,064 27% 3,232 28%
Yes, I hold 3 jobs 17 9% 456 9% 351 9% 1,239 11%
Yes, I hold 4 jobs 2 1% 104 2% 101 3% 273 2%
Yes, I hold more than 4 jobs 2 1% 64 1% 60 2% 192 2%
Total 182 100% 4,895 100% 3,984 100% 11,374 100%
majtimejob_R Currently not employed 15 8% 342 7% 290 7% 728 6%
Architect 1 1% 291 6% 183 5% 394 3%
Arts administrator or manager 2 1% 161 3% 150 4% 412 4%
Museum or gallery worker, including curator 4 2% 143 3% 78 2% 219 2%
Graphic designer, illustrator, or art director 13 7% 248 5% 52 1% 313 3%
Interior designer 0 0% 43 1% 9 0% 58 1%
Web designer 1 1% 53 1% 12 0% 75 1%
Other designer 2 1% 129 3% 49 1% 242 2%
Higher education arts educator 48 26% 664 14% 732 18% 1,923 17%
K-12 arts educator 18 10% 284 6% 264 7% 808 7%
Private teacher of the arts 2 1% 35 1% 121 3% 356 3%
Other arts educator 0 0% 70 1% 63 2% 167 1%
Craft artist 4 2% 52 1% 29 1% 87 1%
Fine artist 21 12% 573 12% 158 4% 696 6%
Film, TV, video artist 2 1% 87 2% 29 1% 145 1%
Multi-media artist or animator 1 1% 31 1% 7 0% 38 0%
Photographer 4 2% 72 1% 19 0% 86 1%
Actor 0 0% 2 0% 20 1% 59 1%
Dancer or choreographer 0 0% 1 0% 3 0% 11 0%
Engineer or technician (light, sound, other) 0 0% 2 0% 7 0% 11 0%
Musician 0 0% 10 0% 354 9% 770 7%
Theater and stage director or producer 0 0% 2 0% 19 0% 55 0%
45. Are you currently working at two or more jobs?
46. The occupation in which you spend the majority of
your work time:
170

Graduate Level
Variable Response Options Count % Count % Count % Count %
Sample University
SNAAP 2012 Frequency Report • Current Work
Sample UniversityArt, Design, and
MediaMidwest
SNAAP
Institutions
Graduate Level
majtimejob_R Writer, author, or editor 5 3% 82 2% 73 2% 210 2%
Other occupation associated with the arts 7 4% 226 5% 184 5% 463 4%
Building, maintenance, installation, and repair 0 0% 18 0% 12 0% 34 0%
Communications 1 1% 110 2% 51 1% 217 2%
Computer and mathematics 1 1% 47 1% 48 1% 161 1%
Construction 1 1% 35 1% 26 1% 49 0%
Education, training, and library 6 3% 187 4% 212 5% 546 5%
Engineering and science 0 0% 36 1% 27 1% 49 0%
Farming, fishing, and forestry 0 0% 6 0% 1 0% 11 0%
Financial and other business services 0 0% 22 0% 29 1% 77 1%
Food preparation related 2 1% 19 0% 16 0% 46 0%
Healthcare 2 1% 37 1% 26 1% 78 1%
Human resources 1 1% 4 0% 5 0% 17 0%
Legal 0 0% 15 0% 28 1% 67 1%
Management 2 1% 85 2% 76 2% 207 2%
Manufacturing 0 0% 6 0% 0 0% 6 0%
Military and protective services 0 0% 2 0% 4 0% 8 0%
Office and administrative support 4 2% 77 2% 62 2% 190 2%
Sales 2 1% 57 1% 46 1% 125 1%
Services and personal care 0 0% 8 0% 6 0% 28 0%
Social services 0 0% 20 0% 19 0% 52 0%
Transportation and material moving 0 0% 5 0% 5 0% 13 0%
Other occupation outside of the arts 2 1% 171 3% 135 3% 361 3%
Other 8 4% 337 7% 247 6% 694 6%
Total 182 100% 4,907 100% 3,986 100% 11,362 100%
46. The occupation in which you spend the majority of
your work time: (continued)
171

Graduate Level
Variable Response Options Count % Count % Count % Count %
Sample University
SNAAP 2012 Frequency Report • Current Work
Sample UniversityArt, Design, and
MediaMidwest
SNAAP
Institutions
Graduate Level
sector Currently not employed 15 8% 342 7% 290 7% 728 6%
For-profit and commercial 37 20% 1,571 32% 877 22% 3,086 27%
Nonprofit (including schools) 80 44% 1,580 32% 1,783 45% 4,627 41%
Government (including military) 6 3% 239 5% 205 5% 490 4%
Mix of the above 29 16% 692 14% 505 13% 1,413 12%
Not relevant 16 9% 461 9% 301 8% 965 9%
Total 183 100% 4,885 100% 3,961 100% 11,309 100%
timetrainrel Currently not employed 15 8% 342 7% 290 7% 728 6%
Not at all relevant 13 7% 439 9% 311 8% 1,023 9%
Somewhat relevant 24 13% 751 15% 553 14% 1,638 15%
Relevant 33 18% 1,054 22% 747 19% 2,252 20%
Very relevant 97 53% 2,280 47% 2,047 52% 5,636 50%
Total 182 100% 4,866 100% 3,948 100% 11,277 100%
timejobsec Currently not employed 15 8% 342 7% 290 7% 728 7%
Very dissatisfied 18 10% 539 11% 314 8% 1,063 10%
Somewhat dissatisfied 16 9% 684 14% 421 11% 1,458 13%
Somewhat satisfied 56 31% 1,594 33% 1,162 30% 3,574 32%
Very satisfied 78 43% 1,645 34% 1,700 44% 4,293 39%
Total 183 100% 4,804 100% 3,887 100% 11,116 100%
timecreative Currently not employed 15 8% 342 7% 290 7% 728 7%
Very dissatisfied 7 4% 253 5% 139 4% 491 4%
Somewhat dissatisfied 13 7% 444 9% 315 8% 1,003 9%
Somewhat satisfied 54 30% 1,539 32% 1,172 30% 3,483 31%
Very satisfied 93 51% 2,265 47% 1,992 51% 5,472 49%
Total 182 100% 4,843 100% 3,908 100% 11,177 100%
50. Level of satisfaction with each of the following
aspects of your current work in the occupation where you
spend the majority of your work time:
50.1. Job security
50.2. Opportunity to be creative
49. Overall, how relevant is your arts training at this
institution to your current work in the occupation where
you spend the majority of your work time?
48. In terms of your work in the occupation in which you
spend the majority of your work time, in what sector do
you do most of your work:
172

Graduate Level
Variable Response Options Count % Count % Count % Count %
Sample University
SNAAP 2012 Frequency Report • Current Work
Sample UniversityArt, Design, and
MediaMidwest
SNAAP
Institutions
Graduate Level
timeincome Currently not employed 15 8% 342 7% 290 7% 728 7%
Very dissatisfied 24 13% 791 17% 486 13% 1,587 14%
Somewhat dissatisfied 37 21% 1,038 22% 755 20% 2,349 21%
Somewhat satisfied 55 31% 1,766 37% 1,536 40% 4,274 39%
Very satisfied 47 26% 856 18% 803 21% 2,147 19%
Total 178 100% 4,793 100% 3,870 100% 11,085 100%
timebalance Currently not employed 15 8% 342 7% 290 7% 728 7%
Very dissatisfied 10 5% 311 6% 228 6% 690 6%
Somewhat dissatisfied 29 16% 896 19% 694 18% 2,056 18%
Somewhat satisfied 69 38% 1,880 39% 1,536 39% 4,413 40%
Very satisfied 59 32% 1,388 29% 1,150 30% 3,246 29%
Total 182 100% 4,817 100% 3,898 100% 11,133 100%
timegood Currently not employed 15 8% 342 7% 290 7% 728 7%
Very dissatisfied 2 1% 252 5% 134 3% 476 4%
Somewhat dissatisfied 15 8% 517 11% 302 8% 1,054 9%
Somewhat satisfied 64 35% 1,596 33% 1,236 32% 3,598 32%
Very satisfied 86 47% 2,113 44% 1,941 50% 5,296 47%
Total 182 100% 4,820 100% 3,903 100% 11,152 100%
timecareer Currently not employed 15 8% 342 7% 290 8% 728 7%
Very dissatisfied 13 7% 501 11% 347 9% 1,083 10%
Somewhat dissatisfied 31 17% 951 20% 710 19% 2,185 20%
Somewhat satisfied 68 38% 1,766 37% 1,476 39% 4,244 39%
Very satisfied 53 29% 1,194 25% 997 26% 2,725 25%
Total 180 100% 4,754 100% 3,820 100% 10,965 100%
50.5. Opportunity to contribute to the greater good
50. Level of satisfaction with each of the following
aspects of your current work in the occupation where you
spend the majority of your work time: (continued)
50.3. Income
50.4. Balance between work and non-work life
50.6. Opportunity for career advancement
173

Graduate Level
Variable Response Options Count % Count % Count % Count %
Sample University
SNAAP 2012 Frequency Report • Current Work
Sample UniversityArt, Design, and
MediaMidwest
SNAAP
Institutions
Graduate Level
timework Currently not employed 15 8% 342 7% 290 7% 728 7%
Very dissatisfied 8 4% 218 5% 130 3% 446 4%
Somewhat dissatisfied 8 4% 409 8% 266 7% 885 8%
Somewhat satisfied 48 26% 1,324 27% 999 26% 2,997 27%
Very satisfied 103 57% 2,544 53% 2,226 57% 6,118 55%
Total 182 100% 4,837 100% 3,911 100% 11,174 100%
timesat Currently not employed 15 8% 342 7% 290 7% 728 7%
Very dissatisfied 5 3% 160 3% 110 3% 343 3%
Somewhat dissatisfied 13 7% 456 9% 290 7% 960 9%
Somewhat satisfied 63 35% 1,945 40% 1,423 37% 4,349 39%
Very satisfied 86 47% 1,922 40% 1,783 46% 4,764 43%
Total 182 100% 4,825 100% 3,896 100% 11,144 100%
50.8. Overall job satisfaction
50. Level of satisfaction with each of the following
aspects of your current work in the occupation where you
spend the majority of your work time: (continued)
50.7. Work that reflects my personality, interests,
and values
174

Graduate Level
Variable Response Options Count % Count % Count % Count %
Sample University
SNAAP 2012 Frequency Report • Current Work
Sample UniversityArt, Design, and
MediaMidwest
SNAAP
Institutions
Graduate Level
mfuljob_R Currently not employed 15 8% 342 7% 290 7% 728 7%
Architect 0 0% 313 6% 200 5% 422 4%
Arts administrator or manager 2 1% 109 2% 92 2% 257 2%
Museum or gallery worker, including curator 3 2% 120 2% 69 2% 187 2%
Graphic designer, illustrator, or art director 15 8% 224 5% 48 1% 292 3%
Interior designer 0 0% 46 1% 10 0% 62 1%
Web designer 1 1% 36 1% 12 0% 50 0%
Other designer 4 2% 124 3% 69 2% 262 2%
Higher education arts educator 31 17% 435 9% 510 13% 1,300 12%
K-12 arts educator 13 7% 197 4% 198 5% 574 5%
Private teacher of the arts 1 1% 32 1% 102 3% 277 2%
Other arts educator 2 1% 65 1% 59 2% 152 1%
Craft artist 2 1% 71 1% 40 1% 118 1%
Fine artist 50 28% 1,069 22% 302 8% 1,330 12%
Film, TV, video artist 2 1% 131 3% 47 1% 206 2%
Multi-media artist or animator 1 1% 59 1% 20 1% 78 1%
Photographer 2 1% 103 2% 29 1% 125 1%
Actor 0 0% 3 0% 45 1% 123 1%
Dancer or choreographer 0 0% 5 0% 18 0% 69 1%
Engineer or technician (light, sound, other) 0 0% 1 0% 5 0% 9 0%
Musician 1 1% 19 0% 590 15% 1,371 12%
Theater and stage director or producer 0 0% 5 0% 35 1% 117 1%
Writer, author, or editor 7 4% 133 3% 119 3% 387 3%
Other occupation associated with the arts 7 4% 230 5% 202 5% 470 4%
51. The occupation that is the most personally fulfilling
to you:
175

Graduate Level
Variable Response Options Count % Count % Count % Count %
Sample University
SNAAP 2012 Frequency Report • Current Work
Sample UniversityArt, Design, and
MediaMidwest
SNAAP
Institutions
Graduate Level
mfuljob_R Building, maintenance, installation, and repair 0 0% 8 0% 6 0% 16 0%
Communications 1 1% 72 1% 37 1% 158 1%
Computer and mathematics 2 1% 35 1% 32 1% 115 1%
Construction 0 0% 28 1% 24 1% 36 0%
Education, training, and library 3 2% 148 3% 167 4% 405 4%
Engineering and science 0 0% 32 1% 23 1% 41 0%
Farming, fishing, and forestry 0 0% 5 0% 3 0% 13 0%
Financial and other business services 0 0% 17 0% 25 1% 54 0%
Food preparation related 1 1% 10 0% 8 0% 23 0%
Healthcare 1 1% 25 1% 18 0% 61 1%
Human resources 1 1% 4 0% 3 0% 9 0%
Legal 0 0% 12 0% 21 1% 54 0%
Management 3 2% 58 1% 53 1% 140 1%
Manufacturing 0 0% 2 0% 1 0% 3 0%
Military and protective services 0 0% 2 0% 2 0% 5 0%
Office and administrative support 1 1% 40 1% 32 1% 78 1%
Sales 0 0% 35 1% 25 1% 65 1%
Services and personal care 0 0% 4 0% 4 0% 15 0%
Social services 0 0% 18 0% 12 0% 44 0%
Transportation and material moving 0 0% 3 0% 5 0% 7 0%
Other occupation outside of the arts 2 1% 129 3% 109 3% 279 2%
Other 7 4% 282 6% 210 5% 581 5%
Total 181 100% 4,841 100% 3,931 100% 11,168 100%
51. The occupation that is the most personally fulfilling
to you: (continued)
176

Graduate Level
Variable Response Options Count % Count % Count % Count %
trn_summer Summer arts program 73 42% 1,788 40% 1,865 51% 5,223 50%
trn_arths Arts high school 32 19% 953 21% 607 16% 1,913 18%
trn_hscourse Arts courses offered at your high school 106 62% 2,693 60% 2,121 58% 6,150 58%
trn_aftsch After-school program 31 18% 1,063 24% 907 25% 2,715 26%
trn_lesson Private lessons 42 24% 1,410 32% 2,186 59% 5,739 54%
trn_college College-level arts classes 161 94% 3,868 87% 3,023 82% 8,878 84%
trn_comm Community sponsored classes, workshops, or events 90 52% 2,041 46% 1,752 48% 4,943 47%
Totala - - - - - - - -
part_none I have not supported the arts in the past 12 months 4 2% 339 7% 203 5% 625 6%
part_vol Volunteered at an arts organization 71 39% 1,454 30% 1,321 34% 3,614 32%
part_brd Served on the board of an arts organization 42 23% 857 18% 893 23% 2,365 21%
part_tch Volunteered to teach the arts 59 33% 1,009 21% 1,014 26% 2,772 25%
part_donate Donated money to an arts organization or an artist 95 53% 2,220 46% 2,117 54% 5,726 51%
part_attd Attended an arts event 166 92% 4,224 88% 3,544 91% 10,053 90%
part_oth Other 19 11% 479 10% 334 9% 984 9%
Totala - - - - - - - -
perform No 32 18% 1,058 22% 953 24% 2,480 22%
Yes 149 82% 3,796 78% 2,990 76% 8,754 78%
Total 181 100% 4,854 100% 3,943 100% 11,234 100%
52. Arts training you have received during your lifetime
53. The ways in which you have supported the arts in
the past 12 months (other than performing, creating, or
exhibiting your own artwork)
55. Do you make or perform art in your personal (not
work-related) time?
SNAAP 2012 Frequency Report • Arts Engagement
Graduate Level
Sample UniversityArt, Design, and
MediaMidwest
SNAAP
Institutions
Sample University
aTotal may not sum to 100% as respondents could select more than one category.
dFor the frequencies of only those who received this question, see the "Data Highlights" Report. 177

Graduate Level
Variable Response Options Count % Count % Count % Count %
SNAAP 2012 Frequency Report • Arts Engagement
Graduate Level
Sample UniversityArt, Design, and
MediaMidwest
SNAAP
Institutions
Sample University
prac_dnrq Do not make or perform art in personal time 32 18% 1,057 22% 952 24% 2,477 22%
prac_craft Craft Arts 53 29% 1,217 25% 766 19% 2,305 21%
prac_crwri Creative Writing 34 19% 1,101 23% 769 19% 2,438 22%
prac_cul Culinary Arts 29 16% 734 15% 609 15% 1,812 16%
prac_dance Dance 6 3% 209 4% 192 5% 644 6%
prac_design Design 47 26% 1,101 23% 530 13% 1,802 16%
prac_film Film/Media Arts 20 11% 754 16% 339 9% 1,321 12%
prac_finart Fine Arts (painting, sculpting, drawing) 115 63% 2,582 53% 1,067 27% 3,794 34%
prac_music Music 16 9% 608 13% 1,575 40% 3,784 34%
prac_photo Photography 56 31% 1,662 34% 874 22% 2,858 25%
prac_thea Theater 5 3% 150 3% 354 9% 992 9%
prac_oth Other 11 6% 365 8% 215 5% 608 5%
Totala - - - - - - - -
tmpractice Do not make or perform art in personal time 32 18% 1,057 22% 952 24% 2,477 22%
A few times a year or less 17 9% 381 8% 331 8% 814 7%
Several times a month 50 27% 1,124 23% 801 20% 2,379 21%
Several times a week 52 29% 1,383 29% 1,073 27% 3,225 29%
Daily 31 17% 895 18% 775 20% 2,290 20%
Total 182 100% 4,840 100% 3,932 100% 11,185 100%
improduce Do not make or perform art in personal time 32 18% 1,057 22% 952 24% 2,477 22%
Not at all important 1 1% 21 0% 27 1% 51 0%
Somewhat important 7 4% 248 5% 285 7% 663 6%
Important 34 19% 634 13% 663 17% 1,741 16%
Very important 108 59% 2,872 59% 2,010 51% 6,252 56%
Total 182 100% 4,832 100% 3,937 100% 11,184 100%
56. The art forms you practice in your personal (not
work-related) timed
57. About how often do you practice art in your personal
(not work-related) time?d
58. How important is it to you to be able to make or
produce art in your personal (not work-related) time?d
aTotal may not sum to 100% as respondents could select more than one category.
dFor the frequencies of only those who received this question, see the "Data Highlights" Report. 178

Graduate Level
Variable Response Options Count % Count % Count % Count %
SNAAP 2012 Frequency Report • Arts Engagement
Graduate Level
Sample UniversityArt, Design, and
MediaMidwest
SNAAP
Institutions
Sample University
exhibit Do not make or perform art in personal time 32 18% 1,057 22% 952 24% 2,477 22%
I do not perform or exhibit in public 23 13% 830 17% 581 15% 1,634 15%
Less than once a year 34 19% 702 15% 397 10% 1,307 12%
1 or 2 times a year 39 21% 924 19% 569 14% 1,896 17%
3 or more times a year 35 19% 684 14% 791 20% 2,129 19%
Continuously in public or online 19 10% 620 13% 640 16% 1,710 15%
Total 182 100% 4,817 100% 3,930 100% 11,153 100%
59. How often do you publicly perform or exhibit art in
your personal (not work-related) time?d
aTotal may not sum to 100% as respondents could select more than one category.
dFor the frequencies of only those who received this question, see the "Data Highlights" Report. 179

Graduate Level
Variable Response Options Count % Count % Count % Count %
income $10,000 or less 13 7% 522 11% 325 8% 999 9%
$10,001 to $20,000 15 8% 444 9% 328 8% 1,011 9%
$20,001 to $30,000 15 8% 427 9% 339 9% 1,008 9%
$30,001 to $40,000 16 9% 456 10% 350 9% 1,037 9%
$40,001 to $50,000 22 12% 463 10% 399 10% 1,133 10%
$50,001 to $60,000 21 12% 452 9% 391 10% 1,145 10%
$60,001 to $70,000 14 8% 314 7% 302 8% 844 8%
$70,001 to $80,000 9 5% 269 6% 277 7% 680 6%
$80,001 to $90,000 5 3% 161 3% 150 4% 445 4%
$90,001 to $100,000 7 4% 144 3% 122 3% 345 3%
$100,001 to $150,000 11 6% 279 6% 266 7% 646 6%
More than $150,000 3 2% 136 3% 107 3% 279 3%
I prefer not to answer 26 15% 712 15% 542 14% 1,508 14%
Total 177 100% 4,779 100% 3,898 100% 11,080 100%
$10,000 or less 4 2% 209 4% 119 3% 383 3%
$10,001 to $20,000 6 3% 244 5% 156 4% 502 5%
$20,001 to $30,000 8 5% 260 5% 186 5% 584 5%
$30,001 to $40,000 14 8% 303 6% 216 6% 635 6%
$40,001 to $50,000 11 6% 298 6% 246 6% 702 6%
$50,001 to $60,000 11 6% 331 7% 261 7% 781 7%
$60,001 to $70,000 9 5% 258 5% 251 6% 723 7%
$70,001 to $80,000 14 8% 279 6% 264 7% 716 7%
$80,001 to $90,000 8 5% 241 5% 223 6% 618 6%
$90,001 to $100,000 14 8% 278 6% 245 6% 673 6%
$100,001 to $150,000 27 15% 626 13% 622 16% 1,661 15%
More than $150,000 16 9% 500 11% 423 11% 1,118 10%
I prefer not to answer 34 19% 928 20% 673 17% 1,916 17%
Total 176 100% 4,755 100% 3,885 100% 11,012 100%
Sample University
SNAAP 2012 Frequency Report • Facts and Figures
Graduate Level
Sample UniversityArt, Design, and
MediaMidwest
SNAAP
Institutions
60. What was your individual annual income in 2011?
(Do not include spousal income or interest on jointly-
owned assets.)
61. In 2011, what was your total household income
from all sources?
hhincome
aTotal may not sum to 100% as respondents could select more than one category.
dFor the frequencies of only those who received this question, see the "Data Highlights" Report. 180

Graduate Level
Variable Response Options Count % Count % Count % Count %
Sample University
SNAAP 2012 Frequency Report • Facts and Figures
Graduate Level
Sample UniversityArt, Design, and
MediaMidwest
SNAAP
Institutions
percincome Never worked as a professional artist 34 19% 1,133 24% 841 22% 2,242 20%
I did not work as an artist in 2011 22 13% 605 13% 525 14% 1,395 13%
Less than 20% 62 35% 1,467 31% 999 26% 3,098 28%
21% to 40% 12 7% 237 5% 201 5% 600 5%
41% to 60% 3 2% 151 3% 114 3% 406 4%
61% to 80% 8 5% 140 3% 110 3% 331 3%
81% to 100% 34 19% 1,000 21% 1,061 28% 2,895 26%
Total 175 100% 4,733 100% 3,851 100% 10,967 100%
perctime Never worked as a professional artist 34 19% 1,133 24% 841 22% 2,242 20%
I did not work as an artist in 2011 20 11% 472 10% 463 12% 1,172 11%
Less than 20% 31 18% 643 14% 596 15% 1,688 15%
21% to 40% 25 14% 524 11% 323 8% 1,062 10%
41% to 60% 11 6% 414 9% 218 6% 813 7%
61% to 80% 18 10% 351 7% 234 6% 773 7%
81% to 100% 38 21% 1,206 25% 1,177 31% 3,245 30%
Total 177 100% 4,743 100% 3,852 100% 10,995 100%
hrspd Currently not employed 14 8% 342 7% 289 8% 726 7%
I do not do paid work 21 12% 477 10% 293 8% 826 8%
Less than 20 hours 23 13% 697 15% 544 14% 1,667 15%
20 to less than 35 hours 27 15% 762 16% 539 14% 1,747 16%
35 to less than 60 hours 79 45% 2,214 47% 1,894 49% 5,196 48%
60 hours or more 11 6% 226 5% 284 7% 759 7%
Total 175 100% 4,718 100% 3,843 100% 10,921 100%
finsup_dnrq Never worked as a professional artist 34 19% 1,133 24% 841 22% 2,242 21%
finsup_none Did not receive financial support 65 37% 1,635 35% 1,493 39% 4,051 37%
finsup_fam Support from family and friends 37 21% 1,160 25% 895 23% 2,910 27%
finsup_patron Support from patron, foundation, or government grant 55 31% 1,301 28% 964 25% 2,936 27%
finsup_oth Other 6 3% 165 3% 138 4% 431 4%
Totala - - - - - - - -
64. Have you ever received financial support (gifts,
grants, or loans) from any of the following sources to
live and work as an artist (not including support for
school)?d
62. The approximate percentage of your personal (not
family) income that came from your work as an artist in
2011d
63. The approximate percentage of your work time you
spent working as an artist in 2011d
64. On average, how many hours a week do you
currently do paid work?
aTotal may not sum to 100% as respondents could select more than one category.
dFor the frequencies of only those who received this question, see the "Data Highlights" Report. 181

Graduate Level
Variable Response Options Count % Count % Count % Count %
Sample University
SNAAP 2012 Frequency Report • Facts and Figures
Graduate Level
Sample UniversityArt, Design, and
MediaMidwest
SNAAP
Institutions
pay_none No costs associated with attending this institution 3 2% 27 1% 39 1% 107 1%
pay_fam Parents/family 58 32% 1,816 38% 1,446 38% 4,041 37%
pay_schol Scholarship, fellowships, or tuition waiver 142 78% 2,613 55% 2,641 69% 6,855 63%
pay_loan Student loans 84 46% 2,826 59% 1,845 48% 5,929 54%
pay_wkstdy Work study 46 25% 1,412 30% 941 24% 2,926 27%
pay_job Full- or part-time job (not work study) 76 42% 2,472 52% 2,245 58% 6,380 58%
pay_oth Other 24 13% 544 11% 517 13% 1,359 12%
Totala - - - - - - - -
stdloan No costs associated with attending this institution 3 2% 27 1% 39 1% 107 1%
None 79 44% 1,634 34% 1,754 45% 4,357 39%
$10,000 or less 33 18% 495 10% 556 14% 1,372 12%
$10,001 to $20,000 17 9% 491 10% 402 10% 1,174 11%
$20,001 to $30,000 15 8% 397 8% 313 8% 920 8%
$30,001 to $40,000 13 7% 383 8% 219 6% 753 7%
$40,001 to $50,000 7 4% 321 7% 178 5% 578 5%
$50,001 to $60,000 6 3% 264 5% 119 3% 440 4%
More than $60,000 4 2% 596 12% 217 6% 1,011 9%
I prefer not to answer 4 2% 197 4% 110 3% 410 4%
Total 181 100% 4,805 100% 3,907 100% 11,122 100%
impctloan No costs associated with attending this institution 3 2% 27 1% 39 1% 107 1%
No student loan debt acquired 79 44% 1,630 34% 1,754 45% 4,352 39%
No impact 35 19% 811 17% 761 19% 2,026 18%
Some impact 37 21% 1,058 22% 704 18% 2,242 20%
Major impact 26 14% 1,272 27% 654 17% 2,398 22%
Total 180 100% 4,798 100% 3,912 100% 11,125 100%
parentart No 134 75% 3,824 80% 3,141 81% 8,766 80%
Yes 45 25% 951 20% 730 19% 2,252 20%
Total 179 100% 4,775 100% 3,871 100% 11,018 100%
66. How did you pay for your education at this
institution?
71. Were/are any of your parents, guardians, or close
relatives professional artists?
68. How much impact has your debt incurred from
attending this institution had on your career or
educational decisions?d
67. How much student loan debt did you incur in order
to attend this institution?
aTotal may not sum to 100% as respondents could select more than one category.
dFor the frequencies of only those who received this question, see the "Data Highlights" Report. 182

Graduate Level
Variable Response Options Count % Count % Count % Count %
Sample University
SNAAP 2012 Frequency Report • Facts and Figures
Graduate Level
Sample UniversityArt, Design, and
MediaMidwest
SNAAP
Institutions
artcity Past professional artist (but not currently) 29 16% 855 18% 857 22% 2,221 20%
Never worked as a professional artist 34 19% 1,125 23% 836 21% 2,223 20%
Very poor 3 2% 51 1% 44 1% 118 1%
Poor 8 4% 144 3% 112 3% 367 3%
Fair 21 12% 585 12% 435 11% 1,340 12%
Good 42 23% 931 19% 782 20% 2,200 20%
Very good 42 23% 1,097 23% 834 21% 2,608 24%
Total 179 100% 4,788 100% 3,900 100% 11,077 100%
insttown No 119 67% 2,548 54% 2,590 67% 6,584 60%
Yes 58 33% 2,197 46% 1,282 33% 4,411 40%
Total 177 100% 4,745 100% 3,872 100% 10,995 100%
79. How would you rate the current area where you live
and/or work as a place to pursue your artistic career?d
80. Within the first five years after leaving this
institution, did you take up residency in the town/city
where this institution is located to pursue your career?
aTotal may not sum to 100% as respondents could select more than one category.
dFor the frequencies of only those who received this question, see the "Data Highlights" Report. 183

2012 Alumni Comments
Sample University
Graduate Level
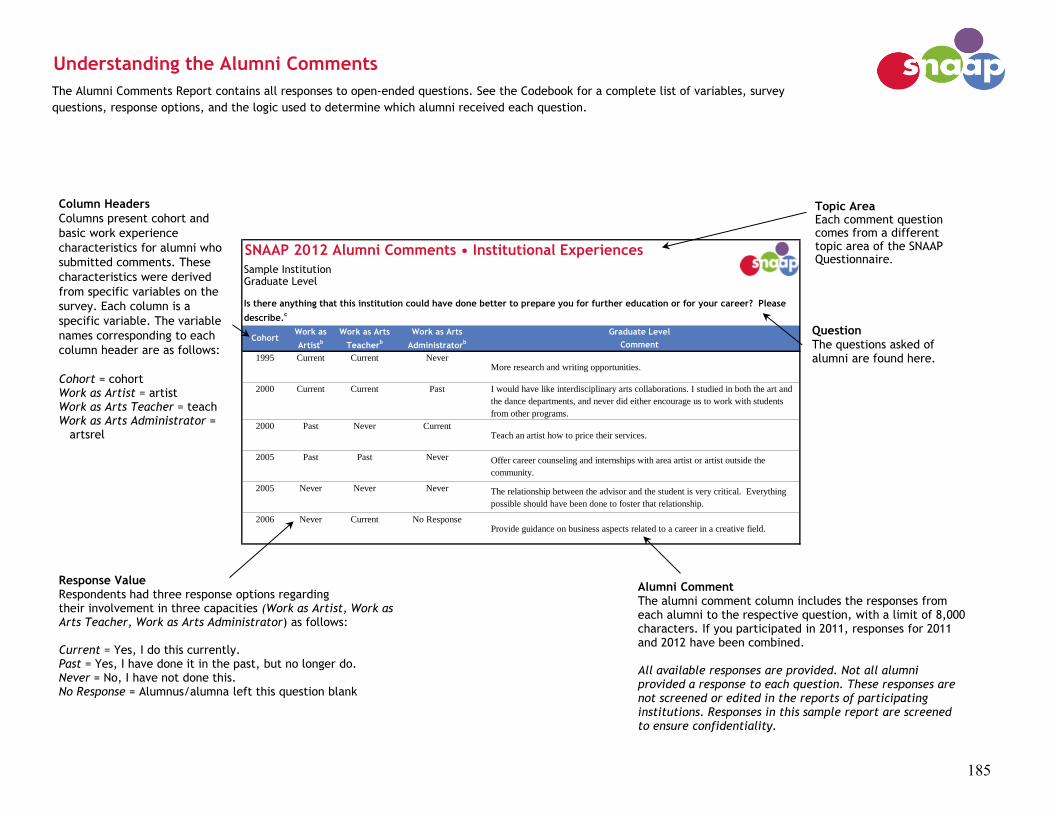
Understanding the Alumni Comments
Work as Work as Arts Work as Arts Graduate Level
Artistb
Teacherb
Administratorb Comment
1995 Current Current NeverMore research and writing opportunities.
2000 Current Current Past I would have like interdisciplinary arts collaborations. I studied in both the art and
the dance departments, and never did either encourage us to work with students
from other programs.
2000 Past Never CurrentTeach an artist how to price their services.
2005 Past Past Never Offer career counseling and internships with area artist or artist outside the
community.
2005 Never Never Never The relationship between the advisor and the student is very critical. Everything
possible should have been done to foster that relationship.
2006 Never Current No ResponseProvide guidance on business aspects related to a career in a creative field.
Cohort
The Alumni Comments Report contains all responses to open-ended questions. See the Codebook for a complete list of variables, survey
questions, response options, and the logic used to determine which alumni received each question.
SNAAP 2012 Alumni Comments • Institutional Experiences
Sample InstitutionGraduate Level
Is there anything that this institution could have done better to prepare you for further education or for your career? Please
describe.c
Column Headers
Columns present cohort and
basic work experience
characteristics for alumni who
submitted comments. These
characteristics were derived
from specific variables on the
survey. Each column is a
specific variable. The variable
names corresponding to each
column header are as follows:
Cohort = cohort Work as Artist = artist Work as Arts Teacher = teach Work as Arts Administrator = artsrel
Question The questions asked of alumni are found here.
Alumni Comment The alumni comment column includes the responses from each alumni to the respective question, with a limit of 8,000 characters. If you participated in 2011, responses for 2011 and 2012 have been combined. All available responses are provided. Not all alumni provided a response to each question. These responses are not screened or edited in the reports of participating institutions. Responses in this sample report are screened to ensure confidentiality.
Response Value Respondents had three response options regarding their involvement in three capacities (Work as Artist, Work as Arts Teacher, Work as Arts Administrator) as follows: Current = Yes, I do this currently. Past = Yes, I have done it in the past, but no longer do. Never = No, I have not done this. No Response = Alumnus/alumna left this question blank
Topic Area Each comment question comes from a different topic area of the SNAAP Questionnaire.
185
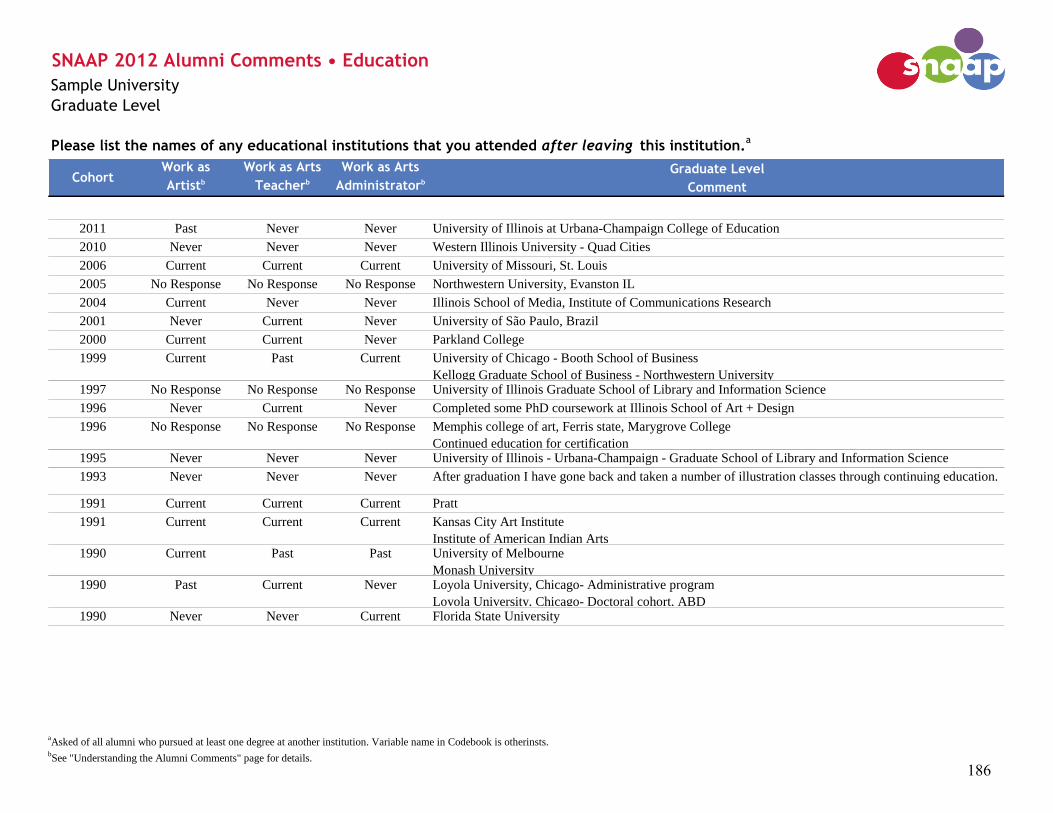
Work as Work as Arts Work as Arts Graduate Level
Artistb Teacherb AdministratorbComment
2011 Past Never Never University of Illinois at Urbana-Champaign College of Education
2010 Never Never Never Western Illinois University - Quad Cities
2006 Current Current Current University of Missouri, St. Louis
2005 No Response No Response No Response Northwestern University, Evanston IL
2004 Current Never Never Illinois School of Media, Institute of Communications Research
2001 Never Current Never University of São Paulo, Brazil
2000 Current Current Never Parkland College
1999 Current Past Current University of Chicago - Booth School of Business
Kellogg Graduate School of Business - Northwestern University1997 No Response No Response No Response University of Illinois Graduate School of Library and Information Science
1996 Never Current Never Completed some PhD coursework at Illinois School of Art + Design
1996 No Response No Response No Response Memphis college of art, Ferris state, Marygrove College
Continued education for certification1995 Never Never Never University of Illinois - Urbana-Champaign - Graduate School of Library and Information Science
1993 Never Never Never After graduation I have gone back and taken a number of illustration classes through continuing education.
1991 Current Current Current Pratt
1991 Current Current Current Kansas City Art Institute
Institute of American Indian Arts1990 Current Past Past University of Melbourne
Monash University1990 Past Current Never Loyola University, Chicago- Administrative program
Loyola University, Chicago- Doctoral cohort, ABD1990 Never Never Current Florida State University
SNAAP 2012 Alumni Comments • Education
Sample University
Graduate Level
Please list the names of any educational institutions that you attended after leaving this institution.a
Cohort
aAsked of all alumni who pursued at least one degree at another institution. Variable name in Codebook is otherinsts.
bSee "Understanding the Alumni Comments" page for details.
186
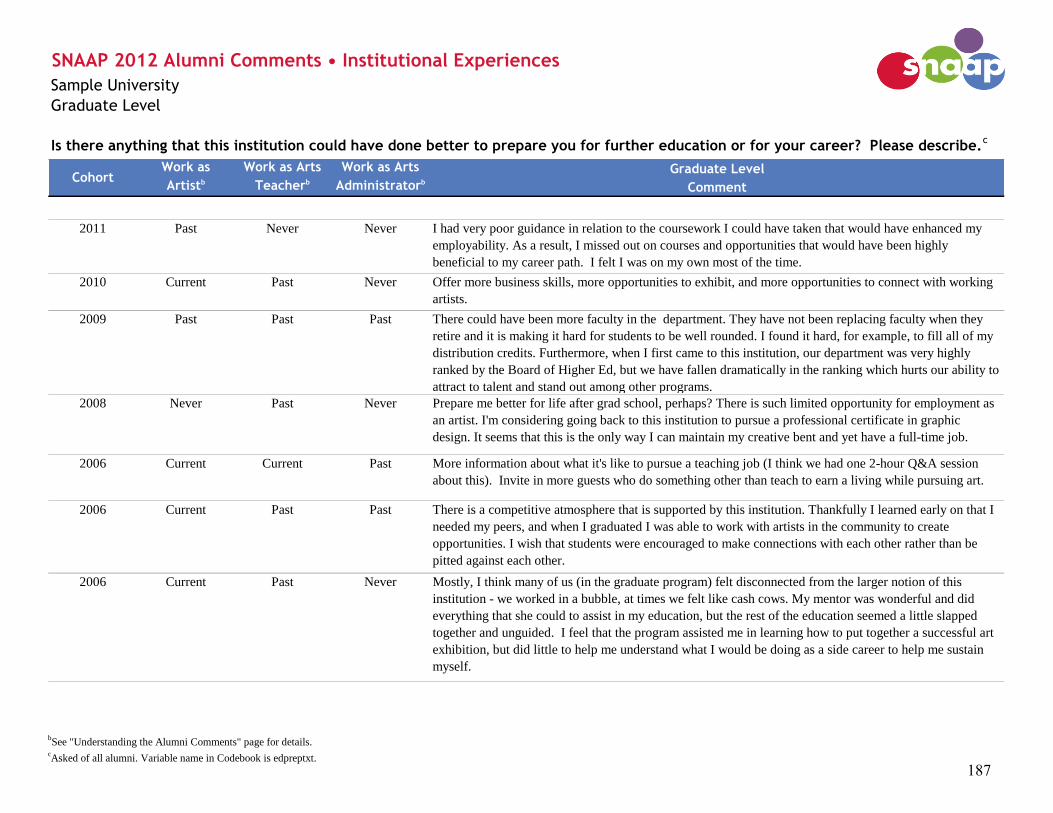
Work as Work as Arts Work as Arts Graduate Level
Artistb Teacherb AdministratorbComment
2011 Past Never Never I had very poor guidance in relation to the coursework I could have taken that would have enhanced my
employability. As a result, I missed out on courses and opportunities that would have been highly
beneficial to my career path. I felt I was on my own most of the time.
2010 Current Past Never Offer more business skills, more opportunities to exhibit, and more opportunities to connect with working
artists.
2009 Past Past Past There could have been more faculty in the department. They have not been replacing faculty when they
retire and it is making it hard for students to be well rounded. I found it hard, for example, to fill all of my
distribution credits. Furthermore, when I first came to this institution, our department was very highly
ranked by the Board of Higher Ed, but we have fallen dramatically in the ranking which hurts our ability to
attract to talent and stand out among other programs.
2008 Never Past Never Prepare me better for life after grad school, perhaps? There is such limited opportunity for employment as
an artist. I'm considering going back to this institution to pursue a professional certificate in graphic
design. It seems that this is the only way I can maintain my creative bent and yet have a full-time job.
2006 Current Current Past More information about what it's like to pursue a teaching job (I think we had one 2-hour Q&A session
about this). Invite in more guests who do something other than teach to earn a living while pursuing art.
2006 Current Past Past There is a competitive atmosphere that is supported by this institution. Thankfully I learned early on that I
needed my peers, and when I graduated I was able to work with artists in the community to create
opportunities. I wish that students were encouraged to make connections with each other rather than be
pitted against each other.
2006 Current Past Never Mostly, I think many of us (in the graduate program) felt disconnected from the larger notion of this
institution - we worked in a bubble, at times we felt like cash cows. My mentor was wonderful and did
everything that she could to assist in my education, but the rest of the education seemed a little slapped
together and unguided. I feel that the program assisted me in learning how to put together a successful art
exhibition, but did little to help me understand what I would be doing as a side career to help me sustain
myself.
SNAAP 2012 Alumni Comments • Institutional Experiences
Sample University
Graduate Level
Is there anything that this institution could have done better to prepare you for further education or for your career? Please describe.c
Cohort
bSee "Understanding the Alumni Comments" page for details.
cAsked of all alumni. Variable name in Codebook is edpreptxt.
187

Work as Work as Arts Work as Arts Graduate Level
Artistb Teacherb AdministratorbComment
Cohort
2004 Current Current Past Better professional development opportunities for students working in non-traditional ways - more
networking with other artists/art communities. PAID internships and summer opportunities for grads that
would help get their name out there. Needing to earn money often meant taking menial jobs over the
summer that did nothing to promote one's career.
2000 Current Current Past Professional practices - providing very practical information... this institution had a WONDERFUL
visiting artist program while I was there though and I found this to be invaluable! I sent two of my
undergraduate students to this institution for graduate study based on the visiting artist program, the
studios, funding, and their ability to teach while in grad school.
1999 Current Past Past More teaching opportunities and help with job placement.
1991 Current Current Past I was very well-schooled in various media and could teach those processes very well. Actual classroom
management, working within a minimal materials budget in a public school, and ideas for grading student's
artwork was non-existent. Most of these skills had to be learned on my own during student teaching time. I
felt this institution was excellent with research, but negligent concerning actual teaching practices. I had
only one art professor that included ideas to teach that particular art process in various classroom age
levels.
Meetings with working art teachers from the area would have been very beneficial.
1991 Current Past Never More input/guidance from professors. More constant interaction with students.
1987 Never Current Current More preparation for teaching and work in academia as well as guidance about building an
exhibition/screening/publication record.1979 Current Past Past Made on-campus workshop information available or part of the study....I participated in wonderful art
workshops after my degree but not during
1974 Current Current Past I don't feel that the student teaching experience that I received about fifty years ago was a true example of
teaching problems and the ability to solve those problems. Being in the field longer would have been a
large help. Another thing that I felt would help would be if the supervising education instructors would
have a much better understanding of art education and what was required of teachers in the public school.
1969 Past Past Past Foster more critical thinking and methodologies that are not only canonical. Internships or professional
opportunities including research grants, journal for publishing graduate research. More opportunities to
prepare and provide lectures in UG classes. (Had assistant-ships that focused on grading papers and some
tutorials with students, but wasn't prepared for lecturing at college level--made several mistakes at 1st
college teaching position, which could have been avoided)
bSee "Understanding the Alumni Comments" page for details.
cAsked of all alumni. Variable name in Codebook is edpreptxt.
188
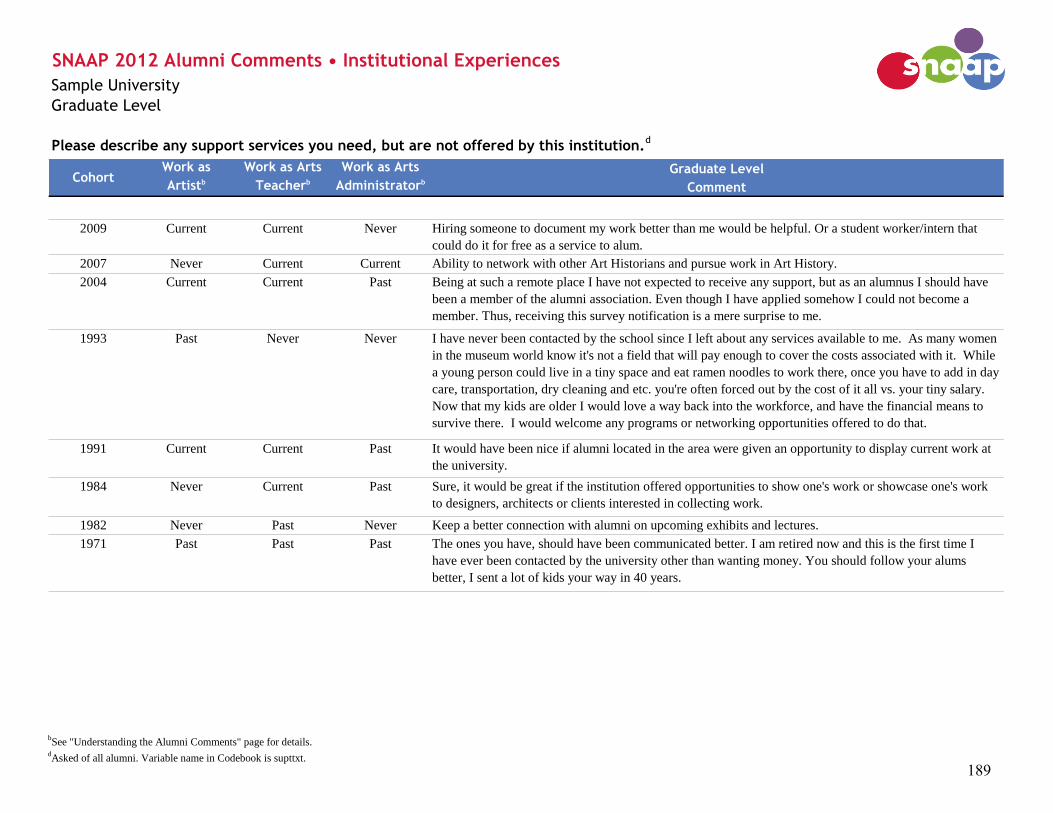
Work as Work as Arts Work as Arts Graduate Level
Artistb Teacherb AdministratorbComment
2009 Current Current Never Hiring someone to document my work better than me would be helpful. Or a student worker/intern that
could do it for free as a service to alum.
2007 Never Current Current Ability to network with other Art Historians and pursue work in Art History.
2004 Current Current Past Being at such a remote place I have not expected to receive any support, but as an alumnus I should have
been a member of the alumni association. Even though I have applied somehow I could not become a
member. Thus, receiving this survey notification is a mere surprise to me.
1993 Past Never Never I have never been contacted by the school since I left about any services available to me. As many women
in the museum world know it's not a field that will pay enough to cover the costs associated with it. While
a young person could live in a tiny space and eat ramen noodles to work there, once you have to add in day
care, transportation, dry cleaning and etc. you're often forced out by the cost of it all vs. your tiny salary.
Now that my kids are older I would love a way back into the workforce, and have the financial means to
survive there. I would welcome any programs or networking opportunities offered to do that.
1991 Current Current Past It would have been nice if alumni located in the area were given an opportunity to display current work at
the university.
1984 Never Current Past Sure, it would be great if the institution offered opportunities to show one's work or showcase one's work
to designers, architects or clients interested in collecting work.
1982 Never Past Never Keep a better connection with alumni on upcoming exhibits and lectures.
1971 Past Past Past The ones you have, should have been communicated better. I am retired now and this is the first time I
have ever been contacted by the university other than wanting money. You should follow your alums
better, I sent a lot of kids your way in 40 years.
Please describe any support services you need, but are not offered by this institution.d
Cohort
SNAAP 2012 Alumni Comments • Institutional Experiences
Sample University
Graduate Level
bSee "Understanding the Alumni Comments" page for details.
dAsked of all alumni. Variable name in Codebook is supttxt.
189

Cohort Work as Work as Arts Work as Arts Graduate Level
Artistb Teacherb AdministratorbComment
2009 Never Never Never I am still in school but I am looking at jobs outside of the arts because of money, particularly in other
university disciplines.
1995 Never Current Never I work in the arts as a professor and pursue my artistic work in that context, but do not make my primary
income from selling, receiving grants for my work.
1987 Past Past Past After working as a part-time local arts agency director for several years, (no benefits-low wages) I was
hired as staff with the state arts agency. This was a position that required arts administration background
and broad knowledge of the arts. My position required grant review and contact with the broad spectrum
of arts organizations and artists throughout the state on the grant requirements and adjudication process for
awards.
1982 Past Past Current I was interested in many aspects of the arts. I worked as a full time artist, but I also wanted access to
health care. Reliable income was important, too. It wasn't the amount of the income- it was the reliability
of it. However, I have always worked in the arts and have received much encouragement. I would say that
my primary occupation is that of an arts educator. I didn't intend to become an arts educator when I was
pursuing my MFA but that's how it worked out. I think it might have gone differently if I had been more
aware of business and entrepreneurial opportunities (and if I had more knowledge of what to do). My
parents were in education so I knew that world better. Frankly, at the time, there wasn't that recognition
that artists were primarily self-employed, small business owners.
1974 Past Past Past After 40 years of working in many art related fields I chose to retire.
SNAAP 2012 Alumni Comments • Career
Sample University
Graduate Level
If there was another reason why you either stopped working in an occupation as an artist or chose not to pursue work as an artist, please
describe that below.e
bSee "Understanding the Alumni Comments" page for details.
eAsked of alumni who were never or past professional artists but intended to be when attending this institution. Variable name in Codebook is stp_othtxt.
190

Work as Work as Arts Work as Arts Graduate Level
Artistb Teacherb AdministratorbComment
1991 Past Current Never There are no other networks that I can think of, but I would like to emphasize the importance of top quality
faculty an instructors.
1989 Past Current Past "Networking" was not really something "artists" seemed to do......to me it has always seemed to be a "Lone
Ranger" approach. However, I do think that the adage "it's not what you know but who you know" is true.
I guess I haven't known, or impressed, the "right" people.
1974 Current Current Past Lack of knowledge of and awareness of professional educational and art organizations
If there are any other networks associated with this institution that have had an influence on your career, please describe them below.f
Cohort
SNAAP 2012 Alumni Comments • Career
Sample University
Graduate Level
bSee "Understanding the Alumni Comments" page for details.
fAsked of all alumni. Variable name in Codebook is infothtxt.
191

Work as Work as Arts Work as Arts Graduate Level
Artistb Teacherb AdministratorbComment
2012 Current Never Current I do not use my skills/training from my undergrad or my graduate certificate in my current full-time
position as an Administrative Assistant.
2010 Current Current Past I am currently working as an adjunct art instructor at two different institutions. My training as an artist is
the basis of my everyday experience as an instructor. I am also finishing a public art project for which I
utilized my prior arts training.
2010 Never Never Never It is not relevant at all, I could have this same job with a high school diploma and not be in huge debt from
going to this institution.
2009 Never Never Never Not really relevant. Most of what I do now is about theory and critical thinking, this is not something I
was trained for as an art student at this institution.
2007 Current Current Current My arts training helped me gain research, technical, and creative problem solving skills that are all relevant
to my current work.2006 Current Past Past I use what I gained in school on a weekly basis. Advise from teachers, peers and visiting artists has stuck
with me over the years, and I have a professional practice that is marked with integrity because of my
experience and influences at this institution. I must also state that this institution was what I made of it.
2001 Never Current Never My art training is fundamental to my work as an art critic. I can understand better the challenges artists
face, and I can relate to art works better than my colleagues who did not graduate in arts. Also, because I
studied in the US and now live in my home country, my English skills are very useful.
1996 Current Current Current My art training is essential for teaching technique, mentoring students, and providing alternative
perspectives in problem solving.
1992 Current Current Never Not relevant in hospital food preparation
1989 Past Current Past I utilize my arts training daily, for both personal work and my employment. But my art training goes back
to my elementary and junior high years. I attribute much of what I do in the 3 separate methods courses I
teach to the excellence of my junior high art teacher and a Saturday school program I attended for 3 years.
You need to remember that for most artists (visual arts, theater, dance, music, or other) that interest and
training in their field often begin long before the individual seeks a college degree. The success or failure
of the artist has as much to do with the other support they have had and continue to receive, perhaps even
IN SPITE OF, their college experience.
Please describe how your arts training is or is not relevant to your current work.g
Cohort
SNAAP 2012 Alumni Comments • Current Work
Sample University
Graduate Level
bSee "Understanding the Alumni Comments" page for details.
gAsked of all alumni who are currently working. Variable name in Codebook is wktraintxt.
192

Work as Work as Arts Work as Arts Graduate Level
Artistb Teacherb AdministratorbComment
Cohort
1980 Past Never Never The basic research and writing skills, as well as my broad undergraduate and graduate education at this
school are relevant to my current work.
1975 Never Never Current Relevant only as orientation to the creative personality and to art and architecture generally
1968 Current Past Never My BFA and MFA training has provided a solid base for my development as an artist and art teacher. My
art school experience opened many doors for further exploration. Even though the location of this
university is not New York City, the visiting artist program in the 60s was phenomenal!
1965 Past Past Past It is totally relevant. I would not be a designer/photographer without my training.
bSee "Understanding the Alumni Comments" page for details.
gAsked of all alumni who are currently working. Variable name in Codebook is wktraintxt.
193

Work as Work as Arts Work as Arts Graduate Level
Artistb Teacherb AdministratorbComment
2010 Current Past Current Other arts occupation I develop arts programming for an after school program serving
underprivileged children.
2008 Current Current Never Higher education arts educator Assistant Professor. I teach mostly courses related to new media in
an art department.
2006 Current Past Past Photographer Owner of a photography-service business. I primarily work as a
portrait & event photographer. I also freelance for a high-end fashion
retailer, doing post-production work.
2005 Never Current Never K-12 arts educator Art teacher: I am the only art teacher for a 6th-8th grade middle
school. I created the entire curriculum, I control my budget, organize
a fundraiser and art show, and coach multiple sports and clubs.
2001 Current Never Never Fine artist Conceptual Artist - Paintings, Drawings, Site Specific work shown in
for profit galleries, non-profit galleries, alternative spaces
2000 Current Past Past Other Graphic Designer. Design of books, publications, logos, marketing
materials, marketing campaigns, advertising, web graphics, and
illustration.
1996 Current Current Never K-12 arts educator Visual Arts Department Head. I teach drawing and painting to high
school students and run a Pre-K through 12 visual arts department at
a private prep school.
1993 Current Current Never Higher education arts educator I am an Associate Professor of Graphic Design in the Department of
Graphic Design at a Big 12 University in the Midwest.
1992 Past Never Current Arts administrator or manager Coordinator of Graduate Academic Affairs-oversee the academic
needs for all graduate programs.
1991 Current Current Past Private teacher of the arts I teach a Seniors' Painting class at a Senior Center... I also teach
specific media in workshops at area Art Guilds and Associations.
Cohort
Please provide your job title and brief description of your work in the occupation in which you spend the majority of your work time.h
SNAAP 2012 Alumni Comments • Current Work
Sample University
Graduate Level
Occupationi
bSee "Understanding the Alumni Comments" page for details.
hAsked of all alumni who are currently working. Variable name in Codebook is majtimetxt.
iOccupation for majority of work time. Variable name in Codebook is majtimejob_R.
194

Work as Work as Arts Work as Arts Graduate Level
Artistb Teacherb AdministratorbComment
Cohort Occupationi
1990 Past Current Never K-12 arts educator Art Department Chairperson (high school): I work with multiple
groups of students, daily, and this requires lesson preparation,
material preparation, mentorship, and outreach to parents.
Additionally, I work with my colleagues to improve instruction and
curriculum. My responsibilities include communicating with parents,
school groups, Administration, and the community about our
program. I am responsible for budgeting and programming. As a
department chair, I work with other building leaders on broader
educational issues and programs. I volunteer in arts associations,
state-wide and national.
1989 Past Current Past Higher education arts educator Lecturer. Undergraduate adviser. Teach three separate methods
courses, plus field supervision, and observation/practicum course.
1987 Never Current Never No Response Art Professor and Program Coordinator. I teach studio art and an art
lecture course as well as manage the hiring and scheduling of adjunct
faculty, lead program initiatives, and monitor the accreditation status
(NASAD) and procedural issues for my college.
1982 Past Current Past Higher education arts educator Associate professor. Develop curriculum for undergraduate graphic
design major, teaching any of the required graphic design courses for
the major; teaching and mentoring in our MFA degree program.
1971 Current Past Past Other designer Now retired for a year and a half from teaching at a university art
department I am engaged in exploring an animated icon writing
system, co-developing a DNA notation system, collaborating with a
retired English professor in proposing discovery based learning for
middle-school and/or high school students with a focus on visual
thinking with symmetry and balance as the integrating cross
disciplinary theoretical core. I am currently redesigning and
implementing a web site for a non-profit organization.1969 Past Past Never Communications Mostly I sold advertising for non profit organizations. I also have
done a lot of public relations for non profits. And I have also raised a
lot of money for non profits because I was a Board Member.
1966 Current Past Past Healthcare Massage Therapist/Bodyworker
1954 Current Past Past Craft artist I have a studio practice in which I create jewelry and small objects in
metal.
bSee "Understanding the Alumni Comments" page for details.
hAsked of all alumni who are currently working. Variable name in Codebook is majtimetxt.
iOccupation for majority of work time. Variable name in Codebook is majtimejob_R.
195

Work as Work as Arts Work as Arts Graduate Level
Artistb Teacherb AdministratorbComment
Cohort Occupationi
1953 Current Past Past Fine artist For 50 years, I have been both a practicing artist and a tenured
professor, retiring as a Distinguished Professor. I have also been a
Fulbright Teaching Scholar. I have always maintained 60-year
schedule of annual exhibitions and have a wide-ranging list of hand-
printed books and portfolios. I am primarily a painter, a sculptor and
regularly draw the human form. I am nearly 87 years old and work 7
days a week.
bSee "Understanding the Alumni Comments" page for details.
hAsked of all alumni who are currently working. Variable name in Codebook is majtimetxt.
iOccupation for majority of work time. Variable name in Codebook is majtimejob_R.
196

Work as Work as Arts Work as Arts Graduate Level
Artistb Teacherb AdministratorbComment
2012 Current Past Never The connections I've made there have opened up opportunities for involvement in the community.
2010 Current Past Past Because of my training I feel more connected to the global art community and relate to the personal
practice of other artists.2010 Never Never Never My arts training is not relevant to my participation in civic and community life because I am not an artist. I
serve the community through other means.2009 Never Never Never While art is heavily related to by interest in civic and community life, this was not instilled in me by the
arts training I received but rather by a few faculty members, it is definitely not an overall connection I see
stressed at this institution.
2007 Current Past Never This institution solidified my love of the arts and commitment to not just be involved in my own work but
to experience and appreciate the work of other artists.2006 Current Current Never I do not remember an emphasis on community or civic participation while I was at this institution.
2006 Current Past Never I would like to think if I had received (or had not received) training at any other institution that I would
also be an active participant in civic and community life. It is how I was raised.
2004 Current Never Never It isn't. The training we received was largely divorced from the community, or social issues that could
engage or benefit the community. In fact, such approaches to artwork were viewed with hostility by the
faculty.
1997 Current Current Current I have started the first industrial design course at a different college. I promote this course on a daily basis
and speak publicly in an effort to bring a greater awareness of industrial design to the community and state.
1991 Current Current Past I do not think my arts training is relevant to my civic and community life except that I use it to teach at the
community level.1990 Current Past Never Higher education, if it works as it should, inherently should encourage citizens to be aware of and support
civic and community life. My own experience certainly reflects this ideal goal.1990 Never Never Current The exhibitions and arts events I attend are simply an extension of my personal interest in the fine arts.
SNAAP 2012 Alumni Comments • Arts Engagement
Sample University
Graduate Level
Describe how your arts training at this institution is or is not relevant to your participation in civic and community life.j
Cohort
bSee "Understanding the Alumni Comments" page for details.
jAsked of all alumni. Variable name in Codebook is contcomm.
197

Work as Work as Arts Work as Arts Graduate Level
Artistb Teacherb AdministratorbComment
Cohort
1987 Past Past Past My arts training is separate from any social or community civic participation. My arts training is a
reflection of who I am and the interests that I have. It was important to me in the way that recognizes that
had I not pursued it, my life would be less complete. My art expresses itself in the way I live my life day to
day. This includes an appreciation of creativity in myself and others and in the ability to see beauty and
relevance in the everyday.
1981 Current Current Past I guess it is only relevant in that I am still living in the community of my original graduate education and
thus still supporting the arts that are a part of this community1969 Past Past Never I do believe that all my arts training has been inspired by and sustained by my involvement in the larger
community/society. I actually work better and produce more when I am in a group situation. I am a
people person and work better in a class or workshop rather than staying at home by myself to produce
work.
bSee "Understanding the Alumni Comments" page for details.
jAsked of all alumni. Variable name in Codebook is contcomm.
198

Work as Work as Arts Work as Arts Graduate Level
Artistb Teacherb AdministratorbComment
2008 Current Current Never The fellowships/tuition waiver and chance to work to earn money while in graduate school made a huge
difference in my life. To be able to graduate without debt while still getting a good education was a great
blessing.
2007 Current Current Never I was prepared artistically however the economy has not allowed me to pursue an artistic career besides
teaching art.
2006 Current Current Past Many faculty members were not really very good at figuring out students' interests with their independent
work and helping them improve on that basis. Many faculty members were more interested in imposing
their own ideas and interests on students instead. This is not particularly helpful when one has gone to
graduate school in order to develop one's independent studio work.
2003 Never Never Never I believe that it would have helped to be connected to a university in my geographic area to do a teaching
internship after graduating. This would have helped me get my food in the door.
1995 Current Current Current We all agree that the arts are incredibly important to the health of a nation and its people. It is therefore
important that students of the arts are given all available assistance in understanding how to grow a career
in the arts. It should be a part of one's education.
1991 Current Current Past It would have been very beneficial to have a mentor/advisor that was more than the person who told me
which classes I needed to take/complete for my degree.1990 Current Past Past I had a fabulous experience while studying my Masters degree in 1989-1990. The experience has held me
in good stead ever since in both my professional and personal life. My only big regret is that I did not take
up the offer to do my PhD here; too many family demands at the time. Thank you.
1982 Past Past Current I'm so glad you are undertaking this survey. It's very important to understand what graduates are doing and
how their education influenced where they ended up.1970 Current Past Past I believe that my education was very good. I am especially grateful to a couple of faculty members who
were challenging and encouraging. I also appreciated the opportunity to teach at the institution for two
years after finishing my MFA.
If there are additional things you would like to tell us about your education, life, and/or career that were not adequately covered on the
survey, please do so here.k
Cohort
SNAAP 2012 Alumni Comments • Facts and Figures
Sample University
Graduate Level
bSee "Understanding the Alumni Comments" page for details.
kAsked of all alumni. Variable name in Codebook is finalcomments.
199

Work as Work as Arts Work as Arts Graduate Level
Artistb Teacherb AdministratorbComment
Cohort
1969 Past Past Never My education at this institution was exceptional. I am very proud of my degrees. It was my personal
situation (children, divorce) that caused my inability to produce much art work through the years. It is
unfortunate.
1965 Current Past Never I spent 31 years as an art faculty member at a university, ten of those were as Department Chairman. I've
also led an active career as an exhibiting artist with over thirty solo shows and numerous group exhibits.
bSee "Understanding the Alumni Comments" page for details.
kAsked of all alumni. Variable name in Codebook is finalcomments.
200

Work as Work as Arts Work as Arts Graduate Level
Artistb Teacherb AdministratorbComment
2012 Current Current Never This survey has a "one size fits all" feel to it. Sometimes it felt like it was not quite asking the right
questions about an MFA program at an art school.
2009 Never Current Never Several questions are only geared to artists, and there is no option for answering N/A. I graduated from Art
History and do not make art, perform, etc.
1999 Current Current Past some questions not appropriate for a student returning to school after pursuing a career
1991 Current Current Past This was a very illuminating questionnaire. It was a chance to look back and see just how much I have
used my training. Thank you!1971 Current Past Past The survey is longer than I expected. A few of the question multiple choice options do not have the
specificity needed for accurate and meaningful responses.
1951 Current Past Never I am a site-specific sculptor, not a Dean.. My income has always had wide swings. If you care to be taken
seriously, eliminate the questions concerning income. I have always told students that if money was that
important, try something else... but for true fulfillment chose a career that you feel passionately about. I
believe this is an age of nichemanship and one must find that niche where one can make a unique
contribution while taking the path unchartered. When I taught, I would work collaboratively with the
various disciplines and students searching for the worst possible problem with the university or
community and then finding an esthetic way to solve it.
If you have any additional comments or feedback that you’d like to share about this project or the questionnaire you just completed,
please do so here.l
Cohort
SNAAP 2012 Alumni Comments • Facts and Figures
Sample University
Graduate Level
bSee "Understanding the Alumni Comments" page for details.
lAsked of all alumni. Variable name in Codebook is survcomments.
201


![[cla] 2012-2013 CLA INSTITUTIONAL REPORT](https://img.pdfslide.net/doc/110x75/6238949ed4c5392cf37012b5/cla-2012-2013-cla-institutional-report.jpg)