Embed Size (px)
Citation preview

INSTITUTIONALSTATISTICS
BOOK2006/07
QUICK FACTSSTUDENT DATA FACULTY DATA
Enrolment - 2006/07 (as at Nov 1) Full-time Faculty - 2006/07
Full-time Undergraduate 5,592 Professors 76Part-time Undergraduate 1,451 Associate Professors 114Full-time Graduate 453 Assistant Professors 81Part-time Graduate 100 Lecturers 19
Headcount - Fall/Winter 7,596 Total 290(excludes Faculty of Medicine)
Full-time Equivalent (2006/07) 7,874(excludes Faculty of Medicine)
FINANCIAL DATA - 2005/06
Operating Revenue ($ millions)
Source of Operating RevenueDegrees Awarded (Calendar Year 2006) -Government Grants 51.453
-Fees 34.049-Other 3.042
Bachelors 2,014Certificate 81 Total Operating Revenue 88.544Diploma 61
Masters 145 Operating Expenses ($ millions)-Salaries & Benefits 56.856
Doctorates 5 -Non-Salary Items 19.382
Total 2,306 Total Operating Expenses 76.238
2
LAKEHEAD UNIVERSITY
INSTITUTIONAL STATISTICS BOOK
2006/07

TABLE OF CONTENTS
PAGE
QUICK FACTS . . . . . . . . . . . . . . . . . . . . . . . . . . . . . 2
SECTION 1 GENERAL
Mission Statement . . . . . . . . . . . . . . . . . . . . . . . . . . . 6Honorary Degrees . . . . . . . . . . . . . . . . . . . . . . . . . . . 7Fellows, Distinguished Alumni, Researchers & Instructors . . . . . . 8Organization - Board, Senate and Committees . . . . . . . . . . . . 9Academic Faculties, Departments & Schools . . . . . . . . . . . . 11Library Collections, Circulation and Reference Statistics . . . . . . 12B.I.U. Comparison - Actual and Moving Average . . . . . . . . . . . 13B.I.U. Weight per FTE . . . . . . . . . . . . . . . . . . . . . . . . 14Glossary of Acronyms . . . . . . . . . . . . . . . . . . . . . . . . 15
SECTION 2 STUDENT DATA
FTE/BIU History . . . . . . . . . . . . . . . . . . . . . . . . . . . 18Degrees Awarded by Program . . . . . . . . . . . . . . . . . . . . 19Full-Time Enrolment by Majors (Fall/Winter) . . . . . . . . . . . . 27Part-Time Enrolment by Majors (Fall/Winter) . . . . . . . . . . . 28Enrolment by Gender, Registration Status & Level . . . . . . . . . 29Enrolment by Gender . . . . . . . . . . . . . . . . . . . . . . . . . 30Enrolment by Level & Registration Status . . . . . . . . . . . . . . 31Age Distribution of Registered Applicants . . . . . . . . . . . . . 32Geographic Distribution of Full-time Registrants . . . . . . . . . . 33Applicant/Registrant Data . . . . . . . . . . . . . . . . . . . . . . 34Applications - All Ontario . . . . . . . . . . . . . . . . . . . . . . 35Registrations - All Ontario . . . . . . . . . . . . . . . . . . . . . 36Applications - N.W.O. . . . . . . . . . . . . . . . . . . . . . . . . 37Registrations - N.W.O. . . . . . . . . . . . . . . . . . . . . . . . . 38Undergraduate Class Sizes . . . . . . . . . . . . . . . . . . . . . 39
PAGE
SECTION 3 FACULTY
Full-Time Faculty Appointments by Department . . . . . . . . . . 41Full-Time Faculty - Distribution by Rank & Appointment . . . . . . 42Full-Time Faculty - Distribution by Gender & Appointment . . . . . 43Full-time Faculty Distribution by Age . . . . . . . . . . . . . . . . 44Full-Time Equivalent Course Enrolments . . . . . . . . . . . . . . . 45Student/Faculty Ratios . . . . . . . . . . . . . . . . . . . . . . . 47Summary of Part-Time (Sessional) Faculty . . . . . . . . . . . . . . .
SECTION 4 FINANCIAL
Revenue by Source and Type of Fund . . . . . . . . . . . . . . . . 49Expenses by Object and Type of Fund . . . . . . . . . . . . . . . . 50Operating Income and Expenditures . . . . . . . . . . . . . . . . . 51Revenue from Research Grants and Contracts . . . . . . . . . . . 52Lakehead University Internal Scholarships, Bursaries and Awards 53Donations and Bequests . . . . . . . . . . . . . . . . . . . . . . . 54
SECTION 5 SPACE
University Land (in Hectares) . . . . . . . . . . . . . . . . . . . . 56Distribution of Physical Space . . . . . . . . . . . . . . . . . . . . 57Residence Accommodation . . . . . . . . . . . . . . . . . . . . . . 58Lakehead University Campus Map . . . . . . . . . . . . . . . . . . 59
HIGHLIGHTS OF LAKEHEAD UNIVERSITY'SECONOMIC IMPACT ON THE CITY OF THUNDER BAY. . . . . . . . . . . . . . . . . . . . . . . . . . . . . . . . . . . . . . . . . . . . . . . . . . . . . . . . . . . 60
4

SECTION 1 - GENERAL
Lakehead University Mission Statement
Honorary Degrees, Fellows, Distinguished Alumni, Distinguished Researchers, Distinguished Instructors
Lakehead University Organization - 2006/07 - Board of Governors, Senate and Committees
Academic Faculties, Departments and Schools
Establishment Summary
Library Collections, Circulation and Reference Statistics
FTE Enrolment and BIU as a % of the Ontario System Totals
BIU Comparison
BIU Weight/FTE
Glossary of Acronyms

Lakehead University is committed to excellence and innovation in undergraduate and graduate teaching, service, research
and other scholarly activity. As part of this commitment, Lakehead University is dedicated to a student-centred learning
environment. Lakehead University values its people and the diversity of their ideas, contributions and achievements.
Lakehead University is dedicated to working with Aboriginal peoples in furthering their educational aspirations. Building
on its past accomplishments and recognizing its role in Northwestern Ontario, Lakehead University reaches out regionally,
nationally and internationally.
Lakehead University is committed to educating students who are recognized for leadership and independent critical
thinking and who are aware of social and environmental responsibilities.
LAKEHEAD UNIVERSITYMISSION STATEMENT
6

HONORARY DEGREES
1973 Senator Norman M. Paterson1974 Patrick D. McTaggart-Cowan
Reva Gerstein1975 Miriam Waddington
J. Murray Fleming1976 Dorothea M. Crittenden
Robert R. Steele1977 Harold S. Braun1978 Hon. Robert K. Andras
Robert J. Prettie1979 Alastair R.C. Duncan
Claude E. Garton1980 Benjamin Cowan1981 Edward J. Monahan
William G. Tamblyn1982 Rt. Hon. Bora Laskin
S.Delbert ClarkTerence M. Penelhum
1983 Harry K. FisherHon. Leo BernierBruce I. Howe
1984 Edward F. SheffieldRev. Agnew H. JohnstonHon. John B. AirdJ. Tuzo Wilson
1985 Rt. Hon. Edward R. SchreyerLynn JohnstonNorval MorrisseauM. Josephine Flaherty
1986 Robert M. BatemanKenneth M. DyeFarley M. MowatDavid T. Suzuki
1987 Douglas M. FisherE. Margaret Fulton
1987 Cliff M. McIntoshMaxwell W. Ward
1988 Hon. Jean ChrétienMaureen ForresterStephen LewisPaul ShafferJohn E. Stokes
1989 Adrienne ClarksonGeraldine Kenny-WallacePeter MansbridgeWilliam West
1990 Jeanne L. AgnewJohn K. BellAmbassador Derek BurneyArthur C. EricksonWilliam S. Fyfe
1991 Arthur BlackRoberta L. BondarKenneth A. ArmsonRichard C. Lyons
1992 Hon. Mme. Justice Karen WeilerNeil Young
1993 Judith Maxwell1994 Hon. Nellie Cournoyea
Ian TamblynJames MacNeillUrsula Franklin
1995 Timothy FindleySaul LaskinMonique FrizeHelen Donis-Keller
1996 Louis DudekLorne EverettRobert PatersonMelvin Pervais
1996 Ronald RistimakiLenore (Leni) Untinen
1997 Mario BernardiOlive DickasonRichard GwynArthur MauroLofti Zadeh
1998 Margaret AtwoodT. Sher SinghRoberta JamiesonJames MacGregor
1999 Rev. John J. Pungente2000 Douglas J. Cardinal
Buffy Sainte MarieJane Urquhart
2001 Carol ShieldsDr. Jack Thomas
2002 Pierre BertonHon. Mme. Justice Louise Arbour
2004 Austin ClarkeFrank Dottori
2005 Maude BarlowPhil Fontaine
2006 Dr. Jerry F. FranklinPaul Weiler
7
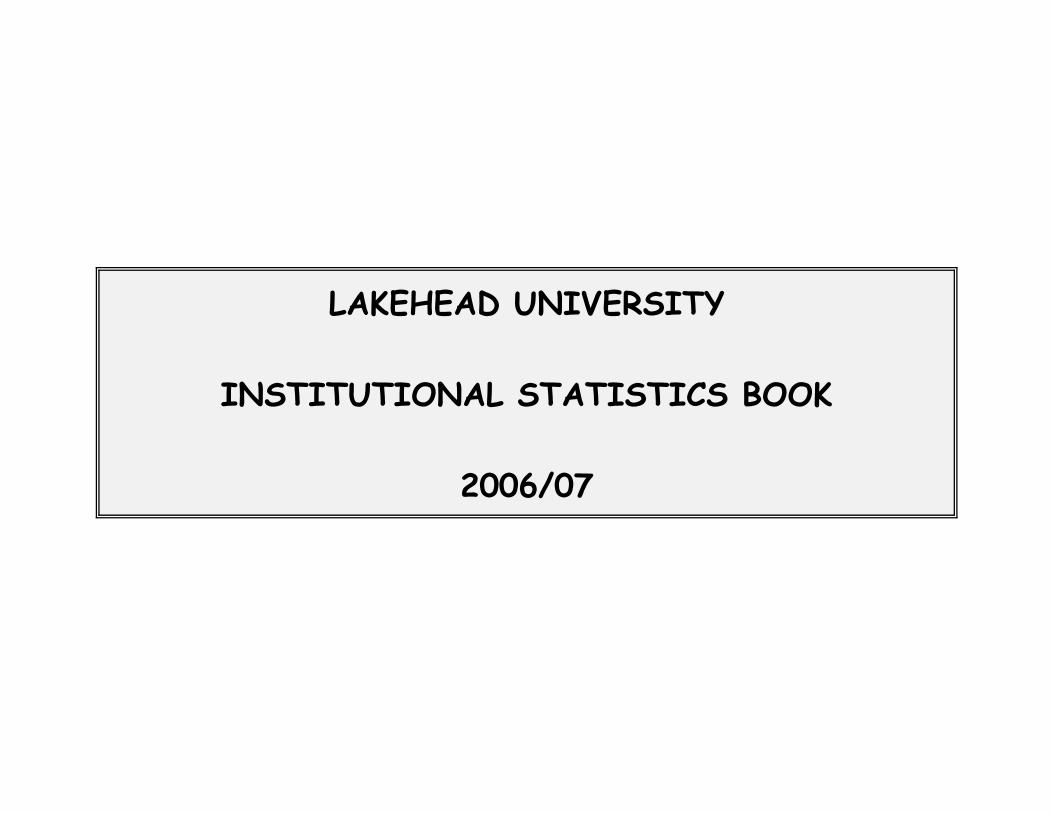
FELLOWS
DISTINGUISHED ALUMNI
DISTINGUISHEDRESEARCHERS
DISTINGUISHEDINSTRUCTORS
1976 R. Jack FlattE. Lorne Goodall
1979 John N. Paterson1980 John Andrews
Hubert Badanai, Sr.1981 Melville W. Bartley1984 William G. Tamblyn
Roderick Philpot1985 Russell A. Peden1987 Charles J. Carter
Saul Laskin1988 Thomas S. Jones
A.L. (Pete) Musselman1989 Wallace Bryan1990 H. Fraser Dougall
G. Sydney Halter1991 Arnold E. Westlake1993 Mary Anne Misner1994 Elizabeth Chalmers1995 Annette Augustine1996 Mae Katt1997 Margaret Page
Robbert P. Welter1998 Florence Johnston
Hon. Mr. Just. John McCartney
1999 Vic Prokopchuk2000 Preston R. Cook2001 Dr. Jim Colquhoun
Tony Seuret2002 Larry Hebert2004 Dusty Miller2005 Rod Shewchuk
2005 Dr. George Macey
1988 Ronald J. Duhamel1989 Lorne Everett1990 E.J. (Dusty) Miller1991 Anthony J. Petrina1992 Richard P. Lang1993 Lyn McLeod1994 Dennis McPherson1995 Robert Gregor1996 Joseph Logozzo1997 Betty Coates (posthumously)1998 John Valley1999 Diane Schoemperlen2000 Margaret Page2001 Peter Prior2002 Joseph Baratta (posthumously)2003 Denis Turcotte2004 Robert Mace2005 Stephen Law
1988 Roger H. MitchellInderjit Nirdosh
1989 Alan N. Hughes1990 Alan Day1991 Said M. Easa1992 Neil Weir1993 Vireshwar V. Paranjape
1994 David Holah1995 S. Ali Mirza1996 Murray Lankester1996 Rao Puttagunta1997 Doug Morris
Ken Rotenberg1998 Graham Borradaile1999 Azim Mallik2001 Laurie Garred2002 Umed S. Panu2003 Stephen Kinrade2004 Bruce Strang
1988 S. Penny Petrone1989 Manfred M. Kehlenbeck1990 Peggy H. Knowles1991 S. Ali Mirza1992 W.G. (Bill) Heath1993 Victor C. Smith1994 Darlene Steven1995 Inderjit Nirdosh1996 Jane Taylor1997 Jeanette Lynes1998 Kim Fedderson1999 Ken Brown2000 Frederick M. Holmes2002 Tom Potter2003 Mike Richardson2004 Margaret McKee
8
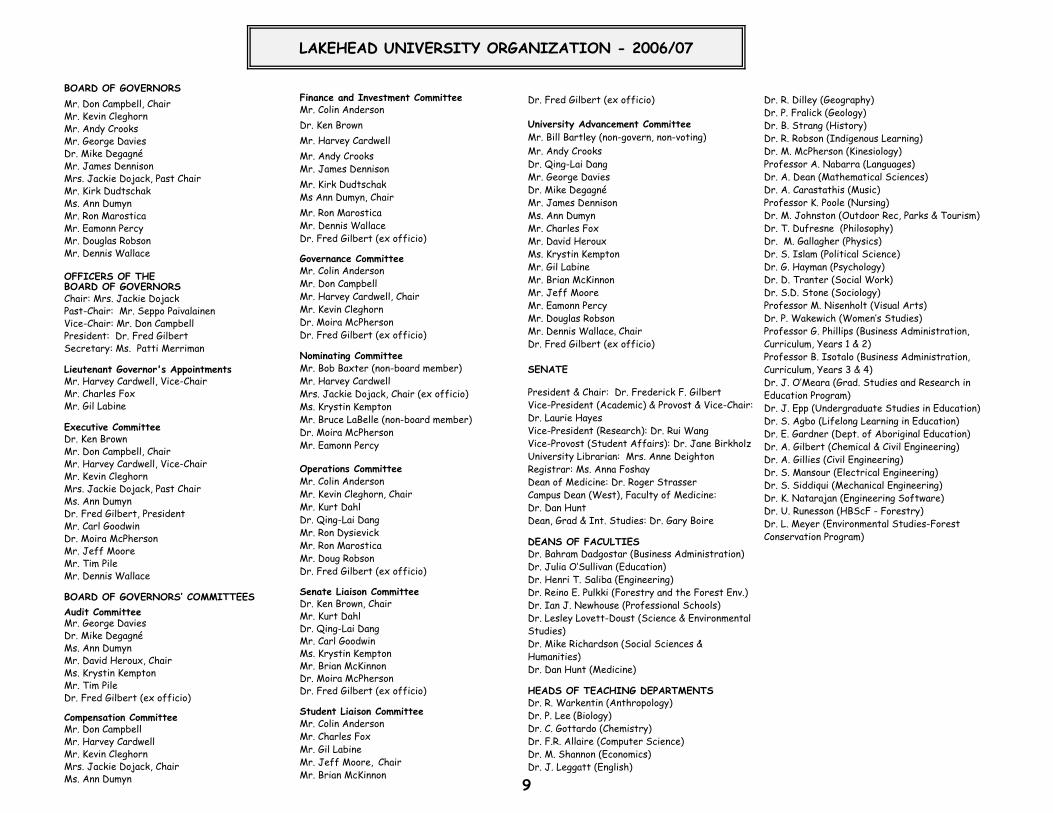
BOARD OF GOVERNORSMr. Don Campbell, ChairMr. Kevin CleghornMr. Andy CrooksMr. George DaviesDr. Mike DegagnéMr. James DennisonMrs. Jackie Dojack, Past Chair Mr. Kirk DudtschakMs. Ann DumynMr. Ron MarosticaMr. Eamonn PercyMr. Douglas Robson Mr. Dennis Wallace
OFFICERS OF THEBOARD OF GOVERNORSChair: Mrs. Jackie DojackPast-Chair: Mr. Seppo PaivalainenVice-Chair: Mr. Don CampbellPresident: Dr. Fred GilbertSecretary: Ms. Patti Merriman
Lieutenant Governor's AppointmentsMr. Harvey Cardwell, Vice-ChairMr. Charles FoxMr. Gil Labine
Executive CommitteeDr. Ken BrownMr. Don Campbell, ChairMr. Harvey Cardwell, Vice-ChairMr. Kevin CleghornMrs. Jackie Dojack, Past ChairMs. Ann DumynDr. Fred Gilbert, PresidentMr. Carl GoodwinDr. Moira McPhersonMr. Jeff MooreMr. Tim PileMr. Dennis Wallace
BOARD OF GOVERNORS’ COMMITTEESAudit CommitteeMr. George DaviesDr. Mike DegagnéMs. Ann DumynMr. David Heroux, ChairMs. Krystin KemptonMr. Tim PileDr. Fred Gilbert (ex officio)
Compensation CommitteeMr. Don CampbellMr. Harvey Cardwell Mr. Kevin CleghornMrs. Jackie Dojack, ChairMs. Ann Dumyn
Finance and Investment CommitteeMr. Colin AndersonDr. Ken BrownMr. Harvey CardwellMr. Andy CrooksMr. James DennisonMr. Kirk DudtschakMs Ann Dumyn, ChairMr. Ron MarosticaMr. Dennis WallaceDr. Fred Gilbert (ex officio)
Governance CommitteeMr. Colin AndersonMr. Don Campbell Mr. Harvey Cardwell, ChairMr. Kevin CleghornDr. Moira McPhersonDr. Fred Gilbert (ex officio)
Nominating CommitteeMr. Bob Baxter (non-board member)Mr. Harvey CardwellMrs. Jackie Dojack, Chair (ex officio)Ms. Krystin KemptonMr. Bruce LaBelle (non-board member)Dr. Moira McPhersonMr. Eamonn Percy
Operations CommitteeMr. Colin AndersonMr. Kevin Cleghorn, ChairMr. Kurt DahlDr. Qing-Lai DangMr. Ron DysievickMr. Ron MarosticaMr. Doug RobsonDr. Fred Gilbert (ex officio)
Senate Liaison CommitteeDr. Ken Brown, ChairMr. Kurt DahlDr. Qing-Lai DangMr. Carl GoodwinMs. Krystin KemptonMr. Brian McKinnonDr. Moira McPhersonDr. Fred Gilbert (ex officio)
Student Liaison CommitteeMr. Colin AndersonMr. Charles FoxMr. Gil LabineMr. Jeff Moore, Chair Mr. Brian McKinnon
Dr. Fred Gilbert (ex officio)
University Advancement CommitteeMr. Bill Bartley (non-govern, non-voting)Mr. Andy CrooksDr. Qing-Lai DangMr. George DaviesDr. Mike DegagnéMr. James DennisonMs. Ann DumynMr. Charles FoxMr. David HerouxMs. Krystin KemptonMr. Gil LabineMr. Brian McKinnonMr. Jeff MooreMr. Eamonn PercyMr. Douglas Robson Mr. Dennis Wallace, ChairDr. Fred Gilbert (ex officio)
SENATE
President & Chair: Dr. Frederick F. GilbertVice-President (Academic) & Provost & Vice-Chair:Dr. Laurie HayesVice-President (Research): Dr. Rui WangVice-Provost (Student Affairs): Dr. Jane BirkholzUniversity Librarian: Mrs. Anne DeightonRegistrar: Ms. Anna Foshay Dean of Medicine: Dr. Roger StrasserCampus Dean (West), Faculty of Medicine:Dr. Dan HuntDean, Grad & Int. Studies: Dr. Gary Boire
DEANS OF FACULTIESDr. Bahram Dadgostar (Business Administration)Dr. Julia O’Sullivan (Education)Dr. Henri T. Saliba (Engineering)Dr. Reino E. Pulkki (Forestry and the Forest Env.)Dr. Ian J. Newhouse (Professional Schools)Dr. Lesley Lovett-Doust (Science & EnvironmentalStudies)Dr. Mike Richardson (Social Sciences &Humanities)Dr. Dan Hunt (Medicine)
HEADS OF TEACHING DEPARTMENTSDr. R. Warkentin (Anthropology)Dr. P. Lee (Biology)Dr. C. Gottardo (Chemistry)Dr. F.R. Allaire (Computer Science)Dr. M. Shannon (Economics)Dr. J. Leggatt (English)
Dr. R. Dilley (Geography)Dr. P. Fralick (Geology)Dr. B. Strang (History)Dr. R. Robson (Indigenous Learning)Dr. M. McPherson (Kinesiology)Professor A. Nabarra (Languages)Dr. A. Dean (Mathematical Sciences)Dr. A. Carastathis (Music)Professor K. Poole (Nursing)Dr. M. Johnston (Outdoor Rec, Parks & Tourism)Dr. T. Dufresne (Philosophy)Dr. M. Gallagher (Physics)Dr. S. Islam (Political Science)Dr. G. Hayman (Psychology)Dr. D. Tranter (Social Work)Dr. S.D. Stone (Sociology)Professor M. Nisenholt (Visual Arts)Dr. P. Wakewich (Women’s Studies)Professor G. Phillips (Business Administration,Curriculum, Years 1 & 2)Professor B. Isotalo (Business Administration,Curriculum, Years 3 & 4)Dr. J. O’Meara (Grad. Studies and Research in Education Program)Dr. J. Epp (Undergraduate Studies in Education)Dr. S. Agbo (Lifelong Learning in Education)Dr. E. Gardner (Dept. of Aboriginal Education)Dr. A. Gilbert (Chemical & Civil Engineering)Dr. A. Gillies (Civil Engineering)Dr. S. Mansour (Electrical Engineering)Dr. S. Siddiqui (Mechanical Engineering)Dr. K. Natarajan (Engineering Software)Dr. U. Runesson (HBScF - Forestry)Dr. L. Meyer (Environmental Studies-ForestConservation Program)
LAKEHEAD UNIVERSITY ORGANIZATION - 2006/07
9
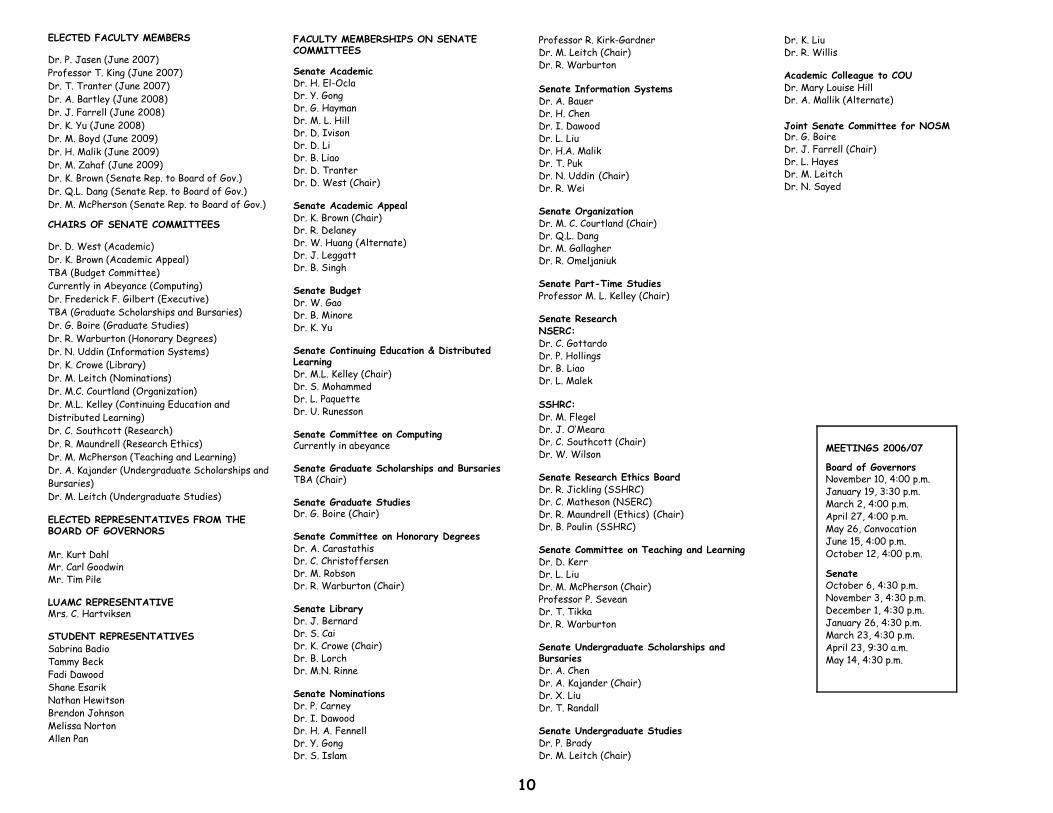
ELECTED FACULTY MEMBERS
Dr. P. Jasen (June 2007)Professor T. King (June 2007)Dr. T. Tranter (June 2007)Dr. A. Bartley (June 2008)Dr. J. Farrell (June 2008)Dr. K. Yu (June 2008)Dr. M. Boyd (June 2009)Dr. H. Malik (June 2009)Dr. M. Zahaf (June 2009)Dr. K. Brown (Senate Rep. to Board of Gov.)Dr. Q.L. Dang (Senate Rep. to Board of Gov.)Dr. M. McPherson (Senate Rep. to Board of Gov.)
CHAIRS OF SENATE COMMITTEES
Dr. D. West (Academic)Dr. K. Brown (Academic Appeal)TBA (Budget Committee)Currently in Abeyance (Computing)Dr. Frederick F. Gilbert (Executive)TBA (Graduate Scholarships and Bursaries)Dr. G. Boire (Graduate Studies)Dr. R. Warburton (Honorary Degrees)Dr. N. Uddin (Information Systems)Dr. K. Crowe (Library)Dr. M. Leitch (Nominations)Dr. M.C. Courtland (Organization)Dr. M.L. Kelley (Continuing Education andDistributed Learning)Dr. C. Southcott (Research)Dr. R. Maundrell (Research Ethics)Dr. M. McPherson (Teaching and Learning)Dr. A. Kajander (Undergraduate Scholarships andBursaries)Dr. M. Leitch (Undergraduate Studies)
ELECTED REPRESENTATIVES FROM THEBOARD OF GOVERNORS
Mr. Kurt DahlMr. Carl GoodwinMr. Tim Pile
LUAMC REPRESENTATIVEMrs. C. Hartviksen
STUDENT REPRESENTATIVESSabrina BadioTammy BeckFadi DawoodShane EsarikNathan HewitsonBrendon JohnsonMelissa NortonAllen Pan
FACULTY MEMBERSHIPS ON SENATECOMMITTEES
Senate Academic Dr. H. El-OclaDr. Y. GongDr. G. HaymanDr. M. L. HillDr. D. IvisonDr. D. LiDr. B. LiaoDr. D. TranterDr. D. West (Chair)
Senate Academic Appeal Dr. K. Brown (Chair)Dr. R. DelaneyDr. W. Huang (Alternate)Dr. J. LeggattDr. B. Singh
Senate Budget Dr. W. GaoDr. B. MinoreDr. K. Yu
Senate Continuing Education & DistributedLearningDr. M.L. Kelley (Chair)Dr. S. MohammedDr. L. PaquetteDr. U. Runesson
Senate Committee on ComputingCurrently in abeyance
Senate Graduate Scholarships and Bursaries TBA (Chair)
Senate Graduate StudiesDr. G. Boire (Chair)
Senate Committee on Honorary DegreesDr. A. CarastathisDr. C. ChristoffersenDr. M. RobsonDr. R. Warburton (Chair)
Senate Library Dr. J. BernardDr. S. CaiDr. K. Crowe (Chair)Dr. B. LorchDr. M.N. Rinne
Senate Nominations Dr. P. CarneyDr. I. DawoodDr. H. A. FennellDr. Y. GongDr. S. Islam
Professor R. Kirk-GardnerDr. M. Leitch (Chair)Dr. R. Warburton
Senate Information SystemsDr. A. BauerDr. H. ChenDr. I. DawoodDr. L. LiuDr. H.A. MalikDr. T. PukDr. N. Uddin (Chair)Dr. R. Wei
Senate Organization Dr. M. C. Courtland (Chair)Dr. Q.L. DangDr. M. GallagherDr. R. Omeljaniuk
Senate Part-Time Studies Professor M. L. Kelley (Chair)
Senate ResearchNSERC: Dr. C. GottardoDr. P. HollingsDr. B. LiaoDr. L. Malek
SSHRC: Dr. M. FlegelDr. J. O’MearaDr. C. Southcott (Chair)Dr. W. Wilson
Senate Research Ethics BoardDr. R. Jickling (SSHRC) Dr. C. Matheson (NSERC)Dr. R. Maundrell (Ethics) (Chair)Dr. B. Poulin (SSHRC)
Senate Committee on Teaching and LearningDr. D. KerrDr. L. LiuDr. M. McPherson (Chair)Professor P. SeveanDr. T. TikkaDr. R. Warburton
Senate Undergraduate Scholarships andBursariesDr. A. ChenDr. A. Kajander (Chair)Dr. X. LiuDr. T. Randall
Senate Undergraduate Studies Dr. P. BradyDr. M. Leitch (Chair)
Dr. K. LiuDr. R. Willis
Academic Colleague to COUDr. Mary Louise HillDr. A. Mallik (Alternate)
Joint Senate Committee for NOSMDr. G. BoireDr. J. Farrell (Chair)Dr. L. HayesDr. M. LeitchDr. N. Sayed
MEETINGS 2006/07
Board of GovernorsNovember 10, 4:00 p.m.January 19, 3:30 p.m.March 2, 4:00 p.m.April 27, 4:00 p.m.May 26, ConvocationJune 15, 4:00 p.m.October 12, 4:00 p.m.
SenateOctober 6, 4:30 p.m.November 3, 4:30 p.m.December 1, 4:30 p.m.January 26, 4:30 p.m.March 23, 4:30 p.m.April 23, 9:30 a.m.May 14, 4:30 p.m.
10
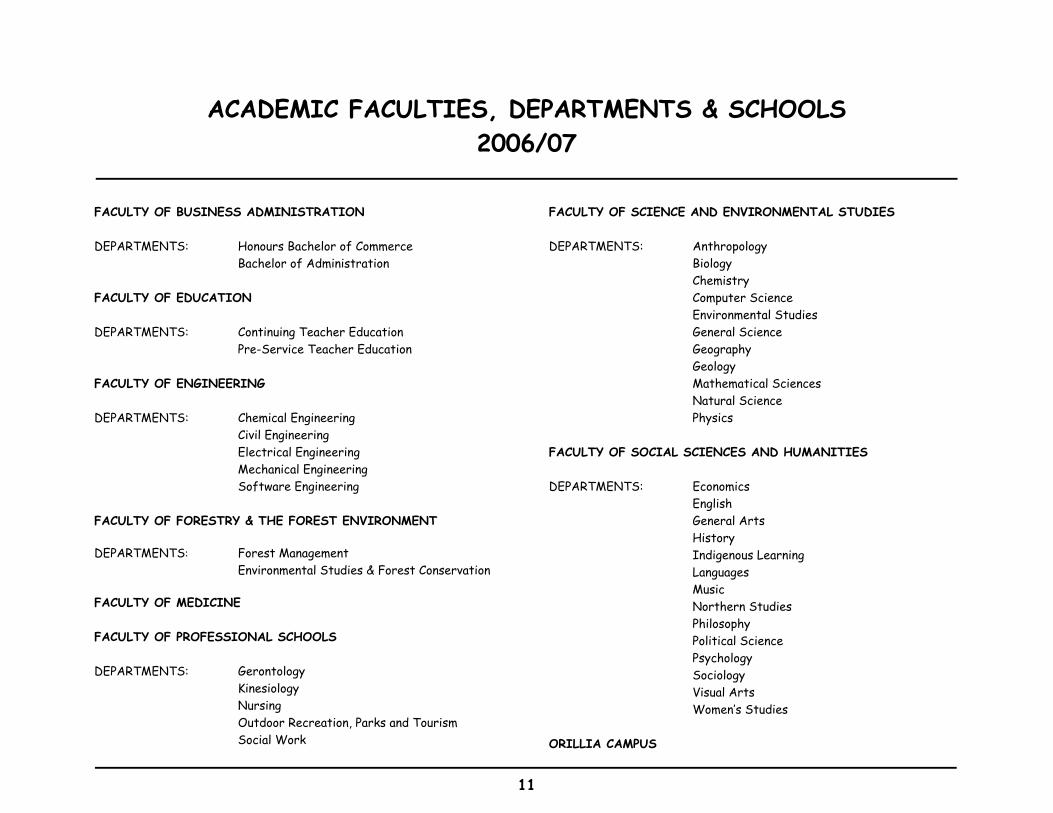
ACADEMIC FACULTIES, DEPARTMENTS & SCHOOLS2006/07
FACULTY OF BUSINESS ADMINISTRATION
DEPARTMENTS: Honours Bachelor of CommerceBachelor of Administration
FACULTY OF EDUCATION
DEPARTMENTS: Continuing Teacher EducationPre-Service Teacher Education
FACULTY OF ENGINEERING
DEPARTMENTS: Chemical EngineeringCivil EngineeringElectrical EngineeringMechanical EngineeringSoftware Engineering
FACULTY OF FORESTRY & THE FOREST ENVIRONMENT
DEPARTMENTS: Forest ManagementEnvironmental Studies & Forest Conservation
FACULTY OF MEDICINE
FACULTY OF PROFESSIONAL SCHOOLS
DEPARTMENTS: GerontologyKinesiologyNursingOutdoor Recreation, Parks and TourismSocial Work
FACULTY OF SCIENCE AND ENVIRONMENTAL STUDIES
DEPARTMENTS: AnthropologyBiologyChemistryComputer ScienceEnvironmental StudiesGeneral ScienceGeographyGeologyMathematical SciencesNatural SciencePhysics
FACULTY OF SOCIAL SCIENCES AND HUMANITIES
DEPARTMENTS: EconomicsEnglishGeneral ArtsHistoryIndigenous LearningLanguagesMusicNorthern StudiesPhilosophyPolitical SciencePsychologySociologyVisual ArtsWomen’s Studies
ORILLIA CAMPUS
11
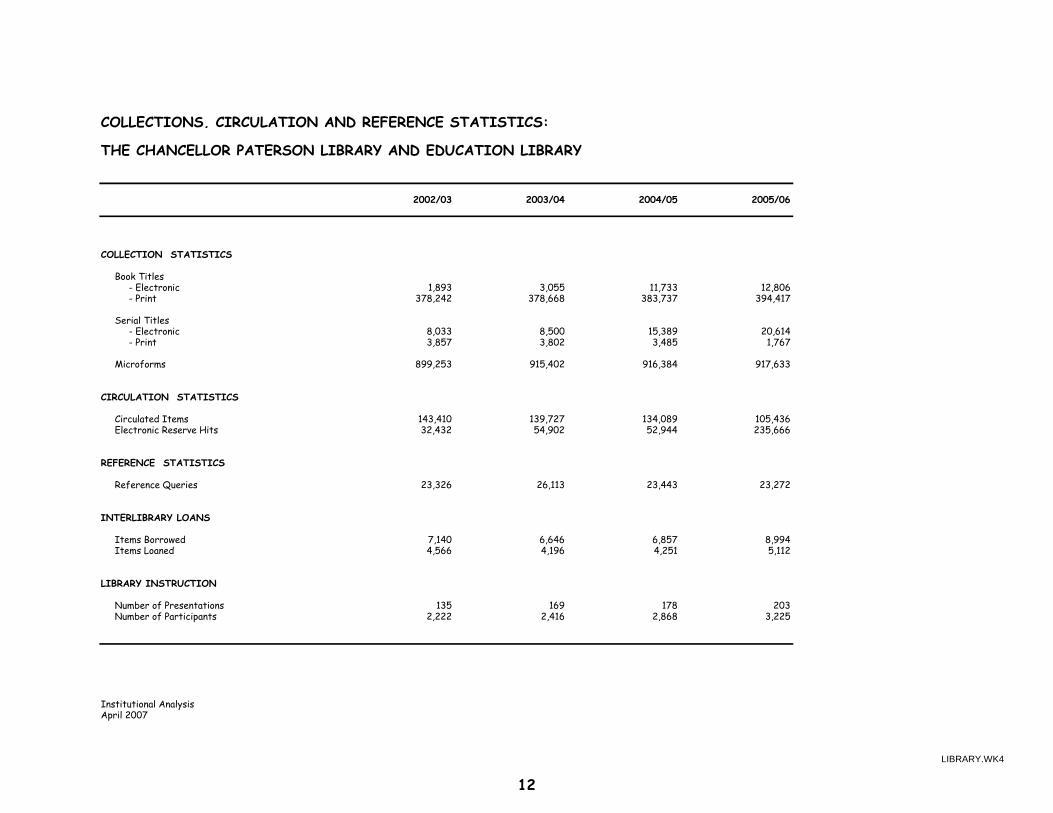
COLLECTIONS, CIRCULATION AND REFERENCE STATISTICS:
THE CHANCELLOR PATERSON LIBRARY AND EDUCATION LIBRARY
2002/03 2003/04 2004/05 2005/06
COLLECTION STATISTICS
Book Titles - Electronic 1,893 3,055 11,733 12,806 - Print 378,242 378,668 383,737 394,417
Serial Titles - Electronic 8,033 8,500 15,389 20,614 - Print 3,857 3,802 3,485 1,767
Microforms 899,253 915,402 916,384 917,633
CIRCULATION STATISTICS
Circulated Items 143,410 139,727 134,089 105,436 Electronic Reserve Hits 32,432 54,902 52,944 235,666
REFERENCE STATISTICS
Reference Queries 23,326 26,113 23,443 23,272
INTERLIBRARY LOANS
Items Borrowed 7,140 6,646 6,857 8,994 Items Loaned 4,566 4,196 4,251 5,112
LIBRARY INSTRUCTION
Number of Presentations 135 169 178 203 Number of Participants 2,222 2,416 2,868 3,225
Institutional AnalysisApril 2007
LIBRARY.WK4
12

LAKEHEAD UNIVERSITY
6000
7000
8000
9000
10000
11000
Year
BIU
s
92/93 93/94 94/95 95/96 96/97 97/98 98/99 99/00 00/01 01/02 02/03 03/04 04/05 prel
Ceiling Base Floor Actual BIU's Moving Average
BIU ComparisonActual and Moving Average
Institutional Analysis FTEBIU%.WK4
13

B.I.U. WEIGHT/FTEUNDERGRADUATE PROGRAMS: GRADUATE PROGRAMS:
MASTERS
Applied Science 2.00 Education 1.0/term, maximum 6Arts, General and 1st Year Honours 1.00Arts, Upper Year Honours 1.50 Engineering 1.3/term, maximum 8Arts, Honours (PSYC, GEOG, MATH) 2.00Bachelor of Engineering 2.00 Environmental Studies 1.3/termCommerce and Business Administration 1.50Education - Consecutive Degree 2.00 Forestry 1.3/term, maximum 8Education - 4 Year Concurrent Arts and Science 1.25Education - 5 Year Concurrent Arts 1.50 Humanities and Social Sciences 1.0/term, maximum 6Education - 5 Year Concurrent Science 1.80Forestry 2.00 Kinesiology 1.0/term, maximum 6Kinesiology 1.50Medicine 5.00 Management 1.0/termMusic 2.00Nursing 2.00 Mathematics 1.0/term, maximum 6Outdoor Recreation, Parks and Tourism 1.50Science, Environmental Studies, Upper Year Honours 2.00 Physical and Biological Sciences 1.3/term, maximum 8Science, Environmental Studies, General 1st Year Honours 1.00Social Work, 1st Year 1.00 Psychology 1.3/term, maximum 8Social Work, Upper Years 1.50Visual Arts 1.50 Public Health 1.3/term, maximum 8
Engineering Technology 1.20 Social Work 1.3/term, maximum 8
Certificates 1.00 PhD:
PsychologyForest SciencesEducation (Joint)
2.0/term, maximum 27 lessMaster's weights used
in Ontario system.
14

GLOSSARY OF ACRONYMS
ACAATO Association of Colleges of Applied Arts and
Tech nolog y of O ntario
ATAC Advanced Technology and Academic Centre
ATOP Access to Opportunities Program
ATRC Aquatic Toxicity Research Centre
AUCC Association of Universities and Colleges of
Canada
BIU Basic I ncom e Unit
CAAT College of Applied Arts and Technology
CARIS Centre for the Application of Resources
Information Systems
CAUBO Canadian Association of University Business
Officers
CAUT Canadian Association of University Teachers
CCOU Council of C hairs - Universities of On tario
CFI Canada Foundation for Innovation
CFS Canadian Federation of Students
CFS-O Canad ian Fed eratio n of S tudents - Ontario
CHST Canadian Health and Social Transfer
CIDA Canadian International Development Agency
CIHR Canadian Institutes of Health Research
CMSF Canadian Millenium Scholarship Fund
CNFER Centre for Northern Forest Ecosystem
Research
COE Centres of Excellence
COFO-UO Council of Financial Officers - Universities of
Ontario
COP Council of Presidents
COU Council of Ontario Universities
CRaNHR Centre for Rural and Northern Health Research
CSAO Council of Senior Administrative Officers
CSAO-UO Council of Se nior A dmin istrative Officers -
Universities of On tario
CSLP Canada Student Loan Program
CUCC Colleg e-Univ ersity Conso rtium Council
CUPA Committee on Univers ity Planning and Ana lysis
CUPE Canadian Union of Public Employees
CURIE Canad ian Universities Reciprocal Insurance
Exchange
EPF Established Programs Financing
FCE Full Course Equivalent
FRP Facilities Renewal Program
FT Full-time
FTE Full-Time Equivalent
ICRP Income Contingent Repayment Plan
IDRC International Development Research Centre
IRAP Industrial Research Assistance Program
IUOE International Union of Operating Engineers
LTRC Lakehead Technology and Research Centre
LUAMC Lakehead University Aboriginal Management
Council
LUCAS Lakehead University Centre for Analytical
Services
LUEL Lakehead University Environmental Laboratory
LUFA Lakehead University Faculty Association
LUPRAC Lakehead Universit y Program Review Audit
Committee
LUSU Lakehead University Student Union
15

MEDTT Ministry of Economic Development, Trade and
Tourism
MEST Ministry of Energy, Science and Technology
MRC Medical Research Council of Canada
MTCU Ministry of Training, Colleges & Universities
NCE Networks of Centres of Excellence
NECAH Northern Educational Centre for Aging & Health
NOMP Northwestern Ontario Medical Program
NOSM Northern Ontario Schoo l of Medicine
NOTC Northwestern Ontario Technology Centre
NRC Natio nal Res earch Cou ncil
NSERC Natural Sciences & Engineering Research
Council of Canada
OAC Ontario Ac adem ic Cre dit
OCAV Ontario Council of Academic Vice-Presidents
OCGS Ontario Council on Graduate Studies
OCSA Ontario Council on Student Affairs
OCUFA Ontario Council of U niversity Faculty
Associations
OIT Ontario Innovation Tru st
OPAS Office for Par tnersh ips for A dvance d Skills
OPEIU Office & Professional Employees International
Union
ORDCF Ontario Research & Development Challenge
Fund
OSAP Ontario Student Assistance Program
OUAC Ontario Universities’ Application Centre
OUCA Ontario Universities’ Council on Admissions
OURA Ontario Universities’ Registrars’ Association
PREA Premier’s Research Excellence Awards
PT Part-time
ROIE Research Overhead Infrastructure Envelope
RPF Research Performance Fund
SEIU Service Employees International Union
SSHRC Social Sciences & Humanities Resea rch C ounc il
of Canada
UCASS University and Colleg e Academic Staff System
(Stats Canada)
USWA United Steelworkers of America
16

SECTION 2 - STUDENT DATA
FTE/BIU History
Degrees Awarded by Program
Full-time and Part-time Enrolment by Majors
Enrolment by Gender, Registration Status and Level, Fall 2006
Enrolment by Gender, 1996 to 2006
Enrolment by Level and Registration Status, 1990 to 2006
Age Distribution of Registered Applicants, 1995/96 to 2006/07
Geographic Distribution of Full-time Registrants
Applicant/Registrant Data
Analyses of Total and First Choice Applications & Registrations
Undergraduate Class Sizes

FTE/BIU HISTORYYEAR 1995/96 1996/97 1997/98 1998/99 1999/00 2000/01 2001/02 2002/03 2003/04 2004/05 2005/06 2006/07
UNDERGRADFTEs - Eligible (for funding) 6,271 5,834 5,904 5,635 5,443 5,295 5,282 5,525 6,072 6,256 6,292 6,178FTEs - Ineligible 41 159 176 180 134 145 171 193 315 358 359 430
BIUs - Eligible 8,742 8,202 8,403 8,038 7,865 7,732 7,746 8,076 8,966 9,602 9,757 9,590BIUs - Ineligible 48 253 289 268 208 228 272 329 553 647 682 805
GRADUATE
FTEs - Eligible 561 465 458 499 497 429 459 542 722 807 1,036 940FTEs - Ineligible 176 192 213 187 186 178 165 144 127 161 269 326
BIUs - Eligible 651 533 535 605 609 547 594 696 909 1,032 1,330 1,227BIUs - Ineligible 207 235 255 218 212 201 193 176 149 175 227 412
TOTALFTEs - Eligible 6,831 6,299 6,362 6,135 5,940 5,724 5,741 6,067 6,794 7,063 7,328 7,118FTEs - Ineligible 216 350 389 367 320 323 336 337 442 519 628 756BIUs - Eligible 9,393 8,735 8,939 8,644 8,474 8,280 8,340 8,772 9,875 10,634 11,087 10,817BIUs - Ineligible 254 489 544 486 421 429 464 506 703 823 909 1,218
Total FTEs 7,047 6,649 6,751 6,501 6,260 6,047 6,077 6,404 7,236 7,581 7,956 7,874
Total BIUs 9,647 9,223 9,483 9,129 8,894 8,709 8,804 9,277 10,578 11,457 11,996 12,035
BIU/FTE Ratio 1.37 1.39 1.41 1.41 1.43 1.45 1.45 1.45 1.45 1.51 1.51 1.52
ACTUAL INSTITUTION TOTALS(eligible only)Min/Max Adjustments (included in total) 3.99 9.17 4.81 5.70 8.06 -0.38 8.74 -1.56 0.00 0.00 34.60 12.67BIUs 9,393 8,735 8,939 8,644 8,474 8,280 8,340 8,770 9,875 10,634 11,122 10,830
Source: MTCU Summary Report of USIS-UAR
5 YEAR MOVING AVERAGE BIUs Corridor base (as at 2002) 7,304
1990/91 6,7871991/92 7,164 1992/93 7,535 1993/94 7,908 1994/95 8,2351995/96 8,8261996/97 9,1971997/98 9,2881998/99 9,2711999/00 9,0912000/01 8,8372001/02 8,6142002/03 8,5352003/04 8,5012004/05 8,7482005/06 9,1802006/07 9,748
Institutional Analysis FTEHIS06.WK4
18

DEGREES AWARDED BY PROGRAMFaculty of Science & Environmental Studies 1992 1993 1994 1995 1996 1997 1998 1999 2000 2001 2002 2003 2004 2005 2006
Anthropology Arts B.A. 2 2 10 19 11 24 8 17 12 11 8 10 4 6 5
B.A. 4 Year - - - - - - 1 0 0 0 1 2 0 0 0H.B.A. 1 2 3 2 7 4 7 3 3 3 0 1 1 4 3
Science B.Sc. - 1 0 0 4 8 9 2 3 2 3 0 2 0 1B.Sc. 4 Year - - - - 1 0 0 0 0 0 0 0 0 1 0H.B.Sc. - - - - 1 3 7 2 6 4 2 4 2 4 3
Biology B.Sc. 15 18 21 23 31 28 33 46 31 26 21 25 12 6 13B.Sc. 4 Year 0 0 0 4 1 1 1 4 0 0 3 1 2 2 3H.B.Sc. 13 13 12 14 14 24 9 13 20 22 20 21 33 21 45M.Sc. 2 4 3 5 6 10 1 3 4 3 4 8 12 8 10
Chemistry B.Sc. 8 3 6 3 8 10 3 5 2 2 4 0 4 3 6H.B.Sc. 5 4 4 3 4 2 8 3 7 9 1 4 2 1 9M.Sc. 0 1 1 3 0 2 1 1 0 2 1 0 3 4 0
Computer Science B.Sc. 1 4 2 5 1 7 12 8 19 15 19 6 9 1 4B.Sc. 4 Year 0 0 2 1 1 1 3 4 0 1 0 3 1 1 1H.BSc. 4 1 3 3 7 3 16 5 8 13 13 11 9 8 6
Environmental Studies H.B.E.S. - - - - - - - - - - 1 4 6 4 5H.B.E.Sc. - - - - - - - - - - 1 6 9 3 9
General Science B.Sc. 7 10 18 26 30 27 31 17 24 19 16 17 13 19 13
Geography Arts B.A. 19 30 40 87 97 59 87 79 73 38 72 80 70 80 59
H.B.A. 2 11 10 14 13 16 10 8 10 2 6 4 13 14 10 Science B.Sc. 0 1 1 5 2 6 6 7 1 0 3 0 0 1 2
H.B.Sc. 1 3 1 1 0 3 2 2 3 0 2 0 0 1 0Certificate 1 1 29 37 22 22 26 19 6 16 1 11 16 35 42
Geology B.Sc. 0 0 0 0 0 0 0 0 0 7 1 3 3 1 1B.Sc. 4 Year 3 2 2 0 2 0 1 5 1 1 3 0 2 1 0H.B.Sc. 3 1 4 1 0 3 2 4 1 4 8 6 0 4 1M.Sc. 0 2 1 3 2 1 2 2 1 1 1 2 2 3 4
19
DEGREES AWARDED BY PROGRAMFaculty of Science & Environmental Studies 1992 1993 1994 1995 1996 1997 1998 1999 2000 2001 2002 2003 2004 2005 2006
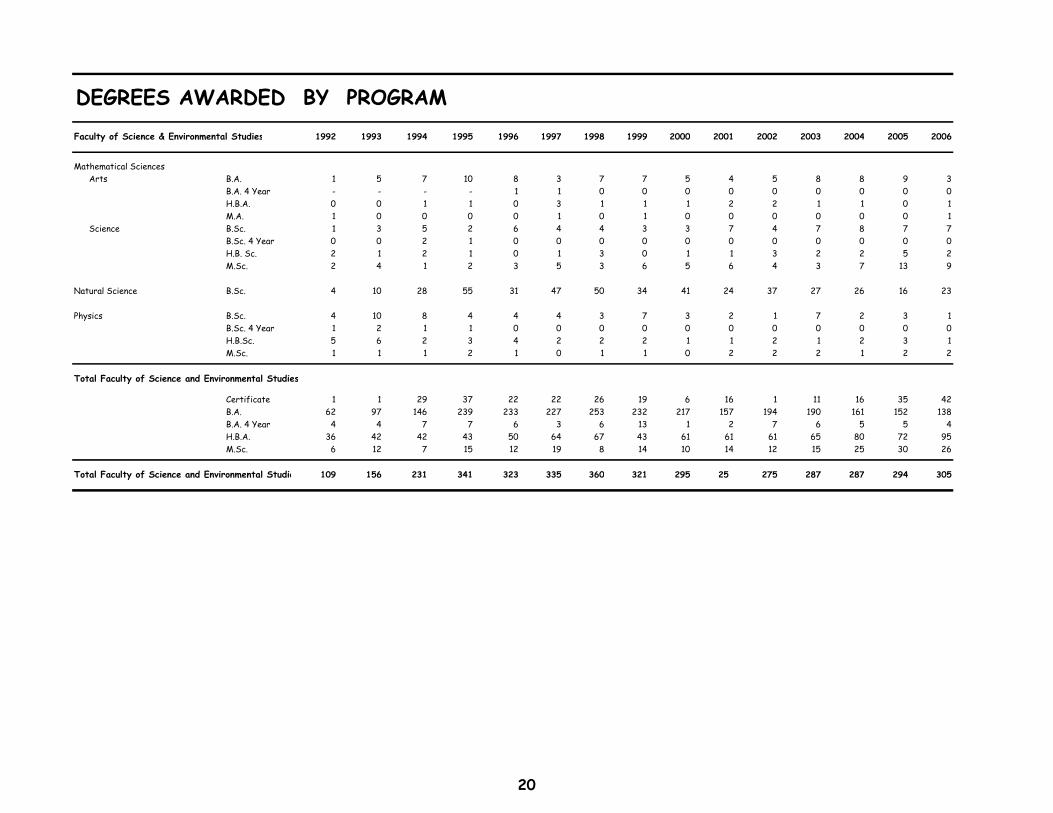
Mathematical Sciences Arts B.A. 1 5 7 10 8 3 7 7 5 4 5 8 8 9 3
B.A. 4 Year - - - - 1 1 0 0 0 0 0 0 0 0 0H.B.A. 0 0 1 1 0 3 1 1 1 2 2 1 1 0 1M.A. 1 0 0 0 0 1 0 1 0 0 0 0 0 0 1
Science B.Sc. 1 3 5 2 6 4 4 3 3 7 4 7 8 7 7B.Sc. 4 Year 0 0 2 1 0 0 0 0 0 0 0 0 0 0 0H.B. Sc. 2 1 2 1 0 1 3 0 1 1 3 2 2 5 2M.Sc. 2 4 1 2 3 5 3 6 5 6 4 3 7 13 9
Natural Science B.Sc. 4 10 28 55 31 47 50 34 41 24 37 27 26 16 23
Physics B.Sc. 4 10 8 4 4 4 3 7 3 2 1 7 2 3 1B.Sc. 4 Year 1 2 1 1 0 0 0 0 0 0 0 0 0 0 0H.B.Sc. 5 6 2 3 4 2 2 2 1 1 2 1 2 3 1M.Sc. 1 1 1 2 1 0 1 1 0 2 2 2 1 2 2
Total Faculty of Science and Environmental Studies
Certificate 1 1 29 37 22 22 26 19 6 16 1 11 16 35 42B.A. 62 97 146 239 233 227 253 232 217 157 194 190 161 152 138B.A. 4 Year 4 4 7 7 6 3 6 13 1 2 7 6 5 5 4H.B.A. 36 42 42 43 50 64 67 43 61 61 61 65 80 72 95M.Sc. 6 12 7 15 12 19 8 14 10 14 12 15 25 30 26
Total Faculty of Science and Environmental Studie 109 156 231 341 323 335 360 321 295 25 275 287 287 294 305
20

DEGREES AWARDED BY PROGRAMFaculty of Social Sciences & Humanities 1992 1993 1994 1995 1996 1997 1998 1999 2000 2001 2002 2003 2004 2005 2006
Economics B.A. 25 13 9 10 12 4 3 4 5 0 4 6 1 7 6H.B.A. 11 4 3 5 2 0 2 2 1 2 3 2 0 2 8M.A. 5 5 6 5 3 2 2 2 4 8 3 4 9 4 4
English B.A. 29 43 71 67 55 53 61 47 73 46 68 56 80 60 67H.B.A. 11 18 10 27 28 20 10 16 13 11 27 23 7 32 38M.A. 4 6 3 6 6 9 7 7 4 7 6 7 7 3 3
General Arts B.A. 53 68 82 66 85 74 78 59 61 54 56 35 28 43 53
History B.A. 20 30 39 47 52 48 36 40 48 43 67 60 54 61 55H.B.A. 3 8 7 6 10 17 7 9 5 6 11 7 13 13 25M.A. 0 3 5 1 2 0 1 3 1 1 3 1 2 0 1
Indigenous Learning B.A. - - - 4 1 9 6 6 11 10 10 5 13 12 16H.B.A. - - - - 1 1 3 0 1 0 0 1 0 2 1Certificate - - - 2 2 1 0 2 1 1 4 0 1 2 0
Languages French B.A. 9 26 28 33 31 25 25 17 12 18 21 19 15 9 9
H.B.A. 5 2 5 5 3 8 4 2 3 2 3 2 3 7 4Certificate - - - - - - - 1 0 0 1 0 0 0 1
Library & Information Studies B.A. 2 2 0 1 0 0 0 0 0 0 0 0 0 0 0Diploma 7 12 13 23 13 9 15 12 5 12 3 2 1 0 0Certificate 0 0 0 0 0 0 0 0 0 0 0 0 0 0 0
Medical Lab Science H.B.Sc. 3 1 8 5 11 10 7 3 0 0 0 0 0 0 0Certificate 0 0 0 0 0 0 4 0 0 0 0 0 0 0 0
Music H.B.A. Mus. 0 0 0 0 0 0 0 0 0 4 1 0 2 4 3H.B.A. Mus. Dip. 1 0 0H.B.Mus. 0 5 5 6 10 7 13 10 7 2 5 5 4 3 6
21
DEGREES AWARDED BY PROGRAMFaculty of Social Sciences and Humanities 1992 1993 1994 1995 1996 1997 1998 1999 2000 2001 2002 2003 2004 2005 2006
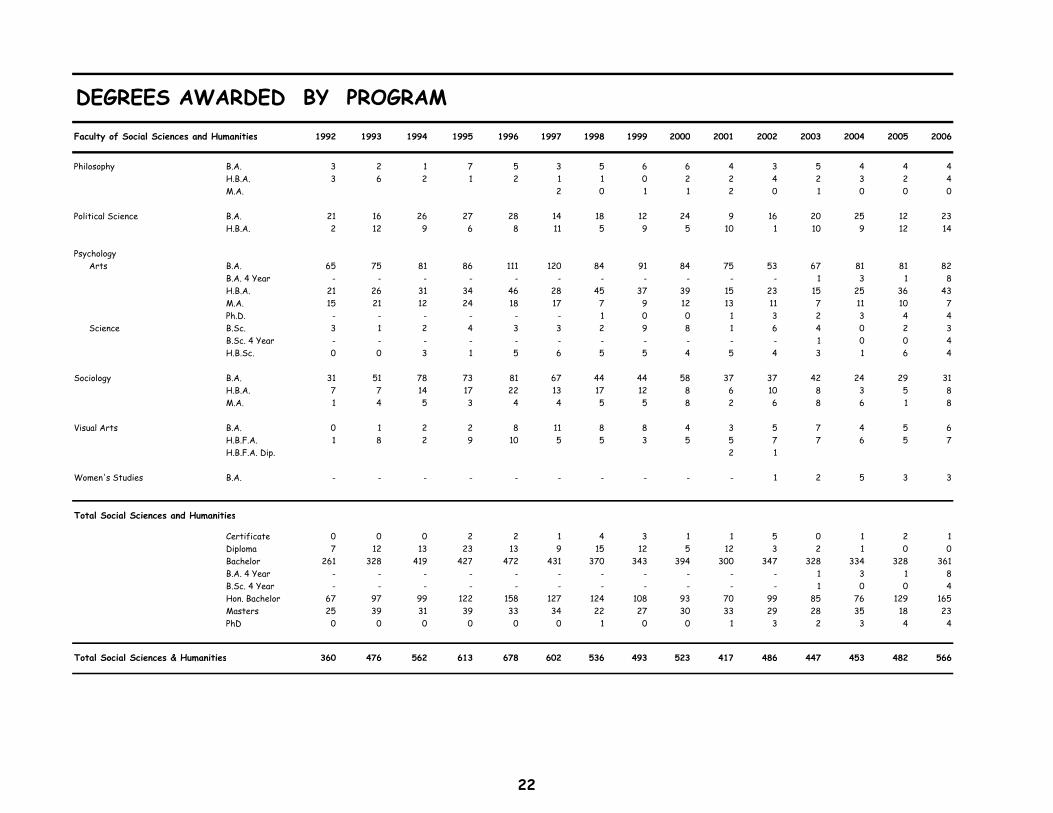
Philosophy B.A. 3 2 1 7 5 3 5 6 6 4 3 5 4 4 4H.B.A. 3 6 2 1 2 1 1 0 2 2 4 2 3 2 4M.A. 2 0 1 1 2 0 1 0 0 0
Political Science B.A. 21 16 26 27 28 14 18 12 24 9 16 20 25 12 23H.B.A. 2 12 9 6 8 11 5 9 5 10 1 10 9 12 14
Psychology Arts B.A. 65 75 81 86 111 120 84 91 84 75 53 67 81 81 82
B.A. 4 Year - - - - - - - - - - - 1 3 1 8H.B.A. 21 26 31 34 46 28 45 37 39 15 23 15 25 36 43M.A. 15 21 12 24 18 17 7 9 12 13 11 7 11 10 7Ph.D. - - - - - - 1 0 0 1 3 2 3 4 4
Science B.Sc. 3 1 2 4 3 3 2 9 8 1 6 4 0 2 3B.Sc. 4 Year - - - - - - - - - - - 1 0 0 4H.B.Sc. 0 0 3 1 5 6 5 5 4 5 4 3 1 6 4
Sociology B.A. 31 51 78 73 81 67 44 44 58 37 37 42 24 29 31H.B.A. 7 7 14 17 22 13 17 12 8 6 10 8 3 5 8M.A. 1 4 5 3 4 4 5 5 8 2 6 8 6 1 8
Visual Arts B.A. 0 1 2 2 8 11 8 8 4 3 5 7 4 5 6H.B.F.A. 1 8 2 9 10 5 5 3 5 5 7 7 6 5 7H.B.F.A. Dip. 2 1
Women's Studies B.A. - - - - - - - - - - 1 2 5 3 3
Total Social Sciences and Humanities
Certificate 0 0 0 2 2 1 4 3 1 1 5 0 1 2 1Diploma 7 12 13 23 13 9 15 12 5 12 3 2 1 0 0Bachelor 261 328 419 427 472 431 370 343 394 300 347 328 334 328 361B.A. 4 Year - - - - - - - - - - - 1 3 1 8B.Sc. 4 Year - - - - - - - - - - - 1 0 0 4Hon. Bachelor 67 97 99 122 158 127 124 108 93 70 99 85 76 129 165Masters 25 39 31 39 33 34 22 27 30 33 29 28 35 18 23PhD 0 0 0 0 0 0 1 0 0 1 3 2 3 4 4
Total Social Sciences & Humanities 360 476 562 613 678 602 536 493 523 417 486 447 453 482 566
22

DEGREES AWARDED BY PROGRAM
Faculty of Professional Schools 1992 1993 1994 1995 1996 1997 1998 1999 2000 2001 2002 2003 2004 2005 2006
Gerontology B.A. - - - - - - - - - - - 4 3 1 3H.B.A. - - - - - - - - - - 1 0 0 1 1Certificate - - - - - - - - - - - - 2 11 14
Kinesiology Honours Bachelor PE H.B.P.E. 28 45 49 4 0 0 0 0 0 0 0 0 0 0 0 Honours Bachelor Kinesiology H.B.K. - - - 38 70 56 80 71 92 70 46 59 64 41 38 MA/MSc. Coaching MA./M.Sc. 4 3 4 3 7 7 5 4 6 9 6 4 3 3 6
Nursing Bachelor of Science B.Sc. - - - 6 48 53 35 43 35 35 27 67 76 88 135 Honours Bachelor Science H.B.Sc. 67 94 57 65 3 0 0 0 0 0 0 0 0 0 0
Certificate - - - - - - 10 20 23 23 18 14 7 11 24
Outdoor Recreation HBOR 52 35 32 82 64 60 73 86 85 97 88 62 69 48 60Certificate - - 15 31 27 21 8 33 34 32 18 5 0 1 0MES - NREC - - - - - - - - - - - - - 1 3
Social Work H.B.S.W. 47 39 48 44 41 47 48 47 37 48 47 44 59 48 50M.S.W. 0 2 3 6 15 13 11 13 14 9 14 10 17 14 11
Master of Public Health M.P.H. - - - - - - - - - - - - 3 20 21
Total Professional Schools
Certificate - - 15 31 27 21 18 53 57 55 36 19 9 23 38Bachelor - - - 6 48 53 35 43 35 35 27 71 79 89 138Hon. Bachelor 194 213 186 233 178 163 201 204 214 215 182 165 192 138 149Masters 4 5 7 9 22 20 16 17 20 18 20 14 23 38 41
Total Professional Schools 198 218 208 279 275 257 270 317 326 323 265 269 303 288 366
23
DEGREES AWARDED BY PROGRAMFaculty of Business Administration 1992 1993 1994 1995 1996 1997 1998 1999 2000 2001 2002 2003 2004 2005 2006
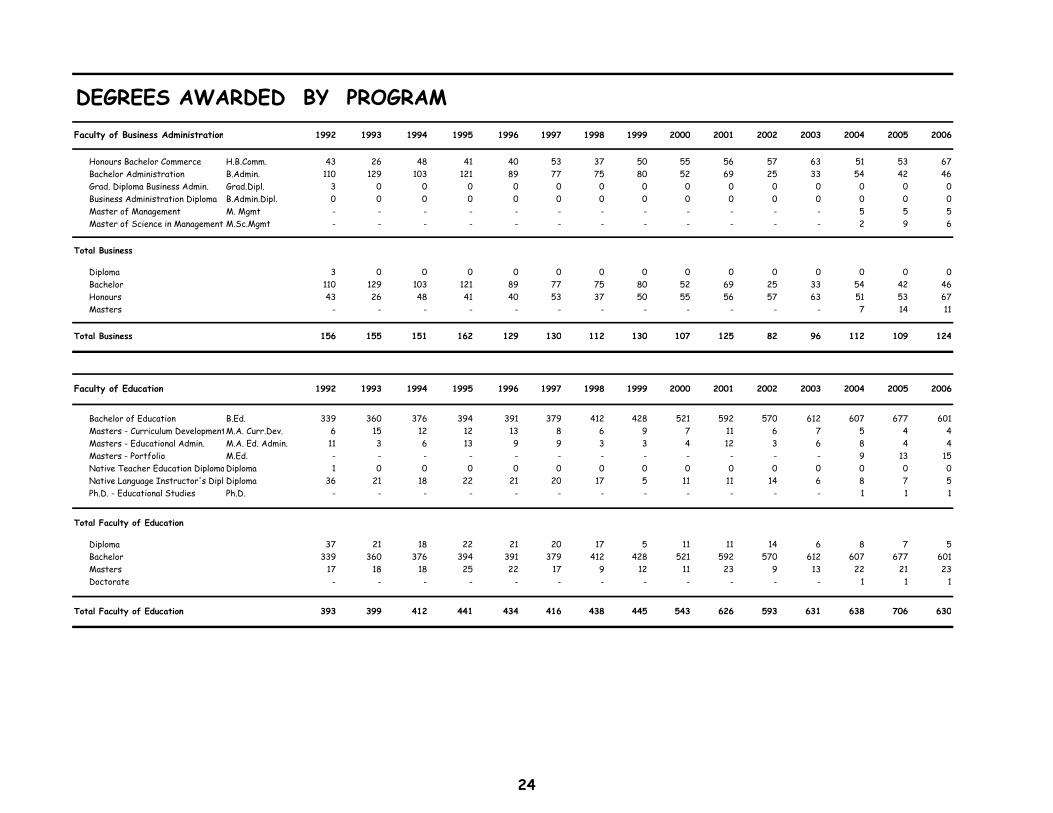
Honours Bachelor Commerce H.B.Comm. 43 26 48 41 40 53 37 50 55 56 57 63 51 53 67 Bachelor Administration B.Admin. 110 129 103 121 89 77 75 80 52 69 25 33 54 42 46 Grad. Diploma Business Admin. Grad.Dipl. 3 0 0 0 0 0 0 0 0 0 0 0 0 0 0 Business Administration Diploma B.Admin.Dipl. 0 0 0 0 0 0 0 0 0 0 0 0 0 0 0 Master of Management M. Mgmt - - - - - - - - - - - - 5 5 5 Master of Science in Management M.Sc.Mgmt - - - - - - - - - - - - 2 9 6
Total Business
Diploma 3 0 0 0 0 0 0 0 0 0 0 0 0 0 0 Bachelor 110 129 103 121 89 77 75 80 52 69 25 33 54 42 46 Honours 43 26 48 41 40 53 37 50 55 56 57 63 51 53 67 Masters - - - - - - - - - - - - 7 14 11
Total Business 156 155 151 162 129 130 112 130 107 125 82 96 112 109 124
Faculty of Education 1992 1993 1994 1995 1996 1997 1998 1999 2000 2001 2002 2003 2004 2005 2006
Bachelor of Education B.Ed. 339 360 376 394 391 379 412 428 521 592 570 612 607 677 601 Masters - Curriculum DevelopmentM.A. Curr.Dev. 6 15 12 12 13 8 6 9 7 11 6 7 5 4 4 Masters - Educational Admin. M.A. Ed. Admin. 11 3 6 13 9 9 3 3 4 12 3 6 8 4 4 Masters - Portfolio M.Ed. - - - - - - - - - - - - 9 13 15 Native Teacher Education Diploma Diploma 1 0 0 0 0 0 0 0 0 0 0 0 0 0 0 Native Language Instructor's Dipl Diploma 36 21 18 22 21 20 17 5 11 11 14 6 8 7 5 Ph.D. - Educational Studies Ph.D. - - - - - - - - - - - - 1 1 1
Total Faculty of Education
Diploma 37 21 18 22 21 20 17 5 11 11 14 6 8 7 5 Bachelor 339 360 376 394 391 379 412 428 521 592 570 612 607 677 601 Masters 17 18 18 25 22 17 9 12 11 23 9 13 22 21 23 Doctorate - - - - - - - - - - - - 1 1 1
Total Faculty of Education 393 399 412 441 434 416 438 445 543 626 593 631 638 706 630
24
DEGREES AWARDED BY PROGRAMFaculty of Engineering 1992 1993 1994 1995 1996 1997 1998 1999 2000 2001 2002 2003 2004 2005 2006
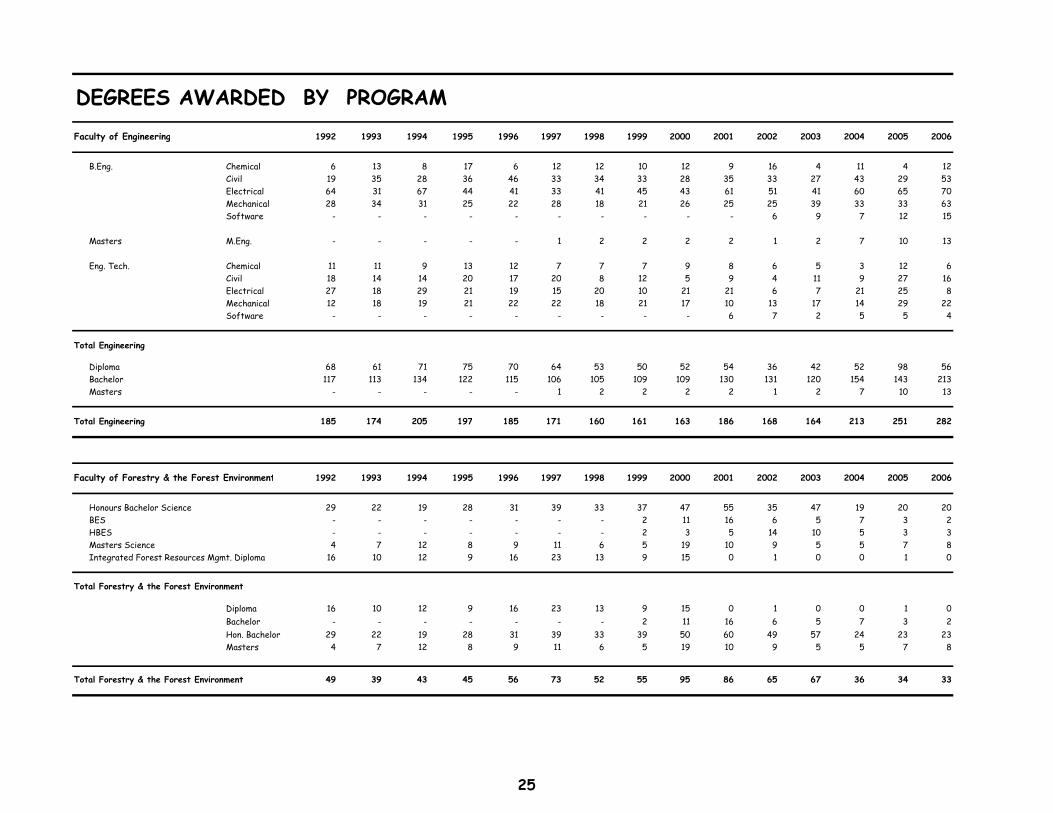
B.Eng. Chemical 6 13 8 17 6 12 12 10 12 9 16 4 11 4 12Civil 19 35 28 36 46 33 34 33 28 35 33 27 43 29 53Electrical 64 31 67 44 41 33 41 45 43 61 51 41 60 65 70Mechanical 28 34 31 25 22 28 18 21 26 25 25 39 33 33 63Software - - - - - - - - - - 6 9 7 12 15
Masters M.Eng. - - - - - 1 2 2 2 2 1 2 7 10 13 Eng. Tech. Chemical 11 11 9 13 12 7 7 7 9 8 6 5 3 12 6
Civil 18 14 14 20 17 20 8 12 5 9 4 11 9 27 16Electrical 27 18 29 21 19 15 20 10 21 21 6 7 21 25 8Mechanical 12 18 19 21 22 22 18 21 17 10 13 17 14 29 22Software - - - - - - - - - 6 7 2 5 5 4
Total Engineering
Diploma 68 61 71 75 70 64 53 50 52 54 36 42 52 98 56 Bachelor 117 113 134 122 115 106 105 109 109 130 131 120 154 143 213 Masters - - - - - 1 2 2 2 2 1 2 7 10 13
Total Engineering 185 174 205 197 185 171 160 161 163 186 168 164 213 251 282
Faculty of Forestry & the Forest Environment 1992 1993 1994 1995 1996 1997 1998 1999 2000 2001 2002 2003 2004 2005 2006
Honours Bachelor Science 29 22 19 28 31 39 33 37 47 55 35 47 19 20 20 BES - - - - - - - 2 11 16 6 5 7 3 2 HBES - - - - - - - 2 3 5 14 10 5 3 3 Masters Science 4 7 12 8 9 11 6 5 19 10 9 5 5 7 8 Integrated Forest Resources Mgmt. Diploma 16 10 12 9 16 23 13 9 15 0 1 0 0 1 0
Total Forestry & the Forest Environment
Diploma 16 10 12 9 16 23 13 9 15 0 1 0 0 1 0Bachelor - - - - - - - 2 11 16 6 5 7 3 2Hon. Bachelor 29 22 19 28 31 39 33 39 50 60 49 57 24 23 23Masters 4 7 12 8 9 11 6 5 19 10 9 5 5 7 8
Total Forestry & the Forest Environment 49 39 43 45 56 73 52 55 95 86 65 67 36 34 33
25

DEGREES AWARDED BY PROGRAM
TOTAL UNIVERSITY 1992 1993 1994 1995 1996 1997 1998 1999 2000 2001 2002 2003 2004 2005 2006
Certificate 1 1 44 70 51 44 48 75 64 72 42 30 26 60 81Diploma 131 104 114 129 120 116 98 76 83 77 56 50 61 106 61Bachelor 889 1027 1178 1309 1348 1273 1250 1237 1339 1299 1300 1359 1396 1434 1499Bachelor 4 Yr 4 4 7 7 6 3 6 13 1 2 7 8 8 6 16Hon. Bachelor 369 400 394 467 457 446 462 444 473 462 447 435 423 415 499Masters 56 81 75 96 98 102 63 77 92 100 80 77 124 138 145PhD 0 0 0 0 0 0 1 0 0 1 3 2 4 5 5
TOTAL UNIVERSITY 1,450 1,617 1,812 2,078 2,080 1,984 1,928 1,922 2,052 2,013 1,935 1,961 2,042 2,164 2,306
NOTES: 1. Reported by calendar year.2. Native Teacher Education Diploma has been discontinued. The program is now a BA/BEd degree and is included in the Bachelor of Education data.3. Concurrent degrees are counted twice, for example, HBOR/BSc is counted as an HBOR degree and a Natural Science BSc. BA/BEd and BSc/BEd are included in Arts & Science and in the BEd program.
Institutional AnalysisFebruary 2007
26

FULL-TIME ENROLMENT BY MAJORS - FALL/WINTER
UNDERGRADUATE GRADUATE TOTAL
DEPARTMENT 97/98 98/99 99/00 00/01 01/02 02/03 03/04 04/05 05/06 06/07 97/98 98/99 99/00 00/01 01/02 02/03 03/04 04/05 05/06 06/07 97/98 98/99 99/00 00/01 01/02 02/03 03/04 04/05 05/06 06/07
Anthropology 93 70 56 45 32 46 49 55 39 28 0 0 0 0 0 0 0 0 0 0 93 70 56 45 32 46 49 55 39 28Biology 200 188 164 147 141 127 193 158 191 217 8 13 9 15 19 31 29 32 29 29 208 201 173 162 160 158 222 190 220 246 Natural Science 44 46 29 22 22 45 27 76 45 20 0 0 0 0 0 0 0 0 0 0 44 46 29 22 22 45 27 76 45 20Business Administration 436 449 385 373 338 342 398 409 396 409 0 0 0 0 0 0 21 16 10 7 436 449 385 373 338 342 419 425 406 416Chemistry 31 31 22 32 15 17 31 25 28 31 3 3 2 2 3 5 8 8 5 4 34 34 24 34 18 22 39 33 33 35Economics 17 17 19 20 15 25 32 33 26 15 5 7 14 10 11 12 9 12 17 19 22 24 33 30 26 37 41 45 43 34Education 1,009 1,056 1,183 1,248 1,374 1,428 1,461 1,583 1,591 1,691 23 24 21 12 18 30 34 34 43 58 1,032 1,080 1,204 1,260 1,392 1,458 1,495 1,617 1,634 1,749Engineering 457 458 504 495 479 531 634 686 708 637 5 4 7 6 10 16 23 27 40 34 462 462 511 501 489 547 657 713 748 671English 84 80 73 69 81 97 146 156 153 117 15 11 12 10 13 16 20 13 16 19 99 91 85 79 94 113 166 169 169 136Environmental Studies - 10 29 46 52 63 69 73 61 49 - - - - - - - 7 9 16 - 10 29 46 52 63 69 80 70 65Forestry/Forest Conservation 267 313 266 231 183 152 114 118 116 107 33 31 18 18 21 22 26 26 27 43 300 344 284 249 204 174 140 144 143 150General/Undecided/Special 395 377 384 356 268 311 324 321 283 291 0 0 0 0 0 0 1 0 0 0 395 377 384 356 268 311 325 321 283 291Geography 122 81 64 64 64 82 105 104 77 65 0 0 0 0 0 0 0 0 0 0 122 81 64 64 64 82 105 104 77 65Geology 16 28 28 25 24 18 17 19 40 44 2 4 3 3 6 6 7 9 10 9 18 32 31 28 30 24 24 28 50 53Gerontology 4 6 12 10 0 0 0 0 4 6 12 10History 66 56 49 60 88 85 114 109 84 73 8 9 9 8 7 5 3 7 12 16 74 65 58 68 95 90 117 116 96 89Indigenous Learning 31 24 20 21 22 24 25 26 27 21 0 0 0 0 0 0 0 0 0 0 31 24 20 21 22 24 25 26 27 21Kinesiology 373 321 313 286 230 236 259 242 238 218 16 18 18 12 10 10 9 14 12 17 389 339 331 298 240 246 268 256 250 235Languages 13 15 8 14 16 18 17 14 17 14 0 0 0 0 0 0 0 0 0 0 13 15 8 14 16 18 17 14 17 14Lib & Info Studies 0 0 0 4 1 0 0 0 0 0 0 0 0 0 0 0 0 0 0 0 0 0 0 4 1 0 0 0 0 0 Library Tech 26 14 3 0 0 0 0 0 0 0 0 0 0 0 0 0 0 0 0 0 26 14 3 0 0 0 0 0 0 0Mathematics 21 17 18 17 15 25 37 27 27 24 16 18 12 8 9 11 24 29 28 19 37 35 30 25 24 36 61 56 55 43 Computer Science 114 125 98 113 87 66 54 49 45 34 0 0 0 0 0 0 0 0 0 0 114 125 98 113 87 66 54 49 45 34Medical Lab Science 9 2 0 0 0 0 0 0 0 0 0 0 0 0 0 0 0 0 0 0 9 2 0 0 0 0 0 0 0 0Medicine - - - - - - - - 24 48 0 0 24 48Music 47 33 31 26 28 33 34 40 37 33 0 0 0 0 0 0 0 0 0 0 47 33 31 26 28 33 34 40 37 33Northern Studies 1Nursing 141 124 118 127 197 268 381 472 504 511 0 0 0 0 0 1 1 1 1 18 141 124 118 127 197 269 382 473 505 529Orillia 103Outdoor Recreation 457 466 407 387 330 301 306 243 189 139 0 0 0 0 0 0 0 0 0 0 457 466 407 387 330 301 306 243 189 139Philosophy 13 19 20 20 20 15 22 29 27 25 6 4 3 2 1 1 0 0 0 0 19 23 23 22 21 16 22 29 27 25Physics 26 20 15 23 23 23 28 27 21 17 3 2 3 4 2 3 2 4 6 5 29 22 18 27 25 26 30 31 27 22Political Science 76 72 76 66 62 82 102 111 134 121 0 0 0 0 0 0 0 0 0 0 76 72 76 66 62 82 102 111 134 121Psychology 335 273 213 195 198 223 287 300 288 255 34 33 43 39 39 41 39 45 48 47 369 306 256 234 237 264 326 345 336 302Public Health (MPH) excl. Nursing 11 26 38 55 0 0 0 0 11 26 38 55Social Work 168 150 117 123 145 130 175 170 152 158 21 24 18 17 14 13 18 23 22 27 189 174 135 140 159 143 193 193 174 185Sociology 125 89 86 68 74 67 59 52 69 65 21 20 20 16 17 15 13 9 12 11 146 109 106 84 91 82 72 61 81 76Visual Arts 56 59 49 47 38 39 44 43 45 46 0 0 0 0 0 0 0 0 0 0 56 59 49 47 38 39 44 43 45 46Women's Studies 4 5 8 3 0 0 0 0 4 5 8 3
TOTAL UNIVERSITY 5,268 5,083 4,847 4,770 4,662 4,919 5,552 5,781 5,702 5,640 219 225 212 182 200 238 298 342 385 453 5,487 5,308 5,059 4,952 4,862 5,157 5,850 6,123 6,087 5,989
NOTES : 1. Enrolment counts are based on November headcounts. 2. Students pursuing more than one degree are counted only once. 3. All dual degree students in HBOR and Education are counted in the Professional program. 4. Nursing Transition students are enrolled as Special Students in General/Undecided/Special.
ENROLMNT.WK4
27

PART-TIME ENROLMENT BY MAJORS - FALL/WINTER
UNDERGRADUATE GRADUATE TOTAL
DEPARTMENT 97/98 98/99 99/00 00/01 01/02 02/03 03/04 04/05 05/06 06/07 97/98 98/99 99/00 00/01 01/02 02/03 03/04 04/05 05/06 06/07 97/98 98/99 99/00 00/01 01/02 02/03 03/04 04/05 05/06 06/07
Anthropology 16 10 21 10 16 9 10 8 11 10 0 0 0 0 0 0 0 0 0 0 16 10 21 10 16 9 10 8 11 10Biology 26 17 14 15 20 13 15 9 30 23 2 3 2 1 3 2 2 2 2 2 28 20 16 16 23 15 17 11 32 25 Natural Science 13 7 10 6 10 4 5 14 7 5 0 0 0 0 0 0 0 0 0 0 13 7 10 6 10 4 5 14 7 5Business Administration 74 73 87 81 56 64 108 87 75 56 0 0 0 0 0 1 6 11 8 12 74 73 87 81 56 65 114 98 83 68Chemistry 4 4 3 3 1 1 2 6 5 1 1 0 0 0 0 0 1 1 0 0 5 4 3 3 1 1 3 7 5 1Economics 1 2 3 2 3 3 6 6 5 7 0 0 1 0 1 0 0 0 0 0 1 2 4 2 4 3 6 6 5 7Education 163 235 165 150 212 268 246 258 240 387 54 29 42 48 42 41 49 40 48 28 217 264 207 198 254 309 295 298 288 415Engineering 21 25 23 24 34 36 39 48 50 78 5 2 4 1 1 1 1 5 4 2 26 27 27 25 35 37 40 53 54 80English 25 21 17 15 17 17 21 24 41 30 6 8 5 4 3 0 1 1 1 0 31 29 22 19 20 17 22 25 42 30Environmental Studies - 0 3 2 5 31 20 23 11 8 - 0 0 0 0 0 0 0 0 0 - 0 3 2 5 31 20 23 11 8Forestry/Forest Conservation 16 8 35 20 23 20 14 15 12 17 7 5 20 12 8 8 5 4 6 3 23 13 55 32 31 28 19 19 18 20General/Undecided/Special 433 387 517 374 388 362 370 326 325 361 0 0 0 0 0 0 0 18 12 0 433 387 517 374 388 362 370 344 337 361Geography 13 8 10 12 10 12 20 26 31 23 0 0 0 0 0 0 0 0 0 0 13 8 10 12 10 12 20 26 31 23Geology 2 1 0 1 2 3 2 2 1 5 1 0 1 0 0 1 0 1 1 0 3 1 1 1 2 4 2 3 2 5Gerontology 4 3 5 3 0 0 0 0 4 3 5 3History 16 6 8 13 7 19 21 22 37 17 3 1 0 0 1 2 0 1 0 0 19 7 8 13 8 21 21 23 37 17Indigenous Learning 6 6 10 3 9 11 13 14 22 8 0 0 0 0 0 0 0 0 0 0 6 6 10 3 9 11 13 14 22 8Kinesiology 12 12 8 6 6 3 14 9 6 10 3 0 1 9 2 10 2 0 1 0 15 12 9 15 8 13 16 9 7 10Languages 6 7 6 7 6 4 8 10 10 7 0 0 0 0 0 0 0 0 0 0 6 7 6 7 6 4 8 10 10 7Library & Info Studies 18 16 19 11 1 2 0 0 0 0 0 0 0 0 0 0 0 0 0 0 18 16 19 11 1 2 0 0 0 0 Library Tech 0 0 0 0 0 0 1 0 0 0 0 0 0 0 0 0 0 0 0 0 0 0 0 0 0 0 1 0 0 0Mathematics 2 0 3 2 10 6 7 6 7 9 4 1 3 0 0 0 0 0 0 2 6 1 6 2 10 6 7 6 7 11 Computer Science 25 10 44 19 22 13 12 5 10 10 0 0 0 0 0 0 0 0 0 0 25 10 44 19 22 13 12 5 10 10Medical Lab Science 3 1 1 0 0 0 0 0 0 0 0 0 0 0 0 0 0 0 0 0 3 1 1 0 0 0 0 0 0 0Music 23 18 13 16 13 10 7 6 5 2 0 0 0 0 0 0 0 0 0 0 23 18 13 16 13 10 7 6 5 2Nursing 90 132 181 182 137 156 178 164 152 143 0 0 0 0 0 16 33 34 25 11 90 132 181 182 137 172 211 198 177 154Orillia 12 12Outdoor Recreation 14 23 21 34 28 29 24 33 20 32 0 0 0 0 0 0 0 0 0 0 14 23 21 34 28 29 24 33 20 32Philosophy 5 4 7 3 2 4 5 5 5 3 0 1 0 1 0 0 0 0 0 0 5 5 7 4 2 4 5 5 5 3Physics 3 1 2 2 2 4 4 1 3 3 0 1 1 0 2 1 0 0 0 0 3 2 3 2 4 5 4 1 3 3Political Science 15 15 10 11 18 21 20 16 28 31 0 0 0 0 0 0 0 0 0 0 15 15 10 11 18 21 20 16 28 31Psychology 92 80 77 63 57 54 56 54 68 76 2 9 6 3 2 3 4 2 0 0 94 89 83 66 59 57 60 56 68 76Public Health (MPH) excl. Nursing 0 0 0 0 15 41 54 32 15 41 54 32Social Work 17 21 28 25 42 51 42 48 41 33 15 32 16 18 19 19 13 7 7 8 32 53 44 43 61 70 55 55 48 41Sociology 29 23 32 21 17 16 15 22 22 24 2 1 3 0 2 2 0 1 1 0 31 24 35 21 19 18 15 23 23 24Visual Arts 12 11 14 13 18 15 11 15 14 15 0 0 0 0 0 0 0 0 0 0 12 11 14 13 18 15 11 15 14 15Women's Studies 2 2 2 2 0 0 0 0 2 2 2 2
TOTAL UNIVERSITY 1,195 1,184 1,392 1,146 1,192 1,261 1,322 1,287 1,301 1,451 105 93 105 97 86 107 132 169 170 100 1,300 1,277 1,497 1,243 1,278 1,368 1,454 1,456 1,471 1,551
TOTAL P/T FCE ENROLMENT 1,117 1,013 1,952 N/A N/A N/A N/A N/A N/A N/A 67 51 103 N/A N/A N/A N/A N/A N/A N/A 1,183 1,064 2,055 N/A N/A N/A N/A N/A N/A N/A
NOTES : 1. Enrolment counts are based on November headcounts. 2. Students pursuing more than one degree are counted only once. 3. All dual degree students in HBOR and Education are counted in the Professional program. 4. Nursing Transition students are enrolled as Special Students in General/Undecided/Special.
ENROLMNT.WK4
28

ENROLMENT BY GENDER, REGISTRATION STATUS AND LEVELFALL 2006
TOTALMALE % OF TOTAL FEMALE % OF TOTAL ENROLMENT
FULL-TIME
Undergraduate 2,457 32.1% 3,183 41.6% 5,640
Master's 182 2.4% 222 2.9% 404
Doctoral 16 0.2% 33 0.4% 49
PART-TIME
Undergraduate 539 7.1% 912 11.9% 1,451
Master's 33 0.4% 67 0.9% 100
Doctoral 0 0.0% 0 0.0% 0
TOTAL 3,227 42% 4,417 58% 7,644
Institutional Analysis GENDER6.WK4
29
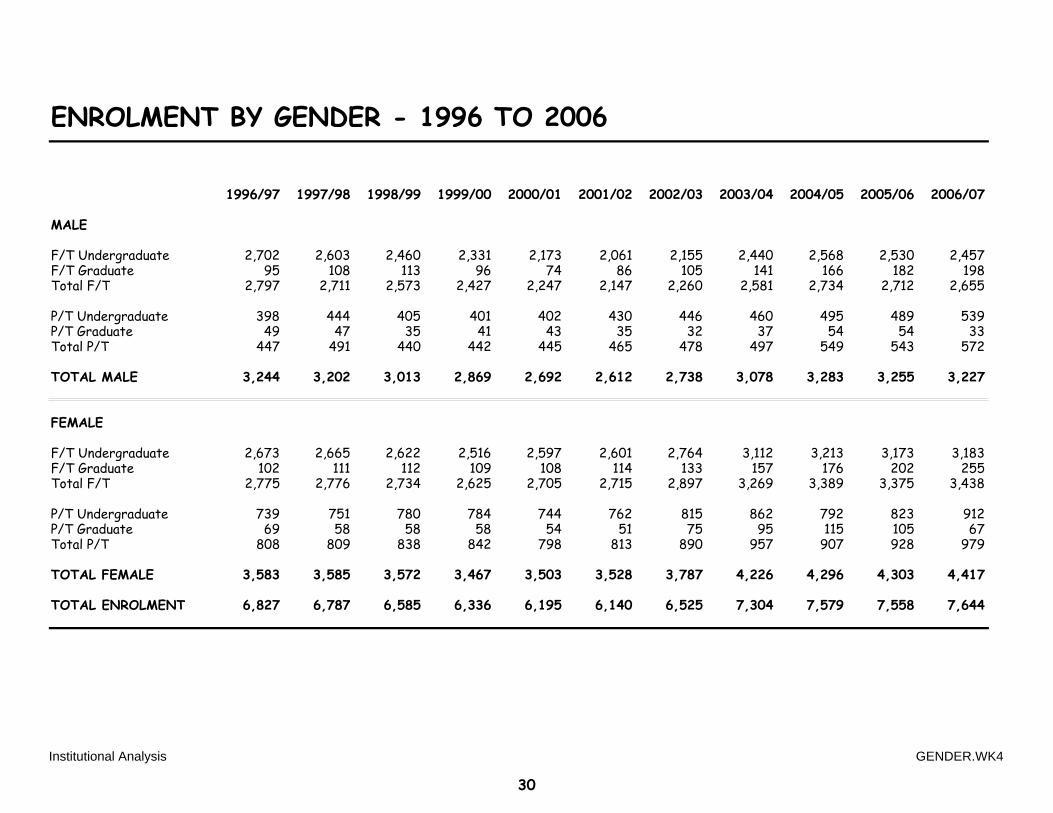
ENROLMENT BY GENDER - 1996 TO 2006
1996/97 1997/98 1998/99 1999/00 2000/01 2001/02 2002/03 2003/04 2004/05 2005/06 2006/07
MALE
F/T Undergraduate 2,702 2,603 2,460 2,331 2,173 2,061 2,155 2,440 2,568 2,530 2,457F/T Graduate 95 108 113 96 74 86 105 141 166 182 198Total F/T 2,797 2,711 2,573 2,427 2,247 2,147 2,260 2,581 2,734 2,712 2,655
P/T Undergraduate 398 444 405 401 402 430 446 460 495 489 539P/T Graduate 49 47 35 41 43 35 32 37 54 54 33Total P/T 447 491 440 442 445 465 478 497 549 543 572
TOTAL MALE 3,244 3,202 3,013 2,869 2,692 2,612 2,738 3,078 3,283 3,255 3,227
FEMALE
F/T Undergraduate 2,673 2,665 2,622 2,516 2,597 2,601 2,764 3,112 3,213 3,173 3,183F/T Graduate 102 111 112 109 108 114 133 157 176 202 255Total F/T 2,775 2,776 2,734 2,625 2,705 2,715 2,897 3,269 3,389 3,375 3,438
P/T Undergraduate 739 751 780 784 744 762 815 862 792 823 912P/T Graduate 69 58 58 58 54 51 75 95 115 105 67Total P/T 808 809 838 842 798 813 890 957 907 928 979
TOTAL FEMALE 3,583 3,585 3,572 3,467 3,503 3,528 3,787 4,226 4,296 4,303 4,417
TOTAL ENROLMENT 6,827 6,787 6,585 6,336 6,195 6,140 6,525 7,304 7,579 7,558 7,644
Institutional Analysis GENDER.WK4
30

ENROLMENT BY LEVEL AND REGISTRATION STATUS1990 TO 2006
UNDERGRADUATE GRADUATE TOTALTOTAL
YEAR Full-time Part-time Full-time Part-time Full-time Part-time ENROLMENT
1990 4,092 1,999 156 118 4,248 2,117 6,365
1991 4,518 2,034 187 131 4,705 2,165 6,870
1992 5,119 2,051 182 149 5,301 2,200 7,501
1993 5,602 1,741 219 139 5,821 1,880 7,701
1994 5,849 1,648 196 158 6,045 1,806 7,851
1995 5,497 1,587 230 144 5,727 1,731 7,458
1996 5,375 1,137 197 118 5,572 1,255 6,827
1997 5,268 1,195 219 105 5,487 1,300 6,787
1998 5,083 1,184 225 93 5,308 1,277 6,585
1999 4,847 1,185 205 99 5,052 1,284 6,336
2000 4,770 1,146 182 97 4,952 1,243 6,195
2001 4,662 1,192 200 86 4,862 1,278 6,140
2002 4,919 1,261 238 107 5,157 1,368 6,525
2003 5,552 1,322 298 132 5,850 1,454 7,304
2004 5,781 1,305 342 151 6,123 1,456 7,579
2005 5,702 1,301 385 170 6,087 1,471 7,558
2006 5,640 1,451 453 100 6,093 1,551 7,644
Institutional Analysis ENROL.WK4
31
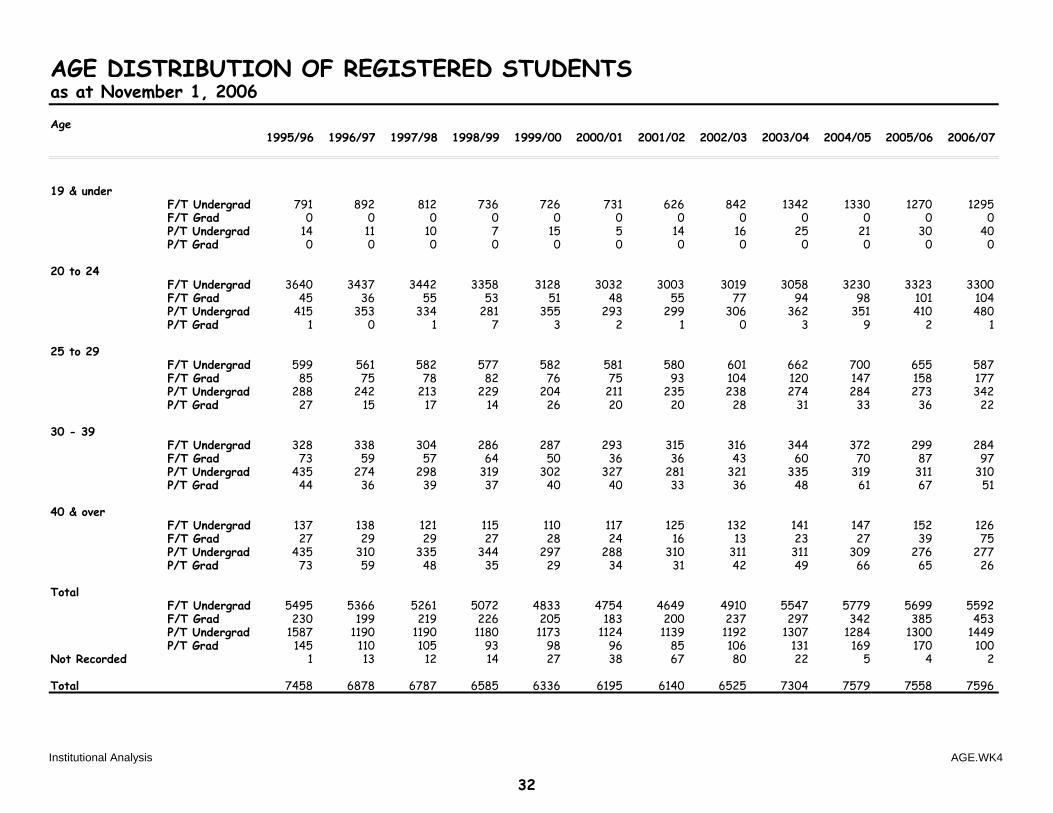
AGE DISTRIBUTION OF REGISTERED STUDENTSas at November 1, 2006
Age1995/96 1996/97 1997/98 1998/99 1999/00 2000/01 2001/02 2002/03 2003/04 2004/05 2005/06 2006/07
19 & underF/T Undergrad 791 892 812 736 726 731 626 842 1342 1330 1270 1295F/T Grad 0 0 0 0 0 0 0 0 0 0 0 0P/T Undergrad 14 11 10 7 15 5 14 16 25 21 30 40P/T Grad 0 0 0 0 0 0 0 0 0 0 0 0
20 to 24F/T Undergrad 3640 3437 3442 3358 3128 3032 3003 3019 3058 3230 3323 3300F/T Grad 45 36 55 53 51 48 55 77 94 98 101 104P/T Undergrad 415 353 334 281 355 293 299 306 362 351 410 480P/T Grad 1 0 1 7 3 2 1 0 3 9 2 1
25 to 29F/T Undergrad 599 561 582 577 582 581 580 601 662 700 655 587F/T Grad 85 75 78 82 76 75 93 104 120 147 158 177P/T Undergrad 288 242 213 229 204 211 235 238 274 284 273 342P/T Grad 27 15 17 14 26 20 20 28 31 33 36 22
30 - 39F/T Undergrad 328 338 304 286 287 293 315 316 344 372 299 284F/T Grad 73 59 57 64 50 36 36 43 60 70 87 97P/T Undergrad 435 274 298 319 302 327 281 321 335 319 311 310P/T Grad 44 36 39 37 40 40 33 36 48 61 67 51
40 & overF/T Undergrad 137 138 121 115 110 117 125 132 141 147 152 126F/T Grad 27 29 29 27 28 24 16 13 23 27 39 75P/T Undergrad 435 310 335 344 297 288 310 311 311 309 276 277P/T Grad 73 59 48 35 29 34 31 42 49 66 65 26
TotalF/T Undergrad 5495 5366 5261 5072 4833 4754 4649 4910 5547 5779 5699 5592F/T Grad 230 199 219 226 205 183 200 237 297 342 385 453P/T Undergrad 1587 1190 1190 1180 1173 1124 1139 1192 1307 1284 1300 1449P/T Grad 145 110 105 93 98 96 85 106 131 169 170 100
Not Recorded 1 13 12 14 27 38 67 80 22 5 4 2
Total 7458 6878 6787 6585 6336 6195 6140 6525 7304 7579 7558 7596
Institutional Analysis AGE.WK4
32

GEOGRAPHIC DISTRIBUTION OF FULL-TIME REGISTRANTSNumber of Students
1996 1997 1998 1999 2000 2001 2002 2003 2004 2005 2006
Northwestern Ontario 2,608 2,538 2,405 2,266 2,372 2,387 2,594 2,859 3,041 3,102 3,097Other Ontario 2,610 2,482 2,473 2,354 2,102 2,009 2,161 2,483 2,525 2,434 2,508Other Prov & Int. 358 334 394 432 478 466 402 508 557 551 488
TOTAL 5,576 5,354 5,272 5,052 4,952 4,862 5,157 5,850 6,123 6,087 6,093
Percentage of Students
1996 1997 1998 1999 2000 2001 2002 2003 2004 2005 2006
Northwestern Ontario 46.8% 47.4% 45.6% 44.9% 47.9% 49.1% 50.3% 48.9% 49.7% 51.0% 50.8%Other Ontario 46.8% 46.4% 46.9% 46.6% 42.4% 41.3% 41.9% 42.4% 41.2% 40.0% 41.2%Other Prov & Int. 6.4% 6.2% 7.5% 8.6% 9.7% 9.6% 7.8% 8.7% 9.1% 9.1% 8.0%
TOTAL 100.00% 100.00% 100.00% 100.00% 100.00% 100.00% 100.00% 100.00% 100.00% 100.00% 100.00%
Note: Northwestern Ontario includes Districts of Thunder Bay, Rainy River and Kenora.
Institutional Analysis GEO_DIS.WK4
33

APPLICANT/REGISTRANT DATAFirst Year Total Applications & Registered Applicants by Enrolment Status in Previous YearFall 1987 to Fall 2005
TOTAL APPLICATIONS REGISTERED APPLICANTS
Non- Non- Previous TotalYear Secondary Secondary Total Secondary Secondary Registrations First Year
/Other
1987 1,844 999 2,843 454 211 127 792
1988 2,293 1,209 3,502 651 284 291 1,226
1989 2,216 1,255 3,471 567 265 436 1,268
1990 2,524 1,439 3,963 689 294 360 1,343
1991 2,770 1,615 4,385 715 382 276 1,373
1992 3,192 1,895 5,087 853 446 498 1,797
1993 3,842 1,756 5,598 981 385 447 1,813
1994 3,919 1,710 5,629 980 357 703 2,040
1995 3,379 1,447 4,826 834 322 530 1,686
1996 3,397 1,278 4,675 931 288 446 1,665
1997 2,763 1,177 3,940 814 334 298 1,446
1998 2,645 (211) 1,021 (59) 3,666 (270) 714 284 439 1,437
1999 3,242 (613) 1,080 (111) 4,322 (724) 703 265 672 1,640
2000 3,172 (698) 1,128 (150) 4,300 (848) 681 274 128 1,083
2001 2,974 (739) 1,170 (178) 4,144 (917) 579 312 283 1,174
2002 3,801 (1,771) 1,293 (205) 5,094 (1,976) 825 336 333 1,494
2003 7,464 (3,058) 1,515 (296) 8,979 (3,354) 1,183 321 391 1,895
2004 7,264 (1,741) 1,879 (333) 9,143 (2,074) 773 371 694 1,838
2005 3,657 (1,125) 1,489 (208) 5,146 (1,333) 705 353 432 1,490
Source: Ontario Universities Application Centre, Admission Data System Reports (Table 2.0).
Note: Commencing in 1998, application choices have changed to include choices greater than 3. Prior years include 1st, 2nd and 3rd choices only. Totals for choices greater than 3 are shown in parentheses.
Institutional Analysis APPLICAN.WK4
34

ANALYSES OF TOTAL AND FIRST-CHOICE APPLICATIONS
1983 TO 2005 -- ALL ONTARIO
All Universities Lakehead Lakehead/ALL Universities
Year Total 1st Choice Total 1st Choice Total 1st Choice
1983 143,067 56,372 2,658 1,084 1.86% 1.92% 1984 150,916 56,972 3,149 1,228 2.09% 2.16% 1985 163,740 60,098 2,935 1,144 1.79% 1.90% 1986 160,865 60,112 2,538 1,051 1.58% 1.75% 1987 169,413 61,843 2,482 953 1.47% 1.54% 1988 217,953 79,988 3,502 1,382 1.61% 1.73% 1989 233,243 86,778 3,471 1,384 1.49% 1.59% 1990 239,511 88,326 3,963 1,533 1.65% 1.74%1991 239,468 88,848 4,385 1,621 1.83% 1.82%1992 246,186 91,114 5,087 2,020 2.07% 2.22%1993 244,660 87,913 5,598 2,114 2.29% 2.40%1994 244,694 87,724 5,629 2,160 2.30% 2.46%1995 232,839 83,783 4,826 1,877 2.07% 2.24% 1996 229,032 82,454 4,675 1,794 2.04% 2.18%1997 222,150 80,286 3,940 1,574 1.77% 1.96%1998 240,127 78,274 3,666 1,379 1.53% 1.76%1999 262,692 82,033 4,322 1,398 1.65% 1.70%2000 301,700 85,012 4,300 1,384 1.43% 1.63%2001 328,891 91,396 4,144 1,274 1.26% 1.39%2002 383,321 101,757 5,094 1,563 1.33% 1.54%2003 627,207 135,654 8,979 2,243 1.43% 1.65%2004 481,767 114,930 6,418 1,670 1.33% 1.45%2005 443,052 116,329 5,146 1,495 1.16% 1.29%
Source: Ontario Universities Application Centre, Admission Data System Reports (Tables 2.0 and 2.1).
Notes: Data pertain to applications to first-year programs processed through the Ontario Universities Application Centre only. When Advanced Standing and direct applications are included, Lakehead received and processed larger numbers each year.
Institutional AnalysisMay 2007
APPS®.WK4
35
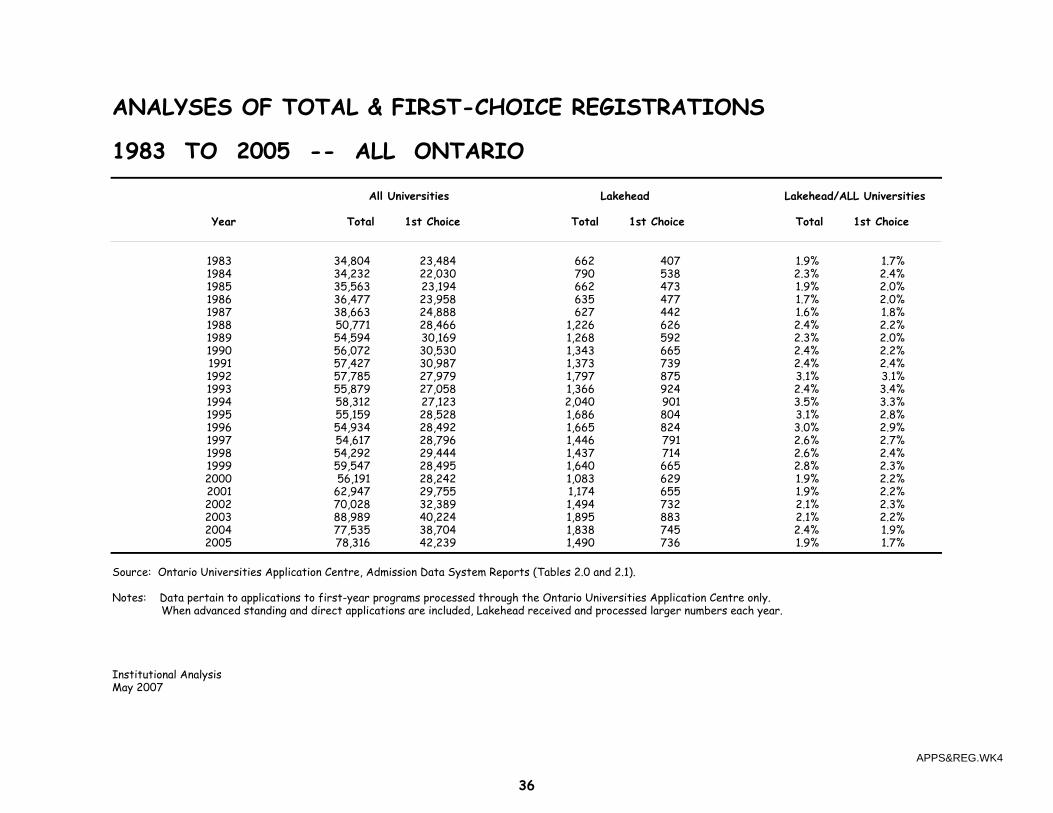
ANALYSES OF TOTAL & FIRST-CHOICE REGISTRATIONS
1983 TO 2005 -- ALL ONTARIO
All Universities Lakehead Lakehead/ALL Universities
Year Total 1st Choice Total 1st Choice Total 1st Choice
1983 34,804 23,484 662 407 1.9% 1.7% 1984 34,232 22,030 790 538 2.3% 2.4% 1985 35,563 23,194 662 473 1.9% 2.0% 1986 36,477 23,958 635 477 1.7% 2.0% 1987 38,663 24,888 627 442 1.6% 1.8% 1988 50,771 28,466 1,226 626 2.4% 2.2% 1989 54,594 30,169 1,268 592 2.3% 2.0% 1990 56,072 30,530 1,343 665 2.4% 2.2%1991 57,427 30,987 1,373 739 2.4% 2.4%1992 57,785 27,979 1,797 875 3.1% 3.1%1993 55,879 27,058 1,366 924 2.4% 3.4%1994 58,312 27,123 2,040 901 3.5% 3.3%1995 55,159 28,528 1,686 804 3.1% 2.8% 1996 54,934 28,492 1,665 824 3.0% 2.9%1997 54,617 28,796 1,446 791 2.6% 2.7%1998 54,292 29,444 1,437 714 2.6% 2.4%1999 59,547 28,495 1,640 665 2.8% 2.3%2000 56,191 28,242 1,083 629 1.9% 2.2%2001 62,947 29,755 1,174 655 1.9% 2.2%2002 70,028 32,389 1,494 732 2.1% 2.3%2003 88,989 40,224 1,895 883 2.1% 2.2%2004 77,535 38,704 1,838 745 2.4% 1.9%2005 78,316 42,239 1,490 736 1.9% 1.7%
Source: Ontario Universities Application Centre, Admission Data System Reports (Tables 2.0 and 2.1).
Notes: Data pertain to applications to first-year programs processed through the Ontario Universities Application Centre only. When advanced standing and direct applications are included, Lakehead received and processed larger numbers each year.
Institutional AnalysisMay 2007
APPS®.WK4
36
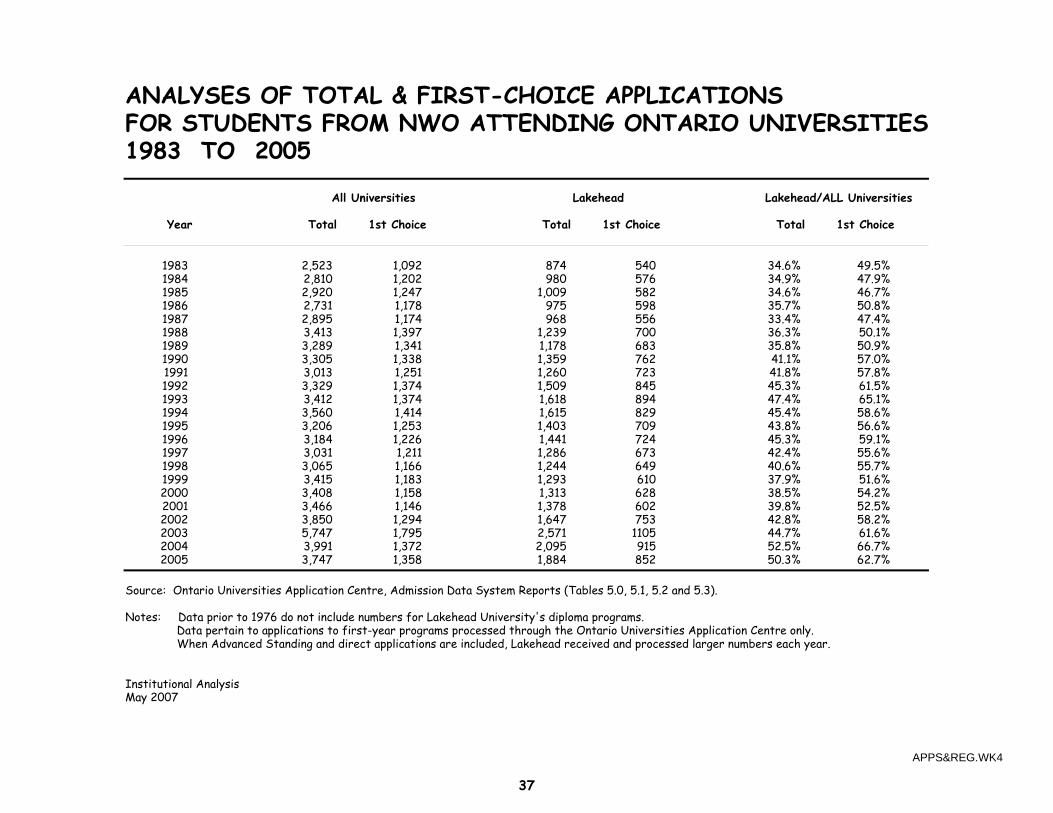
ANALYSES OF TOTAL & FIRST-CHOICE APPLICATIONSFOR STUDENTS FROM NWO ATTENDING ONTARIO UNIVERSITIES1983 TO 2005
All Universities Lakehead Lakehead/ALL Universities
Year Total 1st Choice Total 1st Choice Total 1st Choice
1983 2,523 1,092 874 540 34.6% 49.5% 1984 2,810 1,202 980 576 34.9% 47.9% 1985 2,920 1,247 1,009 582 34.6% 46.7% 1986 2,731 1,178 975 598 35.7% 50.8% 1987 2,895 1,174 968 556 33.4% 47.4% 1988 3,413 1,397 1,239 700 36.3% 50.1%1989 3,289 1,341 1,178 683 35.8% 50.9%1990 3,305 1,338 1,359 762 41.1% 57.0%1991 3,013 1,251 1,260 723 41.8% 57.8%1992 3,329 1,374 1,509 845 45.3% 61.5%1993 3,412 1,374 1,618 894 47.4% 65.1%1994 3,560 1,414 1,615 829 45.4% 58.6%1995 3,206 1,253 1,403 709 43.8% 56.6%1996 3,184 1,226 1,441 724 45.3% 59.1%1997 3,031 1,211 1,286 673 42.4% 55.6%1998 3,065 1,166 1,244 649 40.6% 55.7%1999 3,415 1,183 1,293 610 37.9% 51.6%2000 3,408 1,158 1,313 628 38.5% 54.2%2001 3,466 1,146 1,378 602 39.8% 52.5%2002 3,850 1,294 1,647 753 42.8% 58.2%2003 5,747 1,795 2,571 1105 44.7% 61.6%2004 3,991 1,372 2,095 915 52.5% 66.7%2005 3,747 1,358 1,884 852 50.3% 62.7%
Source: Ontario Universities Application Centre, Admission Data System Reports (Tables 5.0, 5.1, 5.2 and 5.3).
Notes: Data prior to 1976 do not include numbers for Lakehead University's diploma programs. Data pertain to applications to first-year programs processed through the Ontario Universities Application Centre only. When Advanced Standing and direct applications are included, Lakehead received and processed larger numbers each year.
Institutional AnalysisMay 2007
APPS®.WK4
37
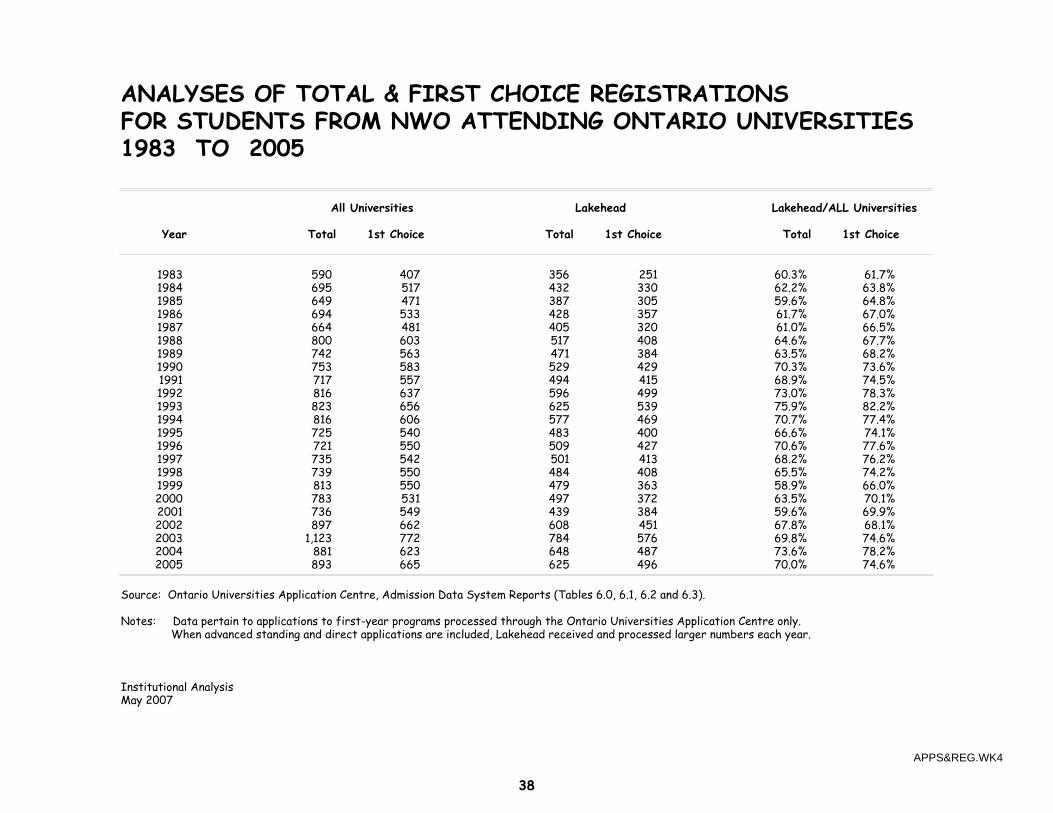
ANALYSES OF TOTAL & FIRST CHOICE REGISTRATIONSFOR STUDENTS FROM NWO ATTENDING ONTARIO UNIVERSITIES1983 TO 2005
All Universities Lakehead Lakehead/ALL Universities
Year Total 1st Choice Total 1st Choice Total 1st Choice
1983 590 407 356 251 60.3% 61.7%1984 695 517 432 330 62.2% 63.8%1985 649 471 387 305 59.6% 64.8%1986 694 533 428 357 61.7% 67.0%1987 664 481 405 320 61.0% 66.5%1988 800 603 517 408 64.6% 67.7%1989 742 563 471 384 63.5% 68.2%1990 753 583 529 429 70.3% 73.6%1991 717 557 494 415 68.9% 74.5%1992 816 637 596 499 73.0% 78.3%1993 823 656 625 539 75.9% 82.2%1994 816 606 577 469 70.7% 77.4%1995 725 540 483 400 66.6% 74.1%1996 721 550 509 427 70.6% 77.6%1997 735 542 501 413 68.2% 76.2%1998 739 550 484 408 65.5% 74.2%1999 813 550 479 363 58.9% 66.0%2000 783 531 497 372 63.5% 70.1%2001 736 549 439 384 59.6% 69.9%2002 897 662 608 451 67.8% 68.1%2003 1,123 772 784 576 69.8% 74.6%2004 881 623 648 487 73.6% 78.2%2005 893 665 625 496 70.0% 74.6%
Source: Ontario Universities Application Centre, Admission Data System Reports (Tables 6.0, 6.1, 6.2 and 6.3).
Notes: Data pertain to applications to first-year programs processed through the Ontario Universities Application Centre only. When advanced standing and direct applications are included, Lakehead received and processed larger numbers each year.
Institutional AnalysisMay 2007
APPS®.WK4
38

93/94 94/95 95/96 96/97 97/98 98/99 99/00 00/01 01/02 02/03 03/04 04/05 1-25 44.7% 46.1% 47.5% 47.5% 50.3% 49.2% 50.1% 49.8% 47.0% 45.3% 45.1% 42.0% 26-50 34.8% 35.3% 32.7% 33.4% 30.0% 32.1% 32.3% 32.8% 35.8% 35.7% 35.5% 39.8%
51-100 13.6% 13.0% 14.1% 13.6% 13.3% 13.7% 13.0% 12.7% 12.8% 14.0% 14.0% 14.0% 101-150 4.1% 3.4% 3.3% 3.5% 3.7% 3.1% 3.3% 3.6% 3.1% 3.2% 3.4% 2.6%
>150 2.8% 2.2% 2.4% 1.9% 2.6% 1.8% 1.3% 1.0% 1.3% 1.9% 2.0% 1.6%
Note: 1. The data are taken from the class size reports run from the student history database. It includes all zero to 4th year level undergraduate classes and 5th year level undergraduate classes (Engineering, Geology and Mathematics).2. The data do not include the following: Music Performance, Co-operative Education, Continuing and Distance Education, Exchange, Thesis, Reading, Field school, Practicum, Project or Labs.
0%
20%
40%
60%
80%
100%
120%
93/94 94/95 95/96 96/9797/98 98/99 99/00 00/01
01/02 02/03 03/0404/05
Undergraduate Class SizesFall and Winter Term
CLASSIZE.WK439

SECTION 3 - FACULTY DATA
Full-time Faculty Appointments by Department
Full-time Faculty Appointments - Distribution by Rank
Full-time Faculty Appointments - Distribution by Type of Appointment
Full-time Faculty Appointments - Distribution by Gender & Rank
Full-time Faculty Appointments - Distribution by Gender & Type of Appointment
Full-time Faculty Appointments - Distribution by Age
FTE Course Enrolments & FTE Course Enrolments per FTE Faculty
Student/Faculty Ratios
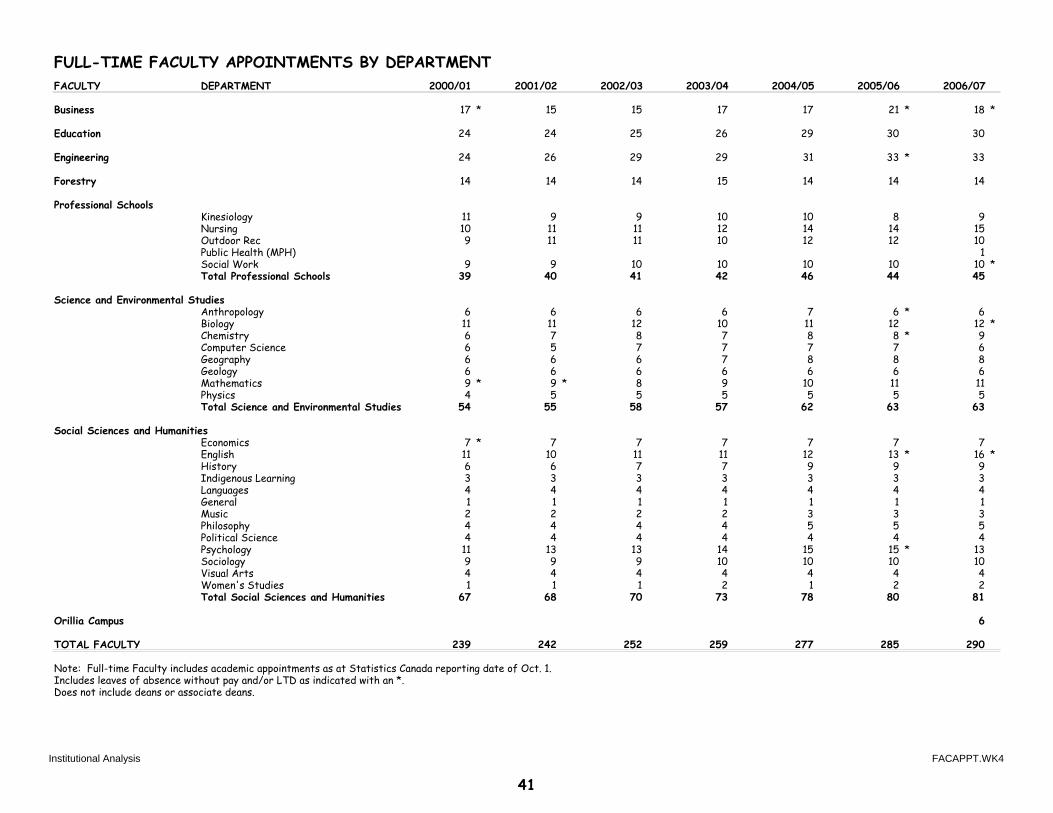
FULL-TIME FACULTY APPOINTMENTS BY DEPARTMENTFACULTY DEPARTMENT 2000/01 2001/02 2002/03 2003/04 2004/05 2005/06 2006/07
Business 17 * 15 15 17 17 21 * 18 *
Education 24 24 25 26 29 30 30
Engineering 24 26 29 29 31 33 * 33
Forestry 14 14 14 15 14 14 14
Professional SchoolsKinesiology 11 9 9 10 10 8 9Nursing 10 11 11 12 14 14 15Outdoor Rec 9 11 11 10 12 12 10Public Health (MPH) 1Social Work 9 9 10 10 10 10 10 *Total Professional Schools 39 40 41 42 46 44 45
Science and Environmental StudiesAnthropology 6 6 6 6 7 6 * 6Biology 11 11 12 10 11 12 12 *Chemistry 6 7 8 7 8 8 * 9Computer Science 6 5 7 7 7 7 6Geography 6 6 6 7 8 8 8Geology 6 6 6 6 6 6 6Mathematics 9 * 9 * 8 9 10 11 11Physics 4 5 5 5 5 5 5Total Science and Environmental Studies 54 55 58 57 62 63 63
Social Sciences and HumanitiesEconomics 7 * 7 7 7 7 7 7English 11 10 11 11 12 13 * 16 *History 6 6 7 7 9 9 9Indigenous Learning 3 3 3 3 3 3 3Languages 4 4 4 4 4 4 4General 1 1 1 1 1 1 1Music 2 2 2 2 3 3 3Philosophy 4 4 4 4 5 5 5Political Science 4 4 4 4 4 4 4Psychology 11 13 13 14 15 15 * 13Sociology 9 9 9 10 10 10 10Visual Arts 4 4 4 4 4 4 4Women's Studies 1 1 1 2 1 2 2Total Social Sciences and Humanities 67 68 70 73 78 80 81
Orillia Campus 6
TOTAL FACULTY 239 242 252 259 277 285 290
Note: Full-time Faculty includes academic appointments as at Statistics Canada reporting date of Oct. 1.Includes leaves of absence without pay and/or LTD as indicated with an *.Does not include deans or associate deans.
Institutional Analysis FACAPPT.WK4
41

FULL-TIME FACULTY APPOINTMENTS
DISTRIBUTION BY RANK
RANK 1997/98 1998/99 1999/00 2000/01 2001/02 2002/03 2003/04 2004/05 2005/06 2006/07
Professor 76 81 81 76 80 81 71 72 75 76
Associate Professor 102 101 94 87 85 88 92 100 100 114
Assistant Professor 58 56 60 64 72 73 80 84 95 81
Lecturer 1 2 5 9 5 10 16 21 15 19
TOTAL 237 240 240 236 242 252 259 277 285 290
DISTRIBUTION BY TYPE OF APPOINTMENT
TYPE OF APPOINTMENT 1997/98 1998/99 1999/00 2000/01 2001/02 2002/03 2003/04 2004/05 2005/06 2006/07
Tenured 194 195 188 175 174 174 163 171 178 191
Probationary 34 35 38 45 54 60 68 74 87 71
Term 9 10 14 16 14 18 28 32 20 28
TOTAL 237 240 240 236 242 252 259 277 285 290
Source: Human Resources Faculty Data BaseNote: Excludes Deans
FAC-RANK.WK4
42

FULL-TIME FACULTY APPOINTMENTSDISTRIBUTION BY GENDER & RANK
1997/98 1998/99 1999/00 2000/01 2001/02 2002/03 2003/04 2004/05 2005/06 2006/07RANK Male Female Male Female Male Female Male Female Male Female Male Female Male Female Male Female Male Female Male Female
Professor 70 6 76 5 75 6 69 7 69 11 68 13 57 14 57 15 57 18 58 18
Associate 79 23 72 29 67 27 62 25 57 28 56 32 60 32 66 34 67 33 79 35
Assistant 34 24 35 21 39 21 42 22 53 19 56 17 61 19 64 20 68 27 53 28
Lecturer 1 0 2 0 3 2 4 5 2 3 3 7 8 8 9 12 8 7 13 6
Sub-Total 184 53 185 55 184 56 177 59 181 61 183 69 186 73 196 81 200 85 203 87
TOTAL 237 240 240 236 242 252 259 277 285 290
DISTRIBUTION BY GENDER & TYPE OF APPOINTMENT
1997/98 1998/99 1999/00 2000/01 2001/02 2002/03 2003/04 2004/05 2005/06 2006/07TYPE OF APPOINTMENT Male Female Male Female Male Female Male Female Male Female Male Female Male Female Male Female Male Female Male Female
Tenured 156 38 153 42 148 40 136 39 132 42 126 48 116 47 121 50 125 53 137 54
Probationary 22 12 23 12 25 13 31 14 40 14 47 13 51 17 55 19 64 23 47 24
Term 6 3 9 1 11 3 10 6 9 5 10 8 19 9 20 12 11 9 19 9
Sub-Total 184 53 185 55 184 56 177 59 181 61 183 69 186 73 196 81 200 85 203 87
TOTAL 237 240 240 236 242 252 259 277 285 290
Source: Human Resources Faculty DatabaseNote: Excludes Deans
FAC-APPT.WK4
43

0
10
20
30
40
50
Age Groups
Per
cent
age
Dis
tribu
tion
<30 30-39 40-49 50-59 60+
1987/88 1988/89 1989/90 1990/91 1991/92 1992/93 1993/94 1994/95 1995/96
1996/97 1997/98 1998/99 1999/00 2000/01 2001/02 2002/03 2003/04
Full-Time Faculty Distribution by Age
Source: Statistics Canada TablesInstitutional Analysis, March 2006
AGE-DIST.WK4
44
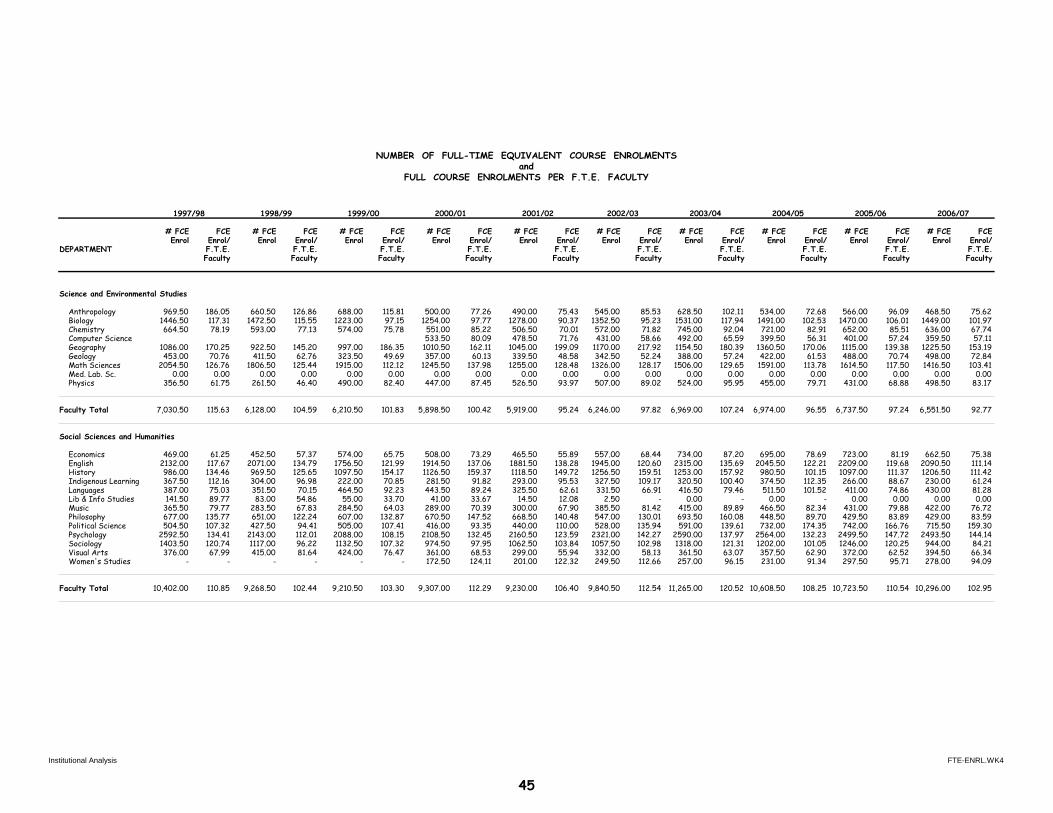
NUMBER OF FULL-TIME EQUIVALENT COURSE ENROLMENTSand
FULL COURSE ENROLMENTS PER F.T.E. FACULTY
1997/98 1998/99 1999/00 2000/01 2001/02 2002/03 2003/04 2004/05 2005/06 2006/07
# FCE FCE # FCE FCE # FCE FCE # FCE FCE # FCE FCE # FCE FCE # FCE FCE # FCE FCE # FCE FCE # FCE FCEEnrol Enrol/ Enrol Enrol/ Enrol Enrol/ Enrol Enrol/ Enrol Enrol/ Enrol Enrol/ Enrol Enrol/ Enrol Enrol/ Enrol Enrol/ Enrol Enrol/
DEPARTMENT F.T.E. F.T.E. F.T.E. F.T.E. F.T.E. F.T.E. F.T.E. F.T.E. F.T.E. F.T.E.Faculty Faculty Faculty Faculty Faculty Faculty Faculty Faculty Faculty Faculty
Science and Environmental Studies
Anthropology 969.50 186.05 660.50 126.86 688.00 115.81 500.00 77.26 490.00 75.43 545.00 85.53 628.50 102.11 534.00 72.68 566.00 96.09 468.50 75.62Biology 1446.50 117.31 1472.50 115.55 1223.00 97.15 1254.00 97.77 1278.00 90.37 1352.50 95.23 1531.00 117.94 1491.00 102.53 1470.00 106.01 1449.00 101.97Chemistry 664.50 78.19 593.00 77.13 574.00 75.78 551.00 85.22 506.50 70.01 572.00 71.82 745.00 92.04 721.00 82.91 652.00 85.51 636.00 67.74Computer Science 533.50 80.09 478.50 71.76 431.00 58.66 492.00 65.59 399.50 56.31 401.00 57.24 359.50 57.11Geography 1086.00 170.25 922.50 145.20 997.00 186.35 1010.50 162.11 1045.00 199.09 1170.00 217.92 1154.50 180.39 1360.50 170.06 1115.00 139.38 1225.50 153.19Geology 453.00 70.76 411.50 62.76 323.50 49.69 357.00 60.13 339.50 48.58 342.50 52.24 388.00 57.24 422.00 61.53 488.00 70.74 498.00 72.84Math Sciences 2054.50 126.76 1806.50 125.44 1915.00 112.12 1245.50 137.98 1255.00 128.48 1326.00 128.17 1506.00 129.65 1591.00 113.78 1614.50 117.50 1416.50 103.41Med. Lab. Sc. 0.00 0.00 0.00 0.00 0.00 0.00 0.00 0.00 0.00 0.00 0.00 0.00 0.00 0.00 0.00 0.00 0.00 0.00 0.00 0.00Physics 356.50 61.75 261.50 46.40 490.00 82.40 447.00 87.45 526.50 93.97 507.00 89.02 524.00 95.95 455.00 79.71 431.00 68.88 498.50 83.17
Faculty Total 7,030.50 115.63 6,128.00 104.59 6,210.50 101.83 5,898.50 100.42 5,919.00 95.24 6,246.00 97.82 6,969.00 107.24 6,974.00 96.55 6,737.50 97.24 6,551.50 92.77
Social Sciences and Humanities
Economics 469.00 61.25 452.50 57.37 574.00 65.75 508.00 73.29 465.50 55.89 557.00 68.44 734.00 87.20 695.00 78.69 723.00 81.19 662.50 75.38English 2132.00 117.67 2071.00 134.79 1756.50 121.99 1914.50 137.06 1881.50 138.28 1945.00 120.60 2315.00 135.69 2045.50 122.21 2209.00 119.68 2090.50 111.14History 986.00 134.46 969.50 125.65 1097.50 154.17 1126.50 159.37 1118.50 149.72 1256.50 159.51 1253.00 157.92 980.50 101.15 1097.00 111.37 1206.50 111.42Indigenous Learning 367.50 112.16 304.00 96.98 222.00 70.85 281.50 91.82 293.00 95.53 327.50 109.17 320.50 100.40 374.50 112.35 266.00 88.67 230.00 61.24Languages 387.00 75.03 351.50 70.15 464.50 92.23 443.50 89.24 325.50 62.61 331.50 66.91 416.50 79.46 511.50 101.52 411.00 74.86 430.00 81.28Lib & Info Studies 141.50 89.77 83.00 54.86 55.00 33.70 41.00 33.67 14.50 12.08 2.50 - 0.00 - 0.00 - 0.00 0.00 0.00 0.00Music 365.50 79.77 283.50 67.83 284.50 64.03 289.00 70.39 300.00 67.90 385.50 81.42 415.00 89.89 466.50 82.34 431.00 79.88 422.00 76.72Philosophy 677.00 135.77 651.00 122.24 607.00 132.87 670.50 147.52 668.50 140.48 547.00 130.01 693.50 160.08 448.50 89.70 429.50 83.89 429.00 83.59Political Science 504.50 107.32 427.50 94.41 505.00 107.41 416.00 93.35 440.00 110.00 528.00 135.94 591.00 139.61 732.00 174.35 742.00 166.76 715.50 159.30Psychology 2592.50 134.41 2143.00 112.01 2088.00 108.15 2108.50 132.45 2160.50 123.59 2321.00 142.27 2590.00 137.97 2564.00 132.23 2499.50 147.72 2493.50 144.14Sociology 1403.50 120.74 1117.00 96.22 1132.50 107.32 974.50 97.95 1062.50 103.84 1057.50 102.98 1318.00 121.31 1202.00 101.05 1246.00 120.25 944.00 84.21Visual Arts 376.00 67.99 415.00 81.64 424.00 76.47 361.00 68.53 299.00 55.94 332.00 58.13 361.50 63.07 357.50 62.90 372.00 62.52 394.50 66.34Women's Studies - - - - - - 172.50 124.11 201.00 122.32 249.50 112.66 257.00 96.15 231.00 91.34 297.50 95.71 278.00 94.09
Faculty Total 10,402.00 110.85 9,268.50 102.44 9,210.50 103.30 9,307.00 112.29 9,230.00 106.40 9,840.50 112.54 11,265.00 120.52 10,608.50 108.25 10,723.50 110.54 10,296.00 102.95
Institutional Analysis FTE-ENRL.WK4
45
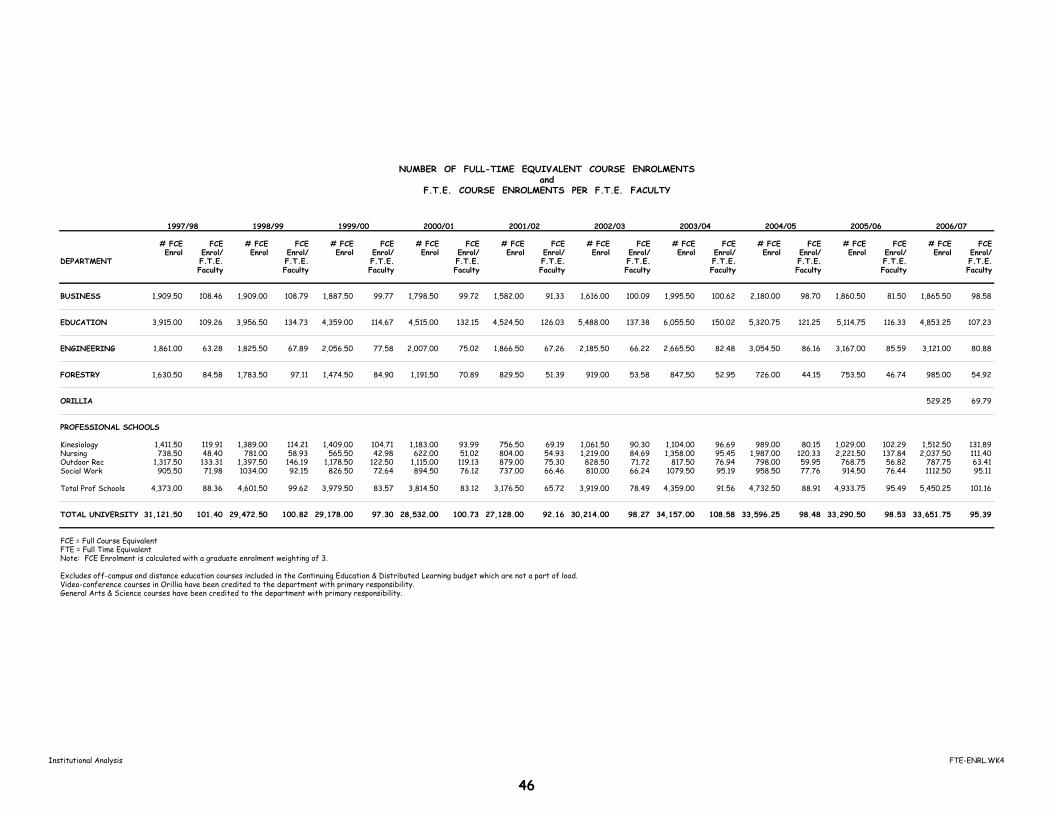
NUMBER OF FULL-TIME EQUIVALENT COURSE ENROLMENTSand
F.T.E. COURSE ENROLMENTS PER F.T.E. FACULTY
1997/98 1998/99 1999/00 2000/01 2001/02 2002/03 2003/04 2004/05 2005/06 2006/07
# FCE FCE # FCE FCE # FCE FCE # FCE FCE # FCE FCE # FCE FCE # FCE FCE # FCE FCE # FCE FCE # FCE FCEEnrol Enrol/ Enrol Enrol/ Enrol Enrol/ Enrol Enrol/ Enrol Enrol/ Enrol Enrol/ Enrol Enrol/ Enrol Enrol/ Enrol Enrol/ Enrol Enrol/
DEPARTMENT F.T.E. F.T.E. F.T.E. F.T.E. F.T.E. F.T.E. F.T.E. F.T.E. F.T.E. F.T.E.Faculty Faculty Faculty Faculty Faculty Faculty Faculty Faculty Faculty Faculty
BUSINESS 1,909.50 108.46 1,909.00 108.79 1,887.50 99.77 1,798.50 99.72 1,582.00 91.33 1,616.00 100.09 1,995.50 100.62 2,180.00 98.70 1,860.50 81.50 1,865.50 98.58
EDUCATION 3,915.00 109.26 3,956.50 134.73 4,359.00 114.67 4,515.00 132.15 4,524.50 126.03 5,488.00 137.38 6,055.50 150.02 5,320.75 121.25 5,114.75 116.33 4,853.25 107.23
ENGINEERING 1,861.00 63.28 1,825.50 67.89 2,056.50 77.58 2,007.00 75.02 1,866.50 67.26 2,185.50 66.22 2,665.50 82.48 3,054.50 86.16 3,167.00 85.59 3,121.00 80.88
FORESTRY 1,630.50 84.58 1,783.50 97.11 1,474.50 84.90 1,191.50 70.89 829.50 51.39 919.00 53.58 847.50 52.95 726.00 44.15 753.50 46.74 985.00 54.92
ORILLIA 529.25 69.79
PROFESSIONAL SCHOOLS
Kinesiology 1,411.50 119.91 1,389.00 114.21 1,409.00 104.71 1,183.00 93.99 756.50 69.19 1,061.50 90.30 1,104.00 96.69 989.00 80.15 1,029.00 102.29 1,512.50 131.89Nursing 738.50 48.40 781.00 58.93 565.50 42.98 622.00 51.02 804.00 54.93 1,219.00 84.69 1,358.00 95.45 1,987.00 120.33 2,221.50 137.84 2,037.50 111.40Outdoor Rec 1,317.50 133.31 1,397.50 146.19 1,178.50 122.50 1,115.00 119.13 879.00 75.30 828.50 71.72 817.50 76.94 798.00 59.95 768.75 56.82 787.75 63.41Social Work 905.50 71.98 1034.00 92.15 826.50 72.64 894.50 76.12 737.00 66.46 810.00 66.24 1079.50 95.19 958.50 77.76 914.50 76.44 1112.50 95.11
Total Prof Schools 4,373.00 88.36 4,601.50 99.62 3,979.50 83.57 3,814.50 83.12 3,176.50 65.72 3,919.00 78.49 4,359.00 91.56 4,732.50 88.91 4,933.75 95.49 5,450.25 101.16
TOTAL UNIVERSITY 31,121.50 101.40 29,472.50 100.82 29,178.00 97.30 28,532.00 100.73 27,128.00 92.16 30,214.00 98.27 34,157.00 108.58 33,596.25 98.48 33,290.50 98.53 33,651.75 95.39
FCE = Full Course EquivalentFTE = Full Time EquivalentNote: FCE Enrolment is calculated with a graduate enrolment weighting of 3.
Excludes off-campus and distance education courses included in the Continuing Education & Distributed Learning budget which are not a part of load.Video-conference courses in Orillia have been credited to the department with primary responsibility.General Arts & Science courses have been credited to the department with primary responsibility.
Institutional Analysis FTE-ENRL.WK4
46

STUDENT/FACULTY RATIOS
TOTAL AVERAGE F. T. E. INSTRUCTIONAL FACULTY F. T. E. STUDENT/ ONTARIOCOSTS ('000'S) SALARY FACULTY FACULTY RATIO UNIVERSITIES
YEAR (LAKEHEAD) (LAKEHEAD) (LAKEHEAD) (LAKEHEAD) RATIO
1987/88 $14,410 $52,628 273.8 15.4 16.81988/89 $16,648 $55,305 301.0 15.3 17.21989/90 $18,511 $60,657 305.2 15.4 17.41990/91 $20,110 $65,256 308.2 16.9 18.01991/92 $21,862 $70,826 308.7 18.3 19.11992/93 $23,474 $76,050 314.8 18.2 19.61993/94 $23,957 $74,279 322.5 20.6 19.71994/95 $23,400 $72,950 320.8 21.2 20.11995/96 $23,148 $70,020 330.6 19.6 20.1 1996/97 $21,564 $69,788 309.5 20.4 21.21997/98 $21,525 $71,866 299.5 21.2 21.51998/99 $21,323 $73,758 289.1 21.0 21.41999/00 $22,021 $76,514 287.8 20.2 22.12000/01 $22,999 $75,197 305.9 18.5 N/A2001/02 $26,735 $78,708 339.7 16.7 N/A2002/03 $29,092 $80,051 363.4 16.5 N/A2003/04 $27,665 $80,000 345.8 19.1 N/A
Sources: Instructional Costs per COFO-UO Annual Report. Average Salary per Statistics Canada Reports on salaries for full-time teaching staff.
FTE faculty = total academic salaries (per COFO-UO)/average salary (per Statistics Canada). Ontario Universities Ratio per Council of Ontario Universities, Facts & Figures.
Note:Commencing 1998/99, total instructional costs no longer include laboratory technicians per CICA Handbook changes.
Institutional AnalysisAugust 2005
Institutional Analysis RATIOS.WK4
47

SECTION 4 - FINANCIAL DATA
Revenue by Source and Type of Fund
Expenses by Object and Type of Fund
Operating Income and Expenditures
Revenue from Research Grants and Contracts
Internal Scholarships, Bursaries and Awards
Donations and Bequests

LAKEHEAD UNIVERSITY REVENUE BY SOURCE AND TYPE OF FUNDFOR THE FISCAL YEAR ENDING APRIL 30th(IN THOUSANDS OF DOLLARS)
SOURCE 1995/96 1996/97 1997/98 1998/99 1999/00 2000/01 2001/02 2002/03 2003/04 2004/05 2005/06
1. GOVERNMENT GRANTS AND CONTRACTS (A) ONTARIO MET (I) FORMULA 24,278 21,999 21,878 21,873 22,325 22,657 24,518 24,774 25,305 27,761 30,694 (II) EXTRA FORMULA 6,559 3,760 4,046 4,046 8,647 8,492 6,938 10,273 16,540 20,599 20,347 (III) OTHER MET GRANTS 2,621 2,274 3,821 5,020 15,167 1,613 1,002 5,585 597 591 4,480
(B) OTHER ONTARIO GRANTS 2,492 1,467 1,028 1,324 1,459 2,145 2,984 5,706 3,269 5,312 1,932
TOTAL ONTARIO GRANTS $35,950 $29,500 $30,773 $32,263 $47,598 $34,907 $35,442 $46,338 $45,711 $54,263 $57,453
(C) FEDERAL 2,205 1,641 2,222 2,419 3,356 3,655 6,822 10,145 5,953 9,508 8,536
(D) MUNICIPAL 0 0 0 50 0 2 28 25 0 0 5
(E) OTHER 0 0 732 0 334 40 34 43 12 0 68
2. FEES (A) TUITION CREDIT 16,773 18,805 20,336 21,279 22,349 22,617 22,966 25,168 29,632 31,172 31,153 (B) TUITION NON-CREDIT 476 447 256 231 204 191 454 307 187 273 391 (C) MISCELLANEOUS 5,012 4,747 4,690 6,042 5,265 1,479 1,526 1,559 1,934 2,290 2,504
3. BORROWINGS 0 0 0 0 0 0 0 0 13,600 14,595 100,000
4. DONATIONS, NON-GOVT GRANTS & CONTRACTS 3,015 3,646 1,236 1,136 1,475 2,433 7,641 3,178 1,962 5,575 4,477
5. SALES OF SERVICE AND PRODUCTS 6,136 6,752 7,503 6,118 10,682 13,440 10,755 12,294 13,363 13,061 13,676
6. INVESTMENT INCOME 1,311 1,090 1,325 583 1,552 930 525 224 2,135 1,597 3,578
7. MISCELLANEOUS 320 671 524 893 849 1,034 1,054 3,174 1,530 1,773 1,506
TOTAL $71,198 $67,299 $69,597 $71,014 $93,664 $80,728 $87,247 $102,455 $116,019 $134,107 $223,347
Source: Table 2, Council of Ontario Universities COFO-UO Reports
Institutional AnalysisApril 2007
COUFOUREV.WK4
49

LAKEHEAD UNIVERSITY EXPENSES BY OBJECT AND TYPE OF FUND FOR THE FISCAL YEAR ENDING APRIL 30th(IN THOUSANDS OF DOLLARS)
OBJECT OF EXPENSE 1995/96 1996/97 1997/98 1998/99 1999/00 2000/01 2001/02 2002/03 2003/04 2004/05 2005/06
1. SALARIES AND WAGES (A) ACADEMIC RANKS 18,964 18,279 18,273 17,595 20,976 20,302 24,250 26,590 24,585 26,638 28,524 (B) OTHER INSTRUCTION AND RESEARCH 6,370 5,484 5,743 5,409 2,967 4,366 4,816 5,542 6,776 7,289 7,926 (C) OTHER SALARIES AND WAGES 15,234 14,243 14,843 16,859 19,209 16,527 16,204 16,328 17,339 18,702 19,412
TOTAL SALARIES AND WAGES $40,468 $38,006 $38,859 $39,863 $43,152 $41,195 $45,270 $48,460 $48,700 $52,629 $55,862
2. EMPLOYEE BENEFITS 5,996 5,510 5,983 6,030 6,506 6,886 7,434 7,611 8,173 8,757 9,303
TOTAL SALARIES AND BENEFITS $46,564 $43,516 $44,842 $45,893 $49,658 $48,081 $52,704 $56,071 $56,873 $61,386 $65,165
3. LIBRARY ACQUISITIONS 1,442 1,297 1,334 1,391 1,448 1,608 1,528 1,614 1,699 1,648 1,760
4. EQUIPMENT & FURNITURE PURCHASE, RENTAL AND MAINTENANCE 2,002 3,074 4,849 6,026 8,282 5,107 10,498 4,198 3,894 10,573 5,277
5. OPERATIONAL SUPPLIES AND EXPENSES 4,410 4,209 3,458 3,191 5,796 6,549 6,393 7,402 7,814 8,517 9,459
6. COST OF GOODS SOLD 3,635 3,689 4,120 4,681 5,182 5,927 5,679 6,549 6,124 5,713 5,806
7. UTILITIES 2,275 2,192 2,276 2,245 2,365 2,488 3,048 3,678 4,327 4,316 3,523
8. MUNICIPAL TAXES 456 433 419 411 398 379 371 364 387 439 490
9. RENOVATIONS AND ALTERATIONS 229 134 45 191 40 1,936 4,411 1,249 1,386 2,634 2,741
10. EXTERNALLY CONTRACTED SERVICES 2,125 1,751 1,705 1,474 1,728 177 238 254 412 452 509
11. SCHOLARSHIPS, BURSARIES, ETC. 1,276 1,465 1,953 2,433 3,174 3,784 4,235 5,079 5,721 6,198 6,631
12. PRINCIPAL AND INTEREST REPAYMENTS 1,794 1,739 1,526 1,566 1,556 1,507 1,458 1,828 4,152 4,782 5,775
13. LAND AND SITE SERVICES 21 0 0 0 0 0 0 0 0 0 0
14. BUILDINGS 0 0 0 0 0 0 0 0 0 0 0
15. MISCELLANEOUS 4,084 3,424 3,220 3,664 1,728 2,455 2,412 3,073 3,007 3,005 3,085
16. INTERNAL COST ALLOCATIONS 0 17 0 0 0 0 0 0 0 0 0
17. EXTERNAL COST RECOVERIES (846) (899) (1,183) (1,235) (1,820) (1,238) (1,257) (1,345)
TOTAL $70,313 $66,940 $69,747 $72,320 $80,456 $78,815 $91,740 $89,539 $94,558 $108,406 $108,876
Source: Table 4, Council of Ontario Universities COFO-UO Reports
Note: Based on changes in the CICA Handbook which COFO-UO is adhering to, external cost recoveries are not netted between the other expense categories
Institutional AnalysisApril 2007
COFOUEXP.WK4
50
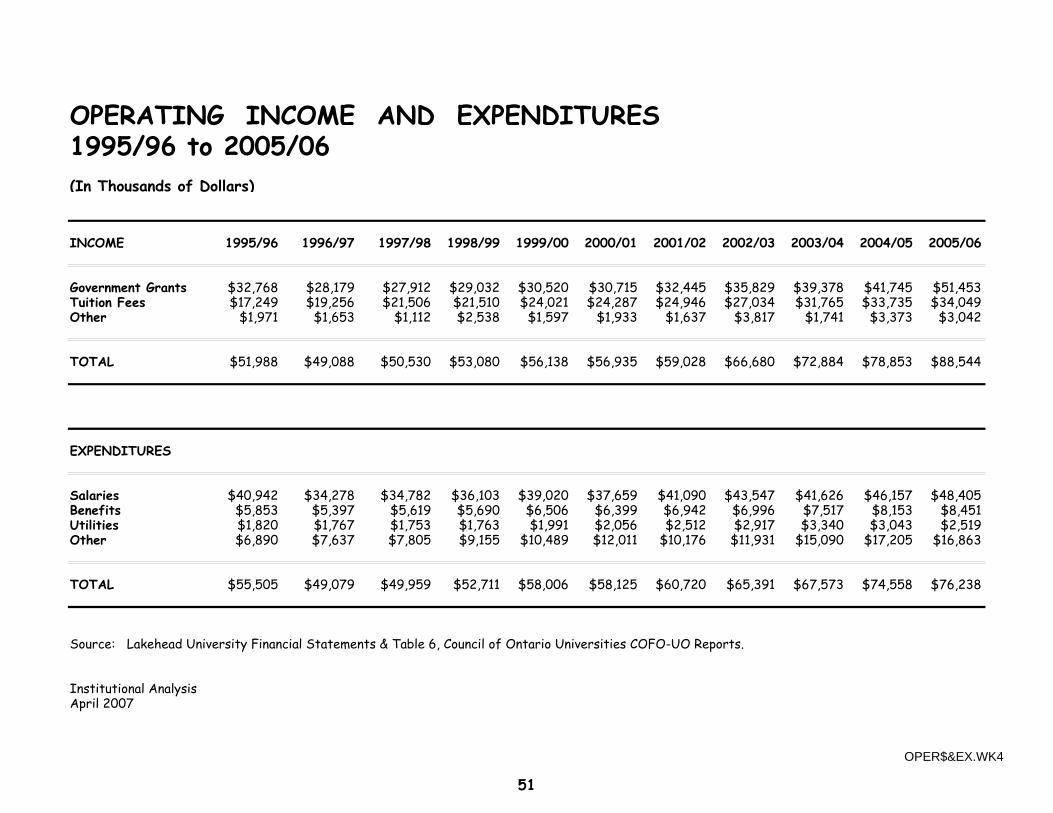
OPERATING INCOME AND EXPENDITURES1995/96 to 2005/06(In Thousands of Dollars)
INCOME 1995/96 1996/97 1997/98 1998/99 1999/00 2000/01 2001/02 2002/03 2003/04 2004/05 2005/06
Government Grants $32,768 $28,179 $27,912 $29,032 $30,520 $30,715 $32,445 $35,829 $39,378 $41,745 $51,453Tuition Fees $17,249 $19,256 $21,506 $21,510 $24,021 $24,287 $24,946 $27,034 $31,765 $33,735 $34,049Other $1,971 $1,653 $1,112 $2,538 $1,597 $1,933 $1,637 $3,817 $1,741 $3,373 $3,042
TOTAL $51,988 $49,088 $50,530 $53,080 $56,138 $56,935 $59,028 $66,680 $72,884 $78,853 $88,544
EXPENDITURES
Salaries $40,942 $34,278 $34,782 $36,103 $39,020 $37,659 $41,090 $43,547 $41,626 $46,157 $48,405Benefits $5,853 $5,397 $5,619 $5,690 $6,506 $6,399 $6,942 $6,996 $7,517 $8,153 $8,451Utilities $1,820 $1,767 $1,753 $1,763 $1,991 $2,056 $2,512 $2,917 $3,340 $3,043 $2,519Other $6,890 $7,637 $7,805 $9,155 $10,489 $12,011 $10,176 $11,931 $15,090 $17,205 $16,863
TOTAL $55,505 $49,079 $49,959 $52,711 $58,006 $58,125 $60,720 $65,391 $67,573 $74,558 $76,238
Source: Lakehead University Financial Statements & Table 6, Council of Ontario Universities COFO-UO Reports.
Institutional AnalysisApril 2007
OPER$&EX.WK4
51
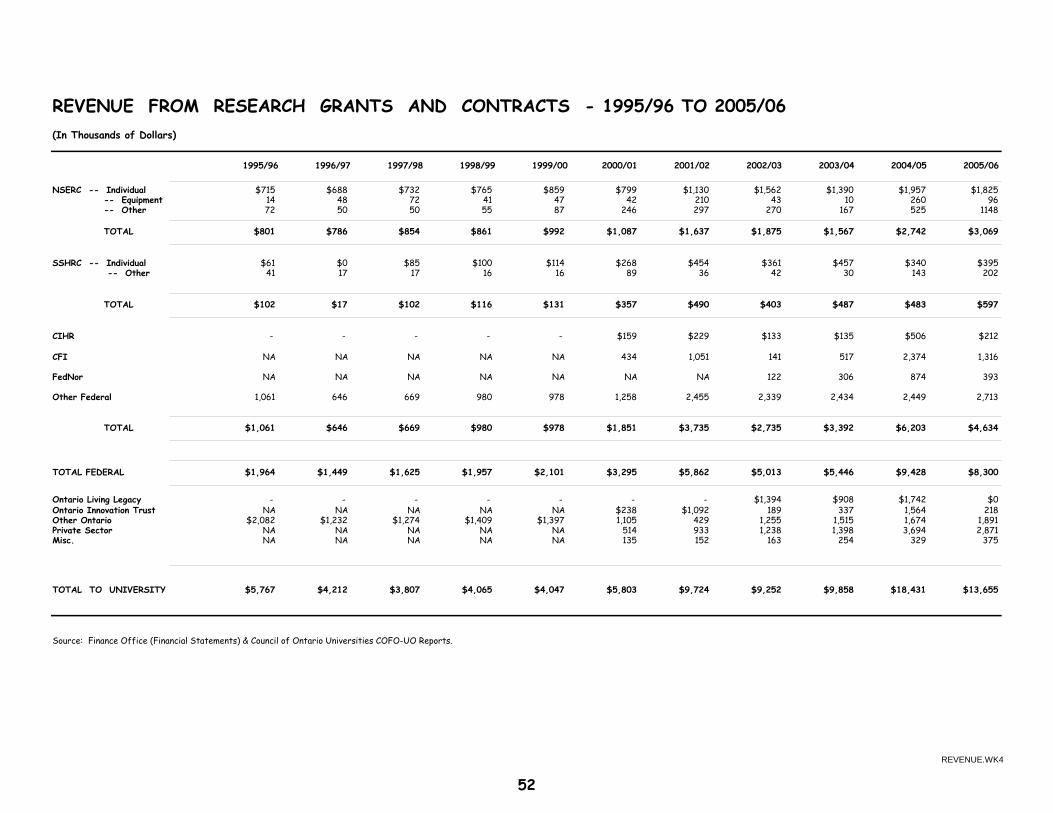
REVENUE FROM RESEARCH GRANTS AND CONTRACTS - 1995/96 TO 2005/06(In Thousands of Dollars)
1995/96 1996/97 1997/98 1998/99 1999/00 2000/01 2001/02 2002/03 2003/04 2004/05 2005/06
NSERC -- Individual $715 $688 $732 $765 $859 $799 $1,130 $1,562 $1,390 $1,957 $1,825 -- Equipment 14 48 72 41 47 42 210 43 10 260 96 -- Other 72 50 50 55 87 246 297 270 167 525 1148
TOTAL $801 $786 $854 $861 $992 $1,087 $1,637 $1,875 $1,567 $2,742 $3,069
SSHRC -- Individual $61 $0 $85 $100 $114 $268 $454 $361 $457 $340 $395 -- Other 41 17 17 16 16 89 36 42 30 143 202
TOTAL $102 $17 $102 $116 $131 $357 $490 $403 $487 $483 $597
CIHR - - - - - $159 $229 $133 $135 $506 $212
CFI NA NA NA NA NA 434 1,051 141 517 2,374 1,316
FedNor NA NA NA NA NA NA NA 122 306 874 393
Other Federal 1,061 646 669 980 978 1,258 2,455 2,339 2,434 2,449 2,713
TOTAL $1,061 $646 $669 $980 $978 $1,851 $3,735 $2,735 $3,392 $6,203 $4,634
TOTAL FEDERAL $1,964 $1,449 $1,625 $1,957 $2,101 $3,295 $5,862 $5,013 $5,446 $9,428 $8,300
Ontario Living Legacy - - - - - - - $1,394 $908 $1,742 $0Ontario Innovation Trust NA NA NA NA NA $238 $1,092 189 337 1,564 218Other Ontario $2,082 $1,232 $1,274 $1,409 $1,397 1,105 429 1,255 1,515 1,674 1,891Private Sector NA NA NA NA NA 514 933 1,238 1,398 3,694 2,871Misc. NA NA NA NA NA 135 152 163 254 329 375
TOTAL TO UNIVERSITY $5,767 $4,212 $3,807 $4,065 $4,047 $5,803 $9,724 $9,252 $9,858 $18,431 $13,655
Source: Finance Office (Financial Statements) & Council of Ontario Universities COFO-UO Reports.
REVENUE.WK4
52

LAKEHEAD UNIVERSITY INTERNAL SCHOLARSHIPS, BURSARIES AND AWARDS
UNDERGRADUATE & GRADUATE 1995/96 1996/97 1997/98 1998/99 1999/00 2000/01 2001/02 2002/03 2003/04 2004/05 2005/06
Admission Scholarship $251,337 $396,898 $333,468 $293,992 $325,509 $444,602 $497,430 $467,345 $516,108 $585,637
In-Course Scholarship $519,338 $412,991 $403,670 $375,754 $384,695 $412,795 $461,844 $522,030 $564,184 $686,824
Graduate Awards $218,550 $274,819 $316,039 $322,580 $354,406 $464,564 $519,764 $454,397 $667,550 $1,949,104
Bursaries $287,411 $380,787 $900,043 $1,441,009 $2,109,172 $2,462,979 $2,755,635 $3,634,511 $3,739,385 $2,747,435
TOTAL $1,276,636 $1,465,495 $1,953,220 $2,433,335 $3,173,782 $3,784,940 $4,234,673 $5,078,283 $5,487,227 $5,969,000 $6,632,000
INCREASE 6.5% 14.8% 33.3% 24.6% 30.4% 19.3% 11.9% 19.9% 8.1% 8.8%
1) Graduate awards include: all endowed awards, Faculty Research Scholarships, Lakehead portion of OGSST and OGS.2) Figures do not include Canada Scholarships, CIDA, OGS, and other externally awarded scholarships.3) In addition to the OGS Open Scholarships, ten institutional scholarships are available for Lakehead students.4) Increase in 1993/94 bursaries due to additional Disability Grants, Ontario Special Bursaries and Child Care Bursaries andgraduate awards due to Saunders endowment.5) Increase in 1997/98 (and subsequent years) bursaries due in part to OSOTF but mainly to an increase in the reinvestment tuition fund.
Institutional AnalysisApril 2007
BURSARIE.WK4
53
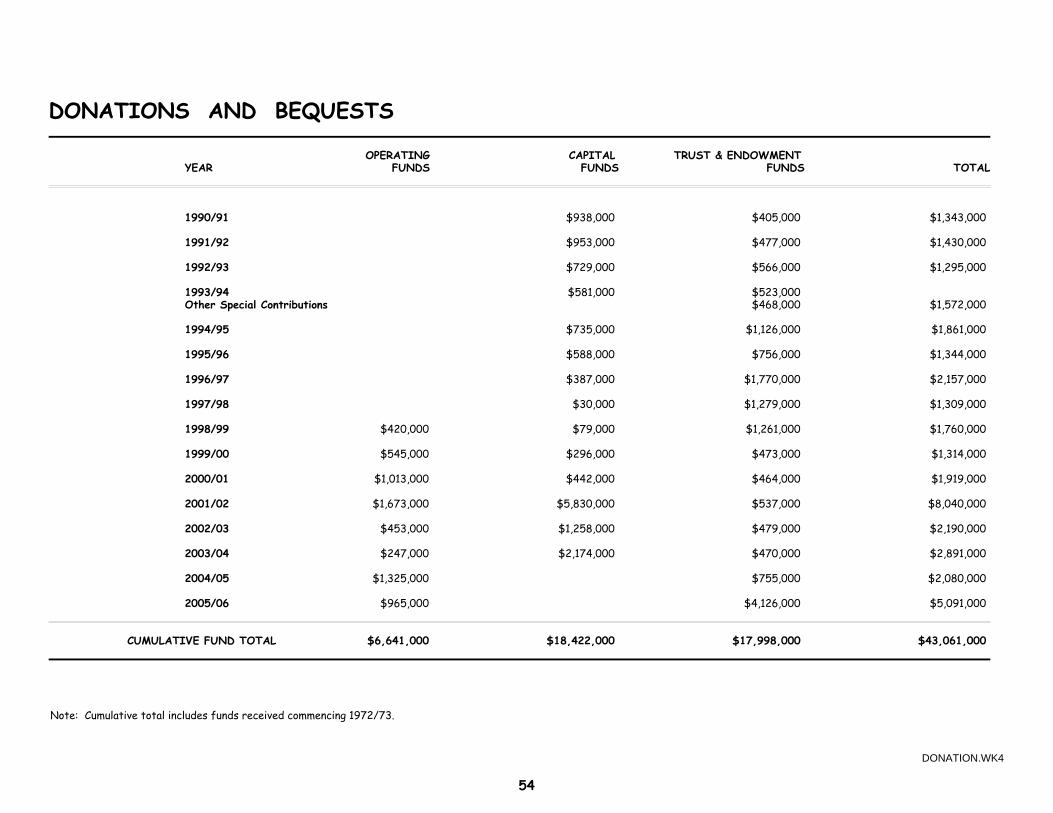
DONATIONS AND BEQUESTS
OPERATING CAPITAL TRUST & ENDOWMENTYEAR FUNDS FUNDS FUNDS TOTAL
1990/91 $938,000 $405,000 $1,343,000
1991/92 $953,000 $477,000 $1,430,000
1992/93 $729,000 $566,000 $1,295,000
1993/94 $581,000 $523,000Other Special Contributions $468,000 $1,572,000
1994/95 $735,000 $1,126,000 $1,861,000
1995/96 $588,000 $756,000 $1,344,000
1996/97 $387,000 $1,770,000 $2,157,000
1997/98 $30,000 $1,279,000 $1,309,000
1998/99 $420,000 $79,000 $1,261,000 $1,760,000
1999/00 $545,000 $296,000 $473,000 $1,314,000
2000/01 $1,013,000 $442,000 $464,000 $1,919,000
2001/02 $1,673,000 $5,830,000 $537,000 $8,040,000
2002/03 $453,000 $1,258,000 $479,000 $2,190,000
2003/04 $247,000 $2,174,000 $470,000 $2,891,000
2004/05 $1,325,000 $755,000 $2,080,000
2005/06 $965,000 $4,126,000 $5,091,000
CUMULATIVE FUND TOTAL $6,641,000 $18,422,000 $17,998,000 $43,061,000
Note: Cumulative total includes funds received commencing 1972/73.
DONATION.WK4
54
SECTION 5 - SPACE
University Land
Distribution of Physical Space
Residence Accommodation
Campus Map
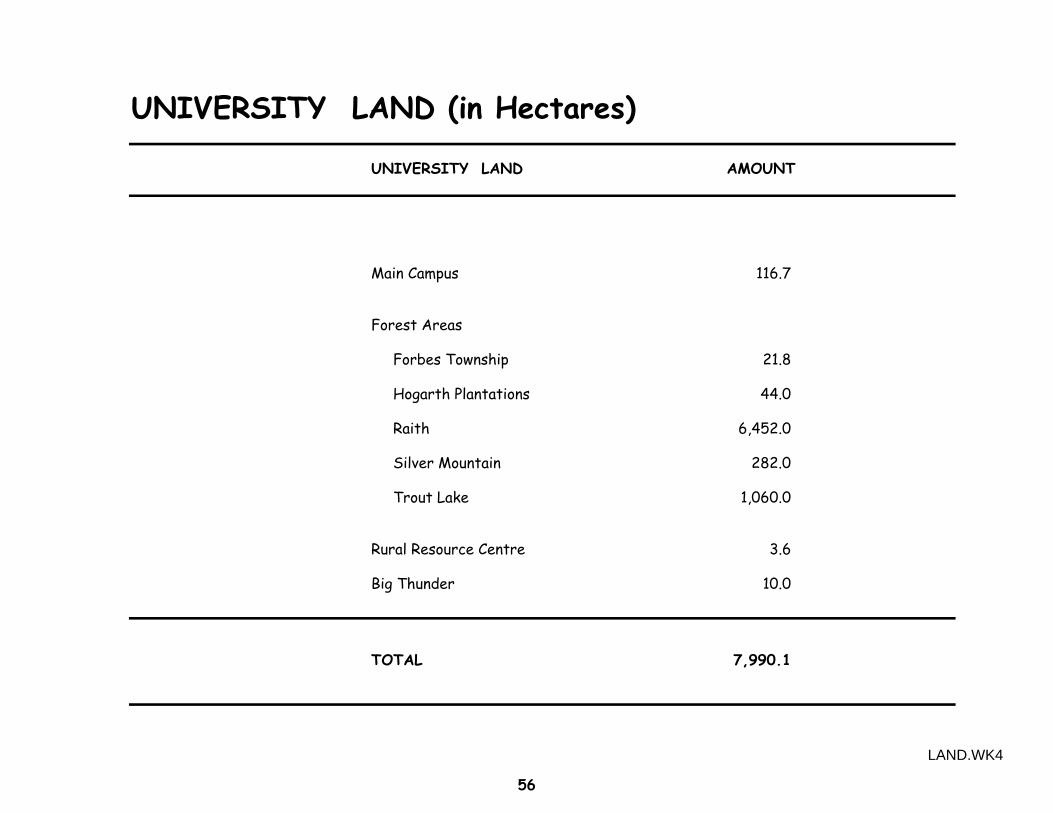
UNIVERSITY LAND (in Hectares)
UNIVERSITY LAND AMOUNT
Main Campus 116.7
Forest Areas
Forbes Township 21.8
Hogarth Plantations 44.0
Raith 6,452.0
Silver Mountain 282.0
Trout Lake 1,060.0
Rural Resource Centre 3.6
Big Thunder 10.0
TOTAL 7,990.1
LAND.WK4
56
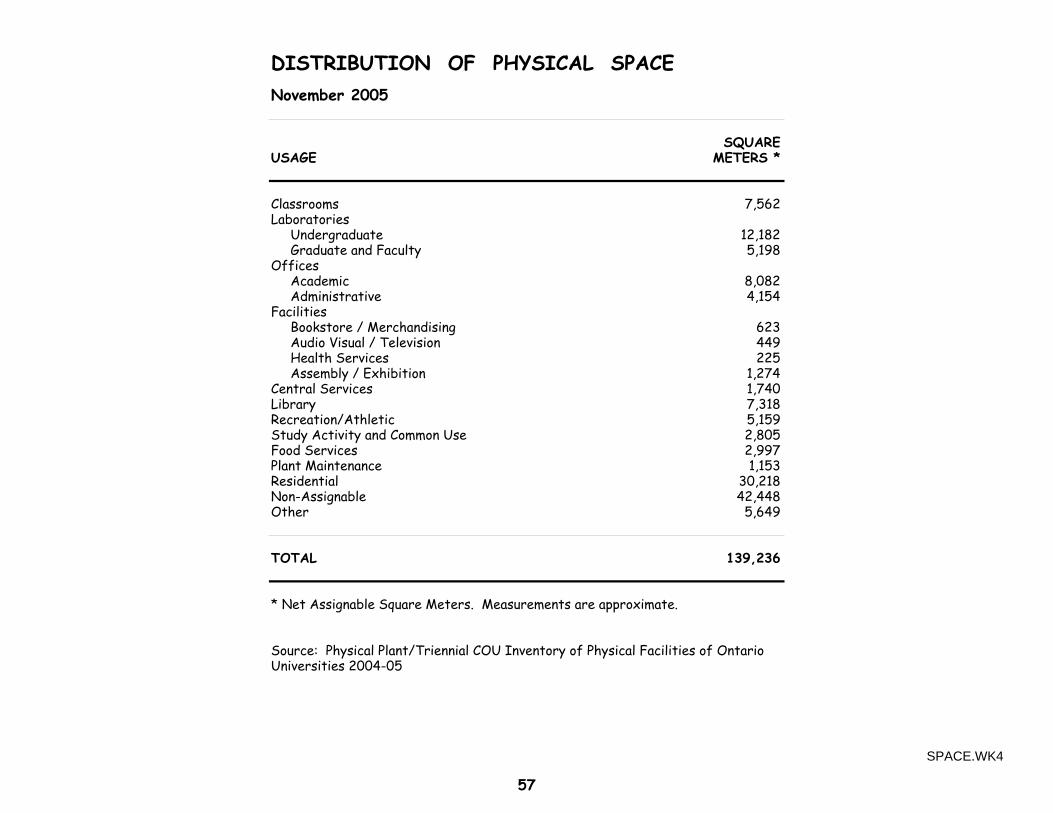
DISTRIBUTION OF PHYSICAL SPACENovember 2005
SQUAREUSAGE METERS *
Classrooms 7,562Laboratories Undergraduate 12,182 Graduate and Faculty 5,198Offices Academic 8,082 Administrative 4,154Facilities Bookstore / Merchandising 623 Audio Visual / Television 449 Health Services 225 Assembly / Exhibition 1,274Central Services 1,740Library 7,318Recreation/Athletic 5,159Study Activity and Common Use 2,805Food Services 2,997Plant Maintenance 1,153Residential 30,218Non-Assignable 42,448Other 5,649
TOTAL 139,236
* Net Assignable Square Meters. Measurements are approximate.
Source: Physical Plant/Triennial COU Inventory of Physical Facilities of OntarioUniversities 2004-05
SPACE.WK4
57

RESIDENCE ACCOMMODATION
TOTAL ACCOMMODATION
1996/97 1997/98 1998/99 1999/00 2000/01 2001/02 2002/03 2003/04 2004/05 2005/06 2006/07
Apartments 288 288 288 288
Dormitories 709 711 711 672 650 615 640 639 625 564 505
Townhouses 430 430 430 430 430 430 430 430 430 430 430
Total 1139 1141 1141 1102 1080 1045 1070 1357 1343 1282 1223
FEES
1996/97 1997/98 1998/99 1999/00 2000/01 2001/02 2002/03 2003/04 2004/05 2005/06 2006/07
Single $2,484 $2,549 $2,796 $2,852 $2,909 $3,218 $3,420 $3,724 $3,911 $3,990 $4,184
Single - - - $3,284 $3,350 $3,670 $3,884 $4,230 $4,442 $4,535 $4,744
Double $2,237 $2,295 $2,531 $2,531 $2,582 $2,882 $3,074 $3,348 $3,516 $3,586 $3,764
Townhouse (+ Utilities) $3,403 $3,481 $3,620 $3,684 $3,750 $3,978 $4,284 $4,631 $4,863 $4,980 $5,250
Full Meal Plan $2,240 $2,284 $2,255 $2,408 $2,455 $2,523 $2,606 $2,708 $2,747 $2,983 $2,976
Apartment $4,631 $4,863 $4,980 $5,270
Lakehead University has dormitory, townhouse and apartment style residences.Dormitories offer double, basic single and single rooms.Townhouses have four single bedrooms each with the exception of two houses which have three bedrooms each. Handicap accommodation is available in the townhouses. Meal plans are required in dormitories and are available to townhouse and apartment residents. Two 144-bed apartment-style complexes opened in September 2003. The apartments have four single bedrooms (including barrier-free units).Utility fees are included in the townhouse rates as of September 2003.Dormitory double rooms converted to single rooms in 3 Bartley Houses during the summer of 2005. Dormitory double rooms converted to single rooms in Bartley and Prettie Residences during the summer of 2006.
ACCOMOD.WK4
58

59

HIGHLIGHTS OF LAKEHEAD UNIVERSITY'S ECONOMIC IMPACT ON THE CITY OF THUNDER BAY as of November 2006 $251.0Million The total economic impact of Lakehead University on the City of Thunder Bay (with multiplier of
2.14 x operating expenditures). $117.3 Million Total operating expenditures of Lakehead in 2005/06 (including operations, capital, research and
scholarships and bursaries). 2,250 Employees Lakehead University is a major employer in the City of Thunder Bay. This includes approximately
700 full-time positions. $66.0 Million Salaries and benefits paid by Lakehead University in 2005/06. $5.5 Million Monthly payroll. 7,644 Students Total number of students enrolled at Lakehead University. This includes 6,093 full-time graduate
and undergraduate students.
4,265 Students Approximately 70 % of full-time students attending Lakehead University are from outside the local commuting area.
$68.9 Million New money brought into the City of Thunder Bay by students from outside the local commuting area. $0.49 Million Paid by Lakehead University to the City of Thunder Bay in lieu of taxes. $13.7 Million Research support received by Lakehead University. $6.6 Million Paid to students this year in scholarships, bursaries and awards.
60