Embed Size (px)
Citation preview

FinancialInstitutionsCenter
Institutions, Relationships and BankCompetition in Bond UnderwritingMarkets: An InternationalComparative Study
byAyako Yasuda
01-31

The Wharton Financial Institutions Center
The Wharton Financial Institutions Center provides a multi-disciplinary research approach tothe problems and opportunities facing the financial services industry in its search forcompetitive excellence. The Center's research focuses on the issues related to managing riskat the firm level as well as ways to improve productivity and performance.
The Center fosters the development of a community of faculty, visiting scholars and Ph.D.candidates whose research interests complement and support the mission of the Center. TheCenter works closely with industry executives and practitioners to ensure that its research isinformed by the operating realities and competitive demands facing industry participants asthey pursue competitive excellence.
Copies of the working papers summarized here are available from the Center. If you wouldlike to learn more about the Center or become a member of our research community, pleaselet us know of your interest.
Franklin Allen Richard J. HerringCo-Director Co-Director
The Working Paper Series is made possible by a generousgrant from the Alfred P. Sloan Foundation
Institutions, Relationships and Bank
Competition in Bond Underwriting Markets:
An International Comparative Study
Ayako Yasuda
Wharton School
University of Pennsylvania
Preliminary and incomplete|please comment
November 2000
This version: July 2001
Abstract
This paper addresses the question of whether existing institutional di�erences in bankingsystems a�ect bank competition in capital markets. Post-deregulation competition betweenentrant commercial banks and incumbent investment banks in the Japanese corporate bondunderwriting market is empirically analyzed and compared with the results of the U.S. study in(Yasuda 2001b). I �nd that the certi�cation e�ect alone cannot explain both the di�erences andsimilarities in the results. Drawing from the comparative banking literature, I interpret these�ndings as coming from the presence of \betrayal cost" in Japan and its absence in the U.S.These di�erences in the economic roles of relationships, as shaped by di�erences in the historyof banking and corporate �nancing institutions, appear to persist in bank competition in thederegulated market.
JEL Classi�cation: G1, G2, G3, L1, L5, P5.
1

1 Introduction
Interaction of bank relationships with development of and competition in capital markets is an
underexplored and increasingly important subject of inquiry. Understanding both the short-term
and long-term linkages between relationships, competition, and markets is critically important for
comparing policy alternatives for re-designing banking regulation and buildling capital markets in
both developed and developing countries. This is especially true today, as the debate has simmered
on unresolved for decades on whether there is, has been or will be a global convergence of corporate
�nance and corporate governance institutions.
Only a decade ago the bank-based systems of Japan and Germany were widely perceived
to be the superior ones, and many supporters advocated adaptation of their systems to developing
and transforming economies. The Anglo-American model of market principles has then taken over,
as Japan sank into a debilitating banking crisis and the emerging markets became the rage among
investors. The prospect of a global convergence into the Anglo-American standard of corporate
�nance and governance has since long been predicted by its proponents.
Curiously, during the same period, U.S. and Japan overhauled their regulation to restore
universal banking, a banking system best represented by Germany. Commercial banks in the U.S.
and Japan were allowed to enter securities underwriting business to earn fees in capital markets,
among other investment banking activities that were hitherto prohibited to them. Debt capital
markets grew in these two countries, and consolidation in the industry sped up.
Having the two countries with distinct �nancial systems thus implementing similar dereg-
ulations motivates an interesting question of whether existing institutional di�erences in banking
systems a�ect bank competition in capital markets. There is also a broader question of whether
deregulation of capital markets will lead to disappearance of the institutional di�erences and con-
vergence of the systems toward a market-based, Anglo-American system. Is the convergence oc-
curring? If so, to what mode of organization are we converging? To the Anglo-American model, or
to universal banking, or both? Or are those categorizations becoming less useful to understand the
true underlying structure of dynamic relationships between institutions and markets? Financial
systems across the industrialized world today continue to be in a state of ux, and this state calls
for a new, economic and empirical work to investigate how existing relationships and institutions
2
interact with policy changes to determine the new mode of competition in marketplace. Findings
on this mechanism in the short-run will provide us with underpinnings for the long-run dynamics
between relationships, institutions, and markets. This paper investigates these questions by study-
ing post-deregulation competition between entrant commercial banks and incumbent investment
banks in the Japanese corporate bond underwriting market and comparing the results with those
of the U.S. study in (Yasuda 2001b).
The international comparisons were conducted based on the following two hypotheses.
First, the banking literature often emphasizes di�erences between market-based �nancial systems
of the U.S./U.K. and bank-based �nancial systems of Japan and Germany. 1 The certi�cation
hypothesis predicts that a pre-existing banking relationship a�ects a �rm's demand for underwriting
service from a bank positively. The U.S.-Japan contrast suggests that the positive e�ect of bank
relationships on underwriter demand is stronger in Japan than in the U.S.
Second, the Japanese main bank system is characterized by the multi-faceted, state-
contingent nature of relationships and reciprocal delegation of monitoring among banks ((Aoki
and Patrick 1994)). These institutional features in contrast to the American regime of arm's length
banking predicts that Japanese �rms are more constrained by the betrayal cost of switching from
existing relationship(s) with their banks than American �rms. In other words, existence of such
a relationship lowers relative demand for underwriting service by rival commercial banks (but not
investment banks).
Like the U.S. results, I �nd that a previous loan relationship a�ects a Japanese �rm's
demand for a given bank's underwriting service positively. I also �nd that issuers with lower credit
ratings value bank relationships more, which is qualitatively similar to the U.S. result.
I �nd that the valuation of bank relationship (��) is not higher in Japan than in the U.S.,
while the \dissimilarity coe�cient" (�) is lower in the modi�ed nest for Japan but not in the
U.S. The certi�cation alone cannot explain both the similarity result (in ��) and the di�erence
result (in �). Something more is at work. Drawing from the institutional di�erences that have
been documented in the literature, I interpret these results as coming from the di�erences in the
relative weights on one-shot versus long-term payo�s of having/keeping bank relationships in the
1See (Allen and Gale 2000) on the subject of comparing �nancial systems, and (Roe 1994) and (Aoki and Patrick
1994) for development of banking/�nancial systems in the U.S. and Japan, respectively.
3
two countries.
In the U.S. bond underwriting market, the one-time payo� of certi�cation appears to be
the �rst-order economic role of existing relationships, whereas in Japan, the long-term bene�t of
not switching appears to play an economic role of the same magnitude as the weaker-than-the U.S.,
(and potentially negative) one-shot payo� of choosing a bank with relationships. Certi�cation alone
cannot explain why commercial banks without relationships are signi�cantly worse o� when there
are other commercial banks with relationships than when they face no rival commercial banks with
relationships. In fact, net certi�cation need not be present to explain this negative cross-bank e�ect
and the positive own-e�ect of relationships as long as preservation of long-term relationships value
predominates the �rm's choice problem. These di�erences in the economic roles of relationships,
as shaped by the di�erences in the history of banking and corporate �nancing institutions, appear
to persist in bank competition in the deregulated market.
What emerges from the experiences of �nancial deregulation in the two countries is a pic-
ture of the banking industry where imperfect competition is persistent, and where the time-varying
values of bank-�rm relationships play a pivotal role in determining the nature of competition. It
is an industry where the relative values of relationships that �rms maintain with both their com-
mercial and investment bankers are co-determined by both the �rm-level (time-varying) variations,
such as the �rms' newness to (and reliance on) the �nancial markets, and the country-level (also
time-varying) variations, such as the degree of reliance on capital markets for external �nancing
by corporate issuers in general. These variations explain why commercial banks made pro�table
entry into the corporate bond market while second-tier investment banks stayed outside. They
also explain why their entry resulted in only modest competitive gain in the market. While the
empirical analysis is that of a short-run equilibrium, the results set in the broader context of com-
parative banking literature suggest long-term path dependence of these international di�erences in
the linkage between institutions, relationships and markets.
The remainder of the paper is organized as follows. Section 2 reviews related branches
of the corporate �nance literature. Section 3 describes the banking regulation and historical de-
velopment of the corporate bond underwriting market in Japan. Section 4 explains the empirical
speci�cation used to estimate the demand model. Section 5 describes the data and de�nes the ex-
planatory variables to be included in the estimation, and Section 6 presents the estimation results.
4
Section 7 interprets and analyzes the economic implications of these demand and price estimates.
Section 8 reports a small extension of the analysis of the Japanese data. Section 9 concludes.
2 Prior and Related Literature
2.1 Analysis of the Japanese Banking System
The Japanese �nancial system has been studied in both banking and corporate governance literature
as a major alternative or benchmark to the U.S.-style �nancial system. See (Aoki and Patrick 1994)
for a collective volume of articles on the the subject covering institutional, regulatory, legal and
contractual aspects of the so-called Main Bank System in Japan as well as studies comparing it
with banking systems of various developing and transforming economies. In the book, the Japanese
main bank system is characterized by the multi-faceted, state-contingent nature of relationships
and reciprocal delegation of monitoring among banks. 2 Also see (Hoshi, Kashyap, and Scharfstein
90a) and (Hoshi, Kashyap, and Scharfstein 1990) for empirical analyses of Japanese corporate
banking relationships, and (Hoshi, Kashyap, and Scharfstein 1993) and (Hoshi and Kashyap 1999)
for discussions of �nancial deregulation and its rami�cations.
2.2 Related Literature in Corporate Finance
2.2.1 The Monitoring Role of Commercial Banks
The theory of �nancial intermediation has stressed the unique monitoring function of commercial
banks. A number of papers argue that banks have scale economies and comparative cost advantages
over other lenders (including individual bondholders) in producing information about the borrow-
ers. 3 In particular, it has been argued that a bank loan renewal creates two positive externalities
for the �rm. It enables other fund providers to avoid duplicating the costly evaluation process, and
it also provides certi�cation of the �rm's payment ability to the public. (James 1987) investigates
2See Figure 1 and Table 1, for matrix representation of the main bank system, as well as the taxonomy of banking
systems, both from (Aoki and Patrick 1994).3(Leland and Pyle 1977), (Diamond 1984), (Fama 1985). Also, see (Ongena and Smith 1998) for a literature
survey on topics involving bank relationships.
5

Figu
re1:
TheMatrix
Represen
tationof
Main
BankRelation
s
Financial State of the FirmExcellent Favourable Normal Critical
α ( x ) x [ x ]Nature of β ( x ) xMain Bank χ x x x xRelations δ x x x x
ε ( x ) ( x ) x [ x ]
α : Bank loansβ : Bond issue related service *χ : Shareholdingδ : Payment settlement accountsε : The supply of management information and resourcesx : --indicates this role performed in this financial state[ x ] : --indicates this role performed strongly in this financial state( x ) : --indicates this role performed weakly in this financial state
Source: Aoki and Patrick (1994)
* The original table in the source specifies this service as "trustee administrator in the case of domestic issues
and co-lead management in the case of Euro issue", reflecting the regulation of the time. Since then banks have been allowed
to underwrite domestic issues as well.
6
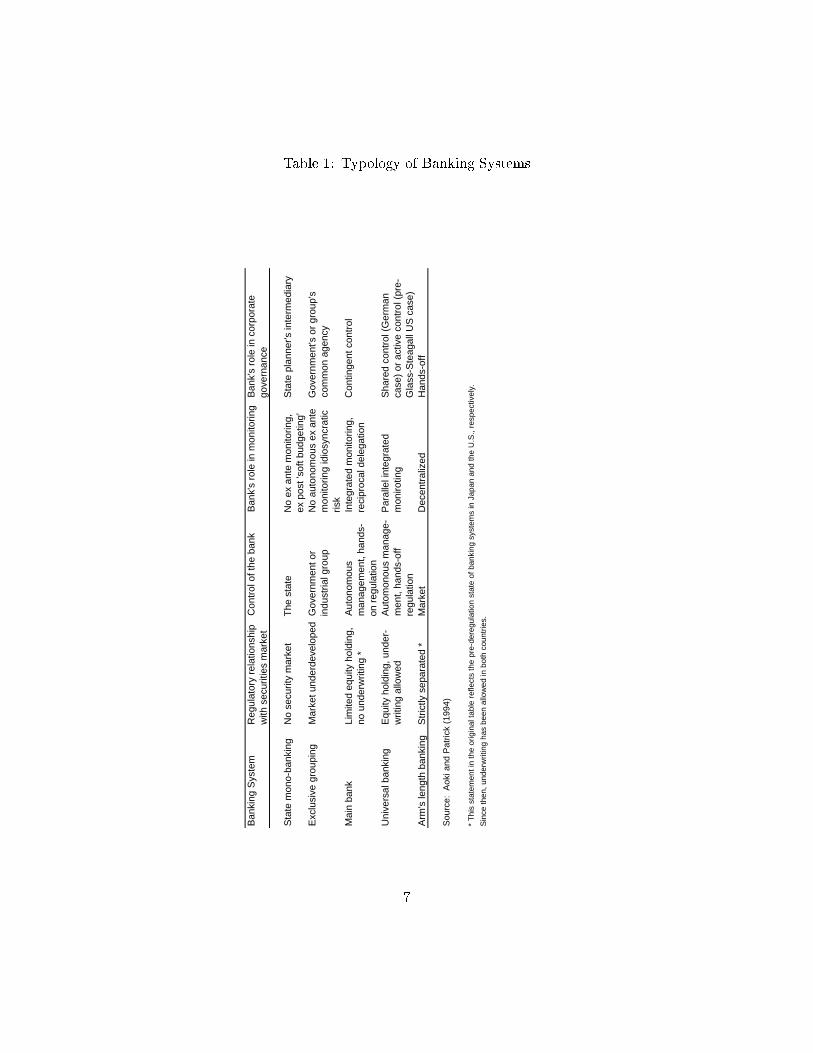
Table 1: Typology of Banking Systems
Ban
king
Sys
tem
R
egul
ator
y re
latio
nshi
pC
ontr
ol o
f the
ban
k B
ank'
s ro
le in
mon
itorin
gB
ank'
s ro
le in
cor
pora
tew
ith s
ecur
ities
mar
ket
gove
rnan
ce
Sta
te m
ono-
bank
ing
No
secu
rity
mar
ket
The
sta
teN
o ex
ant
e m
onito
ring,
S
tate
pla
nner
's in
term
edia
ryex
pos
t 'so
ft bu
dget
ing'
Exc
lusi
ve g
roup
ing
Mar
ket u
nder
deve
lope
d G
over
nmen
t or
No
auto
nom
ous
ex a
nte
Gov
ernm
ent's
or
grou
p's
indu
stria
l gro
upm
onito
ring
idio
sync
ratic
com
mon
age
ncy
risk
Mai
n ba
nkLi
mite
d eq
uity
hol
ding
, A
uton
omou
s In
tegr
ated
mon
itorin
g,
Con
tinge
nt c
ontr
olno
und
erw
ritin
g *
man
agem
ent,
hand
s-re
cipr
ocal
del
egat
ion
on r
egul
atio
nU
nive
rsal
ban
king
E
quity
hol
ding
, und
er-
Aut
omon
ous
man
age-
Par
alle
l int
egra
ted
Sha
red
cont
rol (
Ger
man
writ
ing
allo
wed
men
t, ha
nds-
off
mon
irotin
gca
se)
or a
ctiv
e co
ntro
l (pr
e-re
gula
tion
Gla
ss-S
teag
all U
S c
ase)
Arm
's le
ngth
ban
king
Str
ictly
sep
arat
ed *
Mar
ket
Dec
entr
aliz
ed
Han
ds-o
ff
Sou
rce:
Aok
i and
Pat
rick
(199
4)
* T
his
stat
emen
t in
the
orig
inal
tabl
e re
flect
s th
e pr
e-de
regu
latio
n st
ate
of b
anki
ng s
yste
ms
in J
apan
and
the
U.S
., re
spec
tivel
y.
Sin
ce th
en, u
nder
writ
ing
has
been
allo
wed
in b
oth
coun
trie
s.
7
this idea by measuring the average stock price reaction of �rms that publicly announce a bank loan
agreement or renewal. Consistent with certi�cation e�ect of bank loans, he �nds that bank loan
announcements are associated with positive and statistically signi�cant stock price reactions.
Other papers, such as the one by (Chemmanur and Fulghieri 1994), attribute the moni-
toring ability of banks to their incentive to build their own reputations as lenders. (Chemmanur
and Fulghieri 1994) model a �rm's choice between bank loans and bonds, allowing for debt rene-
gotiation in the event of �nancial distress. The main implication of the model is that the desire of
the banks to acquire a reputation for making the \right" renegotiation versus liquidation decisions
gives them an endogenous incentive to devote more resources towards evaluating a �rm's value
than bondholders. These papers suggest that commercial banks have closer, longer-term, and more
exclusive relationships with their borrowers than other types of lenders. These views support the
use of pre-existing relationship variables in my model as a measure of e�ectiveness in information
production as underwriters. In a related empirical study, (Datta, Iskandar-Datta, and Patel 1999)
�nd that the existence of bank debt (with any bank and not necessarily with the underwriting
bank) lowers the at-issue yield for �rst public straight bond o�ers.
Several papers 4 study the implications of commercial bank underwriting using game-
theoretic models. They demonstrate that even with the assumption of rational investors, a potential
social cost to the combining of investment banking and commercial banking cannot be ruled out.
The existence and magnitude of the con ict of interest problem depends on the cost of information
production by the two types of banks, the timing of their access to a �rm's private information,
investors' beliefs about the quality of the �rms underwritten by commercial banks, etc.{none of
which are easily measurable. There are also a group of articles which pursue this issue empirically.
These articles investigate whether there is a signi�cant di�erence in the level of the ex post default
rate and ex ante yield of bonds between commercial bank underwriters and investment bank un-
derwriters. 5 Their statistical models yield descriptive interpretations of the data. They generally
conclude that there is no detectable con ict of interest in the data with the exception of (Hamao
4(Kanatas and Qi 1998), (Rajan 1992), (Puri 1999).5See (Ang and Richardson 1994), (Kroszner and Rajan 1994), and (Puri 1994) for default rate studies using pre-
Glass-Steagall historical data. See (Puri 1996), (Gande, Puri, Saunders, and Walter 1997), and (Hamao and Hoshi
1999) for studies on ex ante yield.
8

and Hoshi 1999) and in some cases there is a net certi�cation e�ect.
2.2.2 A Reputation Model of the Firm's Debt Choice
(Diamond 1991) uses the borrowing �rm's reputation in explaining the choice between bank loans
and bonds. The main result of the paper is that �rm reputation and bank monitoring (of the �rm's
investment decisions) are substitutes. The intuition for this result is as follows: Young �rms and old
�rms without reputations tend to rely more on bank loans, because they do not have reputations
to lose and therefore bank monitoring is needed to enforce e�cient investment decisions. Large
established �rms with good reputations, on the other hand, do have a reputation to lose and
therefore have su�cient incentive to choose e�cient investment decisions. Bank monitoring is
costly, and thus this class of �rms will prefer to issue bonds.
The model implies that there is an intertemporal linkage between bank loans today and the
�rm's decision to issue bonds in the future: \A borrower's credit record acquired when monitored
by a bank serves to predict future actions of the borrower when not monitored" (p.690). This
suggests that the monitoring of �rms by commercial banks in the loan market can become an asset
in another market, e.g., when such banks become underwriters in the bond market. 6 Moreover, this
substitution between bank monitoring and �rm reputation implies that issuers with low reputation
value their loan relationship with underwriting banks more than those with high reputation.
3 The Banking Regulation and Historical Development of the
Corporate Bond Underwriting Market in Japan
In the literature on comparative �nancial systems, Japan is categorized as having a bank-based
system of relationship �nance in contrast to the \spot market" model of anonymous transactions
6Alternatively, the lending bank might be chosen as underwriter because the �rm prefers to keep a single-bank
relationship in all �nancial services provided by commercial banks. The impact of the multiple- vs. single-bank
relationships on credit availability, pricing, and �rm performance is mixed. While (Petersen and Rajan 1994) and
(Petersen and Rajan 1995) demonstrate that multiple-bank �rms are more credit constrained (and face higher interest
payments) than single-bank �rms, (Houston and James 1996) conclude the opposite.
9
best represented by the U.S. But less often documented is the fact that Japan has one of the
largest capital markets (both stock and bonds) outside of the U.S. 7 as well as a history of banking
regulation that at least partially mimicked that of the U.S. following the Second World War. Thus
for the purpose of this paper I describe historical development of the present day �nancial system in
Japan which has come to possess substantial elements of both bank-based as well as market-based
institutions.
3.1 Historical Overview of the Japanese Financial System
3.1.1 Pre-War Period (1900-1938)
In pre-World War II Japan, a system very di�erent from what is perceived today as the main
bank system existed. It is characterized by, on one hand, powerful stockowners, most notably
zaibatsu families such as Iwasaki (later Mitsubishi), Mitsui, Sumitomo and Yasuda, who controlled
their conglomerate corporate groups through private holding companies, and, on the other hand,
relatively weak and numerous banks as lenders.
Both zaibatsu and non-zaibatsu �rms relied more heavily on retained earnings and equity
than they did on bank loans. Banks were relatively small, numerous and fragile, both because of
free entry (until 1933) and the limited diversi�cation of the banks' loan portfolio.
1927 Bank Law led to separation of sales and trading business from banking while still
allowing underwriting activities by banks 8 For example, the present-day Big Four securities houses
were all created as spin-o�s of banks in the pre-war period. 9 These o�-shoots of banks obtained
underwriting licenses pursuant to the 1938 Underwriting Law.
Meanwhile, the 1927 Bank Law allowed certain securities businesses as auxiliary operations
of banks. Thus banks continued to operate some investment banking businesses. 10 For example,
these banks were dominant players in underwriting public and corporate bonds. It seems that a
territorial division was drawn between bonds and equity, where securities �rms specialized in equity
7See, for example, (Rajan and Zingales 1995).8See (Ueda 1994), p.15 in (Inoue 1980).9Yamaichi Securities, Daiwa Securities, Nikko Securities and Nomura Securities were spun o� from Koike Bank,
Fujimoto Building Broker Bank, Industrial Bank of Japan, and Nomura Bank, respectively.10(Inoue 1980).
10

underwriting and brokerage and banks dominated bond underwriting.
3.1.2 The War Period (1938-1945)
Under the war economy, the government brought about a series of new comprehensive policies
which were intended to restructure the free-market economy controlled by stockowners to a highly
centralized economy with a greater role played by banks. Two, among the new policies, caused
drastic reorganization of the existing �nancial institutions. One was the deliberate reduction of the
number of banks by means of higher capital requirements, forced mergers and acquisition of small
banks, and the compulsory guideline that limited the distribution of banks to one per prefecture.
Another signi�cant policy was the Designated Financial Institution System, which matched
each existing bank with particular military and other industrial �rms. It was designed to guarantee
these key companies ample capital resources for their production. At the end of the war, majority
of these �rms under the Designated Financial Institution System was designated to one of the �ve
major zaibatsu banks. 11 These compulsory relationships between �rms and banks seemed to have
evolved into more self-enforcing main bank relationships after the war.
3.1.3 From Post-War Reforms to Current Deregulation (1945-present)
Various \economic democratization" measures were taken by the U.S. during the occupation period
following the end of the World War II. Dissolution of zaibatsu was an example of such measures,
designed to achieve (1) dispersion of stock-holding among households and (2) separation of owner-
ship and control of large Japanese companies, many of which hitherto were controlled by 10 or so
zaibatsu families.
According to (Aoki 1989), \Between August 1946 and August 1947, |[m]ost of the shares
of the holding companies and zaibatsu families were transferred to the Holding Companies Liquida-
tion Commission. The total value of shares transferred under this operation, |amounted to 118.4
billion yen, which was about two-�fths of the total value of stocks outstanding at that time. 12"
These shares were sold by the Security Liquidation Coordination Council, mostly to small
11See (Teranishi 1994).12(Aoki 1989), p.124.
11

individual stockholders including many of the companies' employees, prior to the opening of the
Tokyo Stock Exchange in 1949. As a result, individual holdings reached 61% of the total in 1950
(compared with 23.6% for �nancial institutions and industrial companies combined) and has been
steadily declining since then. 13
Another important \economic democratization" measure taken was the passage of The
Anti- Monopoly Law in 1947. Of note are its Article 9, which bans pure holding companies whose
primary business is to own and control other corporations. Also, Article 11 of the law sets a 5%
limit on stock-holding by �nancial institutions. Later in 1953 Article 11 was modi�ed to 10%
for banks, securities �rms and insurance companies but this change was reversed to 5% for banks
and securities �rms by the Miki Administration (in the 70's or early 80' s). 14 Article 65 of The
1948 Securities and Exchange Law, which was modeled after The 1933 Glass-Steagall Act, led to
separation of banking and securities business for the next 45 years. Also separation of long-term vs.
short-term lending between long-term credit banks and city banks, and separation of commercial
banking vs. trust banking between city/regional banks and trust banks complemented the above
Article 65 to characterize the highly-compartmentalized post-war Japanese �nancial system. The
paragraph below succinctly summarizes the post-war �nancial system in Japan:
The post-war Japanese �nancial system owed much to its early post-war, war-time,
and pre-war institutional heritage. The Ministry of Finance opted for a system of
bank loan-based �nance for industrial corporations. It used regulatory restrictions and
economic disincentives to severely inhibit corporate bond issue and the development
of a secondary market.|Essentially, only public utilities and long-term credit banks
could issue bonds in any quantity, and this was done mainly through non- arm's length
placements. Equity issue was expensive for management-controlled �rms, both because
dividends were paid out of after-tax pro�ts while interest payments were a deductible
expense, and because the pre-war custom of new stock issue at par rather than market
prevailed well in to the 1970's. The issuance of commercial paper for short-term �nance
was not allowed until 1987. Business, growing rapidly and always in need of new loans
13(Niki 1984)14(Mabuchi 1996), p.119.
12
for working capital and �xed investment, had no choice but to borrow from banks. 15
In the 1970's, the Japanese government debt soared to an unprecedented level. 16 In
order to facilitate absorption of this massive amount of government debt in the private sector,
sales of Japanese Government Bonds (JGBs) in the secondary markets were allowed for those more
than 1 year old since issuance. Furthermore, in 1981 the New Bank Law and the New Securities
and Exchange Law were enacted in order to pave the way for banks to selectively enter securities
businesses.
In April 1983, the ban on sale of government/semi-government bonds by banks was lifted.
Then in June 1984, dealing of these government bonds by banks (\bank dealing") was allowed
Finally, in 1993 banks were allowed to set up subsidiary securities �rms to engage in
selected securities businesses, most notably underwriting of public/corporate bonds. This was a
signi�cant step toward revision of the Article 65 of the Securities and Exchange Law. On a di�erent
front, in October 1994, upper limit on duration of bank term deposits was lifted and e�ectively
ended the historical separation of long-term credit banks and commercial banks. 17
3.2 Overview of the Japanese Domestic Bond Markets
3.2.1 Issuing Methods
Corporate bonds are either issued in public o�erings or placed privately. Public o�erings are
underwritten by a syndicate team of securities �rms. In addition to paying underwriting and
other service fees to the lead manager and the rest of the syndicate team members, an issuer has
customarily hired a bank (typically the issuer's main bank) as principal bond management bank,
and paid service fees to the bank for custody and settlement work for the duration of the bond. This
custom, which gave main banks lucrative fee business as well as signi�cant power over allocation
of bonds, may have come into existence not the least because of historical dominance of banks in
bond underwriting business in the pre-war period, as well as the Designated Bank System during
the war.
15(Patrick 1994), p.371.16(Ueda 1994), pp.104-105.17(Shikano 1996), p.29.
13
In the 1950's-1970's, when corporate issues were rare and virtually limited to utility com-
panies and a short list of \approved" companies which met stringent eligibility guidelines, terms and
allocation of o�erings were set in a non-arm's length manner at kisaikai, or bond-issuing meetings,
attended by the syndicate members and the principal management bank. A signi�cant fraction of
these issues were placed among the largest banks, and the company's main bank, serving as princi-
pal management bank at kisaikai, was quite in uential in setting terms, and allocating the issues.
The principal management bank charged fees that totalled 2-3% in the course of the maturity of
the bond. In e�ect, the commercial banks and the investment banks had together cartelized the
corporate �nancing market. 18 Whether a �rm borrowed from a bank or issued a bond, they col-
lected a monopoly rent. Because the commercial banks and investment banks together controlled
both markets, the �rms could not avoid the monopoly rents in one market by raising funds in the
other. 19
A \proposal method", whereby individual securities �rms bid against each other for the
lead- manager position by submitting proposals to the prospective issuer, was introduced in 1987
and replaced kisaikai by 1988. After the new method experienced problems with discounting sales
among underwriters, a \universal price sales method" was introduced in 1991. The newest method,
which is employed in the Euro markets as well, restricts all underwriters to sell securities at the
issue price during the o�ering period.
Private placement is allowed as a method of issuing and placing bonds to less than 50
subscribers. Unlike public o�erings, it is mostly led by banks and securities �rms are not involved
in the placement. Historically, it has been de facto a variant of syndicated bank loans. The size of
this market has increased lately, mostly as a result of relaxation of upper limit on issuance amount.
3.2.2 Eligibility guidelines for Issuers
The origin of eligibility guidelines dates back to the policy measure taken up by the Bank of Japan
in the post-war period (1948-1955). As a means of indirect credit provision to large industrial
companies, the Bank of Japan screened and selected a list of large companies whose bonds were
given high collateral values. This encouraged banks to hold these bonds as assets, as these banks
18The equity market was not a signi�cant source of external �nancing for �rms during this period. See Section 3.3.2.19(Ramseyer 1994), pp.237-239.
14
were heavily dependent on collateral- backed lending from the Bank of Japan at the time. In fact
most of these bond issues were purchased by �nancial institutions such as city banks.
Even after this mechanism was abolished, the guidelines continued to be used by the
members of kisaikai to rank and screen prospective issuers. The guidelines were initially set for
eligibility to issue collateralized bonds.
The �rst non-collateralized straight bond was issued in Japan in 1979 by Sears, Roebuck.
This led to establishment of eligibility guidelines for non-collateralized bond issues by domestic
corporations. At the time, only 2 companies met the guidelines.
For example, eligibility guidelines as of 1981 were:
� net asset of more than 6 billion yen
� �rst-time issuers: more than 10% dividend payout ratio for the past 3 consecutive years
� non-�rst-time issuers: more than 8% dividend ratio for 3 years or more than 10% for 1 year
� other criteria: net asset ratio, equity ratio, operational pro�t/gross asset ratio, and interest
coverage ratio
Credit ratings assigned to issuers and/or issues by independent agencies were not intro-
duced until the 1980's. By 1985, 4 credit rating agencies were established. Eventually, credit ratings
started to �rst supplement and then replace the guidelines.
Since then, with gradual relaxation of the above guidelines, the number of eligible compa-
nies increased from 2 to some 600. 20 However, the number of actual issuers remains a low fraction
of those eligible even in the 1990's, and the recent increase in the market size is largely a result
of increase in issuance amount per issue. This in return was induced by relaxation in 1991 and
subsequently removal in 1993 of upper limit on issuance amount (as a multiple of net assets). 21
Finally, in January 1996, the eligibility guidelines were all together lifted. 22 These restrictions, in
place until recently, e�ectively postponed development of sub-investment grade bond (or so-called
junk bond) market in Japan.
20See (Tokai Bank Research Monthly 1993), p.14, Table 3.21Ibid., p.6, pp.16-17.22(Finance and Fiscal A�ars (Kinyu Zaisei Jijyou) 1995, ).
15
3.2.3 Size of the Markets
In the latter half of the 1980s, lured by the low issuance cost re ecting the soaring stock prices,
Japanese companies issued an unprecedented amount of convertible bonds and bonds with warrants.
In 1989, the peak year, the total equity-related bond �nance reached 26.5 trillion yen, 6.5 times
the level before the boom started in 1985. 23
Since the bubble economy burst in 1989, issuance of convertible bonds and bonds warrants
has all but disappeared, and straight bond issuance has risen both proportionately and absolutely. 24
The main reasons for the recent increase are:
� A series of deregulation measures in the domestic market has made domestic issuance cheaper
and simpler than before, making it a comparative option to Euro-yen markets
� Low interest rate
� Re�nancing needs for the existing bonds with warrants and convertible bonds
3.3 Overview of the Domestic Equity Markets
3.3.1 Ownership Structure: The Post-war Development
The zaibatsu dissolution led to drastic reshu�ing of stock ownership into the hands of individual
households after World War II 25 Since then, however, the former zaibatsu members have regrouped
as more informal keiretsu groups, and inter stockholding by their members have steadily risen, while
individual owners' share declined and institutional investors' share remained more or less at. This
is in sharp contrast to the change that took place in the U.S. or U.K. where the decline in individual
owners' share was roughly compensated by the increase in institutional investors' share over the
same period. 26
The 5-10% rule pursuant to Article 11 of the Anti-Monopoly Law meant that for a keiretsu
group including one city bank, one trust bank, one life insurance company and one casualty insur-
ance company, the group �nancial a�liates as a whole can own up to 30% of its industrial a�liates.
23See (Tokai Bank Research Monthly 1993).24Ibid.25(Aoki 1989), p.125.26See (Niki 1984).
16

Consequently, the management of many of the keiretsu companies was e�ectively shielded from
outsiders and to a lesser degree from demands of their own individual stockowners.
3.3.2 Primary Markets
New equity can be issued in one of the following four methods.
(1) public o�erings (at market price)
(2) third-party allotments (such as employees, suppliers, etc.)
(3) allotments to existing shareholders (historically at par, and then more recently at an interme-
diate value between face value and the market value)
(4) stock split
Among (1)-(3), (3) was the dominant method until the 1970's. Clearly this was not appealing
to those companies who had access to low-rate bank loans. Then with the rising stock prices,
(1) became the more dominant method. Public o�erings was 53.6% of total amount raised (thus
excluding stock split) in 1973; in 1980, it was 78.1%.
Listing standards 27 for the Tokyo Stock Exchange includes number of shares, number of
stockholders, pro�tability, years since incorporation, etc.28 There are also active over-the-counter
(OTC) markets. 29
3.4 Deregulation of Euro-Yen Bond Markets
The �rst Euro-yen bond was a 10 billion yen bond issued by EIB (European Investment Bank) in
1977. It was initially a highly restricted market, where only sovereign and supranational issuers
were allowed to raise funds.
In the 1980s, however, rapidly appreciating yen and innovation in currency swap markets
induced growth of yen-denominated bond markets from demand and supply side, respectively.
In response, the Japanese government started relaxing the regulations governing the Euro-yen
markets. In some ways the government used the Euro market as an \experimental laboratory" for
deregulation that was slowly taking place back home, and for this reason the deregulation in the
27(Matsutani 1995), p.195.28See http://www.tse.co.jp/english/top/eframese.html (Tokyo Stock Exchange).29Ibid., p.199. Also see http://www.jasdaq.co.jp (Japan Securities Dealers Association).
17

Euro markets typically preceded similar measures subsequently taken in the domestic market (see
Section 7 for more discussion on relevance of this market).
Meanwhile, the Article 65 of the Securities and Exchange Law did not prevent Japanese
banks from setting up overseas subsidiaries which engaged in securities businesses, for instance, in
underwriting o�erings by Japanese issuers in the Euro markets (but they were e�ectively banned
from becoming bookrunners).
In April 1984 , the following changes were announced by the government 30:
(1) public o�erings were allowed for the �rst time to those domestic Japanese corporate issuers who
met the eligibility guidelines (see Section 3.2.2).
(2) Eligibility guidelines for foreign issuers were relaxed to allow more non-sovereign issuers.
(3) Foreign underwriters were allowed for the �rst time to lead-manage an o�ering (hitherto only
allowed to Japanese securities �rms). Japanese underwriters which were European subsidiaries of
Japanese banks, however, were still not allowed lead-manager positions.
With (1), 30 Japanese issuers were newly eligible for straight bond issues, and 100 for
convertible bonds. 31
Eligibility guidelines continued to get relaxed in incremental manner over the following
decade, before they were �nally removed in January 1996, the same year that such guidelines were
also lifted for the domestic bond markets. 32
Between 1991 and 1993, domestic issuers' total issuance in the Euro-yen bond mar-
kets marked 2-3 trillion yen per year, re ecting the drastic shift away from equity-related �-
nance(convertible bonds and bonds with warrants) into Euro-yen bond �nance. After 1994, how-
ever, further deregulation in the domestic bond markets created for the �rst time a head-on com-
petition between the Euro-yen and domestic bond markets. Clearly some of the earlier competitive
advantage of the Euro-yen markets was lost with the deregulation and simpli�cation of procedures
in the domestic markets.
One of the remaining restrictions in the Euro-yen bond markets for domestic issuers was
so-called kanryu seigen, or restrictions on return of bonds back into Japan. The restriction was
30(Finance and Fiscal A�airs (Kinyu Zaisei Jijyou) 1984a, ).31See (Akakura 1984), p.50.32For details, see (International Finance (Kokusai Kinyu) 1996, ).
18

intended to make sales of Euro-yen bonds in Japan di�cult, thereby minimizing the e�ect of Euro-
yen bond issuance on Japan's current account balance. The restriction period used to be as long
as 180 days in the 1980s, was gradually shortened and abolished for the non-Japanese issues in
August 1995, and was lifted for Japanese issues as well in April 1998. 33
3.5 Entry of Bank Subsidiary Securities Firms into the Corporate Bond Mar-
kets
The Financial Institution Reform Act (passed June 1992) allowed banks, securities �rms, trust
banks and insurance companies to reciprocally enter each other's business areas by means of area-
speci�c subsidiaries.
By the Auxiliary Rules of the Act, security �rm subsidiaries of banks were initially not
allowed to engage in equity brokerage businesses. The reasons given were:
(1) Japanese banks have not historically been involved in equity brokerage business (whereas they
were the dominant players in bond underwriting business in the prewar period before Article 65),
(2) a potential con ict of interest arising from the existing stock ownership by the parent banks
and brokerage operations at subsidiary level, and
(3) many small- and mid-size brokerage �rms relied on equity brokerage fees as main source of
pro�ts. 34
Accordingly, the bank subsidiaries were initially allowed to engage in the following activi-
ties:
(1) underwriting/trading of public bonds (sovereign, governmental agencies, etc.)
(2) operations relating to short-term securities and asset �nance securities
(3) underwriting of corporate bonds (including convertible bonds (CBs) and bonds with warrants
(WBs) ) and trading of corporate bonds (excluding CBs and WBs)
(4) operations relating to investment trust business
This means they were excluded from:
(1) underwriting/trading of equity
33For details of eligibility guidelines, see (Investment Monthly (Toushi Geppo) 1985, ), p.43.34(Kanzaki 1996), p. 97.
19
(2) trading of CBs and WBs
(3) trading of stock index futures and options
Eventually, with enactment of the Financial System Reform Law on Oct. 1, 1999, the
remaining equity-related restrictions were lifted. 35
The �rst bank subsidiaries started operations in July, 1993. The following observations
and evaluations were found in popular business publications in the �rst few years of bank subsidiary
operations.
(1) Underwriting fees have lowered further since their entry (the fees had been decreasing even
before 1993). For example, for a benchmark issue with a particular credit rating and a maturity, it
dropped from 1.5 yen per issuance amount of 100 yen (or 1.5%) in 1991 to an average of 0.35-0.55
yen. 36
(2) There seems to be a high correlation (70-90%) between the subsidiaries being lead manager and
the parent banks being the principal bond management bank. The main bank �re wall rule may
35In conjunction with the legalization of bank subsidiary securities �rms, the following �re-wall rules among others
were listed under the Securities and Exchange Law((Kanzaki 1996), pp.,98-99):
(1) Sales of securities issued by borrowers from the parent bank is prohibited if the proceeds was to be used to repay
the above borrowings and if the investors were uninformed about such use of proceeds.
(2) Subsidiaries are not allowed to lead-manage issuance by the parent banks unless the o�ering is rated by a credit
rating agency.
(3) \Back-�nance" (underwriting a security and subsequently selling it to an investor whose credit is extended by
the parent bank within 6 months after the o�ering) is prohibited.
(4) Subsidiaries cannot provide the parent bank with any con�dential information regarding issuers/their clients
without their consent.
(5) Arm's length rule
(6) No \contingent" contract (e.g. parent's providing credit to a customer contingent upon its signing a security
exchange contract with its subsidiary)
(7) No selling of underwritten securities to the parent banks within 6 months of the o�ering
(8) Main bank �re wall: Subsidiary �rms cannot lead manage a bond o�ering by issuers with net asset of less than 500
billion yen if the parent bank is its principal bond management bank. They also cannot lead manage a bond/equity
o�ering by issuers if the parent bank has acted as principal bond management bank for more than 2 times out of the
latest 3 bond issues (within the past two years).36(Finance and Fiscal A�airs (Kinyu Zaisei Jijyou) 1995b, ), p.15.
20

not be e�ective. 37
(3) Main bank relationship is seen as more crucial than expertise in bond sales per se.
Evidence: Sanwa Bank, which is a lower-tier city bank, lags behind other upper-tier city banks in
underwriting business despite its top bidder position in the Japanese Government Bond market.
This is because it has relatively weak main bank ties with the best of blue chip companies 38.
However, in the more recent Nikkei article, Sanwa ranked 5th among the bank subs and 9th among
all securities �rms, so this claim is not necessarily supported over time.
(4) Electricity companies (which comprise 50% of all straight bond markets by issuance amount)
assign underwriters di�erently from other issuers. That is, they emphasize bond sales capabilities
of underwriters rather than their main bank relationships with them. Electricity companies were
the �rst companies to be allowed by the government to issue bonds in the 1950's, and they still are
the most frequent and largest-size issuers in the market today. Historically, their lead managership
has been rotated among the Big Four (Nomura, Nikko, Yamaichi, Daiwa) securities �rms. 39
It is interesting that (2)-(4) re ect a view that main bank ties contributed to the rapid
increase in market shares by entrant banks, while (1) reports a simultaneous drop in price.
3.6 Further Continuation of Financial Deregulation
The �nancial deregulation in Japan is still ongoing today. A series of new laws and amendments
to old laws have been passed since 1993 encompassing such broad areas as expansion of asset
investment products, relaxation of stock listing standards, and further dismantling of walls between
banks, securities �rms and insurance companies. 40
37Ibid., p.22.38(Weekly Diamond (Shuukan Diamond) 1995, ).39Ibid.40Some government agencies post and update summaries of these regulatory changes in English. See:
http://www.fsa.go.jp/indexe.html (Financial Services Agency (Kinyu-cho))
http://www.fsa.go.jp/p fsa/indexe.html (Financial Supervisory Agency)
http://www.fsa.go.jp/p mof/p mofe.html (Ministry of Finance (Financial System Planning Bureau))
21

4 Empirical Speci�cation of the Demand Model
The main part of the empirical model consists of a discrete choice model of a �rm's underwriter
choice. The approach taken here is transaction-based, rather than capital stock-based. This follows
the pecking-order �nancing model 41 and is consistent with the premises of other debt choice models
as well.
4.1 Notation
Let the banks be numbered 1::K, indexed by k.
Let the �rms be numbered 1::N , indexed by i.
4.2 Model
Based on the model of the underwriting service market described in Section 3 of (Yasuda 2001b),
the price (observed or not) o�ered by bank j to �rm i is speci�ed as
pi;j = ziT 1j + zi;j
T 2j + �i;j (1)
where �i;j � N(0; �2) iid. (For simplicity of notation, zT k is used to refer to the non-random part
of the price from now on.) zi here capture the reputation/risk characteristics of issuers/bonds which
determine the cost of underwriting for the banks as discussed in the previous section. Examples
of such characteristics are credit ratings and maturities of bonds. The subscripts in j re ects the
implication of the analysis that individual banks price these characteristics of issues/bonds di�er-
ently. The price equations are thus speci�ed in order to impute the unobserved prices. Imputation
methods are discussed in Section 4.4.
Consider a �rm i that chooses an underwriter after observing pi;k for k = 1::K. The
product in this market is di�erentiated along two dimensions, namely, price and certi�cation ability,
41In this well-known partial equilibrium model of the �rm's �nancing behavior, the �rm optimizes with respect to
each �nancial transaction, taking its need for external �nance as given. The model implies a hierarchical decision
tree for the �rm, which is easily adaptable in a nested-logit model framework. See (MacKie-Mason 1990); (Helwege
and Liang 1996) for use of nested-logit models in testing pecking-order model predictions.
22
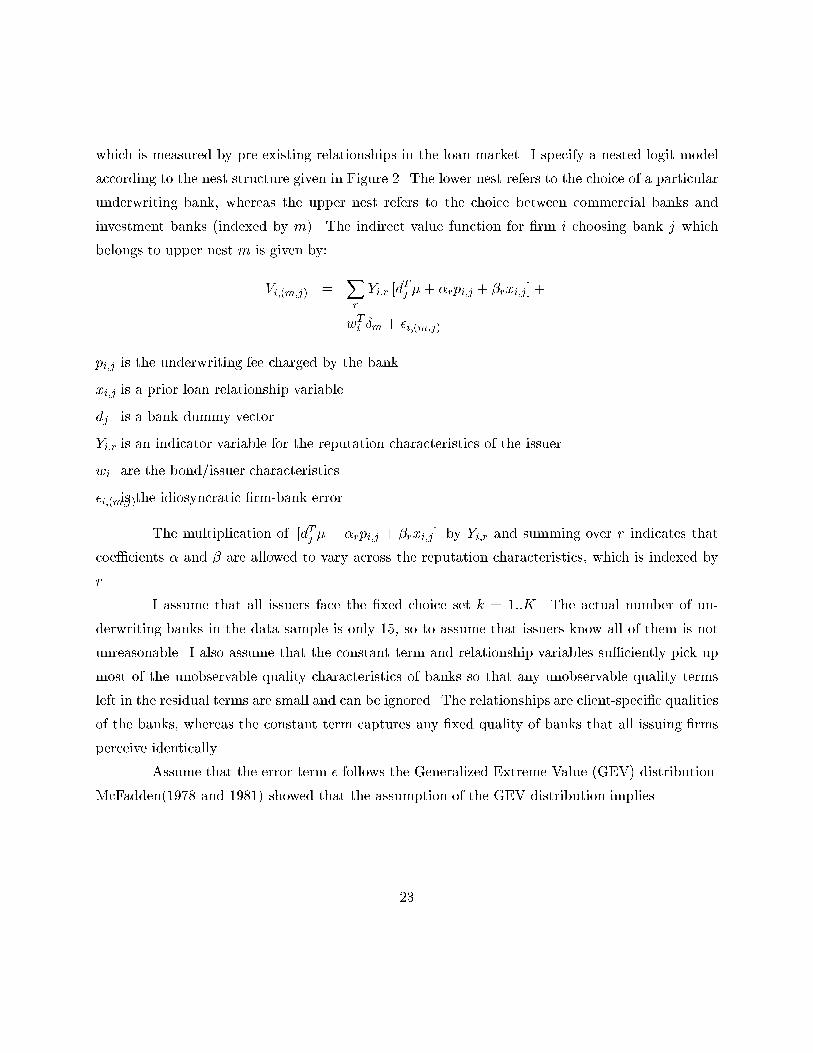
which is measured by pre-existing relationships in the loan market. I specify a nested-logit model
according to the nest structure given in Figure 2. The lower nest refers to the choice of a particular
underwriting bank, whereas the upper nest refers to the choice between commercial banks and
investment banks (indexed by m). The indirect value function for �rm i choosing bank j which
belongs to upper nest m is given by:
Vi;(m;j) =Xr
Yi;r [dTj �+ �rpi;j + �rxi;j ] +
wTi �m + �i;(m;j)
pi;j is the underwriting fee charged by the bank
xi;j is a prior loan relationship variable
dj is a bank dummy vector
Yi;r is an indicator variable for the reputation characteristics of the issuer
wi are the bond/issuer characteristics
�i;(m;j)is the idiosyncratic �rm-bank error
The multiplication of [dTj � + �rpi;j + �rxi;j] by Yi;r and summing over r indicates that
coe�cients � and � are allowed to vary across the reputation characteristics, which is indexed by
r.
I assume that all issuers face the �xed choice set k = 1::K. The actual number of un-
derwriting banks in the data sample is only 15, so to assume that issuers know all of them is not
unreasonable. I also assume that the constant term and relationship variables su�ciently pick up
most of the unobservable quality characteristics of banks so that any unobservable quality terms
left in the residual terms are small and can be ignored. The relationships are client-speci�c qualities
of the banks, whereas the constant term captures any �xed quality of banks that all issuing �rms
perceive identically.
Assume that the error term � follows the Generalized Extreme-Value (GEV) distribution.
McFadden(1978 and 1981) showed that the assumption of the GEV distribution implies
23

Figure 2: Firm's Choice Set
investment banks
commercial banks
underwriting bank
underwriting bank
level m
upper nest
level j
lower nest
24
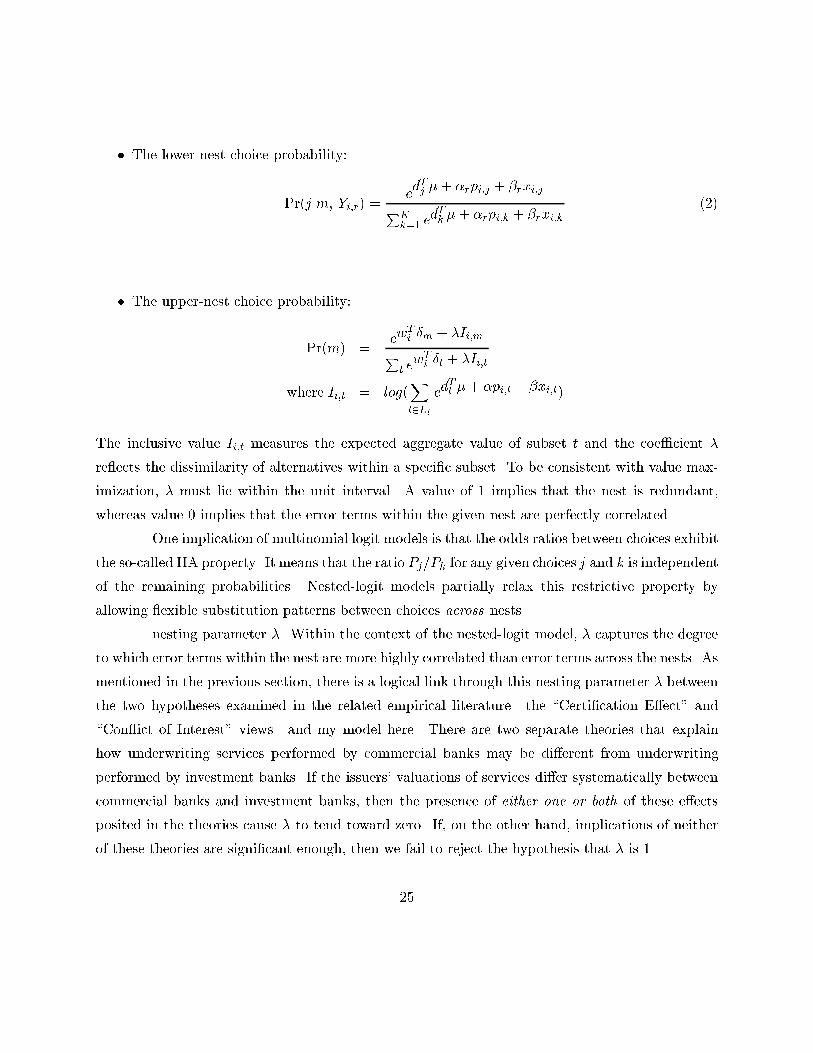
� The lower-nest choice probability:
Pr(jjm; Yi;r) =edTj �+ �rpi;j + �rxi;j
PKk=1 e
dTk �+ �rpi;k + �rxi;k(2)
� The upper-nest choice probability:
Pr(m) =ew
Ti �m + �Ii;mP
t ewTi �t + �Ii;t
where Ii;t = log(Xl2Lt
edTl �+ �pi;l + �xi;l)
The inclusive value Ii;t measures the expected aggregate value of subset t and the coe�cient �
re ects the dissimilarity of alternatives within a speci�c subset. To be consistent with value max-
imization, � must lie within the unit interval. A value of 1 implies that the nest is redundant,
whereas value 0 implies that the error terms within the given nest are perfectly correlated.
One implication of multinomial logit models is that the odds ratios between choices exhibit
the so-called IIA property. It means that the ratio Pj=Pk for any given choices j and k is independent
of the remaining probabilities. Nested-logit models partially relax this restrictive property by
allowing exible substitution patterns between choices across nests.
nesting parameter �. Within the context of the nested-logit model, � captures the degree
to which error terms within the nest are more highly correlated than error terms across the nests. As
mentioned in the previous section, there is a logical link through this nesting parameter � between
the two hypotheses examined in the related empirical literature|the \Certi�cation E�ect" and
\Con ict of Interest" views|and my model here. There are two separate theories that explain
how underwriting services performed by commercial banks may be di�erent from underwriting
performed by investment banks. If the issuers' valuations of services di�er systematically between
commercial banks and investment banks, then the presence of either one or both of these e�ects
posited in the theories cause � to tend toward zero. If, on the other hand, implications of neither
of these theories are signi�cant enough, then we fail to reject the hypothesis that � is 1.
25
4.3 Hypothesis Testing
4.3.1 Basic Model
By applying the empirical speci�cation of the basic demand model to both the Japanese and the
U.S. data and comparing their results, I am addressing the following research questions as put
forward in Section 1:
(1a) Do issuing �rms value the ability of underwriting banks to certify the issuers for investors?
This is captured by the sign of coe�cient � in Equation 2.
(1b) Is the certi�cation e�ect greater in Japan than in the U.S.? This is measured by comparing
the value of ��in the two countries.
(2) Does this trade-o� vary across the reputation characteristics of the issuing �rms in Japan, as it
does in the U.S.? This hypothesis is tested by interacting the demand function with the reputation
characteristics of the issuers, thus allowing the valuations of relationships and price to vary across
these characteristics.
4.3.2 Modi�ed Model
Here I modify the nest structure so that a commercial bank with a banking relationship is moved
to the investment bank nest (see Figure 3). This modi�cation corresponds to the last research
question, which is:
(3) Do the stylized institutional di�erences between the Japanese Main Bank system and the less
systematically organized U.S. banking system a�ect the bank competition in the bond markets
di�erently? If so, how?
The rationale for having this \new" nest structure is as follows:
Consider the following scenario|the issuing �rm, once having chosen not to hire the commercial
bank with which it has a previous banking relationship (for whatever reason), needs to decide
between choosing an investment bank and choosing another commercial bank with which it has
not had a previous relationship. To the extent that hiring a commercial bank with no previous
relationships as underwriter is perceived as betraying the existing bank relationship, a �rm which
seeks to preserve the value of existing bank relationships prefers an investment bank to a rival
26
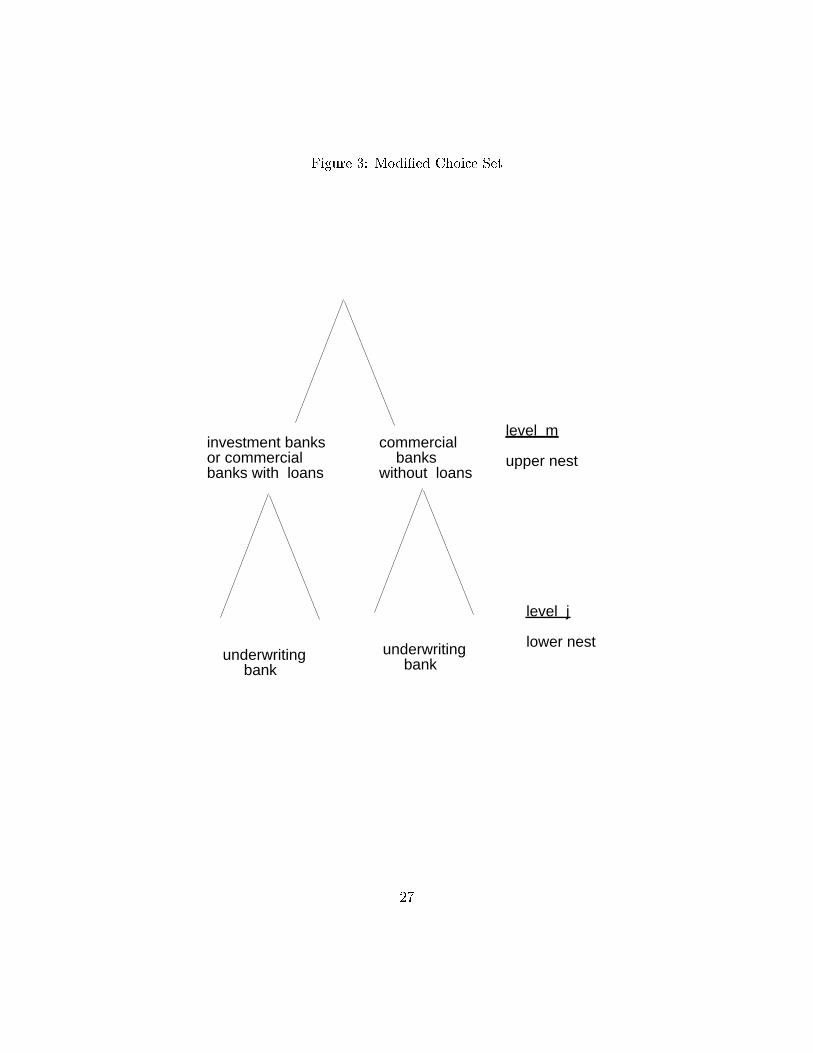
Figure 3: Modi�ed Choice Set
underwriting bank
underwriting bank
level m
upper nest
level j
lower nest
investment banks or commercial banks with loans
commercial banks without loans
27

commercial bank. The theoretical, comparative analysis of the Japanese Main Bank System vs.
the more arm's-length, U.S. banking system predicts that Japanese �rms are more averse to such
betrayals than U.S. �rms. Further suppose that because of symmetry in the Main Bank system,
there is a common betrayal cost associated with choosing any other commercial bank with which it
had no relationships. Within the context of the nested-logit model, � captures the degree to which
error terms within the nest are more highly correlated than error terms across the nests. Moving
the bank with relationships to the investment bank nest would therefore lower � in the case of
Japan, but not in the case of the U.S. Given this reasoning, we can empirically test this hypothesis
with Ho : �Japanmodified < �Japanbasic and Ho : �
U:S:modified ' �U:S:basic.
4.4 The Estimation Method
A data issue arises in studying this market because prices vary across both issuers and banks, but
only one price per issue, that is, the price o�ered by the bank which is hired to underwrite the
bond, is observed. So not only are there missing price data, but there is also a selection-driven
endogeneity in the observed price data. Let ci represent the index of the bank chosen by �rm
i. Since price enters the value function of the issuing �rm negatively, the fact that a given bank
was chosen over other banks in the choice set implies that these observed prices, (pi;j; j = ci), are
on average lower than the unconditional distribution of pi;j. As a result, if we impute unobserved
prices by obtaining estimates of from Equation 1 using observed prices as dependent variables, we
will be systematically underestimating unobserved prices and biasing the price coe�cient � toward
zero, or even positive.
To address this selection issue, I estimate the parameters of the lower nest of the un-
derwriter choice model using an EM algorithm framework 42. The main idea is to estimate price
estimates ; � and demand estimates �; �; � jointly in an iterative algorithm where price imputation
is done conditional on the information on ci; i = 1::N . The main appeal of using this framework
for my data problem is that it provides an iterative procedure where, if not for the systematic ab-
sence of some data, the Maximum Likelihood estimation is straightforward. The demand estimates
obtained from this estimation method are then used to estimate the upper level of the nested-logit
42(Dempster, Laird, and Rubin 1977), (McLachlan and Krishnan 1997).
28
model. Details of this method are found in Appendix.
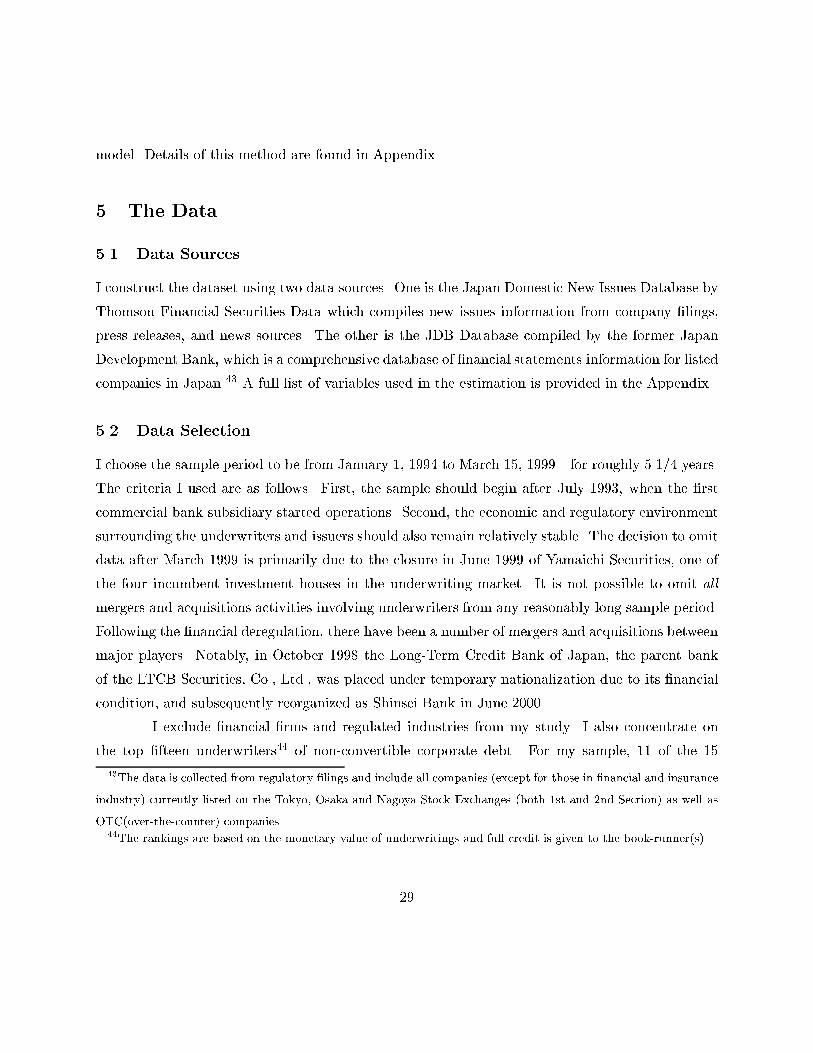
5 The Data
5.1 Data Sources
I construct the dataset using two data sources. One is the Japan Domestic New Issues Database by
Thomson Financial Securities Data which compiles new issues information from company �lings,
press releases, and news sources. The other is the JDB Database compiled by the former Japan
Development Bank, which is a comprehensive database of �nancial statements information for listed
companies in Japan 43 A full list of variables used in the estimation is provided in the Appendix.
5.2 Data Selection
I choose the sample period to be from January 1, 1994 to March 15, 1999|for roughly 5 1=4 years.
The criteria I used are as follows. First, the sample should begin after July 1993, when the �rst
commercial bank subsidiary started operations. Second, the economic and regulatory environment
surrounding the underwriters and issuers should also remain relatively stable. The decision to omit
data after March 1999 is primarily due to the closure in June 1999 of Yamaichi Securities, one of
the four incumbent investment houses in the underwriting market. It is not possible to omit all
mergers and acquisitions activities involving underwriters from any reasonably long sample period.
Following the �nancial deregulation, there have been a number of mergers and acquisitions between
major players. Notably, in October 1998 the Long-Term Credit Bank of Japan, the parent bank
of the LTCB Securities, Co., Ltd., was placed under temporary nationalization due to its �nancial
condition, and subsequently reorganized as Shinsei Bank in June 2000.
I exclude �nancial �rms and regulated industries from my study. I also concentrate on
the top �fteen underwriters44 of non-convertible corporate debt. For my sample, 11 of the 15
43The data is collected from regulatory �lings and include all companies (except for those in �nancial and insurance
industry) currently listed on the Tokyo, Osaka and Nagoya Stock Exchanges (both 1st and 2nd Section) as well as
OTC(over-the-counter) companies.44The rankings are based on the monetary value of underwritings and full credit is given to the book-runner(s).
29

underwriters are subsidiaries of bank holding companies. Using the above criteria results in a
sample of 1,308 non-convertible, �xed-rate corporate bond issues.
5.3 Variables in the Demand Equation
5.3.1 The Price Variable
The price variable (PRICE) used in the estimation is a gross spread expressed as a percentage of
the size of the bond 45. The gross spread is the fee that underwriters receive, or the di�erence
between the price at which securities are sold to investors and the price paid by the underwriters to
the issuing �rm. A typical public bond o�ering consists of multiple underwriters forming a selling
syndicate. As shown in Figure 4, one underwriter serves as the book-runner (or the lead-manager)
who organizes and managers the deal. I identi�ed the book-runner (or the lead-manager) as the
underwriter of a given issue.46 Given the syndicate and fee structure as illustrated below and
shown in Figure 4, this seems to be a reasonable assumption. This rule is also consistent with the
perception of practitioners who advertise their bank's market position in terms of \book-runner
ranking".
5.3.2 The Loan Variable
I construct dummy variables LOAN1-LOAN15 using balance sheet data from the JDB database.
These variables capture the presence of signi�cant, pre-existing loan relationships between a given
�rm and individual commercial banks that were established prior to the entry of the banks into the
underwriting market. I treat these relationships as predetermined and exogenous to the transactions
in the underwriting market.
On any given year's balance sheet, a company typically has loans from more than one
bank. 47 Since these loans vary in relative sizes as well as in consistency of presence over the years,
45The unit is in 10 basis points.46In a small number of cases where there were two co-book-runners, each was counted separately as if they under-
wrote separate issues.47(Ongena and Smith 1998) reports that multiple-bank relationships are commonly found across a number of
countries and data samples.
30
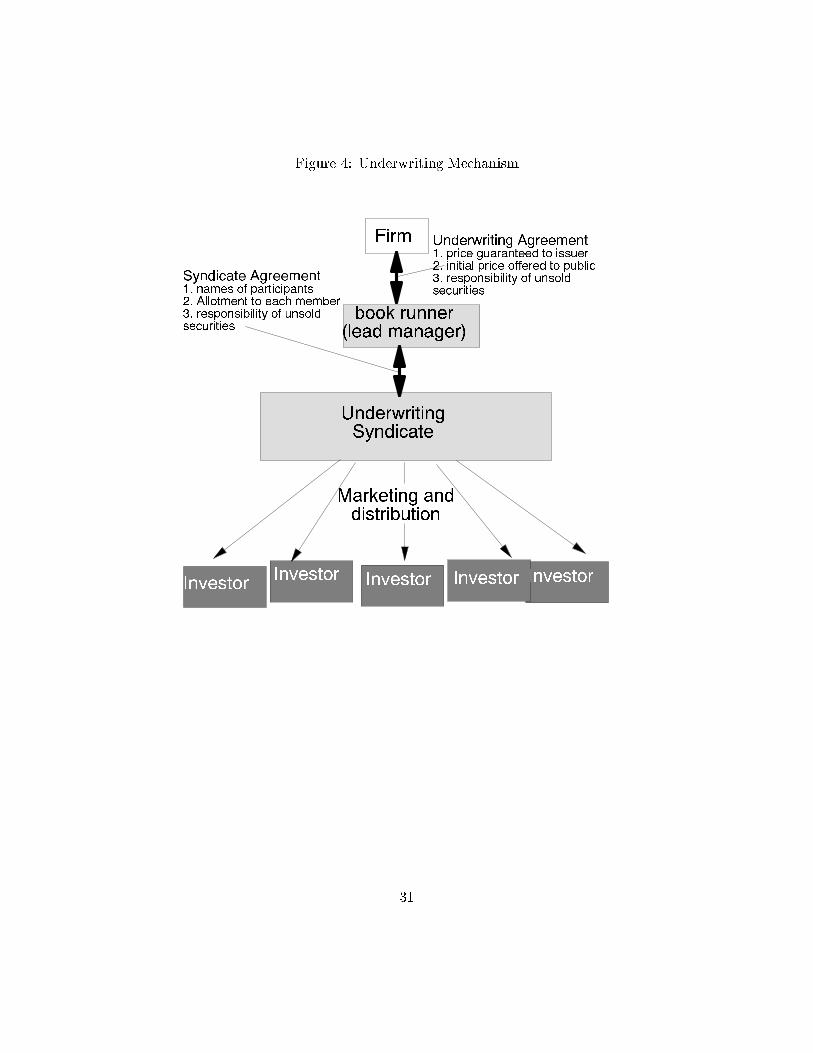
Figure 4: Underwriting Mechanism
InvestorInvestorInvestorInvestor Investor
Firm
book runner(lead manager)
UnderwritingSyndicate
Underwriting Agreement1. price guaranteed to issuer2. initial price offered to public3. responsibility of unsoldsecurities
Syndicate Agreement1. names of participants2. Allotment to each member3. responsibility of unsoldsecurities
Marketing anddistribution
31
it is misleading to count all of these banks as having equally important banking relationships with
the �rm. The literature suggests that �rms carefully maintain rankings among these banks for
various economic reasons, such as to assure provision of credit liquidity from their top bankers
when needed, or to limit sharing of private information about the �rm among only the top few
banks. Based on this knowledge about multiple bank relationships, we assess that only these top
banker relationships have any economic e�ect on the �rm's underwriter choice problem. Thus in
order to measure only these \top banker" relationships, I count the top lender in a given year and
discard the rest (see Appendix A for the exact variable de�nitions). 48
5.4 Variables in the Price Equation
As discussed in Section 1, underwriting fees are determined in part by various costs, including
distribution costs, the expected cost of taking market and reputation risks, and information pro-
duction costs. I estimate my model using various speci�cations for the price equations. The basic
variables that I include are a constant term, AAA (a dummy variable for a AAA credit rating
category), and some maturity variables.
Being in the higher credit rating category means issuers have more �nancial strength and
in general are of higher reputation than those in the lower credit rating category. This decreases
the risk-related cost for the underwriter. It might also mean that it is less costly to distribute these
bonds because the company is better well-known and investors need to be marketed less intensively
(which also feeds back to create potentially smaller market risk). For similar reasons, investors
require lower yields for higher credit rating bonds.
In general, underwriters also demand higher underwriting fees for longer maturity bonds.
This makes sense to the extent that a normal yield curve is also upward sloping; in addition, the
secondary market for 30-year corporate bonds is much less liquid than for 30-year government
bonds. This is measured by including some strati�ed dummy variables for maturity.
I also include a variable that represents the previous issue experience of �rms in the bond
market. From the underwriter's point of view, more experienced or frequent issuers are easier to
48Multiple \top" relationships are still possible with this method, since if bank A is the top lender in year t, and
bank B is the top lender in year t+1, both will be counted. I also ran the estimation using alternative de�nitions of
loan relationships, and �nd that our results are robust to speci�cation changes. See Section 8 for details.
32

market than �rst-time or infrequent issuers. They are also less likely to lead to failed transactions
because the track record of previous issues gives a reputation to the name of the issuer. Thus the
price is expected to be decreasing in this variable.
5.5 Descriptive Statistics of the Sample
The tables presented here give descriptive statistics for the sample used in the estimation. In all
of these tables, the �rst two columns segment the data according to whether the underwriter was
a commercial bank or an investment bank.
In Table 2 the sample is tabulated by issue size, maturity, and credit rating. Several
observations can be made. First, bank-underwritten issues are relatively small compared to in-
vestment bank-underwritten issues. Their maturity also tends to be slightly shorter, but no better
or worse in terms of credit ratings. There are a few plausible reasons for this. For example, if a
smaller, younger �rm is more likely to choose the commercial bank with which it had built close
ties, the issue size might be proxying for characteristics of that �rm. Or if commercial banks have a
smaller distribution capability relative to investment banks, the issue size might then be re ecting
the supply-side constraint. The commercial bank issues are also smaller than the investment bank
issues in the U.S. sample studied in (Yasuda 2001b).
In Table 3, the sample is tabulated �rst by previous issue experience and then by the is-
suer's industry code. The portion of �rst-time issuers (of domestic bonds) is actually lower among
commercial bank issues (10%) than among investment bank counterparts (18%). This is in contrast
to the U.S. bond market sample studied in (Yasuda 2001b), where �rst-time issuers were more likely
among commercial bank issues. This �nding is interesting because it goes against the characteriza-
tion of commercial bank clients as smaller, younger �rms with no or little previous issue experience,
which are the case in the U.S. market. Rather, in the Japanese market, commercial banks have
cultivated relationships with these �rms under the tightly regulated bank-based �nancing system in
the 1950's-70's. Among these �rms, many of the blue-chip companies entered the bond market in
the 1980's as a result of the issuer-side deregulation measures, but at that time commercial banks
were still not allowed to underwrite bonds. 49
49See Section 3 for the timing of various deregulation measures.
33

Table 2: Sample Summary Statistics
Ban
k is
sues
Inve
stm
ent b
ank
issu
esA
ll is
sues
Seg
men
t no
.no
.(%
)vo
lum
e (Y
bn.
)no
.no
.(%
)vo
lum
e (Y
bn.
)no
.no
.(%
)vo
lum
e (Y
bn.
)Is
sue
size
(Y b
n.)
<
=7.
522
4
31
%1,
055.
5
12
1
21%
552.
7
34
5
26
%1,
608.
2
7.
5<
<=
1536
2
50
%3,
807.
5
26
3
45%
2,78
4.5
62
5
48
%6,
592.
0
<
1513
2
18
%3,
906.
0
20
6
35%
6,20
0.0
33
8
26
%10
,106
.0
to
tal
718
100%
8,76
9.0
590
10
0%9,
537.
2
1,30
8
100%
18,3
06.2
Mat
urity
(yr.
)
<=
536
2
50
%3,
850.
0
27
4
46%
4,08
5.8
63
6
49
%7,
935.
8
5<
35
6
50
%4,
919.
0
31
6
54%
5,45
1.4
67
2
51
%10
,370
.4
to
tal
718
100%
8,76
9.0
590
10
0%9,
537.
2
1,30
8
100%
18,3
06.2
Cre
dit R
atin
gA
AA
17
2%22
7.0
24
4%74
6.3
41
3%97
3.3
AA
294
41%
4,66
4.0
221
37
%4,
778.
9
515
39%
9,44
2.9
A
375
52%
3,63
0.0
300
51
%3,
478.
0
675
52%
7,10
8.0
B
elow
A32
4%
248.
0
45
8%
534.
0
77
6%
782.
0
to
tal
718
100%
8,76
9.0
590
10
0%9,
537.
2
1,30
8
100%
18,3
06.2
NO
TE
:1$
= 1
17 y
en a
s of
03/
01/0
1.
Thi
s m
akes
1 b
illio
n ye
n ap
prox
imat
ely
equa
l to
$8.5
mill
ion.
34
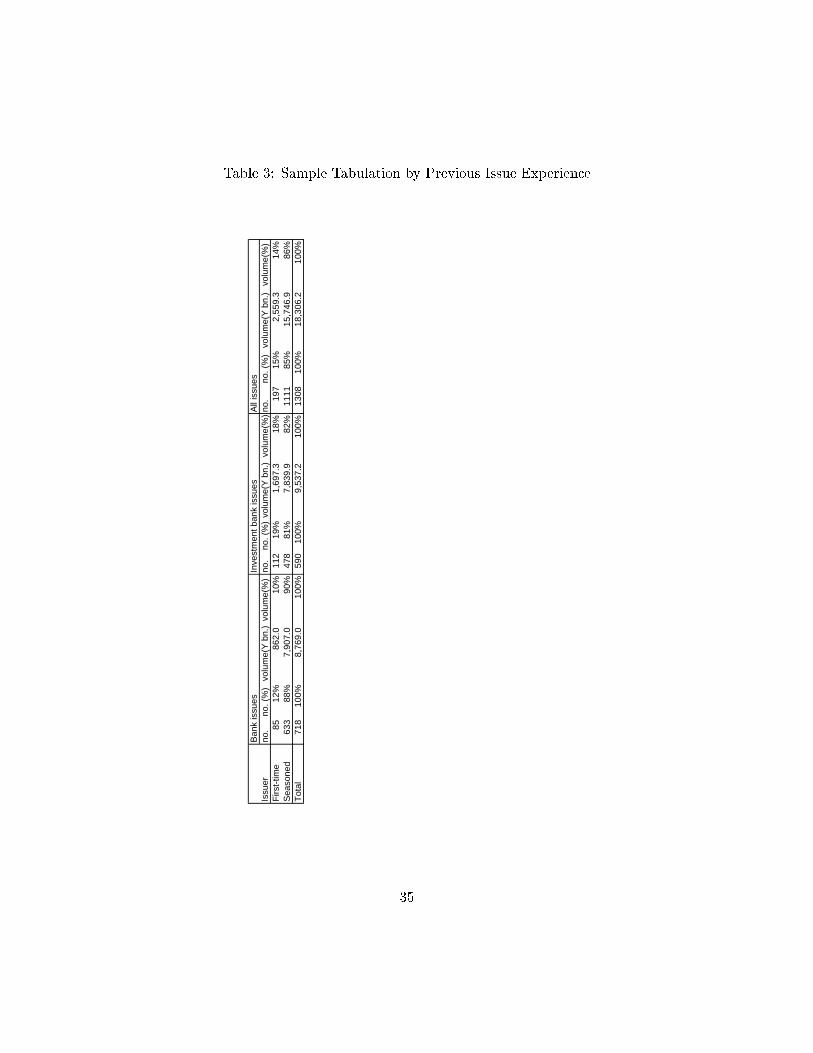
Table 3: Sample Tabulation by Previous Issue Experience
Ban
k is
sues
Inve
stm
ent b
ank
issu
esA
ll is
sues
Issu
erno
.no
. (%
)vo
lum
e(Y
bn.
)vo
lum
e(%
)no
.no
. (%
)vo
lum
e(Y
bn.
)vo
lum
e(%
)no
.no
. (%
)vo
lum
e(Y
bn.
)vo
lum
e(%
)F
irst-
time
8512
%86
2.0
10%
112
19%
1,69
7.3
18%
197
15%
2,55
9.3
14%
Sea
sone
d63
388
%7,
907.
0
90%
478
81%
7,83
9.9
82%
1111
85%
15,7
46.9
86
%T
otal
718
100%
8,76
9.0
10
0%59
010
0%9,
537.
2
10
0%13
0810
0%18
,306
.2
100%
35

Meanwhile, because sub-investment grade bonds have not been allowed in Japan until very
recently (see Section 3.2.2), the Japanese commercial banks have not been able to take advantage of
their bank relationships with those �rms. These two features of the deregulation process combined
might have diminished the value of relationship capital for commercial bank entrants in the bond
underwriting market. Also, like in the U.S. sample, there is no meaningful di�erences between
commercial bank and investment bank subsamples in terms of the distribution of issuers across
di�erent industries (Table 4).
Table 5 compares Japan and the U.S. in terms of prevalence of previous banking relation-
ships between issuing �rms and commercial bank (entrant) underwriters. The average number of
banking relationships per issuing �rm is 0.3 in the U.S. and 1.6 in Japan, but this di�erence is
somewhat misleading because banking relationships are 4 times more likely to exist between the
Japanese issuers and commercial bank underwriters in the sample than their U.S. counterparts.
The average number of relationships per issuing �rm when there is at least one such relationship is
1.4 in the U.S. and 1.8 in Japan. So the �rst major di�erences between the two countries observed
in the data is that banking relationships between �rms and entrant commercial banks are more
pervasive in Japan, even among �rms established enough to issue straight public debt. 50
In Table 6, I report sample statistics of the two data that hint at another important dif-
ference in the nature of bank competition between the two countries. The �rst row compares the
collective market shares of incumbent investment bank underwriters in the U.S. and Japan. The
larger U.S. share does not imply a higher per bank market share, because there are 11 investment
bank underwriters in the U.S. where there are only 4 in Japan. The fourth row reports the probabil-
ity that an investment bank is chosen, conditional on the number of previous banking relationships
being zero. In both countries, the choice probability for investment bank underwriters is unchanged
in the absence of bank relationships.
The �fth row reports another conditional probability, namely the probability that an
investment bank is chosen when (A) the number of banking relationships is at least 1, and (B)
the banks with previous banking relationships are not chosen. This conditional probability crudely
50One historical reason for this di�erence might be the prohibition of interstate banking and the resulting regional
fragmentation of commercial banks in the U.S. The U.S. is the only country among developed countries to have
imposed interstate banking in recent history.
36
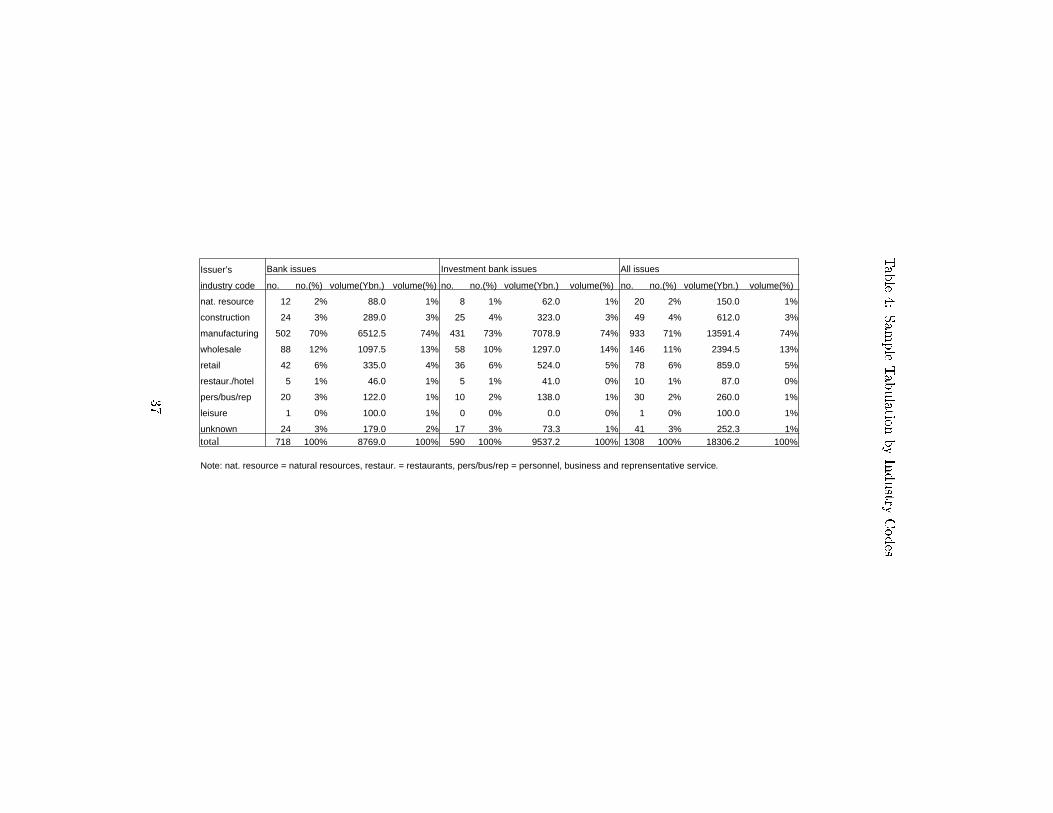
Table4:
Sam
pleTabulation
byIndustry
Codes
table3-3b.as
Issuer’s Bank issues Investment bank issues All issues
industry code no. no.(%) volume(Ybn.) volume(%) no. no.(%) volume(Ybn.) volume(%) no. no.(%) volume(Ybn.) volume(%)
nat. resource 12 2% 88.0 1% 8 1% 62.0 1% 20 2% 150.0 1%
construction 24 3% 289.0 3% 25 4% 323.0 3% 49 4% 612.0 3%
manufacturing 502 70% 6512.5 74% 431 73% 7078.9 74% 933 71% 13591.4 74%
wholesale 88 12% 1097.5 13% 58 10% 1297.0 14% 146 11% 2394.5 13%
retail 42 6% 335.0 4% 36 6% 524.0 5% 78 6% 859.0 5%
restaur./hotel 5 1% 46.0 1% 5 1% 41.0 0% 10 1% 87.0 0%
pers/bus/rep 20 3% 122.0 1% 10 2% 138.0 1% 30 2% 260.0 1%
leisure 1 0% 100.0 1% 0 0% 0.0 0% 1 0% 100.0 1%
unknown 24 3% 179.0 2% 17 3% 73.3 1% 41 3% 252.3 1%total 718 100% 8769.0 100% 590 100% 9537.2 100% 1308 100% 18306.2 100%
Note: nat. resource = natural resources, restaur. = restaurants, pers/bus/rep = personnel, business and reprensentative service.
37
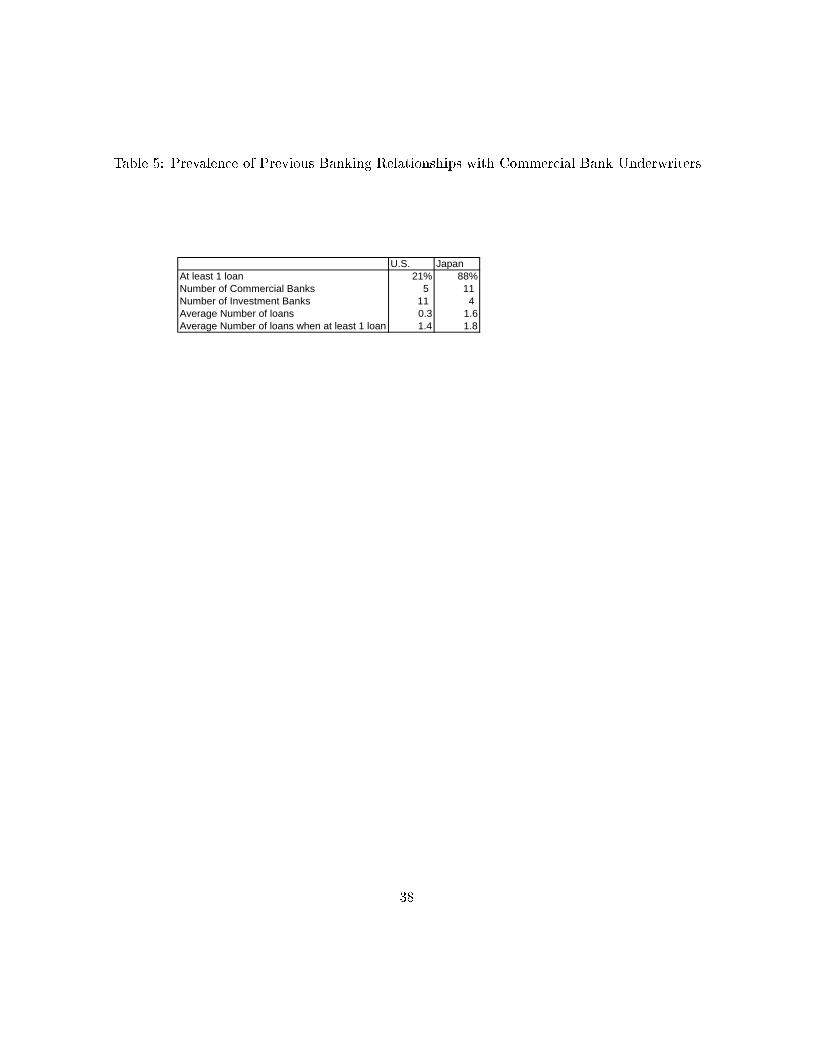
Table 5: Prevalence of Previous Banking Relationships with Commercial Bank Underwriters
U.S. JapanAt least 1 loan 21% 88%Number of Commercial Banks 5 11 Number of Investment Banks 11 4 Average Number of loans 0.3 1.6Average Number of loans when at least 1 loan 1.4 1.8
38

Table 6: Presence of Banking Relationships and Its E�ect on Competition among Banks
U.S. JapanInvestment Bank is chosen (A) 86% 45%Number of Commercial Banks 5 11 Number of Investment Banks (B) 11 4 (A)/(B) Market share per investment bank 8% 11%I-bank is chosen when issuer has no loan 86% 46%I-bank is chosen when: 93% 80% (I) issuer has at least 1 loan and (ii) issuer does not choose bank with loan
39
captures the e�ect of \betrayal" cost as discussed in Section 4.3.2. According to the theory, one
expects this probability to be weakly larger than the unconditional probability reported in the
�rst row, to the extent that choosing another commercial bank with which it had no previous
relationships a�ects the value of existing relationships negatively. 51
As shown in the �fth row of Table 6, this holds true in the data for both countries, but far
more so for Japan than for the U.S. This descriptive observation is consistent with the hypothesis
(3) that Japanese �rms are more constrained by the betrayal cost of existing banking relationships
than the U.S. counterparts.
6 Estimation Results
The estimation results of the base model are presented in Table 7. The base model is the one in
which valuations of price and relationship variables are not allowed to interact with the issuer's
reputation characteristics.
The price coe�cient � is negative and signi�cant, whereas the relationship coe�cient � is
positive and signi�cant. Thus both price and prior loan relationships are signi�cant determinants
of demand in the underwriting market. �, the dissimilarity coe�cient of the nested-logit model,
is 0.3142, which is signi�cantly di�erent from one at the 5% signi�cance level. � 6= 1 implies that
the nesting as speci�ed in Figure 2 is not redundant. Besides the inclusive value variables, I also
include issuer and bond characteristics in the upper nest. Since these are chooser-speci�c variables,
parameters are estimated separately for each choice. However, the coe�cients for one choice (in
51See (Petersen and Rajan 1994) and (Petersen and Rajan 1995) for both empirical and theoretical studies on a
closely related topic. The logic is as follows: (Petersen and Rajan 1994) shows empirically that a �rm's attempts to
widen the circle of relationships by borrowing from multiple leaders increases the price and reduces the availability of
bank credit. The �rms examined in (Petersen and Rajan 1994) are on average smaller and younger than corporate
bond issuers studied in this paper and they rely strictly on bank loans as the source of external �nance. Often, as in
the case of �rms examined in this paper, �rms are neither strictly loan-�nanced nor strictly bond-�nanced, but are
somewhere in the middle. For such �rms, the banker choice problem becomes more complex, as they optimally want
to maintain good relationships with both their lenders and with their investment banks (or whoever provide capital
market-related services). This point is explored further in (Yasuda 2001a).
40

Table 7: Estimation Results (1): Basic Model
Demand estimates Variable names PRICE LOANVariables a bEstimates -0.5455 2.7994 Standard errors (0.1844) (0.0849)
Inclusive Less than
Variable names Value 30 Issues AMOUNTVariables λ δ1 δ2Estimates 0.3142 0.4613 -0.0256Standard errors (0.1175) (0.0892) (0.0053)
Price estimates
MATURITY MATURITY AAA FIRST Variable names >=10 > =20 RATING TIME LOANinvestment banksBank1 1.2250 1.6426 -0.7315 -0.0105
*Bank2 0.5217 1.4935 -0.6353 -0.0722
Bank3 0.6201 1.6410 -0.5094 0.0906
Bank4 0.5561 1.6170 0.0609 -0.0228 commercial banks Bank5 0.5816 1.5227 -0.0493 0.4757 0.1344
*Bank6 0.6876 1.4513 -0.0757 -0.0332 -0.1657
Bank7 0.6400 1.3499 -0.0034 -0.2208 0.0779
* Bank8 0.6581 1.7969 -0.3438 0.1538 0.1743
Bank9 0.6198 1.5966 -0.2926 -0.0031 -0.1290
*Bank10 0.6003 1.6712 -0.5050 0.1284 -0.0208
Bank11 0.6252 1.5403 0.1149 -0.0684 0.0029*
Bank12 0.6607 1.3732 0.1624 0.0853 -0.1514
Bank13 0.7139 1.6166 -0.0810 -0.0523 -0.1145
Bank14 0.6380 1.4319 -0.1371 0.0638 -0.0488
Bank15 0.6469 1.4722 -0.0408 0.0138 -0.1031
41
this case investment banks) are normalized to zero, so the reported coe�cients are for the choice
of commercial banks.
The estimates of equations determining prices, , are reported for each bank. Commercial
banks and investment banks are listed separately, and within each category the banks are listed in
the order of their market shares in the sample. Bank1 is therefore the top-ranking investment bank
underwriter and is the top-ranking bank overall, whereas Bank5 is the top-ranking commercial
bank underwriter . Coe�cients for the maturity and AAA credit rating variables are all positive,
whereas those for the past issue experience variables are mostly negative. These �ndings are con-
sistent with the analysis of price determination in Section 4.2 and with the discussions of variables
entering pricing equations in Section 5. Of these four reputation characteristics of issuers/bonds,
the coe�cients for maturity variables are much larger in absolute values than others.
Table 8 reports the estimation results of one of the interacted models where price and
relationship coe�cients are allowed to vary across the reputation characteristics of issuers, namely,
credit rating. The criterion I use is whether the issuer's credit rating is AAA or not at the time
of the issuance. See Appendix for construction of this credit rating variable. Being in the AAA
category means issuers have more �nancial strength and in general higher reputation than those
in the lower rating category. The price coe�cient �1 for AAA (i.e. \high quality") issuers is
sharply more negative at -1.938, whereas the price coe�cient for non-AAA issuers (\low quality")
is negative but a lot smaller in magnitude at -0.240. The loan coe�cients �r are both positive as
predicted, and smaller for AAA issuers than for non-AAA issuers, which is also consistent with the
prediction.
The dissimilarity coe�cient � is again not signi�cantly di�erent from zero. �1 is positive,
indicating that �rst-time issuers are more likely to choose a commercial bank than seasoned issuers.
�2 is negative. If the issue amount is proxying for the size of the �rm, this suggests that smaller �rms
are more likely to choose a commercial bank underwriter than larger �rms. The price estimates
presented in Table 8 are qualitatively similar to those in the base model in Table 7.
In Table 9, I report the estimation results of another interaction model, where the trade-
o� between price and relationship in the demand equation is allowed to vary along newness of the
issuers in the corporate bond market. Investors are less likely to be familiar with or even recognize
the name of �rst-time issuers in the market, so these �rms are worse o� than seasoned issuers
42
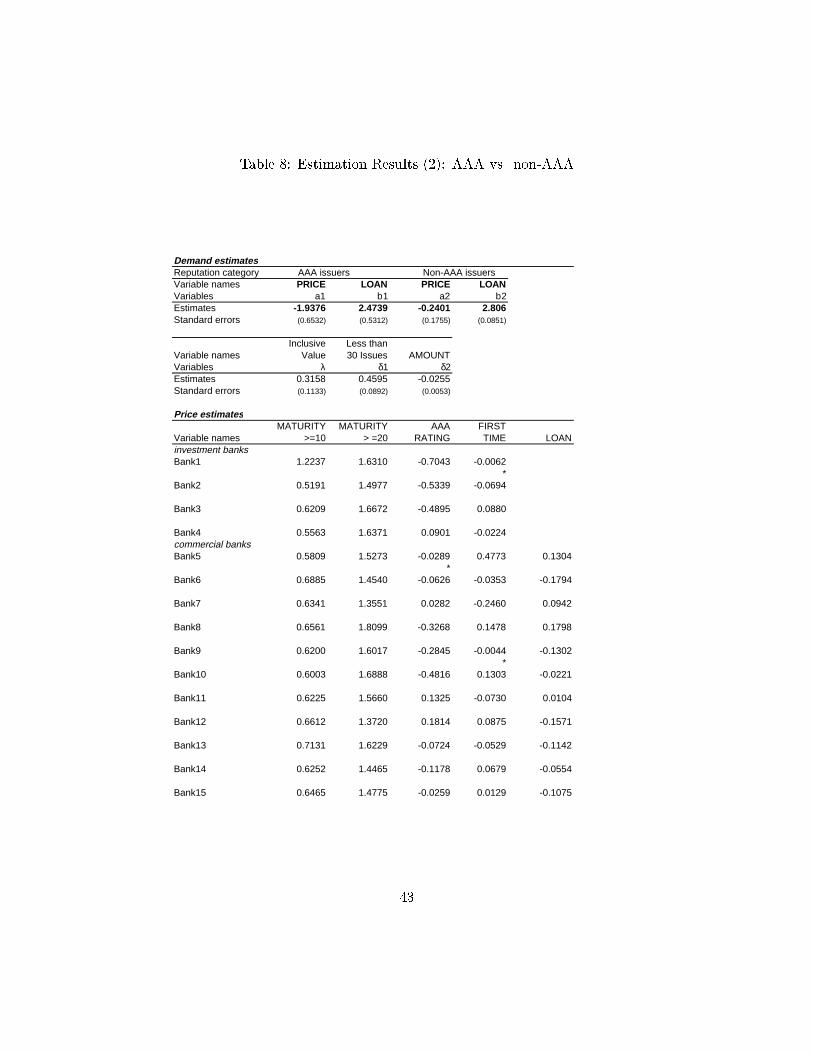
Table 8: Estimation Results (2): AAA vs. non-AAA
Demand estimate sReputation category AAA issuers Non-AAA issuersVariable names PRICE LOAN PRICE LOANVariables a1 b1 a2 b2Estimates -1.9376 2.4739 -0.2401 2.806Standard errors (0.6532) (0.5312) (0.1755) (0.0851)
Inclusive Less than
Variable names Value 30 Issues AMOUNTVariables λ δ1 δ2Estimates 0.3158 0.4595 -0.0255Standard errors (0.1133) (0.0892) (0.0053)
Price estimate s
MATURITY MATURITY AAA FIRST Variable names >=10 > =20 RATING TIME LOANinvestment banksBank1 1.2237 1.6310 -0.7043 -0.0062
*Bank2 0.5191 1.4977 -0.5339 -0.0694
Bank3 0.6209 1.6672 -0.4895 0.0880
Bank4 0.5563 1.6371 0.0901 -0.0224 commercial banks Bank5 0.5809 1.5273 -0.0289 0.4773 0.1304
*Bank6 0.6885 1.4540 -0.0626 -0.0353 -0.1794
Bank7 0.6341 1.3551 0.0282 -0.2460 0.0942
Bank8 0.6561 1.8099 -0.3268 0.1478 0.1798
Bank9 0.6200 1.6017 -0.2845 -0.0044 -0.1302
*Bank10 0.6003 1.6888 -0.4816 0.1303 -0.0221
Bank11 0.6225 1.5660 0.1325 -0.0730 0.0104
Bank12 0.6612 1.3720 0.1814 0.0875 -0.1571
Bank13 0.7131 1.6229 -0.0724 -0.0529 -0.1142
Bank14 0.6252 1.4465 -0.1178 0.0679 -0.0554
Bank15 0.6465 1.4775 -0.0259 0.0129 -0.1075
43
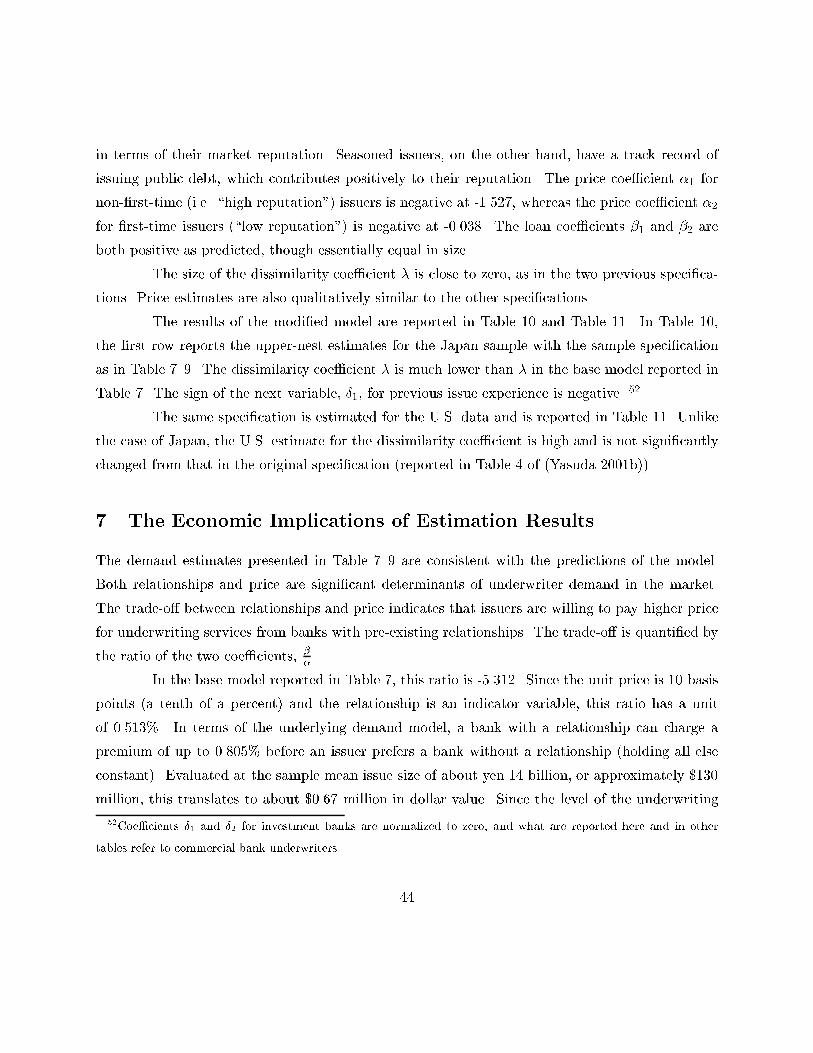
in terms of their market reputation. Seasoned issuers, on the other hand, have a track record of
issuing public debt, which contributes positively to their reputation. The price coe�cient �1 for
non-�rst-time (i.e. \high reputation") issuers is negative at -1.527, whereas the price coe�cient �2
for �rst-time issuers (\low reputation") is negative at -0.038. The loan coe�cients �1 and �2 are
both positive as predicted, though essentially equal in size.
The size of the dissimilarity coe�cient � is close to zero, as in the two previous speci�ca-
tions. Price estimates are also qualitatively similar to the other speci�cations.
The results of the modi�ed model are reported in Table 10 and Table 11. In Table 10,
the �rst row reports the upper-nest estimates for the Japan sample with the sample speci�cation
as in Table 7{9. The dissimilarity coe�cient � is much lower than � in the base model reported in
Table 7. The sign of the next variable, �1, for previous issue experience is negative.52
The same speci�cation is estimated for the U.S. data and is reported in Table 11. Unlike
the case of Japan, the U.S. estimate for the dissimilarity coe�cient is high and is not signi�cantly
changed from that in the original speci�cation (reported in Table 4 of (Yasuda 2001b)).
7 The Economic Implications of Estimation Results
The demand estimates presented in Table 7{9 are consistent with the predictions of the model.
Both relationships and price are signi�cant determinants of underwriter demand in the market.
The trade-o� between relationships and price indicates that issuers are willing to pay higher price
for underwriting services from banks with pre-existing relationships. The trade-o� is quanti�ed by
the ratio of the two coe�cients, ��.
In the base model reported in Table 7, this ratio is -5.312. Since the unit price is 10 basis
points (a tenth of a percent) and the relationship is an indicator variable, this ratio has a unit
of 0.513%. In terms of the underlying demand model, a bank with a relationship can charge a
premium of up to 0.805% before an issuer prefers a bank without a relationship (holding all else
constant). Evaluated at the sample mean issue size of about yen 14 billion, or approximately $130
million, this translates to about $0.67 million in dollar value. Since the level of the underwriting
52Coe�cients �1 and �2 for investment banks are normalized to zero, and what are reported here and in other
tables refer to commercial bank underwriters.
44
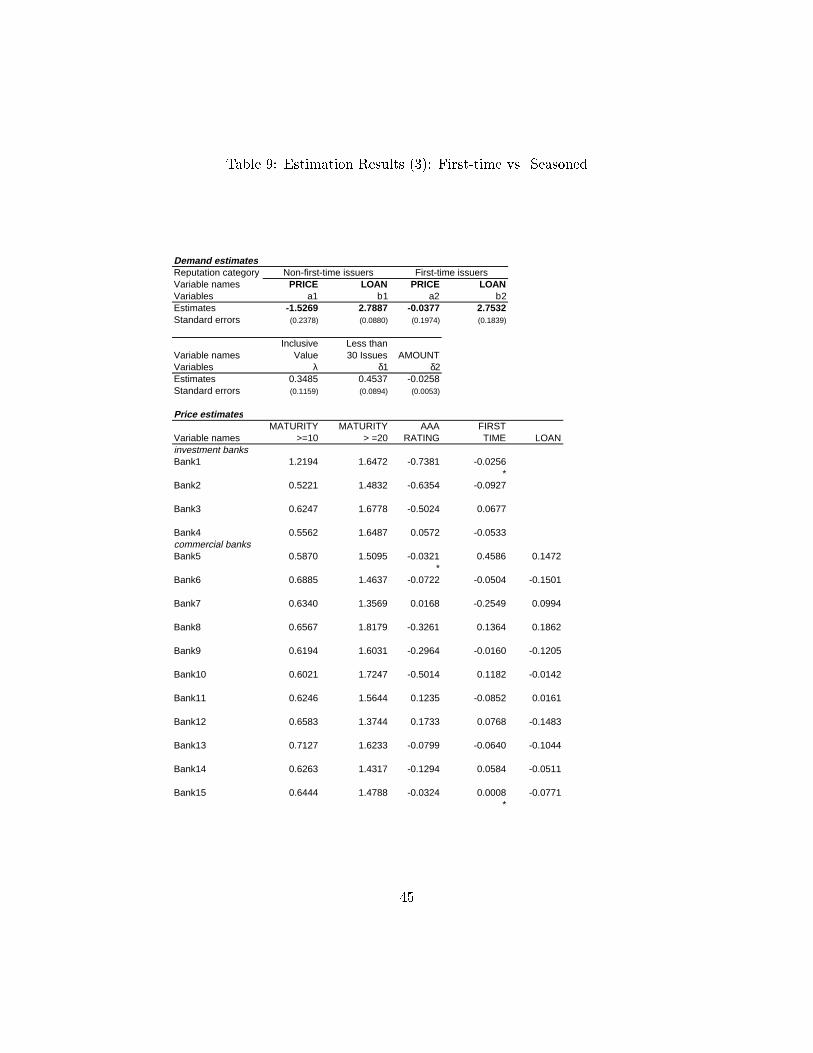
Table 9: Estimation Results (3): First-time vs. Seasoned
Demand estimate sReputation category Non-first-time issuers First-time issuersVariable names PRICE LOAN PRICE LOANVariables a1 b1 a2 b2Estimates -1.5269 2.7887 -0.0377 2.7532Standard errors (0.2378) (0.0880) (0.1974) (0.1839)
Inclusive Less than
Variable names Value 30 Issues AMOUNTVariables λ δ1 δ2Estimates 0.3485 0.4537 -0.0258Standard errors (0.1159) (0.0894) (0.0053)
Price estimate s
MATURITY MATURITY AAA FIRST Variable names >=10 > =20 RATING TIME LOANinvestment banksBank1 1.2194 1.6472 -0.7381 -0.0256
*Bank2 0.5221 1.4832 -0.6354 -0.0927
Bank3 0.6247 1.6778 -0.5024 0.0677
Bank4 0.5562 1.6487 0.0572 -0.0533 commercial banks Bank5 0.5870 1.5095 -0.0321 0.4586 0.1472
*Bank6 0.6885 1.4637 -0.0722 -0.0504 -0.1501
Bank7 0.6340 1.3569 0.0168 -0.2549 0.0994
Bank8 0.6567 1.8179 -0.3261 0.1364 0.1862
Bank9 0.6194 1.6031 -0.2964 -0.0160 -0.1205
Bank10 0.6021 1.7247 -0.5014 0.1182 -0.0142
Bank11 0.6246 1.5644 0.1235 -0.0852 0.0161
Bank12 0.6583 1.3744 0.1733 0.0768 -0.1483
Bank13 0.7127 1.6233 -0.0799 -0.0640 -0.1044
Bank14 0.6263 1.4317 -0.1294 0.0584 -0.0511
Bank15 0.6444 1.4788 -0.0324 0.0008 -0.0771*
45
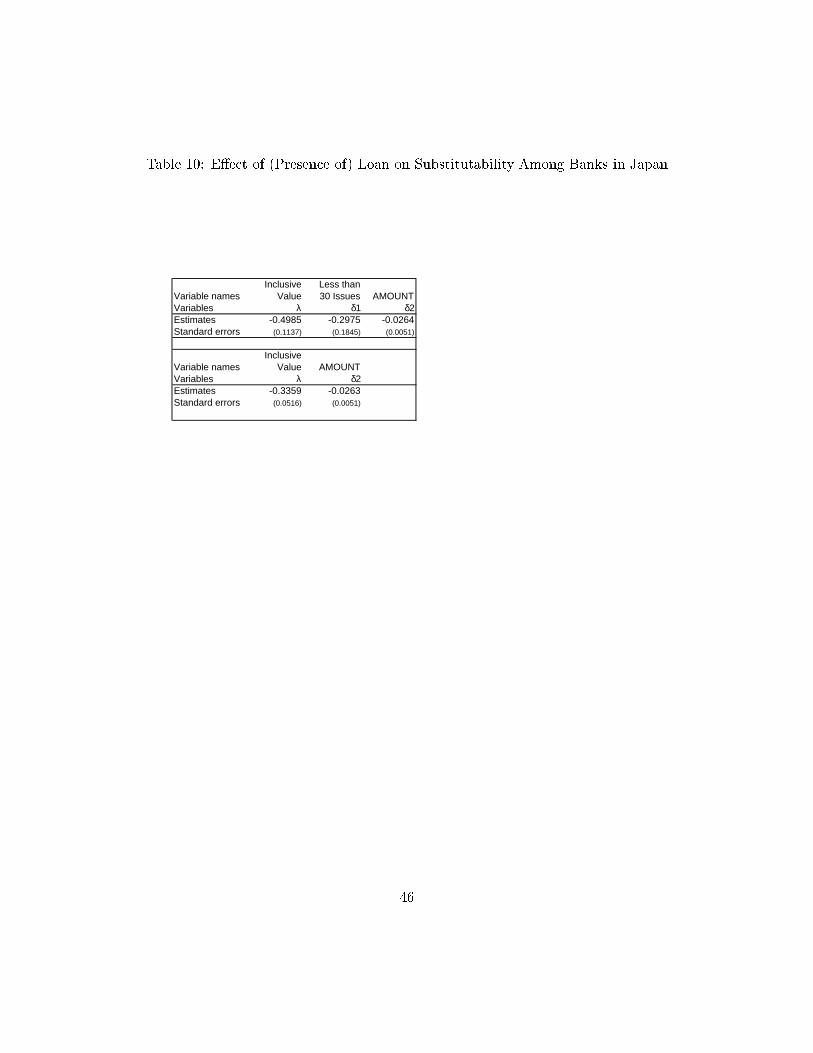
Table 10: E�ect of (Presence of) Loan on Substitutability Among Banks in Japan
Inclusive Less thanVariable names Value 30 Issues AMOUNTVariables λ δ1 δ2Estimates -0.4985 -0.2975 -0.0264Standard errors (0.1137) (0.1845) (0.0051)
Inclusive
Variable names Value AMOUNTVariables λ δ2Estimates -0.3359 -0.0263Standard errors (0.0516) (0.0051)
46
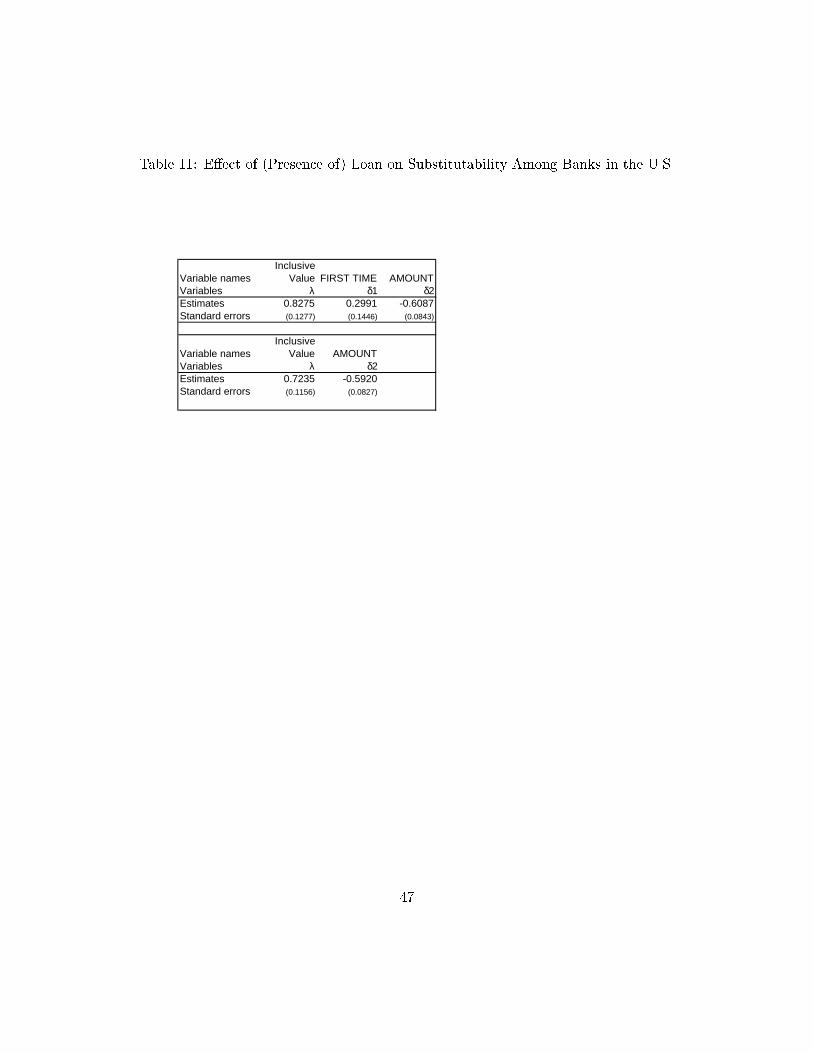
Table 11: E�ect of (Presence of) Loan on Substitutability Among Banks in the U.S.
Inclusive Variable names Value FIRST TIME AMOUNTVariables λ δ1 δ2Estimates 0.8275 0.2991 -0.6087Standard errors (0.1277) (0.1446) (0.0843)
Inclusive
Variable names Value AMOUNTVariables λ δ2Estimates 0.7235 -0.5920Standard errors (0.1156) (0.0827)
47
fee paid by the issuers in the sample ranges anywhere from several hundred thousand to several
million dollars, the value of a relationships implied by the results is quite substantial, and at the
same time reasonable.
In Table 8 where this trade-o� is allowed to di�er between AAA-issuers and non-AAA
issuers, the ratios ��are 1.277 and 11.687 for high- and low-quality issuers, respectively. Evaluated
again at the mean issue size of $130 million, the valuation of pre-existing relationships for two
classes of issuers are approximately $170,000 and $1.52 million, respectively. The 0.128% for high-
quality issuers is roughly 13 - 1
2 of the underwriting fee in that category, whereas 1.169% is on the
high end of the range of underwriting fees paid by non-AAA issuers. The large di�erence in the
values of �r�r
con�rms the prediction that there is an inverse relationship between the reputation of
issuing �rms and their valuation of the ability of underwriting banks to certify them for investors.
Similar implications are obtained from results reported in Table 9, with the ratios ��being
1.826 and 73.029 for non-�rst-time and �rst-time issuers, respectively. Evaluated at the mean issue
size of $130 million, the valuation of pre-existing relationships for these two classes of issuers are
approximately $240,000 and $9.5 million, respectively. However, the price estimate for �rst-time
issuers is not signi�cantly di�erent from zero at 5% signi�cance level, so this ratio does not have
the signi�cance level of the other estimates.
In light of the comparative aim of this paper, it is interesting to compare the result
in the Japanese market to the estimates from the U.S. sample. Because sub-investment grade
bonds comprise only about 5% of the Japanese market, the base model coe�cients are roughly
comparable to the U.S. estimates for non-junk bond issuers in (Yasuda 2001b)(Table 5) in terms
of the reputation characteristics of the issuers.
The ratio ��for the U.S. non-junk bond issuers is 0.501%, which is very similar to that of
the Japanese issuers. Despite Japan's heavier reliance on bank-�nance and the unique features of
its Main Bank System, the valuations of banking relationships as revealed in the demand equations
do not appear to vary much between the two countries.
One comparative feature of corporate organizations in the U.S. and Japan might partly be
attributable for this result. In the U.S., the junk bond segment was a signi�cant part of the overall
market during the sample period. Many of these junk bond issuers are relative young, �rst-time
bond issuers. Relationships with commercial banks may thus have alllowed these new and lower-
48
rated �rms to initiate bond issues earlier than they otherwise could have. In comparison, most of
bond issuers in Japan are large, established old corporations. These di�erences in the compositions
of bond issuing �rms re ect not only the earlier establishment of junk bond market in the U.S., but
potentially also the higher rate of �rm creation (as well as destruction) in the U.S. compared to
Japan. What this implies is that there is a greater share of U.S. �rms who are new to the market
and thus can bene�t from potential certi�cation. Having lower rate of �rm creation thus lowers the
positive e�ect of previous relationships on underwriter demand on average in Japan.
The history of deregulation o�ers another, related explanation to this similarity result.
That is, there might be a relevant di�erence in the stage of market deregulation between the
two countries during their respective sample periods. In the U.S., there has been more new �rm
formation, and a greater number of new issuers into the market. Development of junk bond market
in the 80's has been partly induced by this trend in new �rm formation. In Japan, traditionally the
focus of �nance smooth funding of existing borrowers rather than creation of new �rms. This has
resulted in delayed development of bond market in general, and of junk bond segment in particular.
Furthermore, deregulation of bond markets on the issuer side in the 80's shifted �rms away from
bank borrowing into bond �nance(see Section 3.2 and 3.4), but underwriting by commercial banks
was still prohibited by regulation. Thus the value of banking relationships went unexploited, and
by the time commercial bank entry, many �rms were already seasoned issuers. Thus the value of
the relationship has eroded for much of the Japanese �rms. What this di�erence between the two
countries implies is that the relationship in Japan might have been more valuable had it not been
for the mismatched timing of the bond market deregulation.53
In Table 10, the dissimilarity coe�cient � is much lower than � in the base model reported
in Table 7. The negative sign of the previous issue experience variable for commercial banks
con�rms the economic interpretation that less experienced issues' preference for commercial bank
underwriters is directly linked to existence of previous relationships. Given this ip in the sign of
the coe�cient, I report in the second row another set of estimates when the variable for previous
issue experience is excluded. The low dissimilarity coe�cient � implies that cross-elasticity is low
across the nests and high within the nest.
53However, this does not rule out the possibility that restrictions on bond issuance were binding, i.e. Japanese
�rms had over-vested in relationships with commercial banks before restrictions were lifted.
49

The same speci�cation is estimated for the U.S. data and is reported in Table 11. Unlike
the case of Japan, the U.S. estimate for the dissimilarity coe�cient is high and is not signi�cantly
changed from that in the original speci�cation (reported in Table 4 of (Yasuda 2001b)). Thus
the nesting is redundant and presence of loan does not a�ect the substitution patterns between
underwriters. The sign of �1 for previous issue experience is positive, which is also unchanged from
the base model. The second row results are qualitatively similar.
To re-iterate the international comparative results, I �nd that the valuation of bank rela-
tionship (��) is not higher in Japan than in the U.S., while the \dissimilarity coe�cient" (�) is lower
in the modi�ed nest for Japan but not in the U.S. Neither the certi�cation nor con ict of interest
alone can explain both the similarity result (in ��) and the di�erence result (in �). If there were
con ict of interest alone, � for Japan would be negative, and this is inconsistent with the similarity
result. And if there were smaller but positive certi�cation e�ect alone, �modified would not be lower
in the modi�ed nest for Japan, and this is inconsistent with the di�erence result. Something more
is at work.
The di�erence in empirical results between the two countries can be interpreted as coming
from their di�erences in the relative weights on one-shot versus long-term payo�s. The one-shot
pay-o� of choosing a particular underwriter (with potential certi�cation or con ict of interest in
the presence of relationships) seems to dominate the choice problem that the U.S. issuers face. In
other words, the long-term value of relationships with other commercial banks does not appear
to a�ect the choice of a particular commercial bank. Instead, the net certi�cation e�ect (one-
shot positive pay-o�) alone explains the choice well. In Japan, on the other hand, the long-term
values of relationships with commercial banks appear to have a more dominant e�ect on the �rms'
underwriter choice problem. Certi�cation alone cannot explain why commercial banks without
relationships are signi�cantly worse o� when there are other commercial banks with relationships
than when they face no rival commercial banks with relationships. In fact, net certi�cation need
not be present to explain this negative cross-bank e�ect and the positive own-e�ect of relationships
as long as preservation of long-term relationships value predominates the �rm's choice problem. 54
54This interpretation reconciles our results of underwriter choice model and (Hamao and Hoshi 1999), which
analyzes yield di�erentials in the Japanese data following (Puri 1996) and (Gande, Puri, Saunders, and Walter 1997)
and reports a con ict of interest (or discounting by investors) rather than a certi�cation e�ect for commercial bank
50
The similarity result (in ��) can be due to one-shot payo� that is positive but su�ciently
smaller in Japan than in the U.S., or actually negative one-shot payo� (con ict of interest), coupled
with long-term positive payo� from not switching, resulting in the net level not higher than that
of the U.S. This interpretation is consistent with the di�erence result (in �), which is more cleanly
indicative of presence of betrayal cost (from switching relationships among commercial banks) for
Japanese �rms and absence of such cost for American �rms. Combined, the two results support
existence of betrayal cost for Japanese �rms, lack of such cost for American �rms, while they also
support lower (positive or negative) one-shot payo� for Japanese �rms than for American �rms of
choosing a bank with a relationship. This is admittedly not the only possible interpretation, but an
economically plausible one that draws from the two countries' di�erences in the history of banking
and corporate �nancing institutions (as described in 2.1 and 3).
8 Extension
8.1 Lender Relationship Rankings
Since more comprehensive data on bank-�rm relationships are available for the Japanese market
than for the U.S. market, I also constructed alternative de�nitions of lender relationship variables
that allowed measurement of rankings among lending banks for a given �rm. Objectives of con-
structing such variables are twofold. First, running alternative speci�cations using these variables
allow us to check the robustness of our main results for the Japanese data. Second, in the broader
context of the existing literature on bank relationships, it is quite interesting to investigate whether
the relationship between the rankings of banks and the values of their relationships is non-linear,
as has been suggested.
8.1.1 The Loan Ratio Variable
The rankings I construct are based on �rm-, bank-, and year- speci�c loan ratio variables. The
loan ratio is de�ned as [bank j's loan to �rm i] / [�rm i's total bank loan] (multiplied by 100 to
underwriting.
51
express it in percentage). For each bank-�rm pair, I took a 5-year average (from 1988 to 1992) of
these loan ratios. 55 56
8.1.2 The Lender Relationship Ranking Variable
Using these loan ratio variables, I identify a top lender, second-largest lender, third-largest lender,
and the rest of lenders with lower rankings than third, all among the 11 commercial bank under-
writers. 57
8.2 Sample Statistics
Table 12 shows summary statistics for the loan relationship ranking variables. The �rst column
reports the total number of bank-�rm relationships in which a given bank is a given �rm's top
lender, second lender, and so on. The second column shows the number of observations where a
top lender was chosen as underwriter, a second lender, and so on. The third column shows the
conditional choice probability at which a lender of a given rank is chosen. And the fourth and the
55Taking average of these 5 years means that, if loans were present in all 5 years, the average simply smoothes out
annual uctuations. If loans were present in only a subset of these years, then it lowers the average value, thus again
measuring a somewhat weaker relationship. Taking average seems reasonable, because I did observe in the data some
years where there were no loans by a given bank, which reappears again in subsequent years. Choosing 5 years is to
some extent arbitrary of course, with a practical rationale being that most bank-speci�c data are available for these
5 years.56Another decision I made was to use the sum of bank loans as the denominator, instead of using loan plus public
market debt (bonds) as well. By taking a 5-year average, I am trying to measure the relative strength of relationships
among banks for a given �rm, rather than trying to construct a cardinal value that is comparable across di�erent
�rms. In other words, my priori is that a ratio of 0.15 may indicate either a strong or a weak relationship depending
on who else are also lending to that �rm and what their relative importance is. With this reasoning, using only loan
seems reasonable, as it is the simplest, and adding more to the denominator does not alter the rankings among banks.
(There was no data on who underwrote which portion of bonds outstanding.)57Wherever there is a tie, I count each and all of them as possessing that rank, and assign the next largest lender
as having a rank right below them. So two banks with the top share of 0.20 each both get a Top lender position, the
next bank with the share of 0.15 gets a Second lender position, and so on. Ties occur in about 5% of the sample for
the Top 3 lenders. More details are shown in tables the next section.
52

�nal column reports the mean of the loan ratios for top lenders, second lenders, etc. As can be seen
here, there is a strong non-linear relationship between the choice probability and the rankings as
well as the loan ratios. That is, not only is the choice probability inversely related to the rankings, it
is disproportionately high for top lenders even when their higher loan ratios are taken into account.
Furthermore, this observation is in support of the use of dummy variables for presence of \top
banker" relationships in the main model speci�cation. 58
8.3 Estimation Results and Interpretations
Given the sample statistics, which gave preliminary support to the view that a lender ranking
identi�es strength of relationships well, and may be a better comparable measure for strength of
relationships across �rms and across banks than loan ratios per se, I included 4 dummy variables for
the 4 lender ranking categories, to separately estimate the value of pre-existing lending relationships
in the underwriter demand model. The results are reported in Table 13. 59 I �nd that coe�cients
for all except the lower-ranked lender relationships are positive and signi�cantly di�erent from zero,
with the top-lender relationship being the largest (3.2), second lenders the second largest (2.0), and
third lenders the smallest (1.2). The coe�cient for the lower-ranked relationships is not signi�cantly
di�erent from zero. I �nd that the coe�cient for the price variable is negative. The coe�cient for
the inclusive value variable is 0.24, while the coe�cients for previous market exposure and issue
amount have the predicted signs (and are the same as the previous model speci�cation result).
The trade-o�s between relationships and price, as expressed by ��, are 0.894% for top
lender relationships, and 0.559% and 0.330% for second and third-lenders, respectively. Up to
three top relationships a�ect the �rm's underwriter choice positively, with varying degrees with
predicted directions. Having lower-ranked relationships, however, do not have any signi�cant e�ect
on the �rm's underwriter choice. This result is consistent with the certi�cation e�ect of commercial
bank underwriting. It is also in support of the view that �rms carefully maintain a few key bank
58There can be multiple top relationships in the way I constructed the dummy loan variables. See Appendix A for
details.59I also tried di�erent speci�cations, where Loan Ratio variables (both including the lower-ranked lenders and
excluding them) were used instead of these lender ranking variables, and �nd that the results do not change across
di�erent speci�cations.
53
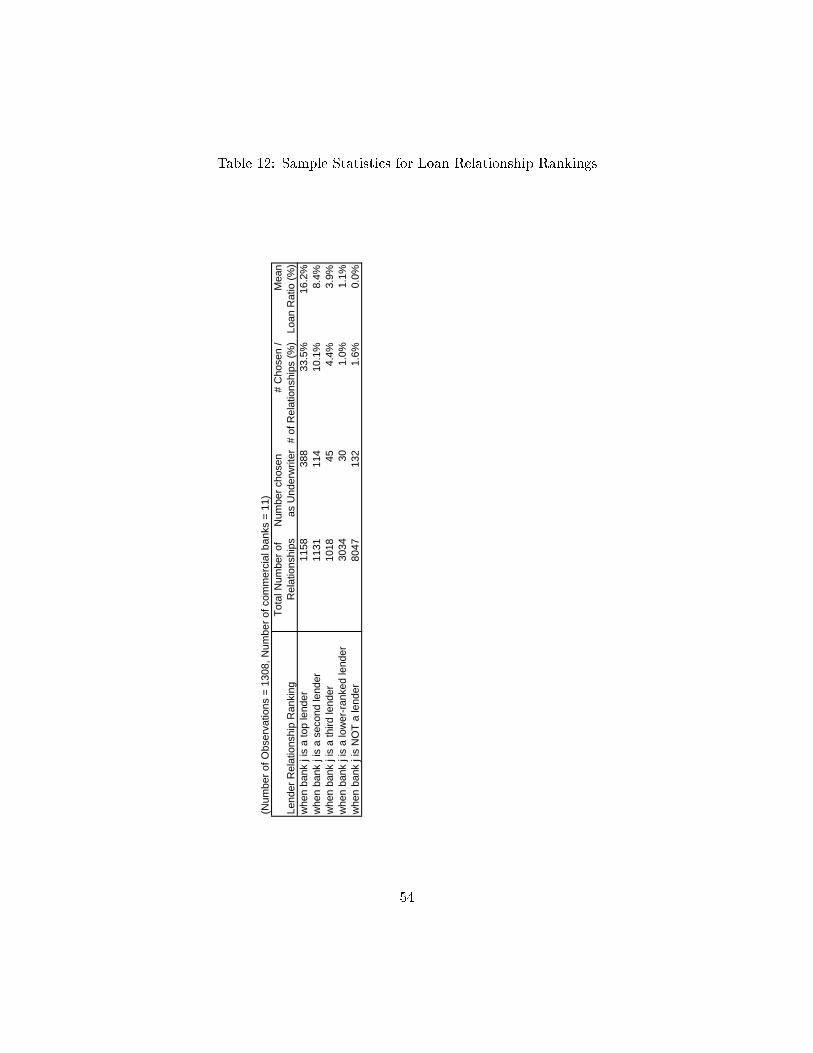
Table 12: Sample Statistics for Loan Relationship Rankings
(Num
ber
of O
bser
vatio
ns =
130
8, N
umbe
r of
com
mer
cial
ban
ks =
11)
T
otal
Num
ber
of
Num
ber
chos
en
# C
hose
n /
Mea
nLe
nder
Rel
atio
nshi
p R
anki
ngR
elat
ions
hips
as U
nder
writ
er#
of R
elat
ions
hips
(%
)Lo
an R
atio
(%
)w
hen
bank
j is
a to
p le
nder
1158
388
33.5
%16
.2%
whe
n ba
nk j
is a
sec
ond
lend
er11
3111
410
.1%
8.4%
whe
n ba
nk j
is a
third
lend
er10
1845
4.4%
3.9%
whe
n ba
nk j
is a
low
er-r
anke
d le
nder
3034
301.
0%1.
1%w
hen
bank
j is
NO
T a
lend
er80
4713
21.
6%0.
0%
54
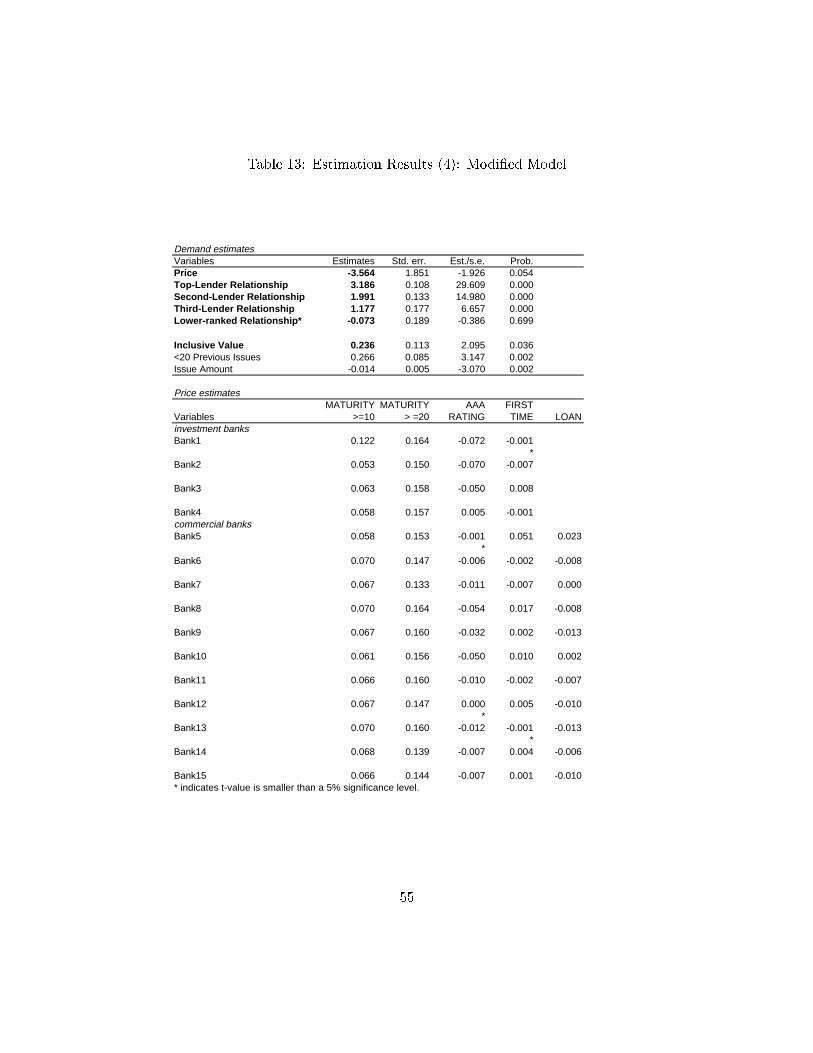
Table 13: Estimation Results (4): Modi�ed Model
Demand estimatesVariables Estimates Std. err. Est./s.e. Prob.Price -3.564 1.851 -1.926 0.054Top-Lender Relationship 3.186 0.108 29.609 0.000Second-Lender Relationship 1.991 0.133 14.980 0.000Third-Lender Relationship 1.177 0.177 6.657 0.000Lower-ranked Relationship* -0.073 0.189 -0.386 0.699 Inclusive Value 0.236 0.113 2.095 0.036 <20 Previous Issues 0.266 0.085 3.147 0.002 Issue Amount -0.014 0.005 -3.070 0.002
Price estimatesMATURITY MATURITY AAA FIRST
Variables >=10 > =20 RATING TIME LOANinvestment banksBank1 0.122 0.164 -0.072 -0.001
*Bank2 0.053 0.150 -0.070 -0.007
Bank3 0.063 0.158 -0.050 0.008
Bank4 0.058 0.157 0.005 -0.001commercial banksBank5 0.058 0.153 -0.001 0.051 0.023
*Bank6 0.070 0.147 -0.006 -0.002 -0.008
Bank7 0.067 0.133 -0.011 -0.007 0.000
Bank8 0.070 0.164 -0.054 0.017 -0.008
Bank9 0.067 0.160 -0.032 0.002 -0.013
Bank10 0.061 0.156 -0.050 0.010 0.002
Bank11 0.066 0.160 -0.010 -0.002 -0.007
Bank12 0.067 0.147 0.000 0.005 -0.010*
Bank13 0.070 0.160 -0.012 -0.001 -0.013*
Bank14 0.068 0.139 -0.007 0.004 -0.006
Bank15 0.066 0.144 -0.007 0.001 -0.010* indicates t-value is smaller than a 5% significance level.
55

relationships to protect their long-term payo�s and that this practice persists in the new market
when the scope of the existing relationships widen. Combined with the results reported in Table 10
and 11, I interpret these results to suggest that, while either or both of certi�cation and preservation
of long-term values can explain this result, in Japan the evidence of the latter is more evident than
in the U.S.
9 Conclusion
This paper has examined the question of whether existing institutional di�erences in the banking
systems a�ect bank competition in capital markets. Behind this question, there is also a broader
inquiry on whether development of capital markets will lead to disappearance of the institutional
di�erences and convergence of the systems toward a market-based, Anglo-American system. I
investigate these questions by studying post-deregulation competition between entrant commercial
banks and incumbent investment banks in the Japanese corporate bond underwriting market and
comparing the results with the U.S. study reported in (Yasuda 2001b).
The comparisons were conducted based on the following two hypotheses. First, the banking
literature often emphasizes di�erences between market-based �nancial systems of the U.S./U.K.
and bank-based �nancial systems of Japan and Germany. The certi�cation hypothesis predicts
that a pre-existing banking relationship a�ects a �rm's demand for underwriting service from a
bank positively. The U.S.-Japan contrast suggests that the positive e�ect of bank relationships on
underwriter demand is stronger in Japan than in the U.S.
Second, the Japanese main bank system is characterized by the multi-faceted, state-
contingent nature of relationships and reciprocal delegation of monitoring among banks ((Aoki
and Patrick 1994)). These institutional features in contrast to the American regime of arm's length
banking predicts that Japanese �rms are more constrained by the betrayal cost of switching from
existing relationship(s) with their banks than American �rms. In other words, existence of such
a relationship lowers relative demand for underwriting service by rival commercial banks (but not
investment banks).
A discrete choice model of underwriter demand and a model of issue-speci�c pricing by
individual banks are jointly estimated. Like the U.S. results in (Yasuda 2001b), I �nd that a previous
56

loan relationship a�ects a �rm's demand for a given bank's underwriting service positively. I also
�nd that issuers with lower credit ratings value bank relationships more, which is qualitatively
similar to the U.S. result.
I �nd that the valuation of bank relationship (��) is not higher in Japan than in the U.S.,
while the \dissimilarity coe�cient" (�) is lower in the modi�ed nest for Japan but not in the U.S.
Neither the certi�cation nor con ict of interest alone can explain both the similarity result (in��) and the di�erence result (in �). If there were con ict of interest alone, � for Japan would be
negative, and this is inconsistent with the similarity result. And if there were smaller but positive
certi�cation e�ect alone, �modified would not be lower in the modi�ed nest for Japan, and this is
inconsistent with the di�erence result. Something more is at work.
The similarity result (in ��) can be due to one-shot payo� that is positive but su�ciently
smaller in Japan than in the U.S., or actually negative one-shot payo� (con ict of interest), coupled
with long-term positive payo� from not switching, resulting in the net level not higher than that
of the U.S. This interpretation is consistent with the di�erence result (in �), which is more cleanly
indicative of presence of betrayal cost (from switching relationships among commercial banks) for
Japanese �rms and absence of such cost for American �rms. Combined, the two results support
existence of betrayal cost for Japanese �rms, lack of such cost for American �rms, while they also
support lower (positive or negative) one-shot payo� for Japanese �rms than for American �rms of
choosing a bank with a relationship. This is admittedly not the only possible interpretation, but an
economically plausible one that draws from the two countries' di�erences in the history of banking
and corporate �nancing institutions.
According to this interpretation, the di�erences between the arm's length banking regime
in the U.S. and the state-contingent, reciprocally supported banking regime in Japan 60 have
resulted in the di�erences in the relative weights on one-shot versus long-term payo�s of hav-
ing/keeping commercial bank relationships in the two countries. In the U.S. bond underwriting
market, the one-time payo� of certi�cation appears to be the �rst-order economic role of existing
relationships, whereas in Japan, the long-term bene�t of not switching (or cost of betrayal) appears
to play an economic role of the same magnitude as the weaker-than-the U.S., and potentially neg-
ative, one-shot payo� of choosing a commercial bank with relationships. These di�erences in the
60See Figure 1 and Table 1 from (Aoki and Patrick 1994).
57

economic roles of relationships, as shaped by the di�erences in the history of banking and corporate
�nancing institutions, appear to persist in bank competition in the deregulated market. 61
Together, this paper and (Yasuda 2001b) provide a collection of new empirical �ndings and
economic arguments about the nature of dynamic interactions between existing bank relationships
and institutions, on one hand, and development of and competition in capital markets, on the
other. 63 In (Yasuda 2001b), we show that pre-existing relationships enabled entrant commercial
banks to compete with incumbent investment banks in the deregulated bond market in the U.S.
This led to a greater competition increase in the segments of the market for newer and lower-rated
issuers, because these issuers valued the certi�cation bene�t of relationships with commercial banks
more. In this paper, we �nd that the di�erences in the economic nature of bank relationships across
the two countries do persist in the ways they a�ect competition in the deregulated bond markets.
The long-term nature of relationships in the Japanese banking system implies that once the banks
and �rms are committed to each other with sunk investments in the relationship, it is still ex-post
optimal to stick to parts of the old relationships that are cheap and bene�cial, even after the bond
market is developed and incentives are no longer there to credibly commit to a new relationship.
These results, when weaved together, give rise to a conceptual query on the global conver-
gence view. The results suggest that it is misleading to equate development of market in Japan with
61Furthermore, a �rm's valuation of relationships with its investment banks is also a relevant determinant of
competition in the markets. Though we did not have the data to measure such relationships to incorporate into
our analysis here, it is plausible that, to the extent that commercial banking is arm's length in the U.S., investment
banking is hands-on and that a large, publicly-traded U.S. �rm's primary bank relationship(s) is with an investment
bank. In contrast, in Japan, a large, publicly-traded �rm's primary banking relationship(s) is with a commercial
bank. 62 This di�erence in relative status of incumbents (investment banks) and entrants (commercial banks) also
adds to explain why the betrayal cost of relationships with the entrant seems to be a signi�cant determinant of
underwriter choice for Japanese �rms but not for American �rms.63While we did not study equity markets, it is well-documented that equity is an insigni�cant source of net external
�nancing for �rms across economies, even for the U.S. (Mayer 1988), (Mayer 1990), and (Rajan and Zingales 1995)
report that across all developed countries, �rms rely mostly on retained earnings, much less on external �nance,
and that within external �nance, debt is the dominant form of capital. In fact, equity was a net negative source
of �nancing for U.S. �rms in the recent years because of the popular use of share buy-backs. From the corporate
�nancing perspective, therefore, we can sensibly concentrate on debt markets.
58

disappearance of institutions in support of economic roles of existing relationships. Institutional
arrangements that supported the main bank system do not automatically disappear when capital
markets develop, because they support the economic roles of relationships to which both �rms and
bank have already invested in. Lack of those arrangements prevents this type of long-term relation-
ships from ever forming between U.S. �rms and U.S. banks, 64 but this does not imply that when
Japanese �rms shift weight to bond �nance away from loan �nance, it is ex post optimal for both
�rms and banks to abandon those relationships wholesale. It may be too costly to \build" such a
relationship in the post-deregulation environment but not too costly to \maintain" one. 65 So it
may be economically optimal for them to preserve the value of pre-existing relationships where it is
credibly cheap to do so (as not betraying the main bank in the bond underwriting market vis-a-vis
other entrant commercial banks was). 66 67 Consequently, the deregulatory measures aimed toward
universal banking and equally implemented in the U.S. and Japan have had (and continue to have)
path-dependent and non-convergent impacts on their �nancial systems.
Similarly, it can be deceptive to assume Anglo-American model's market-based-ness to
imply institutionless-ness (or relationshipsless-ness). (Yasuda 2001b) shows that relationships with
commercial banks may have allowed new and lower-rated �rms to initiate bond issues earlier than
they otherwise could have, but that investment banks' franchise values are not threatened by the
commercial bank entry in the overall U.S. market. In sharp contrast, domestic investment banks
no longer dominate the capital markets in Japan after the deregulation. Of the top 4 incumbent
investment banks, Nomura remains the only stand-alone investment bank. 68 Meanwhile, the
64(Ramseyer 1994).65(Aoki 2001), Chapter 12.66In contrast, preserving the interlock shareholding may no longer be economically justi�ed, and we observe that
it is gradually being dismantled.67In a related theoretical work, (Dinc 1996) formalizes this idea and states that two cases are possible: (1) (Conver-
gence) If relational banking is not feasible with developed bond markets, the relational banking institution disappears
after �nancial ingetration. (2) (Path dependence) If relational banking, once established, is sustainable with devel-
oped bond markets, but reputation building costs are low enough in their absence, then the di�erence in �nancial
institutions between the economies can persist after �nancial market integration. We interpret our empirical �ndings
from Chapter 3 as consistent with the second case scenario.68Yamaichi Securities has gone bankrupt (and many former-Yamaichi employees were absorbed by Merrill Lynch),
Nikko Securities became an a�liate of Citigroup as NSSB (Nikko Salomon Smith Barney), and Daiwa has formed a
59
Japanese commercial banks have consolidated within themselves to form at least four major banking
groups that have the characteristics of broad-based, universal banks. 69
Put di�erently, some major institutional features of the American corporate �nance and
governance, such as existence of specialized investment banks and high-degree of reliance on capital
markets for corporate �nancing and corporate control by large corporates, may be as particular a
product of its own banking history as the universal banking system in continental Europe, or the
main bank system in Japan. Indeed, U.S. domestic capital markets remain �rmly dominated by
domestic, stand-alone investment banks even after the industry-wide consolidation and the resulting
acquisitions of some major U.S. investment banks by both U.S. and European banks. This contrast
between the U.S. and Japan suggests that investment banks remain an uniquely American breed
of �nancial institutions. While there are no legal impediments to emergence of elite, specialized
stand-alone investment banks in Europe or Japan, our analysis of interactions between institutions,
relationships and competition predict that it is unlikely.
Thus, on the query as to if and when of global convergence to the Anglo-American mar-
ket system, we would argue that the view is questioned on two levels. First, its prediction is
questioned because the convergence does not appear to be happening, based on our empirical
�ndings and economic interpretations, and second, its distinction of markets (U.S./U.K.) vs. in-
stitutions/relationships (Japan/Europe) is also questioned because it does not help us understand
why the convergence may not be happening. Global �nancial markets will likely be a signi�cant
source of external �nancing for large global corporates originating in any developed country, but
these countries' �nancial systems will likely remain di�erent. U.S. will continue to be predomi-
nantly investment bank-based, in the sense that it will be serving as a �rm's primary �nancier
at the nexus of transactions between �rm insiders, 70 while Japan will likely remain bank-based.
Markets and institutions / relationships do not work in mutually exclusive manners as is often
comprehensive alliance with Sumitomo Bank (a domestic commercial bank).69Mitsubishi-Tokyo(Tokyo-Mitsubishi, Mitsubishi Trust and Japan Trust), Mizuho(IBJ, Fuji and DKB), Mitsui-
Sumitomo(Sakura and Sumitomo), and UFJ(Sanwa, Tokai and Toyo Trust).70The Silicon Valley model of venture capital �nance is an important omission in this discussion, not only because
the signi�cance of private equity as source of external �nancing in the U.S. has grown exponentially in the last
decade, but also because it is a model where complementarity between VC-�rm relationships and markets (IPOs) via
certi�cation is crucial for the success of the model.
60
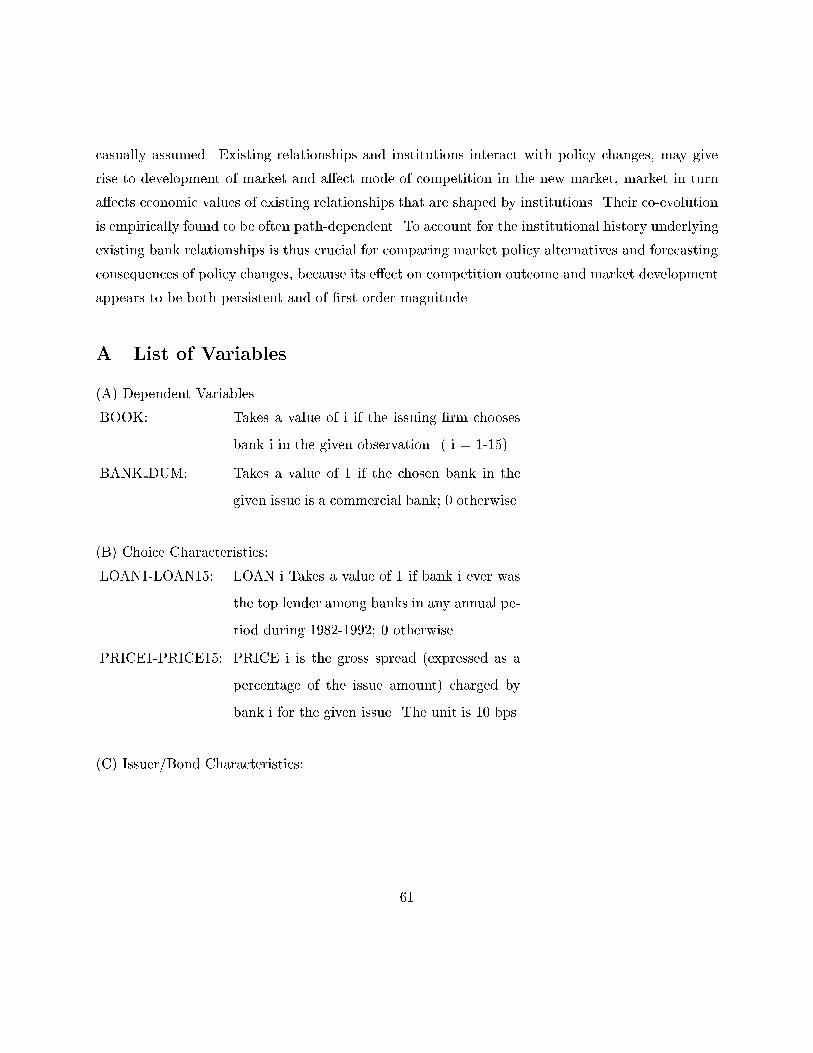
casually assumed. Existing relationships and institutions interact with policy changes, may give
rise to development of market and a�ect mode of competition in the new market, market in turn
a�ects economic values of existing relationships that are shaped by institutions. Their co-evolution
is empirically found to be often path-dependent. To account for the institutional history underlying
existing bank relationships is thus crucial for comparing market policy alternatives and forecasting
consequences of policy changes, because its e�ect on competition outcome and market development
appears to be both persistent and of �rst-order magnitude.
A List of Variables
(A) Dependent Variables
.BOOK: .Takes a value of i if the issuing �rm chooses
bank i in the given observation. ( i = 1-15)
.BANK DUM: .Takes a value of 1 if the chosen bank in the
given issue is a commercial bank; 0 otherwise.
(B) Choice Characteristics:
.LOAN1-LOAN15: .LOAN i Takes a value of 1 if bank i ever was
the top lender among banks in any annual pe-
riod during 1982-1992; 0 otherwise.
.PRICE1-PRICE15: .PRICE i is the gross spread (expressed as a
percentage of the issue amount) charged by
bank i for the given issue. The unit is 10 bps.
(C) Issuer/Bond Characteristics:
61
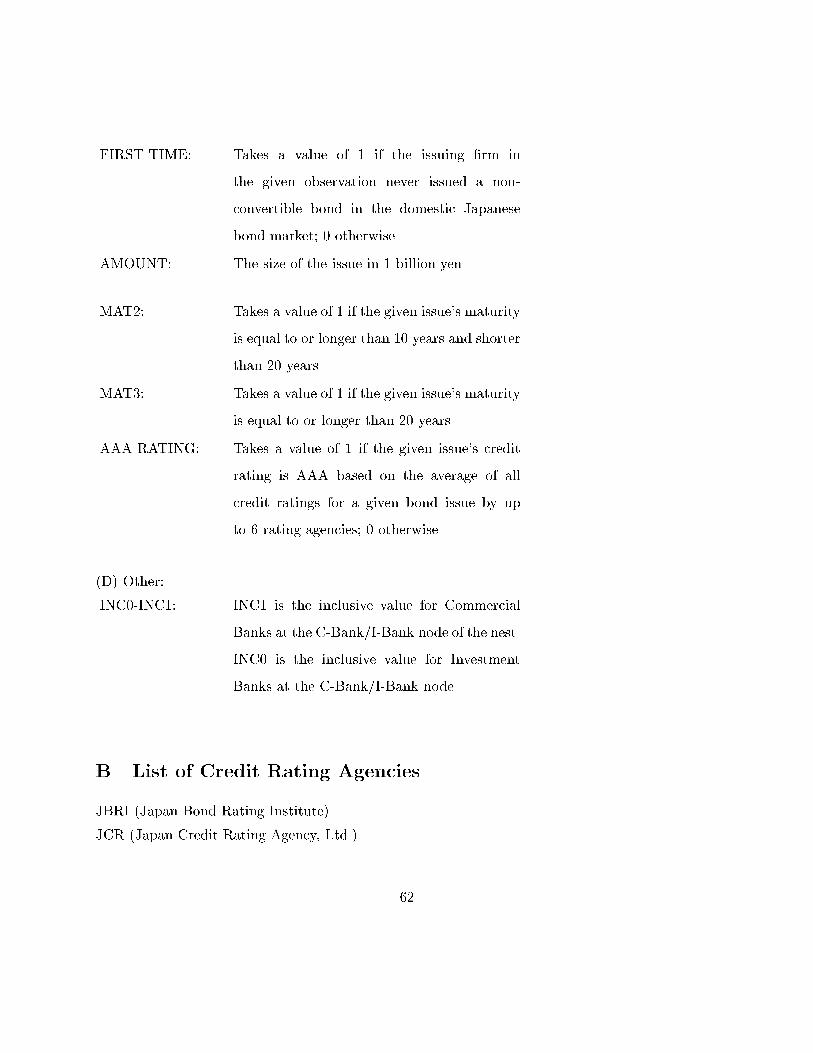
.FIRST TIME: .Takes a value of 1 if the issuing �rm in
the given observation never issued a non-
convertible bond in the domestic Japanese
bond market; 0 otherwise.
.AMOUNT: .The size of the issue in 1 billion yen.
.MAT2: .Takes a value of 1 if the given issue's maturity
is equal to or longer than 10 years and shorter
than 20 years.
.MAT3: .Takes a value of 1 if the given issue's maturity
is equal to or longer than 20 years.
.AAA RATING: .Takes a value of 1 if the given issue's credit
rating is AAA based on the average of all
credit ratings for a given bond issue by up
to 6 rating agencies; 0 otherwise.
(D) Other:
.INC0-INC1: .INC1 is the inclusive value for Commercial
Banks at the C-Bank/I-Bank node of the nest.
INC0 is the inclusive value for Investment
Banks at the C-Bank/I-Bank node.
B List of Credit Rating Agencies
JBRI (Japan Bond Rating Institute)
JCR (Japan Credit Rating Agency, Ltd.)
62

NIS (Nippon Investors Services)
R&I (Japan Rating and Investment Information, Inc.)
Moody's (Moody's Investors Service)
S&P (Standard & Poor's)
C Estimation Method
In the EM framework, the observed data are viewed as being \incomplete", and are augmented by
unobserved data to make up the \complete data". Each EM iteration involves an E-step where the
conditional expectation of the complete-data log likelihood given the observed data is computed
using the previous estimates �(0), and an M-step where the conditional expectation is maximized
over �. This procedure is repeated in an iterative manner until convergence is achieved.
Let ci represent the index of the bank chosen by �rm i.
Let � = f�; �; �; ; �g.
We observe ci and pi;ci , as well as xi;j, zi. The task is to estimate � according to the maximum
likelihood principle. We will do this by an EM-type algorithm, assuming p�ci to be the \hidden"
data and hence fci; pci ; p�cig to be the complete data. Thus we need to establish Pr(ci; pci ; p�ci j�).
Pr(c; pc; p�cj�) = Pr(cjpc; p�c; �) Pr(pc; p�cj�)
by Bayes rule. According to the logistic choice model
Pr(cjpc; p�c; �) = edTc �+�pc+�xcPK
k=1 edTk�+�pk+�xk
According to the iid normal distribution of �k, we know that each pk � N(zT k; �2) independently.
Hence
Pr(pc; p�cj�) =KYk=1
1p2��2
e�1
2�2(pk�z
T k)2
Hence, we have log likelihood of the complete data (of a single �rm) as
lnPr(c; pc; p�cj�) = � 1
2�2
KXk=1
(pk � zT k)2 � K
2ln 2��2 +
63
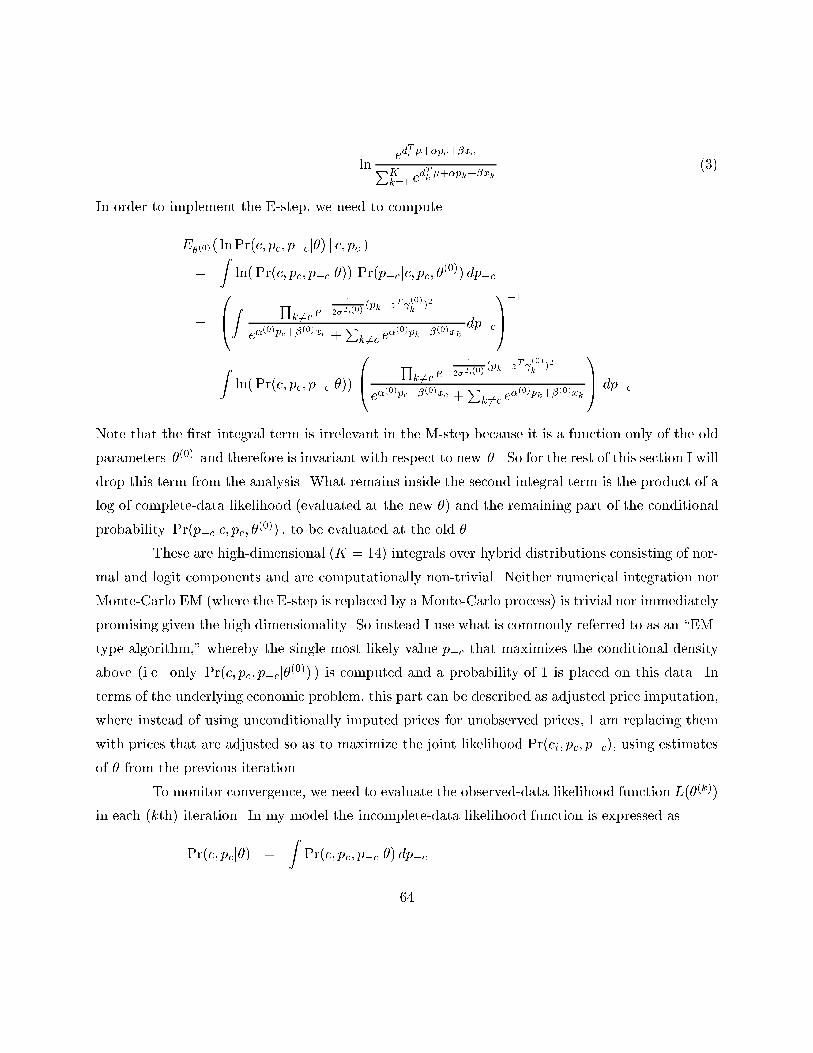
lned
Tc �+�pc+�xcPK
k=1 edTk�+�pk+�xk
(3)
In order to implement the E-step, we need to compute
E�(0)( lnPr(c; pc; p�cj�) j c; pc )=
Zln( Pr(c; pc; p�cj�)) Pr(p�cjc; pc; �(0)) dp�c
=
0B@Z
Qk 6=c e
� 1
2�2;(0)(pk�z
T (0)k
)2
e�(0)pc+�(0)xc +
Pk 6=c e
�(0)pk+�(0)xkdp�c
1CA�1
Zln( Pr(c; pc; p�cj�))
0B@
Qk 6=c e
� 1
2�2;(0)(pk�z
T (0)k
)2
e�(0)pc+�(0)xc +P
k 6=c e�(0)pk+�(0)xk
1CA dp�c
Note that the �rst integral term is irrelevant in the M-step because it is a function only of the old
parameters �(0) and therefore is invariant with respect to new � . So for the rest of this section I will
drop this term from the analysis. What remains inside the second integral term is the product of a
log of complete-data likelihood (evaluated at the new �) and the remaining part of the conditional
probability Pr(p�cjc; pc; �(0)) , to be evaluated at the old �.
These are high-dimensional (K = 14) integrals over hybrid distributions consisting of nor-
mal and logit components and are computationally non-trivial. Neither numerical integration nor
Monte-Carlo EM (where the E-step is replaced by a Monte-Carlo process) is trivial nor immediately
promising given the high dimensionality. So instead I use what is commonly referred to as an \EM-
type algorithm," whereby the single most likely value p�c that maximizes the conditional density
above (i.e. only Pr(c; pc; p�cj�(0)) ) is computed and a probability of 1 is placed on this data. In
terms of the underlying economic problem, this part can be described as adjusted price imputation,
where instead of using unconditionally imputed prices for unobserved prices, I am replacing them
with prices that are adjusted so as to maximize the joint likelihood Pr(ci; pc; p�c), using estimates
of � from the previous iteration.
To monitor convergence, we need to evaluate the observed-data likelihood function L(�(k))
in each (kth) iteration. In my model the incomplete-data likelihood function is expressed as
Pr(c; pcj�) =
ZPr(c; pc; p�cj�) dp�c
64

=
Z KYk=1
1p2��2
e�1
2�2(pk�z
T k)2
e�pc+�xcPKk=1 e
�pk+�xk
!dp�c
As discussed in the previous section, the integrals above are computationally challenging. Laplace's
method provides a useful way of approximating integrals that take the form
I(�) =
ZDe��g(x)f(x) dx
where � is a large parameter71. I apply this approximation method to evaluate the observed-data
likelihood function.
References
Akakura, H. (1984, September). Shouken gyou wo meguru saikin no ugoki to gyosei jo
no shomondai. Finance Journal (Kinyu Jaanaru), 49{52.
Allen, F. and D. Gale (2000). Comparing Financial Systems. The MIT Press.
Ang, J. S. and T. Richardson (1994). The underwriting experience of commercial bank a�liates
prior to the Glass-Steagall Act: A re-examination of evidence for passage of the Act. Journal
of Banking and Finance 18 (2), 351{95.
Aoki, M. (1989). Information, Incentives, and Bargaining in the Japanese Economy. Cambridge
University Press.
Aoki, M. (2001). Towards a Comparative Institutional Analysis. MIT Press.
Aoki, M. and H. Patrick (Eds.) (1994). The Japanese Main Bank System. Oxford University
Press.
Chemmanur, T. J. and P. Fulghieri (1994). Reputation, renegotiation, and the choice between
bank loans and publicly traded debt. Review of Financial Studies 7 (3), 475{506.
Datta, S., M. Iskandar-Datta, and A. Patel (1999). Bank monitoring and the pricing of corporate
public debt. Journal of Financial Economics 51, 435{449.
71See pp.545-7 in (Judd 1996).
65
Dempster, A. P., N. M. Laird, and D. B. Rubin (1977). Maximum likelihood from incomplete
data via the EM algorithm (with discussion). Journal of the Royal Statistical Society B 39,
1{38.
Diamond, D. W. (1984). Financial intermediation and delegated monitoring. Review of Economic
Studies 51, 393{414.
Diamond, D. W. (1991, August). Monitoring and reputation: The choice between bank loans
and directly placed debt. Journal of Political Economy 99 (4), 689{721.
Dinc, S. (1996). Bank Competition, Relationship Banking and Integration of Financial Systems.
Ph. D. thesis, Stanford University.
Fama, E. (1985). What's di�erent about banks? Journal of Monetary Economics 15, 29{39.
Finance and Fiscal A�airs (Kinyu Zaisei Jijyou) (1984a, July). Finance and Fiscal A�airs
(Kinyu Zaisei Jijyou).
Finance and Fiscal A�airs (Kinyu Zaisei Jijyou) (1995b, December). Finance and Fiscal A�airs
(Kinyu Zaisei Jijyou).
Finance and Fiscal A�ars (Kinyu Zaisei Jijyou) (1995, April). Seifu ga Kisei Kanwa
5-kanen Keikaku wo Kettei. Finance and Fiscal A�ars (Kinyu Zaisei Jijyou).
Gande, A., M. Puri, A. Saunders, and I. Walter (1997). Bank underwriting of debt securities:
Modern evidence. Review of Financial Studies 10 (4).
Hamao, Y. and T. Hoshi (1999). Bank underwriting of corporate bonds: Evidence from post-1994
Japan. Working paper, University of Southern California.
Helwege, J. and N. Liang (1996). Is there a pecking order? Evidence from a panel of IPO �rms.
Journal of Financial Economics 25, 429{458.
Hoshi, T. and A. Kashyap (1999). The Japanese banking crisis: Where did it come from and
how will it end? NBER Working Paper 7250, National Bureau of Economic Research.
Hoshi, T., A. Kashyap, and D. Scharfstein (1990). The role of banks in reducing the costs of
�nancial distress in Japan. Journal of Financial Economics 27, 67{88.
66
Hoshi, T., A. Kashyap, and D. Scharfstein (1993, August). The choice between public and private
debt: An analysis of post-deregulation corporate �nancing in Japan. Working Paper 4421,
National Bureau of Economic Research.
Hoshi, T., A. Kashyap, and D. Scharfstein (90a). Bank monitoring and investment: Evidence
from the changing structure of japanese corporate banking relationships. In R. G. Hubbard
(Ed.), Asymmetric Information, Corporate Finance, and Investment. Chicago and London:
University of Chicago Press. A National Bureau of Economic Research Project Report.
Houston, J. and C. James (1996). Bank information monopolies and the mix of private and public
debt claims. Journal of Finance 51, 1863{1889.
Inoue, K. (1980, October/November). Shin ginkou hou wa gyoumu han-i no bappon teki
kaisei wo. Finance and Fiscal A�ars (Kinyu Zaisei Jijyou), 14{18.
International Finance (Kokusai Kinyu) (1996, June). Euro-yen sai shijo no hattatsu
to waga kuni kousha-sai shijo no seibi kokusai ni tsuite. International Finance
(Kokusai Kinyu).
Investment Monthly (Toushi Geppo) (1985, January). Investment Monthly (Toushi Geppo).
James, C. (1987). Some evidence on the uniqueness of bank loans. Journal of Financial Eco-
nomics 19, 217{235.
Judd, K. L. (1996). Approximation, perturbation, and projection methods in economic analysis.
In H. M. Amman, D. A. Kendrick, and J. Rust (Eds.), Handbook of Computational Economics,
Volume I (Handbooks in Economics: 13). Amsterdam: Elsevier.
Kanatas, G. and J. Qi (1998). Underwriting by commercial banks: Incentive con icts, scope
economies, and project quality. Journal of Money, Credit, and Banking 30 (1), 119{133.
Kanzaki, K. (1996, August). Ginkou to Shouken. Jurist , 94{100.
Kroszner, R. S. and R. G. Rajan (1994). Is the Glass-Steagall Act justi�ed? A study of the U.S.
experience with universal banking before 1933. American Economic Review 84 (4), 810{832.
Leland, H. and D. Pyle (1977). Information asymmetries, �nancial structure and �nancial inter-
mediaries. Journal of Finance 32, 371{387.
67
Mabuchi, N. (1996, August). Kinyuu mochikabu gaisha to seido kaikaku. Jurist , 114{120.
MacKie-Mason, J. K. (1990). Do �rms care who provides their �nancing? In R. G. Hubbard
(Ed.), Asymmetric Information, Corporate Finance, and Investment. Chicago and London:
University of Chicago Press. A National Bureau of Economic Research Project Report.
Matsutani, A. (Ed.) (1995). Zusetsu Nihon no Shoken Shijo. Zaikei Shohousha (Publisher).
Mayer, C. (1988). New issues in corporate �nance. European Economic Review 32, 1167{88.
Mayer, C. (1990). Financial systems, corporate �nance, and economic development. In R. G.
Hubbard (Ed.), Asymmetric Information, Corporate Finance, and Investment. Chicago and
London: University of Chicago Press. A National Bureau of Economic Research Project
Report.
McLachlan, G. J. and T. Krishnan (1997). The EM Algorithm and Extensions. New York: John
Wiley and Sons, Inc.
Niki, Y. (1984, December). Waga kuni kabushiki shou kouzou no tokuchou. Investment , 4{
15.
Ongena, S. and D. C. Smith (1998). Bank relationships: A review. In P. Harker and S. A. Zenios
(Eds.), The Performance of Financial Institutions. Cambridge University Press.
Patrick, H. (1994). The relevance of Japanese �nance and its main bank system. In M. Aoki and
H. Patrick (Eds.), The Japanese Main Bank System. New York: Oxford University Press.
Petersen, M. A. and R. G. Rajan (1994, March). The bene�ts of lending relationships: Evidence
from small business data. Journal of Finance 49 (1), 3{37.
Petersen, M. A. and R. G. Rajan (1995, May). The e�ect of credit market competition on lending
relationships. Quarterly Journal of Economics 110 (2), 407{43.
Puri, M. (1994). The long-term default performance of bank underwritten security issues. Journal
of Banking and Finance 18 (2), 397{418.
Puri, M. (1996). Commercial banks in investment banking: Con ict of interest or certi�cation
role? Journal of Financial Economics 40, 373{401.
68
Puri, M. (1999). Commercial banks as underwriters: Implications for the going public process.
Journal of Financial Economics 54 (2).
Rajan, R. G. (1992). A theory of the costs and bene�ts of universal banking. mimeo., University
of Chicago.
Rajan, R. G. and L. Zingales (1995, December). What do we know about capital structure? some
evidence from international data. Journal of Finance 50 (5).
Ramseyer, M. (1994). Explicit reasons for implicit contracts: The legal logic to the Japanese
main bank system. In M. Aoki and H. Patrick (Eds.), The Japanese Main Bank System. New
York: Oxford University Press.
Roe, M. J. (1994). Strong Manager, Weak Owners. Princeton University Press.
Shikano, Y. (1996). Henbou suru Nihon no Kinyu Seido. Toyo Keizai Shinpo Sha (Publisher).
Teranishi, J. (1994). Loan syndication in war-time Japan and the origins of the main bank
system. In M. Aoki and H. Patrick (Eds.), The Japanese Main Bank System. New York:
Oxford University Press.
Tokai Bank Research Monthly (1993, October). Chousa Houkoku: Henbou suru Futsuu
Shasai Shijou. Tokai Bank Research Monthly.
Ueda, K. (1994). Institutional and regulatory frameworks for the main bank system. In M. Aoki
and H. Patrick (Eds.), The Japanese Main Bank System. New York: Oxford University Press.
Weekly Diamond (Shuukan Diamond) (1995, October). Weekly Diamond (Shuukan Dia-
mond).
Yasuda, A. (2001a). Banks, investment banks, and emergence of corporate bond market. mimeo.,
Stanford University.
Yasuda, A. (2001b). Relationship capital and competition in the corporate securities underwriting
market. Policy Paper 00-27, Stanford Institute of Economic Policy and Research.
69