Embed Size (px)
Citation preview

Instructional Support Services
Literacy: Year in Review2007-2008
Presented by:Jayne Gill
Director of Literacy
Purpose
Describe the what and why of Literacy Programs and Frameworks in Douglas County School District
Discuss the impact of these programs on whom
Review the cost of the Literacy Programs and
Frameworks
Literacy Programs and Frameworks Douglas County School District
LIFT: K-12 schools Reading Recovery: Primary Read to Succeed: Primary Reading Together: 2nd – 6th grade Secondary Literacy Specialist:
Middle School and High School

What and Why:LIFT
Literacy Instructional Framework for Teaching
•K-12
•35 schools, 440 trained personnel
•Systemic, school wide staff development model
•Framework for teaching balanced literacy in universal setting, Tier 1
•Taught by ALL teachers
What and Why: Reading Recovery®
• Has been in district schools 4 years• Serves the lowest achieving 1st grade
students on an Individual Literacy Plan (ILP).
• Supports students in short term, 1-1 or small group intervention
• Serves students 12-20 weeks• Is taught by highly trained teachers using
RR national guidelines
What and Why:Read to Succeed
• Serves 1st grade struggling readers on an Individual Literacy Plan (ILP).
• Supports students with short term 1-1 or small group intervention for 30 minutes a day
• Serves students 12-20 weeks• Is taught by trained tutors using evidence-
based, best practice similar to Reading Recovery
What and Why:Reading Together
• 15 week, scripted, peer tutoring program serving ILP students 2nd – 6th grade
• 16 elementary schools; 478 students
• A volunteer adult facilitates the program
• Tutor and tutee are two grade levels apart.
What and Why: Secondary Literacy Specialists
Serve the literacy needs of all students, utilizing the 60%/40% model, in 2 aspects:– 60% coaching/mentoring teachers
Provide embedded professional development Build effective literacy strategies in all content areas Allow ALL students to effectively access content area
curriculum Tier I/Universal setting RtI
– 40% direct service to most struggling ILP students Middle School – Pull-out program High School – Read/Write Strategies class Tier 2/Targeted setting RtI

Impact of these programs on whom: LIFT
Starting Year 5 as LIFT, on average: 04/05
9 Schools
•Reading: 4% more students P/A on CSAP, 84% to 88%
•Writing: 9% more students P/A on CSAP, 63% to 72%
DCSD
•Reading: 5% more students P/A on CSAP, 83% to 89%
•Writing: 8% more students P/A on CSAP, 70% to 76%
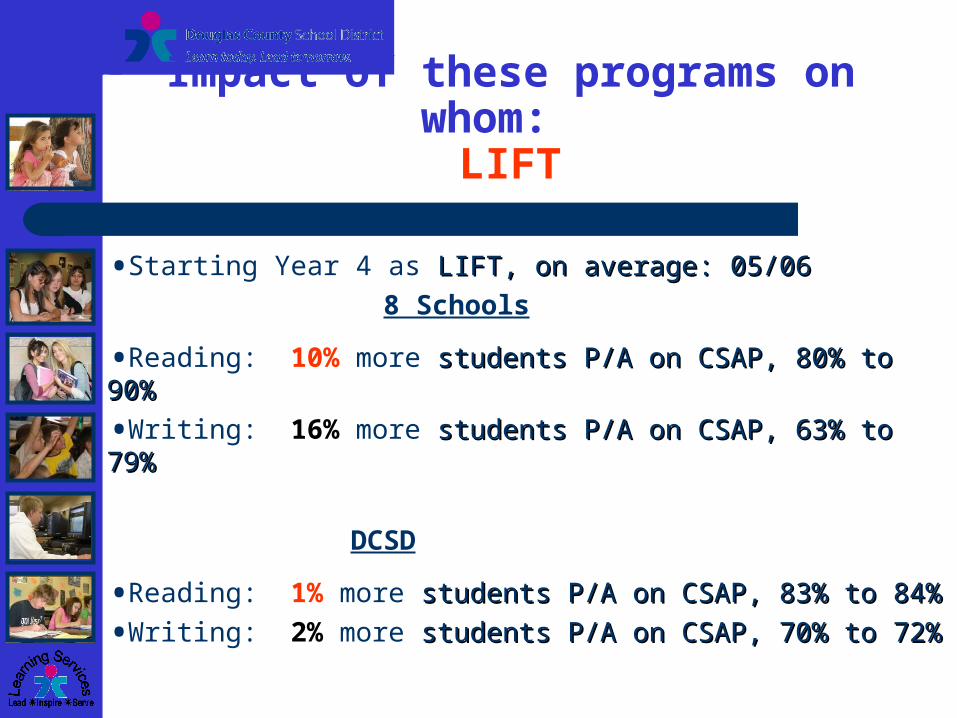
Impact of these programs on whom: LIFT
•Starting Year 4 as LIFT, on average: 05/06LIFT, on average: 05/06
8 Schools
•Reading: 10% more students P/A on CSAP, 80% to 90%students P/A on CSAP, 80% to 90%
•Writing: 16% more students P/A on CSAP, 63% to 79%students P/A on CSAP, 63% to 79%
DCSD
•Reading: 1% more studentsstudents P/A on CSAP, 83% to 84%P/A on CSAP, 83% to 84%
•Writing: 2% more studentsstudents P/A on CSAP, 70% to 72%P/A on CSAP, 70% to 72%

Impact of these programs on whom:
Reading Recovery
85% at/above grade level; 1st grade, ILP, RR served
based on DRA2 pre/post
Compared to• 28% at/above grade level; all DCSD, 1st grade ILP
Compared to• 75% at/above grade level; all DCSD 1st grade students
Success over time• From 74% to 85% at/above grade level over 4 years
For children served in 1-1 “Complete Intervention”

Impact of these programs on whom:Read to Succeed
1st grade
57% at/above grade level; 1st grade ILP served by RTS
Compared to28% at/above grade level; all 1st grade ILP
students
2nd grade
53% at/above grade level; 2nd grade ILP served by RTS
Compared to27% at/above grade level; all 2nd grade ILP
students
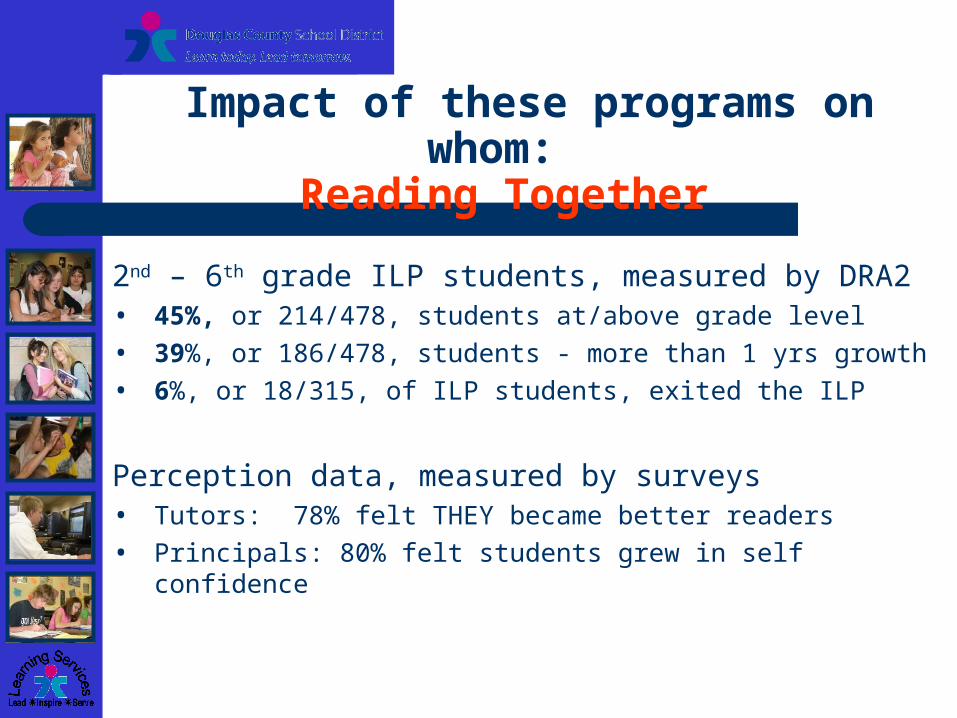
Impact of these programs on whom: Reading Together
2nd – 6th grade ILP students, measured by DRA2• 45%, or 214/478, students at/above grade level
• 39%, or 186/478, students - more than 1 yrs growth
• 6%, or 18/315, of ILP students, exited the ILP
Perception data, measured by surveys• Tutors: 78% felt THEY became better readers
• Principals: 80% felt students grew in self confidence

Impact of these programs on whom: Secondary Literacy Specialists
Proficient or Advanced (P/A) Reading CSAP• 28% “served” ILP students• 33% MS/HS all ILP students (direct and indirectly
served) Compared to
• 81% Average P/A all 7-10 students
DIG DEEPER “Year of more growth” on Reading CSAP
•85% “directly served” ILP students•74% “directly and indirectly served” ILP students
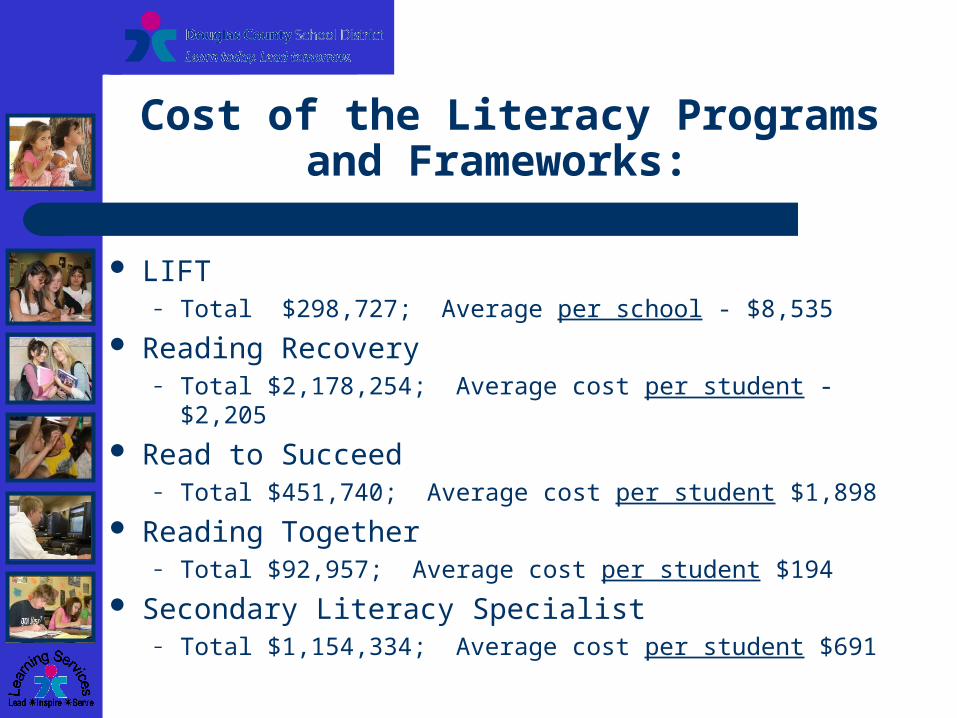
Cost of the Literacy Programs and Frameworks:
LIFT – Total $298,727; Average per school - $8,535
Reading Recovery– Total $2,178,254; Average cost per student - $2,205
Read to Succeed– Total $451,740; Average cost per student $1,898
Reading Together– Total $92,957; Average cost per student $194
Secondary Literacy Specialist – Total $1,154,334; Average cost per student $691

What else may occur for students?
1. Average cost SPED for 1 year in DCSD, $9,275
For average of 5 years = $46,375
2. Average cost of Title I = $2,400
For average of 5 years = $12,000
3. Average cost of retention = $9,200
For average of 1 year = $9,200
4. Average cost of “other” small group pull-out = $2,400
For average of 3 years = $7,200
5. Average cost to imprison for 1 year in US = $23,876

It’s in every one of us to help students reach their
highest potential!