Embed Size (px)
Citation preview
Available online at www.worldscientificnews.com
( Received 02 August 2020; Accepted 21 August 2020; Date of Publication 22 August 2020 )
WSN 148 (2020) 72-89 EISSN 2392-2192
Instrumentation System for Coastal Wave Parameter Monitoring Based on Telemetry Technology Using
Accelerometer
Saeful Anwari, Subiyanto*, Mega Laksmini Syamsudin, Ibnu Faizal
Department of Marine Science, Faculty of Fishery and Marine Science, Universitas Padjadjaran, Sumedang 45363, Indonesia
*E-mail address: [email protected]
ABSTRACT
Sea waves are important in the service of marine meteorological data. Waves that occur at sea
have random and complex movements, so that the height and period of the waves are difficult to measure
and formulate. This study aims to design and create marine instrumentation that can measure and record
the parameters of wave height and period of coastal waves in situ so that the data obtained can reflect
the conditions on the field well. PVC (Polyvinyl Chloride) is used for the instrument floats. The
buoyancy value of the vehicle shows a floating value of 124.97N, or the maximum amount of load that
can be accommodated by the vehicle is ±12 kg. This research was conducted from November 2019 until
July 2020. The pre-research conducted at the Laboratory of Marine Science and Technology, and
Computer Laboratory FPIK Universitas Padjadjaran. Testing laboratory scale carried out in a static pool,
Grand Pangandaran, Pangandaran Regency and field testing was conducted in the Area of Pangandaran
Port, Bojong Salawe, Pangandaran Regency, West Java for 5 days with each observation time for 6
hours / day. The results obtained are x, y, and z axis data values with a total of ±3600 data. Data analysis
is based on the Zero Crossing Analysis statistical using python. The results of data processing showed
a wave height value of 10% (H10) with a value of 3.0 meters, and a wave period of 10% (T10) worth 6.87
seconds. Significant wave height (HS) with a value of 2.8 meters, and significant wave period of 6.8
seconds, with an average wave height of 2.7 meters, and an average wave period of 6.8 seconds. This is
consistent with the wave data from BMKG which show values ranging from 2.5 to 4 meters, on June
27-30 2020 and July 1, 2020.
Keywords: Accelerometer, Marine Instruments, Microcontrollers, Waves, Zero Crossing Analysis

World Scientific News 148 (2020) 72-89
-73-
1. INTRODUCTION
Sea waves are a significant factor in marine meteorological data service (Wang et al.,
2019). Wave and wind energy can do damage to the beach (Jury, 2019). Wind energy can
produce waves that are then deformed and become currents along the coast that transport
sediments from one location to another (Christensen et al., 2019). Waves occurring at sea have
random and dynamic motions, making it difficult to calculate and formulate the height and
period of the waves (Kumar et al., 2018).
Wave recording in Indonesia has not been done much, so that the availability of marine
wave data in Indonesia is still very limited and generally difficult to obtain (Sugianto et al.,
2017). Therefore observations are usually made using wave forecasting techniques (Oliveira et
al., 2019; Sugianto et al., 2017). Wave forecasting technique is performed using data of daily
average or maximum wind speed. The data collected therefore cannot imagine the actual
conditions (Sugianto et al. 2017).
There are several theories that support the theories of Airy, Stokes, Gertsner, Mich, and
Knoidal, to explain waves of varying degrees of complexity and precision. Each theory has its
limits of validity. The Airy wave theory is a small wave, whereas the other theory is a wave
theory with a limited amplitude (Krylov, 2017).
Figure 1. Airy Wave Propagation Model
The wave theory of Airy uses the Cartesian coordinate point. That is, the wave is in the
x-y coordinate system and extends to the x-axis (Sun et al., 2020).
Accelerometer is an instrument used to measure acceleration in three axes data (x, y, z)
(Patel et al., 2020). The measured acceleration does not necessarily have the rate of velocity
change. Rather, the accelerometer gets the acceleration meant by severe phenomena
experienced by the mass test within the reference frame of the accelerometer device. A very
sensitive accelerometer is used as a component of the navigation inertia system (Esteves
Moreira et al., 2020).
This research was conducted to design and create marine instrumentation that can
measure and record the parameters of wave height and period of coastal waves in situ so that
the data obtained can reflect the conditions on the field well.
World Scientific News 148 (2020) 72-89
-74-
Figure 2. Three Axes Data
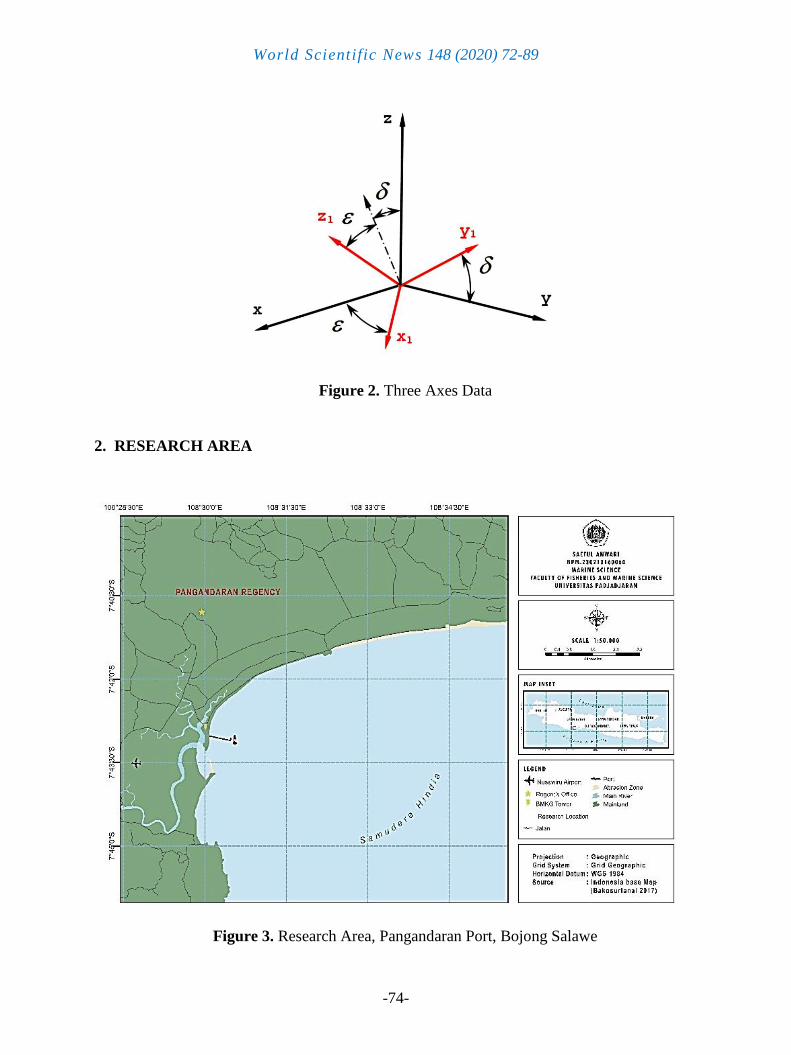
2. RESEARCH AREA
Figure 3. Research Area, Pangandaran Port, Bojong Salawe
World Scientific News 148 (2020) 72-89
-75-
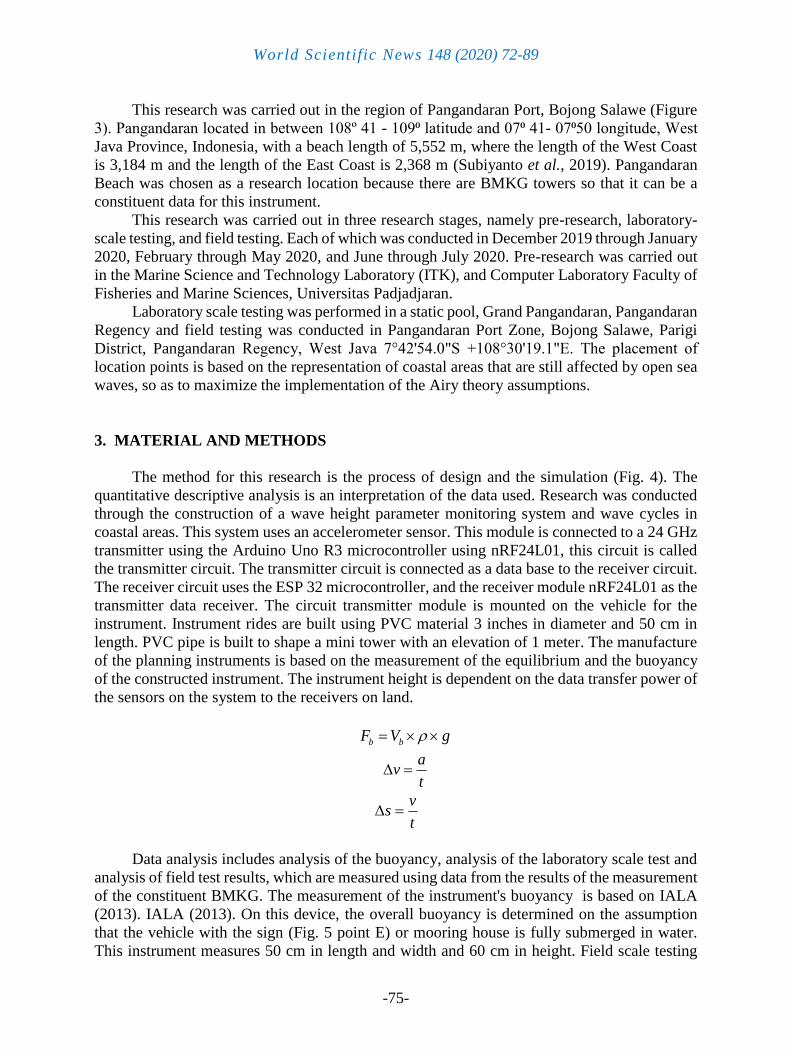
This research was carried out in the region of Pangandaran Port, Bojong Salawe (Figure
3). Pangandaran located in between 108º 41 - 109⁰ latitude and 07⁰ 41- 07⁰50 longitude, West
Java Province, Indonesia, with a beach length of 5,552 m, where the length of the West Coast
is 3,184 m and the length of the East Coast is 2,368 m (Subiyanto et al., 2019). Pangandaran
Beach was chosen as a research location because there are BMKG towers so that it can be a
constituent data for this instrument.
This research was carried out in three research stages, namely pre-research, laboratory-
scale testing, and field testing. Each of which was conducted in December 2019 through January
2020, February through May 2020, and June through July 2020. Pre-research was carried out
in the Marine Science and Technology Laboratory (ITK), and Computer Laboratory Faculty of
Fisheries and Marine Sciences, Universitas Padjadjaran.
Laboratory scale testing was performed in a static pool, Grand Pangandaran, Pangandaran
Regency and field testing was conducted in Pangandaran Port Zone, Bojong Salawe, Parigi
District, Pangandaran Regency, West Java 7°42'54.0"S +108°30'19.1"E. The placement of
location points is based on the representation of coastal areas that are still affected by open sea
waves, so as to maximize the implementation of the Airy theory assumptions.
3. MATERIAL AND METHODS
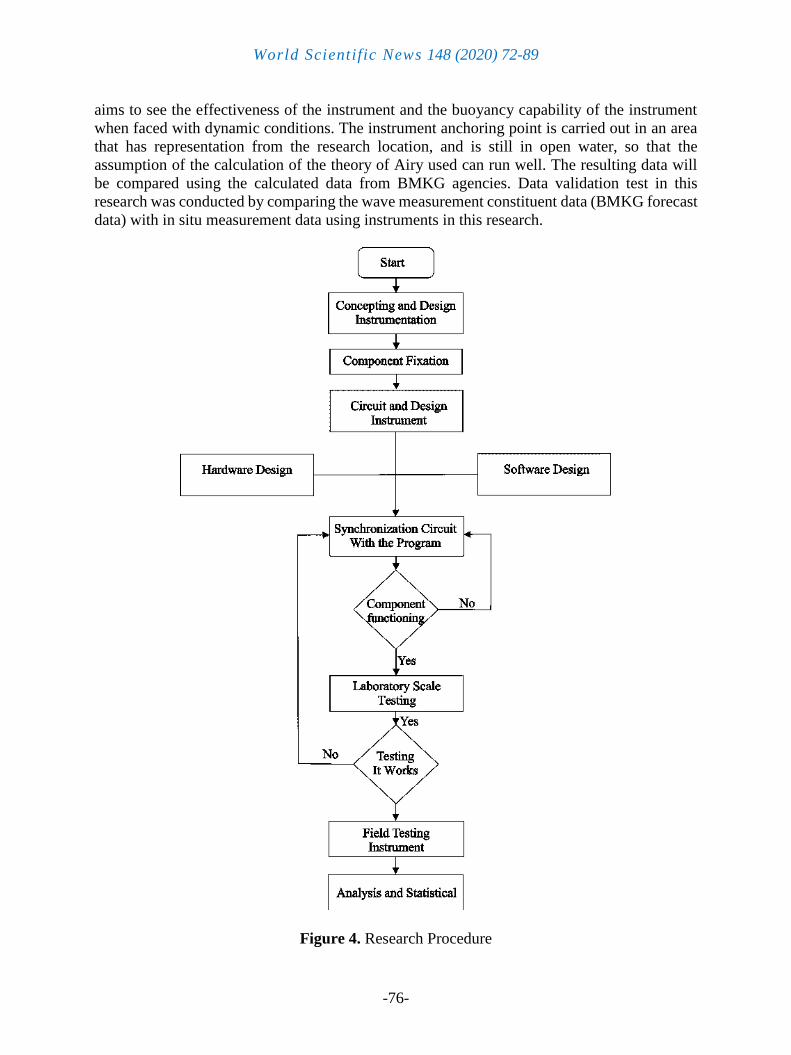
The method for this research is the process of design and the simulation (Fig. 4). The
quantitative descriptive analysis is an interpretation of the data used. Research was conducted
through the construction of a wave height parameter monitoring system and wave cycles in
coastal areas. This system uses an accelerometer sensor. This module is connected to a 24 GHz
transmitter using the Arduino Uno R3 microcontroller using nRF24L01, this circuit is called
the transmitter circuit. The transmitter circuit is connected as a data base to the receiver circuit.
The receiver circuit uses the ESP 32 microcontroller, and the receiver module nRF24L01 as the
transmitter data receiver. The circuit transmitter module is mounted on the vehicle for the
instrument. Instrument rides are built using PVC material 3 inches in diameter and 50 cm in
length. PVC pipe is built to shape a mini tower with an elevation of 1 meter. The manufacture
of the planning instruments is based on the measurement of the equilibrium and the buoyancy
of the constructed instrument. The instrument height is dependent on the data transfer power of
the sensors on the system to the receivers on land.
b bF V g
av
t
vs
t
Data analysis includes analysis of the buoyancy, analysis of the laboratory scale test and
analysis of field test results, which are measured using data from the results of the measurement
of the constituent BMKG. The measurement of the instrument's buoyancy is based on IALA
(2013). IALA (2013). On this device, the overall buoyancy is determined on the assumption
that the vehicle with the sign (Fig. 5 point E) or mooring house is fully submerged in water.
This instrument measures 50 cm in length and width and 60 cm in height. Field scale testing
World Scientific News 148 (2020) 72-89
-76-
aims to see the effectiveness of the instrument and the buoyancy capability of the instrument
when faced with dynamic conditions. The instrument anchoring point is carried out in an area
that has representation from the research location, and is still in open water, so that the
assumption of the calculation of the theory of Airy used can run well. The resulting data will
be compared using the calculated data from BMKG agencies. Data validation test in this
research was conducted by comparing the wave measurement constituent data (BMKG forecast
data) with in situ measurement data using instruments in this research.
Figure 4. Research Procedure
World Scientific News 148 (2020) 72-89
-77-
There are two methods of measuring and evaluating waves, namely the method of zero
up crossing, and the method of zero down crossing, or what is generally referred to as zero
crossing. Zero Crossing Analysis is a tool for measuring the wave quantities dependent on time
dominance (Mazeika & Draudviliene, 2010). Recording data from this instrument is the objects'
acceleration data in the vertical direction, which then translates the acceleration data to a
distance value (displacement) so it can display the wave height value in meters. Acceleration is
a time-shift transition (Yurovsky & Dulov, 2017). Whereas speed is a displacement of the
position of each unit of time objects (Qin et al., 2020).
4. RESULT
4. 1. Design of the instrument vehicle
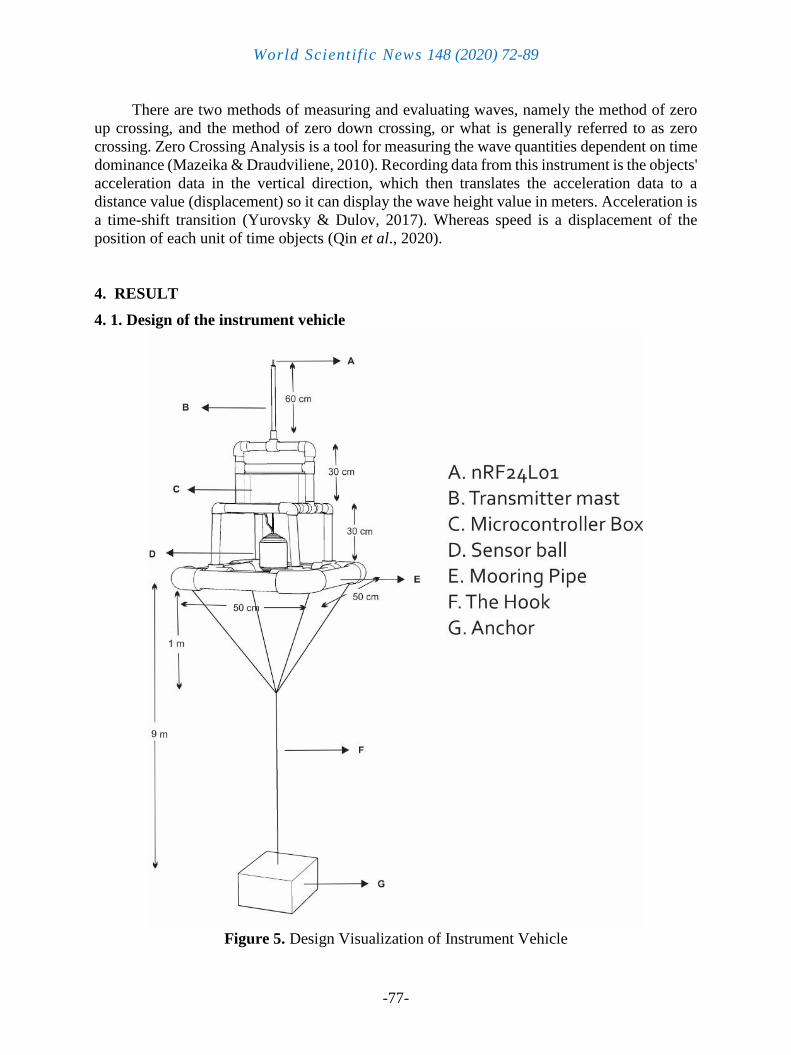
Figure 5. Design Visualization of Instrument Vehicle
World Scientific News 148 (2020) 72-89
-78-
The instrument was planned to have three main sections, the mooring wire, the
microcontroller box and the sensor, respectively. This type of instrument is a moored-buoy
instrument. In theory, mooring buoy is an instrument, unit that floats on the water surface with
a binder or loads under it like an anchor (Jordán & Beltrán-Aguedo, 2004). The instrument is
designed not to be too heavy with the aim to facilitate daily use or mobilization when in the
field, but also the design of the instrument must be able to protect and carry component loads
and have a good stability value (Fig. 5). The material used in this design is Polyvinyl Chloride
(PVC). The use of PVC pipes is based on the availability of materials, and the ease of forming
and having a light weight. In the middle of the vehicle there is a sensor ball which is used as a
place for laying the sensor used is the sensor-accelerometer. At the top of the vehicle there is a
box that is used as the laying of electronic components, such as the Arduino Uno R3
microcontroller, and some cabling for radio signals. This instrument has a length and width of
50 cm and an instrument height of 60 cm, with a mast radio transmission device that can be
extended or shortened depending on the field conditions. Weights are used as anchors with a
load of 3 kg to help the instrument to stay stable and are attached using a rope which is bound
to an instrument up to 50 cm long, then the rope is connected to the ballast with a length
depending on the depth of the bathymetry of the waters, the depth of the waters can be
determined by means of direct field measurements or by using available secondary data. This
instrument was planned in its realization to be constructed in order to be packed in such a way
that it was easy to mobilize. Resins, catalysts and fibers are used to cover leaks from these
devices, so that the instrument's tightness is retained but in compliance with the intended
purpose, which is easy to mobilize.
4. 2. Electronic device systems
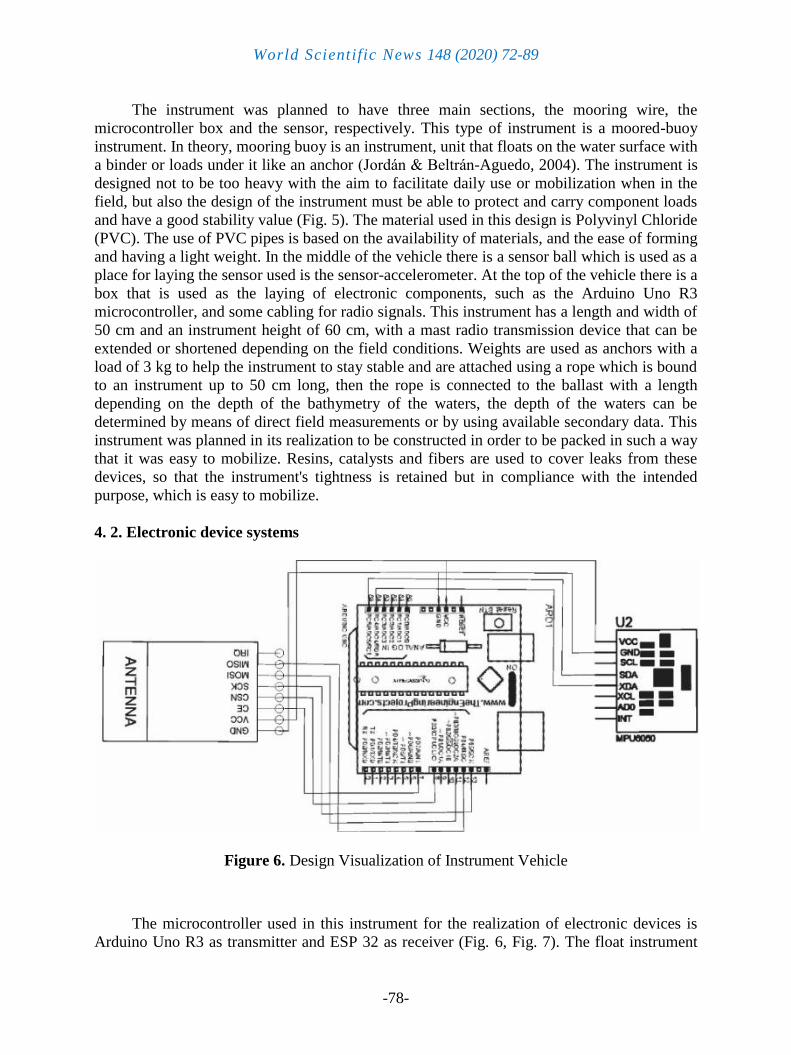
Figure 6. Design Visualization of Instrument Vehicle
The microcontroller used in this instrument for the realization of electronic devices is
Arduino Uno R3 as transmitter and ESP 32 as receiver (Fig. 6, Fig. 7). The float instrument

World Scientific News 148 (2020) 72-89
-79-
functions to detect and record the movement of water particles as vertical acceleration values,
store measurement data and send them to receivers. The use of the nRF24L01 type of radio
antenna is based on the fact that nRF24L01 is a single chip radio transceiver that is used
worldwide. NRF24L01 has good communication speeds (up to 2 Mbps) with a fairly large range
of 1.1 km or around 1100 meters (Sidqi et al. 2018).
The voltage needed for operation by the accelerometer sensor varies from 2.2 V to 3.6 V,
with a typical 3.3V voltage. The data-shaped sensor output is connected to the microcontroller
via I2C (Inter Integrated Circuit) communication on the analog pin. The I2C system is
composed of channels SCL (Serial Clock) and SDA (Serial Data).
This series will bring information between its controller and the I2C. I2C-connected
devices can act as transmitters and receivers. A nodeMCU ESP 32 microcontroller and the
nRF24L01 module are used as data receiver by the firmware on the receiver board (Fig. 7).
Figure 7. Receiver Schematic
A nodeMCU ESP32 has input and output pins that can be used together, so that it is
possible to interpret the incoming data from the transmitter well. The module nRF24L01
receives transmitter data according to the programmed address.
The created data is still irregular, so it needs to be selected and sorted for proper viewing
and visualization of the data. The process of sorting is done on commands implemented in the
system, so incoming data will be sorted before the data is visualized.
World Scientific News 148 (2020) 72-89
-80-
4. 3. Buoyancy
The instrument float's buoyancy is derived from a buoy made of PVC (Polyvinyl
Chloride) material.
b bF V g
bF is the instrument vehicle's buoyancy in Newton units, bV is the floating vehicle's volume
submerged by water, is water density, and g is the acceleration of gravity. The volume of
the total vehicle object is 30.012405bV m . Using an average sea water density of 1027 kg/m3
and gravity of 9.81 m/s, the buoyancy of objects is obtained through:
.w m g
0.012405 1027 9.81 124.97bF N
and if converted to a mass value, the body weight is considered to be 124.97N, the gravity
acceleration is an average of 9.81 m/s, then:
wm
g
124.97
9.81m
12.73m kg
or it can be said that the maximum load which the floating vehicle of this instrument can handle
is ±12 kg. The instrument's overall weight is ±6 kg, so that when a balance load is set and the
load position is placed above the vehicle, there is still 8 kg space for adding components.
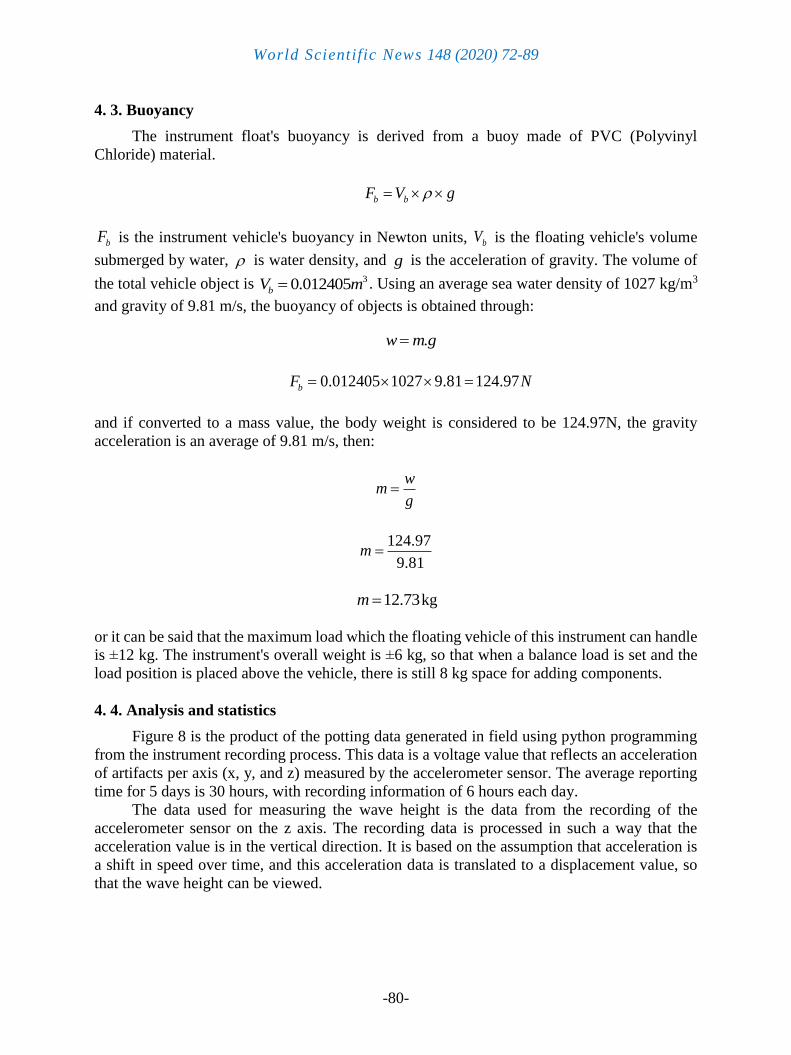
4. 4. Analysis and statistics
Figure 8 is the product of the potting data generated in field using python programming
from the instrument recording process. This data is a voltage value that reflects an acceleration
of artifacts per axis (x, y, and z) measured by the accelerometer sensor. The average reporting
time for 5 days is 30 hours, with recording information of 6 hours each day.
The data used for measuring the wave height is the data from the recording of the
accelerometer sensor on the z axis. The recording data is processed in such a way that the
acceleration value is in the vertical direction. It is based on the assumption that acceleration is
a shift in speed over time, and this acceleration data is translated to a displacement value, so
that the wave height can be viewed.
World Scientific News 148 (2020) 72-89
-81-
Figure 8. Accelerometer Data
World Scientific News 148 (2020) 72-89
-82-
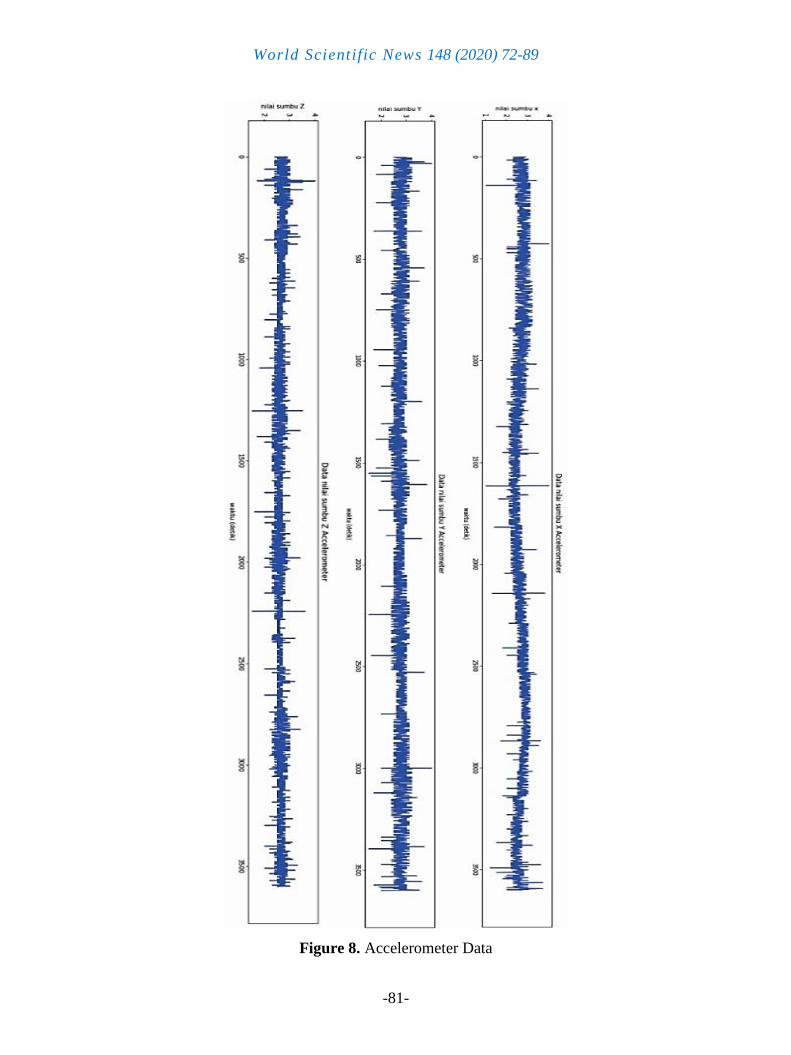
This instrument is based on sensors that shift to obey the wave of particles in order to get
the value of positive displacement and negative displacement. Positive displacement is the
sensor's vertical motion having a value above 0. Though negative displacement is the sensor's
movement vertically below the point 0. The accelerometer sensor z axis will sense a gravity
acceleration of 1 g, so that the acceleration value of the z axis is multiplied by the gravity value.
(a)
(b)
World Scientific News 148 (2020) 72-89
-83-
(c)
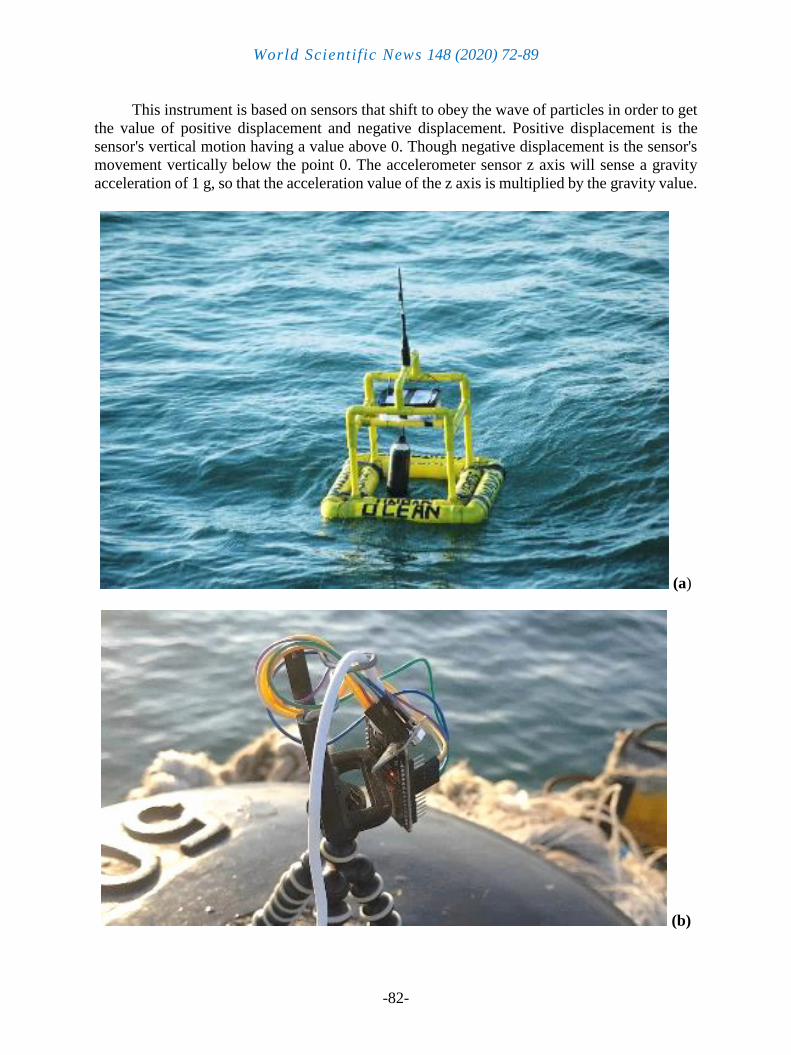
Figure 9(a,b,c). Field Measurement
4. 5. Zero crossing analysis
The use of zero crossing analysis is because waves in the sea (nature) are random and
non-linear movements. For simplify this wave theory, it is assumed that the waveform is an
ideal wave with a sinusoidal shape or a wave explained by Airy's theory. This statement states
that the wave η displacement is a basic harmonic motion induced by the wave direction, with
differences in rotation in the water level.
The first thing to do for wave height measurements is to calculate the average water
surface elevation value based on the water level variations at the recording time. The name of
this water is SWL (Still Water Level) (Copp & Sanfelice, 2016). The method of zero up crossing
is labelled with the point of intersection between the ascending curve and the zero. The point is
set to be the start of a single wave. It is done again after the ups and downs of the curve, and
the search proceeds to locate the intersection point between the ascending curve and the next
zero axis.
The point is set as the end of the first wave and the start of the next wave. The distance
between the two points is the period of the first wave (T1), while the height of the first wave is
called the vertical distance between the highest and lowest point of the two points (H1). The
method of zero down crossing has the same technique but the point noted is the meeting point
between the downward curve and the Still Water Level (SWL).
Figure 10 is a graph showing data of the effects of a two-day recording disrupted in such
a way that some noise occurs. The explanation for this is the wave produced during field testing

World Scientific News 148 (2020) 72-89
-84-
by the movement of fishing vessels around the instrument, even though the area is not a
shipping area, but sometimes the fishermen pass through the area. Noise occurring at a
frequency that is not too high is thought to be caused by electronic circuit mechanical
interference, and environmental factors. Filtering the data is necessary to eliminate or reduce
the noise value.
Figure 10. Contaminated Data
The instrument records data with details of 6 hours per day, for 30 hours of observation.
Figure 11(a) is the recording data for 1 day of observation which produces 720 data,
indicating that the data produced by the instrument is 2 recording data within 1 minute. 1 Hour
recording begins at 09 AM till 10 AM.
In Figure 11(a), the red square pin is enlarged to provide record data for 1 hour of
observation as shown in Figure 11(b). Figure 11(b) indicates that there are points showing
crossings upwards and downwards. Figure 11(b) shows the point of crossing up or Crest wave
at zero point in the red circle.
Whereas the black horizontal line indicates the wave (wave trace) crossing or slope down.
Calculation of the magnitude of 1 wave is determined when the abscissa wave or the first
starting point of the calculation to the peak wave crosses the zero point to the valley point and
crosses again the zero point.
The measuring data is then filtered and sorted according to the average height of the wave.
For wave period approach wave height series. The findings obtained from the significant wave
height variations range from 2,62 m to 2,83 m with a substantial hourly wave duration of
between 6,7 and 7,2 s and an average wave height of 4,0 m and a minimum wave height of 1,52
m.

World Scientific News 148 (2020) 72-89
-85-
Figure 11. Zero Crossing Analysis
(a) (b)
World Scientific News 148 (2020) 72-89
-86-
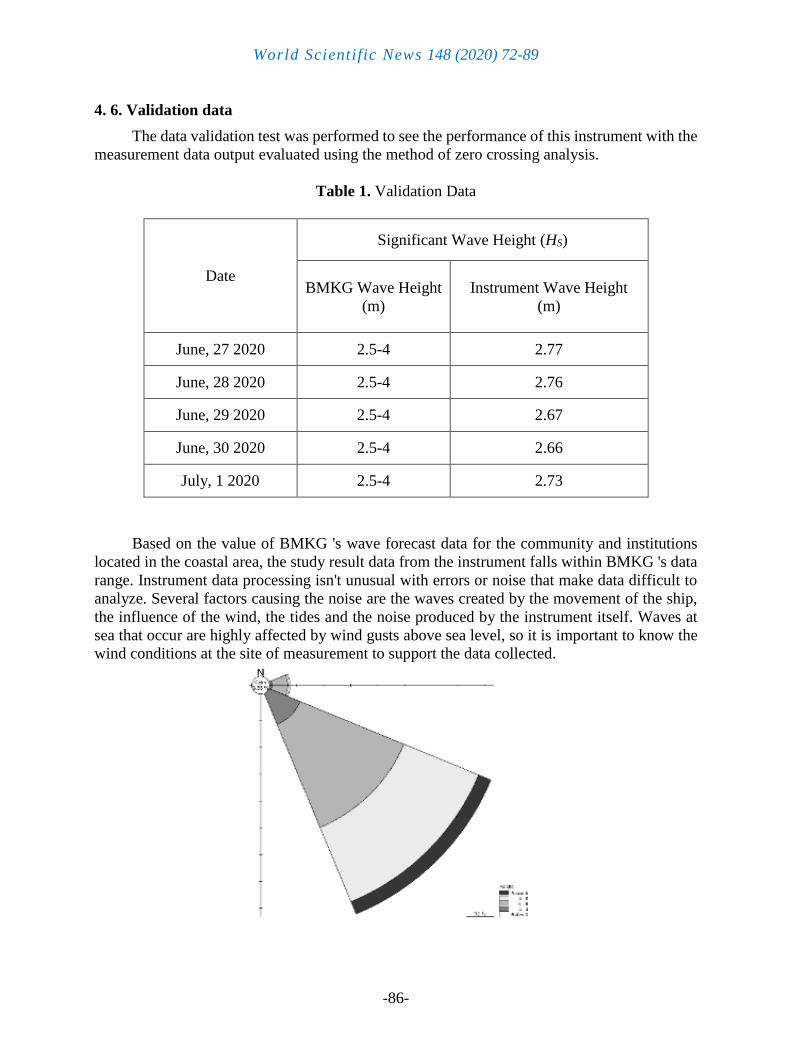
4. 6. Validation data
The data validation test was performed to see the performance of this instrument with the
measurement data output evaluated using the method of zero crossing analysis.
Table 1. Validation Data
Date
Significant Wave Height (HS)
BMKG Wave Height
(m)
Instrument Wave Height
(m)
June, 27 2020 2.5-4 2.77
June, 28 2020 2.5-4 2.76
June, 29 2020 2.5-4 2.67
June, 30 2020 2.5-4 2.66
July, 1 2020 2.5-4 2.73
Based on the value of BMKG 's wave forecast data for the community and institutions
located in the coastal area, the study result data from the instrument falls within BMKG 's data
range. Instrument data processing isn't unusual with errors or noise that make data difficult to
analyze. Several factors causing the noise are the waves created by the movement of the ship,
the influence of the wind, the tides and the noise produced by the instrument itself. Waves at
sea that occur are highly affected by wind gusts above sea level, so it is important to know the
wind conditions at the site of measurement to support the data collected.
World Scientific News 148 (2020) 72-89
-87-
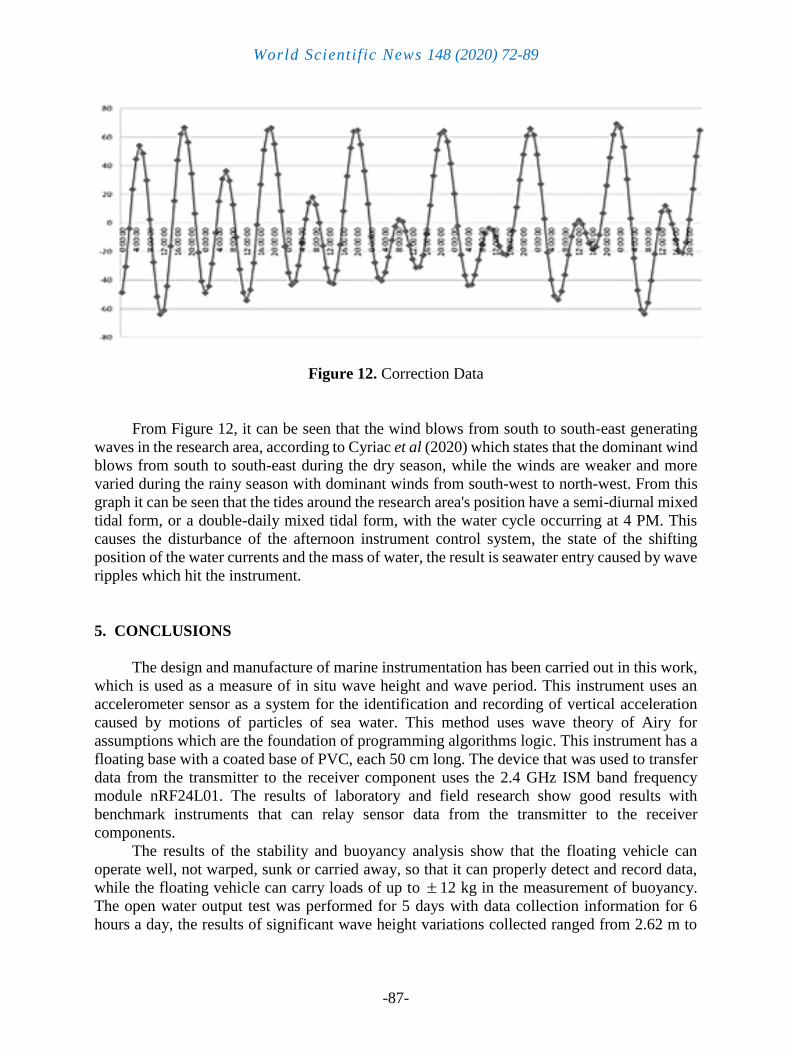
Figure 12. Correction Data
From Figure 12, it can be seen that the wind blows from south to south-east generating
waves in the research area, according to Cyriac et al (2020) which states that the dominant wind
blows from south to south-east during the dry season, while the winds are weaker and more
varied during the rainy season with dominant winds from south-west to north-west. From this
graph it can be seen that the tides around the research area's position have a semi-diurnal mixed
tidal form, or a double-daily mixed tidal form, with the water cycle occurring at 4 PM. This
causes the disturbance of the afternoon instrument control system, the state of the shifting
position of the water currents and the mass of water, the result is seawater entry caused by wave
ripples which hit the instrument.
5. CONCLUSIONS
The design and manufacture of marine instrumentation has been carried out in this work,
which is used as a measure of in situ wave height and wave period. This instrument uses an
accelerometer sensor as a system for the identification and recording of vertical acceleration
caused by motions of particles of sea water. This method uses wave theory of Airy for
assumptions which are the foundation of programming algorithms logic. This instrument has a
floating base with a coated base of PVC, each 50 cm long. The device that was used to transfer
data from the transmitter to the receiver component uses the 2.4 GHz ISM band frequency
module nRF24L01. The results of laboratory and field research show good results with
benchmark instruments that can relay sensor data from the transmitter to the receiver
components.
The results of the stability and buoyancy analysis show that the floating vehicle can
operate well, not warped, sunk or carried away, so that it can properly detect and record data,
while the floating vehicle can carry loads of up to 12 kg in the measurement of buoyancy.
The open water output test was performed for 5 days with data collection information for 6
hours a day, the results of significant wave height variations collected ranged from 2.62 m to
World Scientific News 148 (2020) 72-89
-88-
2.83 m with a significant wave duration a hour varying from 6.7 to 7.2 s and an average wave
height of 4.0 m and a minimum wave height of 1.52 m.
Analysis of the data validation was carried out by matching data from instrument
measurements with data from constituents. BMKG wave prediction data are used as the
constituent data. Measurement data encountered quite a lot of noise, this is caused by many
factors such as the waves that occur due to the direction of the ship, the effect of wind, tides,
and noise generated by the instrument itself, so supporting data is used to resolve the noise.
References
[1] Christensen, D. F., Brinkkemper, J., Ruessink, G., & Aagaard, T. (2019). Field
observations of intra-wave sediment suspension and transport in the intertidal and
shallow subtidal zones. Marine Geology, 413(October 2018), 10–26
[2] Copp, D. A., & Sanfelice, R. G. (2016). A zero-crossing detection algorithm for robust
simulation of hybrid systems jumping on surfaces. Simulation Modelling Practice and
Theory, 68, 1–17
[3] Cyriac, R., Dietrich, J. C., Blain, C. A., Dawson, C. N., Dresback, K. M., Fathi, A.,
Bilskie, M. V., Graber, H. C., Hagen, S. C., & Kolar, R. L. (2020). Wind and tide
effects on the Choctawhatchee Bay plume and implications for surface transport at
Destin Inlet. Regional Studies in Marine Science, 35, 101131
[4] Esteves Moreira, E., Kuhlmann, B., Serra Alves, F., Alves Dias, R., Cabral, J., Gaspar,
J., & Rocha, L. A. (2020). Highly sensitive MEMS frequency modulated accelerometer
with small footprint. Sensors and Actuators, A: Physical, 307 (March 2020).
[5] IALA. (2013). The Hydrostatic design of buoys. In IALAAISM Guidelines (Issue 1099:
1: 25)
[6] Jordán, M. A., & Beltrán-Aguedo, R. (2004). Nonlinear identification of mooring lines
in dynamic operation of floating structures. Ocean Engineering, 31(3–4), 455–482
[7] Jury, M. R. (2019). Hazardous waves from winter trade winds? Regional Studies in
Marine Science, 28, 100590
[8] Krylov, V. V. (2017). On the role of nonlinear distortion in the theory of wave-like
aquatic propulsion. Ocean Engineering, 145 (June), 15–23
[9] Kumar, N. K., Savitha, R., & Al Mamun, A. (2018). Ocean wave characteristics
prediction and its load estimation on marine structures: A transfer learning approach.
Marine Structures, 61 (January), 202–219
[10] Mazeika, L., & Draudviliene, L. (2010). Analysis of the zero-crossing technique in
relation to measurements of phase velocities of the Lamb waves L. Journal of
Ultragarsas, 9(4), 293–295
[11] Oliveira, B. A., Sobral, F., Fetter, A., & Mendez, F. J. (2019). A high-resolution wave
hindcast off Santa Catarina (Brazil) for identifying wave climate variability. Regional
Studies in Marine Science, 32, 100834
World Scientific News 148 (2020) 72-89
-89-
[12] Patel, A., Ingale, R., & Mandal, A. (2020). Measurement of wave velocities in
compacted clay using bender/extender and accelerometer: An experimental and
numerical approach. Measurement: Journal of the International Measurement
Confederation, 157, 107676
[13] Qin, H., Xu, Z., Li, P., & Yu, S. (2020). A physical model approach to nonlinear
vertical accelerations and mooring loads of an offshore aquaculture cage induced by
wave-structure interactions. Ocean Engineering, 197 (July 2019), 106904
[14] Sidqi, R., Rio Rynaldo, B., Hadi Suroso, S., & Firmansyah, R. (2018). Arduino Based
Weather Monitoring Telemetry System Using NRF24L01+. IOP Conference Series:
Materials Science and Engineering, 336 (1)
[15] Subiyanto, Ibrahim, T. M., Hiwari, H., Hidayat, Y., Ihsan, Y. N., & Sudrajat. (2019).
Coastline Change Analysis through Numerical Flow Modelling on Batu Hiu,
Pangadaran. International Journal of Advanced Science and Technology, 29(5), 211-
219.
[16] Sugianto, D. N., Zainuri, M., Darari, A., Suripin, S. D., & Yuwono, N. (2017). Wave
height forecasting using measurement wind speed distribution equation in Java Sea,
Indonesia. International Journal of Civil Engineering and Technology, 8(5), 604-619.
[17] Sun, F., Li, Y., Wang, G., Li, Y., Dong, X., & Gao, X. (2020). Linearly polarized Airy–
Lorentz–Gaussian beam modulated by a triangular phase function. Optik, 165302.
[18] Wang, H., Lo Iacono, C., Wienberg, C., Titschack, J., & Hebbeln, D. (2019). Cold-
water coral mounds in the southern Alboran Sea (western Mediterranean Sea): Internal
waves as an important driver for mound formation since the last deglaciation. Marine
Geology, 412 (September 2018), 1–18
[19] Yurovsky, Y. Y., & Dulov, V. A. (2017). Compact Low-cost arduino-based buoy for
sea surface wave measurements. Progress in Electromagnetics Research Symposium,
2315-2322