Embed Size (px)
Citation preview
170
INSTRUMENTATION
The evaporative light-scattering detectorThe evaporativelight-scattering
This article was written for INFORM by Steven L Hansell, Bungee Foods.detector (ELSD) is a universaldetector, since it responds 10 725 W. Kinzie Ave., Bradley. IL 60915. and William E. Am. of the Depart-
nearly all anatytes. much like the menl of Food Science. Um\'ers;IY of mina;,f. 1304 W. Pennsylvania Ave.,refractive index (RJ) detector used with Urba1UJ. IL 6180/-1726.high-perfonnance liquid chromarogra-phy (HPLC) or the flame-ionizationdetector (FlO) used with gas chro- elimination), elimination of salven! which light may be scattered uponmatography or supercriucal fluid chro- front peaks (1,2), improved baseline passing through a medium with a sus-matography. The effluent from the col- stability (due 10 reduced temperature pendcd particulate phase; (a) Raleighumn and a carrier gas (preferably high- fluctuations) and compatibility with scauering. (b) Mie scattering. (c)ly purified N2) enters a nebulizer, gradient elution separations (I). Possi- reflection and (d) refraction (3).which converts the effluent into a fine ble analytical applications include Raleigh scattering occurs when themist. TIle mist is carried down a tem- polymers, resins, carbohydrates. sug- particle size (r) is much smaller thanperature-controlled drift tube by the ars. steroids, artificial sweeteners. the wavelength (A) of the incidentcarrier gas. TIle volatile mobile phase is petroleum additives. surfectems. fats. light (rA < 0.05). The incident lightevaporated in a stream of warm gas oils, fatty acids and other lipid-derived quanta induces oscillating dipoles inproducing small particles of solute. analytes. It is especially attractive for each particle they strike. radiatingwhich is. preferably. substantially less analyzing compounds. such as sarumt- light in all directions from the particle.volatile than the solvent. The solute ed lipids, which do nOI have a chro- The next process, Mie scattering.passes through a laser beam. and the mophore that absorbs above 200 nm occurs when different points on thescattered light is detected by a photo (I). This is a significant advantage for same particle (r > AnD) are exposeddiode. The scattered light is proportion- the ELSD as compared to the ultravio- to incident light with a variety ofal to the amount of sample. The amount let/variable wavelength (UV/Vis) amplitudes and phases. where theof light scattered is dependcnt upon the detector. a selective detector which is induced oscillating dipoles producesize of the solute particles, which can the most commonly used HPLC light waves that interfere with eachbe controlled by the effluent now rate. detector. In many cases the prelimi- other. When the particle sizecarrier gas now rate. and drift tube tern- nary concentration andlor derivatiza- approaches the wavelength of the inci-perature. tion steps required for HPLC separa- dent light, the last IWO
The advantages of the ELSD tions with detectors other than an processes-reflection and refractioninclude increased sensitivity (beuer ELSD are eliminated. (which always occur together)-aresignal-to-noise ratio due to solvent There are four main processes by the most prevalent (3). Investigations
reponed by Charlesworth (3) indicatethat because of the large panicle sizes
4associated with the ELSD, the lightscattering probably is due to reflection
s and refraction for all but the smallest6 particles. In addition, most of the light... to reach the detector has undergone.. refraction (3).>
" Particle size is determined by the• characteristics of the nebulizer andI 2 physical properties of the carrier gas
• and mobile phase (4). The particle
E I J size can be altered by varying the car-8 V rier gas velocity. initial solute concen-
rranon and the temperature (3).
I~Increasing the sample concentrationincreases the size of the panicle rather
0.0 SO.Othan the number of particles (2,4).
Retentionvotume(nil) Increases in the average panicle size(2-5) with II much narrower size dis-
Figure 1. HPsec of moleculer weight (MW) stenderds. Peek 1 ""potypropylene glycol tribution (5) increases the detector(PPG)MW of 4000{24.72 mOfmL).Puk 2 .. PPG MW 013000 (21.59 mg!mL),Puk 3. PPG response (sensitivity). The response isMW Of2000 (21.38 mglmL),Peak 4 = triolein MW of 885.4 (21.48 mgfmL). Peek 5. dlolelnMW of 621.0 (20.58mg!mL),Puk 6:: monooteln MW of 356.5(22.30mglmL)end Puk 7 a directly dependent upon the concen-oleic ecld MW of 282.5 (21.86 mOfmL). tration of the scattering droplets (6).
INFORM. VOl. 6, no. 2 (February 1995)
L.
171
Maximum sensitivity with respect topanicle size for the ELSD is approxi-mately rlA(max) = 4. where r is thepanicle size and). is the wavelength(3). ELSD sensitivity is reduced witha decrease in concentration to verylow concentrations, where Mie lightscattering occurs. ELSD sensitivityalso was reduced at large concentra-tions due to reduced refraction andreflection because of reduced surface-to-volume ratios (3).
The detector response is linear forconcentrations between I It \0-4 to1.5 x JO-3 g/cm3 for polycondensa-tion products formed by the reactionbetween diepoxide and diuminemonomers (3). While some investiga-tors have indicated that the response islinear (5), others have stated that thedetector response is proportional to1.69 (2) or 1.81 (t) to the power of theanalyre mass flow rate, while othershave indicated that the detector
response can vary sigmoidally (4).Quantitalion from peak area or shapesmay be a problem due to the nonlinearresponse of the ELSD (2). Someinvestigators have indicated that sincethe response is not linear and dependsupon many variables, the ELSD is nottruly II "mass" detector (7). The detec-tor response determination stillappears to be an area of uncertainty.
Carrier gas flow rate is thought tohave a greater effect on detectorresponse than temperature (1,4). Anincrease in carrier gas flow ratereduces the signal and noise levelsbecause of a reduced panicle size (4).Increasing gas flow rates increases thenumber of particles (2). Slower carriergas now rates increase the detectorresponse, increase the solute particledimensions and increase the sensitivi-ty. but also increase the noise (6).Supersonic gas velocities producenoisy baselines below an evaporator
. .drift tube temperature of 100 C (4).probably due to incomplete vaporiza-tion (2). At increased carrier gas veloc-ities, increases in sample concenuauonare needed to achieve an optimum par-ticle diameter (4), The operating con-ditions for the ELSD must be opti-mized to maximize the signal-to-noiseratio. Very volatile compounds show adecrease in response with an increasein temperature. Less volatile com-pounds are relatively insensitive totemperature changes (I). Mourey andOppenheimer (4) indicated that tem-perature had a minimal affect onresponse and they used the lowest rea-sonable temperature above the base-line noise limit. However, others feelthe temperature also must be cpu-mized to minimize loss of any volatilecompounds (2). Excessive tempera-tures may result in boiling of themobile phase, which also increases thenoise level.
Analyze Lipids and Oils without OerivatizationWith the New Varex EvaporativeLight Scattering Detector (ELSD)
• Lipids• Phospholipids• Triglycerides• Fatly Acids• Carbohydrates• Surfactants• Polymers
The NEW Varex ELSD sees every solute thofs less volatile thanthe mobile phose for sensitive HPlC detection of lipids, oilsand carbohydrates without dertvatlzatlon. The detectorseparates the mobile phose from the solute. letting youanalyze complex samples uslng gradient elution. Use thevorex ELSD wlth any volatile mobile phose (even 1(X)% water).The new Varex ELSD detects as little as one nanogram ofsample on column. For in'ormatlon circle "IS
Ii!II!!!IJ Alltech Associates. Inc. Alltech Associates, Inc. (Europe)J • 2051 Waukegan Road. Deerfield, IL 60015 Provinciebaan 144·9270 Laarne Belgium
Phone: 1-800-255-8324· Fax: 708-948-1078 'ret.: 091366 03 00· Fax: 091366 01 71
020792525 @oa9/6113016 <D02·90110150 @076·717576 @0524-734451 @)021/729.70.03~
I . , co"on~~n~ 11Y3E
~i;':';'i..i.._~.2.11TW"!1NIech SoI\IenI ,..... cIa. 5pA; I!O'Io ~. 20'1. Elhanol8; ltm. EthanolA lo 8 OWl 60 rrrut.O.3&1~
INFORM. Vol. 6, no. 2 (Februory 1995)
172
INSTRUMENTATION
affected by the sample RI, intensityand wavelength of the light source.and position of the photo multiplier(6).
An evaporative analyzer was usedwith gel permeation chromatography(GPC) to determine the molecularweight (MW) range of epoxy resinsamples (8). The evaporative analyzerhad the same accuracy as an RI detec-tor, but had improved baseline stabili-ty. increased overall reproducibilityand was insensitive to solventchanges. However, disadvantagesincluded dependence upon numerousoperating conditions. especially thelamp age.
ELSDs have been used extensivelyfor detection of heated fatloil oxida-tion products in combination withhigh-performance size exclusion chro-matography (HPSEC) (9-15). ELSDsalso have been used in combinationwith HPLC to separate and detect var-ious lipid classes (16-30). Autoxi-dized marine oils have been analyzedby HPSEC in combination with anELSD (9.10). Optimization of thedetector with respect to aerosol adjust-ment and temperature was deemedcritical. Aerosol formation was depen-dent upon the mobile phase composi-
TelephoneFax
617/878-7200617/878-7465
INFORM. Vol. 6, no. 2 (February 1995)
P.1IlenIS App/IIfd FOf.Manufacturtcl oy Ornnion under license from the Archer Daniels MicI.lInd
Drift should be negligible sincethe only potential source is thedeposition of dust or aerosol on theinside of the glass window (I).Noise originates primarily from gasbubbles in the mobile phase or fromsolid particles in the carrier gas andmobile phase (solvent impurities)(1,2). The incorporation of an in-linefilter helps to alleviate this problem(I). Noise may arise also from non-volatile contaminants in the gaswhich could adhere to the window(2). Proper design of the nebulizerwill minimize the noise (I). Nonuni-form flow of eluant at the capillarytube can lead to spikes during peakelution (I). Contributions to bandbroadening are very small with themajor contributions coming from theamplifier and the capillary tube con-necting the column to the nebulizer(I).
The mobile phase physical charac-teristics (density, viscosity and surfacetension) and now rate, venturi tubedesign. carrier gas pressure. now rateand linear velocity affect the nebuliza-tion process (6). The elution charac-teristics, sample load and solute densi-ty affect the concentration in the col-umn effluent (6). Light scattering is
TheOxidativeStabilityInstrument
For Information ctrcle .119
tion and now rate, as well as the carri-er gas pressure. The most importantparameter was the temperature setting.
Hopia et 01. have studied fats andoils extensively with HPSEC and anELSD. Triacylglycerols (TAGs), dia-cylglycerols (DAGs), monoacyJglyc-erols (MAGs). free fatty acids(FFAs), sterols, sterol esters, toco-pherols and carorenoids in a standardlipid mixture were separated (11).The most important parameter inoptimizing the ELSD was the tem-perature. FFAs had only 10% of theresponse relative to an equal amountof triolein (11,12), which correspondsto the results from work done in ourlab (Figure 1). The sensitivity of theELSO was better than that of the RIdetector, although optimization of theELSD was necessary to attain themaximum sensitivity.
A differential RI detector, FlO. andELSD were compared with oil sam-ples separated by HPSEC (16). TheELSD temperature was reported as themost important control parameter. Forcompounds with an MW between165-300 g/mole, the relative standarddeviation (RSD) was greatest for theELSD. Macrae et 01. (16) also com-pared a light-scattering detector to an
173
RI detector for carbohydrate and lipidHPLC analysis. They found that thelight scattering detector was more sen-sitive and that gradient elution couldbe used without baseline drift.
Christie (17,18) used an HPLC sys-tern with an ELSD to separate majorlipid classes (varying in polarity). thaihad been isolated from animal tissues.No baseline drift occurred during gra-dient elution. Although the detector isdestructive. a stream splitter may beinstalled to collect fractions for otheranalyses.
Some investigators have reportedthat the mass detector is nonlinear forTAGs (19). The sensitivity of thedetector was affected by the evapora-tor temperature, pressure within thedetector, mobile phase flow rate andmobile phase composition. It also wasconcluded thai the detector was not"mass" responsive. In contrast to otherreports, gradient elution reproducibili-ty was poor.
Analysis of homogeneous andmixed TAGs with isocratic and gradi-ent elution were monitored with anELSD (20). Due to the complexity ofthe oil samples, two nonaqueousreverse-phase columns were needed.Gradient elution provided excellent
J
0.0 50.0Retention volume (mL)
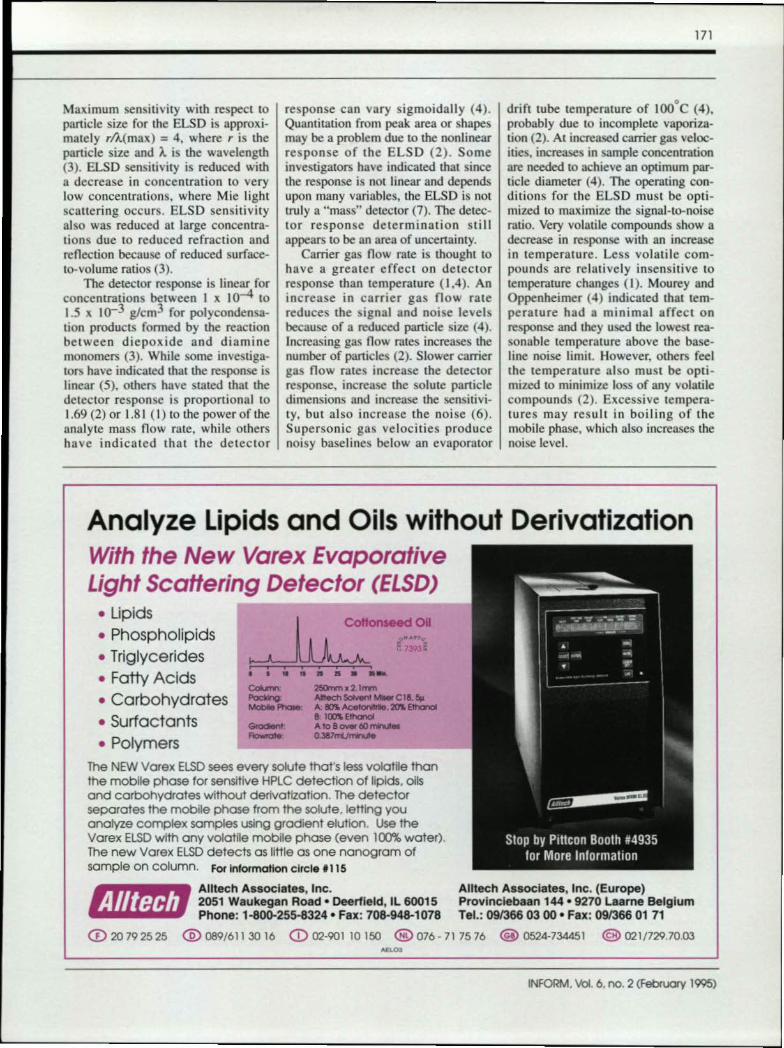
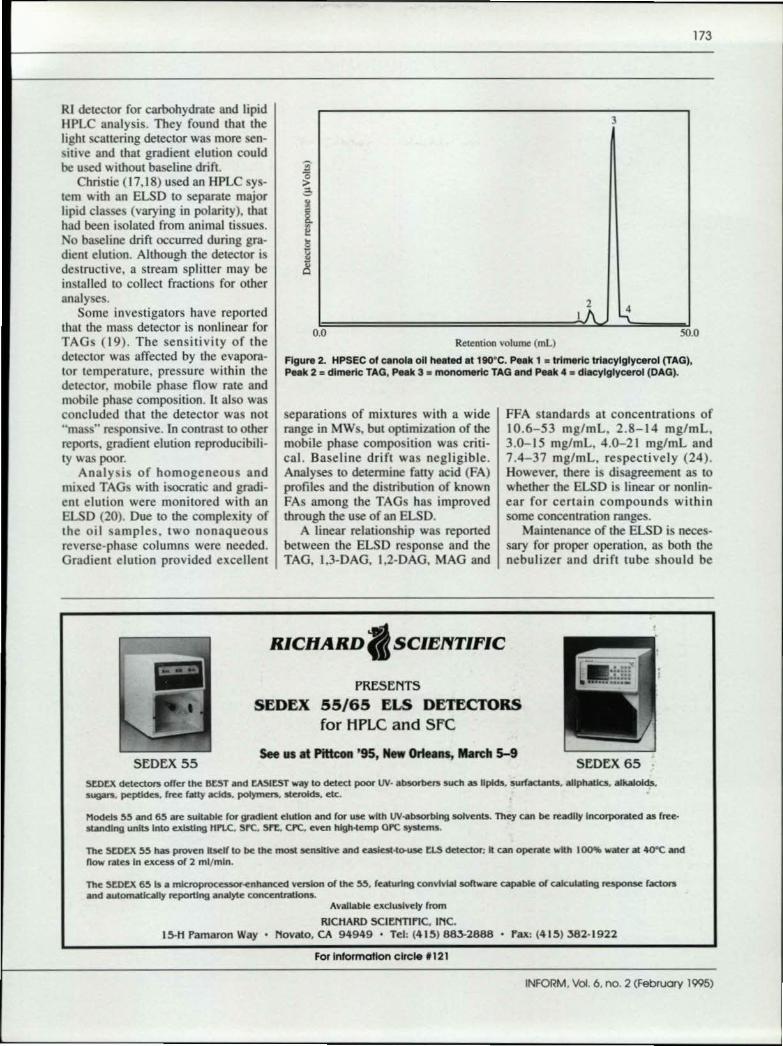
FIgure 2. HPSEC of canola 011Mated at 190"C. Peak 1 • trlmerlc triaeylglycerol (TAG),Peak 2 = dlmeric TAG, Peak 3. monomeric TAG and Peak 4. diacylglycerol (DAG).
separations of mixtures with a widerange in MWs, but optimization of themobile phase composition was criti-cal. Baseline drift was negligible.Analyses to determine fatty acid (FA)profiles and the distribution of knownFAs among the TAGs has improvedthrough the use of an ELSD.
A linear relationship was reportedbetween the ELSD response and theTAG, 1.3-DAG, 1,2-DAG. MAG and
FFA standards at concentrations of10.6-53 mg/mL, 2.8-14 mg/mL,3.0-15 mglmL, 4.0-21 mg/mL and7.4-37 mg/mL, respectively (24).However. there is disagreement as towhether the ELSD is linear or nonlin-ear for certain compounds withinsome concentration ranges.
Maintenance of the ELSD is neces-sary for proper operation, as both thenebulizer and drift tube should be
RICHARD ISCIENTIFIC
PRESENTSSIIDEX 55/65 ELS DETECTORS
for HPLC and SFC
See us at Pitlcon '95, New Orte.ns, "reh $-9SEDEX 55 SEDEX 65
sr:oc.xdetectOl'll offer the Hr:.sT and r:AS1r:.sT way to detect poor UV· ab50fbers such as lipids. surfactants. allphal.lcs. aUwoIds.sugars. pcptides. (ree fatty adds, poIymeB, steroids, et~
Models~!> and 6~ are suitable for Wildlent elution and for use with UV-ab5Ofblng solvents. They can be readUylncorporated as (ree·standing units Into exbtlng HPLC. sre, SI"r:. CPe, even hlgh.(emp OPe systems.
The Sr:Or:x 53 h.a5 proven Itself to be the most sensiUve and easIest-lo-use r:LS detector; It can opel'ilte with 100'!I0 water at 4O"C andflow rates In excess of 2 ml/mln.
The sror:x 65 Is a mlcroprocessor-enlumced ~rslon of the ~~. featuring conv1vlal software capable of caJculatlng response factorsand automaUcally reporting analyte coneentrallons.
Available exclusively from
RlCNARDSCU~NTIf1C,INC.I~N ramarcn Way' Novato, CA 94949 • Tel: (41~l88~2888 • f'ax: (41~) -'82·1922
For In'ormatlon cIrcle 1121
INFORM, Vol. 6, no. 2 (February 1995)
174
INSTRUMENTATION
4
s
0.0Retention volume (mL)
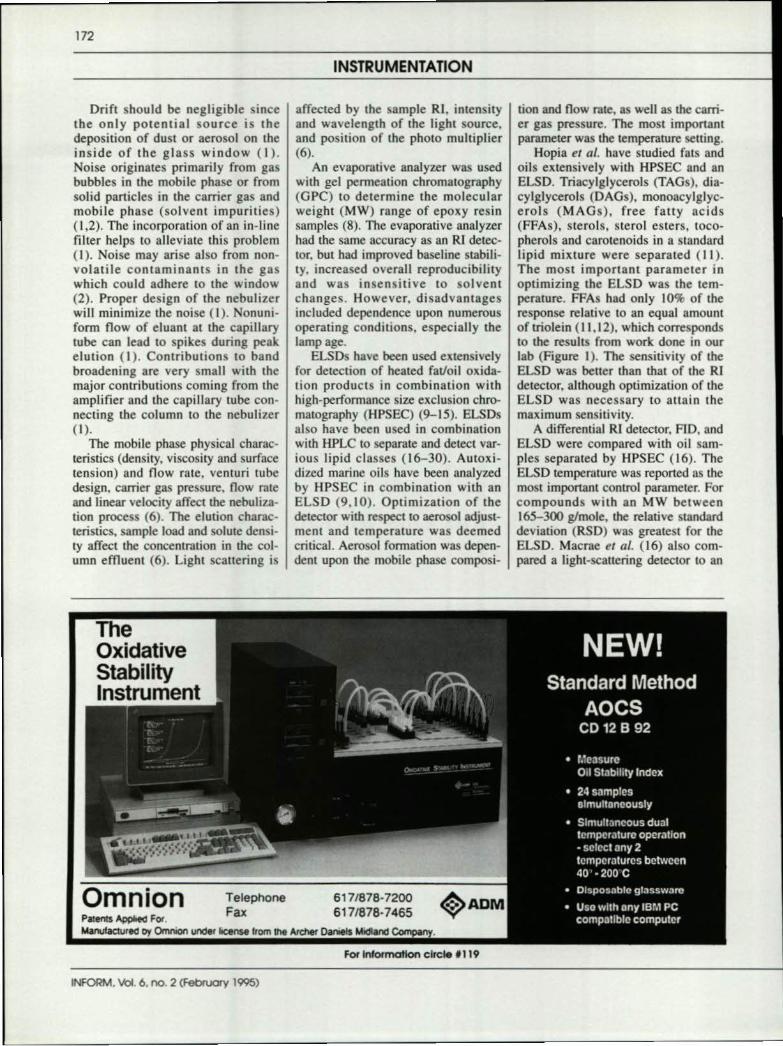
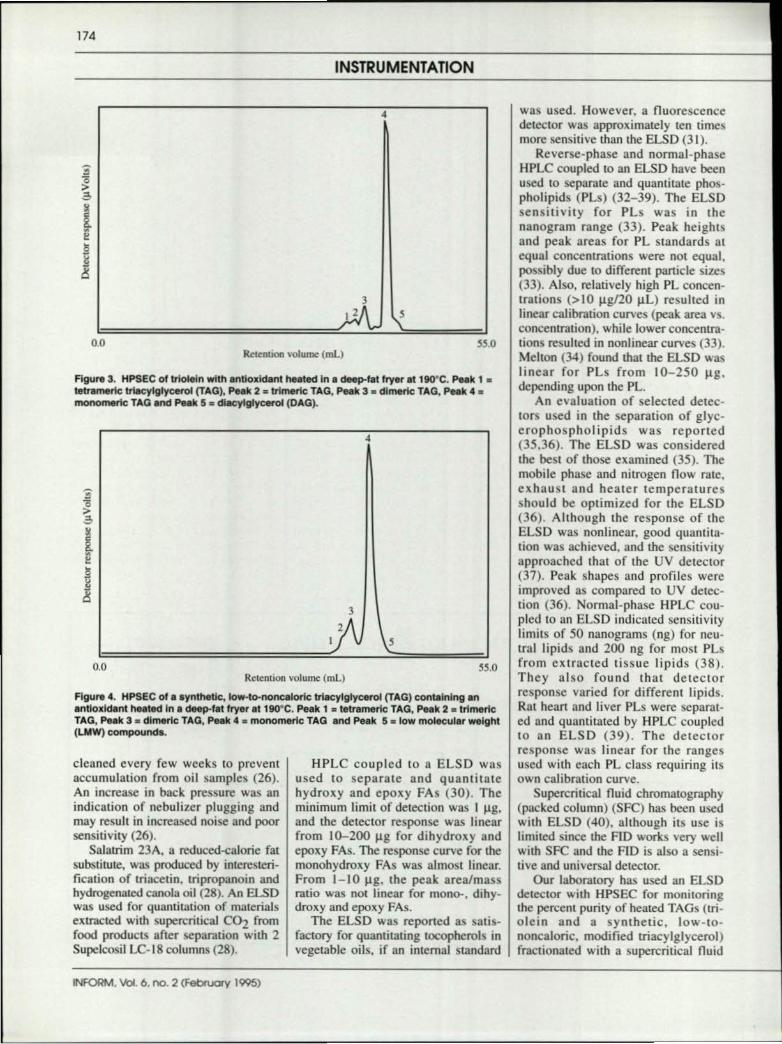
Figure 3. HPSEC of trioleln with antioxidant heated In a deep-fat fryer at 190·C. Peak 1 •tetrllmeric triacylgtycerol (TAG). Peak 2 = trimeric TAG, Peak 3 = dJmerlc TAG, Peak 4.monomeric TAG and Peak 5. diacylglycef'Ol (DAG).
4
10- \'0.0
Retention volume (ml)
Figure 4. HPSEC 01 a synthetic, Iow-Io-noncalorlc trlacylglyc8tol (TAG) containing anantioxidant healed In ill dHp"fat fryer at 19o"C. Peak 1 = tetramerlc TAG, Peak 2. !rlmerlcTAG, Peak 3. dlmerlc TAG, Peak 4. monomeric TAG and Peak 5. low molecular weight(LMW) COO'Ipounda.
cleaned every few weeks 10 preventaccumulation from oil samples (26).An increase in back pressure was anindication of nebulizer plugging andrna)' result in increased noise and poorsensitivity (26).
Salalrim 23A. a reduced-calorie fatsubstitute, was produced by inreresrert-fication of triacetin. lripropanoin andhydrogenated canola oil (28). An ElSDwas used for quamitation of materialsextracted with supercritical C02 fromfood products after separation with 2Supelcosil LC-18 columns (28).
HPLC coupled to a ELSD wasused to separate and quantitatehydroxy and epoxy FAs (30). Theminimum limit of detection was I ~g.and the detector response was linearfrom 10-200).1g for dihydroxy andepoxy FAs. The response curve for themonohydroxy FAs was almost linear.From 1-10 ug , the peak area/massratio was not linear for mono-, dihy-droxy and epoxy FAs.
The ELSD was reponed as satis-factory for quantitating tocopherols invegetable oils, if an internal standard
55.0
was used. However, a fluorescencedetector was approximately ten timesmore sensitive than the ELSD (31).
Reverse-phase and normal-phaseHPLC coupled to an ELSD have beenused to separate and quantitate phos-pholipids (PLs) (32-39). The ELSDsensitivity for PLs was in thenanogram range (33). Peak heightsand peak areas for PL standards atequal concentrations were not equal,possibly due to different panicle sizes(33). Also, relatively high PL concen-trations (> I0 ).1g120).1L) resulted inlinear calibration curves (peak area vs.concentration), while lower concentra-tions resulted in nonlinear curves (33).Mehon (34) found that the ELSD waslinear for PLs from 10-250 ug,depending upon the PL.
An evaluation of selected detec-tors used in the separation of glyc-erophospholipids was reponed(35.36). The ELSD was consideredthe best of those examined (35). Themobile phase and nitrogen now rate.exhaust and heater temperaturesshould be optimized for the ELSD(36). Although the response of theELSD was nonlinear, good quanuta-uon was achieved. and the sensitivityapproached that of the UV detector(37). Peak shapes and profiles wereimproved as compared to UV detec-tion (36). Normal-phase HPLC cou-pled to an ELSD indicated sensitivitylimits of 50 nanograms (ng) for neu-tral lipids and 200 ng for most PLsfrom extracted tissue lipids (38).They also found that detectorresponse varied for different lipids.Rat heart and liver PLs were separat-ed and quantitated by HPLC coupledto an ELSD (39). The detectorresponse was linear for the rangesused with each PL class requiring itsown calibration curve.
Supercritical fluid chromatography(packed column) (SFC) has been usedwith ELSD (40). although its use islimited since the FID works very wellwith SFC and the RD is also a sensi-tive and universal detector.
Our laboratory has used an ELSDdetector with HPSEC for monitoringthe percent purity of heated TAGs (tri-olein and a synthetic, low-to-noncalonc. modified triacylglycerol)fractionated with a supercriucal fluid
55.0
INFORM, Vol. 6, no. 2 (February 1995)
ReferencesI.Stolyhwo, A .• H. Colin and G.
Guiochon. J. Chromatog. 265: 1(1983).
2. Stolyhwo. A .. H. Colin, M. Martinand G. Guiochon, Ibid. 288:253(1984).
3. Charlesworth, J.M., Anal. Chtm.50:1414(1978).
4. Mourey. T.H .. and L.E. Oppen-
(C02) extraction system intomonomeric and dimeric TAG compo-nents (41). Figure I is a separation ofMW standards used for the HPSECcalibration of heated fats and oils. Thehigher MW components of a heatedcanota oil sample (Figure 2) (41) wasdetermined, as well as the cornposi-lion of triolein after heating (Figure 3)and the composition of a heated. syn-thetic, Iow-ro-nonceloric. modified tri-acylglycerol (Figure 4), Each was sep-arated under the same analytical con-ditions as the canol a oil (41), Thepolymeric TAG components found infood oils after frying can be easilyquantitated using a combination ofHPSEC and the ELSD.
Substantial deviations of thedetector response from linearity (as afunction of MW) can occur amongsome analytes, e.g .. there are sub-stantial differences in detectorresponse for the same amount ofmonoacylglycerot. TAG and dimericTAG, Even though there are limita-tions. if the operating conditions areoptimized and carefully controlled,the ELSD is a very sensitive andreliable universal detection system.As a result. the ELSD has had a sub-stantial impact on lipid analysis, par-ticularly for the analysis of tracecomponents. Until the ELSD. a sen-sitive and universal HPLC detectorwas unavailable, since the RI is typi-catty two or more orders of magni-tude less-sensitive than the ELSD.The impact of the ELSD on HPLClipid analysis has been similar to theimpact of the FID on gas chromatog-raphy. because the ELSD is the firstuniversal HPLC detector with theprerequisite sensitivity for analysisof trace lipid components, TheELSD is clearly the detector ofchoice for the HPLC analysis oflipids, LovIbondO nntometer PFX990
Full details from: HF scientific, inc.3170 Metro Parkway, Ft. Myers, FL 33916-7597
Phone: (813) 337-2116Fax: (813) 332-7643
The ThItomeIer Umited_RoodSalsbury SPl 2.J'(--Tel: (722) 3272.2
F.,.: (722) .12322Tela: 47372 TlNTCO G
--.p.•••••• II••_GmbHSchl .... JlitJasse sa~ Dortnu1d "I
"'""""Tel: (2311945 lClOFill<: (231) 845 1000T..,., 822&06 LO"IIB 0
175
Levibona
For information circle '113
176
INSTRUMENTATION
1994 AOeS Annual Meeting Souvenir T-Shirts
~
Skyline Design Peach Designavailable in sizes available in sizes .)large and extra large large and extra large
Select a white, 100% cotton T-shirt with the
ATLANTA design in the 1994 Annual Meeting colors of blue,orange and green. The cost is only $10.00, plus
$1.00 shipping and handling.
To order, contact Publication Orders, AOeS Press Dept. IP.O. Box 3489, Champaign, IL 61826-3489
Phone: 217-359-2344, Fax: 217-351-8091or call Toll-Free 1-800-336-AOCS
heimer. AML Chern.56:2427 (1984).5.0ppenheimer. L.E., and T.H.
Mourey. 1. Chromotog. 323:297(1985).
6. Van der Meeren. P.. J. Vanderdee-len and L. Baert. Anal. Chem.64:1056 (1992).
7. Righezza, M., and G. Guiochon,1. Liq. Chromatog. 11:2709(1988).
8. Morris. C.E.M., and I. Orabovac.J. Chromatog. 189:259(1980).
9. Burkow, J.C .• and R.J. Henderson,Lipids 26:227 (1991).
10. Burkow, I.C .. and R.J. Henderson,J. Cnromatog. 552:501 (1991).
11. Hopia. A.1.. V.1. Piironen. P.E.Koivistoinen and L.E.T. Hyvdnen,J. Am. Oil Chem. Soc. 69:772(1992).
12. Hopta. A.I., Lehensm.swiss. !I.-
Technol. 26:568 (1993).13. Hopia, A.I., A.-M. Lampi, V.1.
Piironen. L.E.T. Hyvonen and P.E.Koivistoinen, J. Am. Oil Chem.Soc. 7~779 (1993).
14. Hopia. A.I.. Lebensm.swiss. u.-Techno/. 26:563 (1993).
15. Coulombe, S., J. Cnromatog. Sci.26: 1(1988).
16. Macrae, R .. L.C. Trugo and J.Dick. Chromatographio 15:476(1982).
17. Christie. W.W., J. Upid Res.26:507 (1985).
18. Christie, W.W., 1. Chromat,361:396 (1986).
19. Robinson, J.L., M. Tsimidou andR. Macrae, J. Chromatog. 324:35(1985).
20. Stolywho. A., H. Colin and G.Guiochon, Anal. Chern. 57: 1342(1985).
21. Palmer. A.J., and F.J. Palmer. J.Cnromatog. 465:369 (1989).
22. Grossberger, T., and E. Roth-schild. LC'GC Internal. 2:46(1989).
23. Markello. r.c., J. Guo and W.A.Gahl, Anal. Biochem. 198:368(1991).
24. Yang, B., and J. Chen. J. Am. OilChern.Soc. 68:980 (1991).
25. Hierro. M.T.G. M.C. Tomas. F.Fernandez-Marrin and G. San ra-Marfa. J. Chromotog, 607:329(1992).
26. Letter. W.S., J. liquid Chromatog.16:225 (1993).
27. Viinanen, E., and A. Hopia. J. Arn.Oil Chern.Soc. 71:537(1994).
28. Huang. A.S., L.R. Robinson, L.G.Gursky. R. Profit a and C.G.Sabidong, J. Agric. Food Cnem.42:468 (1994).
29. Liu, 1.. T. Lee, E. Bobik Jr .. M.
Guzman-Harty and C. Hasulcw, J.Am. Oil Chern. Soc. 70:343(1993).
30. Gerard. H.C .. R.A. Moreau, w.F.Fell and S.F. Osman, Ibid. 69:301(1992).
3\. Chase, G.W. Jr., C.C. Akoh andR.R. Bltenmlller, Ibid. 7/:877(1994).
32. Abidi, S.L.. J. Chromatog,587: 193 (1991).
33. Letter, W.S.• J. liquid Chromatog.15:253 (1992).
34. Melton, S.L., J. Am. Oil Chern.Soc. 69:784 (1992).
35. Amari, tv., P.R. Brown and J.G.Turcotte. Amer. Lab. 24:23 (1992).
36. Amari. r.v, P.R. Brown and J.G.Turcotte. Ibid. 24:26 (1992).
37. Mounts, T.L.. S.L. Abidi and K.A.Rennick, J. Am. Oil Chem. Soc.69:438 (1992).
38. Lutzke, B.S .. and 1.M Braughler.J. lipid Res. 31:2127 (\990).
39. Juanede. P.• G. Rocquelin and P.O.Astorg.lipids 25:756 (1990).
40. Carraud. F., D. Thiebaut, M.Caude, R. Rosser, M. Lafosse andM. Dreux. J. Chromatog, Sci.25:395 (1987).
4\. Hansen. S.L., and W.E. Artz, J.Am. Oil Chern. Soc. 71:615(1994). •
INFORM. Vol. 6, no. 2 (february 1995)