Embed Size (px)
Citation preview
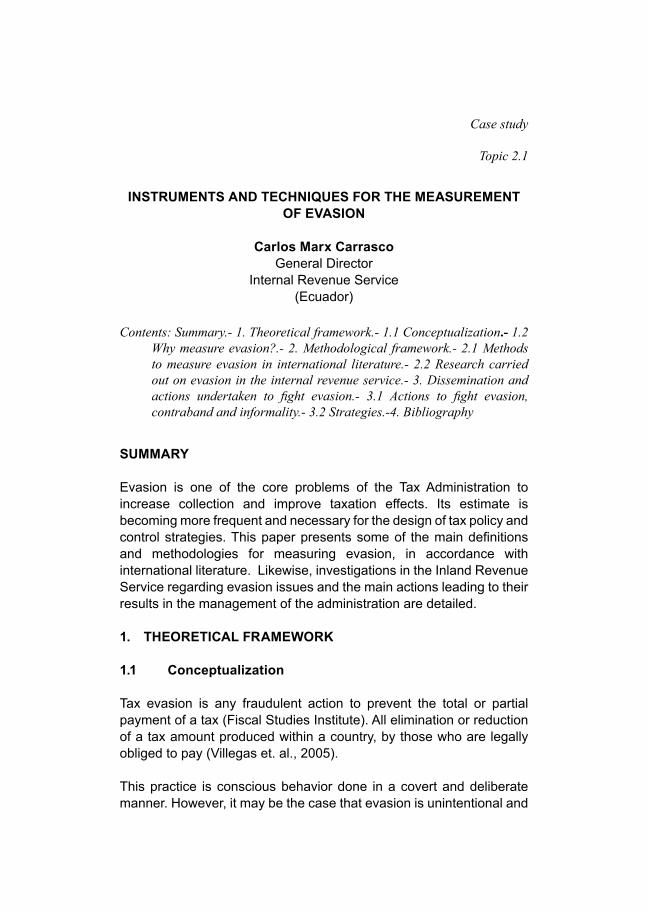
Instruments and technIques for the measurement of evasIon
carlos marx carrasco General Director
Internal Revenue Service (Ecuador)
Case study
Topic 2.1
Contents: Summary.- 1. Theoretical framework.- 1.1 Conceptualization.- 1.2 Why measure evasion?.- 2. Methodological framework.- 2.1 Methods to measure evasion in international literature.- 2.2 Research carried out on evasion in the internal revenue service.- 3. Dissemination and actions undertaken to fight evasion.- 3.1 Actions to fight evasion, contraband and informality.- 3.2 Strategies.-4. Bibliography
summary
Evasion is one of the core problems of the Tax Administration to increase collection and improve taxation effects. Its estimate is becoming more frequent and necessary for the design of tax policy and control strategies. This paper presents some of the main definitions and methodologies for measuring evasion, in accordance with international literature. Likewise, investigations in the Inland Revenue Service regarding evasion issues and the main actions leading to their results in the management of the administration are detailed.
1. theoretIcaL frameWorK
1.1 conceptualization
Tax evasion is any fraudulent action to prevent the total or partial payment of a tax (Fiscal Studies Institute). All elimination or reduction of a tax amount produced within a country, by those who are legally obliged to pay (Villegas et. al., 2005).
This practice is conscious behavior done in a covert and deliberate manner. However, it may be the case that evasion is unintentional and
TOPIC 2.1 (Ecuador)
2
open (for example: travelling salespersons), derived from a precarious socio-economic system which excludes from the formal system a segment of the population. From this point of view, informality is part of evasion.1
The Royal Commission on Taxation of the United Kingdom, defined in 1955, evasion as any activity from which a person does not pay the tax required by existing legislation (Cosulich 1993). As Seville (2005) states, the tax gap or evasion rate is the distance between the collection which would be received by the State, if all taxpayers comply strictly with the standard (potential collection) and the collection that effectively entered into the Treasury.
The causes of evasion are not unique, for Lamagrande cited by Aquinas (2008): “the examination of the phenomenon of tax evasion, allows us to infer its degree of complexity and dynamic character.” Its reduction depends on the removal of the factors involved in such dynamic, and a series of measures appropriate to a given, economic and social context should be carried out in order to achieve this. “Without detriment to circumstances beyond the economic tax field can improve or affect the level of tax compliance.”
1.2 Why measure evasion?
The criminalization of this act is justified as evasion infringes upon the State’s tax basis and undermines the social economy of the market (Ugalde and García, 2007). The importance of the tax burden and its influence on production costs, marketing and service delivery, makes the evading taxpayer enjoy advantages when compared to the rest of the taxpayers. In addition to eroding the government’s revenue (Tacchi, 1993), a tax system with high levels of evasion attempts against the real impact of the system, by altering the principles of equity and social cohesion which pursues the Welfare State (Cosulich, 1993 and Cardona et al., 2007)
Evasion is a stumbling block for development, balanced growth, and in general for tax system justice. Its measurement is justified for two 1 As Portes and Haller (2004) state: “Consensus seems to be increasing among the research-
ers of the developed world that the scope of application of the term informal sector covers “the actions of economic agents that do not adhere to the institutional standards established or those to which their protection is denied.” (Feige 1990, page 990). Or, includes “all the income-generating activities not covered by the State in social environments where similar activities are regulated.” For example, unpaid domestic work is an informal activity but it does not affect taxes. Thus, remuneration received by workers of the informal sector may not involve tax evasion if pensions are within the exempted tranche” (A definition of informality).
TOPIC 2.1 (Ecuador)
3
reasons: (i) allows you to design an economic system to ensure a minimum level of well-being for its citizens, compliance with the principle of sufficiency and avoiding macro fiscal imbalances for the State, and (ii) is an essential input for the management of the tax administrations.
1.0.1 economic Importance of measuring evasion
The final purpose of a tax system is to provide resources to finance public expenditure (Jorrat, 1996). In this solidarity process between the State and society, the system is legitimized provided that it guarantees: (i) a minimum level of well-being through horizontal and vertical equity and (ii) the tax regime should support balanced and sustained economic growth2. The importance given by a Government to one or another will depend on the ideology it pursues, but there is no doubt that these two objectives must be present in greater or lesser extent in a tax system
Erosion of tax revenues from evasion brings difficulties to the State to run an efficient social policy. It is estimated that every year about 160 billion dollars are lost due to tax evasion throughout the planet, by invoices counterfeiting and transfer pricing alteration between related parties. On the other hand, if we consider that the budget allocated by developed countries to help poor countries is 103 billion dollars, if evasion is controlled, it could cover more than 1.5 times this budget (Murphy et. al, 2007).
Tax evasion, limits the development of the economies, especially those that do not have a strong tax system. According to Martens (2007), this practice will be responsible for the death of 5.6 million children for the 2000-2015 period, this means 1,000 children per day.
In 2000, the Millennium Development Goals were formed as an effort to eradicate poverty and promote development. However, until 2015 - the end date for the goals – the developing world will have lost 2.5 trillion dollars from evasive practices. In this respect, the World Bank estimates that 0.9 trillion dollars would be needed to meet these objectives in the project implementation period. Evasion would cover 2.7 times that figure (Martens 2007).
In addition to the effects on poverty, the asymmetries in the distribution of income present a positive correlation with the weakness of tax 2 Balanced, because growth may generate greater asymmetries in the distribution of wealth,
therefore a mechanism to prevent this must be put in place; and sustainable, because the purpose is to minimize the fluctuations of economic cycles in time.
TOPIC 2.1 (Ecuador)
4
systems. Lax tax systems have preferred regressive indirect taxes for their ease of collection. In poor countries only 16% of tax revenue comes from income tax, while 32% is generated by excise taxes. In rich countries these ratios are 28% and 25% respectively (Martens 2007). The dismantling of direct taxation in developing countries has been accompanied by rising inequality, where in the last 20 years the Gini coefficient has increased in 53 of 73 developing countries (Martens 2007).
Evasion affects welfare because it breaks both the horizontal and vertical equity3. In the case of vertical equity, the effective tax rate4 of two individuals with different income may be the same because one of them uses mechanisms to reduce its payment. In the manner way two individuals who have equal income may be subject to a different tax rate if one evades its taxes, violating the horizontal equity of the tax system.
Evasion damages growth. Companies that evade their tax obligations have advantages over those that do comply, as mentioned by Stiglitz these distortions produce market failures since the true costs of production or income are not collected, this limits the growth of the affected economies. Even the imbalance that exists between productive sectors (monopolies) in developing countries causes evasion amounts to be centered in large corporations. This creates incentives to capture political power spaces achieving the establishment of foreign policy, tax or industrial incentives, legalizing evasion and causing the tax burden to fall on traditional economic groups (Prats y Macias-Aymar , 2008).
Gold mining companies in some African countries have total VAT exemption for imports and local procurement of goods and services. Finally, according to UNDP in Southeast Asia agriculture accounts for more than 30% of GDP and contributes to less than 6% of government revenues.
The evasion practices of large corporations with institutionally weak Governments generate growth based on the exploitation of natural resources which is concentrated on export sectors of low value added products. An example is the Democratic Republic of Congo, who in 2006 received the negligible value of US$86,000 for mining rights.
3 Vertical equity refers to the equal treatment of equals, while horizontal equity is the unequal treatment of unequal.
4 The effective tax rate is defined as the ratio between the taxes assessed on the individual’s income. This indicator shows the society’s relative degree of tax compliance.
TOPIC 2.1 (Ecuador)
5
Tanzania is another example of this problem, because it has the largest gold reserves of the continent after South Africa, and only receives 3% of the value of total exports of this mineral.
Ultimately, problems generated by evasion on the economic growth and social welfare have economic-political impacts. High levels of evasion weaken society’s confidence in the State, and produces lack of legitimacy in its actions. This lack of legitimacy along with high social inequality hinders the emergence of a credible and sustainable fiscal compact (Prats and Macias-Aymar, 2008).
1.0.2 the Importance of measuring evasion for the tax administration.
According to Jorrat (2003) it is important for the Tax Administration (TA) to have information on the amount of tax evasion in an economy for several reasons. First, it allows the tax administration to orient control plans. Tax control planning should be based on information on quantifiable economic activities and riskier geographic zones and the most used evasive methods. To do this it is essential to quantify this phenomenon not only at the aggregate level, but at sector and territorial levels as well.
Second, it allows you to monitor the results of examination plans and make changes when necessary (Jorrat, 2003). Not having a priori evasion information limits control plans and may cause errors when defining examinations. In the same manner, without evasion figures prior to the tax control prevent assessing how effective these controls were. This delegitimizes the action of the State and causes the TA to enter into a vicious circle where evasion schemes are based on subjective aspects that increase the probability of failure.
Third, tax evasion is an indicator of the efficiency of the Administration (Jorrat, 2003 and Trujillo, 1998). [All] tax systems face difficulties when differentiating between the collection product trend growth of the economy and the proceeds generated by the management of the tax benefit. This issue is resolved, in part, by having periodic measurements of evasion levels which can distinguish the level of efficiency of institutional management, of the inertia of the economy.
Fourth, the Government should consider evasion when deciding the TA’s collection goals and when analyzing any amendments to the tax legislation (Jorrat, 2003 and Trujillo, 1998). If in the course of time,
TOPIC 2.1 (Ecuador)
6
evasion figures in a country does not decline or tax pressure rates do not increase, the tax authority should consider two possible causes: (i) or control plans are not producing the results expected and would have to change the strategy, or (ii) the existing legislation is being an obstacle to improve compliance, therefore a legislative change should be considered. These conclusions can only be reached when a regular quantification of evasion rates are maintained.
Fifth, evasion rates, along with Tax Expenditure quantifications must be inputs for the Parliament and the Executive power at the time of establishing the general State budget. It must also be an important input for bills seeking to assign benefits and tax incentives to the different economic sectors or geographical areas. State policy consistent with national objectives could not assign economic or tax incentives to economic activities that maintain high levels of evasion.
Sixth, to know the evasion breakdown helps to identify the economic sectors that would require a higher degree of simplification of the tax system or in its absence an increased investment in the tax culture to insert it into the formal system. This can be the case of simplified regimes, where proper quantification of evasion by population segments help design a simplified regime that will formalize persons requiring a system of this kind, and not on the other hand be regimes to help evaders. Quantifying evasion can help simplifying the system and reduce informality.
Finally, as noted by Trujillo (1998) to measure evasion especially dimensions the problem. To not know what is the magnitude of the problem prevents finding optimal solutions. Knowledge of the extent of evasion can allocate additional resources to improve institutionalism and/or the management of the Tax Administration.
2. methodoLoGIcaL frameWorK
2.1 methods to measure evasion in International Literature
Estimates of evasion gaps are of particular importance in the management of the Tax Administration, because it enables the design of control strategies according to the characteristics of taxpayers and the aspects that provided for in the legal provisions.
Tax literature has stated different methodologies for measuring evasion. Some of them are focused on measuring total evasion (formal and
TOPIC 2.1 (Ecuador)
7
informal sector), others the part corresponding to the GDP of the National Accounts System and omitted in tax returns and others to increase the informal economy or underground economy5. The main difficulty of the research in this field is that, by definition, evasion is not observable behavior outside of law. This implies, in the empirical framework, that a measurement as from existing databases in the tax administration cannot be obtained directly6.
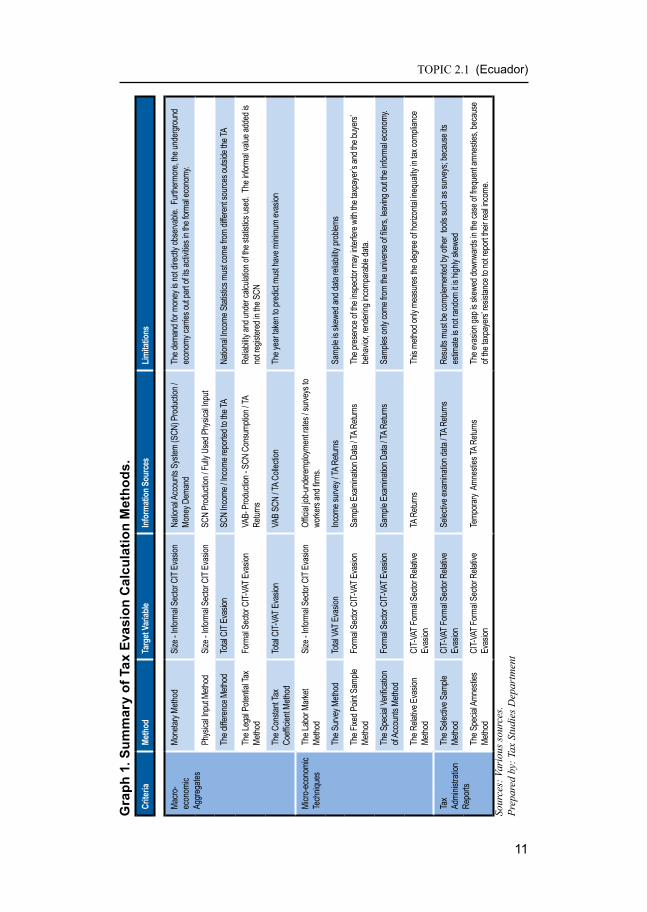
The methods most used in the TA are indirect methods, which give a rough picture of evasion, do not attain to supply the necessary aspects for the design of control programs. In practice, three indirect ways to estimate evasion can be distinguished (Fenochietto 1999):
• Tax Administration Reports. Consists of measuring the effect of tax default on the generation of income for the tax administration.
• Macroeconomic aggregates. Is the use of the statistics of the National Accounts System, the labor market, the underground economy and tax default to approximate tax evasion
• Microeconomic techniques. The use of surveys on a sample of taxpayers.
Hereinafter, the most used methods according to teach category are described herein.
2.1.1 macroeconomic aggregates
the monetary method
The monetary method estimates the size of the underground economy under the assumption that the relationship between the demand for money and national production does not remain constant. Technological innovations generate a decline in the preference for cash. If noted otherwise, the excess cash must be related to the presence of an underground economy under the assumption that money is being used more intensively than the formal economy. This method has limitations, since the demand for money is not a directly observable economic aggregate and the underground economy performs part of its activities in the formal economy.5 Informal or illegal, underground economy can be defined as the network of transaction that
occurs without complying with the tax regulations transgressing the law and evading taxes. This type of trade is reflected on the hidden sales made by the business, retail and wholesale. As such, this fraud involves in some cases the evasion of all taxes established.
6 However, the relative evasion method is an indirect process that makes exclusive use of the tax administration databases to estimate the evasion in respect of the best compliance prac-tices in the universe of taxpayers.
TOPIC 2.1 (Ecuador)
8
the Physical Input method
The physical input method assumes a stable relationship between a physical input widely used in the economy and national production. Based on this relationship, the size of economic activity is estimated, which is then compared to the production recorded in the National Accounts System. The difference between both figures is considered a non-reported economic activity and is associated with the evaded amount of tax revenue.
the difference method.
The difference method compares the income recorded in the National Accounts System with the income reported on tax returns. The difference of two numbers is the evaded income gap. In order for this method to make sense, national income statistics must come from sources other than the Tax Administration.
the Legal tax Potential method.
the premise of the legal tax potential method is that the National Accounts System figures are correct and are a good basis for the calculation of income tax and VAT. The evaded tax is defined as the difference between the legal potential tax and the tax in effect collected; this is, the difference between tax revenue that would have been obtained if all legal tax obligations had been paid, and taxes actually collected
The theoretical taxable base for the legal tax potential is estimated according to the tax:• Value-added tax: final taxed consumption of households of
the National Accounts System, plus the taxed intermediate consumption of business sector that produces exempt goods.
• Income tax: the excess gross exploitation, adjusted by monetary correction, less the surplus of exempt and excluded activities, the surplus of companies subject to presumptive income, prior periods losses that may lower the current taxable income, among other deductions, discounts and exemptions.
This method depends on the reliability of the statistics used, the informal value-added registry in the National Accounts System and the possible underestimation of the macroeconomic aggregates
TOPIC 2.1 (Ecuador)
9
The Constant Tax Coefficient Method
In this method, the fiscal pressure of a year in which tax evasion was minimal is chosen and is used to estimate the potential tax for the year in study. The difference between the estimated tax and the actual tax is the evaded tax
2.1.2 microeconomic techniques
the Labor market method.
The labor-market method compares the labor participation rates, according to official statistics, with the same rates obtained from surveys done to companies and workers. As from the differences found and based on average workmanship productivity, non-reported labor income, and thus, tax revenues ceased to be received for this concept.
the survey method
The survey method consists of obtaining information on taxpayers’ income through a survey, which is a source different from income tax statements. Income determined by the survey is compared with the income recorded in income statements, and tax default is estimated based on this. The weakness of this method is that it is subject to sampling bias and the problem of the reliability of data.
the fixed Point sample method
In the fixed point method an inspector visits a company, and stays during the working day to observe the development of the activity. From there, the theoretical sales levels are measured, considering that when the taxpayer is subject to the control of its transactions the true sales level is reflected. However, the presence of the officer Inspector at the place being inspected may interfere with the taxpayer’s and the buyers’ behaviors. In this case, the figure measured under control is not comparable with the one recorded in other periods.
The Special Verification of Accounts Method
The special verification of accounts method performs “line by line” audits, on a stratified sample of taxpayers, to determine the amount of taxes that are not paid for not abiding by the laws. The advantage of
TOPIC 2.1 (Ecuador)
10
this method is that it is less expensive and complex than other survey methods and allows reliable estimates of different tax evasion by different segmentation variables (economic activity, geographic location, etc.). On the other hand, the limitation is in considering samples taken from the universe of filers, leaving out the informal economy.
the relative evasion method
The relative evasion method operates on a new concept of evasion, regarding it not as the decline in collection but as a decline of equity in compliance with the tax. In this sense, the method focuses on estimating horizontal inequality in tax evasion, i.e. quantify in what measure tax obligations are not complied among those that do comply. The procedure is to determine the level that each taxpayer should pay according to their activity and some variables as invested and sales level. The estimated tax for each taxpayer is compared to the level of average taxation in that all comply, to then estimate the relative evasion coefficient on the standard deviation of the compliance percentages.
2.1.3 tax administration report
the selective sample method.
Selective sampling method compares the information presented in the returns by a selected group of taxpayers, through examination actions performed by the Tax Administration. The limitation of this method is in the fact that it must be complemented by other statistical tools such as surveys; because its estimate is not random it is highly skewed.
the special amnesties method.
The special amnesties method quantifies tax evasion by using information from income tax returns under the protection of temporary amnesties. This method works on the assumption that taxpayers are induced to declare their actual income in exchange for the suspension of fines or other sanctions they may be subject to. The limitation of this method is that you can skew evasion downwards in the case of frequent amnesties, because in spite of favorable conditions, some taxpayers may continue preferring not to submit to the same to not report their real income and therefore have to pay a higher tax.
TOPIC 2.1 (Ecuador)
11
Gra
ph 1
. sum
mar
y of
tax
eva
sion
cal
cula
tion
met
hods
.cr
iteria
meth
odta
rget
varia
bleInf
orm
ation
sou
rces
Limita
tions
Macro
-ec
onom
ic Ag
greg
ates
Mone
tary M
ethod
Size
- Info
rmal
Secto
r CIT
Evas
ionNa
tiona
l Acc
ounts
Sys
tem (S
CN) P
rodu
ction
/ Mo
ney D
eman
dTh
e dem
and f
or m
oney
is no
t dire
ctly o
bser
vable
. Fur
therm
ore,
the un
derg
roun
d ec
onom
y car
ries o
ut pa
rt of it
s acti
vities
in th
e for
mal e
cono
my.
Phys
ical In
put M
ethod
Size
- Info
rmal
Secto
r CIT
Evas
ionSC
N Pr
oduc
tion /
Full
y Use
d Phy
sical
Input
The d
iffere
nce M
ethod
Total
CIT
Evas
ionSC
N Inc
ome /
Inco
me re
porte
d to t
he TA
Natio
nal In
come
Stat
istics
mus
t com
e fro
m dif
feren
t sou
rces o
utside
the T
A
The L
egal
Poten
tial T
ax
Metho
dFo
rmal
Secto
r CIT-
VAT E
vasio
nVA
B- P
rodu
ction
- SCN
Con
sump
tion /
TA
Retur
nsRe
liabil
ity an
d und
er ca
lculat
ion of
the s
tatist
ics us
ed. T
he in
forma
l valu
e add
ed is
no
t regis
tered
in th
e SCN
The C
onsta
nt Ta
x Co
efficie
nt Me
thod
Total
CIT-
VAT E
vasio
nVA
B SC
N / T
A Co
llecti
onTh
e yea
r take
n to p
redic
t mus
t hav
e mini
mum
evas
ion
Micro
-eco
nomi
c Te
chniq
ues
The L
abor
Mar
ket
Metho
dSi
ze - I
nform
al Se
ctor C
IT Ev
asion
Offic
ial jo
b-un
dere
mploy
ment
rates
/ sur
veys
to
worke
rs an
d firm
s.
The S
urve
y Meth
odTo
tal VA
T Eva
sion
Incom
e sur
vey /
TA R
eturn
sSa
mple
is sk
ewed
and d
ata re
liabil
ity pr
oblem
s
The F
ixed P
oint S
ample
Me
thod
Form
al Se
ctor C
IT-VA
T Eva
sion
Samp
le Ex
amina
tion D
ata / T
A Re
turns
The p
rese
nce o
f the i
nspe
ctor m
ay in
terfer
e with
the t
axpa
yer’s
and t
he bu
yers’
be
havio
r, ren
derin
g inc
ompa
rable
data.
The S
pecia
l Ver
ificati
on
of Ac
coun
ts Me
thod
Form
al Se
ctor C
IT-VA
T Eva
sion
Samp
le Ex
amina
tion D
ata / T
A Re
turns
Samp
les on
ly co
me fro
m the
unive
rse of
filer
s, lea
ving o
ut the
infor
mal e
cono
my.
The R
elativ
e Eva
sion
Metho
dCI
T-VA
T For
mal S
ector
Rela
tive
Evas
ionTA
Retu
rns
This
metho
d only
mea
sure
s the
degr
ee of
horiz
ontal
ineq
uality
in ta
x com
plian
ce
Tax
Admi
nistra
tion
Repo
rts
The S
electi
ve S
ample
Me
thod
CIT-
VAT F
orma
l Sec
tor R
elativ
e Ev
asion
Selec
tive e
xami
natio
n data
/ TA
Retur
nsRe
sults
mus
t be c
omple
mente
d by o
ther t
ools
such
as su
rveys
; bec
ause
its
estim
ate is
not ra
ndom
it is
highly
skew
ed
The S
pecia
l Amn
estie
s Me
thod
CIT-
VAT F
orma
l Sec
tor R
elativ
e Ev
asion
Temp
orar
y Am
nesti
es TA
Retu
rns
The e
vasio
n gap
is sk
ewed
down
ward
s in t
he ca
se of
frequ
ent a
mnes
ties,
beca
use
of the
taxp
ayer
s’ re
sistan
ce to
not re
port t
heir r
eal in
come
.So
urce
s: V
ario
us so
urce
s.Pr
epar
ed b
y: T
ax S
tudi
es D
epar
tmen
t
TOPIC 2.1 (Ecuador)
12
2.2 research carried out on evasion in the Internal revenue service
In Ecuador, investigations performed on the subject of evasion are fundamental tools for designing strategies to control and tax policy. These investigations are framed in macro and micro econometric techniques for estimating tax gap by sector and geographical location. In addition, there are studies that model the behavior of taxpayers as evasion agents in an environment of general balance.
In this regard, the work has been substantial. Hereinafter the studies developed to date.
2.2.1 vat and corporate Income tax collection Gap estimate by Industry
At the end of the year 2007, the Internal Revenue Service developed an estimate of evasion by economic activity of the corporate income tax and the value added tax for the year 2004, taking into account the industries’ classification of the Central Bank of Ecuador7. The methodology used is based on the process to assess the theoretical potential tax, as from consumption and the Exploitation Gross Surplus – EBE, in Spanish - (adjusted for informality) recorded in the Supply and Utilization Tables of the National Accounts System. This result is compared with the effective collection recorded in the statistics of the corporate income tax and the value added tax of Internal Revenue Service (Andean et., 2008) to estimate the evasion gap of each tax.
Hereinafter are the main methodological guidelines:
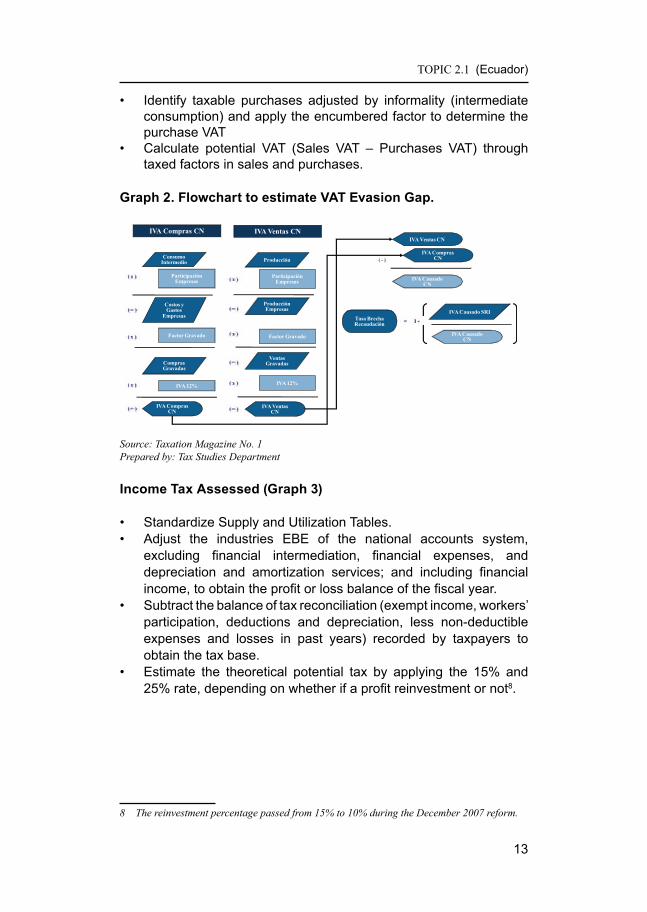
value added tax (Graph 2)
• Standardize Supply and Utilization Tables.• Identify taxable sales adjusted by informality (households and
government consumption, investment in and stock variations) and apply the taxed factor to determine the Sales VAT
7 Validation of economic activities and their standardization according to the Central Bank of Ecuador industry codes was done only for special taxpayers, since they concentrate 75% of the collection. CIIU3 economic activities that were the subject of thorough review were: crude oil extraction, natural gas and related services, the development of byproducts from oil refining, housing rentals, public administration and defense; compulsory social security affili-ation schemes. It must be emphasized that the omission of this review can lead to erroneous collection gap rates.
TOPIC 2.1 (Ecuador)
13
• Identify taxable purchases adjusted by informality (intermediate consumption) and apply the encumbered factor to determine the purchase VAT
• Calculate potential VAT (Sales VAT – Purchases VAT) through taxed factors in sales and purchases.
Graph 2. flowchart to estimate vat evasion Gap.
IVA Ventas CN
Producción
Producción Empresas
( x )
( = )
( x )
Ventas Gravadas
( x )
Participación Empresas
Factor Gravado
IVA 12%
( = )
IVA Ventas CN
IVA Compras CN
Consumo Intermedio
Costos y Gastos
Empresas
( x )
( = )
( x )
Compras Gravadas
( x )
Factor Gravado
IVA 12%
( = ) IVA Compras CN ( = )
Participación Empresas
IVA Ventas CN
( - )IVA Compras
CN
IVA Causado CN
Tasa Brecha Recaudación
IVA Causado CN
IVA Causado SRI= 1 -
Source: Taxation Magazine No. 1Prepared by: Tax Studies Department
Income tax assessed (Graph 3)
• Standardize Supply and Utilization Tables.• Adjust the industries EBE of the national accounts system,
excluding financial intermediation, financial expenses, and depreciation and amortization services; and including financial income, to obtain the profit or loss balance of the fiscal year.
• Subtract the balance of tax reconciliation (exempt income, workers’ participation, deductions and depreciation, less non-deductible expenses and losses in past years) recorded by taxpayers to obtain the tax base.
• Estimate the theoretical potential tax by applying the 15% and 25% rate, depending on whether if a profit reinvestment or not8.
8 The reinvestment percentage passed from 15% to 10% during the December 2007 reform.
TOPIC 2.1 (Ecuador)
14
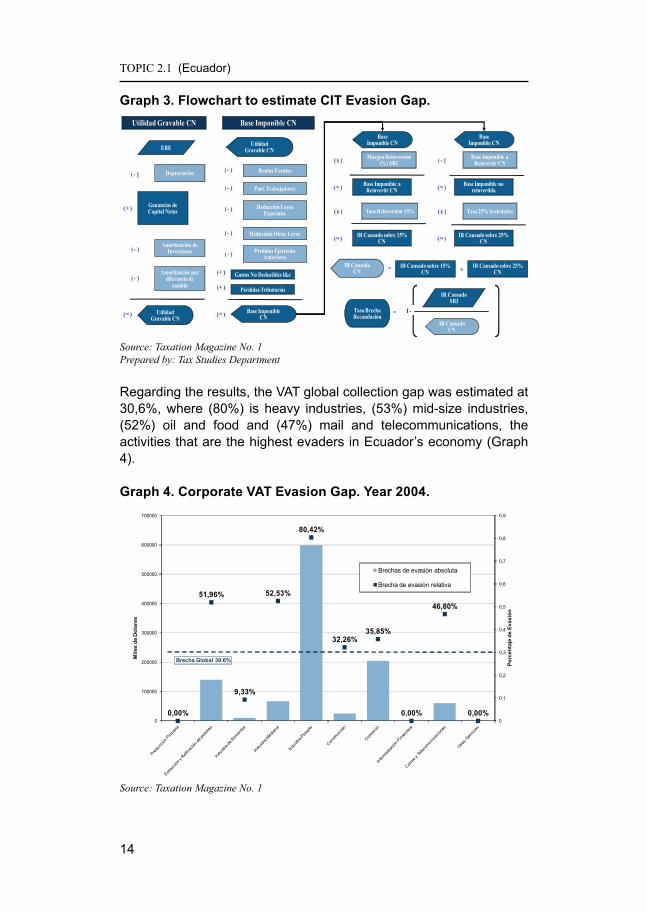
Graph 3. flowchart to estimate cIt evasion Gap. Utilidad Gravable CN
EBE
( - ) Depreciación
Utilidad Gravable CN
Base Imponible CN
( - ) Rentas Exentas
( = ) Base Imponible CN( = )
Ganancias de Capital Netas
Amortización de Inversiones
Amortización por diferencia de
cambio
( + )
( - )
( - )
Utilidad Gravable CN
( - ) Part. Trabajadores
Deducción Leyes Especiales
( - )
Deducción Otras Leyes( - )
Pérdidas Ejercicios Anteriores( - )
Gastos No Deducibles l&e( + )
Pérdidas Tributarias( + )
Base Imponible CN
Margen Reinversión (%) SRI( x )
Base Imponible a Reinvertir CN( = )
Tasa Reinversión 15%
Base Imponible CN
Base Imponible a Reinvertir CN
Base Imponible no reinvertida
( - )
( = )
Tasa 25% Sociedades( x )( x )
IR Causado sobre 15% CN
IR Causado sobre 25% CN( = )( = )
IR Causado CN
IR Causado sobre 15% CN
IR Causado sobre 25% CN
= +
Tasa Brecha Recaudación
IR Causado CN
IR Causado SRI
= 1 -
Source: Taxation Magazine No. 1Prepared by: Tax Studies Department
Regarding the results, the VAT global collection gap was estimated at 30,6%, where (80%) is heavy industries, (53%) mid-size industries, (52%) oil and food and (47%) mail and telecommunications, the activities that are the highest evaders in Ecuador’s economy (Graph 4).
Graph 4. corporate vat evasion Gap. year 2004.
0,00%
51,96%
9,33%
52,53%
80,42%
32,26%35,85%
0,00%
46,80%
0,00%0
0,1
0,2
0,3
0,4
0,5
0,6
0,7
0,8
0,9
0
100000
200000
300000
400000
500000
600000
700000Po
rcen
taje
de
Evas
ión
Mile
s de
Dol
ares
Brechas de evasión absoluta
Brecha de evasión relativa
Brecha Global 30.6%
Source: Taxation Magazine No. 1
TOPIC 2.1 (Ecuador)
15
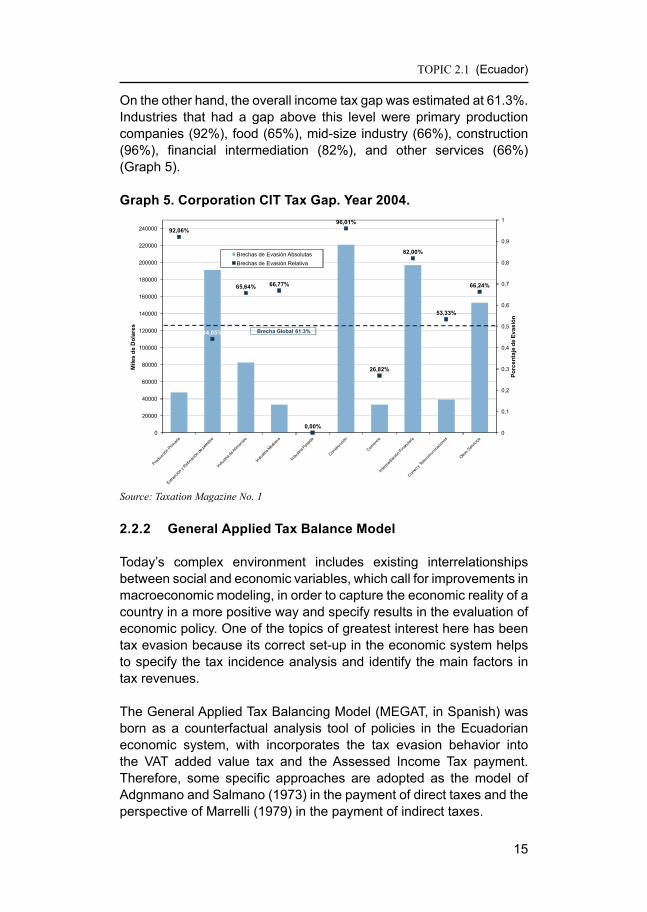
On the other hand, the overall income tax gap was estimated at 61.3%. Industries that had a gap above this level were primary production companies (92%), food (65%), mid-size industry (66%), construction (96%), financial intermediation (82%), and other services (66%) (Graph 5).
Graph 5. corporation cIt tax Gap. year 2004.
92,06%
44,05%
65,64% 66,77%
0,00%
96,01%
26,82%
82,00%
53,33%
66,24%
0
0,1
0,2
0,3
0,4
0,5
0,6
0,7
0,8
0,9
1
0
20000
40000
60000
80000
100000
120000
140000
160000
180000
200000
220000
240000
Porc
enta
je d
e Ev
asió
n
Mile
s de
Dol
ares
Brechas de Evasión AbsolutasBrechas de Evasión Relativa
Brecha Global 61.3%
Source: Taxation Magazine No. 1
2.2.2 General applied tax Balance model
Today’s complex environment includes existing interrelationships between social and economic variables, which call for improvements in macroeconomic modeling, in order to capture the economic reality of a country in a more positive way and specify results in the evaluation of economic policy. One of the topics of greatest interest here has been tax evasion because its correct set-up in the economic system helps to specify the tax incidence analysis and identify the main factors in tax revenues.
The General Applied Tax Balancing Model (MEGAT, in Spanish) was born as a counterfactual analysis tool of policies in the Ecuadorian economic system, with incorporates the tax evasion behavior into the VAT added value tax and the Assessed Income Tax payment. Therefore, some specific approaches are adopted as the model of Adgnmano and Salmano (1973) in the payment of direct taxes and the perspective of Marrelli (1979) in the payment of indirect taxes.
TOPIC 2.1 (Ecuador)
16
MEGAT as other general equilibrium models is formulated from competitive markets in a small and open economic system with increasing or decreasing technologies in the production and external marketing of goods and services, responding in principle to the concept of Walrasian Equilibrium for all agents and markets that form the same.
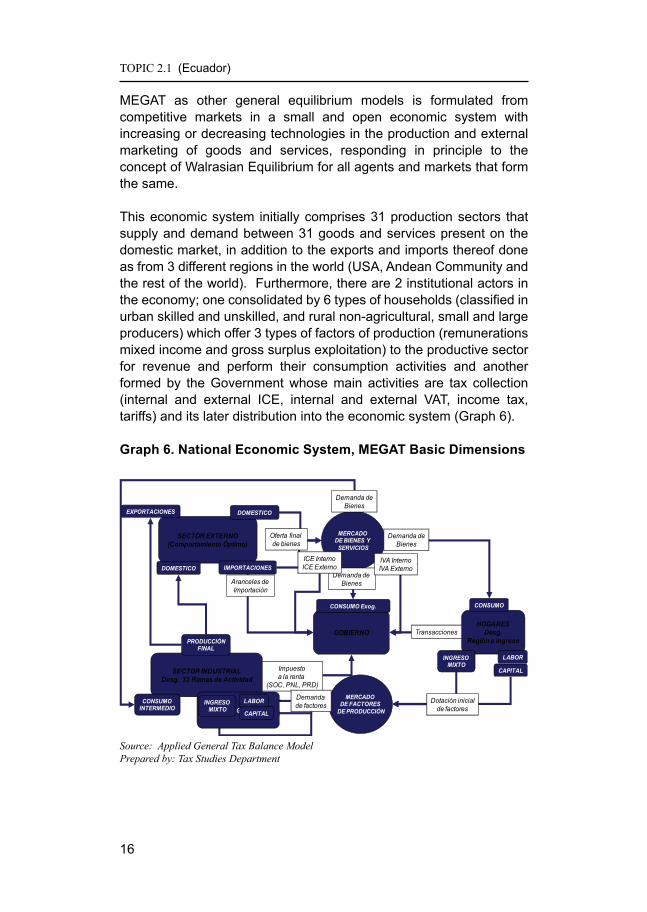
This economic system initially comprises 31 production sectors that supply and demand between 31 goods and services present on the domestic market, in addition to the exports and imports thereof done as from 3 different regions in the world (USA, Andean Community and the rest of the world). Furthermore, there are 2 institutional actors in the economy; one consolidated by 6 types of households (classified in urban skilled and unskilled, and rural non-agricultural, small and large producers) which offer 3 types of factors of production (remunerations mixed income and gross surplus exploitation) to the productive sector for revenue and perform their consumption activities and another formed by the Government whose main activities are tax collection (internal and external ICE, internal and external VAT, income tax, tariffs) and its later distribution into the economic system (Graph 6).
Graph 6. national economic system, meGat Basic dimensions
6
SECTOR INDUSTRIALDesg. 33 Ramas de Actividad
HOGARESDesg.
Región e ingresoGOBIERNO
MERCADO DE BIENES Y
SERVICIOS
MERCADO DE FACTORES
DE PRODUCCIÓN
SECTOR EXTERNO(Comportamiento Óptimo)
Demanda deBienes
Demanda deBienes
Impuesto a la renta
(SOC, PNL, PRD)
Transacciones
Aranceles de Importación
Demanda de Bienes
IMPORTACIONES
EXPORTACIONES
Demanda de factoresCONSUMO
INTERMEDIO
ICE InternoICE Externo
CONSUMO
PRODUCCIÓNFINAL
DOMESTICO
DOMESTICO
Oferta final de bienes
CONSUMO Exog.
CAPITAL
LABORINGRESO MIXTO
Dotación inicialde factores
IVA InternoIVA Externo
VALOR AGREGADOLABOR
CAPITAL
INGRESO MIXTO
Source: Applied General Tax Balance ModelPrepared by: Tax Studies Department
TOPIC 2.1 (Ecuador)
17
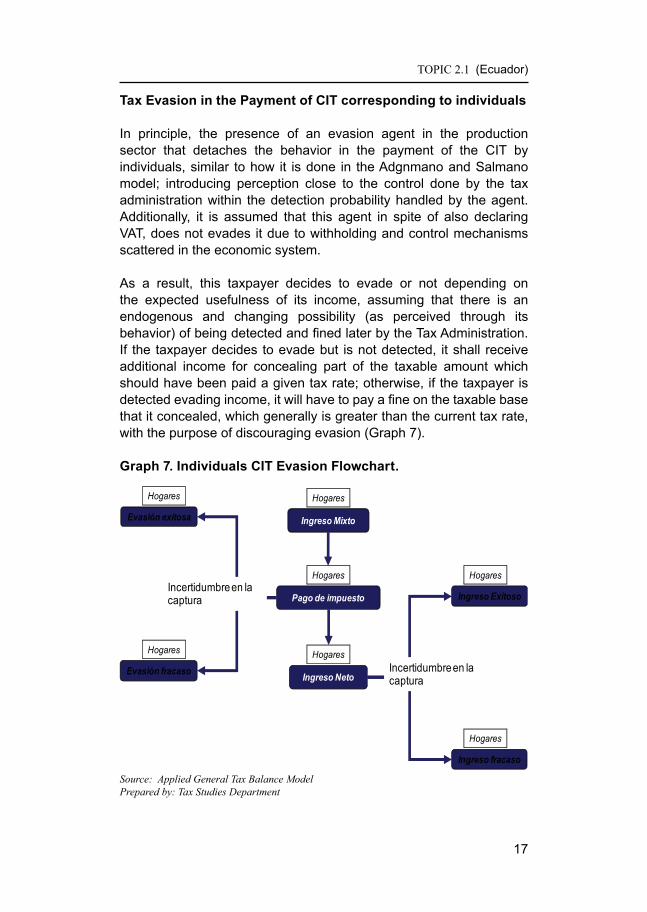
tax evasion in the Payment of cIt corresponding to individuals
In principle, the presence of an evasion agent in the production sector that detaches the behavior in the payment of the CIT by individuals, similar to how it is done in the Adgnmano and Salmano model; introducing perception close to the control done by the tax administration within the detection probability handled by the agent. Additionally, it is assumed that this agent in spite of also declaring VAT, does not evades it due to withholding and control mechanisms scattered in the economic system.
As a result, this taxpayer decides to evade or not depending on the expected usefulness of its income, assuming that there is an endogenous and changing possibility (as perceived through its behavior) of being detected and fined later by the Tax Administration. If the taxpayer decides to evade but is not detected, it shall receive additional income for concealing part of the taxable amount which should have been paid a given tax rate; otherwise, if the taxpayer is detected evading income, it will have to pay a fine on the taxable base that it concealed, which generally is greater than the current tax rate, with the purpose of discouraging evasion (Graph 7).
Graph 7. Individuals cIt evasion flowchart.
Ingreso Mixto
Hogares
Pago de impuesto
Hogares
Ingreso Neto
Hogares
Evasión exitosa
Hogares
Evasión fracaso
Hogares
Incertidumbre en la captura Ingreso Exitoso
Hogares
Ingreso fracaso
Hogares
Incertidumbre en la captura
Source: Applied General Tax Balance ModelPrepared by: Tax Studies Department
TOPIC 2.1 (Ecuador)
18
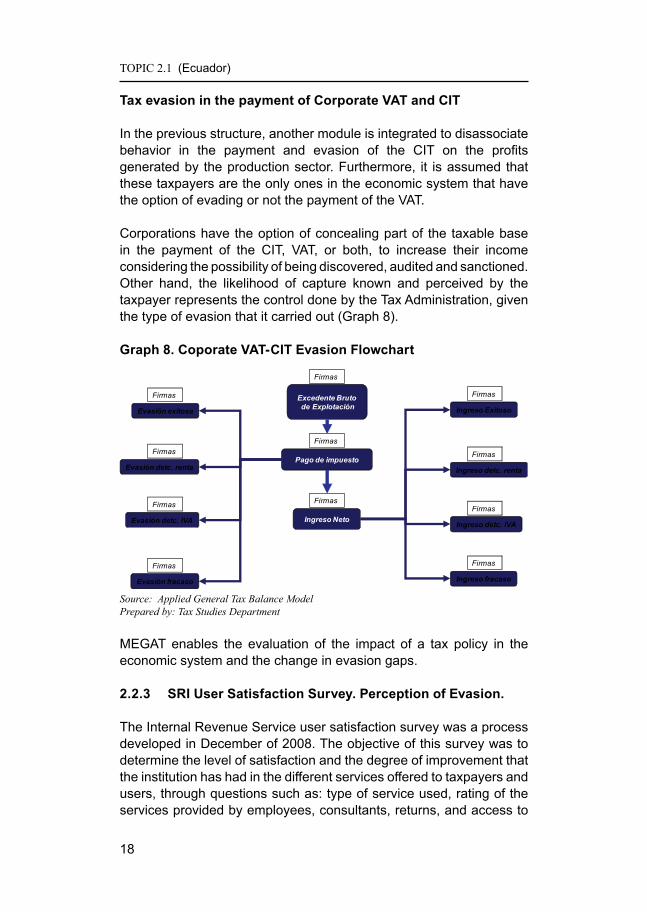
tax evasion in the payment of corporate vat and cIt
In the previous structure, another module is integrated to disassociate behavior in the payment and evasion of the CIT on the profits generated by the production sector. Furthermore, it is assumed that these taxpayers are the only ones in the economic system that have the option of evading or not the payment of the VAT.
Corporations have the option of concealing part of the taxable base in the payment of the CIT, VAT, or both, to increase their income considering the possibility of being discovered, audited and sanctioned. Other hand, the likelihood of capture known and perceived by the taxpayer represents the control done by the Tax Administration, given the type of evasion that it carried out (Graph 8).
Graph 8. coporate vat-cIt evasion flowchart
Excedente Brutode Explotación
Firmas
Pago de impuesto
Firmas
Ingreso Neto
Firmas
Evasión exitosa
Firmas
Evasión fracaso
Firmas
Ingreso Exitoso
Firmas
Ingreso fracaso
Firmas
Evasión detc. renta
Firmas
Evasión detc. IVA
Firmas
Ingreso detc. renta
Firmas
Ingreso detc. IVA
Firmas
Source: Applied General Tax Balance ModelPrepared by: Tax Studies Department
MEGAT enables the evaluation of the impact of a tax policy in the economic system and the change in evasion gaps.
2.2.3 srI user satisfaction survey. Perception of evasion.
The Internal Revenue Service user satisfaction survey was a process developed in December of 2008. The objective of this survey was to determine the level of satisfaction and the degree of improvement that the institution has had in the different services offered to taxpayers and users, through questions such as: type of service used, rating of the services provided by employees, consultants, returns, and access to
TOPIC 2.1 (Ecuador)
19
services through the Internet, etc. It also stated certain questions to measure the taxpayers’ perceptions on evasion control and sanction topics, (2009 INEC).
This survey was done through direct interviews to people attended during December at the different agencies of SRI nation-wide, after concluding the process that brought them to this agency (Intercept Method). The database contains the opinions of 2,865 taxpayers, distributed proportionally according to the size of the 8 regional offices.
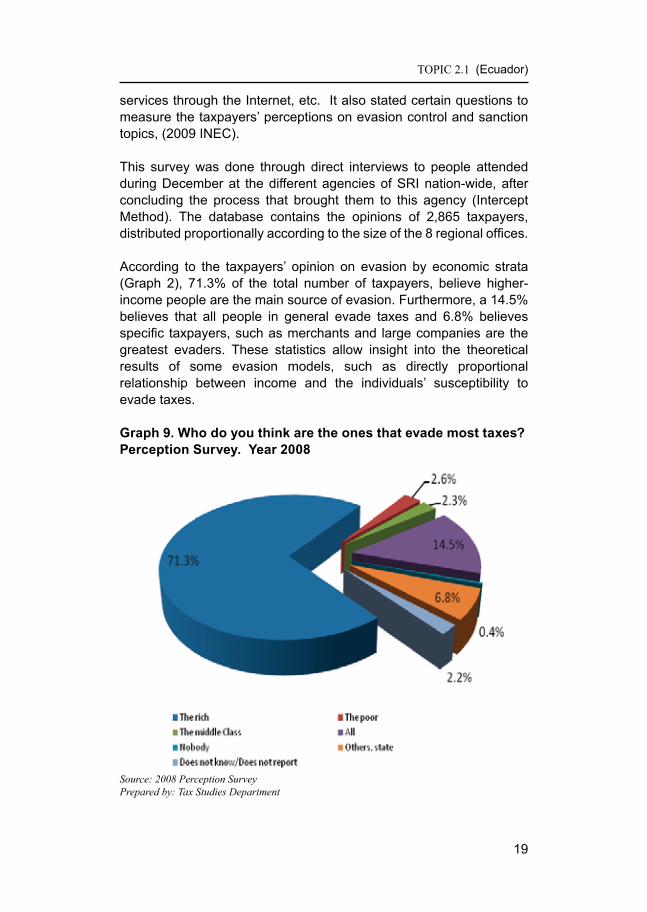
According to the taxpayers’ opinion on evasion by economic strata (Graph 2), 71.3% of the total number of taxpayers, believe higher-income people are the main source of evasion. Furthermore, a 14.5% believes that all people in general evade taxes and 6.8% believes specific taxpayers, such as merchants and large companies are the greatest evaders. These statistics allow insight into the theoretical results of some evasion models, such as directly proportional relationship between income and the individuals’ susceptibility to evade taxes.
Graph 9. Who do you think are the ones that evade most taxes?Perception survey. year 2008
Source: 2008 Perception SurveyPrepared by: Tax Studies Department
TOPIC 2.1 (Ecuador)
20
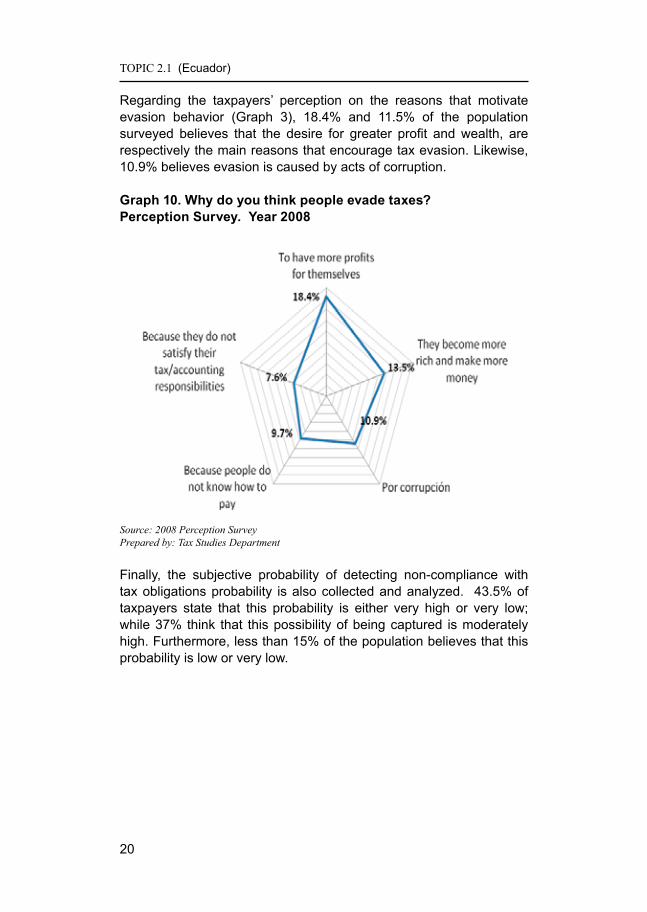
Regarding the taxpayers’ perception on the reasons that motivate evasion behavior (Graph 3), 18.4% and 11.5% of the population surveyed believes that the desire for greater profit and wealth, are respectively the main reasons that encourage tax evasion. Likewise, 10.9% believes evasion is caused by acts of corruption.
Graph 10. Why do you think people evade taxes?Perception survey. year 2008
Source: 2008 Perception SurveyPrepared by: Tax Studies Department
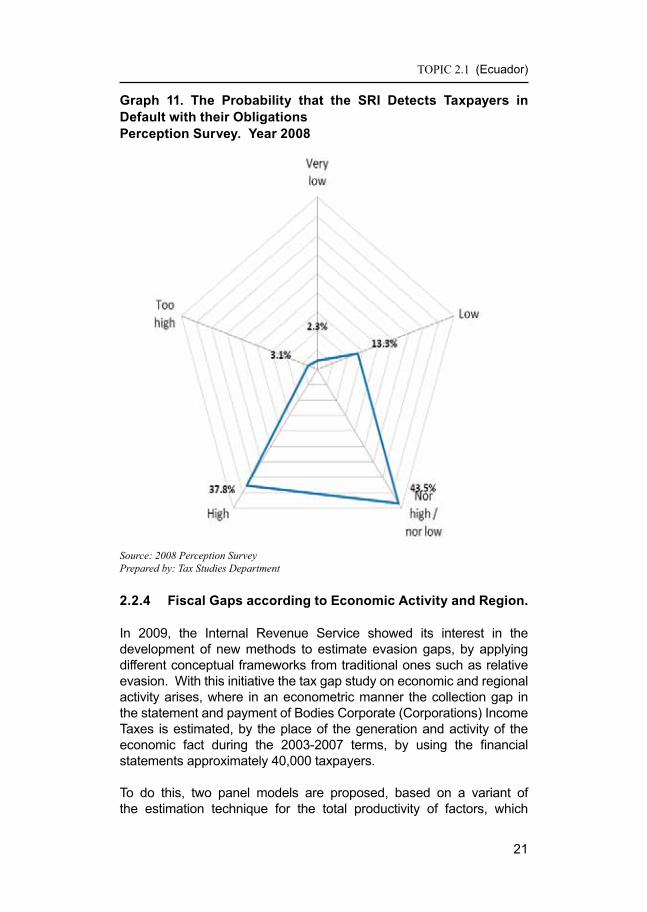
Finally, the subjective probability of detecting non-compliance with tax obligations probability is also collected and analyzed. 43.5% of taxpayers state that this probability is either very high or very low; while 37% think that this possibility of being captured is moderately high. Furthermore, less than 15% of the population believes that this probability is low or very low.
TOPIC 2.1 (Ecuador)
21
Graph 11. the Probability that the srI detects taxpayers in default with their obligationsPerception survey. year 2008
Source: 2008 Perception SurveyPrepared by: Tax Studies Department
2.2.4 fiscal Gaps according to economic activity and region.
In 2009, the Internal Revenue Service showed its interest in the development of new methods to estimate evasion gaps, by applying different conceptual frameworks from traditional ones such as relative evasion. With this initiative the tax gap study on economic and regional activity arises, where in an econometric manner the collection gap in the statement and payment of Bodies Corporate (Corporations) Income Taxes is estimated, by the place of the generation and activity of the economic fact during the 2003-2007 terms, by using the financial statements approximately 40,000 taxpayers.
To do this, two panel models are proposed, based on a variant of the estimation technique for the total productivity of factors, which
TOPIC 2.1 (Ecuador)
22
incorporates the approach of omitted variable and measurement error by stochastic frontier in the tax return. Both models aim to estimate the evasion gap and analyze its sensitivity, since the great uncertainty surrounding the measurement of the non-observable component makes this process necessary (Aguiar and Castro, 2009)
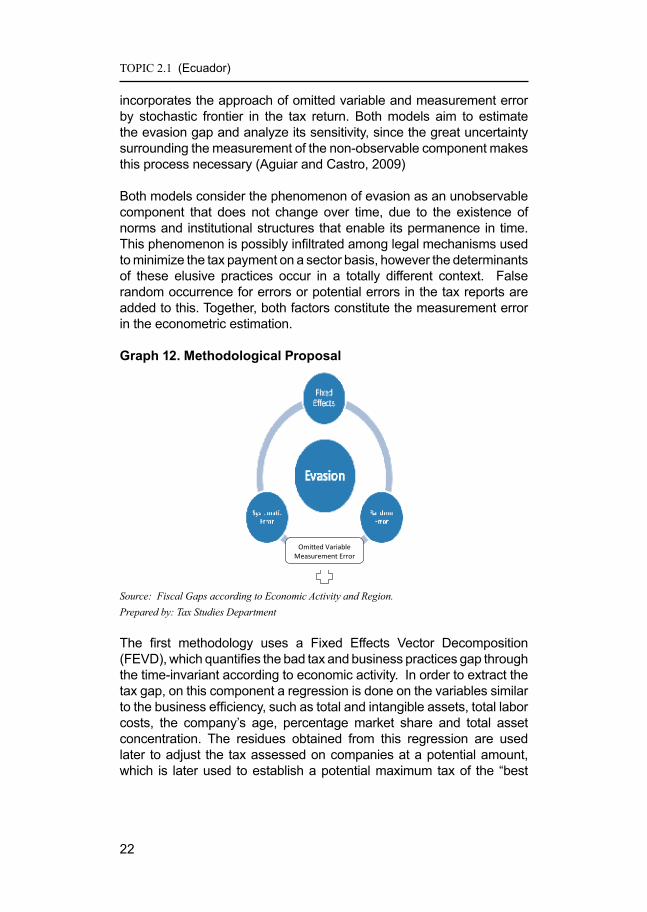
Both models consider the phenomenon of evasion as an unobservable component that does not change over time, due to the existence of norms and institutional structures that enable its permanence in time. This phenomenon is possibly infiltrated among legal mechanisms used to minimize the tax payment on a sector basis, however the determinants of these elusive practices occur in a totally different context. False random occurrence for errors or potential errors in the tax reports are added to this. Together, both factors constitute the measurement error in the econometric estimation.
Graph 12. methodological Proposal
Omitted Variable Measurement Error
Source: Fiscal Gaps according to Economic Activity and Region.Prepared by: Tax Studies Department
The first methodology uses a Fixed Effects Vector Decomposition (FEVD), which quantifies the bad tax and business practices gap through the time-invariant according to economic activity. In order to extract the tax gap, on this component a regression is done on the variables similar to the business efficiency, such as total and intangible assets, total labor costs, the company’s age, percentage market share and total asset concentration. The residues obtained from this regression are used later to adjust the tax assessed on companies at a potential amount, which is later used to establish a potential maximum tax of the “best
TOPIC 2.1 (Ecuador)
23
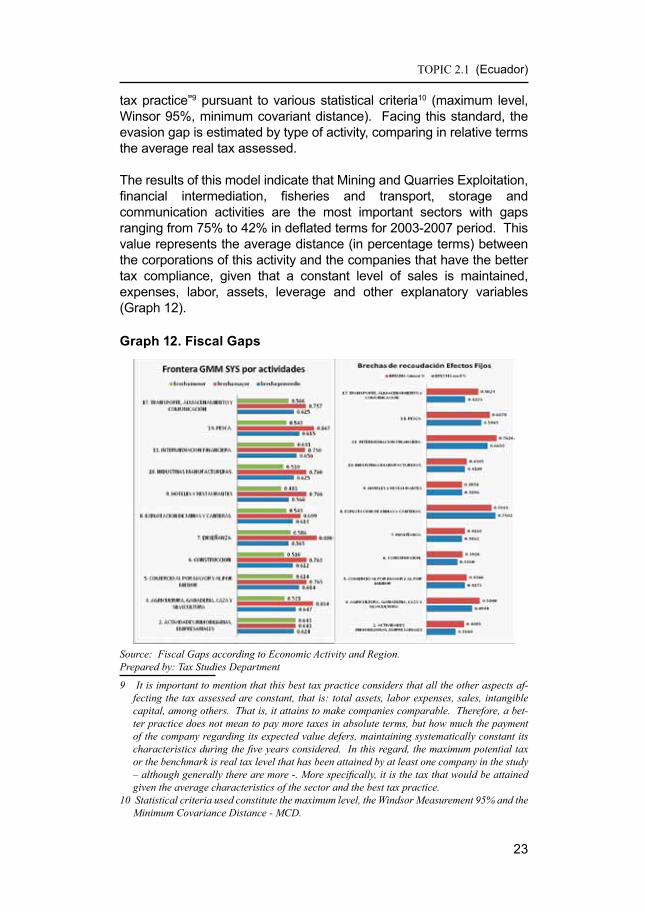
tax practice”9 pursuant to various statistical criteria10 (maximum level, Winsor 95%, minimum covariant distance). Facing this standard, the evasion gap is estimated by type of activity, comparing in relative terms the average real tax assessed.
The results of this model indicate that Mining and Quarries Exploitation, financial intermediation, fisheries and transport, storage and communication activities are the most important sectors with gaps ranging from 75% to 42% in deflated terms for 2003-2007 period. This value represents the average distance (in percentage terms) between the corporations of this activity and the companies that have the better tax compliance, given that a constant level of sales is maintained, expenses, labor, assets, leverage and other explanatory variables (Graph 12).
Graph 12. fiscal Gaps
Source: Fiscal Gaps according to Economic Activity and Region.Prepared by: Tax Studies Department
9 It is important to mention that this best tax practice considers that all the other aspects af-fecting the tax assessed are constant, that is: total assets, labor expenses, sales, intangible capital, among others. That is, it attains to make companies comparable. Therefore, a bet-ter practice does not mean to pay more taxes in absolute terms, but how much the payment of the company regarding its expected value defers, maintaining systematically constant its characteristics during the five years considered. In this regard, the maximum potential tax or the benchmark is real tax level that has been attained by at least one company in the study – although generally there are more -. More specifically, it is the tax that would be attained given the average characteristics of the sector and the best tax practice.
10 Statistical criteria used constitute the maximum level, the Windsor Measurement 95% and the Minimum Covariance Distance - MCD.
TOPIC 2.1 (Ecuador)
24
The second model consists of a Generalized Moments Model System (GMM-SYS), which incorporates more complex elements of statistical theory (instruments in delays and differences) to the specification of the previous model to correct measurement errors, concurrency11 in the estimation of tax determinants.
This tax expected from this model is divided for the one obtained by Minimum Ordinary Squares (MCO, in Spanish), taking the resulting coefficients as a proxy for poor tax practices.
The logic of this process is that if there is a systematic measurement error in the signatures log balances, the predicted value of the corrected model will provide a good approximation of the actual value, and therefore any difference on this (as compared to the estimate by MCO) will determine the unobserved fiscal gap.
On these coefficients, the procedure is the same as in the previous model to obtain the tax gap by type of activity, establishing the potential maximum tax of the “best tax practice” in each sector.
This alternative form of estimation does not change the results significantly at sector level, thus demonstrating the strength of the same, at least for the sectors with higher tax gap. In general, the results again displayed a fairly stable average gap for the four sectors with greater gap estimated in the FEVD model.
However, it is important to highlight that construction activities, are situated at a higher level of evasion 50% than that previously estimated of 33% (Graph 12).
3. dIssemInatIon and actIons undertaKen to fIGht evasIon
3.1. Actions to fight evasion, contraband and informality
Once reviewed the quantitative tools to measure the evasion, it is important to analyze the use given to the quantification of evasion in the formulation of tax policy and improving the management of internal revenue service – SRI, in Spanish-, aimed at combating tax fraud.
11 Concurrency is an endogenous problem that occurs when one or more of the explanation variables is determined jointly with the dependent variable, through an equilibrium mecha-nism.
TOPIC 2.1 (Ecuador)
25
The estimate of the evasion gap was done jointly between the Tax Studies Department and SRI’s National Directorate of Tax Management. The estimation methodology was laid-out and discussed in different technical institutions, such as the Central Bank of Ecuador and private trade unions, such as chambers of commerce, industry and construction.
In September 2007, the Ecuadorian Tax Administration unveiled the gap evasion for Ecuador, the figure reached US$ 2.4 billion; 61.3% in income tax collection and 31% in VAT, and these figures were published in various media outlets.
“The director of the SRI reported annual tax evasion reaches approximately US$ 2.4 billion.” Tax evasion in different sectors is: primary production 96%, financial intermediation 82%, industry 66%, food 65.6%, mail and telecommunications 53%, extraction and oil refining 44% and trade 26.82%.” (Diario del norte, page 12, 2007)
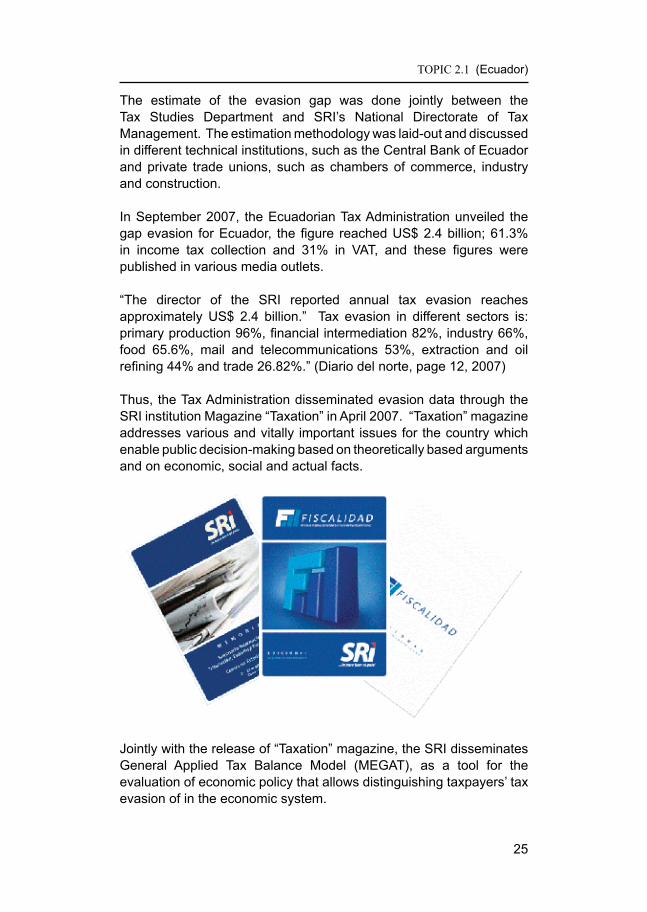
Thus, the Tax Administration disseminated evasion data through the SRI institution Magazine “Taxation” in April 2007. “Taxation” magazine addresses various and vitally important issues for the country which enable public decision-making based on theoretically based arguments and on economic, social and actual facts.
Jointly with the release of “Taxation” magazine, the SRI disseminates General Applied Tax Balance Model (MEGAT), as a tool for the evaluation of economic policy that allows distinguishing taxpayers’ tax evasion of in the economic system.
TOPIC 2.1 (Ecuador)
26
In July 2008 the Inter-American Center of Tax Administrations (CIAT), together with the SRI organized the “International Taxation, Evasion and Decentralization Seminar” in Ecuador, which discussed the methodologies for the calculation of evasion and possible mechanisms for combating tax fraud.
3.2 strategies
3.2.1 tax reform
One of the main objectives which motivated the tax reform “Tax Equity Act” was the reduction of tax evasion, increase the taxpayer base and strengthen tax control.
3.2.2 creation of a Large taxpayer department
To lower tax evasion, the Tax Administration created the Large Taxpayers Control unit. For October 2008, the tax administration exceeded their tax goals among other things, for greater tax evasion control, especially Large Taxpayers.
3.2.3 focused tax assessments
In October 2007 the Tax Administration announced that the construction sector had a 96% gap of evasion. From this estimate, SRI determined glosses for about $ 111.1 million to this sector.
TOPIC 2.1 (Ecuador)
27
Furthermore, during the 2007 - 2009 periods the Special and Large Taxpayers of the transportation, telecommunications, oil, agro-industry and industry sectors were audited and this generated a total debt of US$ 315 million.
3.2.4. Reduction of Informality through Simplified Tax Systems
In August 2008, the Internal Revenue Service presented the Ecuadorian Simplified Taxation Regime (RISE, in Spanish), which replaces the payment of the Value Added Tax (VAT) and the Income Tax (IT), through monthly quotas provided for by law.
In this manner the Tax Administration seeks to facilitate payment by small and medium size businesses to fight evasion and economic informality.
3.2.5 Promote tax culture
The low tax culture is one of the factors causing tax evasion. Therefore, SRI defined strategies to change tax culture in the country and develop the concept of “tax citizenship”. This concept is understood as the commitment of individuals with society, to exercise the correct and ethical use of their rights and fiscal obligations based on the trust of fair and transparent public spending as well as the reciprocity of the participating public agencies
In this context, the Internal Revenue Service declared the 28 April “Tax Culture Day.”
3.2.6 Implement the statement of assets and Liabilities for Bodies corporate
One of the mechanisms for combating the evasion and controlling individuals was the implementation of the statement of assets and liabilities to estimate the different incomes of the taxpayers. This information is confidential in the Tax Administration.
3.2.7 Promote Billing
In order to prevent tax traps and false invoices, the Tax Administration made changes to the invoices emission authorization process.
Thus, the “1-800 Factura” (1-800 invoice) program was created to
TOPIC 2.1 (Ecuador)
28
address citizens complaints for the non-delivery of sales vouchers, mainly in the health, housing and real estate lease sectors
3.2.8 Generate risk
With the purpose of generating risk in the productive sectors and reduce default caused by lack of information or a wrong advice, workshops were organized where the concerns and interests of economic sectors were addressed.
The following were among the topics presented: the omission of income, the economic fact, expenses without livelihoods, the treatment of remunerations, the depreciation of fixed assets, bad accounts provisions, amortization of deferred assets, refunds and “gross up”, under capitalization, commercial leasing, low inventory, fixed assets, casualties tax reconciliation, transfer pricing and estimated assessment.
Furthermore, the procedures to be followed by taxpayers in accordance with tax legislation and the tax control process of the Internal Revenue Service were explained.
In addition, the procedures to be followed in accordance with tax legislation and the process of the Inland Revenue Service tax control taxpayers were explained.
These workshops were done with the participation of different trade unions, such as: Industrial Chambers, Chambers of Commerce, Accountants Associations and the Office of the Comptroller General
TOPIC 2.1 (Ecuador)
29
4. BIBLIoGraPhy
1. Fenocietto, Ricardo (1999). “Métodos de estimación de la evasión impositiva y de la economía informal”. AFIP Magazine, No. 18. Buenos Aires, January.
2. Aguiar, Victor (2009). “Brechas Fiscales por Actividad Económica y por Regional”. Tax Studies Center.
3. Aquino, M. 2008. La Evasión Fiscal: origen y Medidas de Acción para Combatirla. Work Documents. Tax Studies Institute, Spain.
4. Author: Miguel Ángel Aquino
5. INEC (2009). “User Satisfaction Survey of the SRI”. Tax Studies Center.
6. Andino, Mauro & Parra, Juan Carlos (2008). “Estimación de la Brecha de Recaudación del IVA e Impuesto a la Renta de las Sociedades por Industria”. Taxation Magazine No1. Tax Studies Center.
7. Ramirez, Jose (2007). “Modelo de Equilibrio General Aplicado Tributaria”. Tax Studies Center.
8. Cardona, H., L., Agudelo y M., López. 2007. “Los Métodos para Medir la Evasión de Impuestos: una Revisión”. Economic Bi-yearly Magazine. Pages 67-85
9. Chistian Aid Fundation.2005. “The shirts off their Backs: How tax policies fleece the poor”
10. Cosulich, J., 1993. “La Evasión Tributaria: Proyecto Regional de Política Fiscal CEPAL-PNUD”
11. Jorratt, M., 2003. “Los instrumentos para la medición de la Evasión Tributaria”. ECLAC
12. ___. 1996. “Evaluation of the collection capability of the tax system and of tax evasion”, Internal Revenue Service. Chile.
13. Martens, J. 2007. “The Precarious State of Public Finance”.
14. Murphy R., J.Christensen and S., Kapoor. 2007. “Closing the Floodgates: Collecting tax to pay for development”. Tax Justice Network
TOPIC 2.1 (Ecuador)
30
15. Ugalde, R. y J. García. 2007. “Elusión, Planificación y Evasión Tributaria”, LexisNexis, Second Edition .Chile
16. Sevilla, J., 2005. “Política y Técnica Tributaria”. Tax Studies Institute. Treasury Manuals.
17. Trujillo, J. 1998. “La Experiencia chilena en el combate a la Evasión, Curso Seminario Políticas Públicas: transparencia en su Gestión”, Internal Revenue Service.
18. Tacchi, C. 1993. ”The Concept of Tax Avoidance and Evasion and its Effects on the Application of the Tax System”, CIAT Conference.
19. Villegas, H. G., Arguello y R., Spila. 2005. ”La evasión fiscal en la Argentina”, Fiscal Law, Bs., Arg., T. XXIII, page 337.
20. Prats., J. I Macías-Aymar, 2008. “El Pacto Fiscal en los Andes”. Taxation Magazine No 2. pages 11-58
21. Portes., A. y W. Haller. 2004. “La economía informal”. ECLAC. Social Policies Series.