Embed Size (px)
Citation preview
Insurance Corporation of British Columbia
2016/17 ANNUAL SERVICE PLAN REPORT
For more information on the Insurance Corporation of British Columbia contact:
In the Lower Mainland 604-661-2800
Elsewhere in B.C., Canada, or the U.S. 1-800-663-3051
Head Office
151 West Esplanade North Vancouver, British Columbia, V7M 3H9
icbc.com
Email address: icbc.com/contact-us
ICBC’s Corporate Service Plans, Annual Reports and Financial reports are available on the ICBC website.
Insurance Corporation of British Columbia
2016/17 Annual Service Plan Report 3
Board Chair’s Accountability StatementThe 2016/17 Annual Service Plan Report of the Insurance Corporation of British Columbia (ICBC) was prepared under my direction in accordance with the Budget Transparency and Accountability Act and the B.C. Reporting Principles.
The information presented in the ICBC 2016/17 Annual Service Plan Reportreflects the actual performance of ICBC for the 15 months ended March 31, 2017, in relation to the 2016/17-2018/19 Service Plan. The measures presented are consistent with ICBC’s mandate and corporate strategy, and focus on aspects critical to the organization’s performance. I am accountable for those
results as reported.
Sincerely,
Barry Penner, QC Chair of the Board of Directors
Insurance Corporation of British Columbia
2016/17 Annual Service Plan Report 4
Table of Contents
Board Chair’s Accountability Statement ................................................................................................ 3
Chair/CEO Report Letter ........................................................................................................................ 5
Purpose of the Organization .................................................................................................................... 7
Strategic Direction and Context .............................................................................................................. 8
Report on Performance ........................................................................................................................... 9
Goals, Strategies, Measures and Targets .......................................................................................... 10
Financial Report ................................................................................................................................ 20
Discussion of Results .................................................................................................................... 20
Financial Resource Summary Table ............................................................................................. 20
Management’s Responsibility for Financial Statements ................................................................... 32
Independent Auditor’s Report ........................................................................................................... 34
Actuary’s Report ............................................................................................................................... 35
Major Capital Projects ........................................................................................................................ 100
Appendix A: Nominee Companies ..................................................................................................... 101
Appendix B: Additional Information .................................................................................................. 103
Organizational Overview ................................................................................................................ 103
Corporate Governance .................................................................................................................... 103
Contact Information ........................................................................................................................ 103
Appendix C: Crown Corporation Mandate and Action Summary ...................................................... 104
Insurance Corporation of British Columbia
2016/17 Annual Service Plan Report 5
Chair/CEO Report LetterICBC works closely with government to deliver on products, services and initiatives that are important to British Columbians. As a Crown corporation, ICBC is bound by overall government expectations included in an annual Mandate Letter and the Taxpayer Accountability Principles, and is required to report out on its performance against those expectations.
ICBC and insurance providers across the industry are facing some very challenging times. This period, ICBC saw more crashes, more vehicle damage and injury claims, and higher repair costs than expected, which continued to put financial pressure on the corporation.
ICBC accomplished its 2016/17 Mandate Letter requirements and complied with government direction regarding the capital management frameworks for Basic and Optional insurance and continues to work with government to meet financial targets and reporting requirements.
To help mitigate the impacts of the increased claims costs, the Minister of Transportation and Infrastructure directed the ICBC Board of Directors to commission a comprehensive independent review of the affordability and sustainability of Basic insurance rates. This review will help ICBC identify key factors impacting Basic insurance rates and provide a broad range of options available to keep Basic rates as affordable as possible. The review will be based on the principles of maintaining public ownership of ICBC and operating under the current model. A preliminary report is anticipated to be provided to the Board by June 30th.
While ICBC continues to look for ways to reduce the impact of claims pressures, work is also progressing to improve products and services for customers. 2016/17 marked the completion of the multi-year Transformation Program with the launch of a new policy administration system for brokers to sell and ICBC employees to service Autoplan insurance. Now fully completed, the Transformation Program has enabled ICBC to improve its customer service and develop better, quicker and more efficient administrative processes. Overall, the Transformation Program is forecasted to provide annual savings of approximately $90 million to ICBC – savings which are long-term and ongoing.
Other initiatives include stepping up efforts to combat fraud, continuing the fight against distracted driving, and modernizing ICBC’s professional services procurement process. In 2016/17, government and ICBC announced a new windshield repair program, which improves services to customers while also reducing costs, and also announced changes to the way ICBC insures luxury vehicles.
Maintaining high customer satisfaction levels for Insurance Services, Claims Services and Driver Licensing remains a strong focus for the Corporation. Work continued, using a variety of mediums, on a service strategy for customers, which included digital initiatives. In 2016/17, ICBC released a new customer claims portal. The online claims service enhances customers’ ability to report their claims through icbc.com. Claims submitted online are saved directly into ICBC’s claims system to further increase claims handling efficiency; customers can also now check the status of their claim online in addition to contacting our call centre.
Placing value on its partnerships, ICBC continued to work with its partners to enhance business processes that help improve the delivery of products and services for customers. This included
Insurance Corporation of British Columbia
2016/17 Annual Service Plan Report 6
working with government and police to support B.C.’s new, stronger penalties for distracted driving and work on various road safety campaigns. ICBC continued its collaboration with government in implementing a number of shared priority projects, including supporting BC Transplant’s organ donation registration program and a new B.C. parks licence plate offering. In 2016/17, ICBC also continued to assist with the BC Services Card initiative.
ICBC, with government, has established an active communication structure to promote further accountability for outcomes and measures. In addition to frequent scheduled and ad hoc meetings between the Minister and the ICBC Chair and CEO, representatives from the Corporation participate in regularly scheduled meetings with senior Ministry of Transportation and Infrastructure officials, contribute to the Shared Priorities Management Committee, and attend other operational meetings as scheduled.
Our Board of Directors continued to receive ongoing education and evaluation opportunities intended to expand their individual and collective understanding of ICBC and their role in overseeing its operations. This included a number of presentations to the Board of Directors by ICBC staff. Members of the ICBC Board of Directors also attended the Public Sector Board Governance Professional Development Forum in December 2016, organized by the Crown Agency Resource Office. Topics within this full day session included discussion of best practices in strategic planning and effective stakeholder engagement. In addition, an annual review of Board effectiveness undertaken by its Governance Committee resulted in new directions to staff to enhance the quality of the orientation program for new Directors and improve the effectiveness of Board meetings. The directions focused on opportunities to enhance the presentation and delivery of key information to the Board.
As part of our commitment to fiscal responsibility and to ensure the best possible use of government resources, ICBC will continue to work with government to meet all objectives set out by government in the Mandate Letter and Taxpayer Accountability Principles.
Sincerely,
Barry Penner, QCChair of the Board of Directors
Mark BlucherPresident and Chief Executive Officer
Insurance Corporation of British Columbia
2016/17 Annual Service Plan Report 7
Purpose of the Organization The Insurance Corporation of British Columbia (ICBC) is a provincial Crown corporation mandated by the Insurance Corporation Act, Insurance (Vehicle) Act and the Motor Vehicle Act to provide universal compulsory auto insurance (Basic insurance) to drivers in British Columbia (B.C.), with rates regulated by the British Columbia Utilities Commission (BCUC).
ICBC is committed to providing customers with the best insurance coverage at the lowest possible cost. Similar to other vehicle owners across Canada, motorists in B.C. are required by law to purchase a minimum level of Basic vehicle insurance. This provides private passenger and certain commercial vehicle owners with third-party liability protection, underinsured motorist protection, and coverage for medical and rehabilitation costs. B.C.’s coverage is among the most comprehensive in the country.
In addition to providing Basic vehicle insurance, ICBC offers various Optional vehicle insurance coverages, including extended third-party liability, collision, comprehensive and vehicle storage.
ICBC is one of B.C.’s largest corporations and one of Canada’s largest property and casualty insurers. Our insurance products and services are available through a province-wide network of approximately 900 independent brokers, government agents and appointed agents. Each year, ICBC processesapproximately 900,000 claims through a 24-hour, seven-days-a-week telephone claims handling facility and online claims reporting. ICBC continues to have a presence in communities across the province and works with material damage suppliers (e.g. collision and glass repair shops) and healthcare professionals to help customers after a crash.
In addition to providing insurance products and services, ICBC also provides a number of non-insurance services on behalf of the provincial government, including vehicle registration and licensing, driver licensing, and fines collection. ICBC also assists with the BC Services Card initiative and as a partner on various road safety campaigns and initiatives. ICBC operates as an integrated company for the benefit of our customers and partners with businesses and organizations in communities across B.C. to deliver services and programs. Autoplan brokers are key business partners, distributing our insurance products and providing other services such as vehicle registration and licensing. ICBC delivers services in partnership with a broad base of suppliers in the automotive industry. Law enforcement agencies, health services providers, lawyers and community organizations are among ICBC’s other key partners.
ICBC does not have any active operating subsidiary companies. ICBC has 57 nominee holding companies, which hold investment properties for the purpose of generating investment income. ICBC has disclosed a listing of all of its nominee holding companies in Appendix A.
Insurance Corporation of British Columbia
2016/17 Annual Service Plan Report 8
Strategic Direction and Context In 2016/17, ICBC complied with the performance expectations outlined in the 2016/17 Mandate Letter and in the Taxpayer Accountability Principles.
Public sector organizations have a responsibility to operate as efficiently as possible in order to ensure British Columbians are provided with services at the lowest cost possible. As per the priorities identified in the 2016/17 Mandate Letter, ICBC continues to find efficiencies through operational excellence and operates with a corporate strategy focused on being a low-cost company that provides consistent, quality service to its customers, ensuring high customer satisfaction levels.
ICBC is always working to respond to the changing needs of customers, providing them enhanced service in their communities, in ways they value. This includes increasing access to online services and improving the quality, consistency and timeliness of claims handling.
The increasing number of crashes has led to more claims. As this is happening, material damage costs are rising. Vehicles today are more reliant on embedded technology and expensive materials than ever before. As a result, the hours of labour required to repair vehicles and the cost of replacement parts are increasing, particularly for newer vehicles. This, in addition to the increased frequency of bodily injury claims and the number of injury claims per crash, as well as the increase in legally represented claims, has added significant claims costs.
In 2016/17 ICBC continued to identify and implement new initiatives to help alleviate the pressure that rising claims costs continue to put on insurance rates. These initiatives include stepping up efforts to combat fraud, continuing the fight against distracted driving through two month-long awareness and advertisement campaigns, and modernizing ICBC’s professional services procurement process toensure the best value for customers. Most recently, ICBC also made changes to the way it insures luxury vehicles and has launched a new windshield repair program, which improves services to customers while also reducing costs.
In addition, the Minister of Transportation and Infrastructure directed the ICBC Board of Directors to commission a comprehensive independent review of ICBC. This review will help ICBC identify key factors impacting Basic insurance rates and provide a broad range of options available to help ensure rates are affordable for British Columbians.
Investment returns have historically been a strong and consistent contributor to ICBC’s financial health, helping to offset the pressure on rates from rising claims costs. In recent years, due to ongoing lower interest rates in Canada, the extent to which investment income is able to support insurance rates has been decreasing, a reality shared by insurance providers across the country. While the current investment portfolio continues to perform well, exceeding industry benchmarks, ICBC cannot rely upon investment returns to help offset claims costs to the same extent experienced in the past due to the low interest environment.
Typical of other property and casualty insurance companies, ICBC faces other financial and non-financial risks such as changing demographics, increasing sophistication of cyber security threats, natural catastrophes, volatility in investment markets and global uncertainty, all of which we continue to monitor.
Insurance Corporation of British Columbia
2016/17 Annual Service Plan Report 9
Report on PerformanceAs a Crown corporation, ICBC continually works to align with government goals and objectives. ICBC fulfilled the expectations outlined in the 2016/17 Mandate Letter (see Appendix C) to which the Corporation must adhere and ensured alignment to the Taxpayer Accountability Principles and its embedded action plan.
Despite ever-increasing challenges in its business environment, ICBC remains committed to providing customers with the best insurance coverage at the lowest possible cost. To support this, the corporate strategy focuses on four key goals: improve value and service for customers, maintain financial stability, focused operational excellence and aligned people and business capabilities.
In alignment with government direction, ICBC recognizes the Taxpayer Accountability Principles, and its embedded action plan, as an overarching government priority and has incorporated the values of cost consciousness (efficiency), accountability, appropriate compensation, service, respect and integrity into the corporate strategy.
ICBC’s commitment to cost consciousness (efficiency) is demonstrated in ICBC’s Operational Excellence program. Implementing management practices that facilitate performance focus, negotiating existing contracts, and leveraging technology and automation to reduce human effort under the Operational Excellence mandate improved the way ICBC delivers services to customers, achieved key business objectives, and managed controllable operating cost pressures in 2016.
ICBC continually evaluates its performance against the measures set out in the Taxpayer Accountability Principles. Establishing a feedback mechanism between ICBC and the Ministry of Transportation and Infrastructure continues to be a focus, as demonstrated through the establishment of monthly meetings and active collaboration on government-driven initiatives.
Insurance Corporation of British Columbia
2016/17 Annual Service Plan Report 10
Goals, Strategies, Measures and TargetsTo assess progress against our goals, ICBC relies on a number of financial and non-financial corporate performance measures. ICBC uses both International Financial Reporting Standards (IFRS) and non-IFRS measures to assess performance. Non-IFRS measures do not have standardized meanings prescribed by IFRS and therefore may not be comparable to similar measures used by other companies in the industry. Where possible, ICBC uses standard industry measures that enable benchmarking with other insurers. Where external sources of data are used, the most current available information is included in this report. In other cases, because of ICBC’s unique business model, itdevelops distinct measures relevant to the area of performance.
ICBC has changed its fiscal year-end date from December 31 to March 31 to align with its shareholder, the Province of B.C.’s fiscal year-end date. This change was effective immediately after the fiscal calendar year ended December 31, 2015. As a result of this change, 2016/17 is a 15 month transitional fiscal period from January 1, 2016 to March 31, 2017 (2016/17), with comparative financial information for the 12 months ended December 31, 2015. For 2017/18 and thereafter, ICBC’s fiscal year will be the 12 month period from April 1 to March 31. Unless otherwise noted, the financial targets and corporate performance metrics reflect this change.
The data used in the calculation of performance results are derived from the Corporation’s financial and operating systems. Management is responsible for ensuring appropriate controls over the financial systems and are regularly reviewing these to ensure they are operating effectively.
Goal 1: Improve Value and Service for CustomersICBC is supporting government’s strategic priorities of a strong economy and a secure tomorrow. Our Corporate Strategy is focused on being a low-cost and operationally excellent company that provides value to our customers by keeping rates as low as possible and delivering consistent quality service. This goal is critical to our strategy and also aligns to the Taxpayer Accountability Principles of cost consciousness and service.
In 2016/17, ICBC focused on providing consistent, quality products and services to our customers, and addressed business needs by cost-effectively serving customers in ways that were convenient for them. In 2016/17, ICBC launched enhanced online claims reporting to help improve customer experience. The portal expands customers’ ability to report and track the status of their claims through icbc.com. Claims submitted online are saved directly into ICBC’s claims system to further increase claims handling efficiency.
A key priority for ICBC is to help reduce injury and death on B.C. roads, which is why we invest in road safety initiatives and partner with the Province of B.C. and police on various awareness and enforcement campaigns each year. In 2016/17, government renewed its focus on distracted driving by introducing tougher distracted driving penalties. ICBC is committed to raising awareness about the risks, consequences and penalties associated with distracted driving. This clear focus on positive outcomes for British Columbians aligns with the Taxpayer Accountability Principles of service and respect.
Strategies Keep rates as low as possible while moderating rate fluctuations.Improve quality, consistency and timeliness of claims handling.
Insurance Corporation of British Columbia
2016/17 Annual Service Plan Report 11
Increase online services.
Performance Measure 1.1: Insurance Services Satisfaction
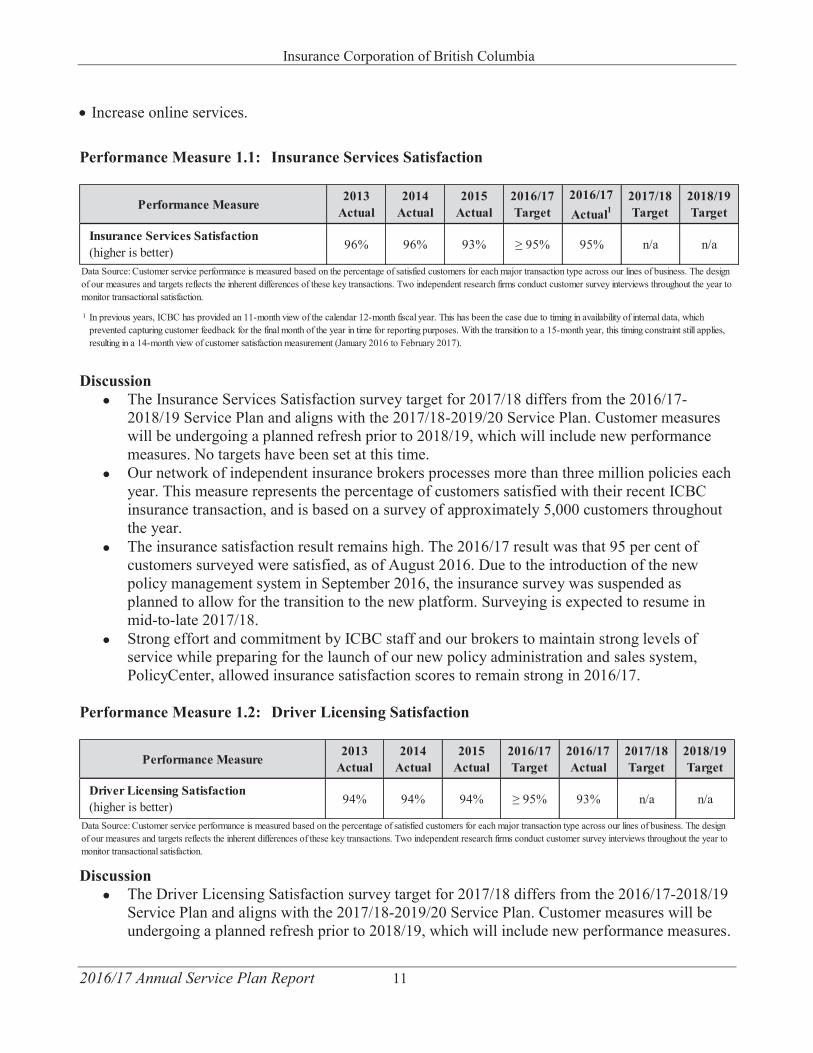
Discussion The Insurance Services Satisfaction survey target for 2017/18 differs from the 2016/17-2018/19 Service Plan and aligns with the 2017/18-2019/20 Service Plan. Customer measureswill be undergoing a planned refresh prior to 2018/19, which will include new performancemeasures. No targets have been set at this time.Our network of independent insurance brokers processes more than three million policies eachyear. This measure represents the percentage of customers satisfied with their recent ICBCinsurance transaction, and is based on a survey of approximately 5,000 customers throughoutthe year.The insurance satisfaction result remains high. The 2016/17 result was that 95 per cent ofcustomers surveyed were satisfied, as of August 2016. Due to the introduction of the newpolicy management system in September 2016, the insurance survey was suspended asplanned to allow for the transition to the new platform. Surveying is expected to resume inmid-to-late 2017/18.Strong effort and commitment by ICBC staff and our brokers to maintain strong levels ofservice while preparing for the launch of our new policy administration and sales system,PolicyCenter, allowed insurance satisfaction scores to remain strong in 2016/17.
Performance Measure 1.2: Driver Licensing Satisfaction
Discussion The Driver Licensing Satisfaction survey target for 2017/18 differs from the 2016/17-2018/19Service Plan and aligns with the 2017/18-2019/20 Service Plan. Customer measures will beundergoing a planned refresh prior to 2018/19, which will include new performance measures.
96% 96% 93% ≥ 95% 95% n/a n/a
1
Data Source: Customer service performance is measured based on the percentage of satisfied customers for each major transaction type across our lines of business. The design of our measures and targets reflects the inherent differences of these key transactions. Two independent research firms conduct customer survey interviews throughout the year to monitor transactional satisfaction.
2016/17Target
2016/17Actual1
2017/18Target
2018/19Target
Insurance Services Satisfaction (higher is better)
Performance Measure2013
Actual2014
Actual2015
Actual
In previous years, ICBC has provided an 11-month view of the calendar 12-month fiscal year. This has been the case due to timing in availability of internal data, which prevented capturing customer feedback for the final month of the year in time for reporting purposes. With the transition to a 15-month year, this timing constraint still applies, resulting in a 14-month view of customer satisfaction measurement (January 2016 to February 2017).
94% 94% 94% ≥ 95% 93% n/a n/a
Performance Measure2013
Actual2014
Actual2015
Actual2016/17Target
2016/17Actual
Data Source: Customer service performance is measured based on the percentage of satisfied customers for each major transaction type across our lines of business. The design of our measures and targets reflects the inherent differences of these key transactions. Two independent research firms conduct customer survey interviews throughout the year to monitor transactional satisfaction.
2017/18Target
2018/19Target
Driver Licensing Satisfaction(higher is better)
Insurance Corporation of British Columbia
2016/17 Annual Service Plan Report 12
No targets have been set at this time. ICBC conducts approximately 1.6 million driver licence related transactions each year. Thismeasure is based on a random sample of over 3,000 customers surveyed throughout the yearand represents the percentage of customers satisfied with a recent driver licensing transaction.The 2016/17 result of 93 per cent is close to the target of 95 per cent or above and is consistentwith prior years' results, with the variance between the target and the actual result fallingwithin the margin of error. These strong scores have been maintained through continuousimprovements to service standards.
Performance Measure 1.3: Claims Services Satisfaction
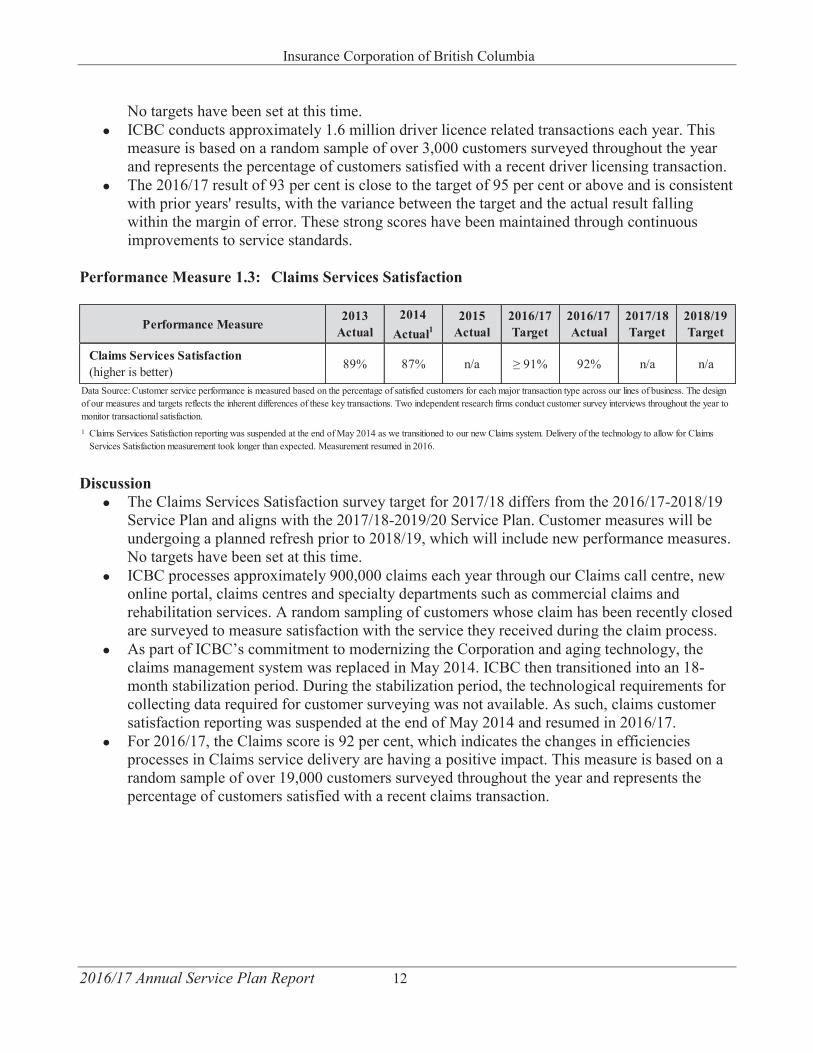
Discussion The Claims Services Satisfaction survey target for 2017/18 differs from the 2016/17-2018/19Service Plan and aligns with the 2017/18-2019/20 Service Plan. Customer measures will beundergoing a planned refresh prior to 2018/19, which will include new performance measures.No targets have been set at this time.ICBC processes approximately 900,000 claims each year through our Claims call centre, newonline portal, claims centres and specialty departments such as commercial claims andrehabilitation services. A random sampling of customers whose claim has been recently closedare surveyed to measure satisfaction with the service they received during the claim process.As part of ICBC’s commitment to modernizing the Corporation and aging technology, theclaims management system was replaced in May 2014. ICBC then transitioned into an 18-month stabilization period. During the stabilization period, the technological requirements forcollecting data required for customer surveying was not available. As such, claims customersatisfaction reporting was suspended at the end of May 2014 and resumed in 2016/17.For 2016/17, the Claims score is 92 per cent, which indicates the changes in efficienciesprocesses in Claims service delivery are having a positive impact. This measure is based on arandom sample of over 19,000 customers surveyed throughout the year and represents thepercentage of customers satisfied with a recent claims transaction.
89% 87% n/a ≥ 91% 92% n/a n/a
1 Claims Services Satisfaction reporting was suspended at the end of May 2014 as we transitioned to our new Claims system. Delivery of the technology to allow for Claims Services Satisfaction measurement took longer than expected. Measurement resumed in 2016.
2015Actual
2016/17Target
2016/17Actual
2017/18Target
2018/19Target
Claims Services Satisfaction (higher is better)
Performance Measure2013
Actual2014
Actual1
Data Source: Customer service performance is measured based on the percentage of satisfied customers for each major transaction type across our lines of business. The design of our measures and targets reflects the inherent differences of these key transactions. Two independent research firms conduct customer survey interviews throughout the year to monitor transactional satisfaction.
Insurance Corporation of British Columbia
2016/17 Annual Service Plan Report 13
Goal 2: Maintain Financial Stability ICBC’s approach to business is driven by creating value for customers by operating in a disciplined and focused manner. ICBC continues to strive to be a low-cost operation focusing on accountability, operational excellence and cost control. To do this, ICBC must adapt to the challenges that face all property and casualty insurance companies, including increased bodily injury and material damage costs as well as a low interest rate environment.
Claims costs are the majority of ICBC’s costs, accounting for approximately $1.06 for every premium dollar collected in the 2016/17 period. The two main elements that have an impact on claims costs are severity (the average pay-out for a claim) and frequency (how many claims are made each year per a given number of policies).
Since late 2014, ICBC has observed a larger-than-anticipated increase in the overall number of claims, due to a higher-than-expected frequency of crashes. Managing the frequency trend is challenging as it is subject to driver behaviour, weather and other factors largely beyond ICBC’s control.
Basic insurance rates in B.C. have experienced on-going pressure from the increasing claims costs in recent years. Higher costs are being driven by an increasing number of crashes, with an upward trend that is higher than expected. This increase is resulting in a higher number of claims being reported and higher bodily injury and material damage (e.g. vehicle repair) costs. These trends are exacerbated by an increase in the number of legally represented claims as well as an increase in the number of large and complex claims being reported, which typically result in larger settlements.
Vehicle repair costs also continue to rise due to vehicle reliance on embedded technology. As a result, the hours of labour required to repair vehicles and the cost of replacement parts are increasing, particularly for newer vehicles.
Investment income has been a strong and consistent contributor to ICBC’s financial health, helping to offset the pressure on rates from rising claims costs. The current investment portfolio continues to perform well; however, in recent years due to ongoing lower interest rates in Canada, the extent to which investment income is able to support the insurance rates has been decreasing across the country and continues to put pressure on ICBC rates. In the current low-interest rate environment, ICBC cannot rely as heavily upon investment income to help offset claims costs as it did in the past.
ICBC is committed to moderating the increases in claims costs and has introduced initiatives to help mitigate costs. In 2016/17 ICBC increased front-line customer service by hiring additional staff to manage the increasing volume of claims, which resulted in claims cost improvements through the timely resolution of claims. This is in addition to improving customers’ access to benefits, including the medical treatments they need immediately after they report their claim.
ICBC also is stepping up efforts against exaggerated and fraudulent claims. Along with a public education campaign, ICBC is starting to use a new fraud analytics tool to help target fraudulent claims more quickly, therefore reducing how much we pay out on claims. In addition, ICBC announced a new windshield repair program, which improves services to customers while also reducing costs, and also announced changes to the way ICBC insures luxury vehicles. ICBC’s mitigation strategies are consistent with the 2016/17 Mandate Letter.
Strategies Manage increasing bodily injury and material damage claims costs.
Insurance Corporation of British Columbia
2016/17 Annual Service Plan Report 14
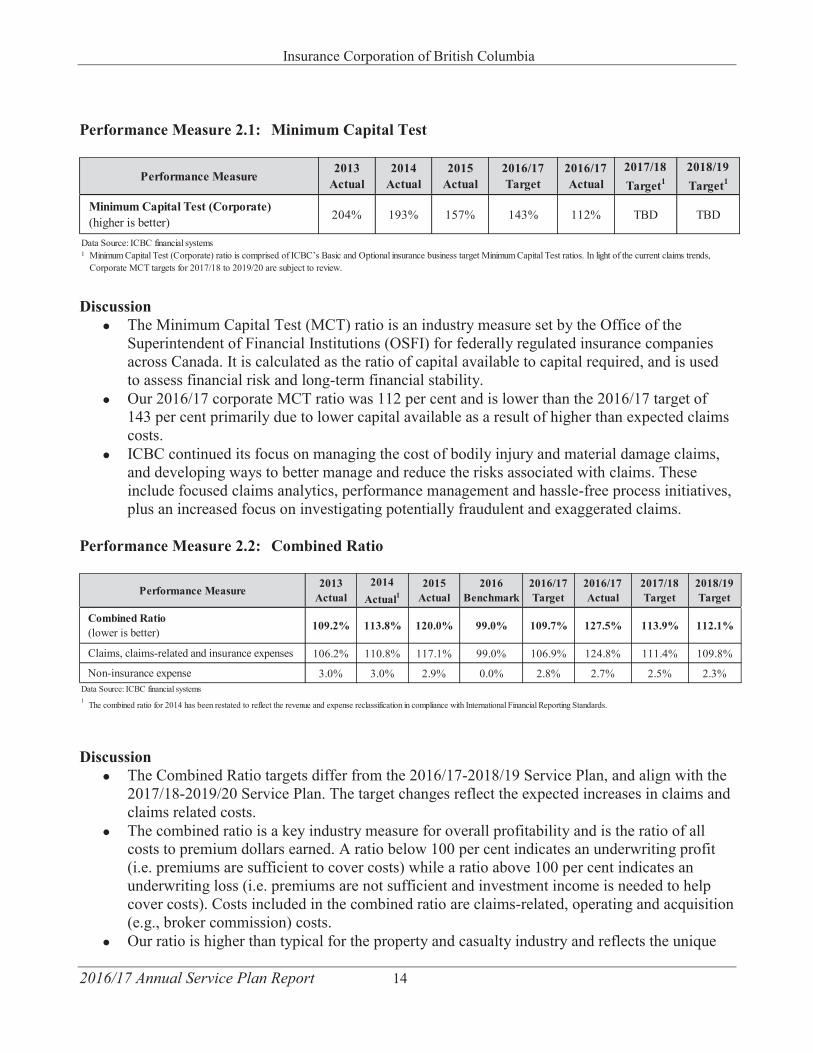
Performance Measure 2.1: Minimum Capital Test
Discussion The Minimum Capital Test (MCT) ratio is an industry measure set by the Office of theSuperintendent of Financial Institutions (OSFI) for federally regulated insurance companiesacross Canada. It is calculated as the ratio of capital available to capital required, and is usedto assess financial risk and long-term financial stability.Our 2016/17 corporate MCT ratio was 112 per cent and is lower than the 2016/17 target of143 per cent primarily due to lower capital available as a result of higher than expected claimscosts.ICBC continued its focus on managing the cost of bodily injury and material damage claims,and developing ways to better manage and reduce the risks associated with claims. Theseinclude focused claims analytics, performance management and hassle-free process initiatives,plus an increased focus on investigating potentially fraudulent and exaggerated claims.
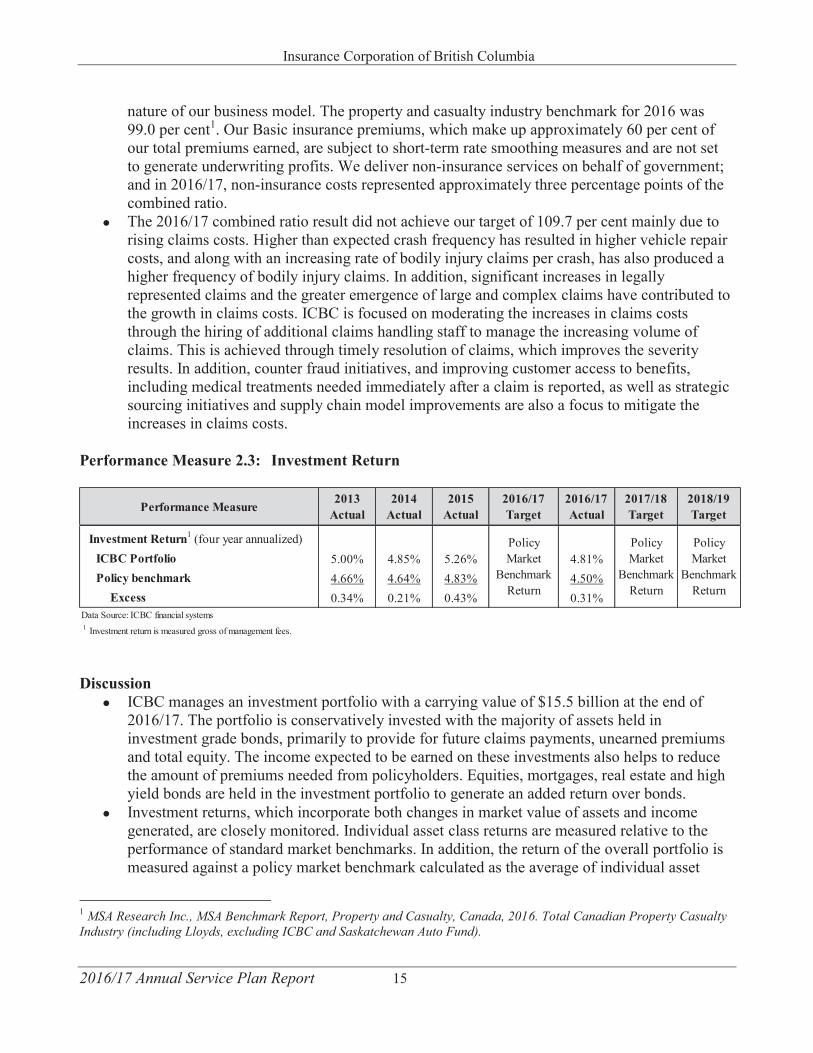
Performance Measure 2.2: Combined Ratio
Discussion The Combined Ratio targets differ from the 2016/17-2018/19 Service Plan, and align with the2017/18-2019/20 Service Plan. The target changes reflect the expected increases in claims andclaims related costs.The combined ratio is a key industry measure for overall profitability and is the ratio of allcosts to premium dollars earned. A ratio below 100 per cent indicates an underwriting profit(i.e. premiums are sufficient to cover costs) while a ratio above 100 per cent indicates anunderwriting loss (i.e. premiums are not sufficient and investment income is needed to helpcover costs). Costs included in the combined ratio are claims-related, operating and acquisition(e.g., broker commission) costs.Our ratio is higher than typical for the property and casualty industry and reflects the unique
204% 193% 157% 143% 112% TBD TBD
Data Source: ICBC financial systems1 Minimum Capital Test (Corporate) ratio is comprised of ICBC’s Basic and Optional insurance business target Minimum Capital Test ratios. In light of the current claims trends,
Corporate MCT targets for 2017/18 to 2019/20 are subject to review.
2018/19Target1
Minimum Capital Test (Corporate)(higher is better)
Performance Measure2013
Actual2014
Actual2015
Actual2016/17Target
2016/17Actual
2017/18Target1
109.2% 113.8% 120.0% 99.0% 109.7% 127.5% 113.9% 112.1%
106.2% 110.8% 117.1% 99.0% 106.9% 124.8% 111.4% 109.8%
3.0% 3.0% 2.9% 0.0% 2.8% 2.7% 2.5% 2.3%Data Source: ICBC financial systems1 The combined ratio for 2014 has been restated to reflect the revenue and expense reclassification in compliance with International Financial Reporting Standards.
2016/17Actual
2013Actual
2014Actual1
2015Actual
2017/18Target
2018/19Target
Combined Ratio (lower is better)
Claims, claims-related and insurance expenses
Non-insurance expense
Performance Measure2016
Benchmark2016/17Target
Insurance Corporation of British Columbia
2016/17 Annual Service Plan Report 15
nature of our business model. The property and casualty industry benchmark for 2016 was 99.0 per cent1. Our Basic insurance premiums, which make up approximately 60 per cent of our total premiums earned, are subject to short-term rate smoothing measures and are not set to generate underwriting profits. We deliver non-insurance services on behalf of government; and in 2016/17, non-insurance costs represented approximately three percentage points of the combined ratio. The 2016/17 combined ratio result did not achieve our target of 109.7 per cent mainly due torising claims costs. Higher than expected crash frequency has resulted in higher vehicle repaircosts, and along with an increasing rate of bodily injury claims per crash, has also produced ahigher frequency of bodily injury claims. In addition, significant increases in legallyrepresented claims and the greater emergence of large and complex claims have contributed tothe growth in claims costs. ICBC is focused on moderating the increases in claims coststhrough the hiring of additional claims handling staff to manage the increasing volume ofclaims. This is achieved through timely resolution of claims, which improves the severityresults. In addition, counter fraud initiatives, and improving customer access to benefits,including medical treatments needed immediately after a claim is reported, as well as strategicsourcing initiatives and supply chain model improvements are also a focus to mitigate theincreases in claims costs.
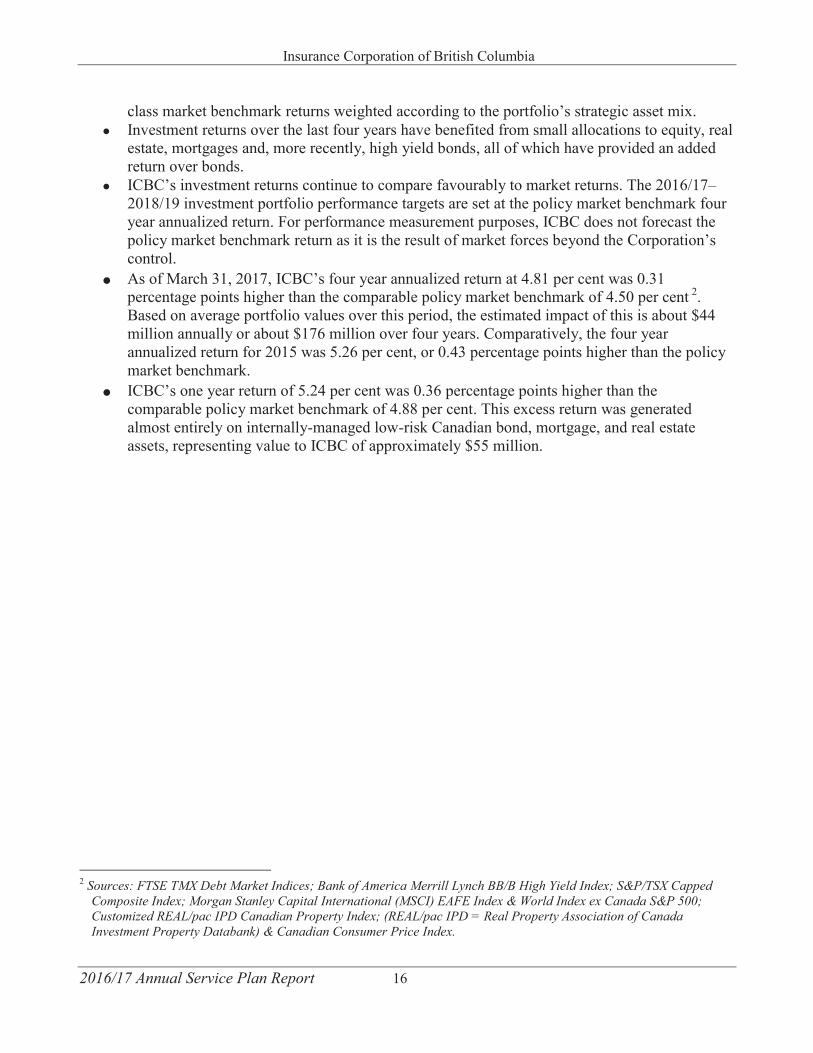
Performance Measure 2.3: Investment Return
Discussion ICBC manages an investment portfolio with a carrying value of $15.5 billion at the end of2016/17. The portfolio is conservatively invested with the majority of assets held ininvestment grade bonds, primarily to provide for future claims payments, unearned premiumsand total equity. The income expected to be earned on these investments also helps to reducethe amount of premiums needed from policyholders. Equities, mortgages, real estate and highyield bonds are held in the investment portfolio to generate an added return over bonds.Investment returns, which incorporate both changes in market value of assets and incomegenerated, are closely monitored. Individual asset class returns are measured relative to theperformance of standard market benchmarks. In addition, the return of the overall portfolio ismeasured against a policy market benchmark calculated as the average of individual asset
1 MSA Research Inc., MSA Benchmark Report, Property and Casualty, Canada, 2016. Total Canadian Property Casualty Industry (including Lloyds, excluding ICBC and Saskatchewan Auto Fund).
5.00% 4.85% 5.26% 4.81%4.66% 4.64% 4.83% 4.50%0.34% 0.21% 0.43% 0.31%
Data Source: ICBC financial systems1 Investment return is measured gross of management fees.
2018/19Target
2015Actual
2016/17Target
2016/17Actual
2017/18TargetPerformance Measure
2013Actual
2014Actual
Investment Return1 (four year annualized) Policy Market
Benchmark Return
Policy Market
Benchmark Return
Policy Market
Benchmark Return
ICBC PortfolioPolicy benchmark
Excess
Insurance Corporation of British Columbia
2016/17 Annual Service Plan Report 16
class market benchmark returns weighted according to the portfolio’s strategic asset mix. Investment returns over the last four years have benefited from small allocations to equity, realestate, mortgages and, more recently, high yield bonds, all of which have provided an addedreturn over bonds.ICBC’s investment returns continue to compare favourably to market returns. The 2016/17–2018/19 investment portfolio performance targets are set at the policy market benchmark fouryear annualized return. For performance measurement purposes, ICBC does not forecast thepolicy market benchmark return as it is the result of market forces beyond the Corporation’scontrol.As of March 31, 2017, ICBC’s four year annualized return at 4.81 per cent was 0.31percentage points higher than the comparable policy market benchmark of 4.50 per cent 2.Based on average portfolio values over this period, the estimated impact of this is about $44million annually or about $176 million over four years. Comparatively, the four yearannualized return for 2015 was 5.26 per cent, or 0.43 percentage points higher than the policymarket benchmark.ICBC’s one year return of 5.24 per cent was 0.36 percentage points higher than thecomparable policy market benchmark of 4.88 per cent. This excess return was generatedalmost entirely on internally-managed low-risk Canadian bond, mortgage, and real estateassets, representing value to ICBC of approximately $55 million.
2 Sources: FTSE TMX Debt Market Indices; Bank of America Merrill Lynch BB/B High Yield Index; S&P/TSX Capped Composite Index; Morgan Stanley Capital International (MSCI) EAFE Index & World Index ex Canada S&P 500; Customized REAL/pac IPD Canadian Property Index; (REAL/pac IPD = Real Property Association of Canada Investment Property Databank) & Canadian Consumer Price Index.
Insurance Corporation of British Columbia
2016/17 Annual Service Plan Report 17
Goal 3: Focused Operational Excellence Providing customers with the best insurance coverage at the lowest possible cost requires us to operate the corporation in a low-cost manner. This means actively controlling spending, avoiding unnecessary costs and improving our ability to deliver a consistent, quality experience and value for our customers.
To help leverage our Transformation Program investment, ICBC has introduced operating methodology to support focused Operational Excellence. Operational Excellence is ICBC’s philosophy of leadership, teamwork and problem solving that focuses on our customer needs, empowering our employees and optimizing existing activities so that we, as an organization, operate more efficiently and avoid unnecessary costs.
In 2016/17, Operational Excellence tactics delivered benefits to the organization by streamlining claims handling processes, implementing management practices that facilitate performance focus and problem solving. Other examples include cost savings through negotiating existing contracts, identifying opportunities to cease activities that do not provide a return on investment and leveraging technology and automation to reduce human effort and processing errors.
At the same time, building internal capability to support a culture of continuous improvement has been a key goal of Operational Excellence, especially in the areas of Claims and Driver Licensing. Significant effort has been placed in refreshing workforce capacity and capability. The adoption of Lean management practices such as visual management, information centres and coaching is an example of how ICBC is helping managers and teams perform better and be as efficient as possible. These changes may be as simple as how best to input information into systems, how to arrange signage and seating in Driver Licensing Offices, to more significant process changes such as improving fraud handling and workflow between investigators and adjusters.
Strategies Operate the Corporation in a low-cost manner.Focus our ability to make continuous business improvements more efficiently.
Insurance Corporation of British Columbia
2016/17 Annual Service Plan Report 18
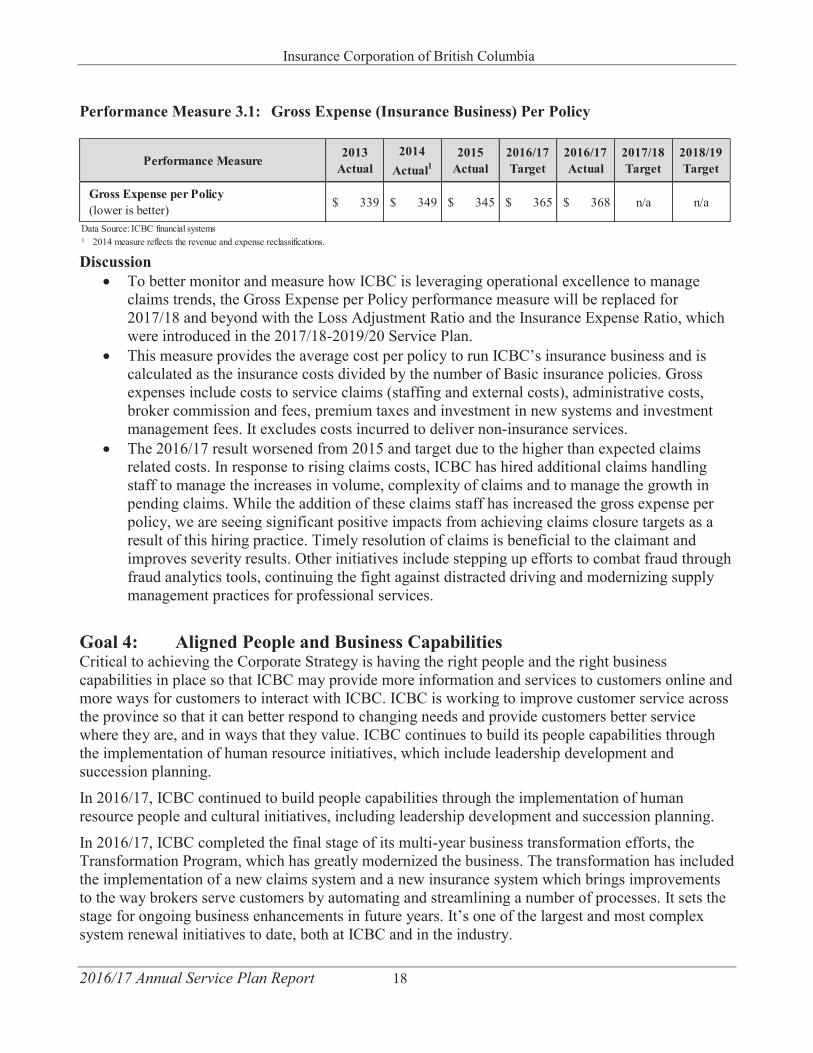
Performance Measure 3.1: Gross Expense (Insurance Business) Per Policy
Discussion To better monitor and measure how ICBC is leveraging operational excellence to manageclaims trends, the Gross Expense per Policy performance measure will be replaced for2017/18 and beyond with the Loss Adjustment Ratio and the Insurance Expense Ratio, whichwere introduced in the 2017/18-2019/20 Service Plan.This measure provides the average cost per policy to run ICBC’s insurance business and iscalculated as the insurance costs divided by the number of Basic insurance policies. Grossexpenses include costs to service claims (staffing and external costs), administrative costs,broker commission and fees, premium taxes and investment in new systems and investmentmanagement fees. It excludes costs incurred to deliver non-insurance services.The 2016/17 result worsened from 2015 and target due to the higher than expected claimsrelated costs. In response to rising claims costs, ICBC has hired additional claims handlingstaff to manage the increases in volume, complexity of claims and to manage the growth inpending claims. While the addition of these claims staff has increased the gross expense perpolicy, we are seeing significant positive impacts from achieving claims closure targets as aresult of this hiring practice. Timely resolution of claims is beneficial to the claimant andimproves severity results. Other initiatives include stepping up efforts to combat fraud throughfraud analytics tools, continuing the fight against distracted driving and modernizing supplymanagement practices for professional services.
Goal 4: Aligned People and Business Capabilities Critical to achieving the Corporate Strategy is having the right people and the right business capabilities in place so that ICBC may provide more information and services to customers online and more ways for customers to interact with ICBC. ICBC is working to improve customer service across the province so that it can better respond to changing needs and provide customers better service where they are, and in ways that they value. ICBC continues to build its people capabilities through the implementation of human resource initiatives, which include leadership development and succession planning.
In 2016/17, ICBC continued to build people capabilities through the implementation of human resource people and cultural initiatives, including leadership development and succession planning.
In 2016/17, ICBC completed the final stage of its multi-year business transformation efforts, the Transformation Program, which has greatly modernized the business. The transformation has included the implementation of a new claims system and a new insurance system which brings improvements to the way brokers serve customers by automating and streamlining a number of processes. It sets the stage for ongoing business enhancements in future years. It’s one of the largest and most complex system renewal initiatives to date, both at ICBC and in the industry.
$ 339 $ 349 $ 345 $ 365 $ 368 n/a n/a
Data Source: ICBC financial systems1 2014 measure reflects the revenue and expense reclassifications.
2017/18Target
2018/19Target
2015ActualPerformance Measure
Gross Expense per Policy(lower is better)
2013Actual
2014Actual1
2016/17Target
2016/17Actual
Insurance Corporation of British Columbia
2016/17 Annual Service Plan Report 19
ICBC continued to work with the Ministry to support government’s non-insurance priorities within the context of government’s overall strategic priorities. See Appendix C for additional information.
Strategies To improve business capabilities and better align people, we have developed the following strategies:
Develop accountable, aligned, enabled and motivated leaders and employees.Leverage business value from technology investments.Align with our shareholder to support government priorities.
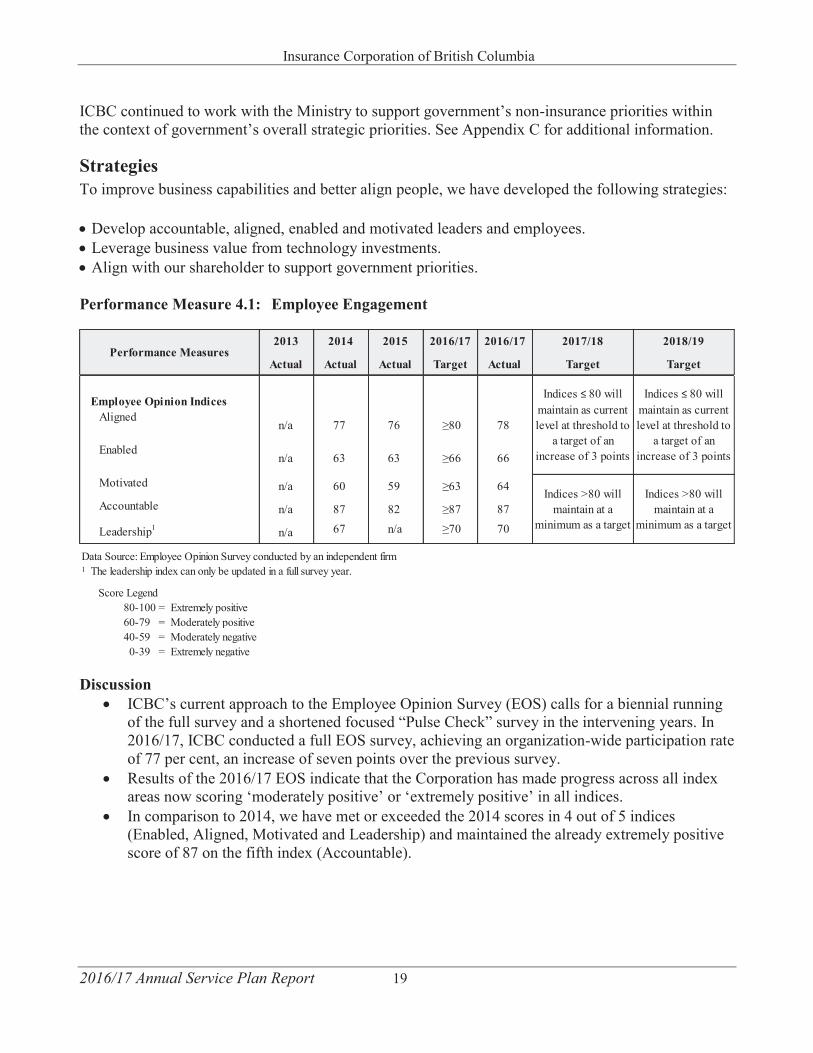
Performance Measure 4.1: Employee Engagement
Discussion ICBC’s current approach to the Employee Opinion Survey (EOS) calls for a biennial runningof the full survey and a shortened focused “Pulse Check” survey in the intervening years. In2016/17, ICBC conducted a full EOS survey, achieving an organization-wide participation rateof 77 per cent, an increase of seven points over the previous survey.Results of the 2016/17 EOS indicate that the Corporation has made progress across all indexareas now scoring ‘moderately positive’ or ‘extremely positive’ in all indices.In comparison to 2014, we have met or exceeded the 2014 scores in 4 out of 5 indices(Enabled, Aligned, Motivated and Leadership) and maintained the already extremely positivescore of 87 on the fifth index (Accountable).
2013 2014 2015 2016/17 2016/17 2017/18 2018/19
Actual Actual Actual Target Actual Target Target
n/a 77 76 ≥80 78
n/a 63 63 ≥66 66
n/a 60 59 ≥63 64
n/a 87 82 ≥87 87
n/a 67 n/a ≥70 70
Data Source: Employee Opinion Survey conducted by an independent firm1 The leadership index can only be updated in a full survey year.
Score Legend80-100 = Extremely positive60-79 = Moderately positive40-59 = Moderately negative
0-39 = Extremely negative
Indices ≤ 80 will maintain as current level at threshold to
a target of an increase of 3 points
Indices >80 will maintain at a
minimum as a target
Indices >80 will maintain at a
minimum as a target
Performance Measures
Employee Opinion IndicesAligned
Enabled
Motivated
Accountable
Leadership1
Indices ≤ 80 will maintain as current level at threshold to
a target of an increase of 3 points
Insurance Corporation of British Columbia
2016/17 Annual Service Plan Report 20
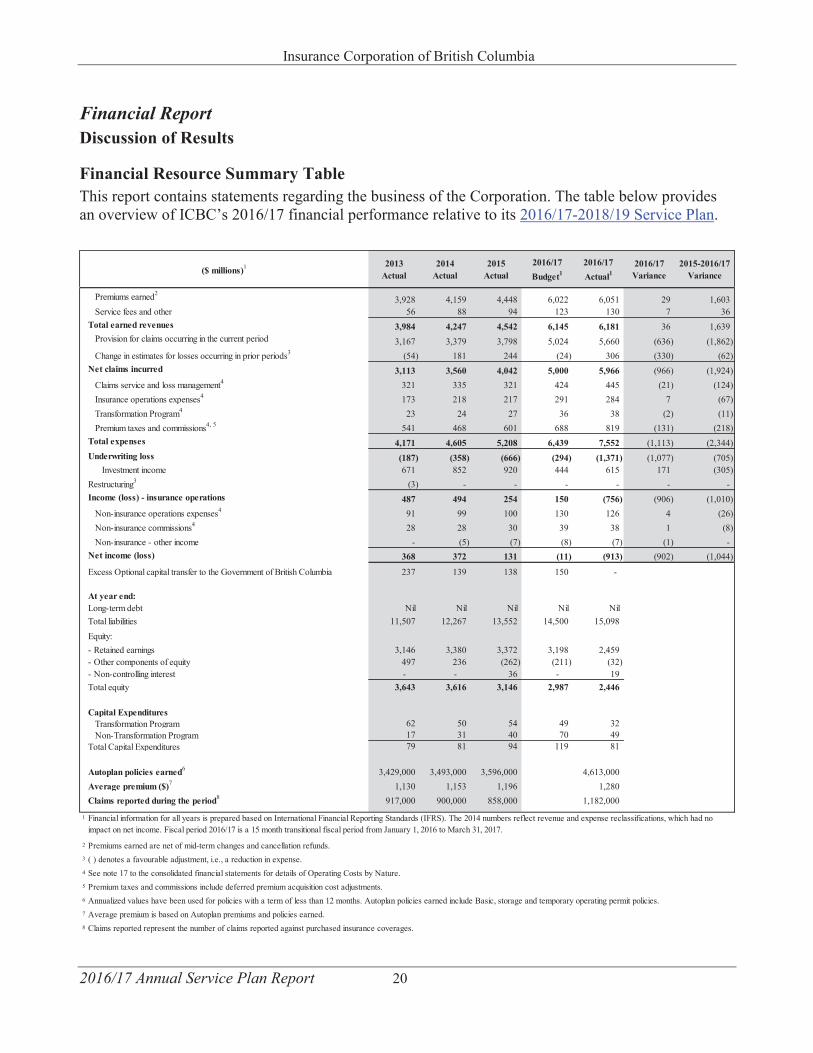
Financial Report Discussion of Results
Financial Resource Summary TableThis report contains statements regarding the business of the Corporation. The table below provides an overview of ICBC’s 2016/17 financial performance relative to its 2016/17-2018/19 Service Plan.
2013Actual
2014Actual
2015Actual
2016/17Budget1
2016/17Actual1
2016/17 Variance
2015-2016/17 Variance
Premiums earned23,928 4,159 4,448 6,022 6,051 29 1,603
Service fees and other 56 88 94 123 130 7 36Total earned revenues 3,984 4,247 4,542 6,145 6,181 36 1,639
Provision for claims occurring in the current period 3,167 3,379 3,798 5,024 5,660 (636) (1,862)Change in estimates for losses occurring in prior periods3 (54) 181 244 (24) 306 (330) (62)
Net claims incurred 3,113 3,560 4,042 5,000 5,966 (966) (1,924)Claims service and loss management4 321 335 321 424 445 (21) (124)Insurance operations expenses4 173 218 217 291 284 7 (67)Transformation Program4 23 24 27 36 38 (2) (11)Premium taxes and commissions4, 5 541 468 601 688 819 (131) (218)
Total expenses 4,171 4,605 5,208 6,439 7,552 (1,113) (2,344)Underwriting loss (187) (358) (666) (294) (1,371) (1,077) (705)
Investment income 671 852 920 444 615 171 (305)Restructuring3 (3) - - - - - -Income (loss) - insurance operations 487 494 254 150 (756) (906) (1,010)
Non-insurance operations expenses4 91 99 100 130 126 4 (26)Non-insurance commissions4 28 28 30 39 38 1 (8)Non-insurance - other income - (5) (7) (8) (7) (1) -
Net income (loss) 368 372 131 (11) (913) (902) (1,044)
Excess Optional capital transfer to the Government of British Columbia 237 139 138 150 -
At year end:Long-term debt Nil Nil Nil Nil NilTotal liabilities 11,507 12,267 13,552 14,500 15,098Equity:- Retained earnings 3,146 3,380 3,372 3,198 2,459- Other components of equity 497 236 (262) (211) (32)- Non-controlling interest - - 36 - 19Total equity 3,643 3,616 3,146 2,987 2,446
Capital ExpendituresTransformation Program 62 50 54 49 32Non-Transformation Program 17 31 40 70 49
Total Capital Expenditures 79 81 94 119 81
Autoplan policies earned6 3,429,000 3,493,000 3,596,000 4,613,000Average premium ($)7 1,130 1,153 1,196 1,280Claims reported during the period8 917,000 900,000 858,000 1,182,000
1
2 Premiums earned are net of mid-term changes and cancellation refunds.3 ( ) denotes a favourable adjustment, i.e., a reduction in expense.4 See note 17 to the consolidated financial statements for details of Operating Costs by Nature.5 Premium taxes and commissions include deferred premium acquisition cost adjustments.6
7
8 Claims reported represent the number of claims reported against purchased insurance coverages.
($ millions)1
Financial information for all years is prepared based on International Financial Reporting Standards (IFRS). The 2014 numbers reflect revenue and expense reclassifications, which had no impact on net income. Fiscal period 2016/17 is a 15 month transitional fiscal period from January 1, 2016 to March 31, 2017.
Annualized values have been used for policies with a term of less than 12 months. Autoplan policies earned include Basic, storage and temporary operating permit policies.Average premium is based on Autoplan premiums and policies earned.
Insurance Corporation of British Columbia
2016/17 Annual Service Plan Report 21
ICBC has changed its fiscal year-end date from December 31 to March 31 to align with the Province of B.C.’s fiscal year-end date. This change was effective immediately after the fiscal year ended December 31, 2015. As a result of this change, 2016/17 is a 15 month transitional fiscal period from January 1, 2016 to March 31, 2017, with comparative financial information for the 12 months ended December 31, 2015. This change is one of the main drivers for the period over period variances. For 2017/18 and thereafter, ICBC’s fiscal year will be the 12 month period from April 1 to March 31.Our 15 month 2016/17 net loss of $913 million was $1,044 million worse than the 12 month 2015 net income of $131 million. This is due to increasing claims costs and lower investment income compared to the previous period, partially offset by higher premiums earned. The change also reflects the difference in reporting periods between the two years (transitional 15 months versus 12 months). Compared to budget, the corporation’s net loss was $902 million higher than the budgeted net loss of $11 million. This is largely due to higher than expected claims costs, partially offset by higher than expected premiums earned and investment income.
The higher claims costs are driven by a higher crash frequency and a higher number of bodily injury claims per crash. These trends are exacerbated by an increased number of legally represented claims as well as an increased number of large and complex claims, which typically result in larger settlements. In addition, material damage repair costs are higher than expected. These external pressures are expected to continue in the foreseeable future.
ICBC remains focused on improving the bottom line and building capital levels to withstand the above mentioned pressures. In fiscal 2016/17, ICBC added additional injury claims handling staff to manage the higher claims volumes and to reduce the growth in pending claims which has shownpositive results. This effort has resulted in significant positive impacts on severity results for bodily injury claims and in achieving claims closure targets. In addition, ICBC, in concert with the Province of B.C., continues to identify and implement new initiatives to help alleviate the pressure that risingclaims costs continue to put on insurance rates. These initiatives include stepping up efforts to combat fraud, road safety initiatives and continuing the fight against distracted driving. Also, the comprehensive independent review of ICBC is underway. This review will help ICBC identify key factors impacting Basic insurance rates and provide a broad range of options available to help ensure rates are affordable for years to come. ICBC will work with the Province of B.C. to implement potential independent review recommendations.
Premiums earned Premiums earned increased to $6,051 million in 2016/17 from $4,448 million in 2015. This is due to the impact of the Basic insurance rate increase of 5.5 per cent effective November 1, 2015, Optional insurance rate increases and a growth in the number of insured vehicles. The increase over 2015 isalso due to the longer fiscal period in 2016/17, as discussed above. Compared to budget, premiums earned increased by $29 million due to higher than expected vehicle growth.
Service fees and other Service fees and other are primarily comprised of interest and other fees received from policyholders who have chosen to finance their insurance premiums over the policy period. In 2016/17, service fees increased by $36 million from 2015 due to higher premiums earned and the longer fiscal period. Compared to budget, service fees increased by $7 million due to higher premiums earned.
Insurance Corporation of British Columbia
2016/17 Annual Service Plan Report 22
Claims costs Cost of claims incurred account for approximately three quarters of our total expenditures. They are comprised of the expected costs to settle claims for all crashes that have occurred during the fiscal period, regardless of when the crash is reported to us, and the change in estimates for losses that occurred in prior periods. Claims incurred costs include payments made to settle claims, adjusters’ case reserves, and actuarial estimates of the additional costs that will be paid on known claims and claims not yet reported.
Claims incurred costs are affected by the growth in the number of policies, the chance of having a claim (frequency) and the average expected costs to settle those claims (severity). Frequency is influenced by factors that include driving and claimant behaviour, driver experience, weather and the effectiveness of road safety and loss management programs. Severity is influenced by factors that include legal representation, litigation, settlement awards, legal fees, medical inflation, vehicle parts/repair inflation and independent adjusting costs.
In 2016/17, ICBC observed higher than expected crash frequency and an increased number of bodily injury claims per crash. As well, there was an increase in the proportion of legally represented claims. Bodily injury costs were also higher this period due to a greater emergence of large and complex claims from prior periods.
Partially offsetting the trends in current and prior periods’ claims in fiscal 2016/17, benefits to bodily injury claim severities were recognized during the period resulting from hiring more injury adjusters in an effort to manage the increasing volume of claims. The effort has contributed to favourable severity results as compared to target levels.
An increase in material damage claims has also been observed as a result of the higher crash frequency, which worsened in the last two quarters of 2016/17 with the adverse winter weather experienced in the Lower Mainland. As well, the material damage repair costs were higher than expected. The higher severity is consistent with trends affecting other jurisdictions.
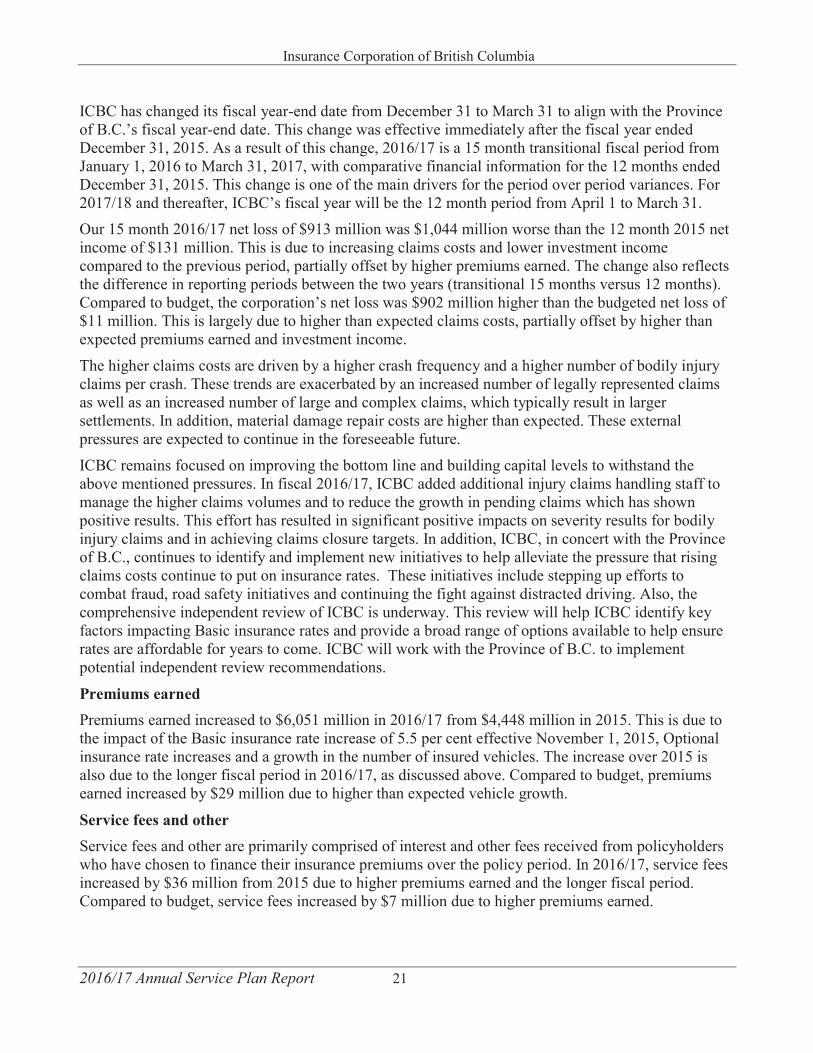
Overall 2016/17 net claims incurred costs of $5,966 million were $1,924 million higher compared to 2015. This increase was driven by current period claims costs increasing by $1,862 million, and a greater unfavourable adjustment by $62 million to the estimate of prior periods’ claims costs compared to 2015. These increases are due to increases in both bodily injury and material damage costs, as well as the longer fiscal period in 2016/17, as discussed above.
Net claims incurred costs in 2016/17 were $966 million higher than budget, with an increase of $636 million in current period claims costs and $330 million in prior periods’ adjustments. These increases are attributable to higher than expected crash frequency and material damage repair costs as well as a greater emergence of large and complex bodily injury claims from prior periods.
ICBC's management has been working with government to develop strategies including various claims and financial mitigation initiatives that will assist in keeping Basic insurance rates as low as possible.
The overall average cost of current period claims that occurred in 2016/17 increased by approximately 22 per cent over 2015, due to increases in both average costs of injury and material damage claims.
Insurance Corporation of British Columbia
2016/17 Annual Service Plan Report 23
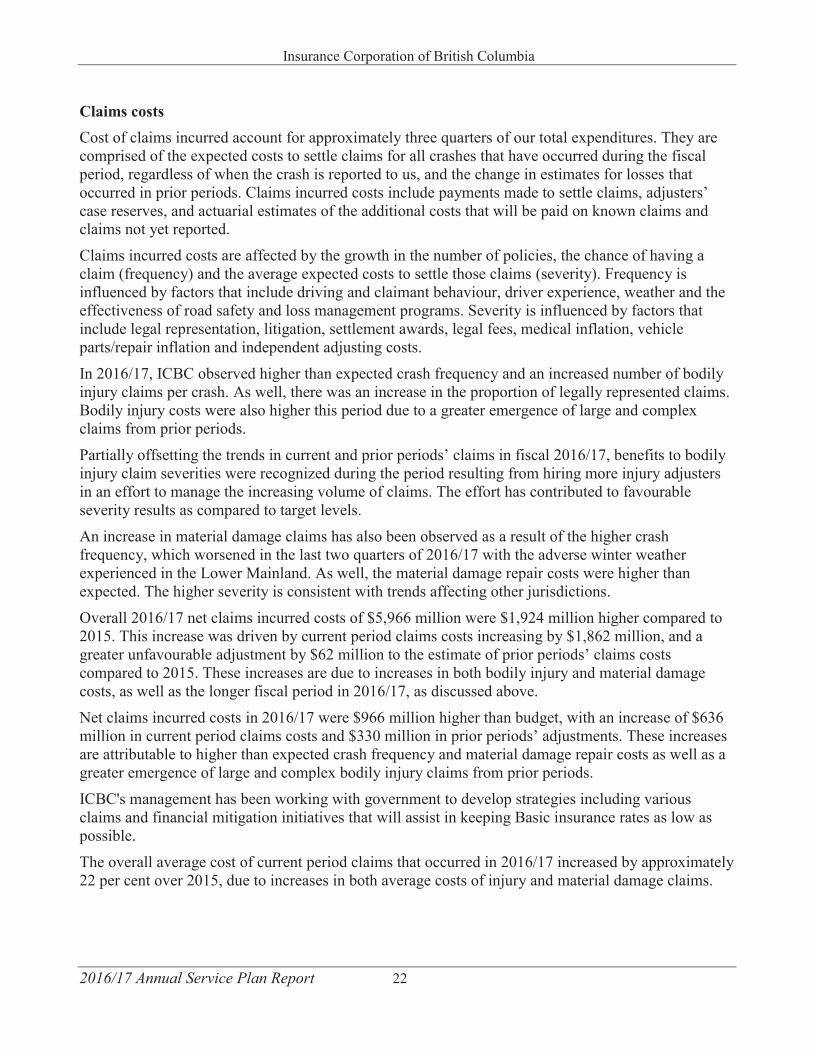
Injury claims Current period injury claims account for approximately 65 per cent of current period claims incurred costs in 2016/17, and include bodily injury claims and accident benefit claims. Injury claims include amounts for pain and suffering, future care, past and future wage loss, medical expenses and external claims handling expenses.
Overall, the total cost of current period injury claims have increased in 2016/17 compared to 2015.This reflects an increased frequency of injury claims, as well as the longer fiscal period in 2016/17, as discussed above. However, injury adjuster recruitment and favourable severities from ICBC initiatives are helping to mitigate the cost increases.
Bodily injury claims costs accounted for over 90 per cent of all injury claims costs and increased by $928 million to $3,308 million in 2016/17 compared to 2015.
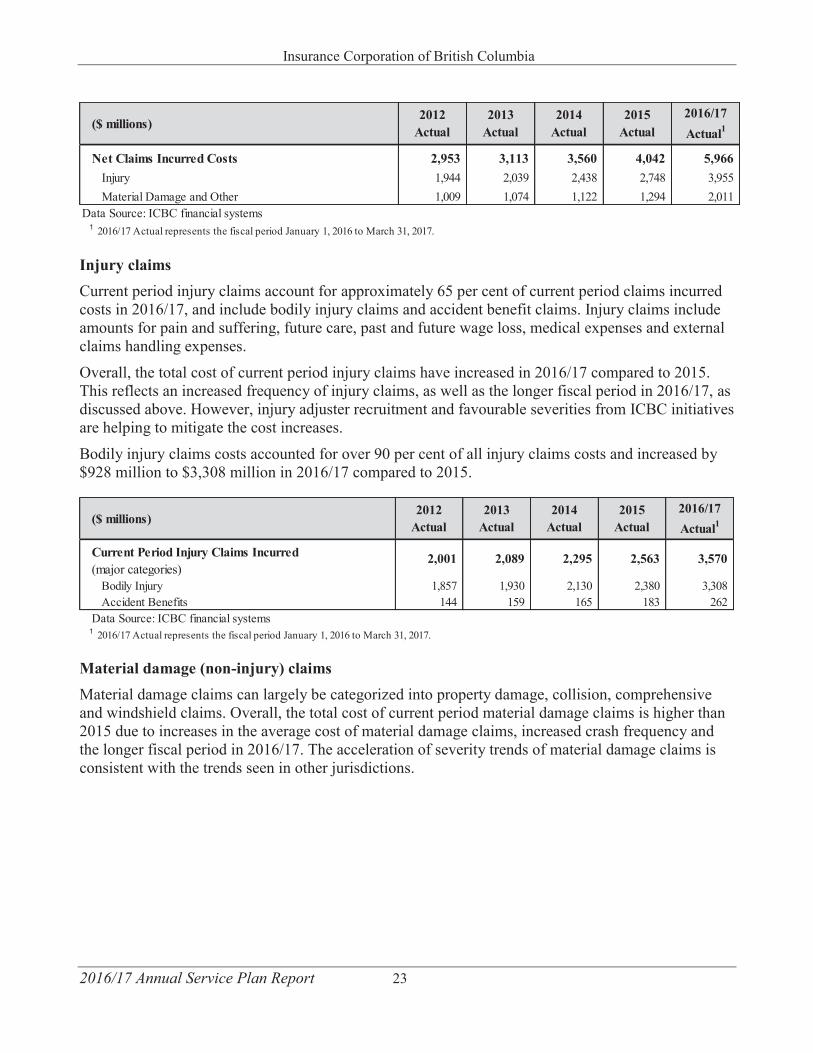
Material damage (non-injury) claims Material damage claims can largely be categorized into property damage, collision, comprehensive and windshield claims. Overall, the total cost of current period material damage claims is higher than 2015 due to increases in the average cost of material damage claims, increased crash frequency and the longer fiscal period in 2016/17. The acceleration of severity trends of material damage claims is consistent with the trends seen in other jurisdictions.
2,953 3,113 3,560 4,042 5,9661,944 2,039 2,438 2,748 3,9551,009 1,074 1,122 1,294 2,011
Data Source: ICBC financial systems1 2016/17 Actual represents the fiscal period January 1, 2016 to March 31, 2017.
($ millions)
Net Claims Incurred CostsInjuryMaterial Damage and Other
2016/17Actual1
2012Actual
2013Actual
2014Actual
2015Actual
2,001 2,089 2,295 2,563 3,570
1,857 1,930 2,130 2,380 3,308144 159 165 183 262
Data Source: ICBC financial systems1 2016/17 Actual represents the fiscal period January 1, 2016 to March 31, 2017.
($ millions)2012
Actual2013
Actual2014
Actual2015
Actual2016/17Actual1
Current Period Injury Claims Incurred (major categories)
Bodily InjuryAccident Benefits
Insurance Corporation of British Columbia
2016/17 Annual Service Plan Report 24
Change in estimates for losses occurred in prior years Adjustments to the prior periods’ claims reserves are due to the re-estimation of future payments for claims incurred in prior periods that are in progress and for those that are not yet reported. As time passes, more claims are paid and more information becomes available, enabling the estimate of the remaining future claims payments to be refined.
In 2016/17, the change in estimates for losses that occurred in prior periods was unfavourable as compared to 2015. This is a result of higher material damage claims from prior periods that have cost more than anticipated. This is also due to increasing legal representation of claims and the greater emergence of more large and complex claims, as discussed previously. Complex claims take longer to settle and, in general, cost more; therefore, additional reserves have been set aside to reflect this shift.
Provision for unpaid claims The provision for unpaid claims is the largest liability on the consolidated statement of financial position. It is an estimate of future claims payments relating to claims that have already occurred. The adequacy of this unpaid claims liability is reviewed and adjusted periodically throughout the periodbased on revised actuarial estimates, which include a provision for adverse deviations (see note 2d tothe consolidated financial statements).
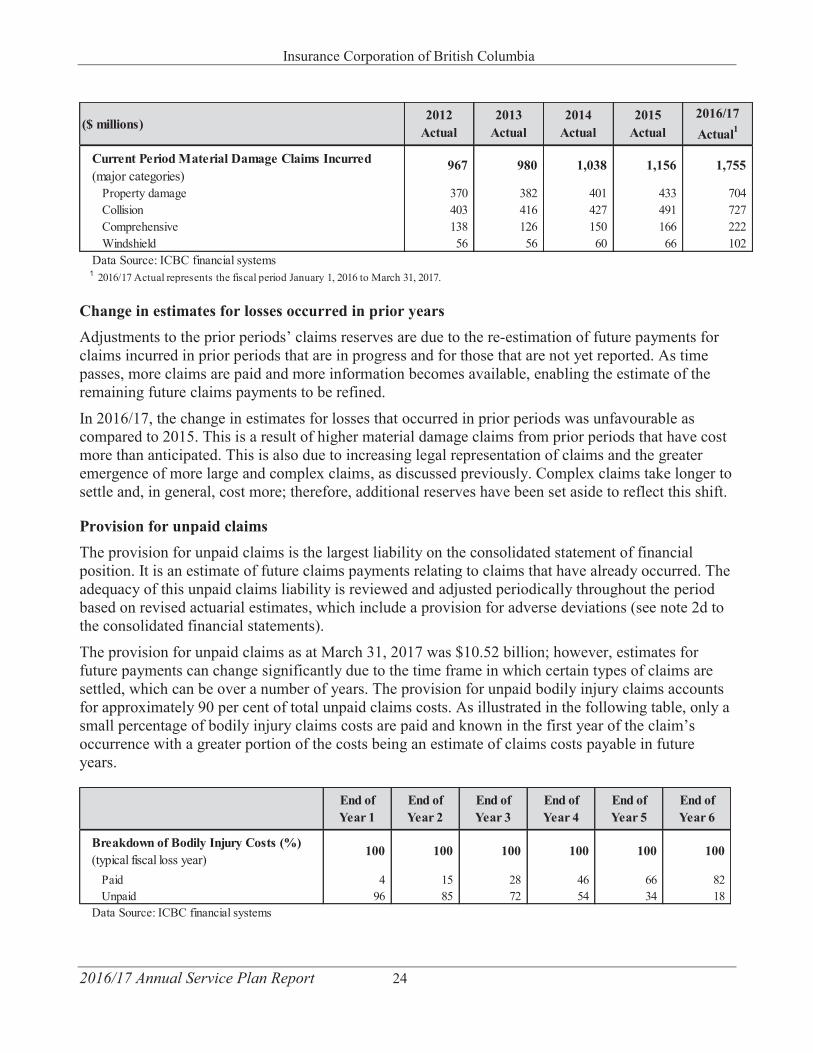
The provision for unpaid claims as at March 31, 2017 was $10.52 billion; however, estimates for future payments can change significantly due to the time frame in which certain types of claims are settled, which can be over a number of years. The provision for unpaid bodily injury claims accounts for approximately 90 per cent of total unpaid claims costs. As illustrated in the following table, only a small percentage of bodily injury claims costs are paid and known in the first year of the claim’s occurrence with a greater portion of the costs being an estimate of claims costs payable in future years.
967 980 1,038 1,156 1,755
370 382 401 433 704403 416 427 491 727138 126 150 166 22256 56 60 66 102
Data Source: ICBC financial systems1 2016/17 Actual represents the fiscal period January 1, 2016 to March 31, 2017.
Windshield
($ millions)
Current Period Material Damage Claims Incurred (major categories)
Property damageCollision
2016/17Actual1
2012Actual
2013Actual
2014Actual
2015Actual
Comprehensive
Breakdown of Bodily Injury Costs (%)(typical fiscal loss year)
100 100 100 100 100 100
Paid 4 15 28 46 66 82Unpaid 96 85 72 54 34 18
Data Source: ICBC financial systems
End of Year 6
End of Year 1
End of Year 2
End of Year 3
End of Year 4
End of Year 5
Insurance Corporation of British Columbia
2016/17 Annual Service Plan Report 25
ICBC commissions the services of an external actuary to provide an independent assessment of the provision for unpaid claims and, as part of the annual audit of the financial results, the external auditor’s actuary also reviews the adequacy of the unpaid claims reserves.
ICBC earns investment income on funds set aside for unpaid claims from the premiums that are collected for the related policies. Investment income is earned until the claims are ultimately paid. In accordance with accepted actuarial practice in Canada, ICBC reports our provision for unpaid claims on a discounted basis to reflect the time value of money. The discounted amount takes into account the expected timing of future payments related to unpaid claims (see note 13 to the consolidated financial statements). The discount rate is based on the expected return of our current investment portfolio. An increase in the discount rate applied to claims costs will reduce the unpaid claims balance while a decrease in the discount rate will increase the unpaid claims balance. In 2016/17, the discount rate of 2.75 per cent decreased by 21 basis points from prior period’s discount rate of 2.96per cent, which increased the balance of unpaid claims.
Road safety and loss management In 2016/17, ICBC invested $61 million in road safety initiatives and loss management programs, which include auto crime and fraud prevention, investigation and detection to help reduce claims costs, giving customers the best insurance coverage at the lowest possible costs.
Using a safe systems approach, we target our road safety investments on the major risks that impact customers and costs in our business, including distractions, high-risk driving, impaired driving and vulnerable road users. We work with a network of partners across the province to deliver road safety programs that help protect customers from risks on the road by reducing the frequency and impact of crashes and crime.
Distracted driving related crashes continue be one of the leading causes of car crash fatalities and serious injuries in B.C. In 2016/17, ICBC continued its partnerships with law enforcement and government to raise awareness of the consequences and penalties associated with distracted driving to reduce injury and death on B.C. roads. This included working with government and police to support B.C.’s new, stronger penalties for electronic device use by drivers.
ICBC remains committed to the Road Improvement Program and Intersection Safety Camera Program and continue to partner with the provincial government and police across the province on enhanced traffic enforcement. ICBC supports enhanced enforcement initiatives through a funding agreement with the Ministry of Justice. In 2016/17, ICBC invested approximately $32 million in enhanced enforcement, such as CounterAttack, distracted driving, speed enforcement and seat belt checks. We also invested in advertising and community initiatives to help change driver behaviours.
ICBC continued to invest in auto crime programs like Bait Car, Stolen Auto Recovery and community partnerships that work towards reducing auto crime in B.C. Initiatives such as Auto Crime Enforcement Month, Lock Out Auto Crime notices and awareness signage help educate vehicle owners on ways to prevent auto crime.
ICBC has been fighting fraud for decades and is taking steps to detect and deter even more cases of fraud. ICBC’s Cyber Unit leverages the internet and social media to combat exaggerated and fraudulent claims. While the overwhelming majority of customers make honest claims, exaggerated and fraudulent claims are an increasing area of focus for all insurers. In 2016/17, ICBC boosted its fraud prevention efforts through the initial phase of the launch of a new fraud analytics tool. The tool
Insurance Corporation of British Columbia
2016/17 Annual Service Plan Report 26
uses data, algorithms and statistical methods to help spot potentially fraudulent claims by helping investigators and adjustors identify fraud earlier, faster and at a level not previously available. ICBC also launched a public awareness campaign that included TV advertisements, intended to educate the public on the concept that when claims are falsified or exaggerated, it ultimately costs everyone in the system.
Operating costs Operating costs include compensation and other costs required to operate the insurance and non-insurance businesses with the exception of claims payments, commissions and premium taxes.
In 2016/17, ICBC continued to focus on managing operating costs prudently. Claims related operating costs of $445 million were higher than 2015 operating costs, primarily due to higher compensation costs as a result of hiring more injury adjusters in an effort to manage the rise in claims volumes. As a result of these additional claims staff, significant benefits were realized in ICBC claims costs throughthe timely resolution of claims files and achieving claims closure targets, which improved severity results. In addition, operating costs were higher compared to 2015 due to the longer fiscal period in 2016/17 compared to prior period, as discussed above. Claims related operating costs in 2016/17 were higher than budget due to higher than expected compensation costs, as discussed above.
The Transformation Program, a multi-year initiative, was completed in 2016/17 on time and belowbudget. The project operating expenses in 2016/17 totaled $38 million including operational costs and depreciation expenses. The spending levels in 2016/17 were within budget.
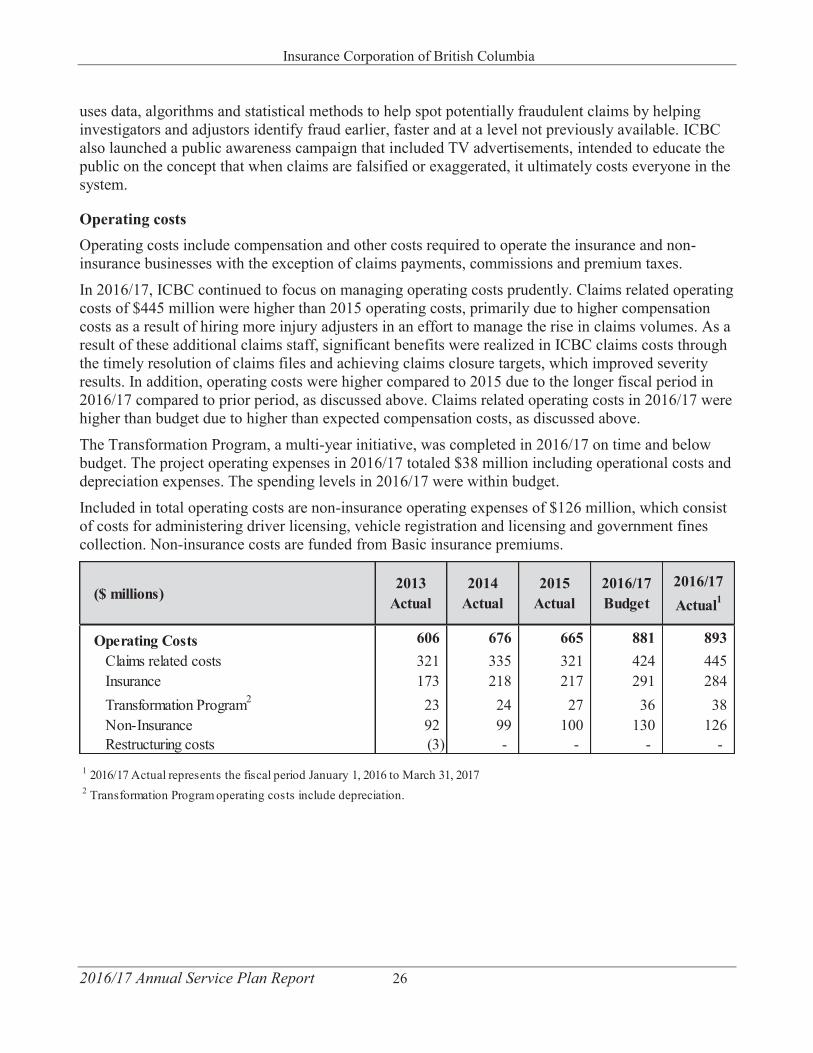
Included in total operating costs are non-insurance operating expenses of $126 million, which consist of costs for administering driver licensing, vehicle registration and licensing and government fines collection. Non-insurance costs are funded from Basic insurance premiums.
Operating Costs 606 676 665 881 893Claims related costs 321 335 321 424 445Insurance 173 218 217 291 284Transformation Program2 23 24 27 36 38Non-Insurance 92 99 100 130 126Restructuring costs (3) - - - -
1 2016/17 Actual represents the fiscal period January 1, 2016 to March 31, 20172 Transformation Program operating costs include depreciation.
2016/17Actual1
($ millions)2013
Actual2014
Actual2016/17Budget
2015Actual
Insurance Corporation of British Columbia
2016/17 Annual Service Plan Report 27
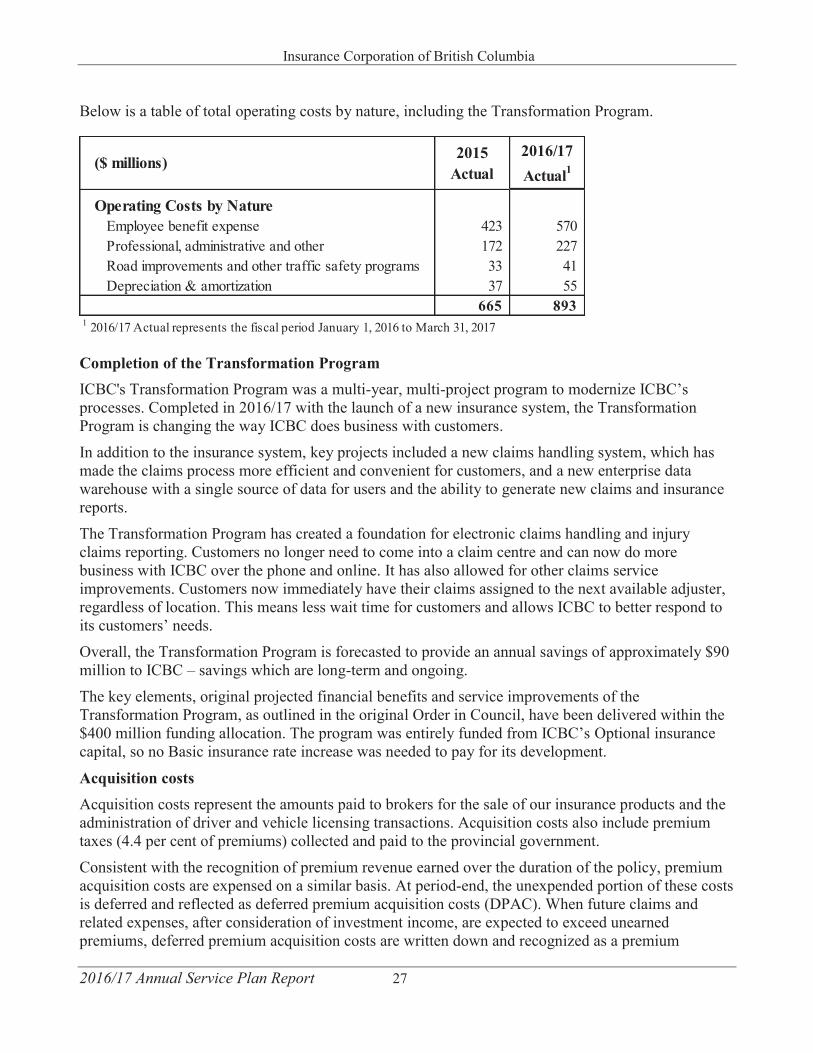
Below is a table of total operating costs by nature, including the Transformation Program.
Completion of the Transformation Program ICBC's Transformation Program was a multi-year, multi-project program to modernize ICBC’s processes. Completed in 2016/17 with the launch of a new insurance system, the Transformation Program is changing the way ICBC does business with customers.
In addition to the insurance system, key projects included a new claims handling system, which has made the claims process more efficient and convenient for customers, and a new enterprise data warehouse with a single source of data for users and the ability to generate new claims and insurance reports.
The Transformation Program has created a foundation for electronic claims handling and injury claims reporting. Customers no longer need to come into a claim centre and can now do more business with ICBC over the phone and online. It has also allowed for other claims service improvements. Customers now immediately have their claims assigned to the next available adjuster, regardless of location. This means less wait time for customers and allows ICBC to better respond to its customers’ needs.
Overall, the Transformation Program is forecasted to provide an annual savings of approximately $90 million to ICBC – savings which are long-term and ongoing.
The key elements, original projected financial benefits and service improvements of the Transformation Program, as outlined in the original Order in Council, have been delivered within the $400 million funding allocation. The program was entirely funded from ICBC’s Optional insurance capital, so no Basic insurance rate increase was needed to pay for its development.
Acquisition costs Acquisition costs represent the amounts paid to brokers for the sale of our insurance products and the administration of driver and vehicle licensing transactions. Acquisition costs also include premium taxes (4.4 per cent of premiums) collected and paid to the provincial government.
Consistent with the recognition of premium revenue earned over the duration of the policy, premium acquisition costs are expensed on a similar basis. At period-end, the unexpended portion of these costs is deferred and reflected as deferred premium acquisition costs (DPAC). When future claims and related expenses, after consideration of investment income, are expected to exceed unearned premiums, deferred premium acquisition costs are written down and recognized as a premium
Operating Costs by NatureEmployee benefit expense 423 570Professional, administrative and other 172 227Road improvements and other traffic safety programs 33 41Depreciation & amortization 37 55
665 8931 2016/17 Actual represents the fiscal period January 1, 2016 to March 31, 2017
($ millions)2016/17Actual1
2015Actual
Insurance Corporation of British Columbia
2016/17 Annual Service Plan Report 28
deficiency. Conversely, where there has been a previous premium deficiency, a positive adjustment is made to eliminate the premium deficiency when unearned premiums are expected to exceed future claims and related expenses.
As at March 31, 2017, the net Corporate DPAC asset was $17 million, and the premium deficiency adjustment expense was $93 million (see notes 17 and 18 to the accompanying consolidated financial statements).Acquisition costs (including non-insurance commissions) of $857 million were $226 million higher than 2015. This is mainly due to an unfavourable DPAC adjustment from higher claims costs that resulted in decreased profitability. Broker commissions and premium taxes are also higher by $128million and $72 million, respectively, due to higher premiums earned over the 15 month period.
Investments ICBC has an investment portfolio with a carrying value of $15.5 billion, which represented 88 per cent of the Corporation’s total assets as at March 31, 2017.
Funds available for investment purposes come primarily from the premiums collected and set aside for unpaid claims. ICBC maintains a conservative investment portfolio, which has a significant allocation to high-quality fixed income securities.
As at March 31, 2017, 72 per cent of the carrying value of the portfolio took the form of high-grade corporate and government bonds, money market securities and mortgage instruments, while 23 per cent of the portfolio was invested in equity and real estate investments. A further five per cent of the portfolio has been allocated to high yield bonds.
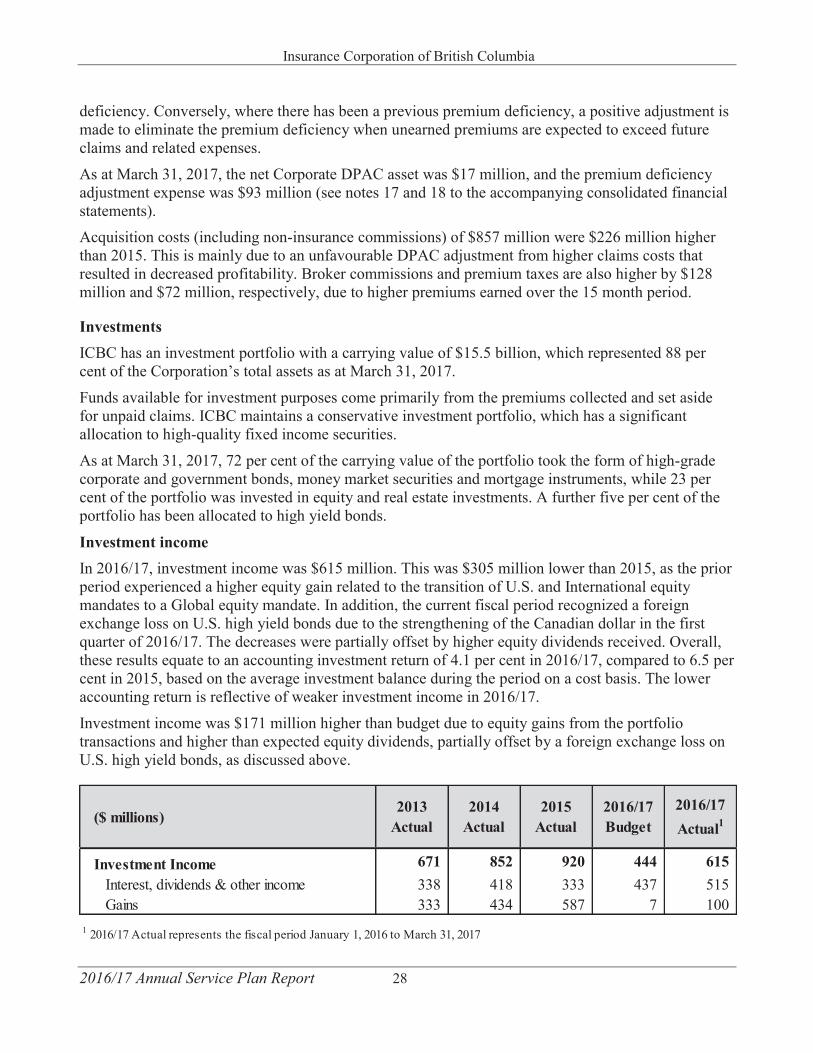
Investment income In 2016/17, investment income was $615 million. This was $305 million lower than 2015, as the prior period experienced a higher equity gain related to the transition of U.S. and International equity mandates to a Global equity mandate. In addition, the current fiscal period recognized a foreign exchange loss on U.S. high yield bonds due to the strengthening of the Canadian dollar in the first quarter of 2016/17. The decreases were partially offset by higher equity dividends received. Overall, these results equate to an accounting investment return of 4.1 per cent in 2016/17, compared to 6.5 per cent in 2015, based on the average investment balance during the period on a cost basis. The lower accounting return is reflective of weaker investment income in 2016/17.
Investment income was $171 million higher than budget due to equity gains from the portfolio transactions and higher than expected equity dividends, partially offset by a foreign exchange loss on U.S. high yield bonds, as discussed above.
Investment Income 671 852 920 444 615Interest, dividends & other income 338 418 333 437 515Gains 333 434 587 7 100
1 2016/17 Actual represents the fiscal period January 1, 2016 to March 31, 2017
($ millions)2013
Actual2014
Actual2016/17Budget
2016/17Actual1
2015Actual
Insurance Corporation of British Columbia
2016/17 Annual Service Plan Report 29
Equity Our equity included retained earnings of $2,459 million and accumulated loss in other components of equity of $32 million as at March 31, 2017. Retained earnings help to absorb significant unexpected increases in claims costs and volatility in the financial markets. We have a significant capital base enabling us to withstand adverse claims experience and unfavourable financial market situations, protect our policyholders and continue to provide our customers with the best coverage at the lowest possible price.
Bonds and equities are measured at fair value on the consolidated statement of financial position, with changes in fair value (unrealized gains and losses) included in other components of equity, which increased ICBC’s unrealized gain position by $152 million at March 31, 2017. This increase primarily reflects the upturn in the fair market value of our equity portfolio due to the strengthening performance of the equity markets at the end of the period.
Similar to the private insurance industry, the adequacy of equity or capital base is an important factor in assessing the financial stability of a company and is closely monitored by regulators.
The common industry method used to measure financial stability is the Minimum Capital Test (MCT) ratio, a risk-based capital adequacy framework which assesses assets, policy liabilities and other potential liabilities to determine appropriate capital levels set by the Office of the Superintendent of Financial Institutions Canada (OSFI). OSFI requires its regulated property and casualty insurers to meet minimum capital test targets.
Although not regulated by OSFI, we have established management targets for MCT ratios in excess of ICBC’s regulatory targets to take into consideration relevant factors such as business risks and requirements, and the volatility inherent in the insurance business, such as changes to claims costs and in the investment markets. As at March 31, 2017, our total corporate MCT level of 112 per cent was lower than the prior year. This was due to the increase in claims costs and ICBC’s inability to set rates to cover costs due to the Basic insurance rate smoothing framework, which limits the range of allowable rate changes, and instead uses Basic insurance capital to smooth through volatility in Basic insurance rates. For further information on the Basic insurance and Optional insurance capital framework, please refer to notes 9, 20 and 22 to the accompanying consolidated financial statements.
Excess Optional capital transfer to the Province of B.C.Excess Optional capital to be transferred to the Province of B.C. is calculated based on a capital management target set by ICBC. The target is based on the Minimum Capital Test (MCT) guideline and the Guideline on Stress Testing issued by Office of the Superintendent of Financial Institutions Canada (OSFI) or as directed by the Province of B.C. In 2016/17, there was no excess Optional capital transfer to the Province of B.C. compared to the Service Plan amount of $150 million. This reflects a decision of the Province of B.C. to cancel Optional transfers over the four fiscal periods from 2016/17 to 2019/20 in order to assist the corporation with working towards financial stability.
Optional capital and income transfers to Basic In 2015, the British Columbia Utilities Commission (BCUC) approved ICBC’s plan to transfer $450 million of capital from Optional insurance to Basic insurance in order to restore the Basic MCT level to above the required regulatory minimum MCT, which has been set at 100 per cent. This transfer was completed on January 1, 2016.
Insurance Corporation of British Columbia
2016/17 Annual Service Plan Report 30
ICBC filed another plan with BCUC on May 31, 2016, and further updated it on August 31, 2016, as the outlook for the period end Basic MCT level was below 100 per cent for both the first and second quarters of 2016/17. The update stated that, in addition to the $300 million income transfer referred to below, ICBC needed to transfer $172 million of capital from Optional insurance to Basic insurance in August 2016 in order to restore the Basic MCT level to be above the 100 per cent regulatory minimum.
$300 million of current period’s income was transferred from the Corporation’s Optional insurance business to the Basic insurance business. This transfer ($201 million on November 1, 2016 and subsequent to period end, $99 million) occurred under the Province of B.C.’s direction and was accepted by the Corporation’s Board of Directors. This transfer of income helped to achieve a Basic insurance rate increase that was as low as possible given the cost pressures. With the income transfer, the projected 2016/17 premium revenue at the current rate level was $2.94 billion as compared to the required premium revenue of $3.08 billion, resulting in a lower Basic insurance rate increase of 4.9 per cent. Without the income transfer, the required premium would have been higher at $3.38 billion,which would have instead given rise to a required Basic insurance rate increase of 15.5 per cent.
Basic and Optional insurance operations ICBC operates as an integrated company providing Basic and Optional insurance products and services. Integrated operations provide benefits to our customers, such as ease of service and savings achieved through economies of scale.
The majority of premium revenues and claims costs are specifically identifiable as Basic or Optional; however, certain costs are not tracked separately. For those costs that are not specifically identified as Basic or Optional, a financial allocation methodology, as approved by the BCUC, is used to allocate costs between these two lines of business. ICBC manages and reports the financial results of its operations on an integrated basis. Detailed financial information on the Basic and Optional lines of business is included in note 22 to the accompanying consolidated financial statements. The following paragraphs provide a high-level summary of results for both the Basic and Optional lines of business, while the balance of the annual report discusses results based on integrated operations.
The Basic insurance business incurred a net loss of $381 million after the Optional income transfer to Basic noted above. This net loss was $124 million higher than the 12 month 2015 net loss of $257million. Basic net loss is worse than the prior period due to higher claims costs and lower investment income, as well as a longer fiscal period in 2016/17 compared to prior period, as discussed above. The increased claims costs and lower investment income are partially offset by higher premium revenues from the Basic insurance rate increase of 5.5 per cent effective November 1, 2015 and 4.9 per cent increase effective November 1, 2016.
In 2016/17, the Optional insurance business incurred a net loss of $532 million after the Optional insurance income transfer to Basic noted above. The Optional insurance net loss is worse than 2015 net income of $388 million, mainly due to higher claims costs and lower investment income, as well as longer fiscal period in 2016/17 compared to prior period, partially offset by higher revenues fromvehicle growth and Optional rate increases.
Risks and uncertainties As a provider of vehicle insurance products, effective risk management is fundamental in protecting
Insurance Corporation of British Columbia
2016/17 Annual Service Plan Report 31
earnings, cash flow, and ultimately to ICBC’s financial stability. ICBC is exposed to various types of insurance and financial risks. Refer to note 9 to the accompanying consolidated financial statements for further details.
Insurance Corporation of British Columbia
2016/17 Annual Service Plan Report 32
Management’s Responsibility for Financial Statements
Scope of Responsibility Management prepares the accompanying consolidated financial statements and related information and is responsible for their integrity and objectivity. The statements are prepared in conformity with International Financial Reporting Standards. These consolidated financial statements include amounts that are based on management’s estimates and judgements, particularly our reserves for unpaid claims. We believe that these statements present fairly ICBC’s financial position, results of operations and cash flows, and that the other information contained in the annual report is consistent with the consolidated financial statements.
Internal Controls We maintain and rely on a system of internal accounting controls designed to provide reasonable assurance that assets are safeguarded and transactions are properly authorized and recorded. The system includes written policies and procedures, an organizational structure that segregates duties, and a comprehensive program of periodic audits by the internal auditors, who independently review and evaluate these controls. There is a quarterly risk assessment process, the results of which influence the development of the internal audit program. We continually monitor these internal accounting controls, modifying and improving them as business conditions and operations change. Policies that require employees to maintain the highest ethical standards have also been instituted. We recognize the inherent limitations in all control systems and believe our systems provide an appropriate balance between costs and benefits desired. We believe our systems of internal accounting controls provide reasonable assurance that errors or irregularities that would be material to the financial statements are prevented or detected in the normal course of business.
Board of Directors and Audit Committee The Audit Committee, composed of members of the Board of Directors, oversees management’s discharge of its financial reporting responsibilities. The Committee recommends for approval to the Board of Directors the appointment of the external auditors and the external actuaries. The Committee meets no less than quarterly with management, our internal auditors and representatives of our external auditors to discuss auditing, financial reporting and internal control matters. The Audit Committee receives regular reports on the internal audit results and evaluation of internal control systems and it reviews and approves major accounting policies including alternatives and potential key management estimates or judgments. Both internal and external auditors and the appointed actuary have access to the Audit Committee without management’s presence. The Audit Committee has reviewed these financial statements prior to recommending approval by the Board of Directors. The Board of Directors has reviewed and approved the financial statements.
Independent Auditor and Actuary Our independent auditor, PricewaterhouseCoopers LLP, have audited the financial statements. Their audit was conducted in accordance with Canadian generally accepted auditing standards, which includes the consideration of our internal controls to the extent necessary to form an independent opinion on the financial statements prepared by management.
William T. Weiland of Eckler Ltd. is engaged as the appointed actuary and is responsible for carrying out an annual valuation of ICBC’s policy liabilities which include a provision for claims and claims expenses, unearned premiums and deferred premium acquisition costs. The valuation is carried out in
Insurance Corporation of British Columbia
2016/17 Annual Service Plan Report 33
accordance with accepted actuarial practice and regulatory requirements. In performing the evaluation, the appointed actuary makes assumptions as to the future rates of claims frequency and severity, inflation, reinsurance recoveries and expenses taking into consideration the circumstances of ICBC and the insurance policies in force. The appointed actuary, in his verification of the underlying data used in the valuation, also makes use of the work of the external auditor.
Mr. Weiland meets every year with PricewaterhouseCoopers’ valuation actuaries and ICBC’s management to discuss business developments, changes in claims processing and claims trends. These discussions assist the independent parties in developing expectations around and assessing management’s estimate of the claims provision.
Mark Blucher Bill Carpenter President and Chief Executive Officer Chief Financial Officer and Chief Actuary
June 8, 2017 June 8, 2017
Insurance Corporation of British Columbia
2016/17 Annual Service Plan Report 34
Independent Auditor’s Report
Minister Responsible for the Insurance Corporation of British Columbiahe Board of Directors for the Insurance Corporation of British Columbia
We have audited the accompanying consolidated financial statements of Insurance Corporation of British Columbia and its subsidiaries, which comprise the consolidated statement of financial positionas at March 31, 2017 and the consolidated statement of comprehensive income, changes in equity andcash flows for the 15 month period then ended, and the related notes, which comprise a summary ofsignificant accounting policies and other explanatory information.
Management’s responsibility for the consolidated financial statements Management is responsible for the preparation and fair presentation of these consolidated financial statements in accordance with International Financial Reporting Standards, and for such internal control as management determines is necessary to enable the preparation of consolidated financial statements that are free from material misstatement, whether due to fraud or error.
Auditor’s responsibilityOur responsibility is to express an opinion on these consolidated financial statements based on ouraudit. We conducted our audit in accordance with Canadian generally accepted auditing standards.Those standards require that we comply with ethical requirements and plan and perform the audit to obtain reasonable assurance about whether the consolidated financial statements are free frommaterial misstatement. An audit involves performing procedures to obtain audit evidence about the amounts and disclosuresin the consolidated financial statements. The procedures selected depend on the auditor’s judgment, including the assessment of the risks of material misstatement of the consolidated financialstatements, whether due to fraud or error. In making those risk assessments, the auditor considersinternal control relevant to the entity’s preparation and fair presentation of the consolidated financial statements in order to design audit procedures that are appropriate in the circumstances, but not for thepurpose of expressing an opinion on the effectiveness of the entity’s internal control. An audit also includes evaluating the appropriateness of accounting policies used and the reasonableness of accounting estimates made by management, as well as evaluating the overall presentation of theconsolidated financial statements.
We believe that the audit evidence we have obtained is sufficient and appropriate to provide a basisfor our audit opinion.
Opinion In our opinion, the consolidated financial statements present fairly, in all material respects, the financial position of Insurance Corporation of British Columbia and its subsidiaries as at March 31, 2017 and their financial performance and their cash flows for the 15 month period then ended in accordance with International Financial Reporting Standards.
Chartered Professional Accountants
Vancouver, British Columbia June 8, 2017
Insurance Corporation of British Columbia
2016/17 Annual Service Plan Report 35
Actuary’s ReportI have valued the policy liabilities, including reinsurance recoverables, in the consolidated statement of financial position of the Insurance Corporation of British Columbia as at March 31, 2017 and their changes in its consolidated statement of comprehensive loss for the 15 month period ended in accordance with accepted actuarial practice in Canada, including selection of appropriate assumptions and methods. In my opinion, the amount of the policy liabilities, including reinsurance recoverables, makes appropriate provision for all policy obligations, and the consolidated financial statements fairly present the results of the valuation.
William T. Weiland
Fellow, Canadian Institute of Actuaries Eckler Ltd.
Vancouver, British Columbia June 8, 2017
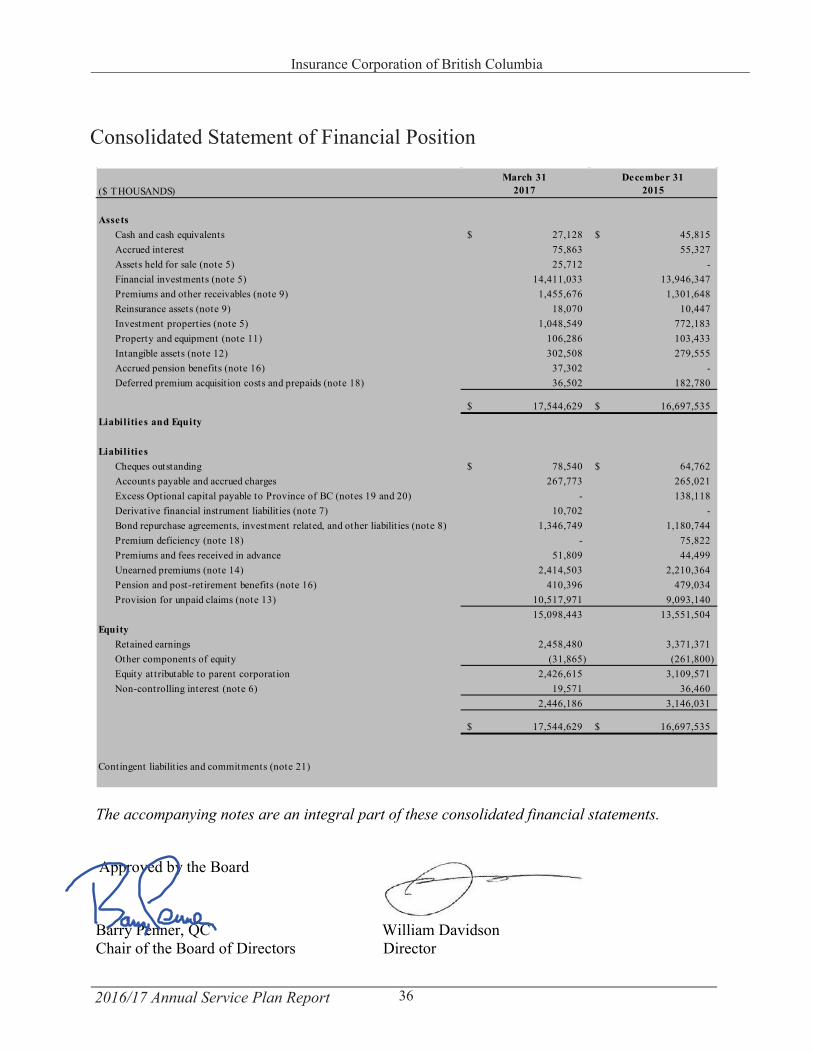
The accompanying notes are an integral part of these consolidated financial statements.
Approved by the Board
Barry Penner, QC William DavidsonChair of the Board of Directors Director
($ THOUSANDS)March 31
2017December 31
2015
AssetsCash and cash equivalents 27,128$ 45,815$Accrued interest 75,863 55,327Assets held for sale (note 5) 25,712 - Financial investments (note 5) 14,411,033 13,946,347Premiums and other receivables (note 9) 1,455,676 1,301,648Reinsurance assets (note 9) 18,070 10,447Investment properties (note 5) 1,048,549 772,183Property and equipment (note 11) 106,286 103,433Intangible assets (note 12) 302,508 279,555Accrued pension benefits (note 16) 37,302 - Deferred premium acquisition costs and prepaids (note 18) 36,502 182,780
17,544,629$ 16,697,535$Liabilities and Equity
LiabilitiesCheques outstanding 78,540$ 64,762$Accounts payable and accrued charges 267,773 265,021Excess Optional capital payable to Province of BC (notes 19 and 20) - 138,118Derivative financial instrument liabilit ies (note 7) 10,702 - Bond repurchase agreements, investment related, and other liabilit ies (note 8) 1,346,749 1,180,744Premium deficiency (note 18) - 75,822Premiums and fees received in advance 51,809 44,499Unearned premiums (note 14) 2,414,503 2,210,364Pension and post-retirement benefits (note 16) 410,396 479,034Provision for unpaid claims (note 13) 10,517,971 9,093,140
15,098,443 13,551,504Equity
Retained earnings 2,458,480 3,371,371Other components of equity (31,865) (261,800)Equity attributable to parent corporation 2,426,615 3,109,571Non-controlling interest (note 6) 19,571 36,460
2,446,186 3,146,031
17,544,629$ 16,697,535$
Contingent liabilit ies and commitments (note 21)
Insurance Corporation of British Columbia
Consolidated Statement of Financial Position
2016/17 Annual Service Plan Report 36
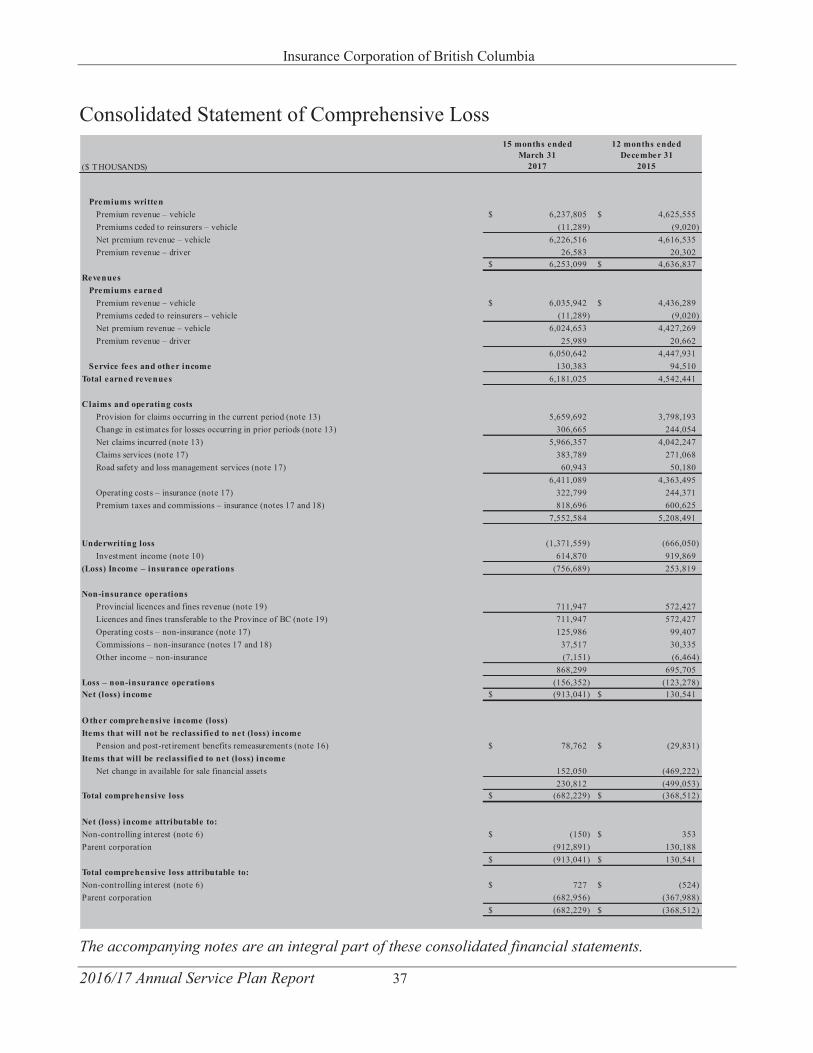
Insurance Corporation of British Columbia
2016/17 Annual Service Plan Report 37
Consolidated Statement of Comprehensive Loss
The accompanying notes are an integral part of these consolidated financial statements.
($ THOUSANDS)
15 months endedMarch 31
2017
12 months ended December 31
2015
Premiums writtenPremium revenue – vehicle 6,237,805$ 4,625,555$ Premiums ceded to reinsurers – vehicle (11,289) (9,020) Net premium revenue – vehicle 6,226,516 4,616,535 Premium revenue – driver 26,583 20,302
6,253,099$ 4,636,837$ Revenues
Premiums earnedPremium revenue – vehicle 6,035,942$ 4,436,289$ Premiums ceded to reinsurers – vehicle (11,289) (9,020) Net premium revenue – vehicle 6,024,653 4,427,269 Premium revenue – driver 25,989 20,662
6,050,642 4,447,931 Service fees and other income 130,383 94,510
Total earned revenues 6,181,025 4,542,441
Claims and operating costsProvision for claims occurring in the current period (note 13) 5,659,692 3,798,193 Change in estimates for losses occurring in prior periods (note 13) 306,665 244,054 Net claims incurred (note 13) 5,966,357 4,042,247 Claims services (note 17) 383,789 271,068 Road safety and loss management services (note 17) 60,943 50,180
6,411,089 4,363,495 Operating costs – insurance (note 17) 322,799 244,371 Premium taxes and commissions – insurance (notes 17 and 18) 818,696 600,625
7,552,584 5,208,491
Underwriting loss (1,371,559) (666,050) Investment income (note 10) 614,870 919,869
(Loss) Income – insurance operations (756,689) 253,819
Non-insurance operationsProvincial licences and fines revenue (note 19) 711,947 572,427 Licences and fines transferable to the Province of BC (note 19) 711,947 572,427 Operating costs – non-insurance (note 17) 125,986 99,407 Commissions – non-insurance (notes 17 and 18) 37,517 30,335 Other income – non-insurance (7,151) (6,464)
868,299 695,705 Loss – non-insurance operations (156,352) (123,278) Net (loss) income (913,041)$ 130,541$
O ther comprehensive income (loss) Items that will not be reclassified to net (loss) income
Pension and post-retirement benefits remeasurements (note 16) 78,762$ (29,831)$ Items that will be reclassified to net (loss) income
Net change in available for sale financial assets 152,050 (469,222) 230,812 (499,053)
Total comprehensive loss (682,229)$ (368,512)$
Net (loss) income attributable to:Non-controlling interest (note 6) (150)$ 353$ Parent corporation (912,891) 130,188
(913,041)$ 130,541$ Total comprehensive loss attributable to:Non-controlling interest (note 6) 727$ (524)$ Parent corporation (682,956) (367,988)
(682,229)$ (368,512)$
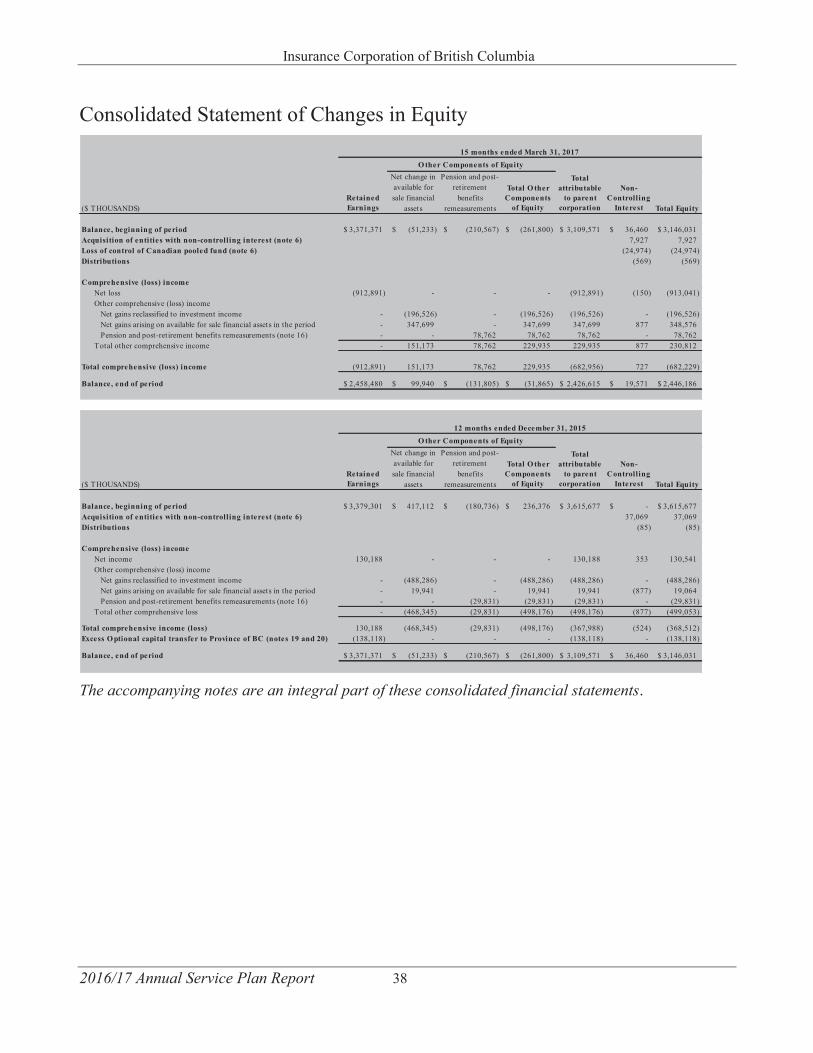
Insurance Corporation of British Columbia
2016/17 Annual Service Plan Report 38
Consolidated Statement of Changes in Equity
The accompanying notes are an integral part of these consolidated financial statements.
($ THOUSANDS)Retained Earnings
Net change in available for sale financial
assets
Pension and post-retirement
benefits remeasurements
Total O ther Components
of Equity
Total attributable
to parent corporation
Non-Controlling
Interest Total Equity
Balance, beginning of period 3,371,371$ (51,233)$ (210,567)$ (261,800)$ 3,109,571$ 36,460$ 3,146,031$Acquisition of entities with non-controlling interest (note 6) 7,927 7,927Loss of control of Canadian pooled fund (note 6) (24,974) (24,974)Distributions (569) (569)
Comprehensive (loss) incomeNet loss (912,891) - - - (912,891) (150) (913,041)Other comprehensive (loss) income
Net gains reclassified to investment income - (196,526) - (196,526) (196,526) - (196,526)Net gains arising on available for sale financial assets in the period - 347,699 - 347,699 347,699 877 348,576Pension and post-retirement benefits remeasurements (note 16) - - 78,762 78,762 78,762 - 78,762
Total other comprehensive income - 151,173 78,762 229,935 229,935 877 230,812
Total comprehensive (loss) income (912,891) 151,173 78,762 229,935 (682,956) 727 (682,229)
Balance, end of period 2,458,480$ 99,940$ (131,805)$ (31,865)$ 2,426,615$ 19,571$ 2,446,186$
($ THOUSANDS)Retained Earnings
Net change in available for sale financial
assets
Pension and post-retirement
benefits remeasurements
Total O ther Components
of Equity
Total attributable
to parent corporation
Non-Controlling
Interest Total Equity
Balance, beginning of period 3,379,301$ 417,112$ (180,736)$ 236,376$ 3,615,677$ -$ 3,615,677$ Acquisition of entities with non-controlling interest (note 6) 37,069 37,069Distributions (85) (85)
Comprehensive (loss) incomeNet income 130,188 - - - 130,188 353 130,541Other comprehensive (loss) income
Net gains reclassified to investment income - (488,286) - (488,286) (488,286) - (488,286)Net gains arising on available for sale financial assets in the period - 19,941 - 19,941 19,941 (877) 19,064Pension and post-retirement benefits remeasurements (note 16) - - (29,831) (29,831) (29,831) - (29,831)
Total other comprehensive loss - (468,345) (29,831) (498,176) (498,176) (877) (499,053)
Total comprehensive income (loss) 130,188 (468,345) (29,831) (498,176) (367,988) (524) (368,512)Excess O ptional capital transfer to Province of BC (notes 19 and 20) (138,118) - - - (138,118) - (138,118)
Balance, end of period 3,371,371$ (51,233)$ (210,567)$ (261,800)$ 3,109,571$ 36,460$ 3,146,031$
12 months ended December 31, 2015O ther Components of Equity
15 months ended March 31, 2017O ther Components of Equity
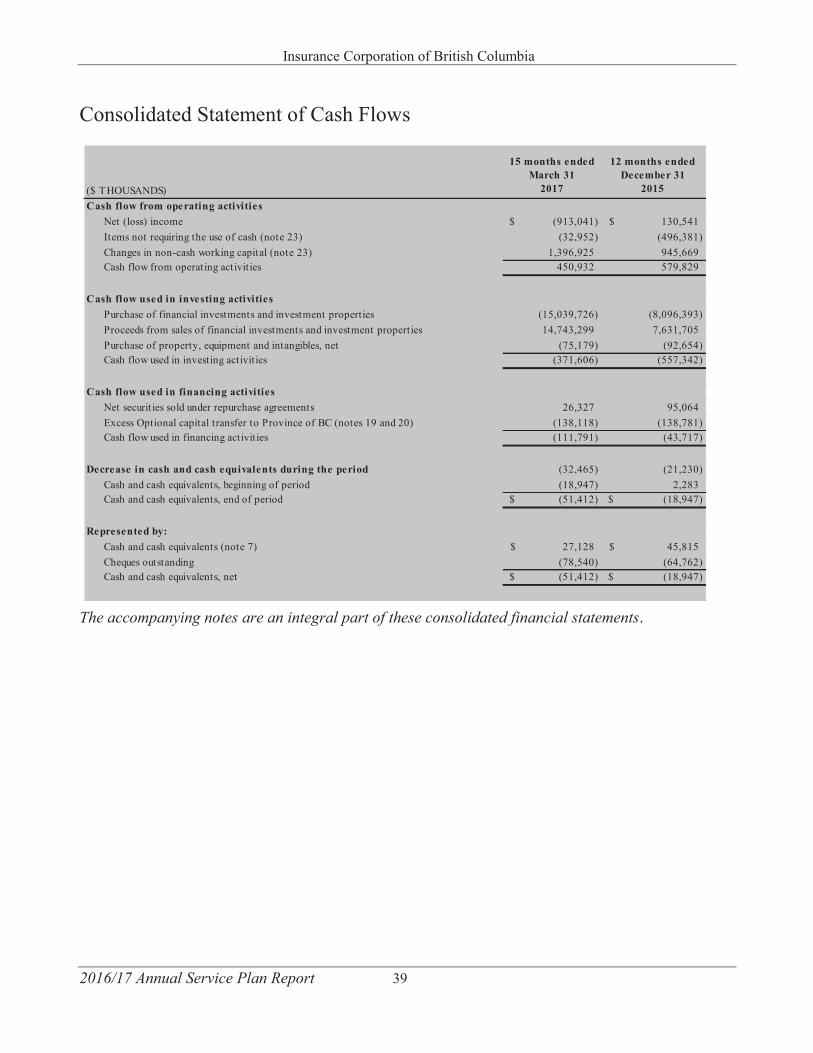
Insurance Corporation of British Columbia
2016/17 Annual Service Plan Report 39
Consolidated Statement of Cash Flows
The accompanying notes are an integral part of these consolidated financial statements.
($ THOUSANDS)
15 months ended March 31
2017
12 months ended December 31
2015Cash flow from operating activities
Net (loss) income (913,041)$ 130,541$ Items not requiring the use of cash (note 23) (32,952) (496,381)Changes in non-cash working capital (note 23) 1,396,925 945,669Cash flow from operating activities 450,932 579,829
Cash flow used in investing activitiesPurchase of financial investments and investment properties (15,039,726) (8,096,393)Proceeds from sales of financial investments and investment properties 14,743,299 7,631,705Purchase of property, equipment and intangibles, net (75,179) (92,654)Cash flow used in investing activities (371,606) (557,342)
Cash flow used in financing activitiesNet securities sold under repurchase agreements 26,327 95,064Excess Optional capital transfer to Province of BC (notes 19 and 20) (138,118) (138,781)Cash flow used in financing activities (111,791) (43,717)
Decrease in cash and cash equivalents during the period (32,465) (21,230)Cash and cash equivalents, beginning of period (18,947) 2,283Cash and cash equivalents, end of period (51,412)$ (18,947)$
Represented by:Cash and cash equivalents (note 7) 27,128$ 45,815$ Cheques outstanding (78,540) (64,762)Cash and cash equivalents, net (51,412)$ (18,947)$
Insurance Corporation of British Columbia
2016/17 Annual Service Plan Report 40
Notes to Consolidated Financial Statements
For the 15 month period ended March 31, 2017
1. Corporate InformationThe Insurance Corporation of British Columbia (the Corporation) is a wholly-owned Crown corporation of the Province of B.C., not subject to income taxes under the Income Tax Act (Canada),incorporated in 1973 and continued under the Insurance Corporation Act, R.S.B.C. 1996 Chapter 228. The head office of the Corporation is 151 West Esplanade, North Vancouver, British Columbia. The Corporation operates and administers plans of universal compulsory vehicle insurance (Basic) and optional vehicle insurance as set out under the Insurance (Vehicle) Act, and is also responsible for non-insurance services under the Insurance Corporation Act and the Motor Vehicle Act. Non-insurance services include driver licensing, vehicle registration and licensing, violation ticketadministration and government fines collection. As a result of amendments to the Insurance Corporation Act in 2003, the Corporation is subject to regulation by the British Columbia Utilities Commission (BCUC) with respect to universal compulsory vehicle insurance rates and services (note 22).
Basic insurance includes the following coverages: $200,000 third party liability protection (higher for some commercial vehicles), access to accident benefits including a maximum of $150,000 for medical and rehabilitation expenses and up to $300 per week for wage loss, $1,000,000 underinsured motorist protection, and also protection against uninsured and unidentified motorists within and outside the Province of B.C. The Corporation also offers insurance in a competitive environment (Optional), which includes, but is not limited to, the following coverages: extended third party liability, comprehensive, collision, and loss of use. The Corporation’s Basic and Optional insurance products are distributed by approximately 900 independent brokers located throughout the Province of B.C. The Corporation has the power and capacity to act as an insurer and reinsurer in all classes of insurance; however, the Corporation currently only acts as a vehicle insurer.
In January 2016, the Corporation’s Board of Directors approved a change to the Corporation’s fiscal year-end from December 31 to March 31 to align with the Province of B.C.’s March 31 fiscal year-end date. This was followed by a change to the Insurance Corporation Act effective March 10, 2016 setting the Corporation’s fiscal year-end at March 31. These consolidated financial statements represent the first complete fiscal period subsequent to this decision. To transition to the new fiscal year-end, the current period includes the 15 months ended March 31, 2017, with comparative financial statements for the 12 months ended December 31, 2015. As a result, information contained in these consolidated financial statements may not be comparable.
These consolidated financial statements have been authorized for issue by the Board of Directors on June 8, 2017.
Insurance Corporation of British Columbia
2016/17 Annual Service Plan Report 41
2. Summary of Significant Accounting PoliciesThe significant accounting policies applied in preparation of these consolidated financial statements are set out below. They have been prepared under the historical cost convention, as modified by the revaluation of certain financial assets at fair value. These policies have been consistently applied to all periods presented, unless otherwise stated.
a) Basis of reporting
The consolidated financial statements of the Corporation have been prepared in accordance with the International Financial Reporting Standards (IFRS) as issued by the International Accounting Standards Board (IASB) and required by the Budget Transparency and Accountability Act. The consolidated financial statements include the accounts of the Corporation and its subsidiary companies. The Corporation’s reporting currency and functional currency for all of its operations is the Canadian dollar, unless otherwise stated.
The Corporation reports revenues and expenses attributable to Basic insurance separately from the other operations of the Corporation (note 22). The Corporation presents investment income separately from underwriting results as this reflects how the business operations are managed and provides more relevant, reliable, comparable and understandable information of these consolidated financial statements and reflects the Corporation’s results from underwriting activities and investment activities. The Corporation also provides a number of non-insurance services on behalf of the Province of B.C. The costs associated with these non-insurance activities are borne by the Corporation. The amounts collected and remitted as well as the related costs are accounted for and disclosed separately in the consolidated statement of comprehensive loss under non-insurance operations for greater transparency (note 19). During the period, the Corporation changed its consolidated statement of cash flows to the indirect method due to preparation efficiency and is a more commonly used financial reporting practice (note 23).
The preparation of consolidated financial statements in conformity with IFRS requires the use of certain critical accounting estimates. It also requires management to exercise its judgment in the process of applying the Corporation’s accounting policies. The estimates and assumptions that have a significant risk of causing a material adjustment to the carrying amounts of assets and liabilities within the next financial period are disclosed in note 3.
b) Basis of consolidation
ControlThe Corporation consolidates the financial statements of all subsidiary companies over which ithas control. Control is achieved when the Corporation has the power to govern the financial andoperating policies of an entity so as to obtain benefits from its activities. Entities are fullyconsolidated from the date on which control is transferred to the Corporation. All but two of theCorporation’s investment properties are held individually in fully-owned nominee holdingcompanies. The Corporation does not have any active operating subsidiary companies. All inter-company transactions and balances are eliminated.
Non-controlling interest (NCI), presented as part of equity, represents the portion of an entity’s profit or loss and net assets that are not attributable to the Corporation. The Corporation attributes
Insurance Corporation of British Columbia
2016/17 Annual Service Plan Report 42
total comprehensive income or loss of entities between the parent and the NCI based on their respective ownership interests. All subsidiaries are wholly-owned except for a few, which are Canadian limited partnerships (note 6).
When the Corporation loses control over an entity, it derecognizes the assets and liabilities of the entity, and any related NCI and other components of equity. Any resulting gain or loss is recognized in profit or loss. Any interest retained in the entity is measured at fair value when control is lost.
In 2015, the Corporation had control of one Canadian equity pooled fund investment (the Fund). The Fund was fully consolidated, with the NCI portion attributed to NCI within equity. In May 2016, the Corporation ceased to control the Fund (note 6).
Significant influence
Associates are entities over which the Corporation has significant influence, which means it has the power to participate in the financial and operating decisions of the investee but does not have control or joint control over the financial or operating policies. Associates generally involve a shareholding of 20% to 50% of the voting rights. In some cases, voting rights in themselves are not sufficient to assess power or significant influence over the relevant activities of the investee. In such cases, judgment is applied through the analysis of management agreements, the effectiveness of voting rights, the significance of the benefits to which the Corporation is exposed and the degree to which the Corporation can use its power or significant influence to affect its returns from investees. Associates are accounted for using the equity method. The Corporation has determined that it does not have significant influence in an investment in a limited partnership for real estate (note 3d), thus the investment is not classified as an associate.
Joint operation
The Corporation accounts for its interest in joint operations by recognizing its share of assets, liabilities, revenues and expenses in accordance with its contractually conferred rights and obligations. The Corporation owns 50% share of each of its three joint operations, one of which is with a Limited Partner. All joint operations are investment properties in Canada.
c) Service fees
Service fees on the Corporation’s payment plan are recognized monthly over the term of the policy. For six or twelve month term Autoplan policies, the Corporation’s payment plan enables customers to make monthly or quarterly payments. The related interest bearing receivables are carried at amortized cost as determined using the effective interest method.
d) Insurance contracts
The Corporation issues insurance contracts that transfer insurance risk which results in the possibility of having to pay benefits on the occurrence of an insured event. The Corporation accounts for insurance contracts as follows:
Insurance Corporation of British Columbia
2016/17 Annual Service Plan Report 43
Premiums earned
The Corporation recognizes vehicle premiums on a straight-line basis over the term of each vehicle policy written. Driver premiums are earned over 12 months. Unearned premiums are the portion of premiums relating to the unexpired term, net of any premium refunds.
Deferred premium acquisition costs
To the extent premium acquisition costs such as commissions and premium taxes are recoverable from unearned premiums, they are deferred and amortized to income over the term of the related policies. An actuarial evaluation is performed to determine the amount allowable for deferral. The method followed in determining the deferred costs limits the amount of the deferral to the amount recoverable from unearned premiums, after giving consideration to the investment income, claims costs, and adjustment expenses expected to be incurred as the premiums are earned. A premium deficiency exists when future claims and related expenses are expected to exceed unearned premiums. When this occurs, the premium deficiency is recognized as a liability and any deferred premium acquisition costs are written down.
Provision for unpaid claims
The provision for unpaid claims represents the estimated amounts required to settle all unpaid claims. It includes amounts for claims that are incurred but not reported (IBNR) plus development on known case reserves and loss adjustment expenses, and is gross of recoveries from reinsurance. The provision for unpaid claims is established according to accepted actuarial practice in Canada. It is carried on a discounted basis and therefore reflects the time value of money, and includes a provision for adverse deviations (PfAD).
As with any insurance company, the provision for unpaid claims is an estimate subject to volatility, which could be material in the near term. The estimation of claims development involves assessing the future behaviour of claims, taking into consideration the consistency of the Corporation’s claims handling procedures, the amount of information available, and historical delays in reporting claims. In general, the more time required for the settlement of a group of claims, the more variable the estimates will be. Variability can be caused by receipt of additional information, significant changes in the average cost or frequency of claims over time, significant changes in the Corporation’s claims operations, the timing of claims payments, and future rates of investment return.
The ultimate cost of long settlement term claims is particularly challenging to predict for several reasons, which include some claims not being reported until many years after a policy term, or changes in the legal environment, case law or legislative amendments. The Corporation is subject to litigation arising in the normal course of conducting its insurance business, which is taken into account in establishing the provision for unpaid claims and other liabilities. Provisions for such liabilities are established by examining the facts of tendered claims and are adjusted in the aggregate for ultimate loss expectations based upon historical experience patterns, current socio-economic trends and structured settlements provided in the form of consistent periodic payments as opposed to lump-sum payments.
Insurance Corporation of British Columbia
2016/17 Annual Service Plan Report 44
To recognize the uncertainty in establishing best estimates, as set out in the Standards of Practice of the Canadian Institute of Actuaries, the Corporation includes a PfAD, consisting of three elements: an interest rate margin, a reinsurance margin, and a claims development margin. The interest rate margin reduces the expected investment rate of return used for discounting to make allowance for i) asset liability mismatch risk, ii) uncertainty in the timing of claims settlement, and iii) credit risk within the investment portfolio. The reinsurance margin makes allowance for the collectability of recoverable amounts from reinsurers and is a reduction in the expected amount of reinsurance recoverable. The claims development margin makes allowance for the various factors that can create greater uncertainty in the estimates of ultimate claims costs, including i) changes in the Corporation’s operations (e.g. claims practices), ii) the underlying data upon which the unpaid claims estimates are based, and iii) the nature of the lines of business written. The claims development margin is a percentage of the unpaid claims, gross of reinsurance, and is larger for injury lines that generally require more time for claims to settle and close.
The Corporation also assesses the adequacy of its insurance liabilities at the end of each reporting period to ensure that they are sufficient to cover expected future cash flows. All changes to the estimate since the end of the last reporting period are recorded in the current period as a ‘Change in estimates for losses occurring in prior periods’. Methods of estimation have been used which the Corporation believes produce reasonable results given current information.
Reinsurance
Reinsurance balances are presented separately on the consolidated statement of financial position to indicate the extent of credit risk related to reinsurance and its obligations to policyholders, and on the consolidated statement of comprehensive loss to indicate the results of its retention of premiums written.
Reinsurance assets, including both reinsurance recoverable and reinsurance receivable, are shown on the consolidated statement of financial position. A PfAD is included in the discounted amount recoverable from reinsurers. The PfAD is applied on a consistent basis with the underlying provision for unpaid claims and includes a reinsurance recovery portion that reflects considerations relating to potential collectability issues with reinsurers.
e) Cash and cash equivalents
Cash and cash equivalents are short-term, highly liquid investments that are subject to insignificant changes in fair value, including cash on hand, deposits with financial institutions that can be withdrawn without prior notice or penalty, and money market securities with a term less than 90 days from the date of acquisition.
f) Assets held for sale
Non-current assets that are expected to be recovered primarily through sale rather than through continuing use, and the sale is considered to be highly probable, are classified as held for sale. Immediately before classification as held for sale, the assets are remeasured at cost less accumulated depreciation and impairment losses. Thereafter, the assets are measured at the lower of their carrying amount and fair value less costs to sell. Impairment losses on initial classification as held for sale and
Insurance Corporation of British Columbia
2016/17 Annual Service Plan Report 45
subsequent gains and losses on remeasurement are recognized in profit or loss; these gains are not recognized in excess of any cumulative impairment loss. Once classified as held for sale, non-current assets are no longer amortized or depreciated (note 5).
g) Financial assets
The Corporation designates its financial instruments as fair value through profit or loss (FVTPL), loans and receivables (Loans) or available for sale (AFS) depending upon the purpose for which the financial assets were acquired. Monetary assets are assets that are to be received in a fixed or determinable number of units of currency. Monetary financial assets include bonds and non-monetary financial assets include equities. The Corporation’s financial assets are accounted for based on their classification as follows:
Fair value through profit or loss The Corporation’s cash and cash equivalents (note 2e) and derivative financial instruments (note 2j) are accounted for as FVTPL. A financial asset is classified in this category if it is acquired principally for the purpose of selling in the short-term. The Corporation’s derivative financial instruments are forward contracts that are not in a hedging relationship, which are classified as FVTPL.
FVTPL financial assets are recorded at fair value on initial recognition and for subsequent measurement. Transaction costs and changes in the fair value are recognized in investment income on the consolidated statement of comprehensive loss.
Loans and receivables Loans are non-derivative financial assets with fixed or determinable payments that are not quoted in an active market. The Corporation has classified its mortgage portfolio, loan, and premiums and other receivables as Loans. The mortgage portfolio consists of mortgages and mortgage bonds. The Corporation currently has one loan to a Canadian operation to acquire a non-controlling interest in a Canadian limited partnership.
Loans are recorded at fair value on initial recognition and subsequently measured at amortized cost using the effective interest rate method. Transaction costs are included in the initial carrying amount of the assets. Impairment losses on loans are recognized in investment income on the consolidated statement of comprehensive loss.
Available for sale Non-derivative financial assets that are not classified as Loans or FVTPL are accounted for as AFS. The Corporation has designated its money market securities with a term greater than 90 days from the date of acquisition, and its bond and equity portfolios as AFS.
AFS financial assets are recorded at fair value on initial recognition or the trade date and for subsequent measurement. Transaction costs are included in the initial carrying amount of the assets.
Insurance Corporation of British Columbia
2016/17 Annual Service Plan Report 46
Changes in the fair value, other than due to foreign exchange, of an AFS financial asset are recorded in other comprehensive income (OCI), until the financial asset is disposed of or becomes impaired, at which time the gain or loss will be recognized in investment income. Changes in the fair value due to foreign exchange on a non-monetary AFS financial asset are recorded in OCI. Changes in fair value due to foreign exchange on a monetary AFS financial asset are recorded in investment income. Interest calculated using the effective interest method is accrued daily and recognized in investment income. Dividends are recognized in investment income when the right to receive payments is established on the ex-dividend date.
Financial assets are derecognized when the rights to receive cash flows have expired or have been transferred along with substantially all of the risks and rewards of ownership.
h) Translation of foreign currencies
Foreign currency transactions are translated at exchange rates at the date of the sale or purchase. Foreign currency assets and liabilities considered as monetary items are translated at exchange rates in effect at the period end date. Foreign exchange gains and losses resulting from the settlement of such transactions and from the translation at period end exchange rates of monetary assets and liabilities denominated in foreign currencies are recognized in investment income.
Translation differences on non-monetary AFS financial assets, such as equity securities, are recognized as part of the change in fair value in OCI until the security is disposed of or impairment is recorded. Translation differences on monetary AFS financial assets are recorded in investment income.
i) Fair value of financial assets
In accordance with IFRS 13 Fair Value Measurement, the Corporation defines fair value as the price that would be received to sell an asset or paid to transfer a liability in an orderly transaction between market participants at the measurement date. Fair value measurement is classified as Level 1, 2 or 3 based on the degree to which fair value is observable:
Level 1 inputs to the valuation methodology are quoted prices (unadjusted) in active markets for identical assets or liabilities.
Level 2 inputs to the valuation methodology include inputs other than quoted prices included within Level 1 that are observable for the asset or liability, either directly or indirectly.
Level 3 inputs to the valuation methodology are not based on observable market data. Where an active market does not exist, and quoted prices are unavailable, fair values are determined using valuation techniques that refer to observable market data. Where observable market data is unavailable, the estimated fair value is determined using valuation techniques.
The estimated fair value of money market securities greater than 90 days, which are not considered cash and cash equivalents, is approximated by cost. The estimated fair value for bonds and equities is based on quoted prices or on other observable market information, where available. The estimated fair value for mortgages is determined by referencing the yield curve of Government of Canada bonds to the corresponding maturity dates of the underlying mortgages, plus an estimated risk premium. The
Insurance Corporation of British Columbia
2016/17 Annual Service Plan Report 47
risk premium is determined by factors such as the location of the property, tenant profile, and degree of leverage of the property.
These valuations are reviewed each reporting date by management.
j) Derivative financial instruments
The Corporation uses derivative financial instruments to manage the foreign exchange risks related to its US bond portfolio (note 7).
Foreign exchange related derivative instruments that are not designated as hedges are recorded using the mark-to-market method of accounting whereby instruments are recorded at fair value as an asset or liability with changes in fair value recognized in investment income in the period of change. The related foreign exchange gains or losses on the bond portfolio are included in investment income on the consolidated statement of comprehensive loss.
k) Investment properties
Properties held for rental income or capital appreciation that are not occupied by the Corporation are classified as investment properties.
The estimated fair value of the Corporation’s investment properties is based on independent appraisals by professionally qualified external valuators made during the period or on a combination of discounted cash flows using current market capitalization rates and the direct capitalization method. The estimated fair value as calculated using the direct capitalization method is determined by dividing the net operating income by the capitalization rate.
The Corporation has certain properties that serve dual purposes, investment and own-use portions. If the investment and own-use portions can be sold separately or leased out separately under a finance lease, the portions are accounted for separately. If the portions cannot be sold separately, the property is investment property only if an insignificant portion is held for own-use in the supply of services or for administrative purposes. Where the portion held for own-use is significant then it would be treated as property and equipment. The Corporation has two properties that serve dual purposes, both of which are classified as investment properties.
Investment properties comprise of land and buildings and are initially recognized at the fair value of the purchase consideration plus directly attributable costs. Subsequent to initial recognition, the investment properties are carried at cost less accumulated depreciation for the building portion and impairment, if any.
Depreciation is provided on a straight-line basis at 2.5% to 5.0% annually over the investment properties’ useful life.
l) Investment-related liabilities
Investment-related liabilities include mortgage debt associated with investment properties (note 2k) and are initially recognized at fair value and subsequently measured at amortized cost.
Insurance Corporation of British Columbia
2016/17 Annual Service Plan Report 48
m) Bond repurchase agreements
The Corporation participates in the sale and repurchase of Government of Canada and Provincial bonds which are sold and simultaneously agreed to be repurchased at a future date with the market repurchase rate determining the forward contract price. These sale and repurchase arrangements are accounted for as financial liabilities and are initially recognized at fair value and subsequently measured at cost. The difference between the sale price and the agreed repurchase price on a repurchase contract is recognized as interest expense. Assets transferred under repurchase agreements are not derecognized as substantially all the risks and rewards of ownership are retained by the Corporation and a liability equal to the consideration received has been recorded.
n) Accounts payable and accrued charges
Accounts payable and accrued charges are obligations to pay for goods and services that have been acquired in the ordinary course of business from suppliers. Accounts payable and accruals are recognized initially at fair value and subsequently measured at amortized cost.
o) Provisions
Provisions are recognized when the Corporation has a present legal or constructive obligation as a result of past events, and it is probable that an outflow of resources will be required to settle the obligation and the amount can be reliably estimated. These costs are included in the accounts payable and accrued charges presented on the consolidated statement of financial position. Future operating losses are not recognized.
Where these amounts are due more than 12 months after the reporting date, they are measured at the present value of the expenditures expected to settle the obligation using a discount rate that reflects current market assessments of the time value of money and the risks specific to the obligation.
p) Pension and post-retirement benefits
The amounts recognized in net income in respect of defined benefit pension plans and post-retirement benefits are as follows:
The Corporation’s portion of the current service costs; Non-investment costs; Interest costs; Past service costs; and Impact of any curtailment or settlements during the period.
The current service cost is equal to the present value of benefits earned by members during the reporting period.
The non-investment costs are equal to expenses paid from the plans in the reporting period relating to the administration of the plans.
Insurance Corporation of British Columbia
2016/17 Annual Service Plan Report 49
The interest costs are calculated using the discount rate at the beginning of the reporting period and applied to the net liability at the beginning of the reporting period.
Past service costs arise from plan amendments that increase or decrease the obligation. Past service costs are recognized immediately in net income.
The changes in the defined benefit obligation and the changes in the fair value of plan assets that result from a curtailment or settlement of plan liabilities during the reporting period are recognized in net income.
A plan’s surplus is equal to the excess, if any, of the plan’s assets over its obligations. For plans in surplus, an asset is recognized on the consolidated statement of financial position to the extent that the Corporation can realize an economic benefit, in the form of a refund or a reduction in future contributions, at some point during the life of the plan or when the plan liabilities are settled. For plans in deficit, the resulting net liability is recognized on the consolidated statement of financial position.
The value recognized on the consolidated statement of financial position for each defined benefit pension plan and for post-retirement benefits is calculated at the end of the reporting period as follows:
The defined benefit obligation of the plan; Less the fair value of the plan assets out of which the obligations are to be settled directly; and Adjusted for the net change of any surplus derecognized.
The Corporation recognizes all actuarial remeasurements in the reporting period in which they arise, through OCI on the consolidated statement of comprehensive loss.
Certain current and former employees of the Corporation who were formerly employed in the Motor Vehicle Branch are members of a separate plan, the BC Public Service Pension Plan. This is a multi-employer defined benefit plan for which the Corporation applies defined contribution accounting. Since the BC Public Service Pension Plan pools risks amongst the current and former members of many employers, there is no consistent or reliable basis for allocating the Corporation’s portion of the obligation, assets, and costs. As a result, the Corporation expenses the contributions made. Contributions are subject to change in the future depending on the funded status of the plan.
q) Property and equipment
Property and equipment are initially recorded at fair value and subsequently measured at cost less accumulated depreciation and impairment losses. Cost includes expenditures that are directly attributable to the acquisition or construction of the items including retirement costs. Subsequent costs such as betterments are included in the asset only when it is probable that future economic benefits associated with the item will flow to the Corporation. All other subsequent expenditures are recognized as repairs and maintenance. Capitalized software that is an integral part of the equipment is accounted for as equipment.
Insurance Corporation of British Columbia
2016/17 Annual Service Plan Report 50
Property and equipment are depreciated when they are available for use on a straight-line basis over the estimated useful life of each asset, taking into account the residual value, at the following annual rates:
Buildings 2.5% to 10% Furniture and equipment 10% to 33% Leasehold improvements Term of the lease
The assets’ residual values and useful lives are reviewed annually and adjusted, if appropriate, at each reporting date.
Gains and losses on disposals are determined by comparing the proceeds with the carrying amount and recorded in net income.
r) Intangible assets
Capitalized software that is not an integral part of the equipment is accounted for as an intangible asset. Software development costs, which are comprised of labour and material costs for design, construction, testing, and other costs directly attributable to bringing the asset to a condition where it can be applied in its intended use, are capitalized for infrastructure projects expected to be of continuing benefit to the Corporation, or expensed where the potential future benefits are uncertain or not quantifiable.
Finite life intangible assets are initially recorded at fair value and subsequently carried at cost less accumulated amortization and impairment losses. Intangible assets with finite useful lives are amortized over their estimated useful lives when they are available for use on a straight-line basis at 10% to 33%, taking into account the residual value.
Indefinite life and not available for use intangible assets are not subject to amortization, but are assessed for indicators of impairment at each reporting date.
s) Impairment of assets
Impairment of financial assetsFinancial assets not carried at FVTPL are assessed at each reporting date to determine if there is objective evidence of impairment such as deterioration in the financial health of the investee, industry and sector performance, changes in technology, financing and operational cash flows, and the significance of deterioration in the fair value of the asset below cost. In addition, for equity investments, a prolonged decline is also considered objective evidence of impairment. Where objective evidence of impairment exists, an impairment loss will be recognized as follows:
For AFS financial assets, the related unrealized loss charged to OCI is reclassified to investmentincome.For Loans, the related difference between the amortized cost carrying amount and the fair value,calculated as the present value of the estimated future cash flows, directly from the loan or the saleof collateral, discounted at the asset’s original effective interest rate, is recognized in investmentincome.
Insurance Corporation of British Columbia
2016/17 Annual Service Plan Report 51
If the fair value of a previously impaired debt instrument classified as AFS or a financial asset measured at amortized cost increases and the increase can be objectively related to an event occurring after the impairment loss was recognized, the impairment loss is reversed in investment income. Impairment losses on equity instruments are not reversed.
Impairment of non-financial assetsThe Corporation’s non-financial assets consist primarily of investment properties, property and equipment, and intangible assets. An impairment review is carried out at the end of each reporting period to determine if there are any indicators of impairment. When indicators of impairment exist, the Corporation assesses the asset for impairment. Investment properties are assessed for impairment as separate and identifiable cash-generating units, distinct from the other operations of the Corporation. All other assets are assessed as a group as their cash flows are generated from the operations of the Corporation. If an asset is impaired, the Corporation’s carrying amount is written down to its estimated recoverable amount when material. Recoverable amount is the higher of fair value less costs to sell and value in use. Non-financial assets that suffered an impairment are reviewed for possible reversal of the impairment at each reporting date. If there is a change in estimate of the recoverable amount, an impairment loss is reversed to net income only to the extent that the asset’s carrying value does not exceed the carrying value that would have been determined, net of depreciation, if no impairment loss had been recognized.
t) Leases
Leases in which a significant portion of the risks and rewards of ownership are retained by the lessor are classified as operating leases. Payments made under operating leases are charged to net income on the consolidated statement of comprehensive loss on a straight-line basis over the period of the lease. Where substantially all of the risks and rewards have been transferred to the lessee, the lease is classified as a finance lease. In these cases, an obligation and an asset are recognized based on the present value of the future minimum lease payments and balances are amortized over the lease term or useful life, as applicable.
u) Current and non-current classification of assets and liabilities
Assets are classified as current when expected to be realized within one year of the reporting date. Liabilities are classified as current when expected to be settled within one year of the reporting date. All other assets and liabilities are classified as non-current.
v) Restricted Cash
Restricted cash includes cash balances which the Company does not have immediate access to as they have been pledged to counterparties as security for investments or trade obligations. These balances are available to the Company only upon settlement of the trade obligations for which they have been pledged as security.
Insurance Corporation of British Columbia
2016/17 Annual Service Plan Report 52
3. Critical Accounting Estimates and Judgments
The Corporation makes estimates and judgments that affect the reported amounts of assets and liabilities. These are continually evaluated and based on historical experience and other facts, including expectations of future events that are believed to be reasonable under the circumstances. Management believes its estimates and judgments to be appropriate; however, actual results may be materially different and would be reflected in future periods.
Significant accounting estimates and judgments include:
a) Actuarial methods and assumptions
The Corporation typically employs three standard actuarial methods to analyze the ultimate claims costs, augmented by more in-depth analyses as needed:
The incurred development method;The paid development method; andThe Bornhuetter-Ferguson method.
The standard methods call for a review of historical loss and count development patterns. As part of this review, the Corporation calculates loss and count development factors, which represent the period-to-period changes in a given loss year’s incurred loss amount. Based on an examination of the loss development factors, the Corporation’s Chief Actuary selects a best estimate of development factors that forecast future loss development.
The loss and count development factors rely on a selected baseline. The baseline for the majority of the coverages is the average of the most recent four loss years. The use of a baseline helps maintain consistency in the loss and count development factors from one reserve review to another. Circumstances may arise when the standard methods are no longer appropriate to use. In these cases, and in accordance with accepted actuarial practice, modifications to the methods are made or alternative methods are employed that are specific and appropriate to the circumstances. Circumstances may include a change in the claims settlement environment, a change in the handling or reserving of claims, or an emerging trend in the statistical data used in the analysis.
An additional method is employed to address the increasingly complex bodily injury claims environment, which includes a growing legal representation rate, a shifting frequency mix of bodily injury claims by severity of injury, and a slowdown in the settlement of claims. This additional method used legal status and severity of injury to separate bodily injury claims data into segments of similar complexity and is based on the Adler-Kline claim closure model. It has allowed the Corporation’s Chief Actuary to capture changes in the claim settlement rates within each segment, and changes in the mix of claims by segment, which impacts the bodily injury severity trend rate.
The timing of when the unpaid ultimate claims costs will be paid depends on both the line of business and historical data. Bodily injury lines of business generally take longer to settle than the material damage claims and exhibit greater variability as to the timing and amount ultimately paid to settle a claim. Historical patterns of claims payment data are used to estimate the future claims payment pattern. Expected future paid amounts are then discounted, using the discounted cash flow method, to
Insurance Corporation of British Columbia
2016/17 Annual Service Plan Report 53
determine a present value as of the reporting date. The discount rate is based upon the expected return on the Corporation’s current investment portfolio, the expected asset default risk of its investment portfolio, and assumptions for interest rates relating to reinvestment of maturing investments. These estimates are based on current market returns as well as expectations about future economic and financial developments.
A PfAD is then added to the estimate to recognize sources of uncertainty in the assumptions behind the provision for unpaid claims (note 2d). The PfAD is calculated according to accepted actuarial practice in Canada (note 13).
b) Impairment of financial assets
Judgment is required to determine if there is objective evidence of impairment for financial assets. The Corporation evaluates, among other factors, the financial health of the investee, industry and sector performance, changes in technology, financing and operational cash flows, and the significance of deterioration in the fair value of the asset below cost. In addition, for equity investments a prolonged decline is also considered objective evidence of impairment (note 10).
c) Pension and post-retirement benefits
The cost of pension and post-retirement benefits earned by employees is actuarially determined using the Projected Unit Credit Method and management’s best estimate of future compensation levels and healthcare costs.
The key assumptions used in calculating the cost of pension and post-retirement benefits are the discount rate, rate of compensation increase, inflation rate, life expectancies, Medical Services Plan trends, and extended healthcare cost trends. Together with plan member data, these and other assumptions are used to estimate future benefit eligibility, amount and duration of payments. The rate determined for each of the key assumptions is disclosed in note 16.
The discount rate is used to calculate the present value of the expected future benefit payments and to calculate interest on the net liability. The discount rate is based on high-grade corporate bond yields at the measurement date.
The rate of compensation increase reflects individual job progression, general price level increases, productivity, seniority, promotion, and other factors.
The inflation rate assumption is based on an assessment of historical data, the Bank of Canada target inflation range and the inflation expectations implied by the Government of Canada nominal and real return long-term bond yields.
Life expectancies are based on Canadian mortality tables, and contain a provision for future longevity improvements.
The Medical Services Plan trend rate is based on expected increases reflected in the provincial budget. The future potential cuts to Medical Service Premiums announced on February 21, 2017 as part of the 2017 B.C. provincial pre-election budget have not been reflected.
Insurance Corporation of British Columbia
2016/17 Annual Service Plan Report 54
The extended healthcare trend rate is based on an analysis of plan experience, assumptions about the trend in total healthcare costs, and the proportion that will be covered by private plans.
With the exception of the discount rate, which is based on market conditions at the financial statement date, all other assumptions are management’s best estimate (note 16).
d) Significant influence
The Corporation owns more than 20% of the nominal voting interests in an investment in a limited partnership for real estate. The factors the Corporation considered in making the determination that the Corporation does not have significant influence include the following:
Each limited partner does not have control or power over the operations of this investment;The Corporation does not have voting power in the investment;The Investment Committee of this investment is responsible for overseeing the investingactivities. The Corporation does not have any influence over the Investment Committee; andAlthough the Corporation has one of five seats on the Governance Committee, the GovernanceCommittee itself has no power over the Investment Committee. The role of the GovernanceCommittee is to provide protective rights and is to ensure the investments are compliant withthe Statement of Investment Policy. Further, the Governance Committee does not have anyinfluence over the investing activities or over the management and operation of thepartnership.
e) Deferred Premium Acquisition Costs
IFRS 4 Insurance Contracts specifies “the financial reporting for insurance contracts by any entity that issues such contracts until the Board completes the second phase of its project on insurance contracts”. Until the new Insurance Contracts IFRS standard becomes effective, insurance companies follow the current IFRS 4 standard for reporting/disclosure guidelines and the former Canadian Generally Accepted Accounting Principles (GAAP) Accounting Guideline (AcG) 3 Financial Reporting by Property & Casualty Insurance Companies. AcG-3.6 states that Deferred Premium Acquisition Costs (DPAC) should be determined by reasonable groupings of business, consistent with an insurer's manner of acquiring, servicing and measuring the profitability of its business. Judgment is required to determine what would qualify as reasonable groupings of business.
Previously, Basic and Optional insurance were viewed as two separate lines of business: rates for each line were set independent of each other; profitability of each line was viewed independently; there were no income transfers between the lines of business; management of pricing and risks related to Basic and Optional insurance being separate business groupings. Therefore, they were classified as two business groupings under AcG-3.
Income transfers have now been initiated from Optional to Basic insurance to help keep Basic insurance rates as low as possible (note 22). Therefore, management has now determined that, effective January 1, 2016, a reasonable grouping of business is considered to be at the combined Corporate level. This results in calculating DPAC at a combined Corporate level as opposed to separate calculations for Basic and Optional insurance (note 18).
Insurance Corporation of British Columbia
2016/17 Annual Service Plan Report 55
4. New Accounting Pronouncements
a) Standards and interpretations effective for the period ended March 31, 2017
The Corporation has adopted the standards and interpretations that are relevant to the operations of the Corporation and effective for the 15 month period ended March 31, 2017. There were no material impacts from the adoption of new standards.
b) Standards and interpretations issued but not yet effective and not early adopted
Standards and interpretations issued that are relevant to the operations of the Corporation, but not yet effective include:
IFRS 9 Financial Instruments. Effective for annual periods beginning on or after January 1,2018; early adoption is permitted. IFRS 9 brings together the classification and measurement,impairment and hedge accounting to replace IAS 39 Financial Instruments: Recognition andMeasurement. IFRS 9 introduces a principles-based approach to the classification of financialassets based on an entity’s business model and the nature of the cash flows of the asset. Allfinancial assets, including hybrid contracts, are measured at FVTPL, fair value through OCI oramortized cost. For financial liabilities, IFRS 9 includes the requirements for classification andmeasurement previously included in IAS 39. IFRS 9 also introduces an expected lossimpairment model for all financial assets at amortized costs. The model has three stages: (1)on initial recognition, 12-month expected credit losses are recognized in profit or loss and aloss allowance is established; (2) if credit risk increases significantly and the resulting creditrisk is not considered to be low, full lifetime expected credit losses are recognized; and (3)when a financial asset is considered impaired, interest revenue is calculated based on thecarrying amount of the asset, net of the loss allowance, rather than its gross carrying amount.Finally, IFRS 9 introduces a new hedge accounting model that aligns the accounting for hedgerelationships more closely with an entity’s risk management activities, permits hedgeaccounting to be applied more broadly to a greater variety of hedging instruments and risksand requires additional disclosures. The Corporation will defer the implementation of IFRS 9until its fiscal period beginning April 1, 2021, as allowed under the amendments to IFRS 4Insurance Contracts outlined below.
IFRS 4 (Amendment) Insurance Contracts. Effective for annual periods beginning on or afterJanuary 1, 2018. The amendments introduce two approaches to address concerns about thediffering effective dates of IFRS 9 Financial Instruments and the forthcoming new insurancecontracts standard: the overlay approach and the deferral approach. The overlay approachprovides an option for all issuers of insurance contracts to adjust profit or loss for eligiblefinancial assets by removing any additional accounting volatility that may arise from applyingIFRS 9 before the new insurance contracts standard. The deferral approach providescompanies whose activities are predominantly related to insurance an optional temporaryexemption from applying IFRS 9 until January 1, 2021. By adopting the new insurancestandard and IFRS 9 conjunctively, there will not be any unintended interactions that mayresult from accounting mismatches. The Corporation will defer IFRS 9 until the fiscal period
Insurance Corporation of British Columbia
2016/17 Annual Service Plan Report 56
beginning April 1, 2021. The Corporation will be evaluating the impact of this amendment on its consolidated financial statements.
IFRS 15 Revenue Recognition. Effective for annual periods beginning on or after January 1,2018; early adoption is permitted. The standard establishes a comprehensive framework fordetermining how much and when revenue is recognized. It replaces existing revenuerecognition guidance. IFRS 15 contains a scope exception which excludes insurance contractswithin the scope of IFRS 4. The Corporation has performed an impact analysis and does notexpect the standard to have a material impact to the consolidated financial statements.
IFRS 17 Insurance Contracts. Effective for annual periods beginning on or after January 1,2021. Early adoption is permitted for entities that apply IFRS 9 and IFRS 15 on or before theinitial application of IFRS 17. The standard establishes the principles of recognition,measurement, presentation and disclosure of insurance contracts and supersedes IFRS 4. Thestandard was issued in May 2017 and requires all insurance contracts to be accounted for in aconsistent manner, benefiting both investors and insurance companies. Insurance obligationswill be accounted for using current values, instead of historical cost. The information will beupdated regularly, providing more useful information to users of financial statements. TheCorporation will be evaluating the impact of this standard on its consolidated financialstatements.
IFRS 16 Leases. Effective for annual periods beginning on or after January 1, 2019; earlyadoption permitted. IFRS 16 was issued in January 2016 and is intended to replace IAS 17Leases, and related IFRICs. The standard provides a single lessee accounting model, requiringlessees to recognize assets and liabilities for all leases unless the lease term is 12 months orless or the underlying asset has a low value. Lessor accounting will remain largely unchangedwith previous classifications of operating and finance lease being maintained. The Corporationis in the process of evaluating the impact of this standard on its consolidated financialstatements.
IAS 7 (Amendment) Statement of Cash Flows. Effective for annual periods beginning on orafter January 1, 2017. A disclosure initiative amendment to IAS 7 was issued in January 2017to add additional disclosure requirements regarding changes in liabilities arising fromfinancing activities. As the amendments are for additional disclosure only, the adoption ofthese amendments is not expected to have a material impact to the Corporation’s consolidatedfinancial statements.
IAS 40 (Amendment) Investment Properties. Effective for annual periods beginning on orafter January 1, 2018. The amendment clarified that to transfer to, or from, investmentproperties there must be a change in use. To conclude if a property has changed use thereshould be an assessment of whether the property meets the definition. This change must besupported by evidence. A change in intention, in isolation, is not enough to support a transfer.The adoption of this amendment is not expected to have a material impact to the Corporation’sconsolidated financial statements.
The Corporation has not early adopted these standards.
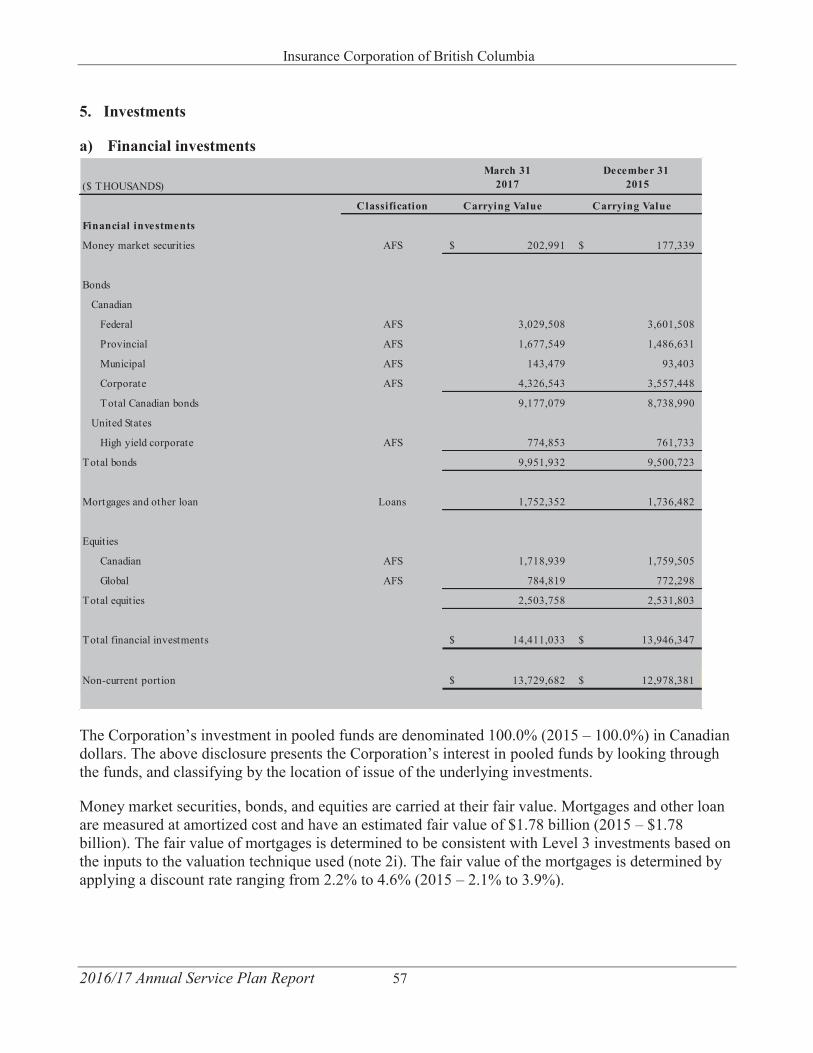
Insurance Corporation of British Columbia
2016/17 Annual Service Plan Report 57
5. Investments
a) Financial investments
The Corporation’s investment in pooled funds are denominated 100.0% (2015 – 100.0%) in Canadian dollars. The above disclosure presents the Corporation’s interest in pooled funds by looking through the funds, and classifying by the location of issue of the underlying investments.
Money market securities, bonds, and equities are carried at their fair value. Mortgages and other loan are measured at amortized cost and have an estimated fair value of $1.78 billion (2015 – $1.78 billion). The fair value of mortgages is determined to be consistent with Level 3 investments based on the inputs to the valuation technique used (note 2i). The fair value of the mortgages is determined by applying a discount rate ranging from 2.2% to 4.6% (2015 – 2.1% to 3.9%).
($ THOUSANDS)March 31
2017December 31
2015
Classification Carrying Value Carrying Value
Financial investments
Money market securities AFS 202,991$ 177,339$
Bonds
Canadian
Federal AFS 3,029,508 3,601,508
Provincial AFS 1,677,549 1,486,631
Municipal AFS 143,479 93,403
Corporate AFS 4,326,543 3,557,448
Total Canadian bonds 9,177,079 8,738,990
United States
High yield corporate AFS 774,853 761,733
Total bonds 9,951,932 9,500,723
Mortgages and other loan Loans 1,752,352 1,736,482
Equities
Canadian AFS 1,718,939 1,759,505
Global AFS 784,819 772,298
Total equities 2,503,758 2,531,803
Total financial investments 14,411,033$ 13,946,347$
Non-current portion 13,729,682$ 12,978,381$
Insurance Corporation of British Columbia
2016/17 Annual Service Plan Report 58
Pooled fundsThe Corporation invests in several pooled funds; the investment strategies of some of these funds include the use of leverage. As at March 31, 2017, the Corporation’s interests range from 8.7% to 94.1% (2015 – 20.4% to 95.7%) of the net assets of the respective funds. The funds are managed by unrelated asset managers. The Corporation holds redeemable units in each of the pooled funds that entitle the holder to a proportional share in the respective fund’s net assets. The carrying value of the Corporation’s investments in pooled funds as at March 31, 2017 is $1.88 billion (2015 – $2.35billion).
Pooled fund investments are included in financial investments as equities. The change in fair value of each pooled fund is included in the OCI section within the consolidated statement of comprehensive loss in ‘Net change in available for sale financial assets’.
The Corporation’s maximum loss exposure from its interests in the pooled funds is equal to the total fair value of these investments.
Asset-backed securitiesThe Corporation purchases bonds that are secured by various assets as part of its investment strategy. The majority of the bonds are issued by Canadian corporate entities and are secured by credit card, auto, or equipment receivables. The Corporation invests mainly in securitization trusts with AAA rated securities that have a first lien on assets and have no exposure to junior or subordinate tranches. The weighted-average duration of the asset-backed securities in the Corporation’s portfolio is 2.5 years (2015 – 2.5 years) and the coupon interest rates range from 1.2% to 2.8% (2015 – 1.1% to 3.5%).
As at March 31, 2017, the carrying value of asset-backed securities included in financial investments in the consolidated statement of financial position is $482.9 million (2015 – $495.2 million). This amount also represents the maximum exposure to losses at that date.
The Corporation also has mortgage backed securities with a carrying value of $72.5 million (2015 –$74.3 million) with an estimated fair value of $76.5 million (2015 – $79.0 million). These mortgage bonds are included in financial investments as mortgages and each bond is secured by a first priority mortgage charge on a Class A real estate property. The fixed interest rates on the mortgage backed securities range from 3.0% to 4.9% (2015 – 3.0% to 4.9%) and the mortgages will mature between one to seven years.
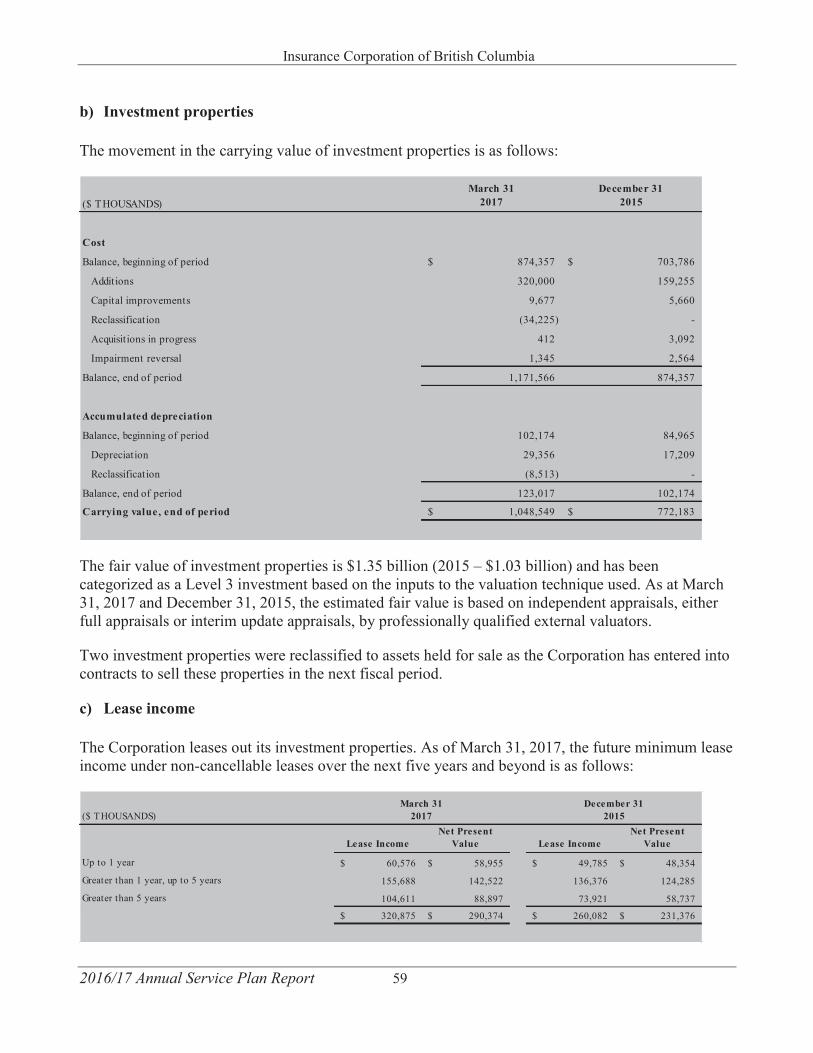
Insurance Corporation of British Columbia
2016/17 Annual Service Plan Report 59
b) Investment properties
The movement in the carrying value of investment properties is as follows:
The fair value of investment properties is $1.35 billion (2015 – $1.03 billion) and has been categorized as a Level 3 investment based on the inputs to the valuation technique used. As at March 31, 2017 and December 31, 2015, the estimated fair value is based on independent appraisals, either full appraisals or interim update appraisals, by professionally qualified external valuators.
Two investment properties were reclassified to assets held for sale as the Corporation has entered into contracts to sell these properties in the next fiscal period.
c) Lease income
The Corporation leases out its investment properties. As of March 31, 2017, the future minimum lease income under non-cancellable leases over the next five years and beyond is as follows:
($ THOUSANDS)March 31
2017December 31
2015
Cost
Balance, beginning of period 874,357$ 703,786$
Additions 320,000 159,255
Capital improvements 9,677 5,660
Reclassification (34,225) -
Acquisitions in progress 412 3,092
Impairment reversal 1,345 2,564
Balance, end of period 1,171,566 874,357
Accumulated depreciation
Balance, beginning of period 102,174 84,965
Depreciation 29,356 17,209
Reclassification (8,513) -
Balance, end of period 123,017 102,174
Carrying value, end of period 1,048,549$ 772,183$
($ THOUSANDS)
Lease IncomeNet Present
Value Lease IncomeNet Present
Value
Up to 1 year 60,576$ 58,955$ 49,785$ 48,354$
Greater than 1 year, up to 5 years 155,688 142,522 136,376 124,285
Greater than 5 years 104,611 88,897 73,921 58,737
320,875$ 290,374$ 260,082$ 231,376$
March 312017
December 312015
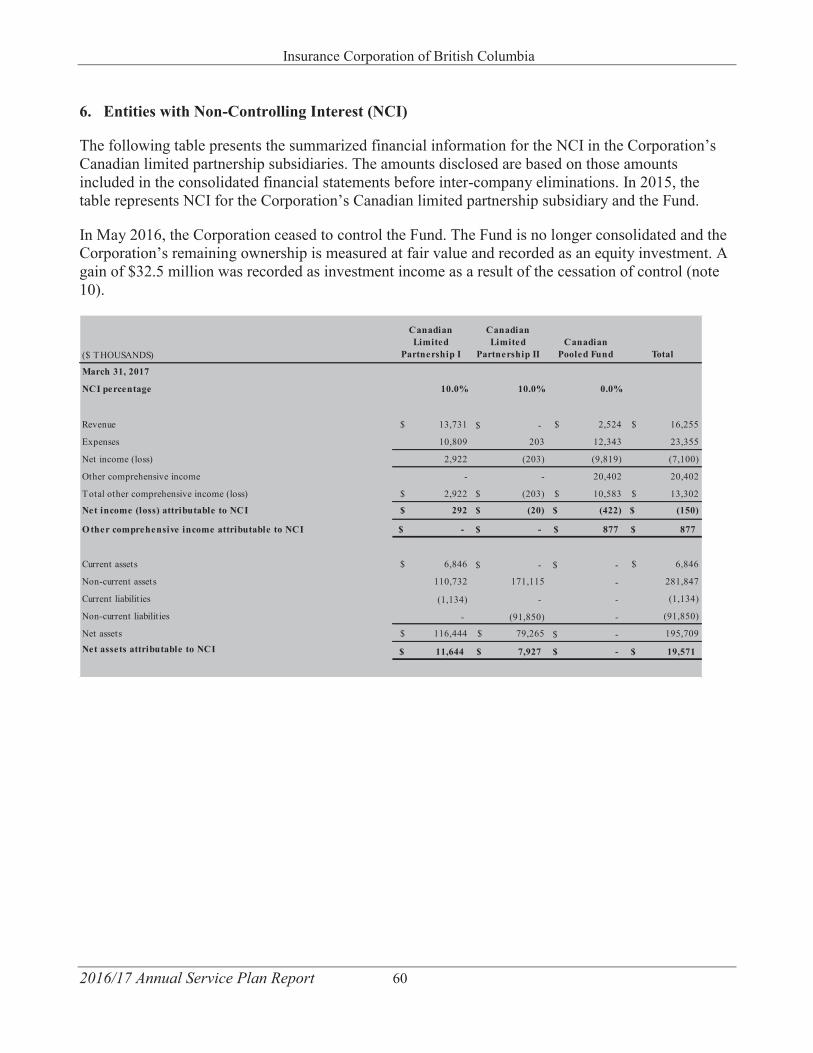
Insurance Corporation of British Columbia
2016/17 Annual Service Plan Report 60
6. Entities with Non-Controlling Interest (NCI)
The following table presents the summarized financial information for the NCI in the Corporation’s Canadian limited partnership subsidiaries. The amounts disclosed are based on those amounts included in the consolidated financial statements before inter-company eliminations. In 2015, the table represents NCI for the Corporation’s Canadian limited partnership subsidiary and the Fund.
In May 2016, the Corporation ceased to control the Fund. The Fund is no longer consolidated and the Corporation’s remaining ownership is measured at fair value and recorded as an equity investment. A gain of $32.5 million was recorded as investment income as a result of the cessation of control (note 10).
($ THOUSANDS)
Canadian Limited
Partnership I
Canadian Limited
Partnership IICanadian
Pooled Fund Total
March 31, 2017
NCI percentage 10.0% 10.0% 0.0%
Revenue $ 13,731 -$ $ 2,524 $ 16,255
Expenses 10,809 203 12,343 23,355
Net income (loss) 2,922 (203) (9,819) (7,100)
Other comprehensive income - - 20,402 20,402
Total other comprehensive income (loss) $ 2,922 $ (203) $ 10,583 $ 13,302
Net income (loss) attributable to NCI $ 292 $ (20) $ (422) $ (150)
O ther comprehensive income attributable to NCI -$ -$ 877$ 877$
Current assets $ 6,846 -$ -$ $ 6,846
Non-current assets 110,732 171,115 - 281,847
Current liabilities (1,134) - - (1,134)
Non-current liabilities - (91,850) - (91,850)
Net assets $ 116,444 $ 79,265 -$ 195,709 Net assets attributable to NCI 11,644$ 7,927$ -$ 19,571$
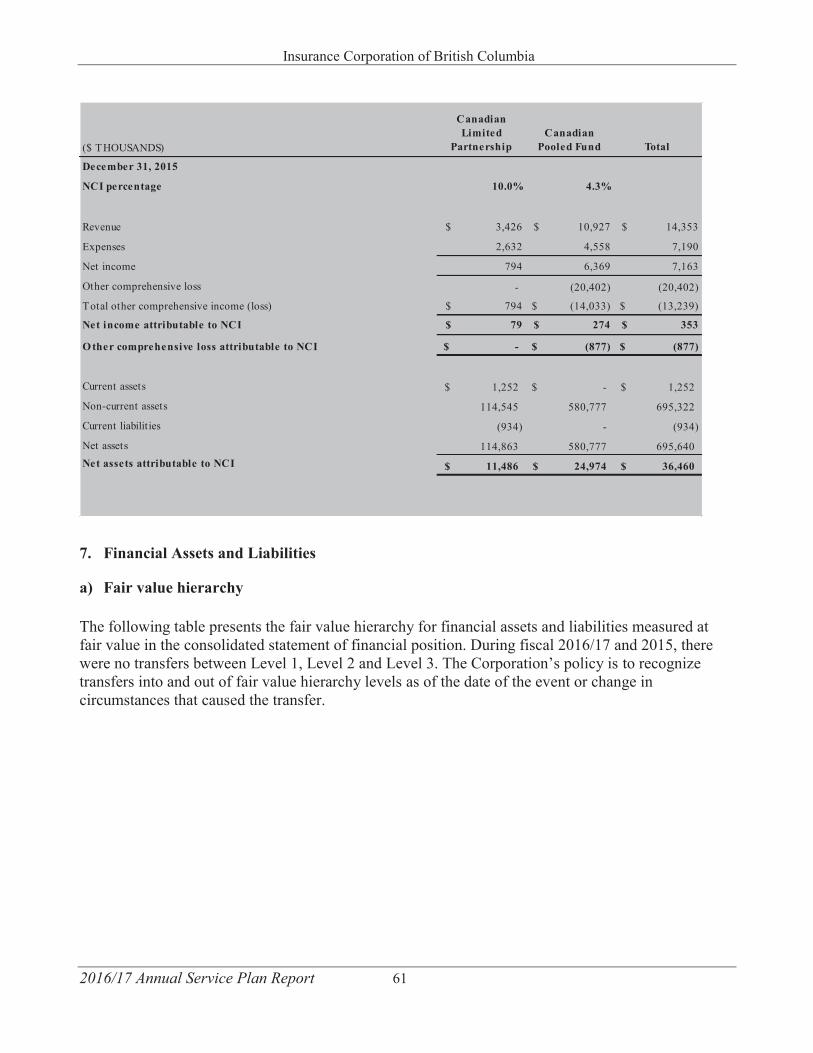
Insurance Corporation of British Columbia
2016/17 Annual Service Plan Report 61
7. Financial Assets and Liabilities
a) Fair value hierarchy
The following table presents the fair value hierarchy for financial assets and liabilities measured at fair value in the consolidated statement of financial position. During fiscal 2016/17 and 2015, there were no transfers between Level 1, Level 2 and Level 3. The Corporation’s policy is to recognize transfers into and out of fair value hierarchy levels as of the date of the event or change in circumstances that caused the transfer.
($ THOUSANDS)
Canadian Limited
PartnershipCanadian
Pooled Fund Total
December 31, 2015
NCI percentage 10.0% 4.3%
Revenue $ 3,426 $ 10,927 $ 14,353
Expenses 2,632 4,558 7,190
Net income 794 6,369 7,163
Other comprehensive loss - (20,402) (20,402)
Total other comprehensive income (loss) $ 794 $ (14,033) $ (13,239)
Net income attributable to NCI $ 79 $ 274 $ 353
O ther comprehensive loss attributable to NCI -$ (877)$ (877)$
Current assets 1,252$ -$ 1,252$
Non-current assets 114,545 580,777 695,322
Current liabilities (934) - (934)
Net assets 114,863 580,777 695,640Net assets attributable to NCI 11,486$ 24,974$ 36,460$
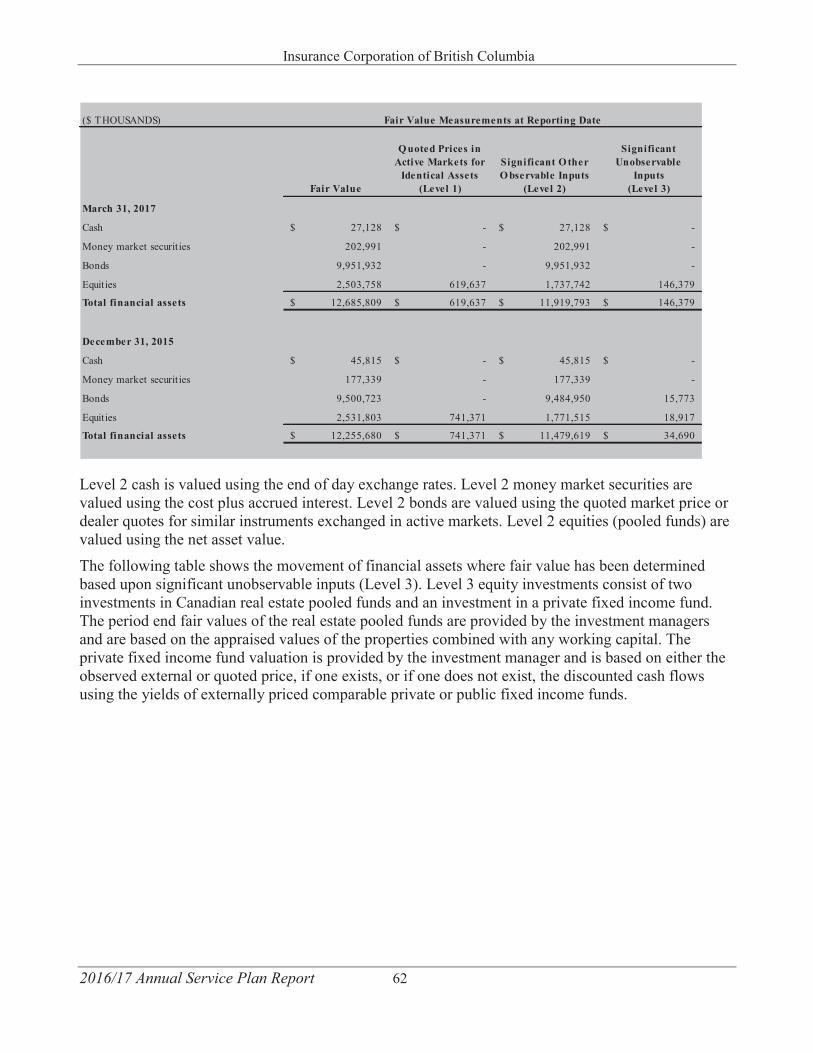
Insurance Corporation of British Columbia
2016/17 Annual Service Plan Report 62
Level 2 cash is valued using the end of day exchange rates. Level 2 money market securities are valued using the cost plus accrued interest. Level 2 bonds are valued using the quoted market price or dealer quotes for similar instruments exchanged in active markets. Level 2 equities (pooled funds) are valued using the net asset value.
The following table shows the movement of financial assets where fair value has been determined based upon significant unobservable inputs (Level 3). Level 3 equity investments consist of two investments in Canadian real estate pooled funds and an investment in a private fixed income fund. The period end fair values of the real estate pooled funds are provided by the investment managers and are based on the appraised values of the properties combined with any working capital. The private fixed income fund valuation is provided by the investment manager and is based on either the observed external or quoted price, if one exists, or if one does not exist, the discounted cash flows using the yields of externally priced comparable private or public fixed income funds.
($ THOUSANDS)
Fair Value
Q uoted Prices in Active Markets for
Identical Assets (Level 1)
Significant O ther O bservable Inputs
(Level 2)
Significant Unobservable
Inputs (Level 3)
March 31, 2017
Cash 27,128$ -$ 27,128$ -$
Money market securities 202,991 - 202,991 -
Bonds 9,951,932 - 9,951,932 -
Equities 2,503,758 619,637 1,737,742 146,379
Total financial assets 12,685,809$ 619,637$ 11,919,793$ 146,379$
December 31, 2015
Cash 45,815$ -$ 45,815$ -$
Money market securities 177,339 - 177,339 -
Bonds 9,500,723 - 9,484,950 15,773
Equities 2,531,803 741,371 1,771,515 18,917
Total financial assets 12,255,680$ 741,371$ 11,479,619$ 34,690$
Fair Value Measurements at Reporting Date
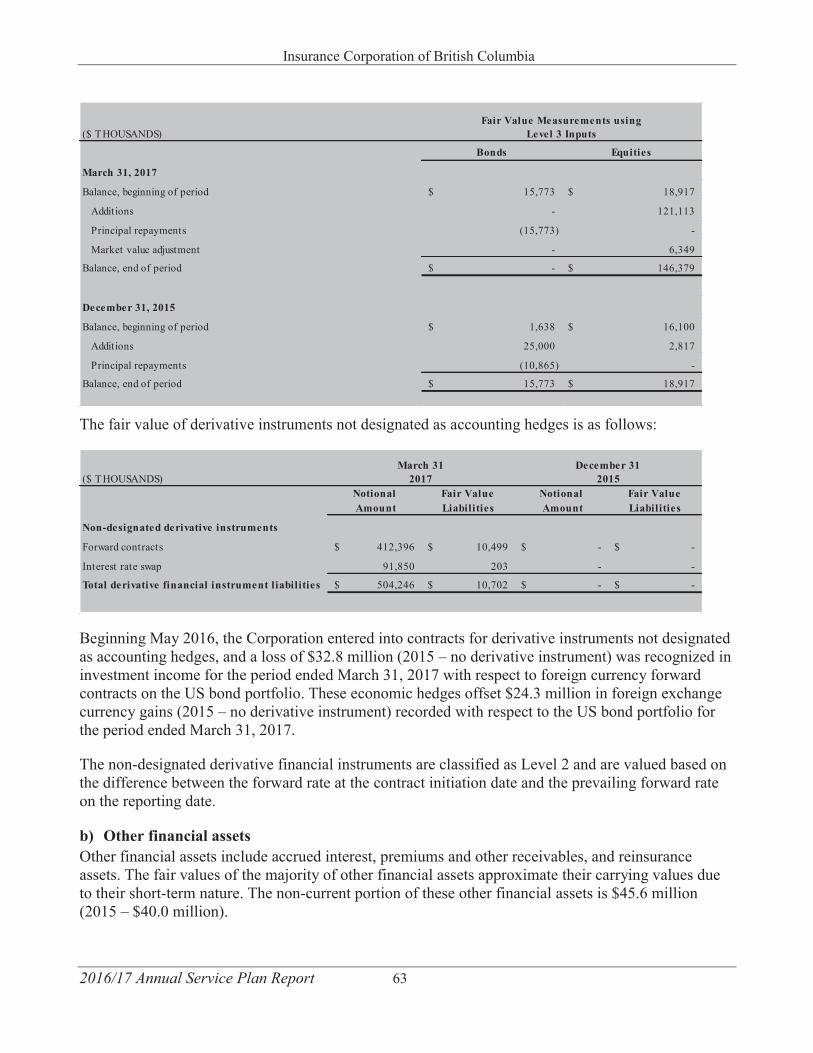
Insurance Corporation of British Columbia
2016/17 Annual Service Plan Report 63
The fair value of derivative instruments not designated as accounting hedges is as follows:
Beginning May 2016, the Corporation entered into contracts for derivative instruments not designated as accounting hedges, and a loss of $32.8 million (2015 – no derivative instrument) was recognized in investment income for the period ended March 31, 2017 with respect to foreign currency forward contracts on the US bond portfolio. These economic hedges offset $24.3 million in foreign exchange currency gains (2015 – no derivative instrument) recorded with respect to the US bond portfolio for the period ended March 31, 2017.
The non-designated derivative financial instruments are classified as Level 2 and are valued based on the difference between the forward rate at the contract initiation date and the prevailing forward rate on the reporting date.
b) Other financial assetsOther financial assets include accrued interest, premiums and other receivables, and reinsurance assets. The fair values of the majority of other financial assets approximate their carrying values due to their short-term nature. The non-current portion of these other financial assets is $45.6 million (2015 – $40.0 million).
($ THOUSANDS)
Bonds Equities
March 31, 2017
Balance, beginning of period 15,773$ 18,917$
Additions - 121,113
Principal repayments (15,773) -
Market value adjustment - 6,349
Balance, end of period -$ 146,379$
December 31, 2015
Balance, beginning of period 1,638$ 16,100$
Additions 25,000 2,817
Principal repayments (10,865) -
Balance, end of period 15,773$ 18,917$
Fair Value Measurements using Level 3 Inputs
($ THOUSANDS)Notional Fair Value Notional Fair Value Amount Liabilities Amount Liabilities
Non-designated derivative instruments
Forward contracts 412,396$ 10,499$ -$ -$
Interest rate swap 91,850 203 - -
Total derivative financial instrument liabilities 504,246$ 10,702$ -$ -$
March 312017
December 312015
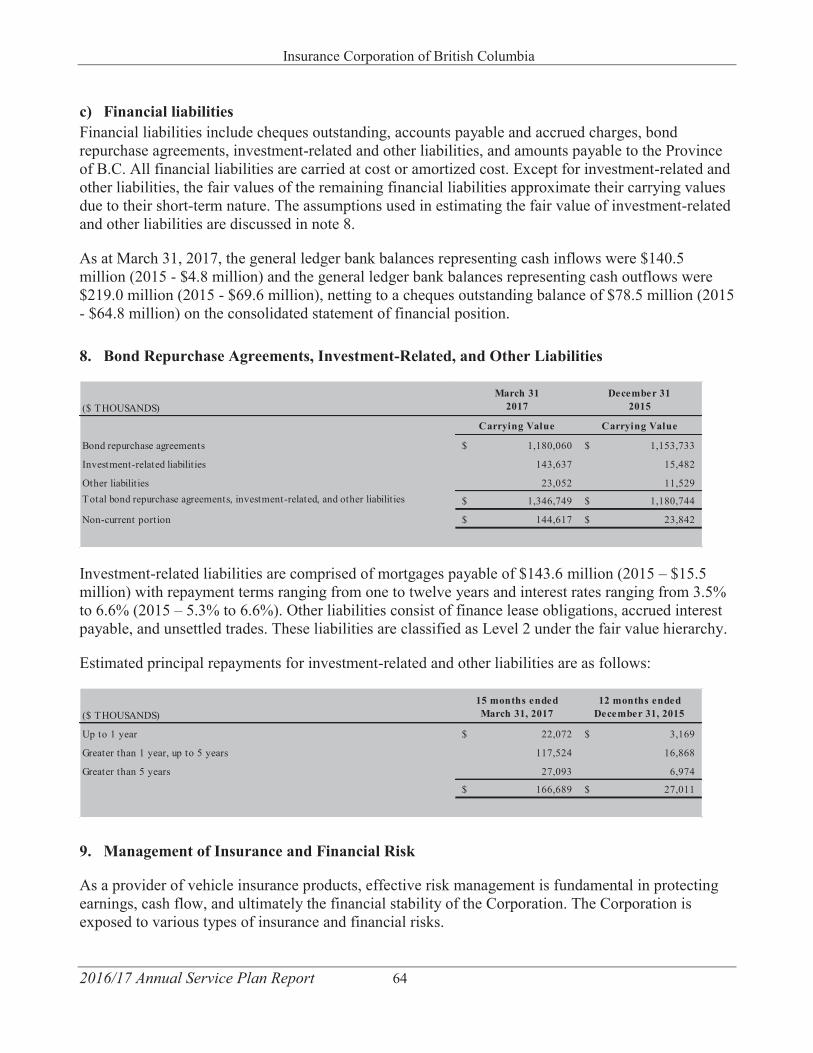
Insurance Corporation of British Columbia
2016/17 Annual Service Plan Report 64
c) Financial liabilitiesFinancial liabilities include cheques outstanding, accounts payable and accrued charges, bond repurchase agreements, investment-related and other liabilities, and amounts payable to the Province of B.C. All financial liabilities are carried at cost or amortized cost. Except for investment-related and other liabilities, the fair values of the remaining financial liabilities approximate their carrying values due to their short-term nature. The assumptions used in estimating the fair value of investment-related and other liabilities are discussed in note 8.
As at March 31, 2017, the general ledger bank balances representing cash inflows were $140.5 million (2015 - $4.8 million) and the general ledger bank balances representing cash outflows were $219.0 million (2015 - $69.6 million), netting to a cheques outstanding balance of $78.5 million (2015 - $64.8 million) on the consolidated statement of financial position.
8. Bond Repurchase Agreements, Investment-Related, and Other Liabilities
Investment-related liabilities are comprised of mortgages payable of $143.6 million (2015 – $15.5million) with repayment terms ranging from one to twelve years and interest rates ranging from 3.5% to 6.6% (2015 – 5.3% to 6.6%). Other liabilities consist of finance lease obligations, accrued interest payable, and unsettled trades. These liabilities are classified as Level 2 under the fair value hierarchy.
Estimated principal repayments for investment-related and other liabilities are as follows:
9. Management of Insurance and Financial Risk
As a provider of vehicle insurance products, effective risk management is fundamental in protecting earnings, cash flow, and ultimately the financial stability of the Corporation. The Corporation is exposed to various types of insurance and financial risks.
($ THOUSANDS)March 31
2017December 31
2015
Carrying Value Carrying Value
Bond repurchase agreements 1,180,060$ 1,153,733$
Investment-related liabilities 143,637 15,482
Other liabilities 23,052 11,529Total bond repurchase agreements, investment-related, and other liabilities 1,346,749$ 1,180,744$
Non-current portion 144,617$ 23,842$
($ THOUSANDS)15 months ended March 31, 2017
12 months ended December 31, 2015
Up to 1 year 22,072$ 3,169$
Greater than 1 year, up to 5 years 117,524 16,868
Greater than 5 years 27,093 6,974
166,689$ 27,011$
Insurance Corporation of British Columbia
2016/17 Annual Service Plan Report 65
a) Insurance risk
The risk under any one insurance contract is the possibility that the insured event occurs and the uncertainty of the amount of the resulting claim. By the very nature of an insurance contract, this risk is random and therefore unpredictable.
The principal risk that the Corporation faces under its insurance contracts is that the actual claims and benefit payments exceed the carrying amount of the insurance liabilities. This could occur when the frequency or severity of claims and benefits are greater than estimated. Insurance events have an element of randomness and the actual number and amount of claims and benefits will vary each year from the level established using statistical techniques.
Frequency and severity of claims There are a number of factors that influence the frequency and severity of claims, some of which the Corporation has some control over. Frequency is the average number of claims per policy, calculated by dividing the total number of claims by the total number of policies. Severity is the average cost of a claim calculated by dividing the total cost of claims by the total number of claims. A number of strategies are used to control cost pressures created by these factors, including claims operational changes, road safety programs, programs to influence driver behaviour such as impaired driving and distracted driving programs, public awareness campaigns, auto crime reduction initiatives, and fraud detection and investigation.
Factors that impact both frequency and severity that the Corporation has little or no control over include: weather, demographics, court issued settlement awards, plaintiff legal fees, and economic changes, including vehicle parts/repair inflation and medical expense inflation that influence the cost of claims.
Sources of uncertainty in the estimation of the provision for unpaid claims To manage the uncertainty associated with estimating the provision for unpaid claims, the Corporation’s Chief Actuary employs standard actuarial methods. The Corporation’s provision for unpaid claims estimate is determined in accordance with accepted actuarial practice in Canada and is based on reasonable assumptions and appropriate methods that are consistently applied (note 3a).
There is inherent uncertainty regarding the assumptions to estimate the amount and timing of future claims payments that make up the provision for unpaid claims. The Corporation is liable for all insured events that occurred during the term of the contract, even if the loss is reported after the end of the contract term. In addition, injury claims may take a long period of time to settle.
Injury claims include bodily injury, accident benefits, and death benefits, which account for approximately 65% (2015 – 67%) of total claims costs. The timing of injury claims can be extended due to delayed reporting, and the timing and amount of injury payments can exhibit considerable uncertainty because of the complex bodily injury claims environment, the subjective nature of pain and suffering damages, internal claims operational changes, the judicial environment, and settlement awards.
Insurance Corporation of British Columbia
2016/17 Annual Service Plan Report 66
The provision for unpaid claims also includes having to estimate direct expenses to be incurred in settling claims net of the expected salvage and subrogation recoveries. The Corporation takes all reasonable steps to ensure that it has appropriate information regarding its individual claims. However, given the uncertainty during the early stages of a claim, it is likely that the final outcome will be different from the original estimate. The provision for unpaid claims includes a provision for reported claims not yet paid and an amount estimated for IBNR claims (note 2d).
The Corporation’s provision for unpaid claims can be affected by the frequency and severity of claims, the discount rate, and actuarial methods and assumptions. The frequency and severity of claims are discussed above, while the discount rate and the actuarial methods and assumptions are discussed in note 3.
A one percentage point increase in the discount rate would have a favourable impact on the provision for unpaid claims, net income, and equity of $252.8 million (2015 – $214.1 million), and a one percentage point decrease in the discount rate would have an unfavourable impact on the provision for unpaid claims, net income, and equity of $266.7 million (2015 – $225.7 million). A one percentage point change in the cost of unpaid claims, with all other variables held constant, would result in an estimated change to the provision for unpaid claims of $105.0 million (2015 – $90.8 million). The changes in selected loss and count development factors and actuarial assumptions in 2016/17 had an estimated 0.9% unfavourable impact (2015 – 1.0% unfavourable) on the 2016/17 provision for unpaid claims. This impact includes an actuarial methodology change on the unallocated loss adjustment expense (ULAE) reserve (note 13).
Concentration of insurance risk The Corporation has a diverse customer base as the sole provider of Basic insurance to all drivers in British Columbia. The Corporation operates in one jurisdiction and provides vehicle insurance only, so there is a concentration of insurance risk with respect to geography, jurisdiction, demographics, and product type.
The impact of the concentration of insurance risk is quantified through CAT (catastrophe) modeling that the Corporation’s reinsurance broker updates annually. This testing allows the Corporation to assess and manage these risks effectively. The concentration of insurance risk is also managed through a CAT reinsurance treaty, a casualty reinsurance treaty, and road safety programs such as road improvement strategies, the graduated licensing program, and the distracted driving campaign because as the sole provider of Basic insurance, the Corporation invests in and benefits the most from these programs.
Premium pricing risk The Corporation is the sole provider of Basic insurance and is not subject to competition risk for its Basic insurance product. However, the Basic insurance rate level is sensitive to investment market conditions and claims experience, which can result in premiums being insufficient to cover costs. The Corporation is subject to regulations over its Basic insurance and applies to BCUC for approval to change its Basic insurance rate. The Corporation is required to make Basic insurance rate applications on an annual basis, and BCUC is required to set rates according to accepted actuarial practice. These aspects of regulation mitigate the underwriting risk associated with pricing for the Basic insurance product (note 22).
Insurance Corporation of British Columbia
2016/17 Annual Service Plan Report 67
The Province of B.C. directs income transfers from Optional insurance to Basic insurance in order to keep Basic rates as low as possible. Also, the Province of B.C. may direct capital transfers from Optional insurance to bolster Basic insurance capital.
Regulation establishes the rate smoothing framework that allows for the use of capital to remove adverse rate volatility. As a result of the framework, the Corporation’s ability to set rates to cover costs can be impacted by BCUC setting rates below cost for a period of time. An independent review has been commissioned by the Corporation’s Board, tasked with examining all key cost drivers impacting the affordability and sustainability of Basic insurance rates, and potential mitigation strategies. Subject to the changes arising from the independent review and the other initiatives, the Corporation’s capital may continue to face added risk (note 22).
The Corporation’s Optional insurance products compete with other insurers and are subject to underwriting risk and competition risk.
b) Financial risk
Concentration of financial riskThe Corporation establishes investment portfolio level targets and limits with the objective of ensuring that portfolios are diversified across asset classes and individual investment risks. The Corporation monitors actual investment positions and risk exposures for concentration risk.
As at March 31, 2017, the equity portfolio was 27.9% (2015 – 31.2%) invested in the financial sector, 15.0% (2015 – 13.7%) in the energy sector, and 11.3% (2015 – 10.4%) in the industrial sector. The bond portfolio was 48.7% (2015 – 54.5%) invested in the government sector and 23.1% (2015 – 20.3%) invested in the financial sector. See credit risk for a discussion of the government bonds.
Concentration of geographical riskGeographical concentration risks are a result of the Corporation having investments from around the world. These risks include varying general economic conditions, political conditions, and other factors that could affect the fair value and liquidity of the investments. The Corporation has contracted external investment managers to manage its global investments in diversified global funds. As at March 31, 2017, the investment portfolio was 89.2% (2015 – 89.0%) invested in Canada, 8.78% (2015 – 8.78%) invested in the United States, and 2.0% (2015 – 2.2%) was invested elsewhere around the world.
Price riskGeneral economic conditions, political conditions, and other factors affect the equity markets, thereby also affecting the fair value of the securities and the pooled funds held by the Corporation. Fluctuations in the value of these securities impact the recognition of unrealized gains and losses on equity securities and on the units of funds held. As at March 31, 2017, the impact of a 10 per cent change in prices, with all other variables held constant, would result in an estimated corresponding change to OCI of approximately $250.3 million (2015 – $253.2 million).
Insurance Corporation of British Columbia
2016/17 Annual Service Plan Report 68
The Corporation manages a widely diversified portfolio, diversified geographically, by sector, and by company, and has policies in place to limit and monitor total equity exposure and individual issuer exposure.
Interest rate risk
When interest rates increase or decrease, the market value of fixed income securities will decrease or increase respectively with a larger market value impact on instruments with a long duration compared to instruments with a short duration. Fluctuations in interest rates have a direct impact on the market valuation of the Corporation’s fixed income portfolio. A natural hedge exists between the Corporation’s fixed income portfolio and the provision for unpaid claims, as the Corporation’s investment yields are used to derive the discount rate for the provision for unpaid claims (note 9a).
The Corporation has policies in place to limit and monitor its exposure to interest rate risk to allow for duration matching of claim liabilities to bond assets.
The carrying values reported in the consolidated statement of financial position for cash and cash equivalents, premiums and other receivables, and accounts payable and accrued charges approximate their fair values and are not significantly impacted by fluctuations in interest rates.
In 2016/17, the Corporation did not use material (2015 – nil) derivative financial instruments to hedge interest rate risk on its investment portfolio.
As at March 31, 2017, a 100 basis point change in interest rates would result in a change of approximately $337.9 million (2015 – $294.8 million) in fair value of the Corporation’s fixed income portfolio and a corresponding impact of approximately $337.9 million (2015 – $294.8million) to OCI. Interest rate changes would also result in an inverse change to the provision for unpaid claims and the corresponding claims costs (note 9a).
Average Yield(%)
Duration (Years)
Average Yield(%)
Duration (Years)
Bonds
Canadian
Federal 1.1 3.2 0.9 2.5
Provincial 1.4 2.9 1.7 2.9
Municipal 1.6 2.5 1.8 3.0
Corporate 1.9 2.6 2.1 2.2
United States
High yield corporate 5.9 4.1 8.2 4.5
Total bonds 1.9 2.9 2.1 2.6
Mortgages and other loan 3.5 2.6 3.7 2.7
Total bonds, mortgages and other loan 2.1 2.9 2.3 2.6
March 312017
December 312015
Insurance Corporation of British Columbia
2016/17 Annual Service Plan Report 69
Credit riskCredit risk is the potential for financial loss to the Corporation if the counterparty in a transaction fails to meet its obligations. Financial instruments that potentially give rise to concentrations of credit risk include cash and cash equivalents, fixed income securities, accounts receivable, reinsurance receivables and recoverables, and structured settlements (note 21a). The total credit risk exposure is $10.24 billion (2015 – $9.05 billion).
Fixed income securitiesFixed income securities are comprised of Canadian investment grade bonds, US high yield corporate bonds, and mortgages. The Corporation mitigates its overall exposure to credit risk in its fixed income securities by holding the majority of its fixed income portfolio in investment grade bonds, and by limiting its exposure to US high yield bonds to a maximum of 6% (2015 –6%) of total investment assets and mortgages to a maximum of 14% (2015 – 14%) of total investment assets. The Corporation further limits the risk in its high yield corporate bonds by holding bonds that are rated B or better for at least 95% of the high yield bond portfolio. All high yield bonds are analyzed by external investment professionals who manage the portfolio for the Corporation. Credit risk in mortgages is mitigated by the security of the underlying mortgaged property. Mortgages are subject to an independent review annually. The risk is also addressed through a stringent underwriting process that incorporates an internal credit scoring mechanism.
The credit quality of financial assets that are neither past due nor impaired can be assessed by reference to external credit ratings, where available, or to historical information about counterparty default rates.
The maximum credit risk exposure for fixed income securities pertain to all bond investments and to mortgage investments; however the Corporation considers Canadian government bonds to be risk-free. Therefore, the total carrying amount is $8.67 billion (2015 – $7.64 billion). There is minimal credit risk exposure to cash.
The counterparty risk associated with repurchase agreements for 2016/17 and 2015 is not material.
The Corporation’s money market securities and bonds by credit quality according to Standard and Poor’s are as follows:
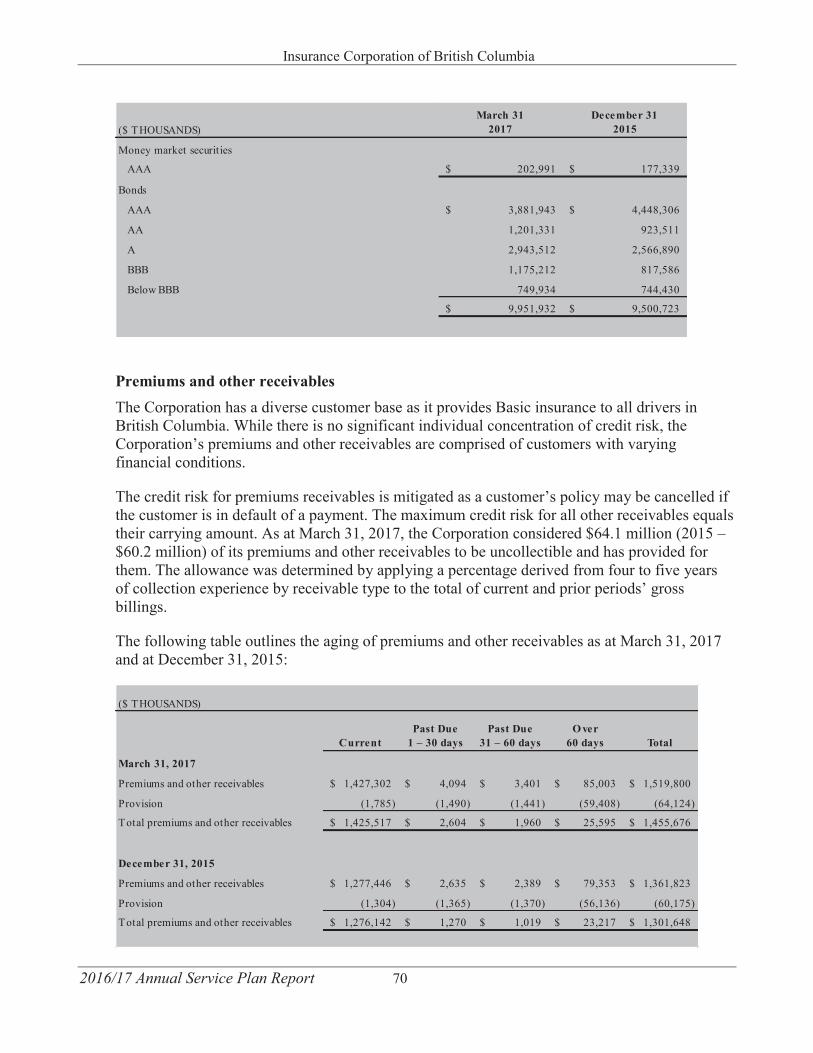
Insurance Corporation of British Columbia
2016/17 Annual Service Plan Report 70
Premiums and other receivablesThe Corporation has a diverse customer base as it provides Basic insurance to all drivers in British Columbia. While there is no significant individual concentration of credit risk, the Corporation’s premiums and other receivables are comprised of customers with varying financial conditions.
The credit risk for premiums receivables is mitigated as a customer’s policy may be cancelled if the customer is in default of a payment. The maximum credit risk for all other receivables equals their carrying amount. As at March 31, 2017, the Corporation considered $64.1 million (2015 –$60.2 million) of its premiums and other receivables to be uncollectible and has provided for them. The allowance was determined by applying a percentage derived from four to five years of collection experience by receivable type to the total of current and prior periods’ gross billings.
The following table outlines the aging of premiums and other receivables as at March 31, 2017 and at December 31, 2015:
($ THOUSANDS)March 31
2017December 31
2015
Money market securities
AAA 202,991$ 177,339$
Bonds
AAA 3,881,943$ 4,448,306$
AA 1,201,331 923,511
A 2,943,512 2,566,890
BBB 1,175,212 817,586
Below BBB 749,934 744,430
9,951,932$ 9,500,723$
($ THOUSANDS)
CurrentPast Due
1 – 30 daysPast Due
31 – 60 daysO ver
60 days Total
March 31, 2017
Premiums and other receivables 1,427,302$ 4,094$ 3,401$ 85,003$ 1,519,800$
Provision (1,785) (1,490) (1,441) (59,408) (64,124)
Total premiums and other receivables 1,425,517$ 2,604$ 1,960$ 25,595$ 1,455,676$
December 31, 2015
Premiums and other receivables 1,277,446$ 2,635$ 2,389$ 79,353$ 1,361,823$
Provision (1,304) (1,365) (1,370) (56,136) (60,175)
Total premiums and other receivables 1,276,142$ 1,270$ 1,019$ 23,217$ 1,301,648$
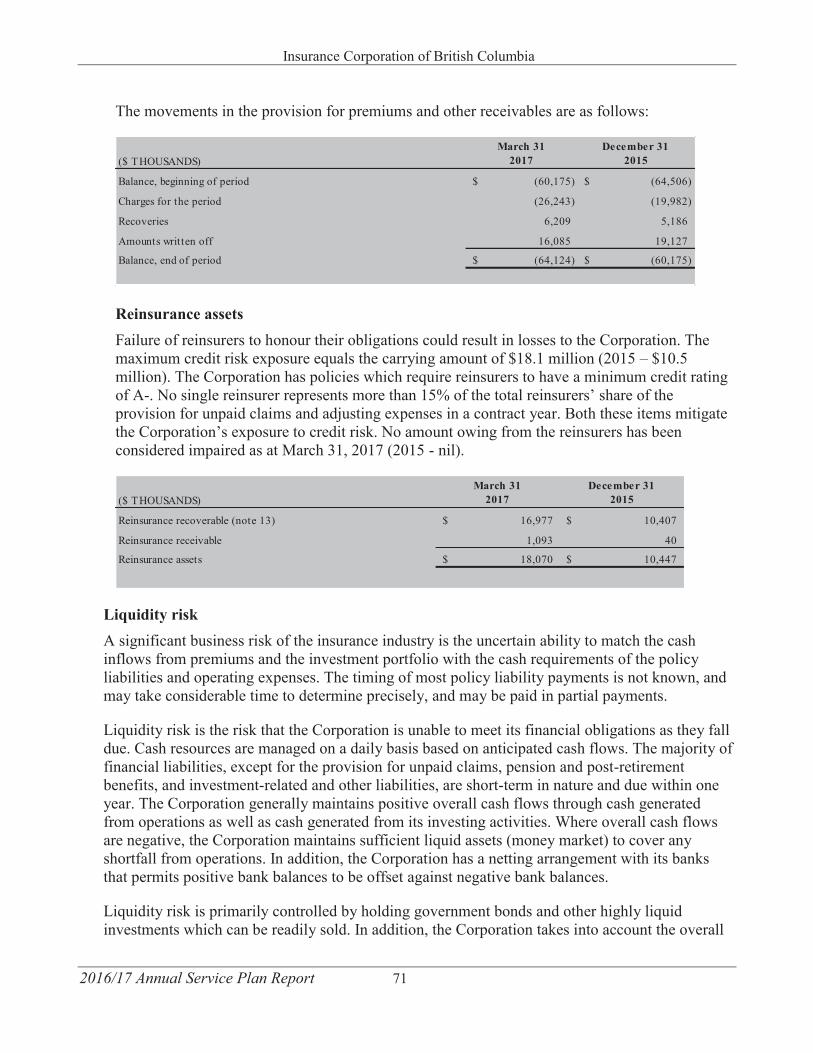
Insurance Corporation of British Columbia
2016/17 Annual Service Plan Report 71
The movements in the provision for premiums and other receivables are as follows:
Reinsurance assets Failure of reinsurers to honour their obligations could result in losses to the Corporation. The maximum credit risk exposure equals the carrying amount of $18.1 million (2015 – $10.5 million). The Corporation has policies which require reinsurers to have a minimum credit rating of A-. No single reinsurer represents more than 15% of the total reinsurers’ share of the provision for unpaid claims and adjusting expenses in a contract year. Both these items mitigate the Corporation’s exposure to credit risk. No amount owing from the reinsurers has been considered impaired as at March 31, 2017 (2015 - nil).
Liquidity risk A significant business risk of the insurance industry is the uncertain ability to match the cash inflows from premiums and the investment portfolio with the cash requirements of the policy liabilities and operating expenses. The timing of most policy liability payments is not known, and may take considerable time to determine precisely, and may be paid in partial payments.
Liquidity risk is the risk that the Corporation is unable to meet its financial obligations as they fall due. Cash resources are managed on a daily basis based on anticipated cash flows. The majority of financial liabilities, except for the provision for unpaid claims, pension and post-retirement benefits, and investment-related and other liabilities, are short-term in nature and due within one year. The Corporation generally maintains positive overall cash flows through cash generated from operations as well as cash generated from its investing activities. Where overall cash flows are negative, the Corporation maintains sufficient liquid assets (money market) to cover any shortfall from operations. In addition, the Corporation has a netting arrangement with its banks that permits positive bank balances to be offset against negative bank balances.
Liquidity risk is primarily controlled by holding government bonds and other highly liquid investments which can be readily sold. In addition, the Corporation takes into account the overall
($ THOUSANDS)March 31
2017December 31
2015
Balance, beginning of period (60,175)$ (64,506)$
Charges for the period (26,243) (19,982)
Recoveries 6,209 5,186
Amounts written off 16,085 19,127
Balance, end of period (64,124)$ (60,175)$
($ THOUSANDS)March 31
2017December 31
2015
Reinsurance recoverable (note 13) 16,977$ 10,407$
Reinsurance receivable 1,093 40
Reinsurance assets 18,070$ 10,447$
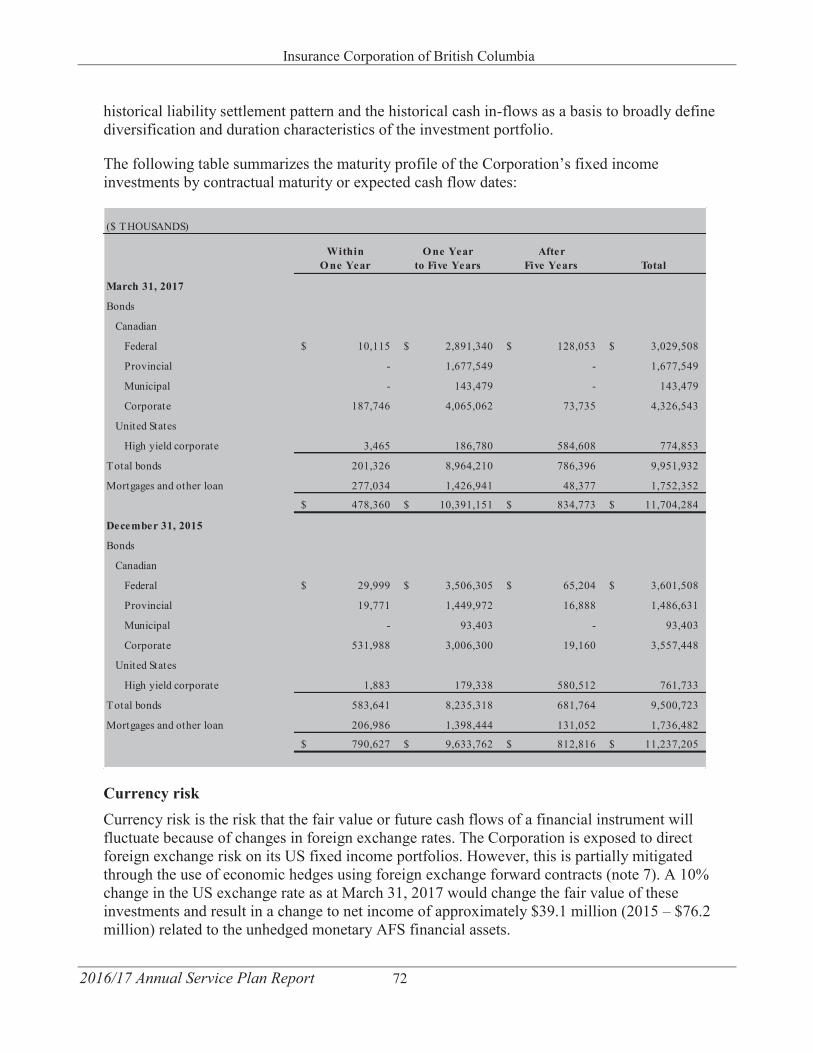
Insurance Corporation of British Columbia
2016/17 Annual Service Plan Report 72
historical liability settlement pattern and the historical cash in-flows as a basis to broadly define diversification and duration characteristics of the investment portfolio.
The following table summarizes the maturity profile of the Corporation’s fixed income investments by contractual maturity or expected cash flow dates:
Currency riskCurrency risk is the risk that the fair value or future cash flows of a financial instrument will fluctuate because of changes in foreign exchange rates. The Corporation is exposed to direct foreign exchange risk on its US fixed income portfolios. However, this is partially mitigated through the use of economic hedges using foreign exchange forward contracts (note 7). A 10% change in the US exchange rate as at March 31, 2017 would change the fair value of these investments and result in a change to net income of approximately $39.1 million (2015 – $76.2million) related to the unhedged monetary AFS financial assets.
($ THOUSANDS)
Within O ne Year
O ne Yearto Five Years
AfterFive Years Total
March 31, 2017
Bonds
Canadian
Federal 10,115$ 2,891,340$ 128,053$ 3,029,508$
Provincial - 1,677,549 - 1,677,549
Municipal - 143,479 - 143,479
Corporate 187,746 4,065,062 73,735 4,326,543
United States
High yield corporate 3,465 186,780 584,608 774,853
Total bonds 201,326 8,964,210 786,396 9,951,932
Mortgages and other loan 277,034 1,426,941 48,377 1,752,352
478,360$ 10,391,151$ 834,773$ 11,704,284$
December 31, 2015
Bonds
Canadian
Federal 29,999$ 3,506,305$ 65,204$ 3,601,508$
Provincial 19,771 1,449,972 16,888 1,486,631
Municipal - 93,403 - 93,403
Corporate 531,988 3,006,300 19,160 3,557,448
United States
High yield corporate 1,883 179,338 580,512 761,733
Total bonds 583,641 8,235,318 681,764 9,500,723
Mortgages and other loan 206,986 1,398,444 131,052 1,736,482
790,627$ 9,633,762$ 812,816$ 11,237,205$
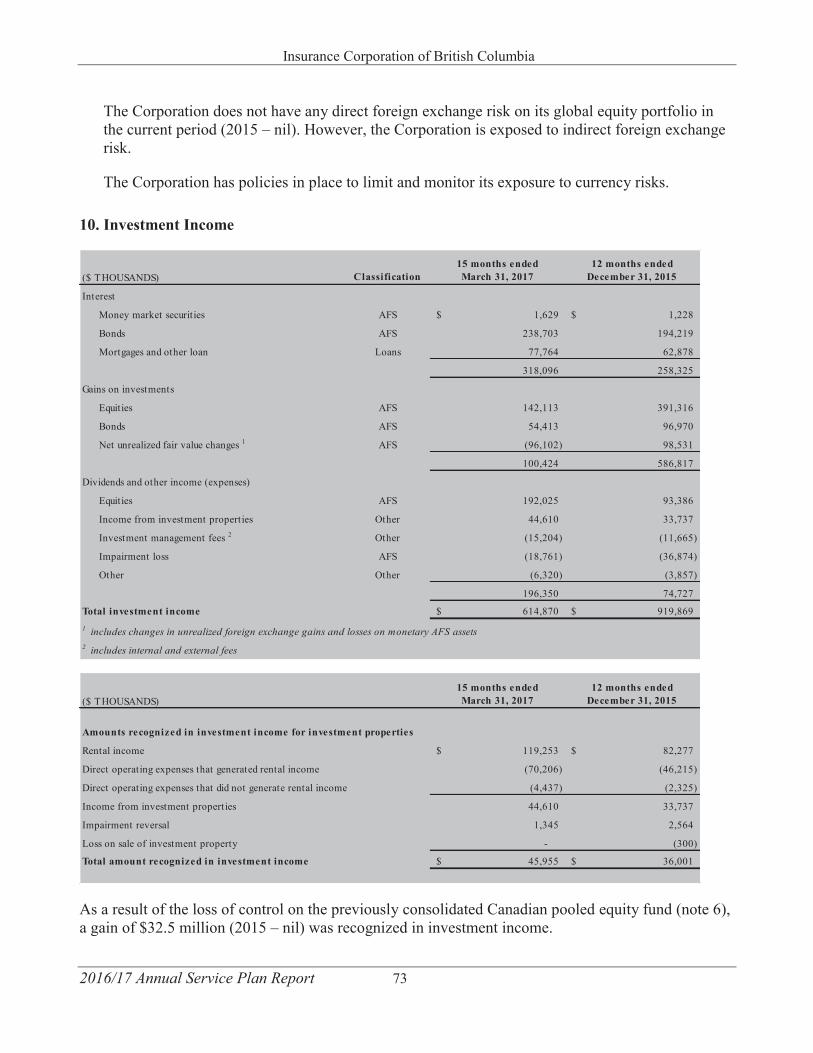
Insurance Corporation of British Columbia
2016/17 Annual Service Plan Report 73
The Corporation does not have any direct foreign exchange risk on its global equity portfolio in the current period (2015 – nil). However, the Corporation is exposed to indirect foreign exchange risk.
The Corporation has policies in place to limit and monitor its exposure to currency risks.
10. Investment Income
As a result of the loss of control on the previously consolidated Canadian pooled equity fund (note 6), a gain of $32.5 million (2015 – nil) was recognized in investment income.
($ THOUSANDS) Classification15 months ended March 31, 2017
12 months ended December 31, 2015
Interest
Money market securities AFS 1,629$ 1,228$
Bonds AFS 238,703 194,219
Mortgages and other loan Loans 77,764 62,878
318,096 258,325
Gains on investments
Equities AFS 142,113 391,316
Bonds AFS 54,413 96,970
Net unrealized fair value changes 1 AFS (96,102) 98,531
100,424 586,817
Dividends and other income (expenses)
Equities AFS 192,025 93,386
Income from investment properties Other 44,610 33,737
Investment management fees 2 Other (15,204) (11,665)
Impairment loss AFS (18,761) (36,874)
Other Other (6,320) (3,857)
196,350 74,727
Total investment income 614,870$ 919,869$ 1 includes changes in unrealized foreign exchange gains and losses on monetary AFS assets2 includes internal and external fees
($ THOUSANDS)15 months ended March 31, 2017
12 months ended December 31, 2015
Amounts recognized in investment income for investment properties
Rental income 119,253$ 82,277$
Direct operating expenses that generated rental income (70,206) (46,215)
Direct operating expenses that did not generate rental income (4,437) (2,325)
Income from investment properties 44,610 33,737
Impairment reversal 1,345 2,564
Loss on sale of investment property - (300)
Total amount recognized in investment income 45,955$ 36,001$
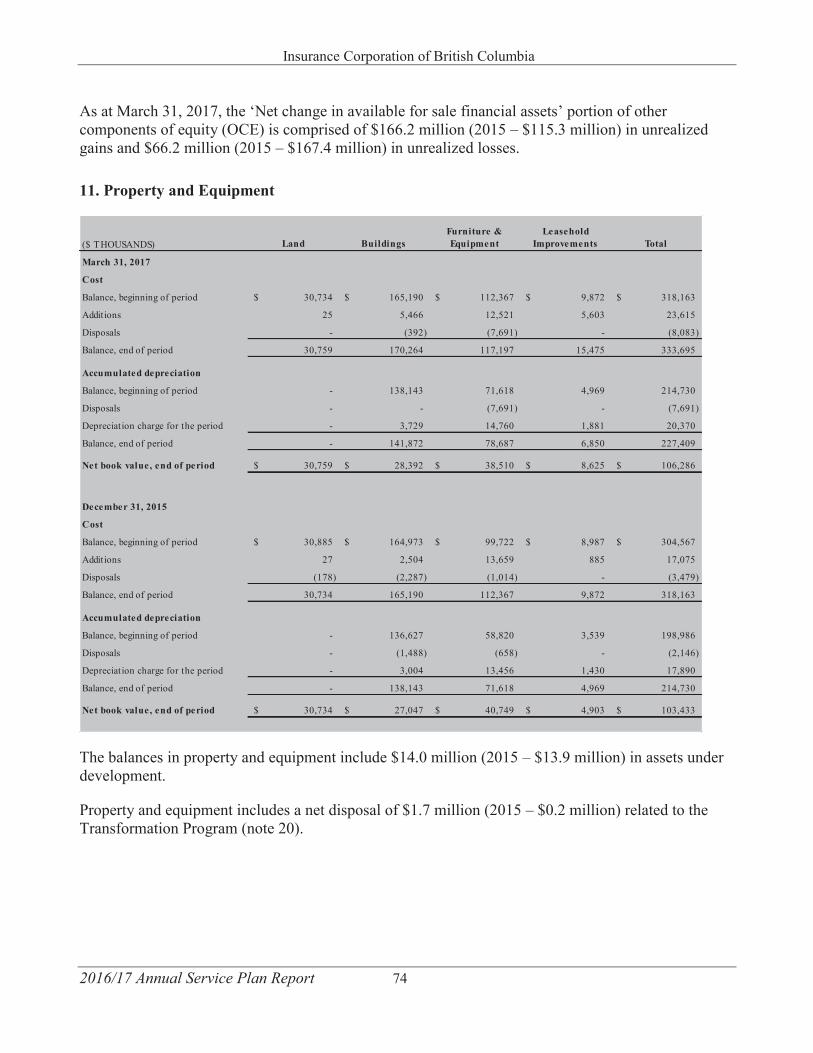
Insurance Corporation of British Columbia
2016/17 Annual Service Plan Report 74
As at March 31, 2017, the ‘Net change in available for sale financial assets’ portion of other components of equity (OCE) is comprised of $166.2 million (2015 – $115.3 million) in unrealized gains and $66.2 million (2015 – $167.4 million) in unrealized losses.
11. Property and Equipment
The balances in property and equipment include $14.0 million (2015 – $13.9 million) in assets under development.
Property and equipment includes a net disposal of $1.7 million (2015 – $0.2 million) related to the Transformation Program (note 20).
($ THOUSANDS) Land BuildingsFurniture & Equipment
Leasehold Improvements Total
March 31, 2017
Cost
Balance, beginning of period 30,734$ 165,190$ 112,367$ 9,872$ 318,163$
Additions 25 5,466 12,521 5,603 23,615
Disposals - (392) (7,691) - (8,083)
Balance, end of period 30,759 170,264 117,197 15,475 333,695
Accumulated depreciation
Balance, beginning of period - 138,143 71,618 4,969 214,730
Disposals - - (7,691) - (7,691)
Depreciation charge for the period - 3,729 14,760 1,881 20,370
Balance, end of period - 141,872 78,687 6,850 227,409
Net book value, end of period 30,759$ 28,392$ 38,510$ 8,625$ 106,286$
December 31, 2015
Cost
Balance, beginning of period 30,885$ 164,973$ 99,722$ 8,987$ 304,567$
Additions 27 2,504 13,659 885 17,075
Disposals (178) (2,287) (1,014) - (3,479)
Balance, end of period 30,734 165,190 112,367 9,872 318,163
Accumulated depreciation
Balance, beginning of period - 136,627 58,820 3,539 198,986
Disposals - (1,488) (658) - (2,146)
Depreciation charge for the period - 3,004 13,456 1,430 17,890
Balance, end of period - 138,143 71,618 4,969 214,730
Net book value, end of period 30,734$ 27,047$ 40,749$ 4,903$ 103,433$
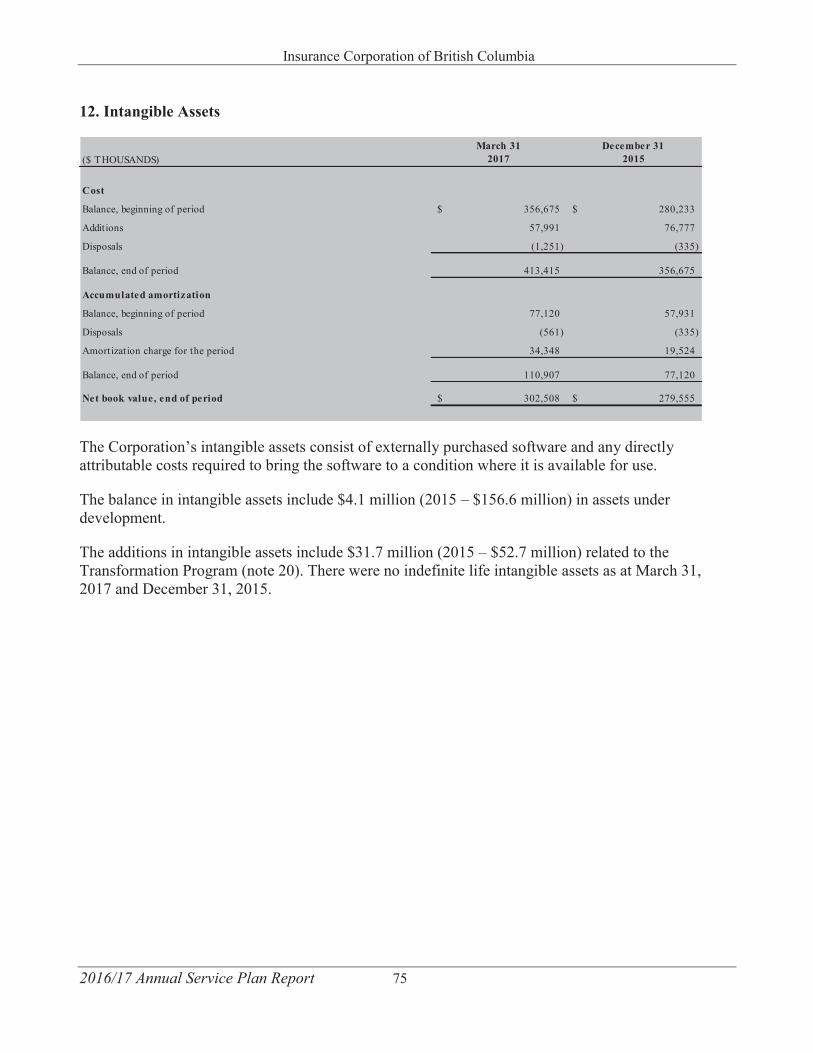
Insurance Corporation of British Columbia
2016/17 Annual Service Plan Report 75
12. Intangible Assets
The Corporation’s intangible assets consist of externally purchased software and any directly attributable costs required to bring the software to a condition where it is available for use.
The balance in intangible assets include $4.1 million (2015 – $156.6 million) in assets under development.
The additions in intangible assets include $31.7 million (2015 – $52.7 million) related to the Transformation Program (note 20). There were no indefinite life intangible assets as at March 31, 2017 and December 31, 2015.
($ THOUSANDS)March 31
2017December 31
2015
Cost
Balance, beginning of period 356,675$ 280,233$
Additions 57,991 76,777
Disposals (1,251) (335)
Balance, end of period 413,415 356,675
Accumulated amortization
Balance, beginning of period 77,120 57,931
Disposals (561) (335)
Amortization charge for the period 34,348 19,524
Balance, end of period 110,907 77,120
Net book value, end of period 302,508$ 279,555$
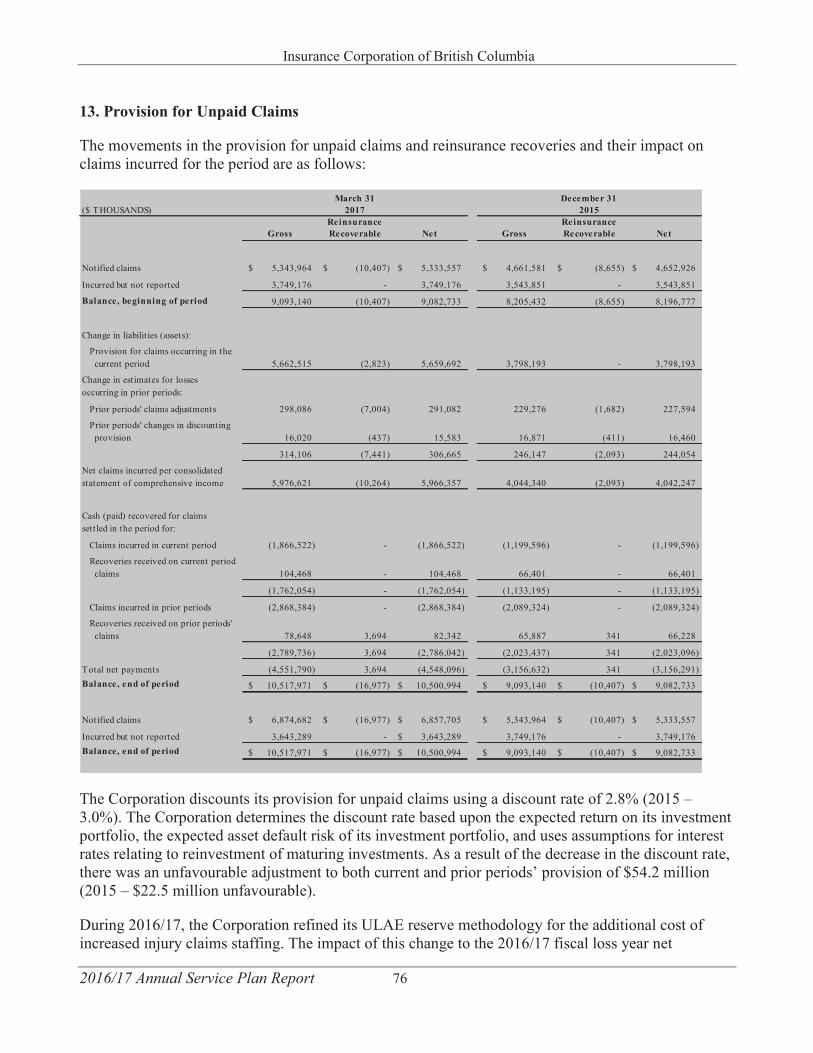
Insurance Corporation of British Columbia
2016/17 Annual Service Plan Report 76
13. Provision for Unpaid Claims
The movements in the provision for unpaid claims and reinsurance recoveries and their impact on claims incurred for the period are as follows:
The Corporation discounts its provision for unpaid claims using a discount rate of 2.8% (2015 –3.0%). The Corporation determines the discount rate based upon the expected return on its investment portfolio, the expected asset default risk of its investment portfolio, and uses assumptions for interest rates relating to reinvestment of maturing investments. As a result of the decrease in the discount rate, there was an unfavourable adjustment to both current and prior periods’ provision of $54.2 million (2015 – $22.5 million unfavourable).
During 2016/17, the Corporation refined its ULAE reserve methodology for the additional cost of increased injury claims staffing. The impact of this change to the 2016/17 fiscal loss year net
($ THOUSANDS)
GrossReinsurance Recoverable Net Gross
Reinsurance Recoverable Net
Notified claims 5,343,964$ (10,407)$ 5,333,557$ 4,661,581$ (8,655)$ 4,652,926$
Incurred but not reported 3,749,176 - 3,749,176 3,543,851 - 3,543,851
Balance, beginning of period 9,093,140 (10,407) 9,082,733 8,205,432 (8,655) 8,196,777
Change in liabilit ies (assets):
Provision for claims occurring in the current period 5,662,515 (2,823) 5,659,692 3,798,193 - 3,798,193
Change in estimates for losses occurring in prior periods:
Prior periods' claims adjustments 298,086 (7,004) 291,082 229,276 (1,682) 227,594
Prior periods' changes in discounting provision 16,020 (437) 15,583 16,871 (411) 16,460
314,106 (7,441) 306,665 246,147 (2,093) 244,054
Net claims incurred per consolidated statement of comprehensive income 5,976,621 (10,264) 5,966,357 4,044,340 (2,093) 4,042,247
Cash (paid) recovered for claims settled in the period for:
Claims incurred in current period (1,866,522) - (1,866,522) (1,199,596) - (1,199,596)
Recoveries received on current period claims 104,468 - 104,468 66,401 - 66,401
(1,762,054) - (1,762,054) (1,133,195) - (1,133,195)
Claims incurred in prior periods (2,868,384) - (2,868,384) (2,089,324) - (2,089,324)
Recoveries received on prior periods' claims 78,648 3,694 82,342 65,887 341 66,228
(2,789,736) 3,694 (2,786,042) (2,023,437) 341 (2,023,096)
Total net payments (4,551,790) 3,694 (4,548,096) (3,156,632) 341 (3,156,291)Balance, end of period 10,517,971$ (16,977)$ 10,500,994$ 9,093,140$ (10,407)$ 9,082,733$
Notified claims 6,874,682$ (16,977)$ 6,857,705$ 5,343,964$ (10,407)$ 5,333,557$
Incurred but not reported 3,643,289 - 3,643,289$ 3,749,176 - 3,749,176Balance, end of period 10,517,971$ (16,977)$ 10,500,994$ 9,093,140$ (10,407)$ 9,082,733$
March 312017
December 312015
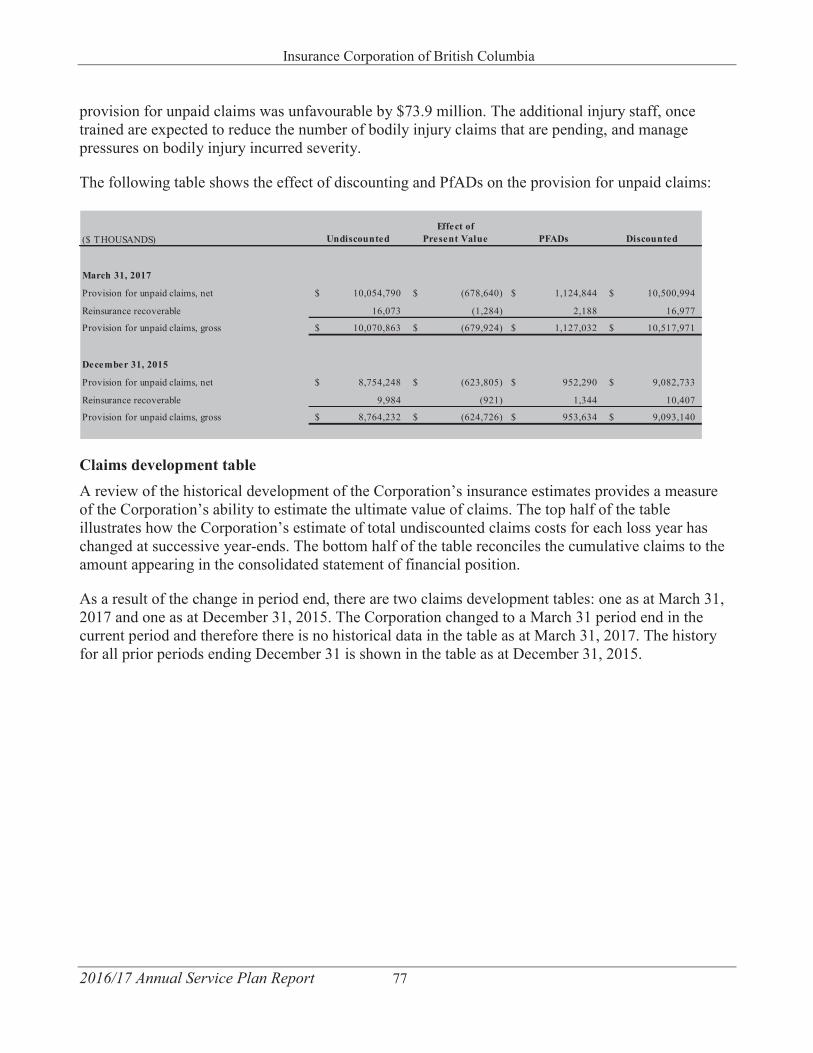
Insurance Corporation of British Columbia
2016/17 Annual Service Plan Report 77
provision for unpaid claims was unfavourable by $73.9 million. The additional injury staff, once trained are expected to reduce the number of bodily injury claims that are pending, and manage pressures on bodily injury incurred severity.
The following table shows the effect of discounting and PfADs on the provision for unpaid claims:
Claims development table A review of the historical development of the Corporation’s insurance estimates provides a measure of the Corporation’s ability to estimate the ultimate value of claims. The top half of the table illustrates how the Corporation’s estimate of total undiscounted claims costs for each loss year has changed at successive year-ends. The bottom half of the table reconciles the cumulative claims to the amount appearing in the consolidated statement of financial position.
As a result of the change in period end, there are two claims development tables: one as at March 31, 2017 and one as at December 31, 2015. The Corporation changed to a March 31 period end in the current period and therefore there is no historical data in the table as at March 31, 2017. The history for all prior periods ending December 31 is shown in the table as at December 31, 2015.
($ THOUSANDS) UndiscountedEffect of
Present Value PFADs Discounted
March 31, 2017
Provision for unpaid claims, net 10,054,790$ (678,640)$ 1,124,844$ 10,500,994$
Reinsurance recoverable 16,073 (1,284) 2,188 16,977
Provision for unpaid claims, gross 10,070,863$ (679,924)$ 1,127,032$ 10,517,971$
December 31, 2015
Provision for unpaid claims, net 8,754,248$ (623,805)$ 952,290$ 9,082,733$
Reinsurance recoverable 9,984 (921) 1,344 10,407
Provision for unpaid claims, gross 8,764,232$ (624,726)$ 953,634$ 9,093,140$
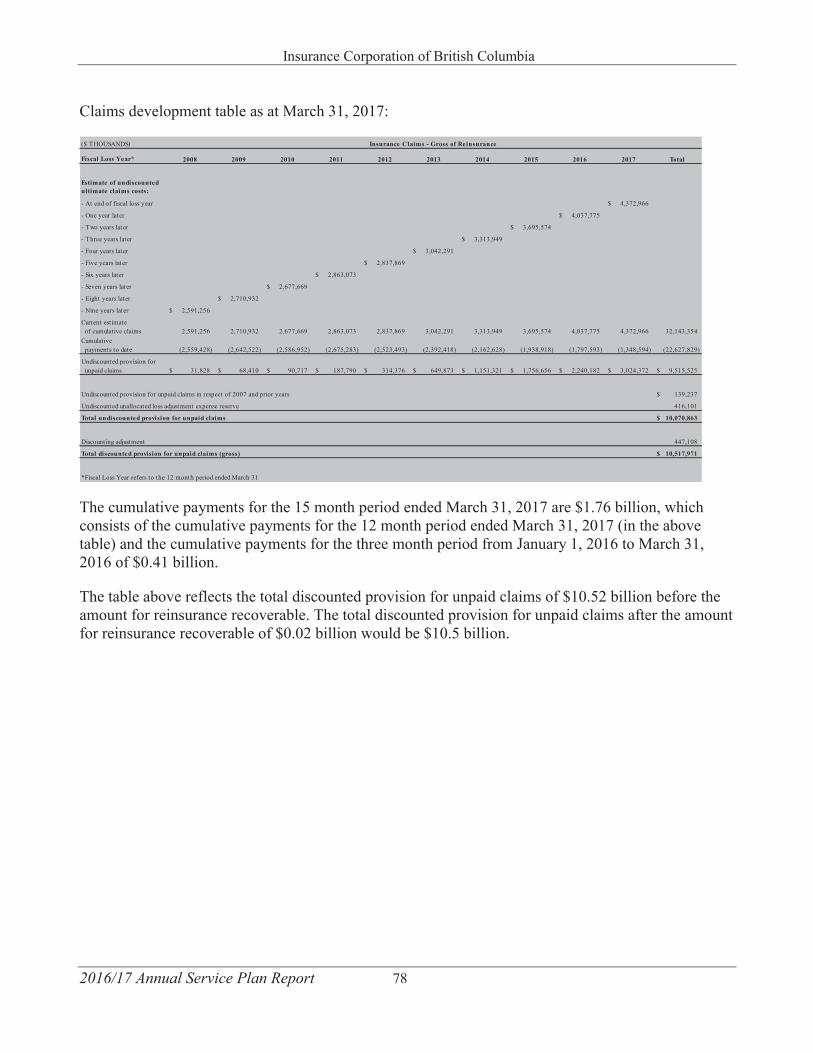
Insurance Corporation of British Columbia
2016/17 Annual Service Plan Report 78
Claims development table as at March 31, 2017:
The cumulative payments for the 15 month period ended March 31, 2017 are $1.76 billion, which consists of the cumulative payments for the 12 month period ended March 31, 2017 (in the above table) and the cumulative payments for the three month period from January 1, 2016 to March 31, 2016 of $0.41 billion.
The table above reflects the total discounted provision for unpaid claims of $10.52 billion before the amount for reinsurance recoverable. The total discounted provision for unpaid claims after the amount for reinsurance recoverable of $0.02 billion would be $10.5 billion.
($ THOUSANDS)
Fiscal Loss Year* 2008 2009 2010 2011 2012 2013 2014 2015 2016 2017 Total
Estimate of undiscounted ultimate claims costs:
- At end of fiscal loss year 4,372,966$
- One year later 4,037,775$
- Two years later 3,695,574$
- Three years later 3,313,949$
- Four years later 3,042,291$
- Five years later 2,837,869$
- Six years later 2,863,073$
- Seven years later 2,677,669$
- Eight years later 2,710,932$
- Nine years later 2,591,256$
Current estimate of cumulative claims 2,591,256 2,710,932 2,677,669 2,863,073 2,837,869 3,042,291 3,313,949 3,695,574 4,037,775 4,372,966 32,143,354Cumulative payments to date (2,559,428) (2,642,522) (2,586,952) (2,675,283) (2,523,493) (2,392,418) (2,162,628) (1,938,918) (1,797,593) (1,348,594) (22,627,829)
Undiscounted provision for unpaid claims 31,828$ 68,410$ 90,717$ 187,790$ 314,376$ 649,873$ 1,151,321$ 1,756,656$ 2,240,182$ 3,024,372$ 9,515,525$
139,237$
416,101
10,070,863$
Discounting adjustment 447,108
Total discounted provision for unpaid claims (gross) 10,517,971$
*Fiscal Loss Year refers to the 12 month period ended March 31
Insurance Claims - Gross of Reinsurance
Undiscounted provision for unpaid claims in respect of 2007 and prior years
Undiscounted unallocated loss adjustment expense reserve
Total undiscounted provision for unpaid claims
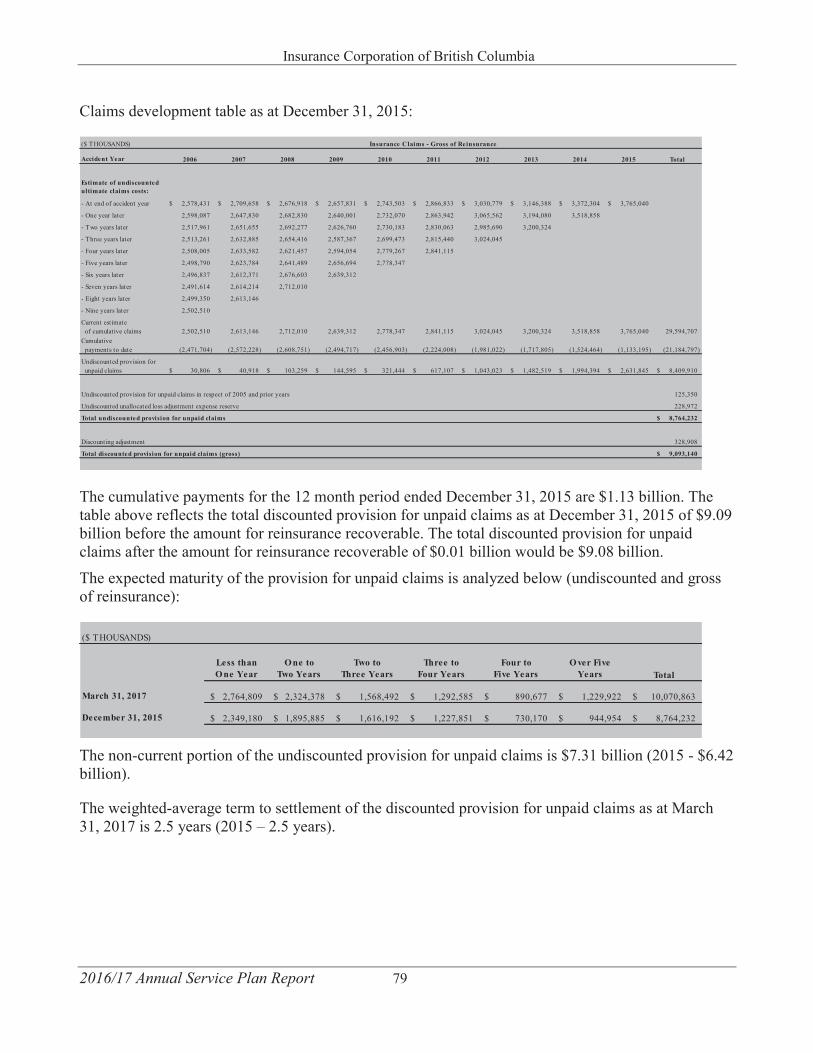
Insurance Corporation of British Columbia
2016/17 Annual Service Plan Report 79
Claims development table as at December 31, 2015:
The cumulative payments for the 12 month period ended December 31, 2015 are $1.13 billion. The table above reflects the total discounted provision for unpaid claims as at December 31, 2015 of $9.09 billion before the amount for reinsurance recoverable. The total discounted provision for unpaid claims after the amount for reinsurance recoverable of $0.01 billion would be $9.08 billion.
The expected maturity of the provision for unpaid claims is analyzed below (undiscounted and gross of reinsurance):
The non-current portion of the undiscounted provision for unpaid claims is $7.31 billion (2015 - $6.42billion).
The weighted-average term to settlement of the discounted provision for unpaid claims as at March 31, 2017 is 2.5 years (2015 – 2.5 years).
($ THOUSANDS)
Accident Year 2006 2007 2008 2009 2010 2011 2012 2013 2014 2015 Total
Estimate of undiscounted ultimate claims costs:
- At end of accident year 2,578,431$ 2,709,658$ 2,676,918$ 2,657,831$ 2,743,503$ 2,866,833$ 3,030,779$ 3,146,388$ 3,372,304$ 3,765,040$
- One year later 2,598,087 2,647,830 2,682,830 2,640,001 2,732,070 2,863,942 3,065,562 3,194,080 3,518,858
- Two years later 2,517,961 2,651,655 2,692,277 2,626,760 2,730,183 2,830,063 2,985,690 3,200,324
- Three years later 2,513,261 2,632,885 2,654,416 2,587,367 2,699,473 2,815,440 3,024,045
- Four years later 2,508,005 2,633,582 2,621,457 2,594,054 2,779,267 2,841,115
- Five years later 2,498,790 2,623,784 2,641,489 2,656,694 2,778,347
- Six years later 2,496,837 2,612,371 2,676,603 2,639,312
- Seven years later 2,491,614 2,614,214 2,712,010
- Eight years later 2,499,350 2,613,146
- Nine years later 2,502,510
Current estimate of cumulative claims 2,502,510 2,613,146 2,712,010 2,639,312 2,778,347 2,841,115 3,024,045 3,200,324 3,518,858 3,765,040 29,594,707Cumulative payments to date (2,471,704) (2,572,228) (2,608,751) (2,494,717) (2,456,903) (2,224,008) (1,981,022) (1,717,805) (1,524,464) (1,133,195) (21,184,797)
Undiscounted provision for unpaid claims 30,806$ 40,918$ 103,259$ 144,595$ 321,444$ 617,107$ 1,043,023$ 1,482,519$ 1,994,394$ 2,631,845$ 8,409,910$
125,350
228,972
8,764,232$
Discounting adjustment 328,908
9,093,140$
Insurance Claims - Gross of Reinsurance
Undiscounted unallocated loss adjustment expense reserve
Undiscounted provision for unpaid claims in respect of 2005 and prior years
Total undiscounted provision for unpaid claims
Total discounted provision for unpaid claims (gross)
($ THOUSANDS)
Less than O ne Year
O ne toTwo Years
Two to Three Years
Three toFour Years
Four to Five Years
O ver FiveYears Total
March 31, 2017 2,764,809$ 2,324,378$ 1,568,492$ 1,292,585$ 890,677$ 1,229,922$ 10,070,863$
December 31, 2015 2,349,180$ 1,895,885$ 1,616,192$ 1,227,851$ 730,170$ 944,954$ 8,764,232$
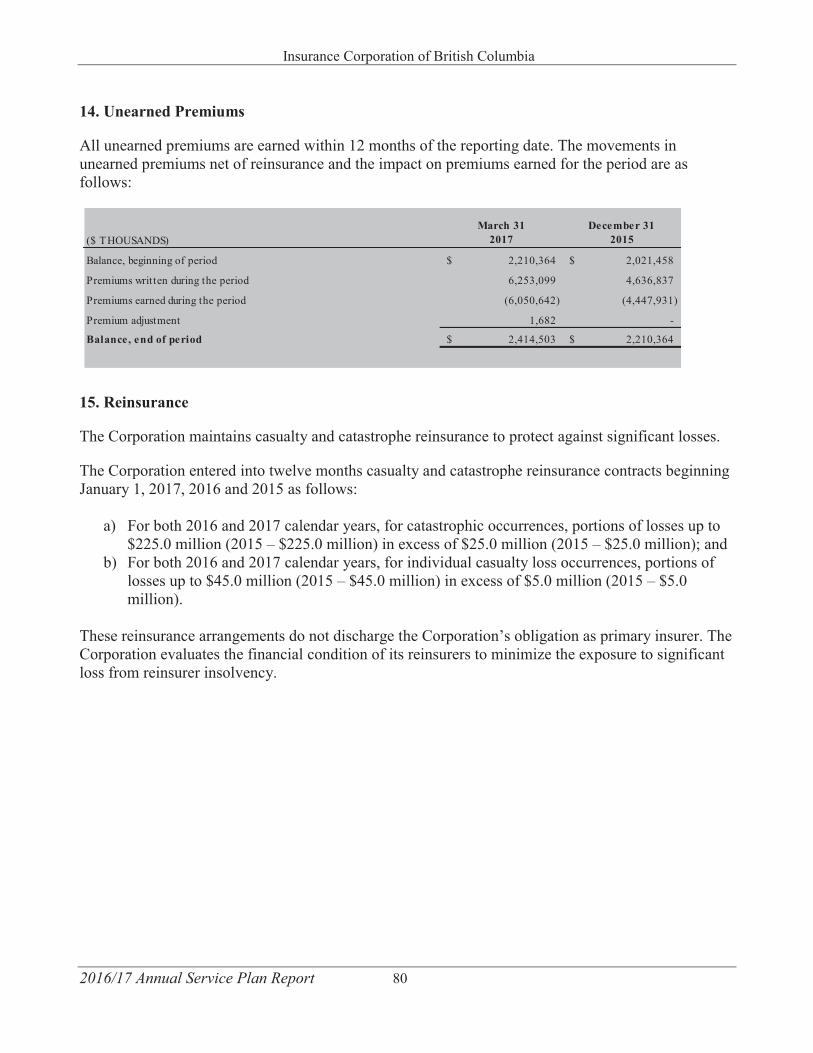
Insurance Corporation of British Columbia
2016/17 Annual Service Plan Report 80
14. Unearned Premiums
All unearned premiums are earned within 12 months of the reporting date. The movements in unearned premiums net of reinsurance and the impact on premiums earned for the period are as follows:
15. Reinsurance
The Corporation maintains casualty and catastrophe reinsurance to protect against significant losses.
The Corporation entered into twelve months casualty and catastrophe reinsurance contracts beginning January 1, 2017, 2016 and 2015 as follows:
a) For both 2016 and 2017 calendar years, for catastrophic occurrences, portions of losses up to$225.0 million (2015 – $225.0 million) in excess of $25.0 million (2015 – $25.0 million); and
b) For both 2016 and 2017 calendar years, for individual casualty loss occurrences, portions oflosses up to $45.0 million (2015 – $45.0 million) in excess of $5.0 million (2015 – $5.0million).
These reinsurance arrangements do not discharge the Corporation’s obligation as primary insurer. The Corporation evaluates the financial condition of its reinsurers to minimize the exposure to significant loss from reinsurer insolvency.
($ THOUSANDS)March 31
2017December 31
2015
Balance, beginning of period 2,210,364$ 2,021,458$
Premiums written during the period 6,253,099 4,636,837
Premiums earned during the period (6,050,642) (4,447,931)
Premium adjustment 1,682 -
Balance, end of period 2,414,503$ 2,210,364$
Insurance Corporation of British Columbia
2016/17 Annual Service Plan Report 81
16. Pension and Post-Retirement Benefits
Plan information
The Corporation sponsors a defined benefit registered pension plan for its current and former management and confidential employees (the Management and Confidential Plan). Subject to the terms of the plan, the Management and Confidential Plan provides benefits to members based on their length of service and eligible earnings in the best five years of plan membership. Employees are required to contribute to the Management and Confidential Plan. In addition, it sponsors two supplemental pension plans for certain employees. The Corporation is the legal administrator of the Management and Confidential Plan and the two supplemental pension plans. Subject to the terms of the plans, pensions are indexed in line with increases in the Consumer Price Index (CPI).
The Corporation also contributes to two other defined benefit pension plans for which it is not the sole sponsor. Current and former employees of the Corporation who are or were members of the Canadian Office & Professional Employees Union (COPE) Local 378 are members of the COPE 378/Insurance Corporation of British Columbia Pension Plan (COPE Plan). Half of the Trustees of the COPE Plan are appointed by the Corporation and the other half by COPE Local 378. The Board of Trustees of the COPE Plan is the legal plan administrator. The COPE Plan provides benefits to members based on their length of service and eligible earnings in the best five years of plan membership. Subject to the terms of the plan, pensions are indexed in line with increases in the CPI. The Corporation’s former Motor Vehicle Branch employees participate in the BC Public Service Pension Plan. The Corporation has no fiduciary responsibility for, or role in the governance of, the COPE Plan or the BC Public Service Pension Plan.
The Management and Confidential Plan, COPE Plan, and the BC Public Service Pension Plan are subject to the statutory requirements (including minimum funding requirements) of the British Columbia Pension Benefits Standards Act (PBSA) and the Income Tax Act (Canada). Each plan’s pace of funding is set out in their respective funding policies.
The Corporation pays Medical Services Plan premiums, life insurance premiums, extended healthcare, and dental costs as post-retirement benefits for its qualifying retirees. The benefits are not prefunded. Benefit entitlements differ for management and confidential and bargaining unit employees, as stated within the terms of the plans.
The Corporation measures its defined benefit obligations and the fair value of plan assets for accounting purposes each period as at the end of the Corporation’s fiscal period. Defined benefit obligations are extrapolated from the most recent actuarial valuation date for each of the plans. The Management and Confidential Plan and the post-retirement benefits actuarial valuations are as of December 31, 2015 and the COPE Plan is as of December 31, 2014. Updated actuarial valuations for each plan will be as of no later than three years from their most recent actuarial valuation date.
On its consolidated statement of financial position, the Corporation derecognizes its portion of anysurplus assets held by the COPE Plan because it cannot realize a future economic benefit in respect of those assets.
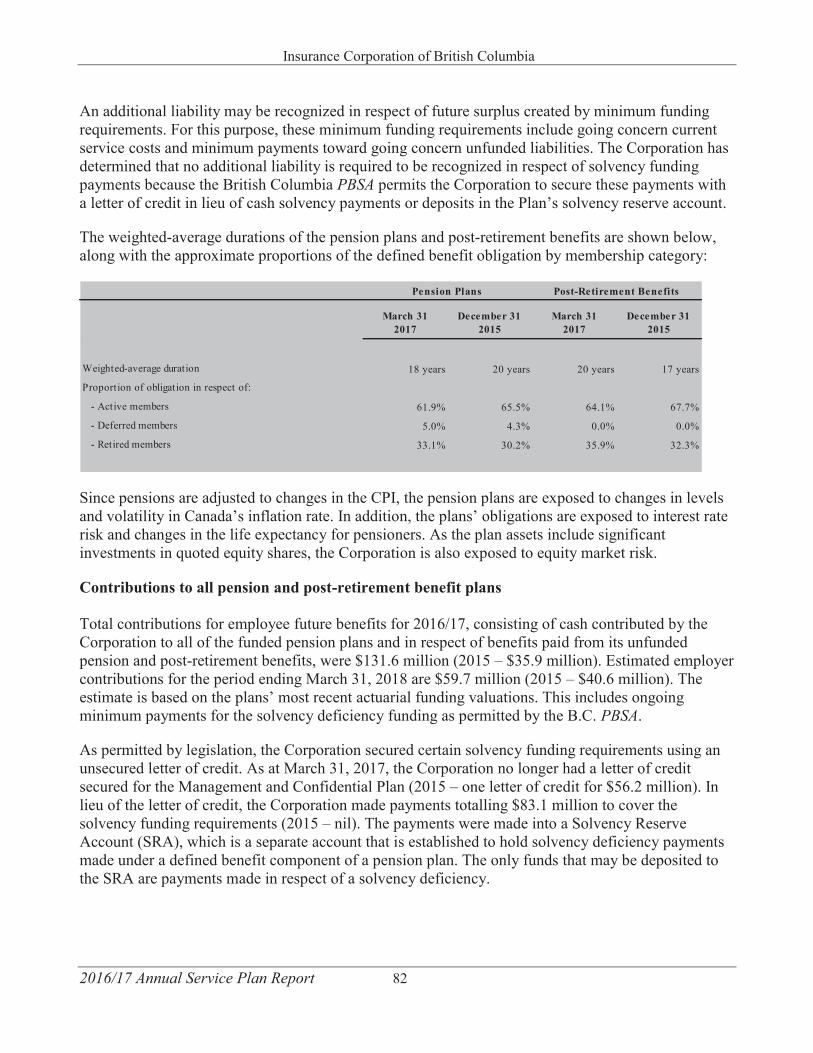
Insurance Corporation of British Columbia
2016/17 Annual Service Plan Report 82
An additional liability may be recognized in respect of future surplus created by minimum funding requirements. For this purpose, these minimum funding requirements include going concern current service costs and minimum payments toward going concern unfunded liabilities. The Corporation has determined that no additional liability is required to be recognized in respect of solvency funding payments because the British Columbia PBSA permits the Corporation to secure these payments with a letter of credit in lieu of cash solvency payments or deposits in the Plan’s solvency reserve account.
The weighted-average durations of the pension plans and post-retirement benefits are shown below, along with the approximate proportions of the defined benefit obligation by membership category:
Since pensions are adjusted to changes in the CPI, the pension plans are exposed to changes in levels and volatility in Canada’s inflation rate. In addition, the plans’ obligations are exposed to interest rate risk and changes in the life expectancy for pensioners. As the plan assets include significant investments in quoted equity shares, the Corporation is also exposed to equity market risk.
Contributions to all pension and post-retirement benefit plans
Total contributions for employee future benefits for 2016/17, consisting of cash contributed by the Corporation to all of the funded pension plans and in respect of benefits paid from its unfunded pension and post-retirement benefits, were $131.6 million (2015 – $35.9 million). Estimated employer contributions for the period ending March 31, 2018 are $59.7 million (2015 – $40.6 million). The estimate is based on the plans’ most recent actuarial funding valuations. This includes ongoing minimum payments for the solvency deficiency funding as permitted by the B.C. PBSA.
As permitted by legislation, the Corporation secured certain solvency funding requirements using an unsecured letter of credit. As at March 31, 2017, the Corporation no longer had a letter of credit secured for the Management and Confidential Plan (2015 – one letter of credit for $56.2 million). In lieu of the letter of credit, the Corporation made payments totalling $83.1 million to cover the solvency funding requirements (2015 – nil). The payments were made into a Solvency Reserve Account (SRA), which is a separate account that is established to hold solvency deficiency payments made under a defined benefit component of a pension plan. The only funds that may be deposited to the SRA are payments made in respect of a solvency deficiency.
March 312017
December 312015
March 312017
December 312015
Weighted-average duration 18 years 20 years 20 years 17 years
Proportion of obligation in respect of:
- Active members 61.9% 65.5% 64.1% 67.7%
- Deferred members 5.0% 4.3% 0.0% 0.0%
- Retired members 33.1% 30.2% 35.9% 32.3%
Pension Plans Post-Retirement Benefits
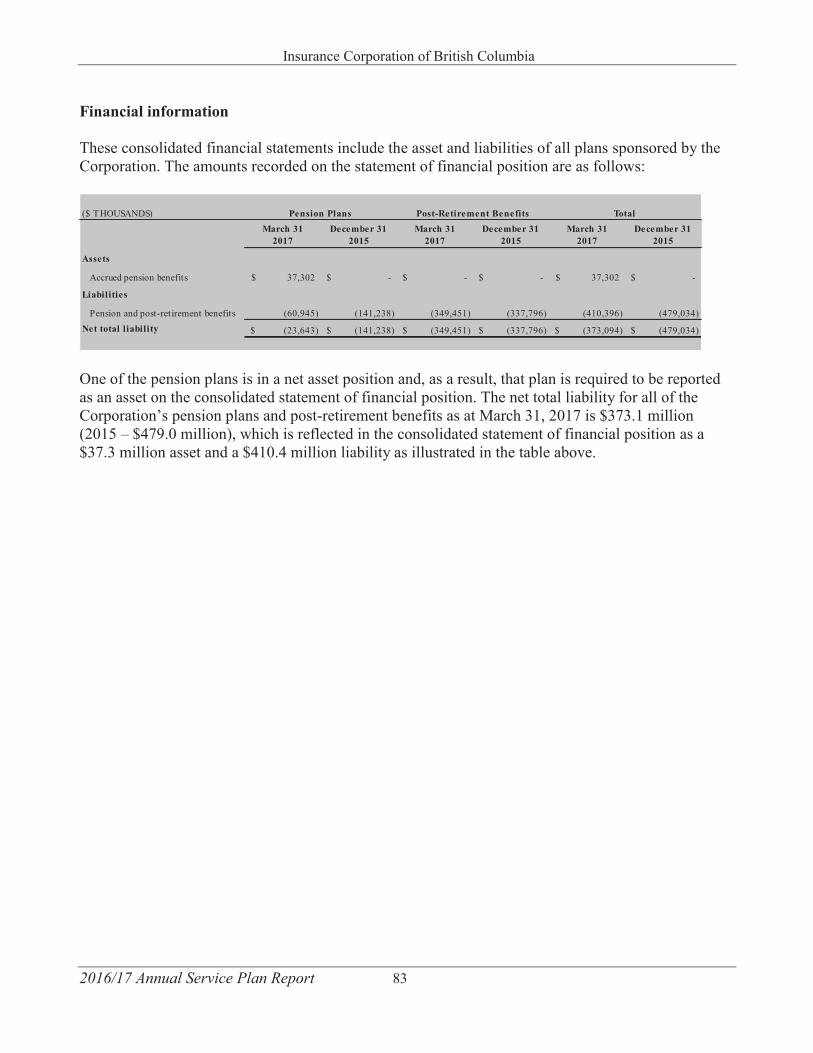
Insurance Corporation of British Columbia
2016/17 Annual Service Plan Report 83
Financial information
These consolidated financial statements include the asset and liabilities of all plans sponsored by the Corporation. The amounts recorded on the statement of financial position are as follows:
One of the pension plans is in a net asset position and, as a result, that plan is required to be reported as an asset on the consolidated statement of financial position. The net total liability for all of the Corporation’s pension plans and post-retirement benefits as at March 31, 2017 is $373.1 million (2015 – $479.0 million), which is reflected in the consolidated statement of financial position as a $37.3 million asset and a $410.4 million liability as illustrated in the table above.
($ THOUSANDS)March 31
2017December 31
2015March 31
2017December 31
2015March 31
2017December 31
2015
Assets
Accrued pension benefits 37,302$ -$ -$ -$ 37,302$ -$
Liabilities
Pension and post-retirement benefits (60,945) (141,238) (349,451) (337,796) (410,396) (479,034)Net total liability (23,643)$ (141,238)$ (349,451)$ (337,796)$ (373,094)$ (479,034)$
Pension Plans Post-Retirement Benefits Total
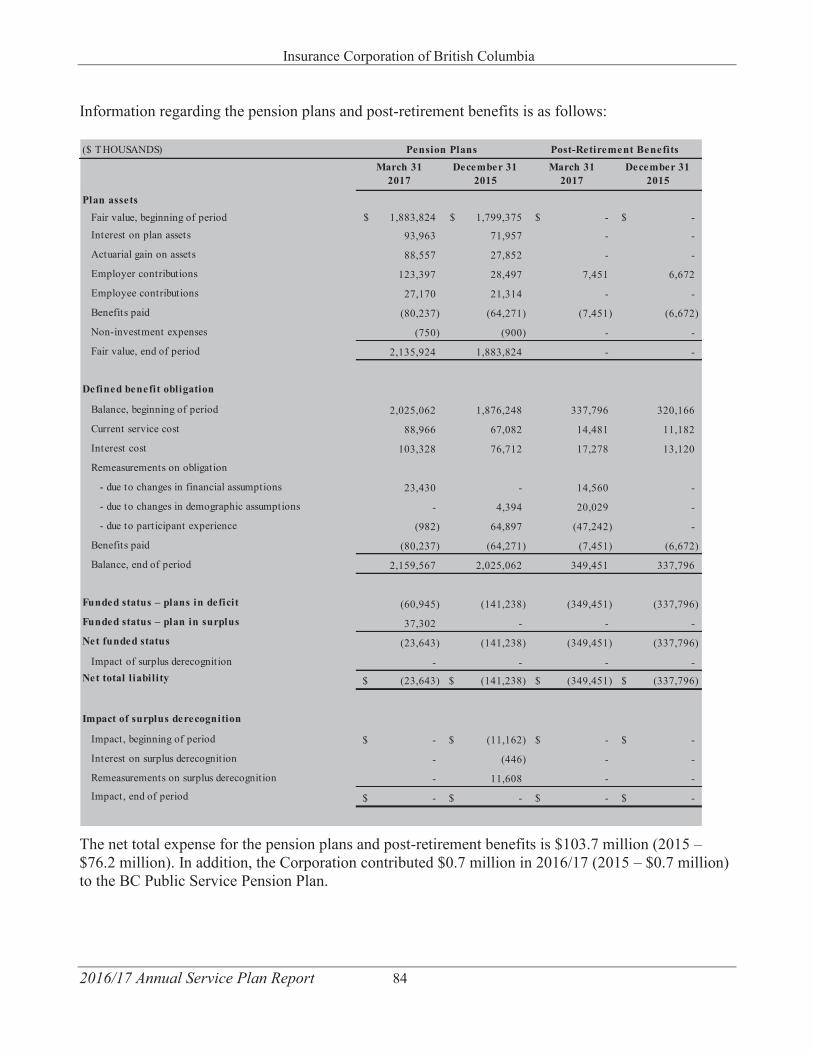
Insurance Corporation of British Columbia
2016/17 Annual Service Plan Report 84
Information regarding the pension plans and post-retirement benefits is as follows:
The net total expense for the pension plans and post-retirement benefits is $103.7 million (2015 – $76.2 million). In addition, the Corporation contributed $0.7 million in 2016/17 (2015 – $0.7 million) to the BC Public Service Pension Plan.
($ THOUSANDS)March 31
2017December 31
2015March 31
2017December 31
2015
Plan assetsFair value, beginning of period 1,883,824$ 1,799,375$ -$ -$ Interest on plan assets 93,963 71,957 - -
Actuarial gain on assets 88,557 27,852 - -
Employer contributions 123,397 28,497 7,451 6,672
Employee contributions 27,170 21,314 - -
Benefits paid (80,237) (64,271) (7,451) (6,672)
Non-investment expenses (750) (900) - -
Fair value, end of period 2,135,924 1,883,824 - -
Defined benefit obligation
Balance, beginning of period 2,025,062 1,876,248 337,796 320,166
Current service cost 88,966 67,082 14,481 11,182
Interest cost 103,328 76,712 17,278 13,120
Remeasurements on obligation
- due to changes in financial assumptions 23,430 - 14,560 -
- due to changes in demographic assumptions - 4,394 20,029 -
- due to participant experience (982) 64,897 (47,242) -
Benefits paid (80,237) (64,271) (7,451) (6,672)
Balance, end of period 2,159,567 2,025,062 349,451 337,796
Funded status – plans in deficit (60,945) (141,238) (349,451) (337,796) Funded status – plan in surplus 37,302 - - - Net funded status (23,643) (141,238) (349,451) (337,796)
Impact of surplus derecognition - - - - Net total liability (23,643)$ (141,238)$ (349,451)$ (337,796)$
Impact of surplus derecognition
Impact, beginning of period -$ (11,162)$ -$ -$
Interest on surplus derecognition - (446) - -
Remeasurements on surplus derecognition - 11,608 - - Impact, end of period -$ -$ -$ -$
Pension Plans Post-Retirement Benefits
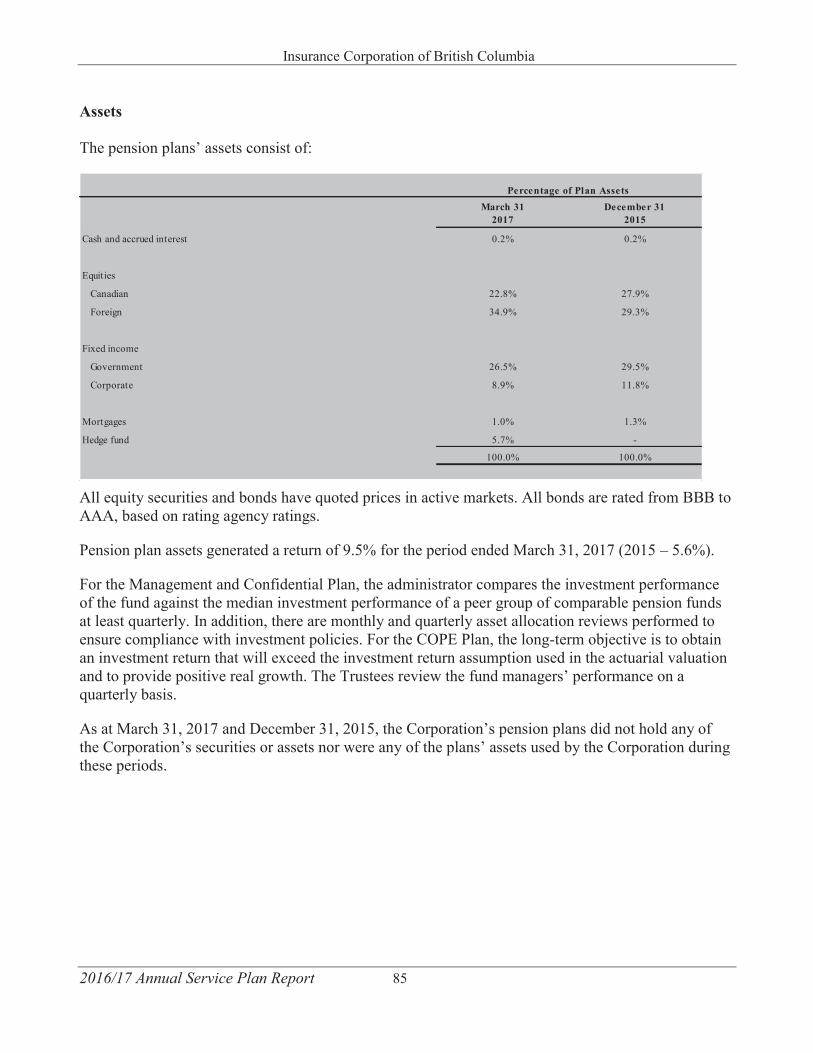
Insurance Corporation of British Columbia
2016/17 Annual Service Plan Report 85
Assets The pension plans’ assets consist of:
All equity securities and bonds have quoted prices in active markets. All bonds are rated from BBB to AAA, based on rating agency ratings.
Pension plan assets generated a return of 9.5% for the period ended March 31, 2017 (2015 – 5.6%).
For the Management and Confidential Plan, the administrator compares the investment performance of the fund against the median investment performance of a peer group of comparable pension funds at least quarterly. In addition, there are monthly and quarterly asset allocation reviews performed to ensure compliance with investment policies. For the COPE Plan, the long-term objective is to obtain an investment return that will exceed the investment return assumption used in the actuarial valuation and to provide positive real growth. The Trustees review the fund managers’ performance on a quarterly basis.
As at March 31, 2017 and December 31, 2015, the Corporation’s pension plans did not hold any of the Corporation’s securities or assets nor were any of the plans’ assets used by the Corporation during these periods.
March 312017
December 312015
Cash and accrued interest 0.2% 0.2%
Equities
Canadian 22.8% 27.9%
Foreign 34.9% 29.3%
Fixed income
Government 26.5% 29.5%
Corporate 8.9% 11.8%
Mortgages 1.0% 1.3%
Hedge fund 5.7% -
100.0% 100.0%
Percentage of Plan Assets
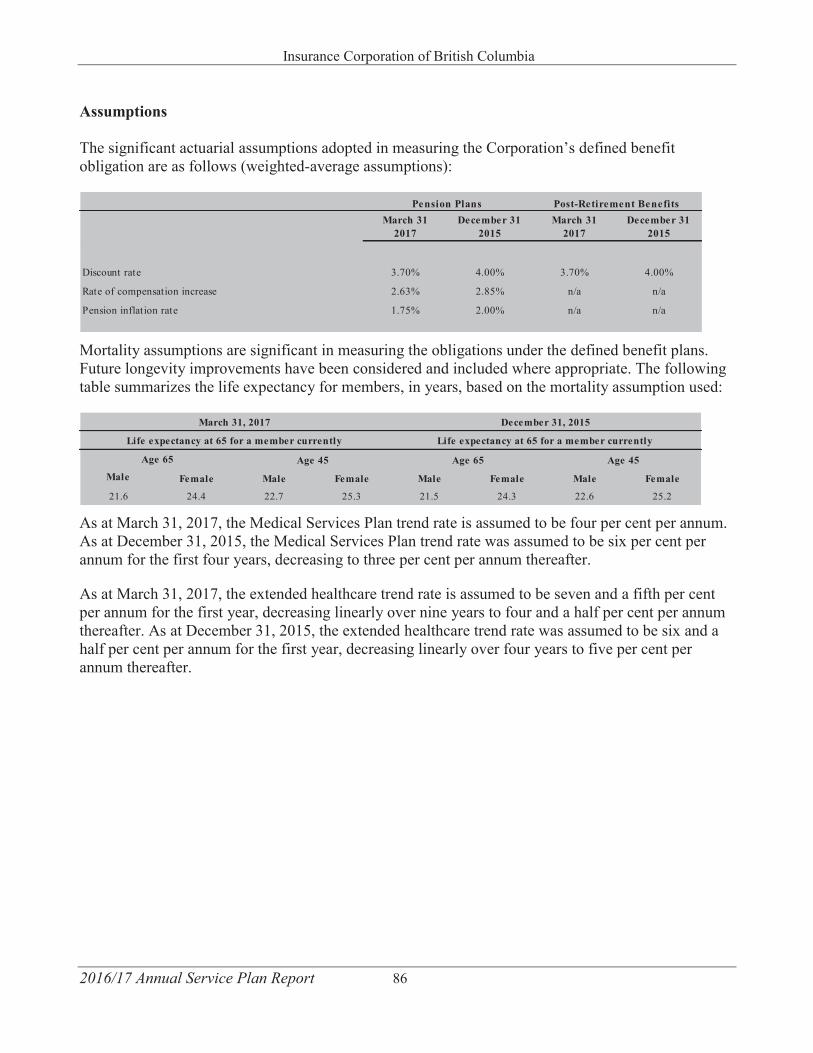
Insurance Corporation of British Columbia
2016/17 Annual Service Plan Report 86
Assumptions The significant actuarial assumptions adopted in measuring the Corporation’s defined benefit obligation are as follows (weighted-average assumptions):
Mortality assumptions are significant in measuring the obligations under the defined benefit plans. Future longevity improvements have been considered and included where appropriate. The following table summarizes the life expectancy for members, in years, based on the mortality assumption used:
As at March 31, 2017, the Medical Services Plan trend rate is assumed to be four per cent per annum. As at December 31, 2015, the Medical Services Plan trend rate was assumed to be six per cent per annum for the first four years, decreasing to three per cent per annum thereafter.
As at March 31, 2017, the extended healthcare trend rate is assumed to be seven and a fifth per cent per annum for the first year, decreasing linearly over nine years to four and a half per cent per annum thereafter. As at December 31, 2015, the extended healthcare trend rate was assumed to be six and a half per cent per annum for the first year, decreasing linearly over four years to five per cent per annum thereafter.
March 312017
December 312015
March 312017
December 312015
Discount rate 3.70% 4.00% 3.70% 4.00%
Rate of compensation increase 2.63% 2.85% n/a n/a
Pension inflation rate 1.75% 2.00% n/a n/a
Pension Plans Post-Retirement Benefits
Male Female Male Female Male Female Male Female
21.6 24.4 22.7 25.3 21.5 24.3 22.6 25.2
March 31, 2017 December 31, 2015
Life expectancy at 65 for a member currently Life expectancy at 65 for a member currently
Age 65 Age 45 Age 65 Age 45
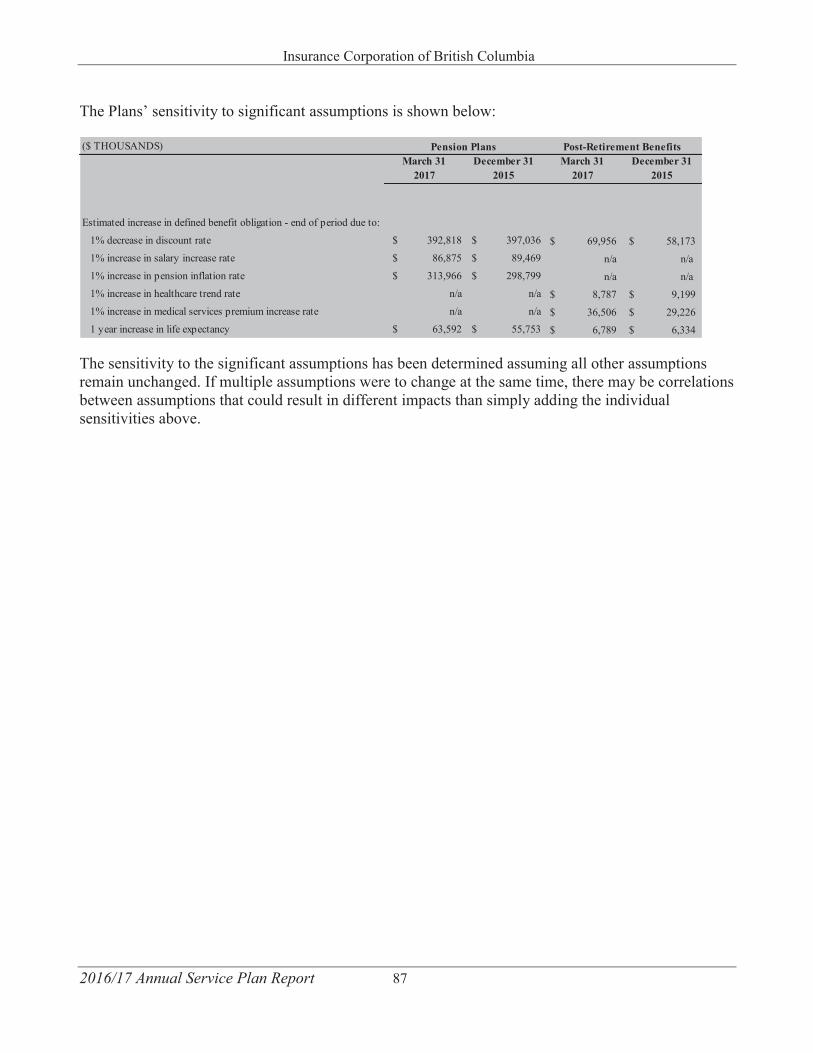
Insurance Corporation of British Columbia
2016/17 Annual Service Plan Report 87
The Plans’ sensitivity to significant assumptions is shown below:
The sensitivity to the significant assumptions has been determined assuming all other assumptions remain unchanged. If multiple assumptions were to change at the same time, there may be correlations between assumptions that could result in different impacts than simply adding the individual sensitivities above.
($ THOUSANDS)March 31
2017December 31
2015March 31
2017December 31
2015
Estimated increase in defined benefit obligation - end of period due to:
1% decrease in discount rate $ 392,818 $ 397,036 69,956$ 58,173$ 1% increase in salary increase rate $ 86,875 $ 89,469 n/a n/a 1% increase in pension inflation rate $ 313,966 $ 298,799 n/a n/a 1% increase in healthcare trend rate n/a n/a 8,787$ 9,199$ 1% increase in medical services premium increase rate n/a n/a 36,506$ 29,226$ 1 year increase in life expectancy $ 63,592 $ 55,753 6,789$ 6,334$
Pension Plans Post-Retirement Benefits
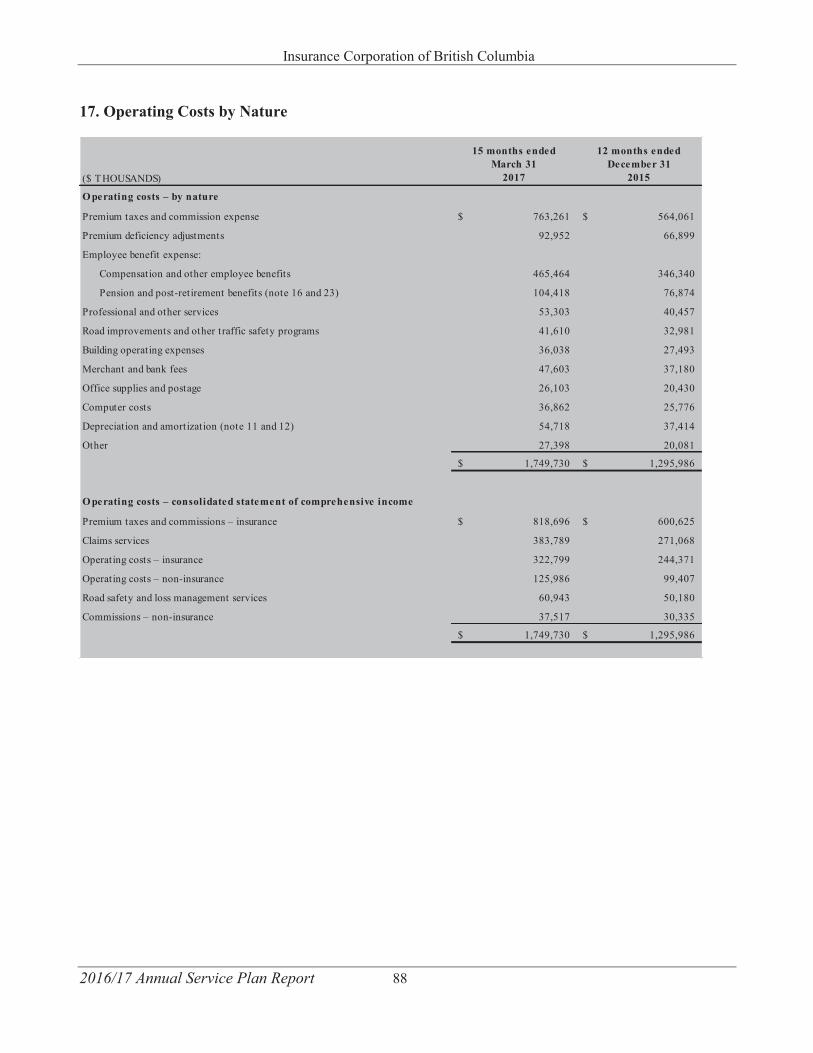
Insurance Corporation of British Columbia
2016/17 Annual Service Plan Report 88
17. Operating Costs by Nature
($ THOUSANDS)
15 months ended March 31
2017
12 months ended December 31
2015
O perating costs – by nature
Premium taxes and commission expense 763,261$ 564,061$
Premium deficiency adjustments 92,952 66,899
Employee benefit expense:
Compensation and other employee benefits 465,464 346,340
Pension and post-retirement benefits (note 16 and 23) 104,418 76,874
Professional and other services 53,303 40,457
Road improvements and other traffic safety programs 41,610 32,981
Building operating expenses 36,038 27,493
Merchant and bank fees 47,603 37,180
Office supplies and postage 26,103 20,430
Computer costs 36,862 25,776
Depreciation and amortization (note 11 and 12) 54,718 37,414
Other 27,398 20,081
1,749,730$ 1,295,986$
O perating costs – consolidated statement of comprehensive income
Premium taxes and commissions – insurance 818,696$ 600,625$
Claims services 383,789 271,068
Operating costs – insurance 322,799 244,371
Operating costs – non-insurance 125,986 99,407
Road safety and loss management services 60,943 50,180
Commissions – non-insurance 37,517 30,335
1,749,730$ 1,295,986$
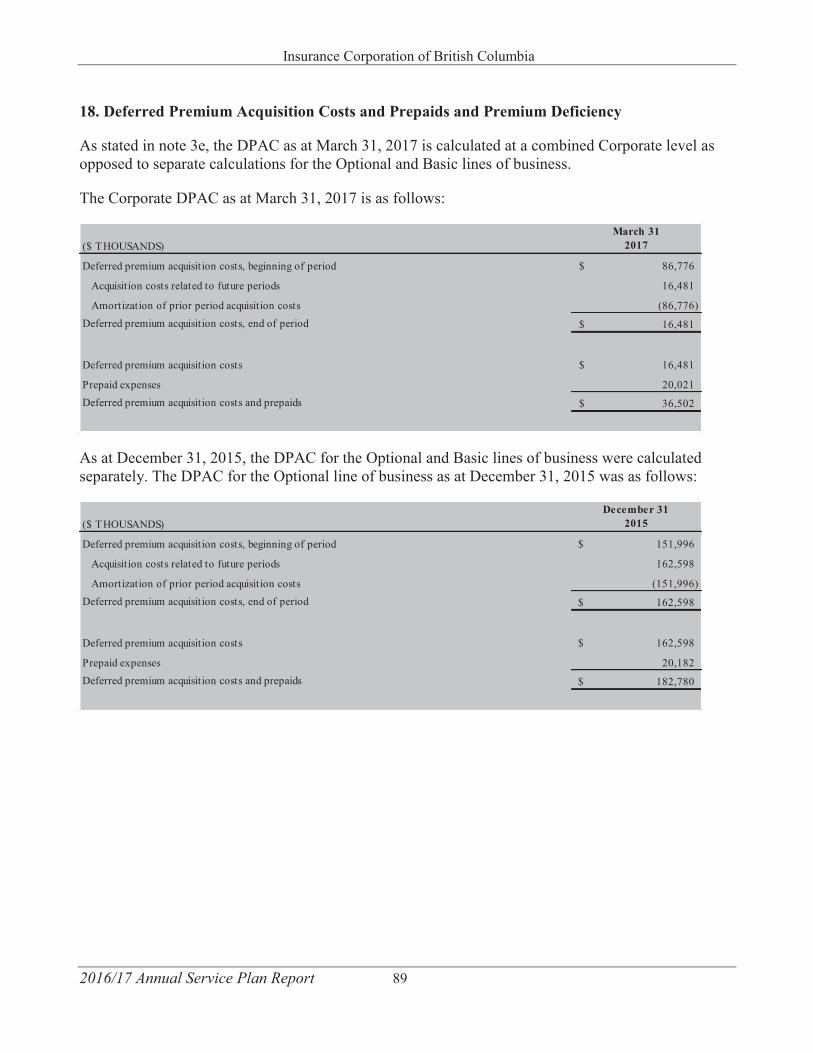
Insurance Corporation of British Columbia
2016/17 Annual Service Plan Report 89
18. Deferred Premium Acquisition Costs and Prepaids and Premium Deficiency
As stated in note 3e, the DPAC as at March 31, 2017 is calculated at a combined Corporate level as opposed to separate calculations for the Optional and Basic lines of business.
The Corporate DPAC as at March 31, 2017 is as follows:
As at December 31, 2015, the DPAC for the Optional and Basic lines of business were calculated separately. The DPAC for the Optional line of business as at December 31, 2015 was as follows:
($ THOUSANDS)March 31
2017
Deferred premium acquisition costs, beginning of period 86,776$
Acquisition costs related to future periods 16,481
Amortization of prior period acquisition costs (86,776) Deferred premium acquisition costs, end of period 16,481$
Deferred premium acquisition costs 16,481$
Prepaid expenses 20,021 Deferred premium acquisition costs and prepaids 36,502$
($ THOUSANDS)December 31
2015
Deferred premium acquisition costs, beginning of period 151,996$
Acquisition costs related to future periods 162,598
Amortization of prior period acquisition costs (151,996) Deferred premium acquisition costs, end of period 162,598$
Deferred premium acquisition costs 162,598$
Prepaid expenses 20,182 Deferred premium acquisition costs and prepaids 182,780$
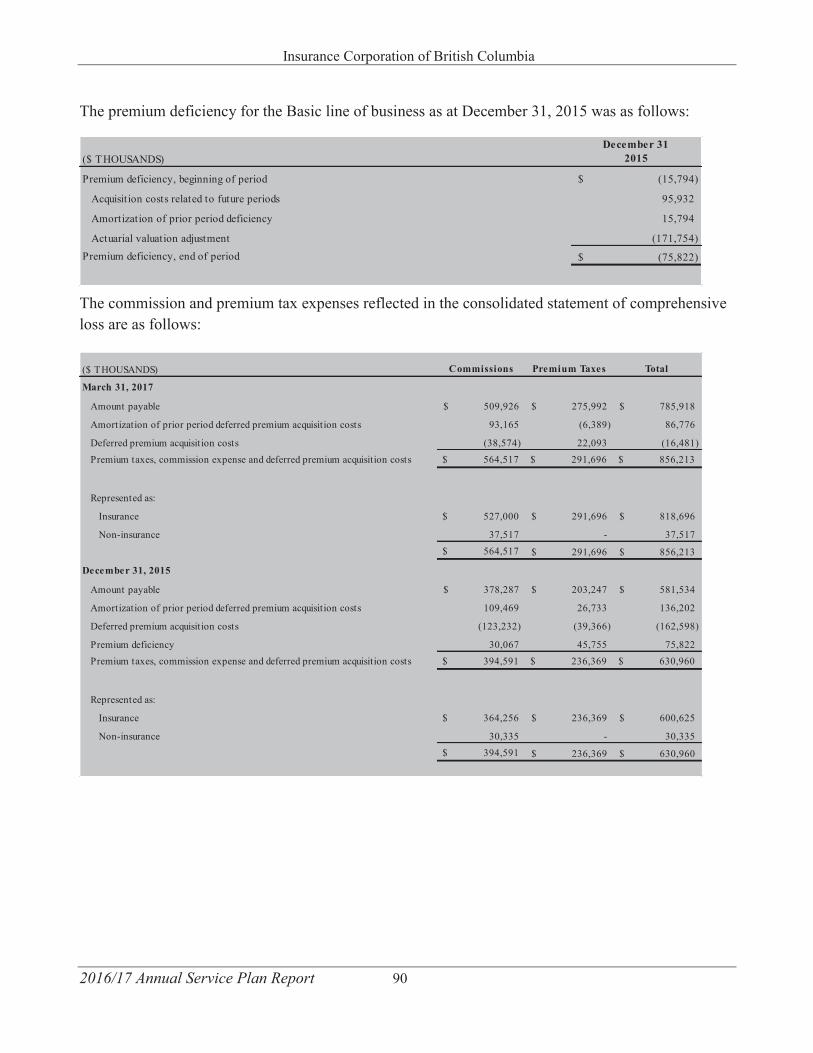
Insurance Corporation of British Columbia
2016/17 Annual Service Plan Report 90
The premium deficiency for the Basic line of business as at December 31, 2015 was as follows:
The commission and premium tax expenses reflected in the consolidated statement of comprehensive loss are as follows:
($ THOUSANDS)December 31
2015
Premium deficiency, beginning of period (15,794)$
Acquisition costs related to future periods 95,932
Amortization of prior period deficiency 15,794
Actuarial valuation adjustment (171,754)Premium deficiency, end of period (75,822)$
($ THOUSANDS) Commissions Premium Taxes Total
March 31, 2017
Amount payable 509,926$ 275,992$ 785,918$
Amortization of prior period deferred premium acquisition costs 93,165 (6,389) 86,776
Deferred premium acquisition costs (38,574) 22,093 (16,481)Premium taxes, commission expense and deferred premium acquisition costs $ 564,517 $ 291,696 $ 856,213
Represented as:
Insurance $ 527,000 291,696$ 818,696$
Non-insurance 37,517 - 37,517 $ 564,517 291,696$ 856,213$
December 31, 2015
Amount payable 378,287$ 203,247$ 581,534$
Amortization of prior period deferred premium acquisition costs 109,469 26,733 136,202
Deferred premium acquisition costs (123,232) (39,366) (162,598)
Premium deficiency 30,067 45,755 75,822Premium taxes, commission expense and deferred premium acquisition costs $ 394,591 $ 236,369 $ 630,960
Represented as:
Insurance $ 364,256 236,369$ 600,625$
Non-insurance 30,335 - 30,335 $ 394,591 236,369$ 630,960$
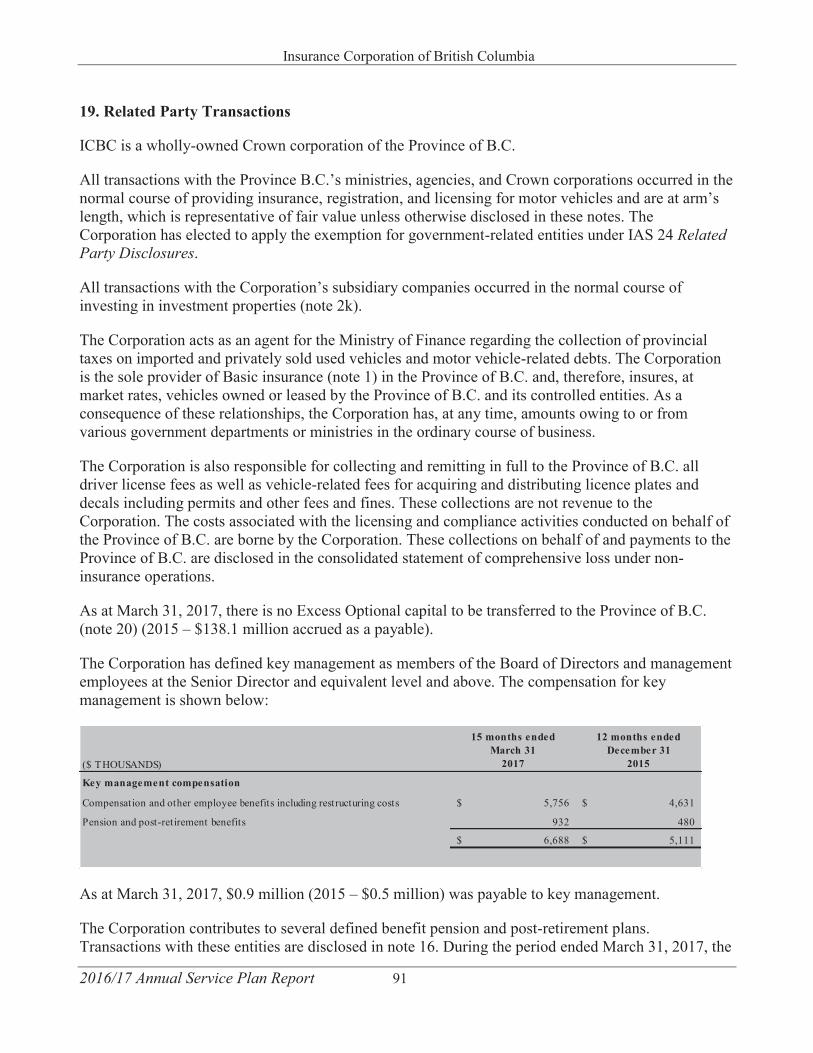
Insurance Corporation of British Columbia
2016/17 Annual Service Plan Report 91
19. Related Party Transactions
ICBC is a wholly-owned Crown corporation of the Province of B.C.
All transactions with the Province B.C.’s ministries, agencies, and Crown corporations occurred in the normal course of providing insurance, registration, and licensing for motor vehicles and are at arm’s length, which is representative of fair value unless otherwise disclosed in these notes. The Corporation has elected to apply the exemption for government-related entities under IAS 24 Related Party Disclosures.
All transactions with the Corporation’s subsidiary companies occurred in the normal course of investing in investment properties (note 2k).
The Corporation acts as an agent for the Ministry of Finance regarding the collection of provincial taxes on imported and privately sold used vehicles and motor vehicle-related debts. The Corporation is the sole provider of Basic insurance (note 1) in the Province of B.C. and, therefore, insures, at market rates, vehicles owned or leased by the Province of B.C. and its controlled entities. As a consequence of these relationships, the Corporation has, at any time, amounts owing to or from various government departments or ministries in the ordinary course of business.
The Corporation is also responsible for collecting and remitting in full to the Province of B.C. all driver license fees as well as vehicle-related fees for acquiring and distributing licence plates and decals including permits and other fees and fines. These collections are not revenue to the Corporation. The costs associated with the licensing and compliance activities conducted on behalf of the Province of B.C. are borne by the Corporation. These collections on behalf of and payments to the Province of B.C. are disclosed in the consolidated statement of comprehensive loss under non-insurance operations.
As at March 31, 2017, there is no Excess Optional capital to be transferred to the Province of B.C. (note 20) (2015 – $138.1 million accrued as a payable).
The Corporation has defined key management as members of the Board of Directors and management employees at the Senior Director and equivalent level and above. The compensation for key management is shown below:
As at March 31, 2017, $0.9 million (2015 – $0.5 million) was payable to key management.
The Corporation contributes to several defined benefit pension and post-retirement plans. Transactions with these entities are disclosed in note 16. During the period ended March 31, 2017, the
($ THOUSANDS)
15 months ended March 31
2017
12 months ended December 31
2015
Key management compensation
Compensation and other employee benefits including restructuring costs 5,756$ 4,631$
Pension and post-retirement benefits 932 480
6,688$ 5,111$
Insurance Corporation of British Columbia
2016/17 Annual Service Plan Report 92
Corporation incurred $4.3 million (2015 – $3.4 million) in administrative expenses and investment management fees on behalf of these plans interest-free. In addition, the Corporation provides certain administrative, investment management, and office services to the plans at no charge. As at March 31, 2017, $0.6 million (2015 – $1.7 million) was payable to these plans for employer contributions.
Other related party transactions have been disclosed elsewhere in the notes to the consolidated financial statements.
20. Capital Management
The Corporation’s capital is comprised of retained earnings, other components of equity, and NCI. The Corporation’s objectives for managing capital are to maintain financial strength including the management of ongoing business risks and protect its ability to meet the obligations owed to policyholders and others.
As prescribed in the British Columbia Government’s Special Direction IC2 (IC2) for Basic and the Insurance Corporation Act (ICA) for Optional insurance, the Corporation is guided by the capital management framework of the Office of the Superintendent of Financial Institutions Canada (OSFI), adopting OSFI’s minimum capital test (MCT) as a means to measure and monitor the Corporation’s capital levels. The MCT utilizes a risk-based formula to assess the capital adequacy of an insurance company by defining the capital available that is required to meet the minimum standards.
The Corporation has an internal corporate management target for MCT which is comprised of two components being the Basic and Optional insurance business MCT targets. For the Basic insurance business, the IC2 requires the Corporation, through BCUC oversight, to maintain capital available equal to at least 100% of MCT. BCUC has approved a Capital Management Plan for Basic insurance that includes a Basic management target MCT ratio at a higher level, sufficient to prevent capital falling below the 100% minimum threshold in most years (note 22) and an additional margin for relatively smooth and predictable rates. In the interest of keeping rates as low and affordable as possible for British Columbians, the Province of B.C. directed transfers of income from Optional to Basic insurance, enabling the Corporation to file for a 4.9% Basic rate increase in the 2016 revenue requirements application, which was subsequently approved by BCUC. To maintain Basic capital above legislative minimums, the Province of B.C. further directed a transfer from Optional insurance capital to Basic insurance.
Amendments made to IC2 in 2016 suspend the capital build and release provisions of the existing Capital Management Plan and keep the capital maintenance provision stable so that there is no impact on the Basic insurance rate change.
For the Optional insurance business, the ICA requires the Corporation to determine a capital management target that either is calculated by the Corporation based on the MCT guideline and the Guideline on Stress Testing issued by OSFI or as directed by the Province of B.C. At period end, when Optional capital is in excess of the management target, that amount is to be transferred to the Province of B.C. by July 1 of the following year (notes 19 and 22).
During 2016/17, the Corporation successfully completed and implemented a business renewal program known as the Transformation Program (TP) to address key business issues, including
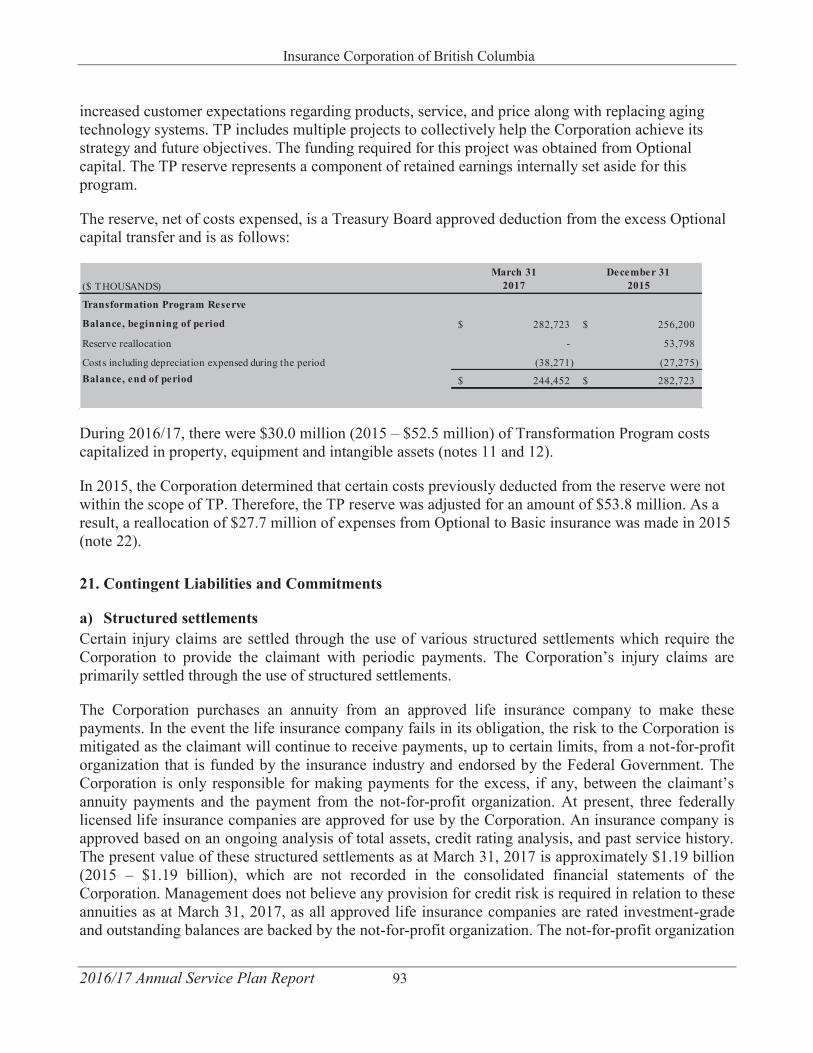
Insurance Corporation of British Columbia
2016/17 Annual Service Plan Report 93
increased customer expectations regarding products, service, and price along with replacing aging technology systems. TP includes multiple projects to collectively help the Corporation achieve its strategy and future objectives. The funding required for this project was obtained from Optional capital. The TP reserve represents a component of retained earnings internally set aside for this program.
The reserve, net of costs expensed, is a Treasury Board approved deduction from the excess Optional capital transfer and is as follows:
During 2016/17, there were $30.0 million (2015 – $52.5 million) of Transformation Program costs capitalized in property, equipment and intangible assets (notes 11 and 12).
In 2015, the Corporation determined that certain costs previously deducted from the reserve were not within the scope of TP. Therefore, the TP reserve was adjusted for an amount of $53.8 million. As a result, a reallocation of $27.7 million of expenses from Optional to Basic insurance was made in 2015 (note 22).
21. Contingent Liabilities and Commitments
a) Structured settlements Certain injury claims are settled through the use of various structured settlements which require the Corporation to provide the claimant with periodic payments. The Corporation’s injury claims are primarily settled through the use of structured settlements.
The Corporation purchases an annuity from an approved life insurance company to make these payments. In the event the life insurance company fails in its obligation, the risk to the Corporation is mitigated as the claimant will continue to receive payments, up to certain limits, from a not-for-profit organization that is funded by the insurance industry and endorsed by the Federal Government. The Corporation is only responsible for making payments for the excess, if any, between the claimant’s annuity payments and the payment from the not-for-profit organization. At present, three federally licensed life insurance companies are approved for use by the Corporation. An insurance company is approved based on an ongoing analysis of total assets, credit rating analysis, and past service history. The present value of these structured settlements as at March 31, 2017 is approximately $1.19 billion (2015 – $1.19 billion), which are not recorded in the consolidated financial statements of the Corporation. Management does not believe any provision for credit risk is required in relation to these annuities as at March 31, 2017, as all approved life insurance companies are rated investment-grade and outstanding balances are backed by the not-for-profit organization. The not-for-profit organization
($ THOUSANDS)March 31
2017December 31
2015
Transformation Program Reserve
Balance, beginning of period 282,723$ 256,200$
Reserve reallocation - 53,798
Costs including depreciation expensed during the period (38,271) (27,275) Balance, end of period 244,452$ 282,723$
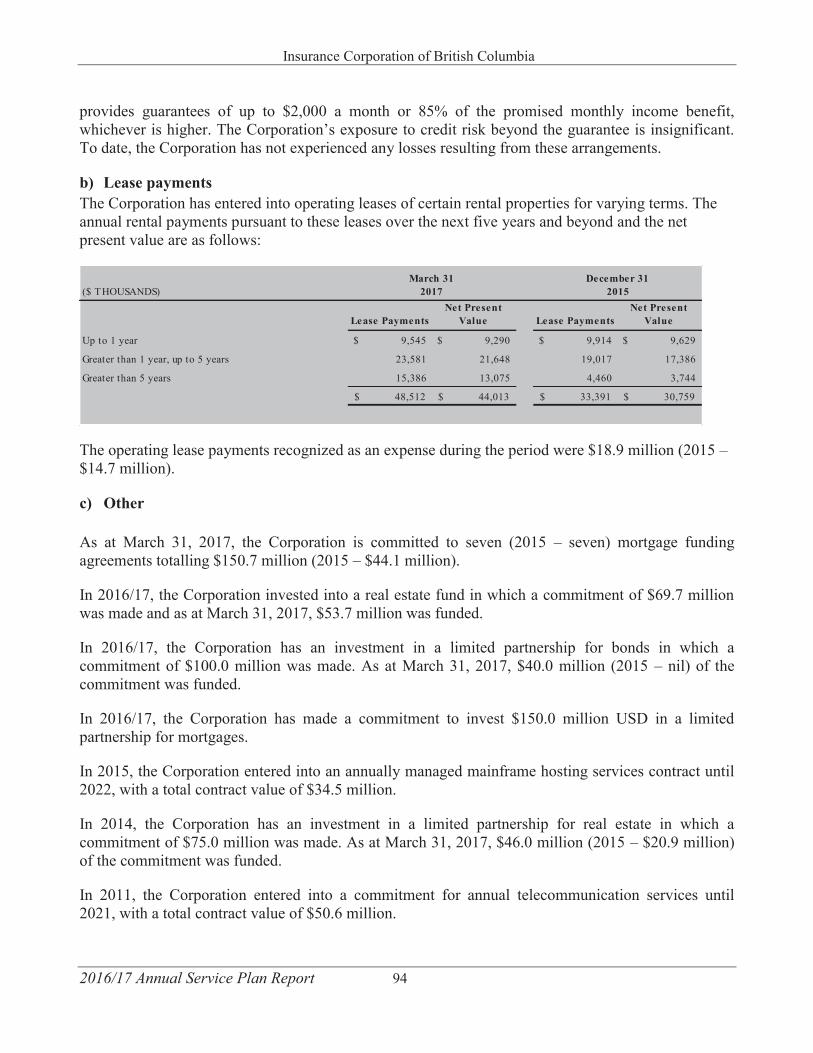
Insurance Corporation of British Columbia
2016/17 Annual Service Plan Report 94
provides guarantees of up to $2,000 a month or 85% of the promised monthly income benefit, whichever is higher. The Corporation’s exposure to credit risk beyond the guarantee is insignificant. To date, the Corporation has not experienced any losses resulting from these arrangements.
b) Lease paymentsThe Corporation has entered into operating leases of certain rental properties for varying terms. The annual rental payments pursuant to these leases over the next five years and beyond and the net present value are as follows:
The operating lease payments recognized as an expense during the period were $18.9 million (2015 –$14.7 million).
c) Other
As at March 31, 2017, the Corporation is committed to seven (2015 – seven) mortgage funding agreements totalling $150.7 million (2015 – $44.1 million).
In 2016/17, the Corporation invested into a real estate fund in which a commitment of $69.7 million was made and as at March 31, 2017, $53.7 million was funded.
In 2016/17, the Corporation has an investment in a limited partnership for bonds in which a commitment of $100.0 million was made. As at March 31, 2017, $40.0 million (2015 – nil) of the commitment was funded.
In 2016/17, the Corporation has made a commitment to invest $150.0 million USD in a limited partnership for mortgages.
In 2015, the Corporation entered into an annually managed mainframe hosting services contract until 2022, with a total contract value of $34.5 million.
In 2014, the Corporation has an investment in a limited partnership for real estate in which a commitment of $75.0 million was made. As at March 31, 2017, $46.0 million (2015 – $20.9 million) of the commitment was funded.
In 2011, the Corporation entered into a commitment for annual telecommunication services until 2021, with a total contract value of $50.6 million.
($ THOUSANDS)
Lease PaymentsNet Present
Value Lease PaymentsNet Present
Value
Up to 1 year $ 9,545 $ 9,290 $ 9,914 $ 9,629
Greater than 1 year, up to 5 years 23,581 21,648 19,017 17,386
Greater than 5 years 15,386 13,075 4,460 3,744
48,512$ 44,013$ 33,391$ 30,759$
March 312017
December 312015
Insurance Corporation of British Columbia
2016/17 Annual Service Plan Report 95
22. Regulation over Basic Insurance
As discussed in note 1, the Corporation is subject to regulation by BCUC. BCUC has jurisdiction over the Corporation’s rates and services for Basic insurance, and responsibility for ensuring that the Basic insurance business does not subsidize the Corporation’s Optional insurance business.
For the regulation of the Corporation’s Basic insurance rates, BCUC is required to ensure that the rates are just, reasonable, not unduly discriminatory, and not unduly preferential. BCUC is required to fix rates on the basis of accepted actuarial practice, to pay for certain specified costs, to ensure the Corporation maintains and/or builds the required Basic insurance capital, to ensure rates are not based on age, gender or marital status, and to ensure increases or decreases in rates are phased in, in a stable and predictable manner.
As required by the regulatory framework, the Corporation maintains a capital management plan that is reviewed and approved by BCUC. This plan was last amended in May 2016, to include both the existing capital management solvency target and an additional margin of capital for a rate smoothing framework. The capital management plan allowed for exclusion of some or all of that fiscal loss years’ loss costs forecast variance as a provision to release Basic insurance capital.
Basic insurance rate increases are also subject to the rate smoothing framework which limits the range of allowable rate changes, and instead uses Basic insurance capital to smooth through volatility in Basic insurance rates (note 9). The rate smoothing framework requires that, if circumstances should arise where, despite the capital management plan, Basic insurance capital is projected to fall below the regulatory minimum target, then in addition to filing with BCUC, the Corporation is also directed to immediately report to the Treasury Board and, in conjunction with the Treasury Board, develop an appropriate plan to address Basic insurance capital levels. As discussed below, these circumstances arose in both fiscal 2016/17 and 2015 periods.
BCUC initiates regulatory processes on its own initiative or upon application by the Corporation. It uses oral hearing, written hearing, or negotiated settlement processes to review applications and subsequently issue legally binding decisions.
The Corporation is required to incur a portion of BCUC’s general operating expenses as well as its costs associated with each ICBC proceeding. BCUC can also order the Corporation to reimburse other proceeding participants for specified costs such as legal and expert witness fees.
BCUC sets rates for Basic insurance that allow it to achieve the required regulatory minimum MCT which has been set at 100%. In any case where the estimate or outlook for the quarterly and/or period end Basic MCT level is below 100%, BCUC directs the Corporation to file, within 60 days, a plan for the restoration of Basic MCT to be at or above the 100% regulatory minimum.
The Corporation filed a plan with BCUC on November 26, 2015, as the outlook for the period end Basic MCT level as of the third quarter of 2015 was below 100%. The plan stated that the Corporation would transfer $450.0 million of capital from Optional insurance to Basic insurance in January 2016 in order to restore the Basic MCT level to be above the 100% regulatory minimum. This transfer was completed on January 1, 2016.
Insurance Corporation of British Columbia
2016/17 Annual Service Plan Report 96
The Corporation filed another plan with BCUC on May 31, 2016, and further updated it on August 31, 2016, as the outlook for the period end Basic MCT level as of both the first and second quarters of 2016/17 was below 100%. The update stated that, in addition to the $300.0 million income transfer referred to below, the Corporation needed to transfer $172.0 million of capital from Optional insurance to Basic insurance during August 2016 in order to restore the Basic MCT level to be above the 100% regulatory minimum.
$300.0 million of current period’s income was transferred from the Corporation’s Optional insurance business to the Basic insurance business. This transfer ($201.0 million on November 1, 2016 and subsequent to period end, $99.0 million - see note 24) occurred under the Province of B.C.’s direction and was accepted by the Corporation’s Board of Directors. As a result of this transfer, the Corporation applied to the BCUC for a Basic insurance rate of 4.9%, which was lower than the otherwise required rate.
Allocation of Basic and Optional amounts The Corporation operates its business using an integrated business model. The majority of premium revenues and costs are specifically identifiable as Basic or Optional (see note 1). The Corporation also delivers non-insurance services on behalf of the Province of B.C. Non-insurance activities include driver licensing, vehicle registration and licensing, violation ticket administration and government fines collection all of which are reported as Basic costs.
BCUC requires the Corporation to follow an approved financial allocation methodology with respect to allocating costs between the Basic insurance business, the Optional insurance business, and non-insurance services. Therefore, for those revenues and costs that are not specifically identified, a pro-rata method is used to allocate to each line of business based on the drivers of those revenues and costs, the degree of causality, and any BCUC directives. BCUC directives have been applied on a prospective basis.
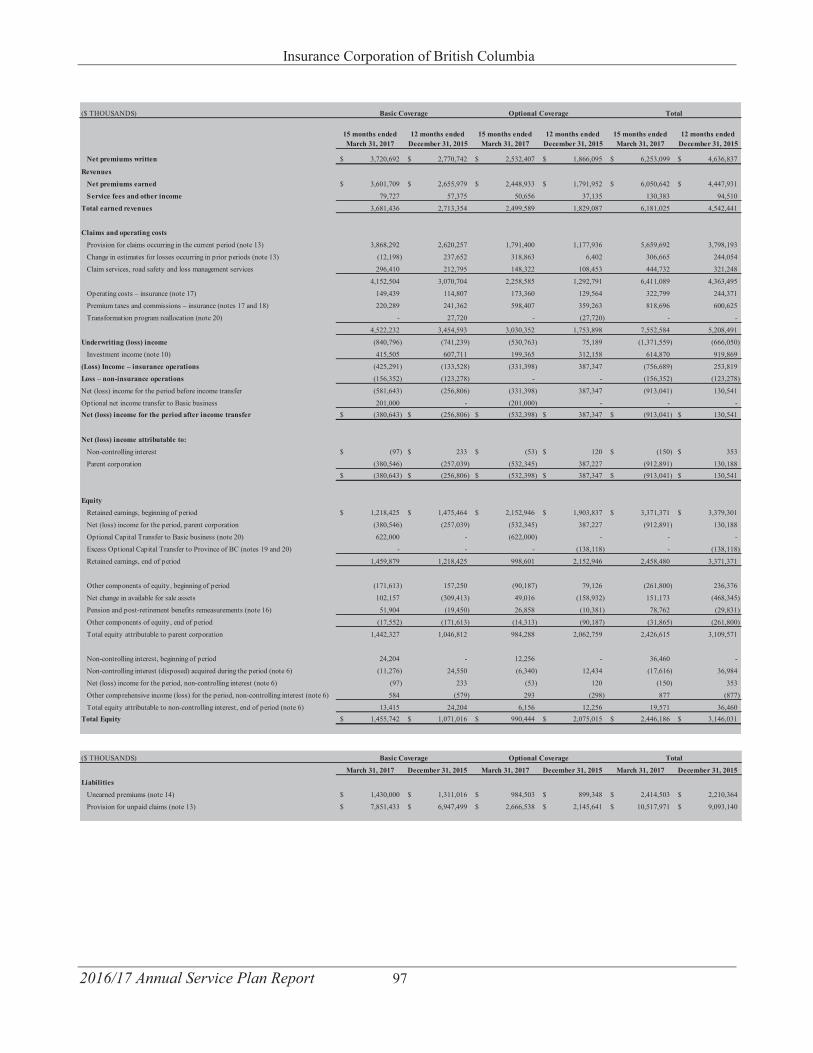
Insurance Corporation of British Columbia
2016/17 Annual Service Plan Report 97
($ THOUSANDS)
15 months ended March 31, 2017
12 months ended December 31, 2015
15 months ended March 31, 2017
12 months ended December 31, 2015
15 months ended March 31, 2017
12 months ended December 31, 2015
Net premiums written 3,720,692$ 2,770,742$ 2,532,407$ 1,866,095$ 6,253,099$ 4,636,837$
Revenues
Net premiums earned 3,601,709$ 2,655,979$ 2,448,933$ 1,791,952$ 6,050,642$ 4,447,931$
Service fees and other income 79,727 57,375 50,656 37,135 130,383 94,510
Total earned revenues 3,681,436 2,713,354 2,499,589 1,829,087 6,181,025 4,542,441
Claims and operating costs
Provision for claims occurring in the current period (note 13) 3,868,292 2,620,257 1,791,400 1,177,936 5,659,692 3,798,193
Change in estimates for losses occurring in prior periods (note 13) (12,198) 237,652 318,863 6,402 306,665 244,054
Claim services, road safety and loss management services 296,410 212,795 148,322 108,453 444,732 321,248
4,152,504 3,070,704 2,258,585 1,292,791 6,411,089 4,363,495
Operating costs – insurance (note 17) 149,439 114,807 173,360 129,564 322,799 244,371
Premium taxes and commissions – insurance (notes 17 and 18) 220,289 241,362 598,407 359,263 818,696 600,625
Transformation program reallocation (note 20) - 27,720 - (27,720) - -
4,522,232 3,454,593 3,030,352 1,753,898 7,552,584 5,208,491
Underwriting (loss) income (840,796) (741,239) (530,763) 75,189 (1,371,559) (666,050)
Investment income (note 10) 415,505 607,711 199,365 312,158 614,870 919,869
(Loss) Income – insurance operations (425,291) (133,528) (331,398) 387,347 (756,689) 253,819
Loss – non-insurance operations (156,352) (123,278) - - (156,352) (123,278)
Net (loss) income for the period before income transfer (581,643) (256,806) (331,398) 387,347 (913,041) 130,541
Optional net income transfer to Basic business 201,000 - (201,000) - - - Net (loss) income for the period after income transfer (380,643)$ (256,806)$ (532,398)$ 387,347$ (913,041)$ 130,541$
Net (loss) income attributable to:
Non-controlling interest (97)$ 233$ (53)$ 120$ (150)$ 353$
Parent corporation (380,546) (257,039) (532,345) 387,227 (912,891) 130,188 (380,643)$ (256,806)$ (532,398)$ 387,347$ (913,041)$ 130,541$
Equity
Retained earnings, beginning of period 1,218,425$ 1,475,464$ 2,152,946$ 1,903,837$ 3,371,371$ 3,379,301$
Net (loss) income for the period, parent corporation (380,546) (257,039) (532,345) 387,227 (912,891) 130,188
Optional Capital Transfer to Basic business (note 20) 622,000 - (622,000) - - -
Excess Optional Capital Transfer to Province of BC (notes 19 and 20) - - - (138,118) - (138,118)
Retained earnings, end of period 1,459,879 1,218,425 998,601 2,152,946 2,458,480 3,371,371
Other components of equity, beginning of period (171,613) 157,250 (90,187) 79,126 (261,800) 236,376
Net change in available for sale assets 102,157 (309,413) 49,016 (158,932) 151,173 (468,345)
Pension and post-retirement benefits remeasurements (note 16) 51,904 (19,450) 26,858 (10,381) 78,762 (29,831)
Other components of equity, end of period (17,552) (171,613) (14,313) (90,187) (31,865) (261,800)
Total equity attributable to parent corporation 1,442,327 1,046,812 984,288 2,062,759 2,426,615 3,109,571
Non-controlling interest, beginning of period 24,204 - 12,256 - 36,460 -
Non-controlling interest (disposed) acquired during the period (note 6) (11,276) 24,550 (6,340) 12,434 (17,616) 36,984
Net (loss) income for the period, non-controlling interest (note 6) (97) 233 (53) 120 (150) 353
Other comprehensive income (loss) for the period, non-controlling interest (note 6) 584 (579) 293 (298) 877 (877)
Total equity attributable to non-controlling interest, end of period (note 6) 13,415 24,204 6,156 12,256 19,571 36,460 Total Equity 1,455,742$ 1,071,016$ 990,444$ 2,075,015$ 2,446,186$ 3,146,031$
Basic Coverage Optional Coverage Total
($ THOUSANDS)
March 31, 2017 December 31, 2015 March 31, 2017 December 31, 2015 March 31, 2017 December 31, 2015
Liabilities
Unearned premiums (note 14) 1,430,000$ 1,311,016$ 984,503$ 899,348$ 2,414,503$ 2,210,364$
Provision for unpaid claims (note 13) 7,851,433$ 6,947,499$ 2,666,538$ 2,145,641$ 10,517,971$ 9,093,140$
Basic Coverage Optional Coverage Total
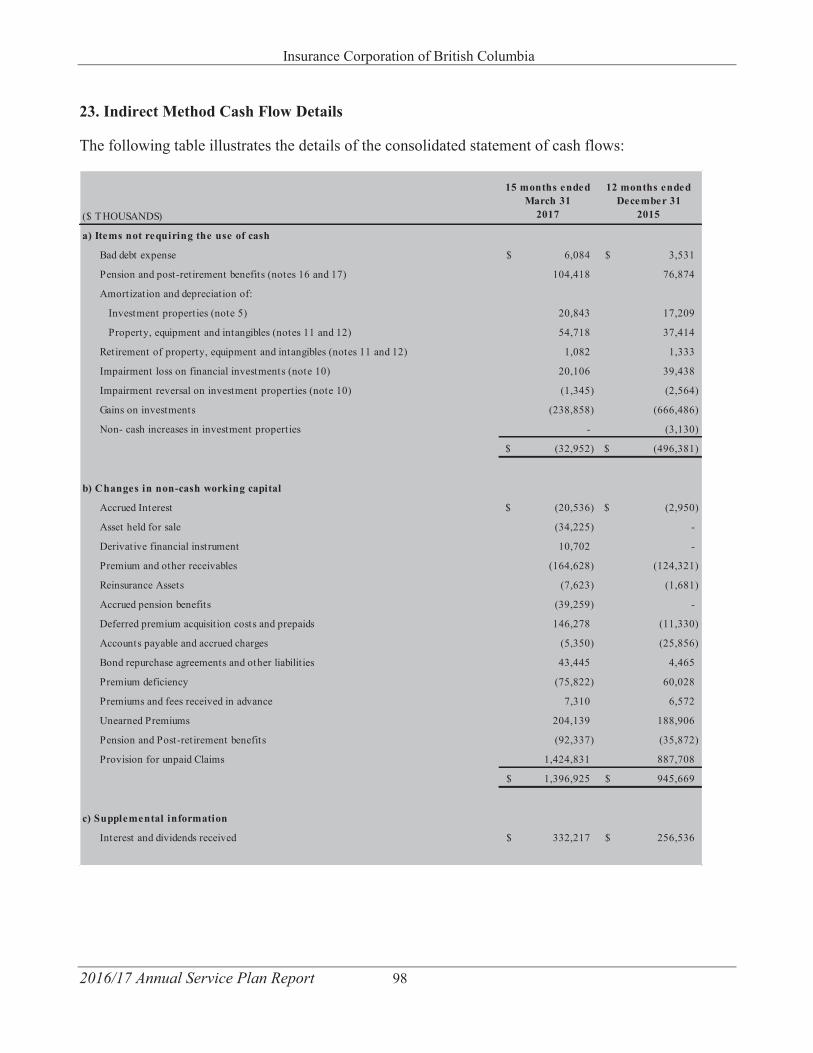
Insurance Corporation of British Columbia
2016/17 Annual Service Plan Report 98
23. Indirect Method Cash Flow Details
The following table illustrates the details of the consolidated statement of cash flows:
($ THOUSANDS)
15 months ended March 31
2017
12 months ended December 31
2015
a) Items not requiring the use of cash
Bad debt expense 6,084$ 3,531$
Pension and post-retirement benefits (notes 16 and 17) 104,418 76,874
Amortization and depreciation of:
Investment properties (note 5) 20,843 17,209
Property, equipment and intangibles (notes 11 and 12) 54,718 37,414
Retirement of property, equipment and intangibles (notes 11 and 12) 1,082 1,333
Impairment loss on financial investments (note 10) 20,106 39,438
Impairment reversal on investment properties (note 10) (1,345) (2,564)
Gains on investments (238,858) (666,486)
Non- cash increases in investment properties - (3,130)
(32,952)$ (496,381)$
b) Changes in non-cash working capital
Accrued Interest (20,536)$ (2,950)$
Asset held for sale (34,225) -
Derivative financial instrument 10,702 -
Premium and other receivables (164,628) (124,321)
Reinsurance Assets (7,623) (1,681)
Accrued pension benefits (39,259) -
Deferred premium acquisition costs and prepaids 146,278 (11,330)
Accounts payable and accrued charges (5,350) (25,856)
Bond repurchase agreements and other liabilit ies 43,445 4,465
Premium deficiency (75,822) 60,028
Premiums and fees received in advance 7,310 6,572
Unearned Premiums 204,139 188,906
Pension and Post-retirement benefits (92,337) (35,872)
Provision for unpaid Claims 1,424,831 887,708
1,396,925$ 945,669$
c) Supplemental information
Interest and dividends received 332,217$ 256,536$
Insurance Corporation of British Columbia
2016/17 Annual Service Plan Report 99
24. Subsequent Events
On April 1, 2017, the Corporation transferred $99.0 million of Optional insurance income to its Basic insurance as directed by the Province of B.C.
On April 18, 2017, ICBC and a Limited Partner acquired a real estate investment property for $92.1 million, of which ICBC controls 90%.
Between April 1, 2017 and May 30, 2017, the Corporation entered into eleven agreements to provide mortgage funding totalling $190.9 million.
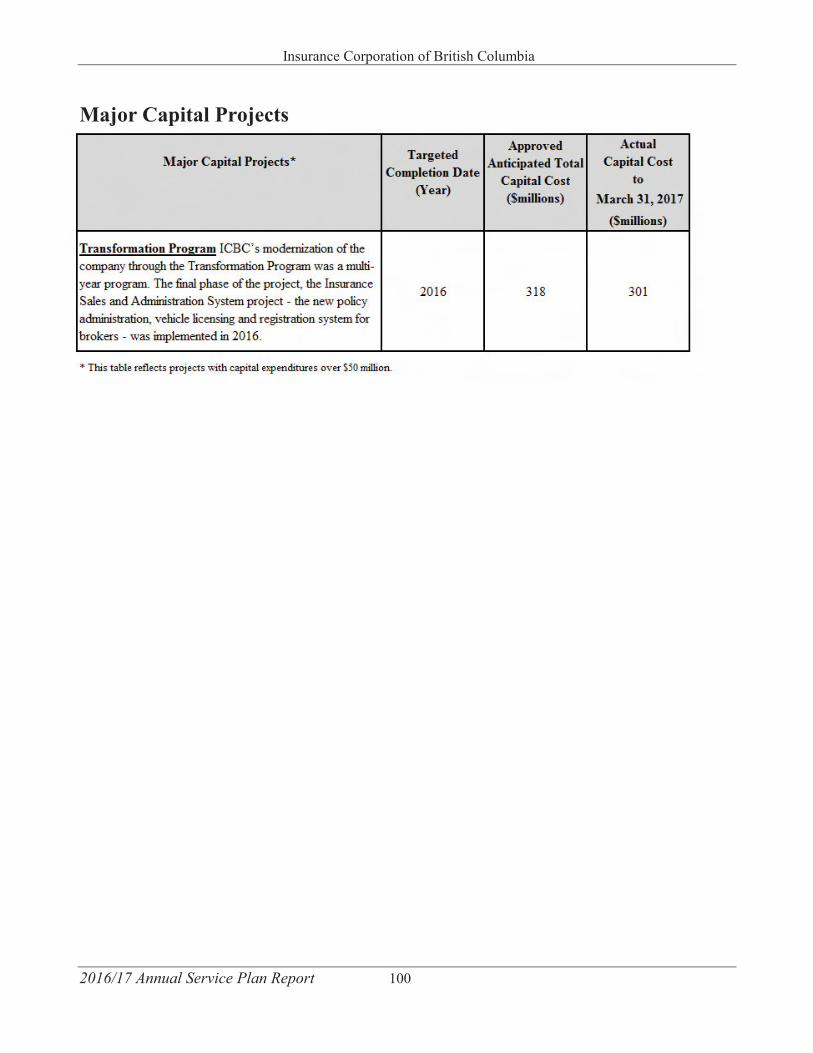
Insurance Corporation of British Columbia
2016/17 Annual Service Plan Report 100
Major Capital Projects
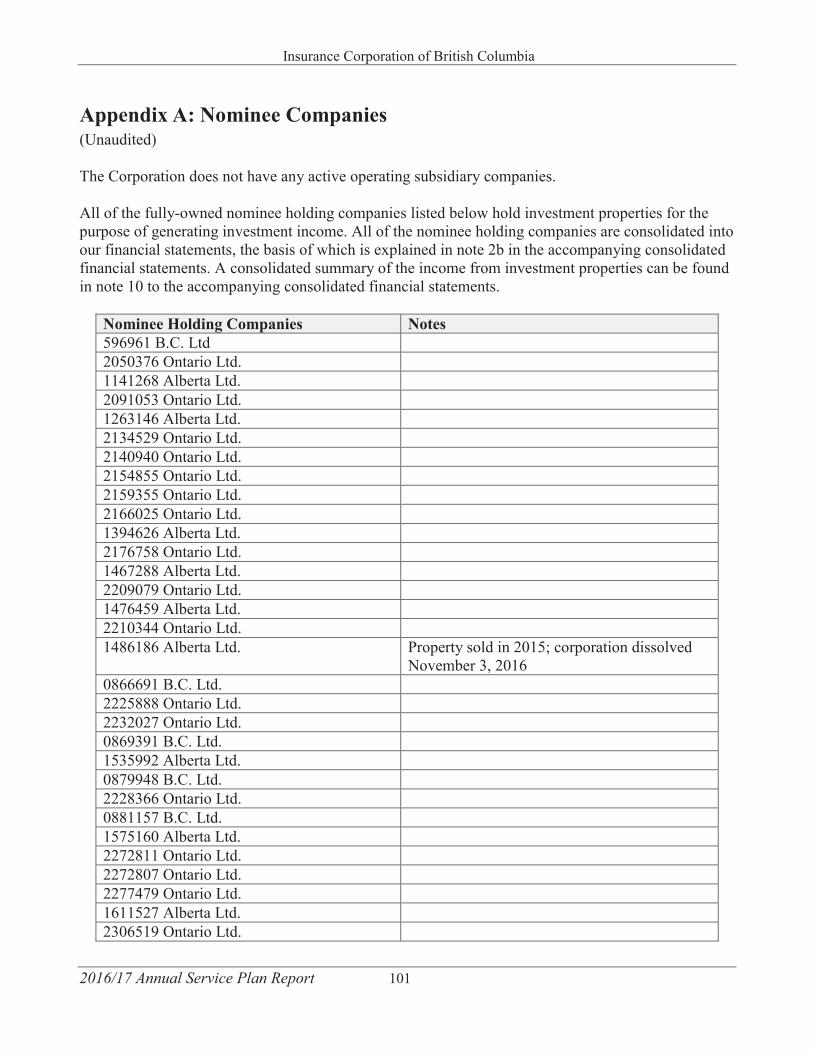
Insurance Corporation of British Columbia
2016/17 Annual Service Plan Report 101
Appendix A: Nominee Companies (Unaudited)
The Corporation does not have any active operating subsidiary companies.
All of the fully-owned nominee holding companies listed below hold investment properties for the purpose of generating investment income. All of the nominee holding companies are consolidated into our financial statements, the basis of which is explained in note 2b in the accompanying consolidated financial statements. A consolidated summary of the income from investment properties can be found in note 10 to the accompanying consolidated financial statements.
Nominee Holding Companies Notes596961 B.C. Ltd 2050376 Ontario Ltd. 1141268 Alberta Ltd. 2091053 Ontario Ltd. 1263146 Alberta Ltd. 2134529 Ontario Ltd. 2140940 Ontario Ltd. 2154855 Ontario Ltd. 2159355 Ontario Ltd. 2166025 Ontario Ltd. 1394626 Alberta Ltd. 2176758 Ontario Ltd. 1467288 Alberta Ltd. 2209079 Ontario Ltd. 1476459 Alberta Ltd. 2210344 Ontario Ltd. 1486186 Alberta Ltd. Property sold in 2015; corporation dissolved
November 3, 20160866691 B.C. Ltd. 2225888 Ontario Ltd. 2232027 Ontario Ltd. 0869391 B.C. Ltd. 1535992 Alberta Ltd. 0879948 B.C. Ltd. 2228366 Ontario Ltd. 0881157 B.C. Ltd. 1575160 Alberta Ltd. 2272811 Ontario Ltd. 2272807 Ontario Ltd. 2277479 Ontario Ltd. 1611527 Alberta Ltd. 2306519 Ontario Ltd.
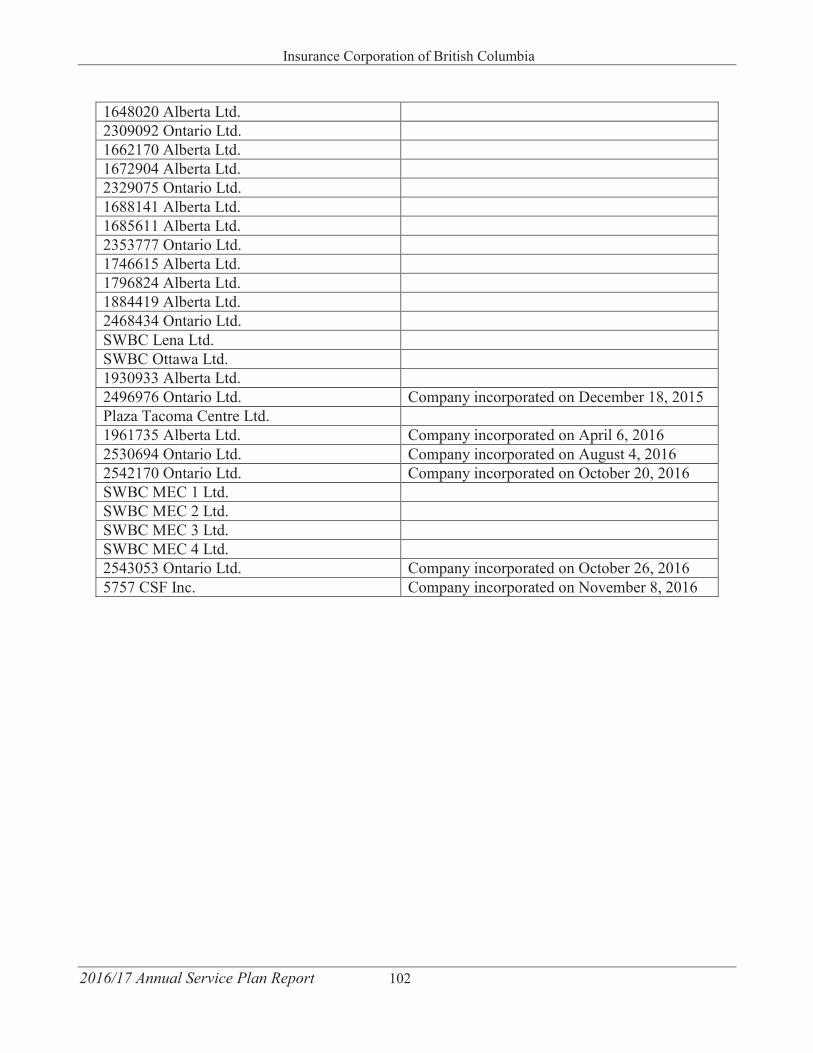
Insurance Corporation of British Columbia
2016/17 Annual Service Plan Report 102
1648020 Alberta Ltd.2309092 Ontario Ltd.1662170 Alberta Ltd.1672904 Alberta Ltd.2329075 Ontario Ltd.1688141 Alberta Ltd.1685611 Alberta Ltd.2353777 Ontario Ltd.1746615 Alberta Ltd.1796824 Alberta Ltd.1884419 Alberta Ltd.2468434 Ontario Ltd.SWBC Lena Ltd. SWBC Ottawa Ltd.1930933 Alberta Ltd. 2496976 Ontario Ltd. Company incorporated on December 18, 2015Plaza Tacoma Centre Ltd.1961735 Alberta Ltd. Company incorporated on April 6, 20162530694 Ontario Ltd. Company incorporated on August 4, 20162542170 Ontario Ltd. Company incorporated on October 20, 2016SWBC MEC 1 Ltd.SWBC MEC 2 Ltd.SWBC MEC 3 Ltd.SWBC MEC 4 Ltd.2543053 Ontario Ltd. Company incorporated on October 26, 20165757 CSF Inc. Company incorporated on November 8, 2016
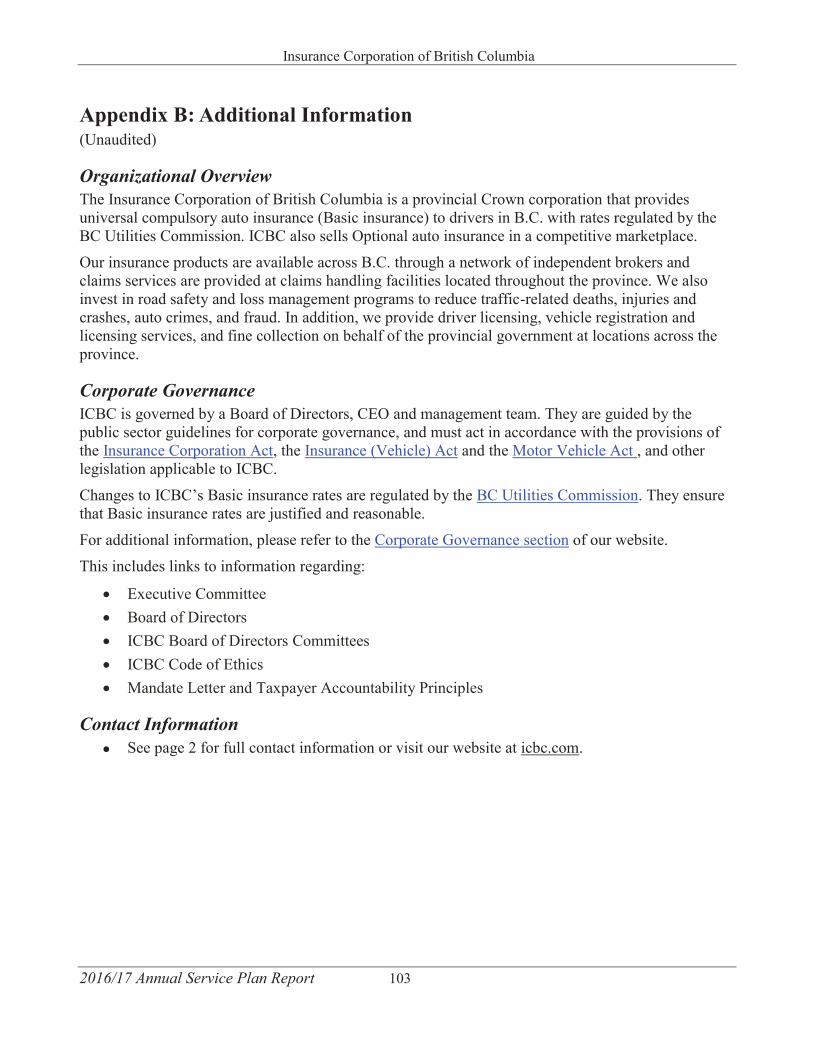
Insurance Corporation of British Columbia
2016/17 Annual Service Plan Report 103
Appendix B: Additional Information (Unaudited)
Organizational Overview The Insurance Corporation of British Columbia is a provincial Crown corporation that provides universal compulsory auto insurance (Basic insurance) to drivers in B.C. with rates regulated by the BC Utilities Commission. ICBC also sells Optional auto insurance in a competitive marketplace.
Our insurance products are available across B.C. through a network of independent brokers and claims services are provided at claims handling facilities located throughout the province. We also invest in road safety and loss management programs to reduce traffic-related deaths, injuries and crashes, auto crimes, and fraud. In addition, we provide driver licensing, vehicle registration and licensing services, and fine collection on behalf of the provincial government at locations across the province.
Corporate Governance ICBC is governed by a Board of Directors, CEO and management team. They are guided by the public sector guidelines for corporate governance, and must act in accordance with the provisions of the Insurance Corporation Act, the Insurance (Vehicle) Act and the Motor Vehicle Act , and other legislation applicable to ICBC.
Changes to ICBC’s Basic insurance rates are regulated by the BC Utilities Commission. They ensure that Basic insurance rates are justified and reasonable.
For additional information, please refer to the Corporate Governance section of our website.
This includes links to information regarding:
Executive CommitteeBoard of DirectorsICBC Board of Directors CommitteesICBC Code of EthicsMandate Letter and Taxpayer Accountability Principles
Contact Information See page 2 for full contact information or visit our website at icbc.com.
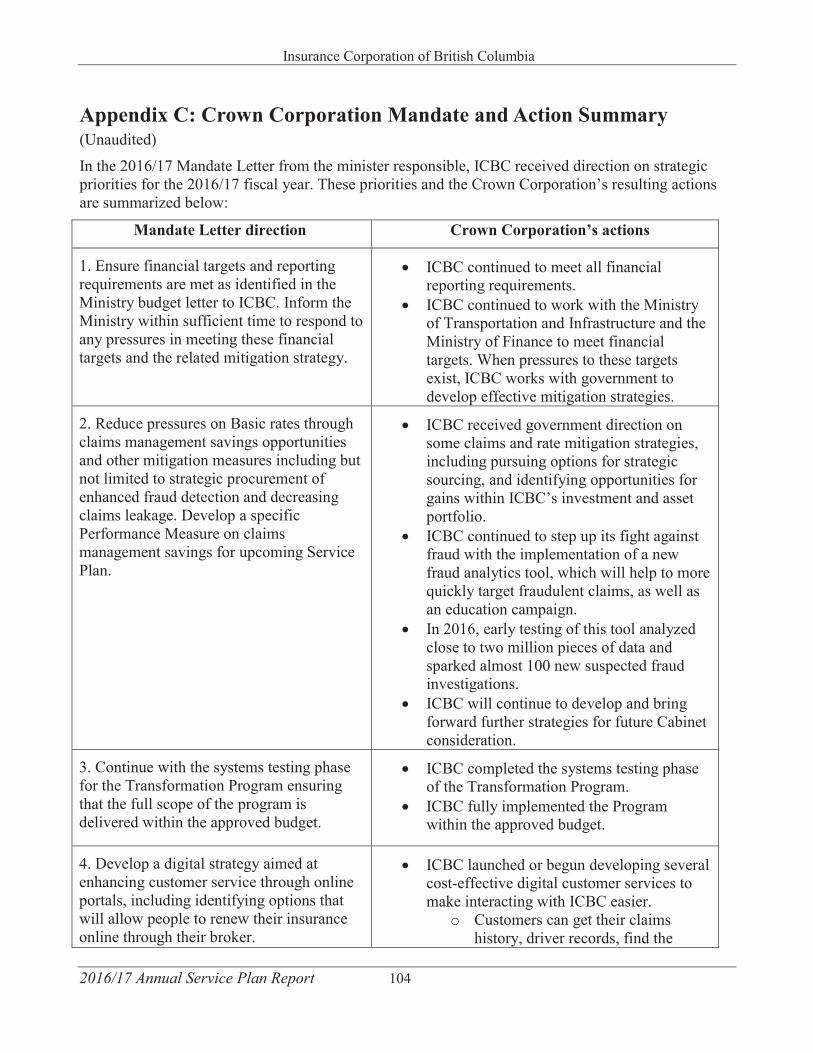
Insurance Corporation of British Columbia
2016/17 Annual Service Plan Report 104
Appendix C: Crown Corporation Mandate and Action Summary(Unaudited)
In the 2016/17 Mandate Letter from the minister responsible, ICBC received direction on strategic priorities for the 2016/17 fiscal year. These priorities and the Crown Corporation’s resulting actions are summarized below:
Mandate Letter direction Crown Corporation’s actions
1. Ensure financial targets and reportingrequirements are met as identified in the Ministry budget letter to ICBC. Inform the Ministry within sufficient time to respond to any pressures in meeting these financial targets and the related mitigation strategy.
ICBC continued to meet all financialreporting requirements.ICBC continued to work with the Ministryof Transportation and Infrastructure and theMinistry of Finance to meet financialtargets. When pressures to these targetsexist, ICBC works with government todevelop effective mitigation strategies.
2. Reduce pressures on Basic rates throughclaims management savings opportunities and other mitigation measures including but not limited to strategic procurement of enhanced fraud detection and decreasing claims leakage. Develop a specific Performance Measure on claims management savings for upcoming Service Plan.
ICBC received government direction onsome claims and rate mitigation strategies,including pursuing options for strategicsourcing, and identifying opportunities forgains within ICBC’s investment and assetportfolio.ICBC continued to step up its fight againstfraud with the implementation of a newfraud analytics tool, which will help to morequickly target fraudulent claims, as well asan education campaign.In 2016, early testing of this tool analyzedclose to two million pieces of data andsparked almost 100 new suspected fraudinvestigations.ICBC will continue to develop and bringforward further strategies for future Cabinetconsideration.
3. Continue with the systems testing phasefor the Transformation Program ensuring that the full scope of the program is delivered within the approved budget.
ICBC completed the systems testing phaseof the Transformation Program.ICBC fully implemented the Programwithin the approved budget.
4. Develop a digital strategy aimed atenhancing customer service through online portals, including identifying options that will allow people to renew their insurance online through their broker.
ICBC launched or begun developing severalcost-effective digital customer services tomake interacting with ICBC easier.
o Customers can get their claimshistory, driver records, find the
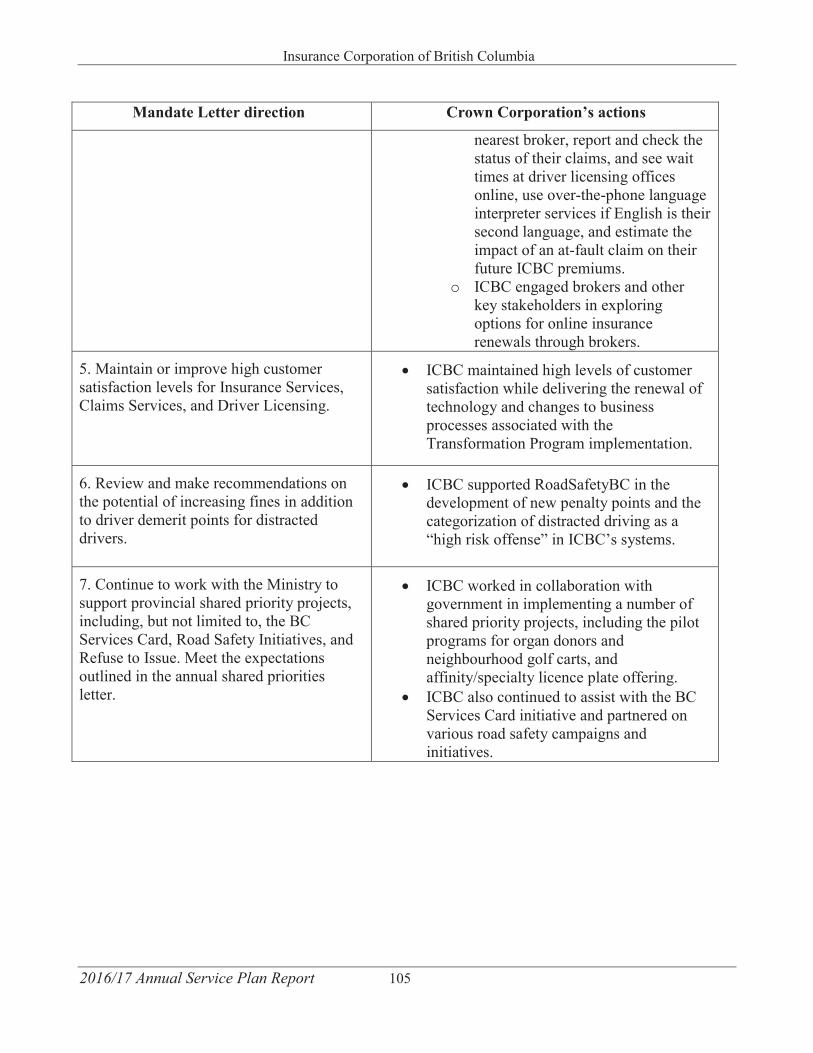
Insurance Corporation of British Columbia
2016/17 Annual Service Plan Report 105
Mandate Letter direction Crown Corporation’s actions
nearest broker, report and check the status of their claims, and see waittimes at driver licensing officesonline, use over-the-phone language interpreter services if English is their second language, and estimate the impact of an at-fault claim on their future ICBC premiums.
o ICBC engaged brokers and otherkey stakeholders in exploringoptions for online insurancerenewals through brokers.
5. Maintain or improve high customersatisfaction levels for Insurance Services, Claims Services, and Driver Licensing.
ICBC maintained high levels of customersatisfaction while delivering the renewal oftechnology and changes to businessprocesses associated with theTransformation Program implementation.
6. Review and make recommendations onthe potential of increasing fines in addition to driver demerit points for distracted drivers.
ICBC supported RoadSafetyBC in thedevelopment of new penalty points and thecategorization of distracted driving as a“high risk offense” in ICBC’s systems.
7. Continue to work with the Ministry tosupport provincial shared priority projects, including, but not limited to, the BC Services Card, Road Safety Initiatives, and Refuse to Issue. Meet the expectations outlined in the annual shared priorities letter.
ICBC worked in collaboration withgovernment in implementing a number ofshared priority projects, including the pilotprograms for organ donors andneighbourhood golf carts, andaffinity/specialty licence plate offering.ICBC also continued to assist with the BCServices Card initiative and partnered onvarious road safety campaigns andinitiatives.