Embed Size (px)
Citation preview
Insurance Regulation and Supervision
For bank Supervisors
17 October 2012
Su Hoong Chang
Agenda
Global Perspective & Financial Stability
Raising the (Regulatory) Bar
Cross-sectoral risk transfers &
Emerging Trends
2
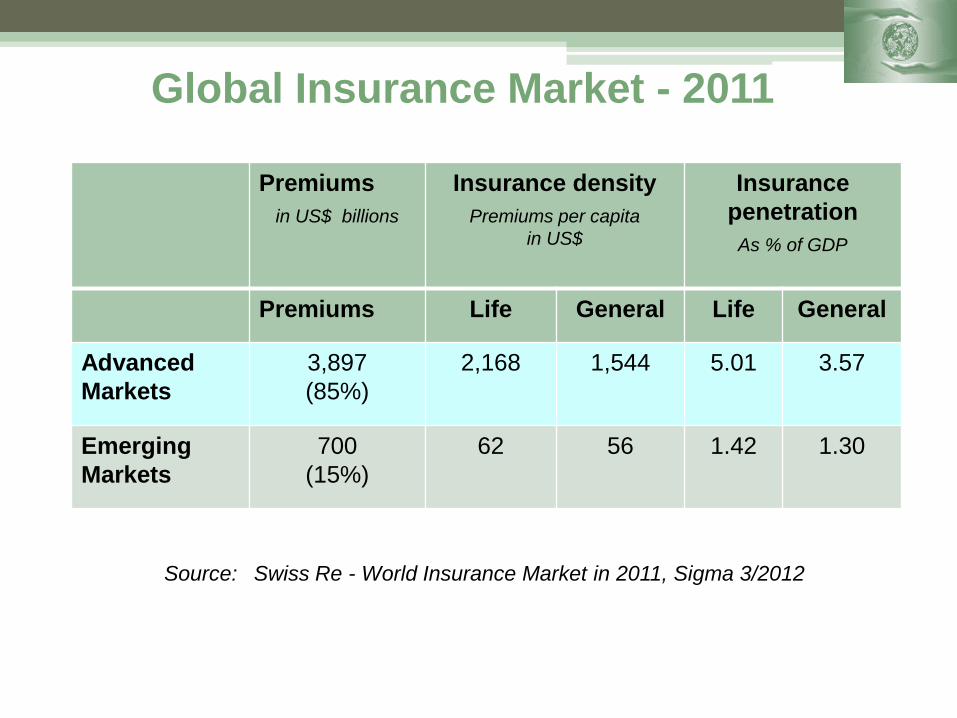
Global Insurance Market - 2011
3
Premiums
in US$ billions
Insurance density
Premiums per capita
in US$
Insurance
penetration
As % of GDP
Premiums Life General Life General
Advanced
Markets
3,897
(85%)
2,168 1,544 5.01 3.57
Emerging
Markets
700
(15%)
62 56 1.42 1.30
Source: Swiss Re - World Insurance Market in 2011, Sigma 3/2012
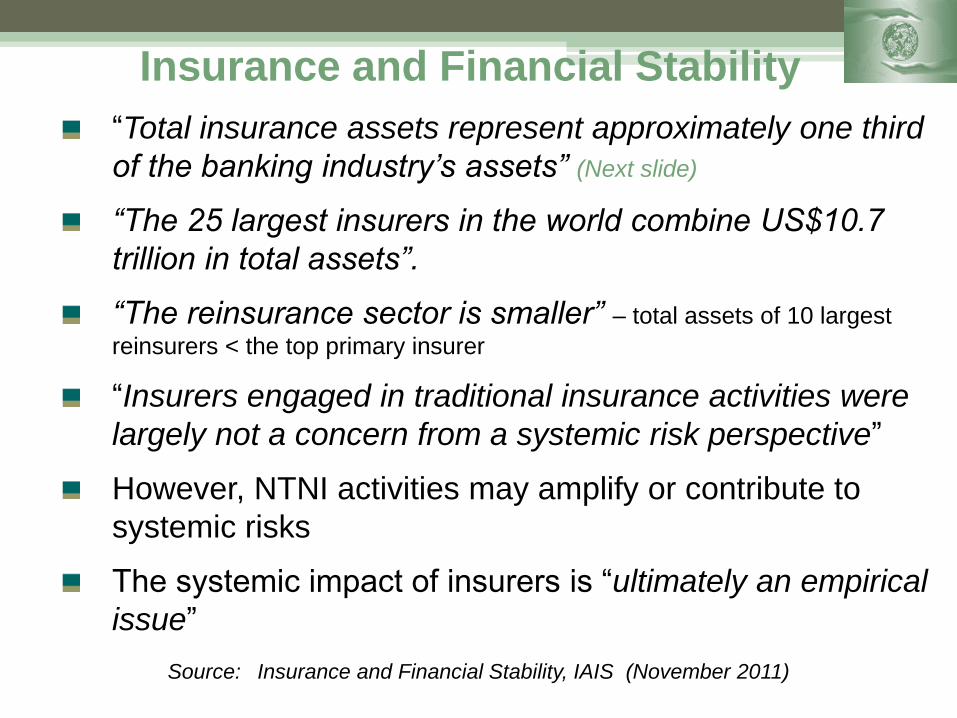
Insurance and Financial Stability
4
“Total insurance assets represent approximately one third
of the banking industry’s assets” (Next slide)
“The 25 largest insurers in the world combine US$10.7
trillion in total assets”.
“The reinsurance sector is smaller” – total assets of 10 largest
reinsurers < the top primary insurer
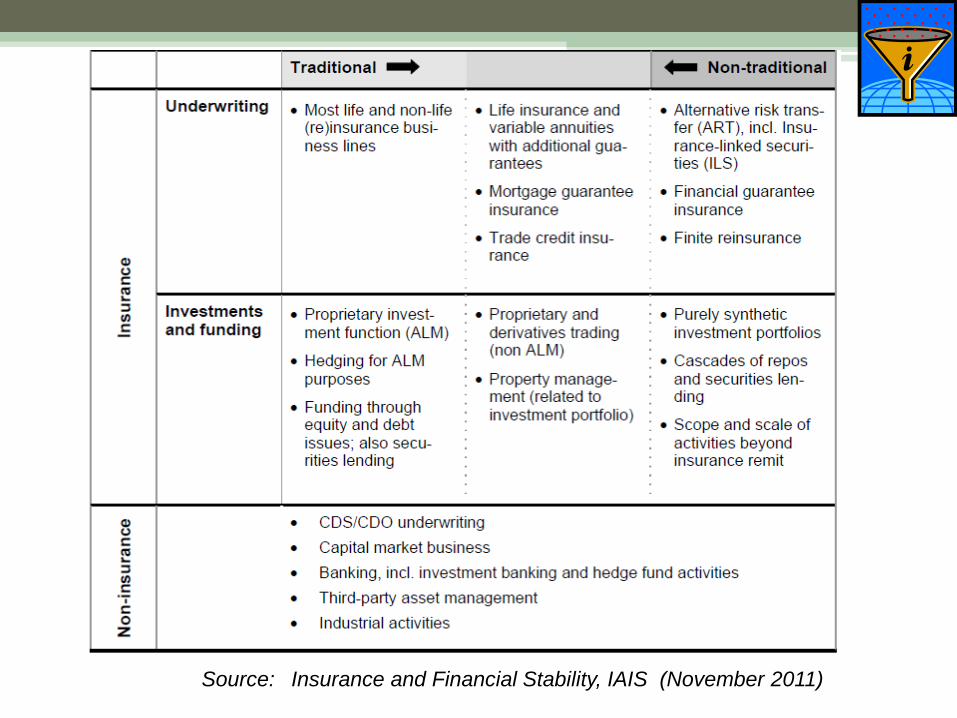
“Insurers engaged in traditional insurance activities were
largely not a concern from a systemic risk perspective”
However, NTNI activities may amplify or contribute to
systemic risks
The systemic impact of insurers is “ultimately an empirical
issue”
Source: Insurance and Financial Stability, IAIS (November 2011)
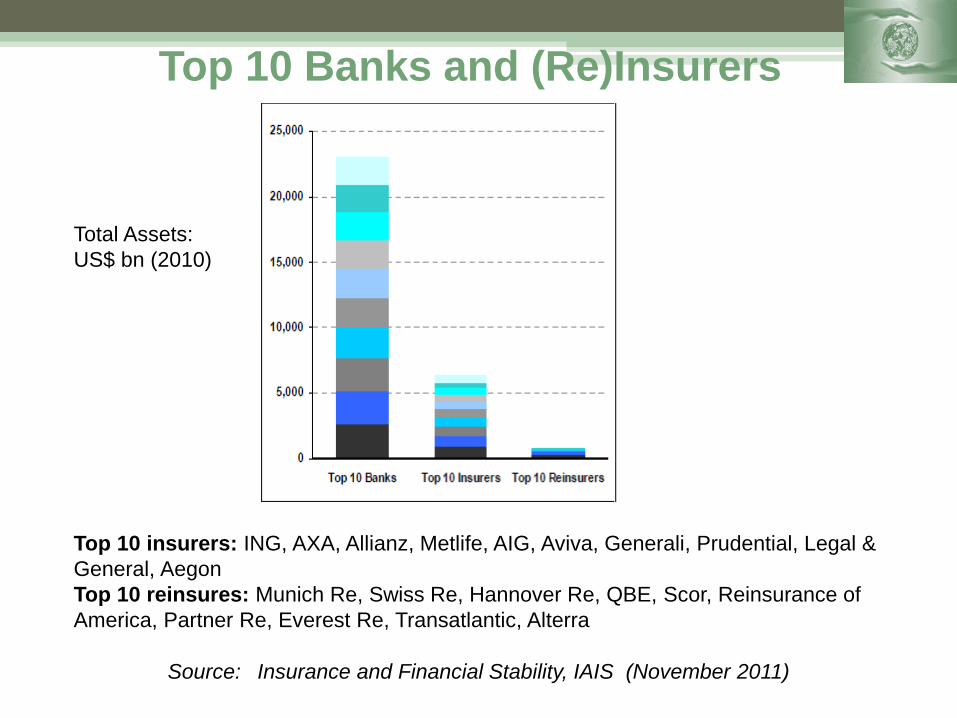
Top 10 Banks and (Re)Insurers
5 Source: Insurance and Financial Stability, IAIS (November 2011)
Top 10 insurers: ING, AXA, Allianz, Metlife, AIG, Aviva, Generali, Prudential, Legal &
General, Aegon
Top 10 reinsures: Munich Re, Swiss Re, Hannover Re, QBE, Scor, Reinsurance of
America, Partner Re, Everest Re, Transatlantic, Alterra
Total Assets:
US$ bn (2010)
6
Source: Insurance and Financial Stabilty, IAIS (November 2011)
Source: Insurance and Financial Stability, IAIS (November 2011)
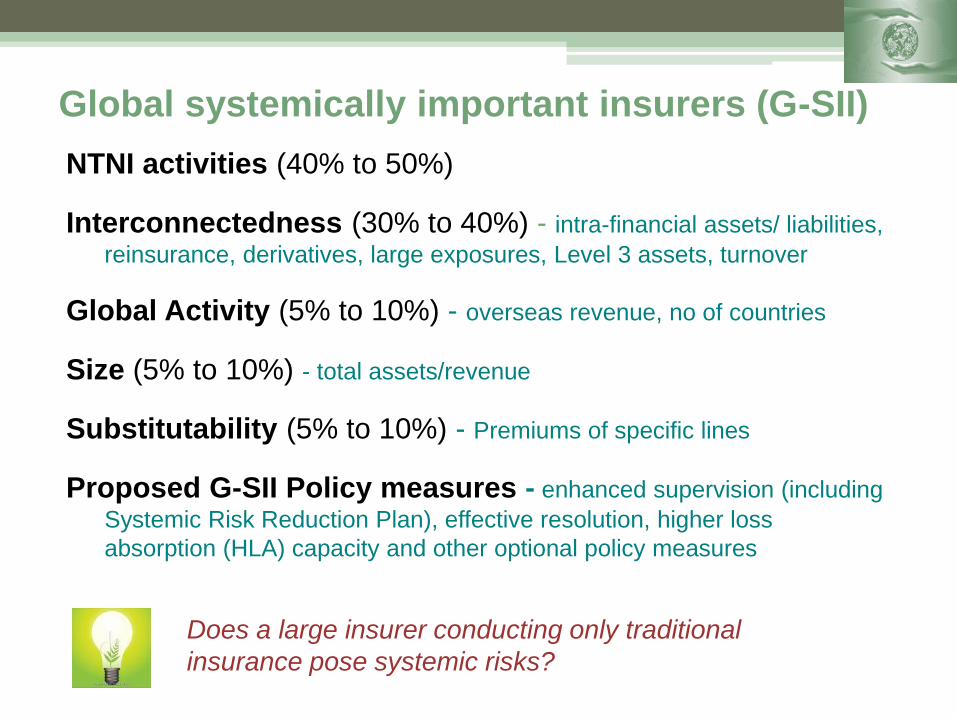
Global systemically important insurers (G-SII)
NTNI activities (40% to 50%)
Interconnectedness (30% to 40%) - intra-financial assets/ liabilities,
reinsurance, derivatives, large exposures, Level 3 assets, turnover
Global Activity (5% to 10%) - overseas revenue, no of countries
Size (5% to 10%) - total assets/revenue
Substitutability (5% to 10%) - Premiums of specific lines
Proposed G-SII Policy measures - enhanced supervision (including
Systemic Risk Reduction Plan), effective resolution, higher loss
absorption (HLA) capacity and other optional policy measures
7
Does a large insurer conducting only traditional
insurance pose systemic risks?
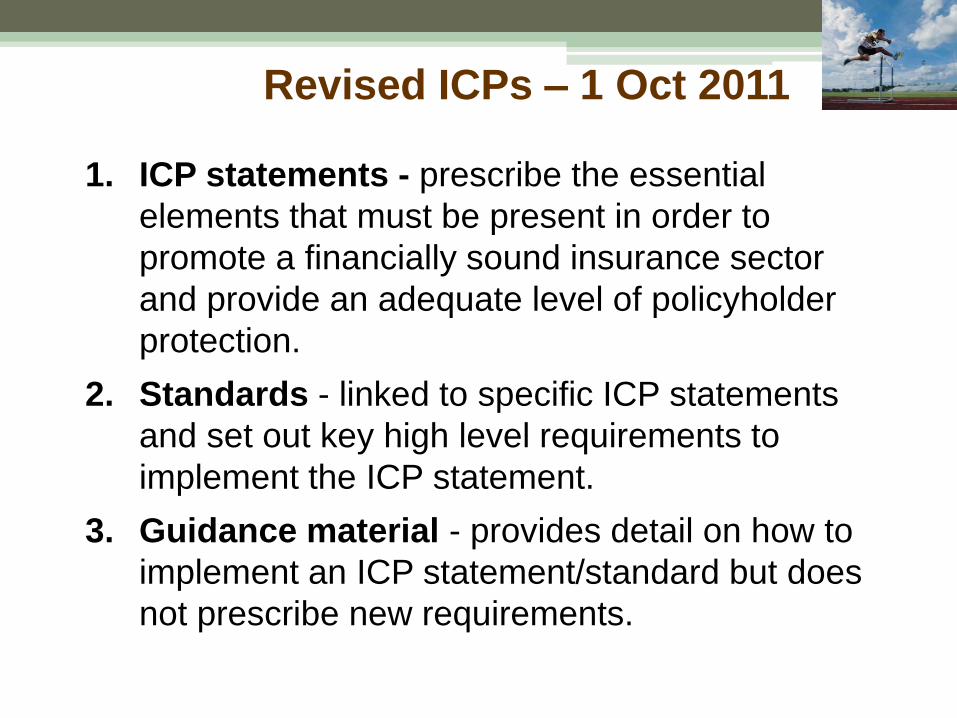
Revised ICPs – 1 Oct 2011
1. ICP statements - prescribe the essential
elements that must be present in order to
promote a financially sound insurance sector
and provide an adequate level of policyholder
protection.
2. Standards - linked to specific ICP statements
and set out key high level requirements to
implement the ICP statement.
3. Guidance material - provides detail on how to
implement an ICP statement/standard but does
not prescribe new requirements.
8
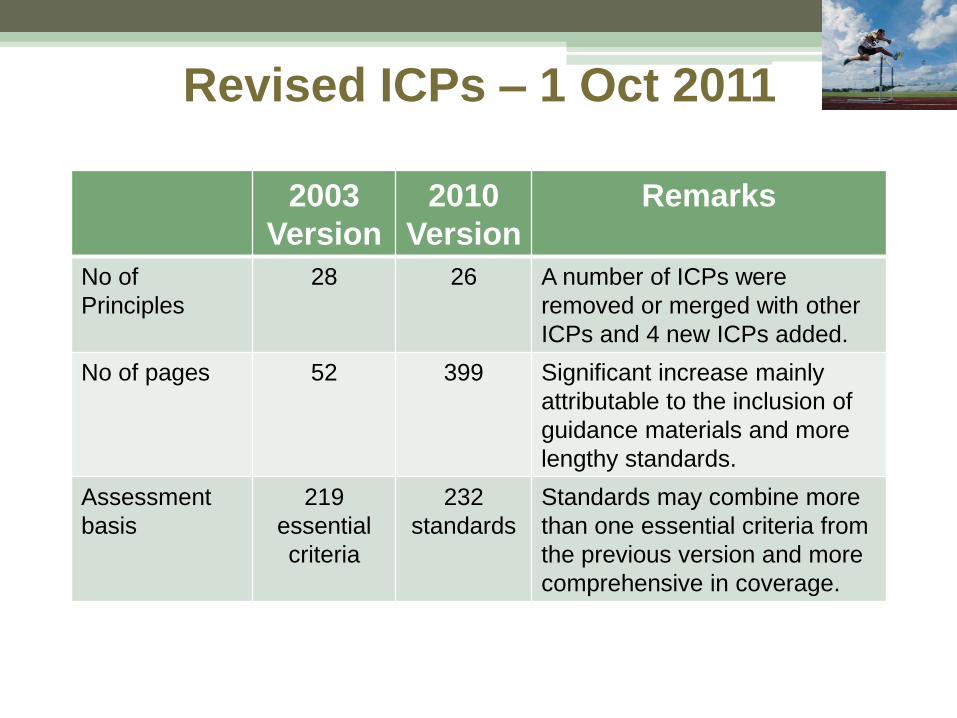
Revised ICPs – 1 Oct 2011
9
2003
Version
2010
Version
Remarks
No of
Principles
28 26 A number of ICPs were
removed or merged with other
ICPs and 4 new ICPs added.
No of pages 52 399 Significant increase mainly
attributable to the inclusion of
guidance materials and more
lengthy standards.
Assessment
basis
219
essential
criteria
232
standards
Standards may combine more
than one essential criteria from
the previous version and more
comprehensive in coverage.
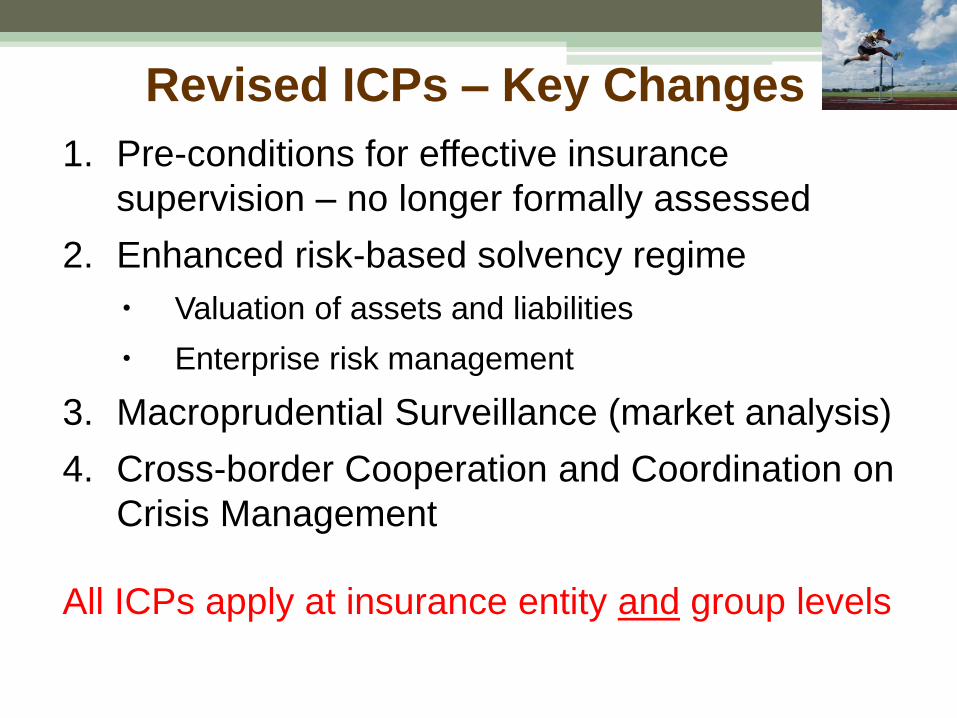
Revised ICPs – Key Changes
1. Pre-conditions for effective insurance
supervision – no longer formally assessed
2. Enhanced risk-based solvency regime
Valuation of assets and liabilities
Enterprise risk management
3. Macroprudential Surveillance (market analysis)
4. Cross-border Cooperation and Coordination on
Crisis Management
All ICPs apply at insurance entity and group levels
10
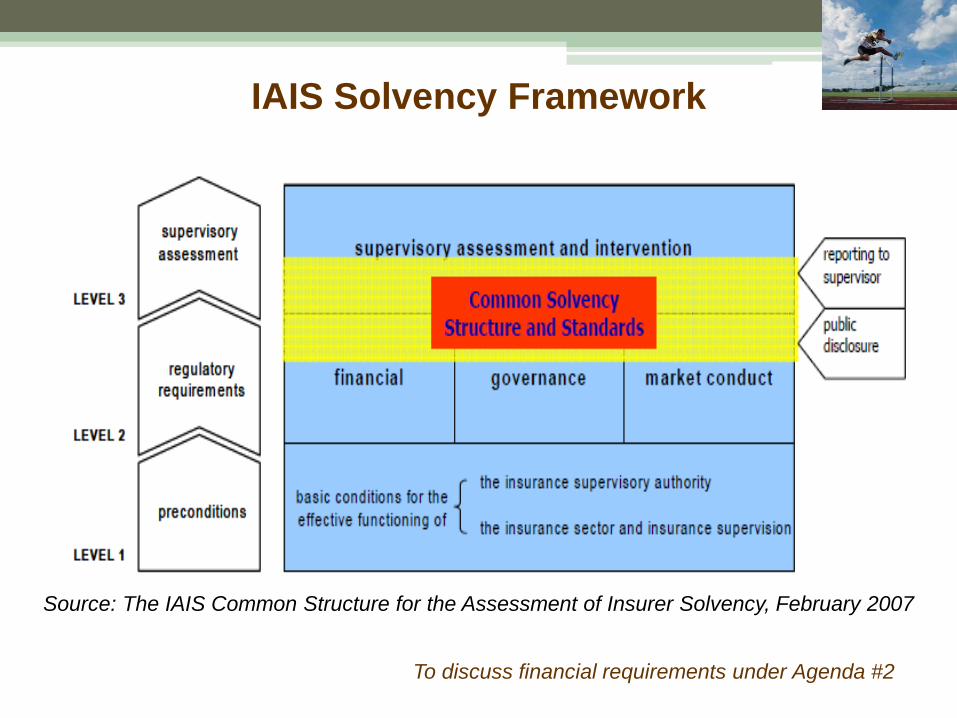
IAIS Solvency Framework
11
Source: The IAIS Common Structure for the Assessment of Insurer Solvency, February 2007
To discuss financial requirements under Agenda #2
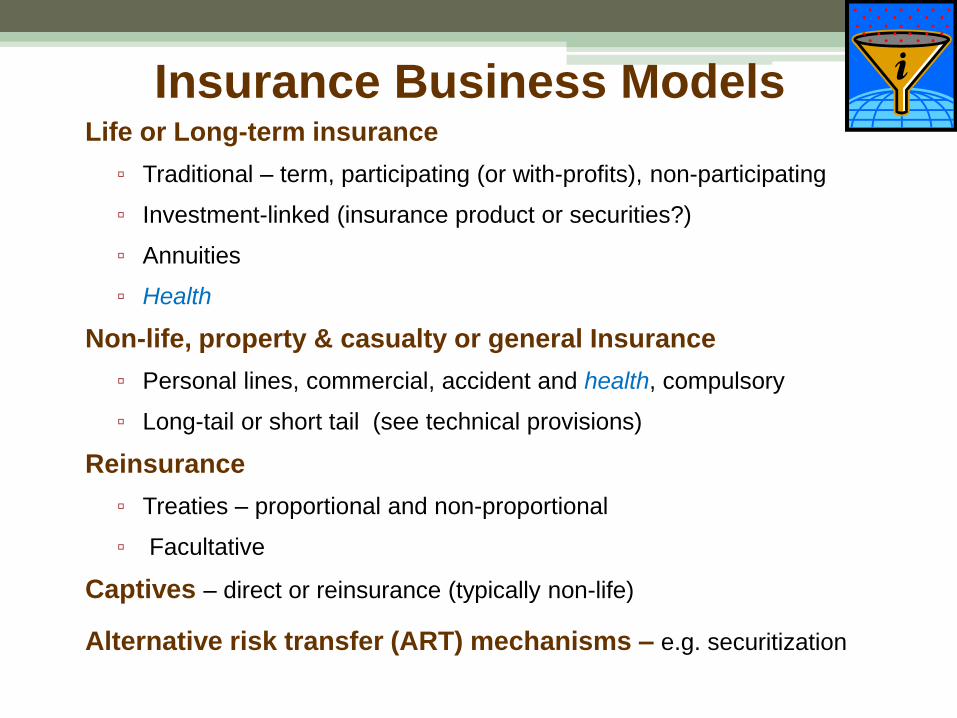
Insurance Business Models Life or Long-term insurance
▫ Traditional – term, participating (or with-profits), non-participating
▫ Investment-linked (insurance product or securities?)
▫ Annuities
▫ Health
Non-life, property & casualty or general Insurance
▫ Personal lines, commercial, accident and health, compulsory
▫ Long-tail or short tail (see technical provisions)
Reinsurance
▫ Treaties – proportional and non-proportional
▫ Facultative
Captives – direct or reinsurance (typically non-life)
Alternative risk transfer (ART) mechanisms – e.g. securitization
12
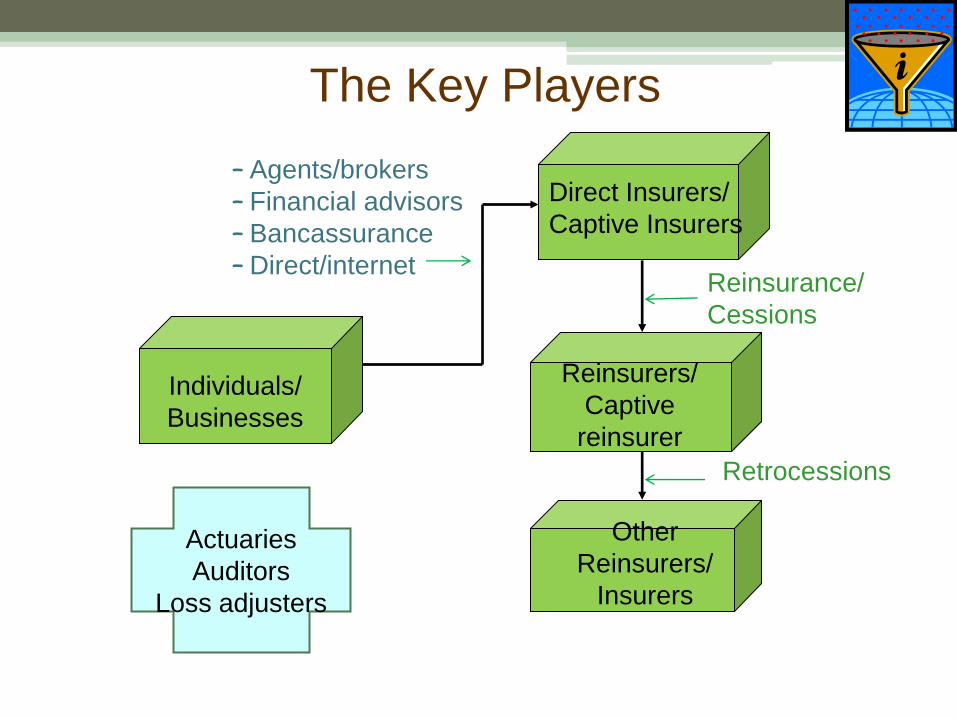
The Key Players
– Agents/brokers
– Financial advisors
– Bancassurance
– Direct/internet
Retrocessions
Individuals/
Businesses
Direct Insurers/
Captive Insurers
Reinsurers/
Captive
reinsurer
Other
Reinsurers/
Insurers
Reinsurance/
Cessions
Actuaries
Auditors
Loss adjusters
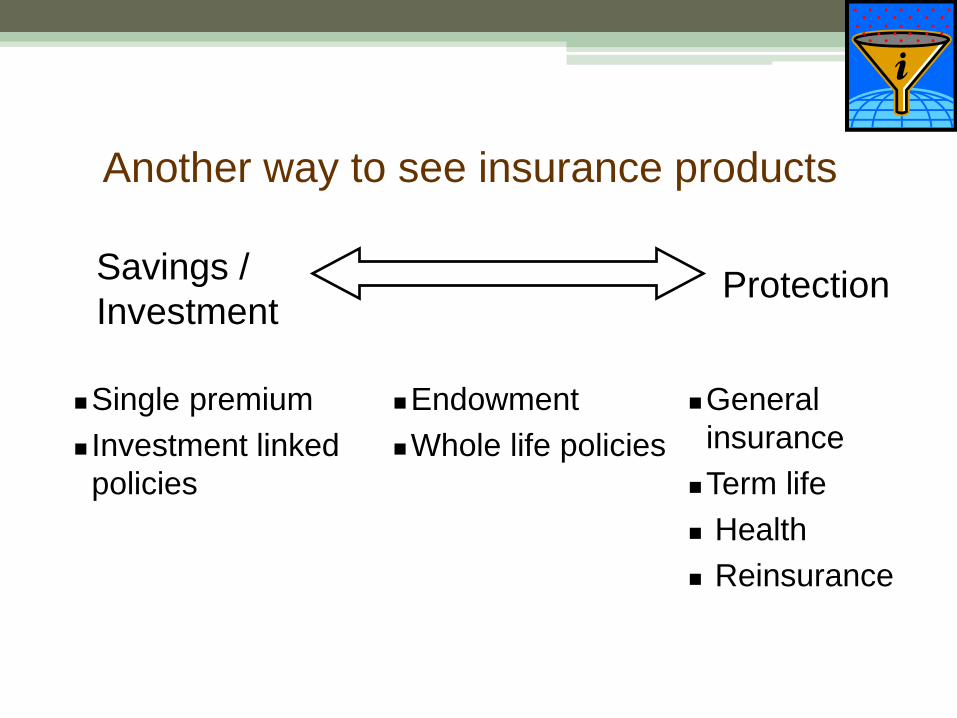
Another way to see insurance products
14
Savings /
Investment Protection
Single premium
Investment linked
policies
Endowment
Whole life policies
General
insurance
Term life
Health
Reinsurance
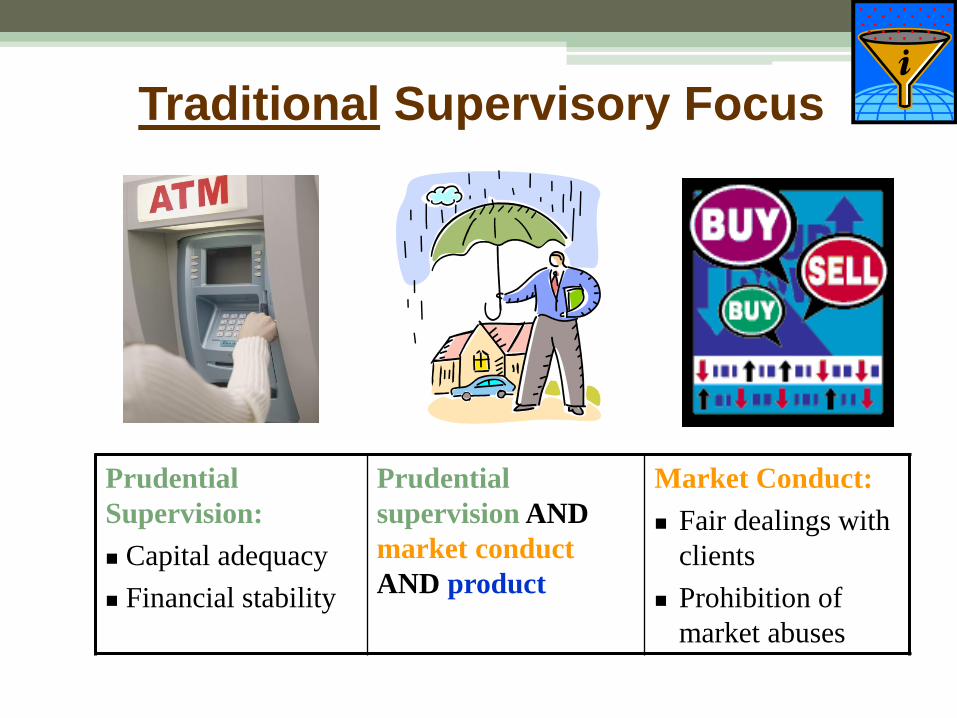
Traditional Supervisory Focus
15
Prudential
Supervision:
Capital adequacy
Financial stability
Prudential
supervision AND
market conduct
AND product
Market Conduct:
Fair dealings with
clients
Prohibition of
market abuses
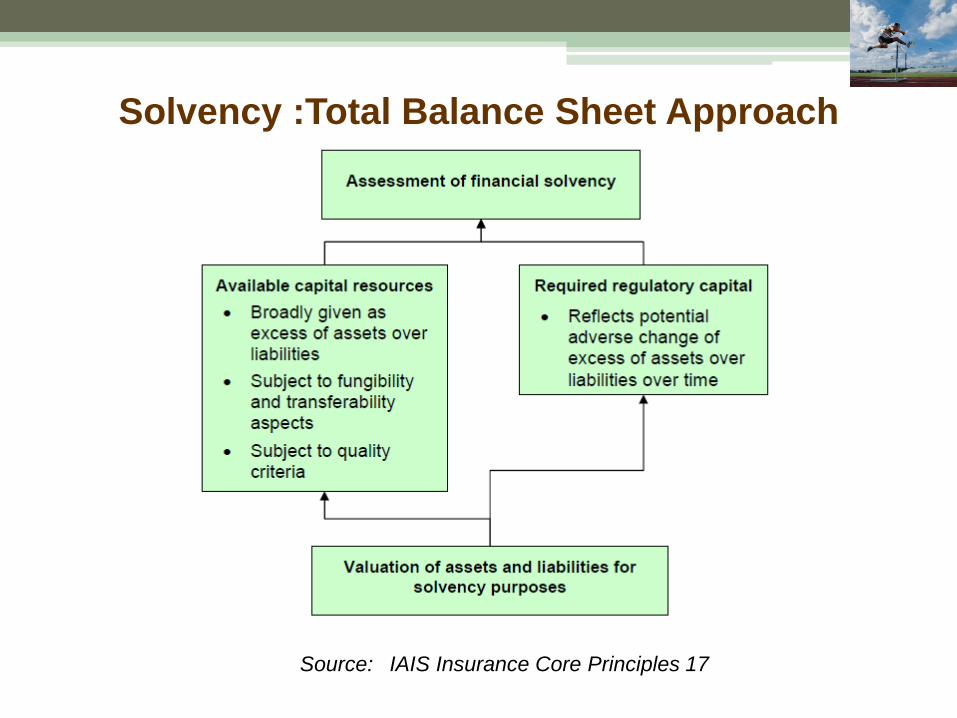
Solvency :Total Balance Sheet Approach
16 Source: IAIS Insurance Core Principles 17
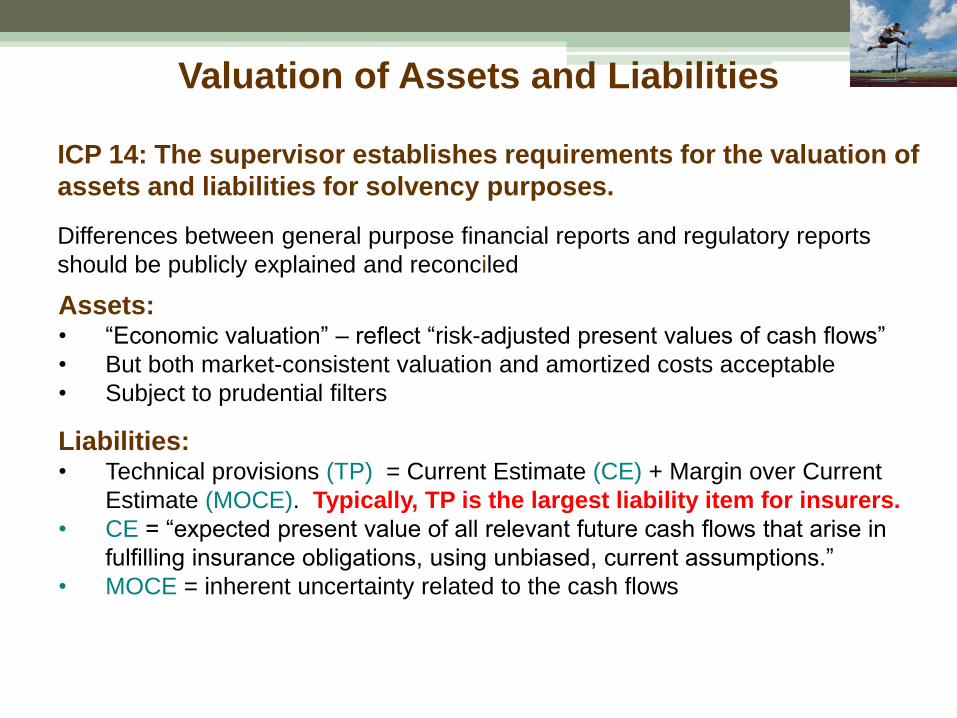
Valuation of Assets and Liabilities
ICP 14: The supervisor establishes requirements for the valuation of
assets and liabilities for solvency purposes.
17
Differences between general purpose financial reports and regulatory reports
should be publicly explained and reconciled
Assets: • “Economic valuation” – reflect “risk-adjusted present values of cash flows”
• But both market-consistent valuation and amortized costs acceptable
• Subject to prudential filters
Liabilities: • Technical provisions (TP) = Current Estimate (CE) + Margin over Current
Estimate (MOCE). Typically, TP is the largest liability item for insurers.
• CE = “expected present value of all relevant future cash flows that arise in
fulfilling insurance obligations, using unbiased, current assumptions.”
• MOCE = inherent uncertainty related to the cash flows
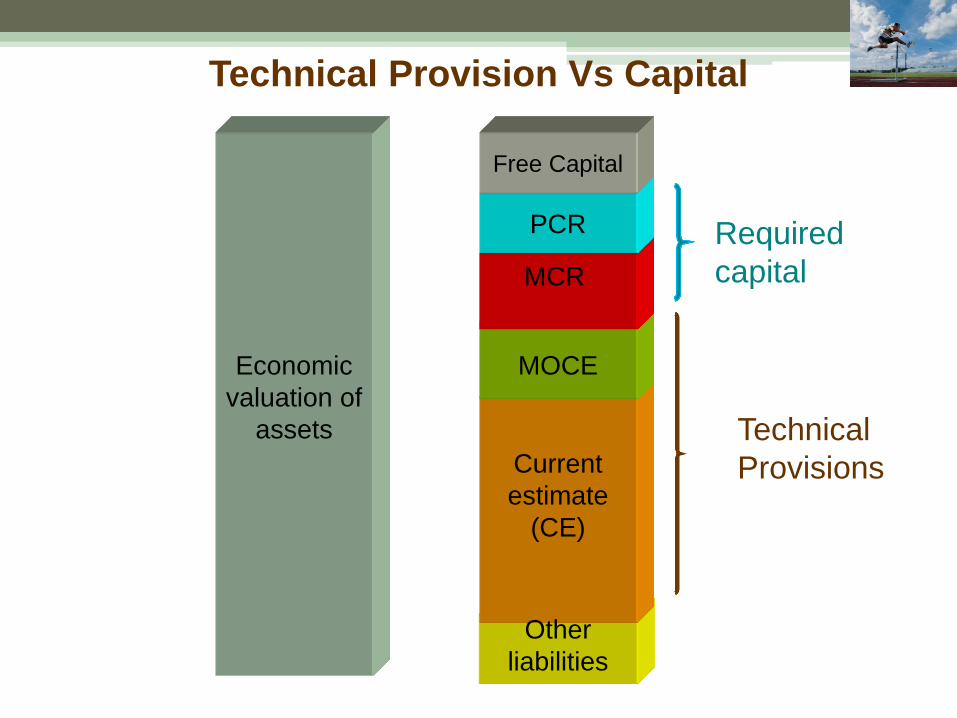
Technical Provision Vs Capital
18
Current
estimate
(CE)
MOCE
MCR
PCR
Technical
Provisions
Required
capital
Other
liabilities
Free Capital
Economic
valuation of
assets
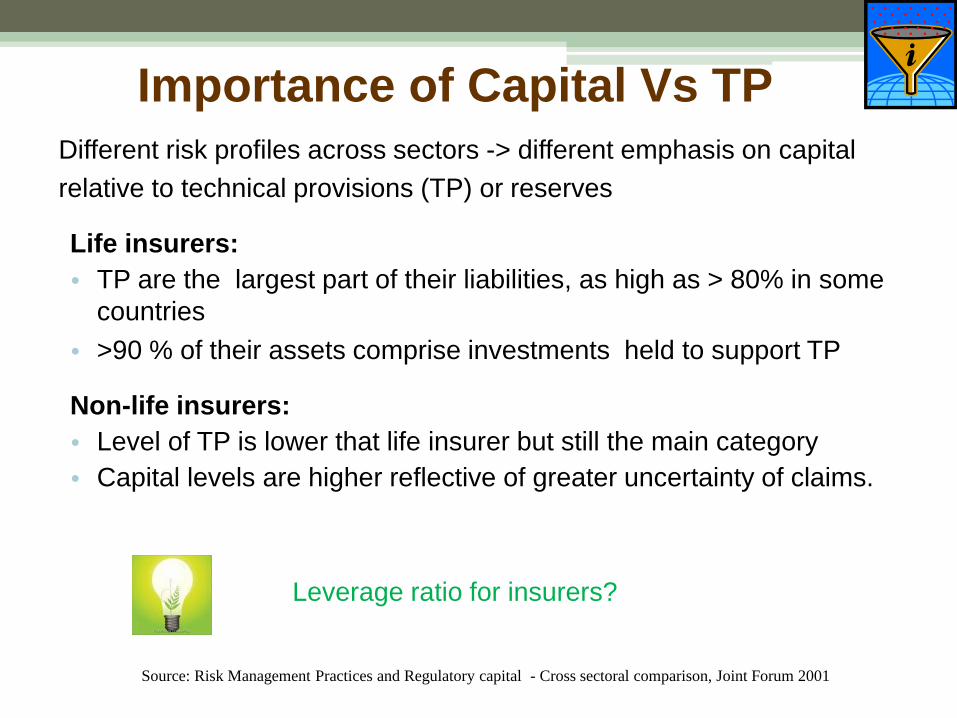
Importance of Capital Vs TP
Different risk profiles across sectors -> different emphasis on capital
relative to technical provisions (TP) or reserves
Life insurers:
• TP are the largest part of their liabilities, as high as > 80% in some
countries
• >90 % of their assets comprise investments held to support TP
Non-life insurers:
• Level of TP is lower that life insurer but still the main category
• Capital levels are higher reflective of greater uncertainty of claims.
19 Source: Risk Management Practices and Regulatory capital - Cross sectoral comparison, Joint Forum 2001
Leverage ratio for insurers?
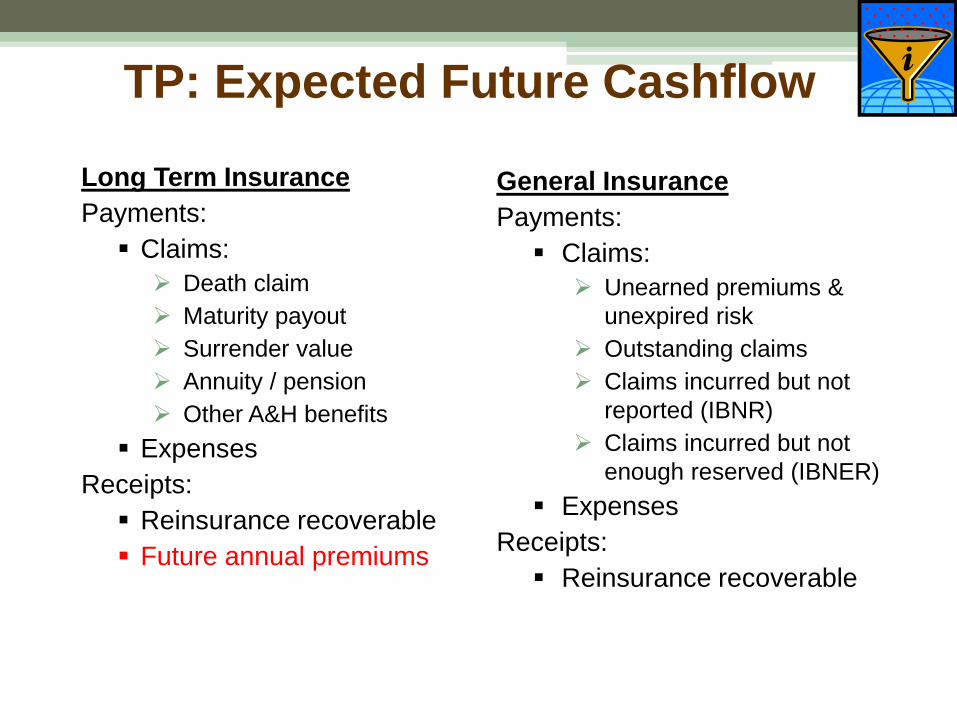
TP: Expected Future Cashflow
20
Long Term Insurance
Payments:
Claims:
Death claim
Maturity payout
Surrender value
Annuity / pension
Other A&H benefits
Expenses
Receipts:
Reinsurance recoverable
Future annual premiums
General Insurance
Payments:
Claims:
Unearned premiums &
unexpired risk
Outstanding claims
Claims incurred but not
reported (IBNR)
Claims incurred but not
enough reserved (IBNER)
Expenses
Receipts:
Reinsurance recoverable
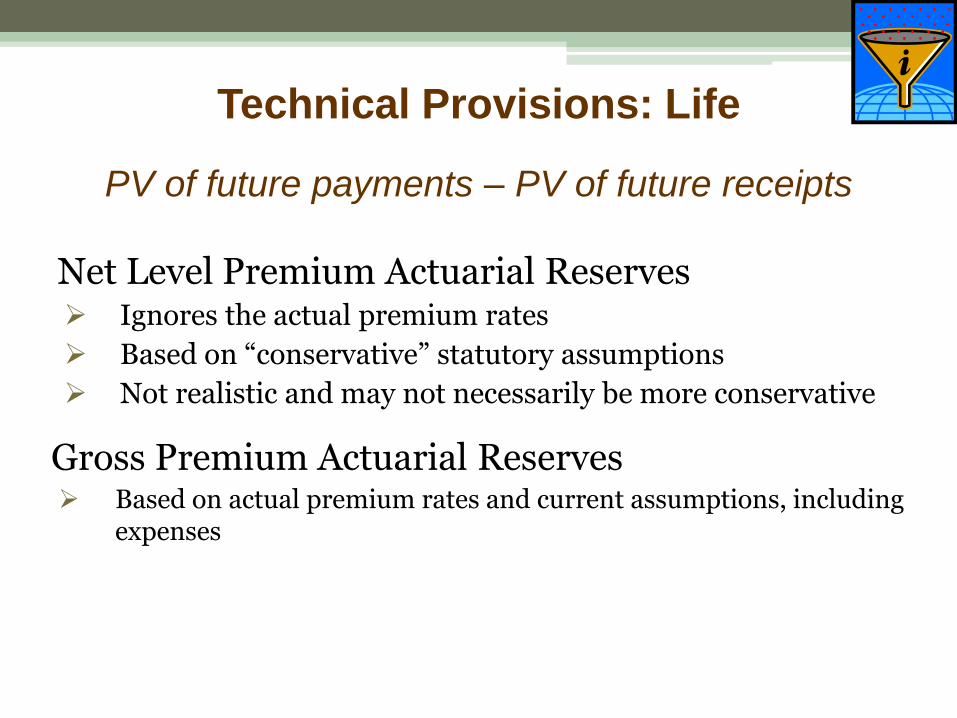
Technical Provisions: Life
Net Level Premium Actuarial Reserves Ignores the actual premium rates
Based on “conservative” statutory assumptions
Not realistic and may not necessarily be more conservative
Gross Premium Actuarial Reserves Based on actual premium rates and current assumptions, including
expenses
21
PV of future payments – PV of future receipts
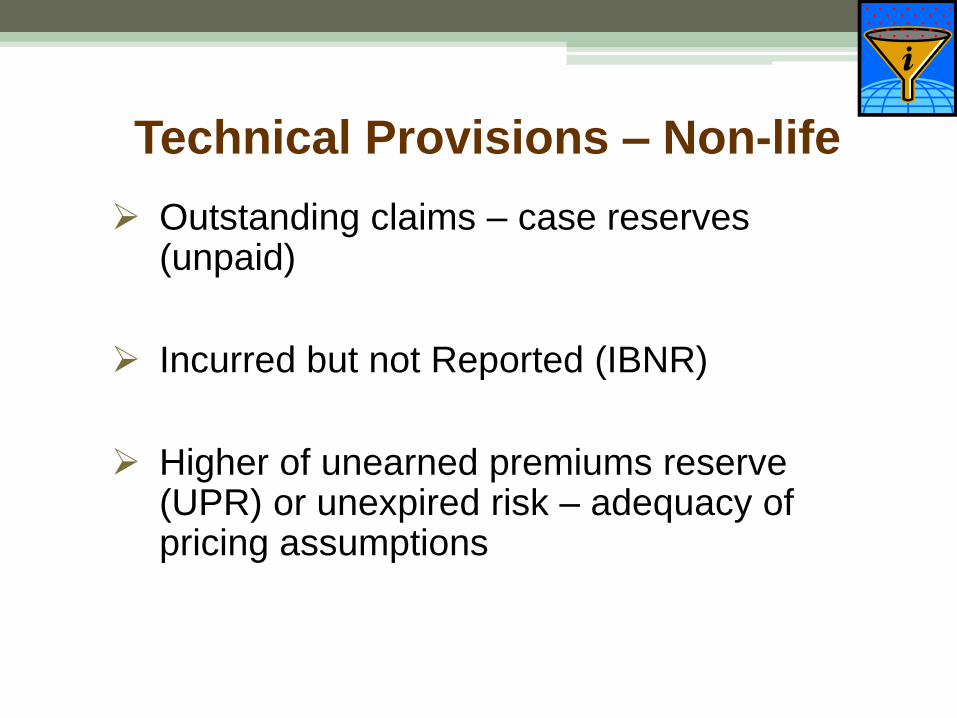
Technical Provisions – Non-life
Outstanding claims – case reserves (unpaid)
Incurred but not Reported (IBNR)
Higher of unearned premiums reserve (UPR) or unexpired risk – adequacy of pricing assumptions
22
23
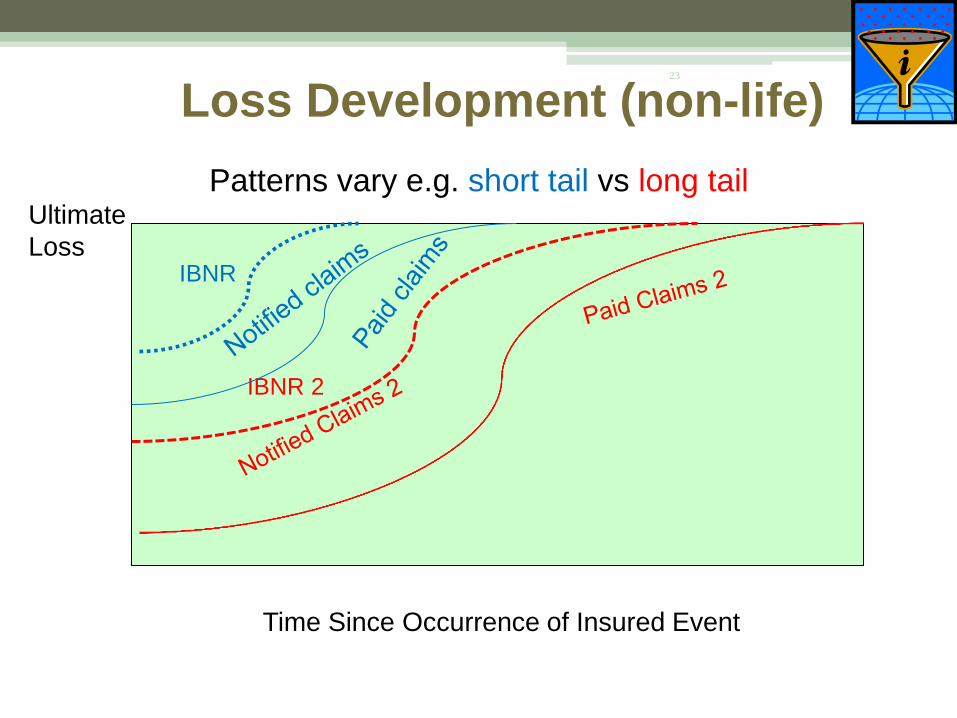
Loss Development (non-life)
Time Since Occurrence of Insured Event
Ultimate
Loss
IBNR 2
Patterns vary e.g. short tail vs long tail
IBNR
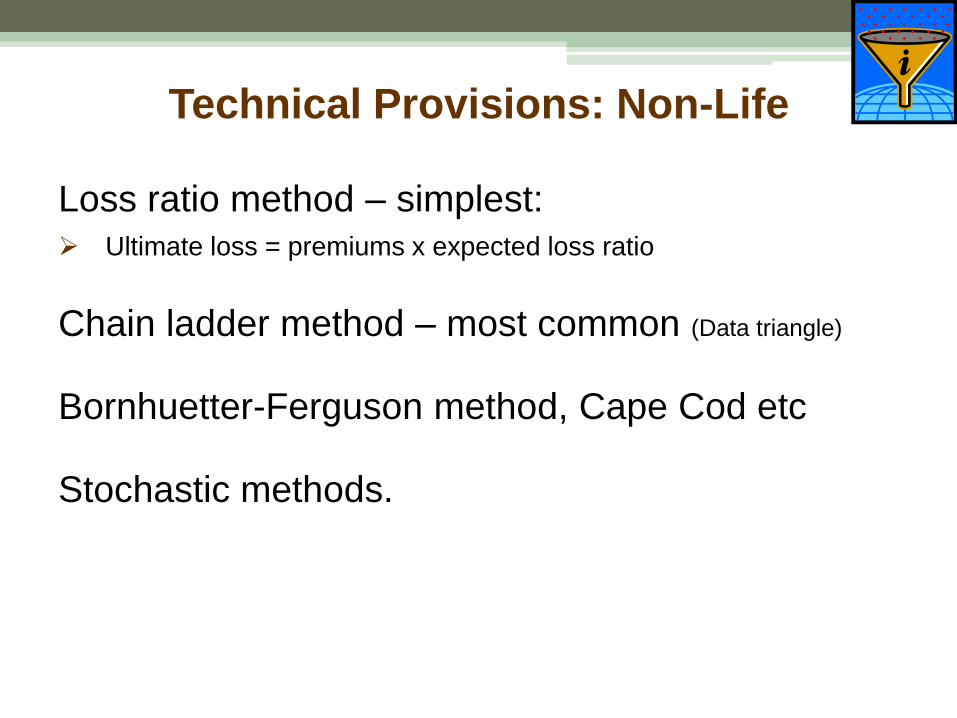
Technical Provisions: Non-Life
24
Loss ratio method – simplest:
Ultimate loss = premiums x expected loss ratio
Chain ladder method – most common (Data triangle)
Bornhuetter-Ferguson method, Cape Cod etc
Stochastic methods.
25
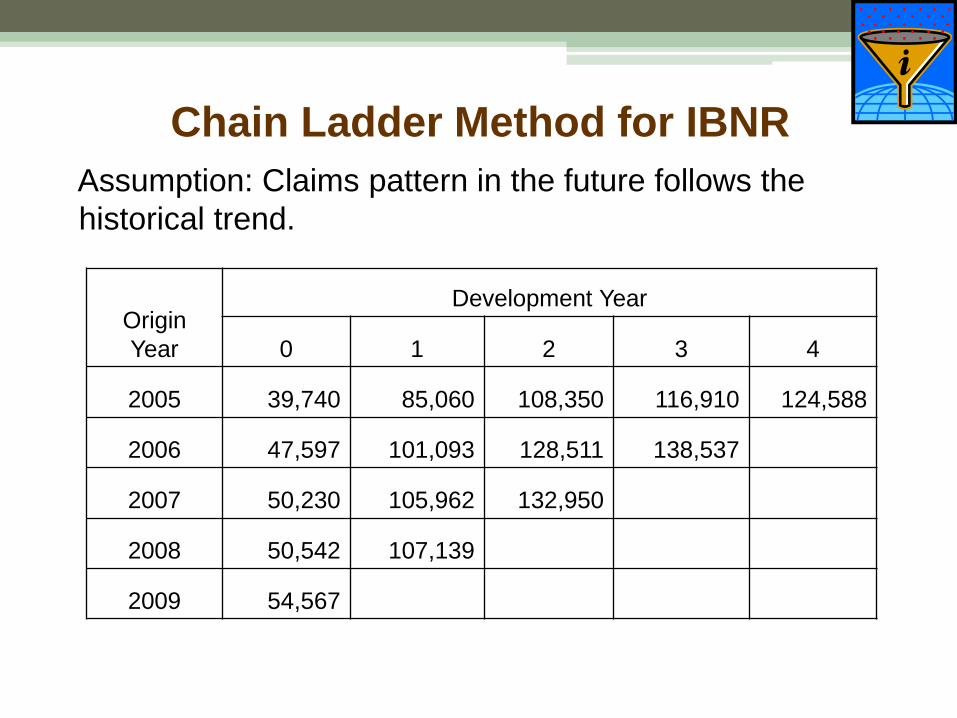
Assumption: Claims pattern in the future follows the
historical trend.
Origin
Year
Development Year
0 1 2 3 4
2005 39,740 85,060 108,350 116,910 124,588
2006 47,597 101,093 128,511 138,537
2007 50,230 105,962 132,950
2008 50,542 107,139
2009 54,567
Chain Ladder Method for IBNR
26
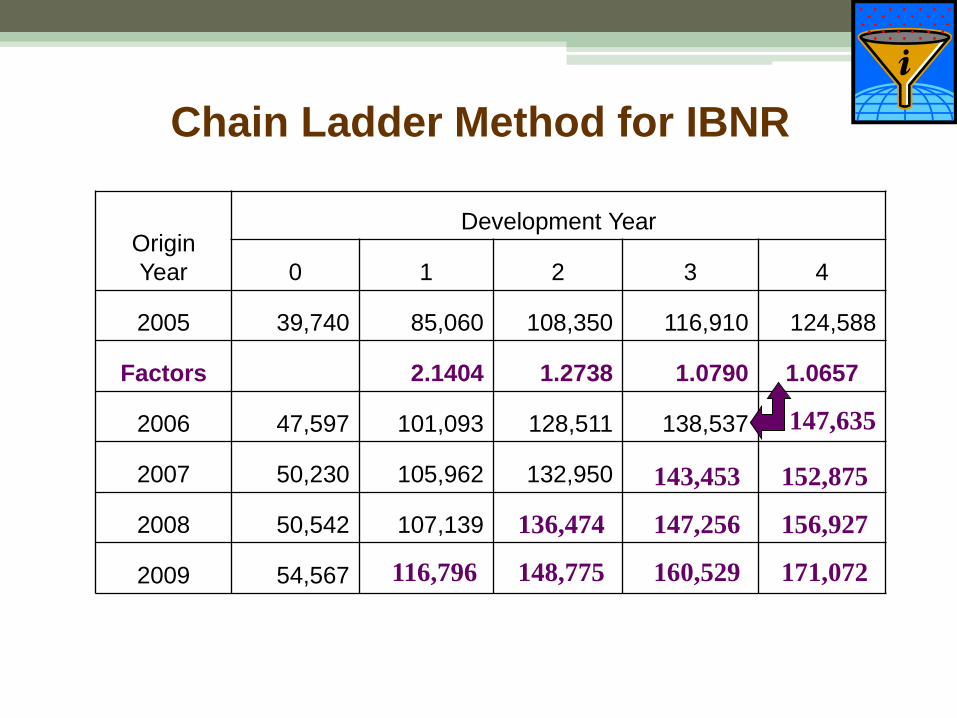
Chain Ladder Method for IBNR
Origin
Year
Development Year
0 1 2 3 4
2005 39,740 85,060 108,350 116,910 124,588
Factors 2.1404 1.2738 1.0790 1.0657
2006 47,597 101,093 128,511 138,537
2007 50,230 105,962 132,950
2008 50,542 107,139
2009 54,567 116,796
136,474
148,775
143,453
147,256
160,529
152,875
156,927
171,072
147,635
Capital Adequacy Requirements (1)
27
ICP 17: The supervisor establishes capital adequacy
requirements for solvency purposes so that insurers can
absorb significant unforeseen losses and to provide for
degrees of supervisory intervention.
Total Balance Sheet Approach
Available capital resources – admissibility and “quality”
Regulatory capital requirements set “at a sufficient level “, based on
“appropriate” target criteria (risk measures, confidence level and
time horizon” – but no specifications
Transparent solvency control levels - Minimum Capital
Requirement (MCR) & Prescribed Capital Requirement (PCR)
Both standardized approaches and internal models acceptable
Capital Adequacy Requirements (2)
28
Types of risks covered
“Explicit” on the risks covered and whether addressed under TP,
capital or both
Key risks (minimum) – underwriting (insurance), credit, market,
operational and liquidity.
Quality and suitability of capital resources
Subordination, availability, permanence and absence of
encumbrances and mandatory servicing costs (guidance only)
Cross-sectoral Risk Transfers
• Repos, securities lending, CDS
• Liquidity swaps – banks and insurers
• Transfers to the capital markets
29
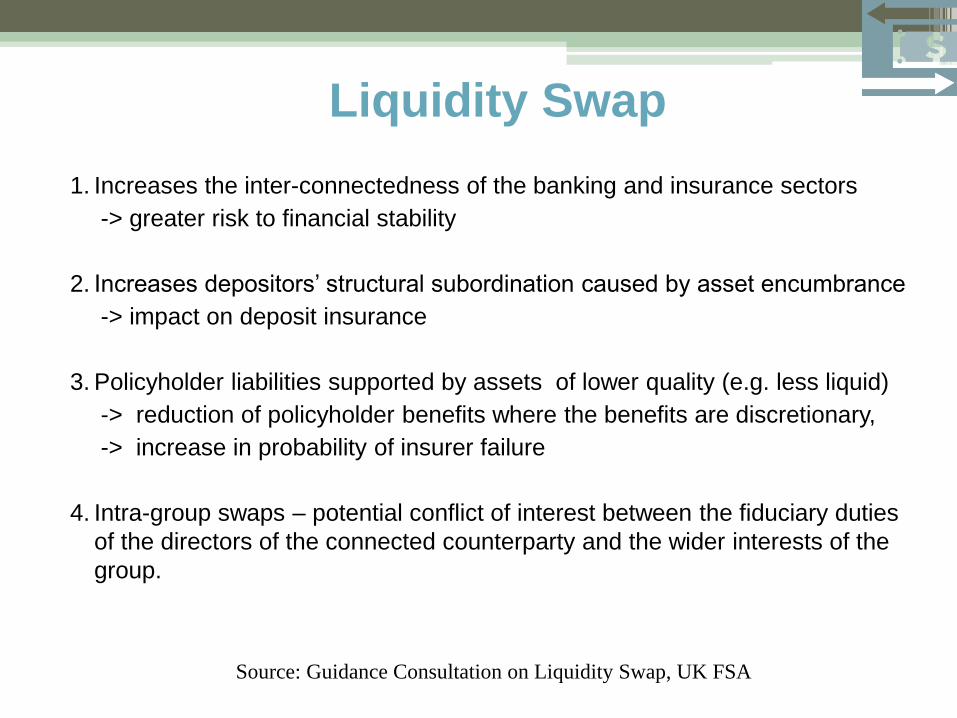
Liquidity Swap
1. Increases the inter-connectedness of the banking and insurance sectors
-> greater risk to financial stability
2. Increases depositors’ structural subordination caused by asset encumbrance
-> impact on deposit insurance
3. Policyholder liabilities supported by assets of lower quality (e.g. less liquid)
-> reduction of policyholder benefits where the benefits are discretionary,
-> increase in probability of insurer failure
4. Intra-group swaps – potential conflict of interest between the fiduciary duties
of the directors of the connected counterparty and the wider interests of the
group.
30 Source: Guidance Consultation on Liquidity Swap, UK FSA
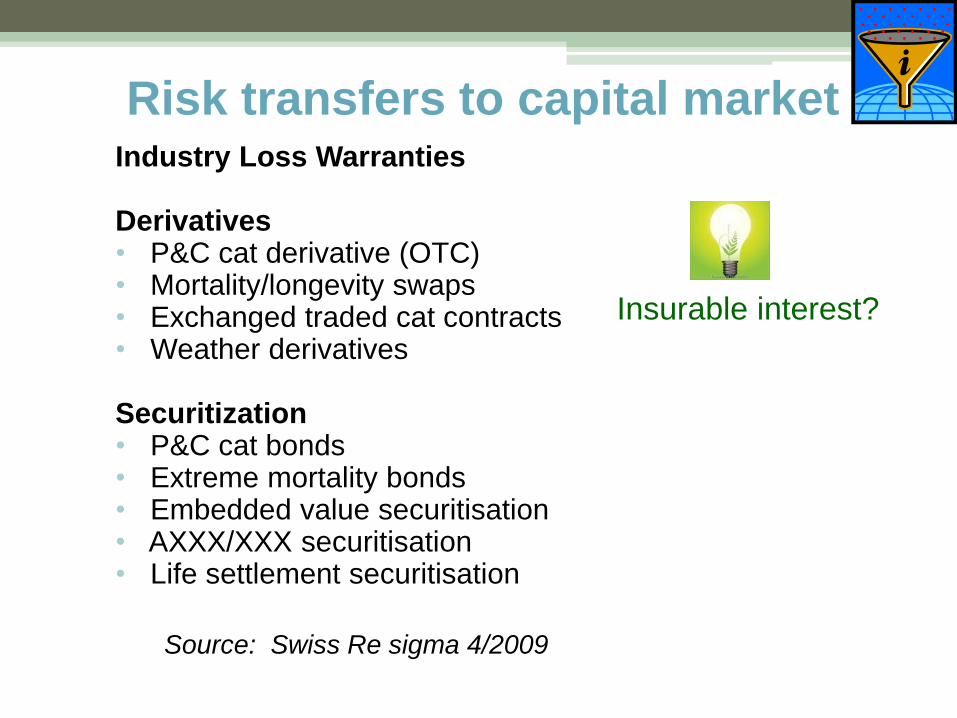
Risk transfers to capital market
Industry Loss Warranties
Derivatives • P&C cat derivative (OTC) • Mortality/longevity swaps • Exchanged traded cat contracts • Weather derivatives
Securitization • P&C cat bonds • Extreme mortality bonds • Embedded value securitisation • AXXX/XXX securitisation • Life settlement securitisation
31
Insurable interest?
Source: Swiss Re sigma 4/2009
Other Emerging Issues
• Treatment of sovereign assets
• De-risking by insurers – unintended
assets reallocation from equities to bonds
• Trend towards investment-linked products
and investment horizon of life insurers ->
role of insurers as long-term investors
• Increase frequency and severity of natural
catastrophe – impact on non-life insurers
32

Thank You