Embed Size (px)
Citation preview


307
This article can be downloaded from http://www.ijerst.com/currentissue.php
Int. J. Engg. Res. & Sci. & Tech. 2014 Arunesh Kumar et al., 2014
VARIATION OF BOILER EFFICIENCY WITHRESPECT TO BOILER LOADS BY INCREASING
OF EXCESS AIR
Arunesh Kumar1*, Abhishek Arya2 and Rahul Kumar Singh3
The main motive of this study is to identify maximum energy loss areas in any thermal powerstations and generate a plan to reduce them using energy and exergy analysis as the tools. Theenergy sources are decreasing down day by day around the world due to the growing demandand sometimes due to ageing of machinery. Most of the power plants are designed by theenergetic performance criteria based not only on the first law of thermodynamics, but the realuseful energy loss cannot be justified by the fist law of thermodynamics, because it does notdifferentiate between the quality and quantity of energy. The main objective of this paper is tosurvey the technical options for waste heat capture and consider in greater depth of Waste heatcapture method through the use of real life examples. Present study deals with the comparisonof energy and exergy analysis of thermal power plants stimulated by coal. Our national electricityrequirement is about 2100 MW against 1615 MW supply; this is evident of about 21% deficit interms of power requirements. In view of this situation, greater need of efficiency improvement ofa thermal power plants
Keywords: Energy, Exergy, Heat balance sheet, Thermal Power Station, Fuel
*Corresponding Author: Arunesh Kumar [email protected]
INTRODUCTIONPower plant is assembly of systems or
subsystems to generate electricity. Power plant
generates the electricity result of combustion of
fuel into mechanical work and is thermal energy.
The availability of electricity and its per capita
consumption shows index of national standard
of living in the present day and flourishing power
1 M.Tech Scholar (Thermal Engineering), Department of Mechanical Engineering, SCOPE Engineering College, Bhopal, India.2 Assistant Professor, Scholar, Department of Mechanical Engineering, SCOPE Engineering College, Bhopal, India.3 M.Tech Scholar, Department of Mechanical Engineering, SCOPE Engineering College, Bhopal, India.
Int. J. Engg. Res. & Sci. & Tech. 2014
ISSN 2319-5991 www.ijerst.comVol. 3, No. 4, November 2014
© 2014 IJERST. All Rights Reserved
Research Paper
generation. The role of efficiency monitoring lies
in maximizing generation from power plants. It
enhances energy efficiency of the power plant. In
order to keep maximum output from a given input,
the units must run at the maximum possible
efficiency. Power sector is one of the key sectors
contributing significantly to the growth of country’s
economy. Power sector needs a more useful role

308
This article can be downloaded from http://www.ijerst.com/currentissue.php
Int. J. Engg. Res. & Sci. & Tech. 2014 Arunesh Kumar et al., 2014
to be played in defining, formulating and
implementing the research projects with close
involvement of all utilities like solar energy and
other various non conventional sources. The
increase in energy consumption, particularly in
the past several decades, has raised fears of
exhausting the globes reserves of coal, petroleum
and other resources in the future. The huge
consumption of fossil fuels has caused visible
damage to the environment in various forms.
Every year human activity dumps roughly 8 billion
metric tons of carbon into the atmosphere, 6.5
billion tons from fossil fuels and 1.5 billion from
deforestation At present India is sixth largest
country in the world in electricity generation,
having aggregate capacity of 177 GWs out of
which 65% is from thermal, 21% from hydro, 3%
from nuclear and the rest about 11% is from
renewable energy sources. Although over the
years, Indian power sector has experienced a five-
time increased in its installed capacity—a jump
from 30,000 MW in 1981 to over 176,990.40 MW
by 30 June 2014 but still there is a huge gap in
generation and demand in India hence need to
be establish more generation plants preferably
to be come f rom renewable sources by
governmental as well as various private
participation.
Process of Thermal Power Plants
The whole process comprises of generating heat
energy in the boiler and then converting heat
energy generated in the boiler into mechanical
energy in the turbine and further converting this
mechanical energy generated in the turbine into
electrical energy in the alternator. Coal will be
used as fuel in the boiler. The combustion of the
fuel generates the heat energy in the boiler. The
heat energy transfer to heat transfer area provided
in the different area like (bed coils, water wall,
steam drawn /mud drum economizer super
heater, air pre heater. This will be transferred to
the water which will pass through and steam is
generated and this steam will be further
superheated in the super heater so that dry
superheated steam will be generated. This steam
will be fed into the turbine and this steam expands
in the turbine and generates mechanical energy
will be converted in to electrical energy. The whole
process is comprises in Figure 1.
Figure 1: General Layout of Thermal Power

309
This article can be downloaded from http://www.ijerst.com/currentissue.php
Int. J. Engg. Res. & Sci. & Tech. 2014 Arunesh Kumar et al., 2014
Aim
The main analysis of the study is to find out those
areas where energy losses are occurring
maximum and modified them for efficient and
effective improvement in thermal power station.
Objectives
The object to satisfy this are
• To conduct energy calculation of the overall
plant and determine the efficiencies and energy
losses of all the major components on the
power station.
• Select and modified the areas where energy
losses are being experienced.
• Determine the costs and payback periods for
the new technologies suggested for efficiency
improvements.
Types of Fuel Used in Boiler
There are many type of fuel used in boiler to
generate necessary heat (Table 1).
of the it’s thermal energy is converted into
mechanical energy which is further used forgeneration electric power. The steam coming outof the steam turbine is condensed in thecondenser and condensate is supplied back tothe boiler with the help of the feed pump and cycleis repeated.
The function of the boiler is to generate thesteam .The function of condenser is to condensethe steam coming out of steam turbine at lowpressure. The function of the steam turbine is toconvert part of heat energy of steam intomechanical energy. The function of feed pump isto raise the pressure of the condensate from thecondenser pressure (0.015 bar ) to boilerpressure (200 bar). The other components likeeconomizer, super heater and steam feedheaters are used in the primary circuit to increasethe overall efficiency of the thermal power plant.
Fuel GCV(Kcal/kg)
Coal
a) Bituminous 4,500 to 6,500
b) Anthracite 6,500 to 7,700
c) Lignite 3,500 to 4500
Furnace oil 10,500 to 11,700
Natural Gas 8,200 to 8,600 KCal/Nm3
Agro fuels 3,100 to 4,500
Kerosene 11,100 11,100
LPG 11,600 to 11,700 KCal/Kg
Working of Thermal Power Plant
Steam is generated in the boiler of the thermal
power plant using the heat of the fuel burned in
the combustion chamber. The steam generated
is passed through steam turbine where the part
Figure 2: working of Thermal Power Plant
HISTORICAL PROSPECTIVEThe scenario of energy in thermal power plant
are discussed that fossil fuels contribute 80%,
renewable Energy resources contribute 14% and
nuclear 6% of world annual energy use. These
numbers will soon change as the world’s
populat ion grows, energy demand rises,
inexpensive oil and gas deplete, global warming.
Effects continue to rise and urban pollution
worsens the living conditions. The development
Table 1: Various Types of Fuels Used in Boiler
310
This article can be downloaded from http://www.ijerst.com/currentissue.php
Int. J. Engg. Res. & Sci. & Tech. 2014 Arunesh Kumar et al., 2014
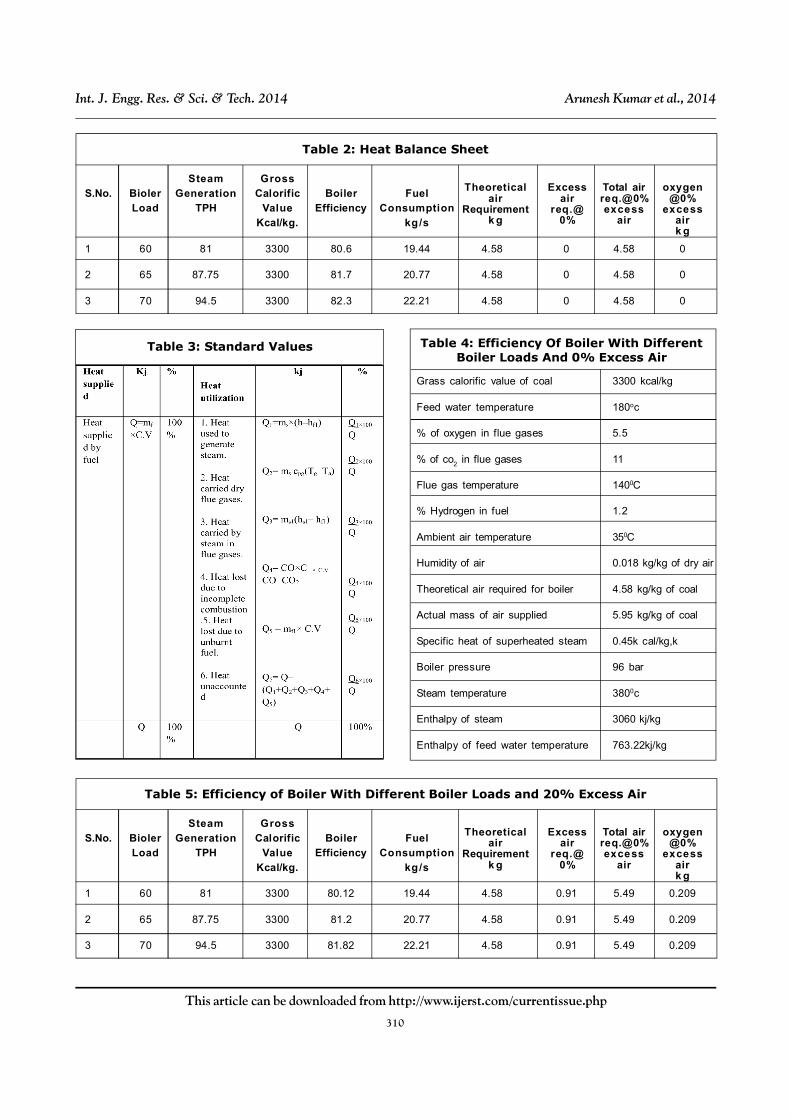
Table 2: Heat Balance Sheet
Steam GrossS.No. Bioler Generation Calorific Boiler Fuel
Load TPH Value Efficiency ConsumptionKcal/kg. kg/s
1 60 81 3300 80.6 19.44 4.58 0 4.58 0
2 65 87.75 3300 81.7 20.77 4.58 0 4.58 0
3 70 94.5 3300 82.3 22.21 4.58 0 4.58 0
Theoreticalair
Requirementk g
Excessair
req.@0%
Total airreq.@0%excess
air
oxygen@0%
excessairk g
Table 3: Standard Values Table 4: Efficiency Of Boiler With DifferentBoiler Loads And 0% Excess Air
Grass calorific value of coal 3300 kcal/kg
Feed water temperature 180oc
% of oxygen in flue gases 5.5
% of co2 in flue gases 11
Flue gas temperature 1400C
% Hydrogen in fuel 1.2
Ambient air temperature 350C
Humidity of air 0.018 kg/kg of dry air
Theoretical air required for boiler 4.58 kg/kg of coal
Actual mass of air supplied 5.95 kg/kg of coal
Specific heat of superheated steam 0.45k cal/kg,k
Boiler pressure 96 bar
Steam temperature 3800c
Enthalpy of steam 3060 kj/kg
Enthalpy of feed water temperature 763.22kj/kg
Table 5: Efficiency of Boiler With Different Boiler Loads and 20% Excess Air
Steam GrossS.No. Bioler Generation Calorific Boiler Fuel
Load TPH Value Efficiency ConsumptionKcal/kg. kg/s
1 60 81 3300 80.12 19.44 4.58 0.91 5.49 0.209
2 65 87.75 3300 81.2 20.77 4.58 0.91 5.49 0.209
3 70 94.5 3300 81.82 22.21 4.58 0.91 5.49 0.209
Theoreticalair
Requirementk g
Excessair
req.@0%
Total airreq.@0%excess
air
oxygen@0%
excessairk g
311
This article can be downloaded from http://www.ijerst.com/currentissue.php
Int. J. Engg. Res. & Sci. & Tech. 2014 Arunesh Kumar et al., 2014
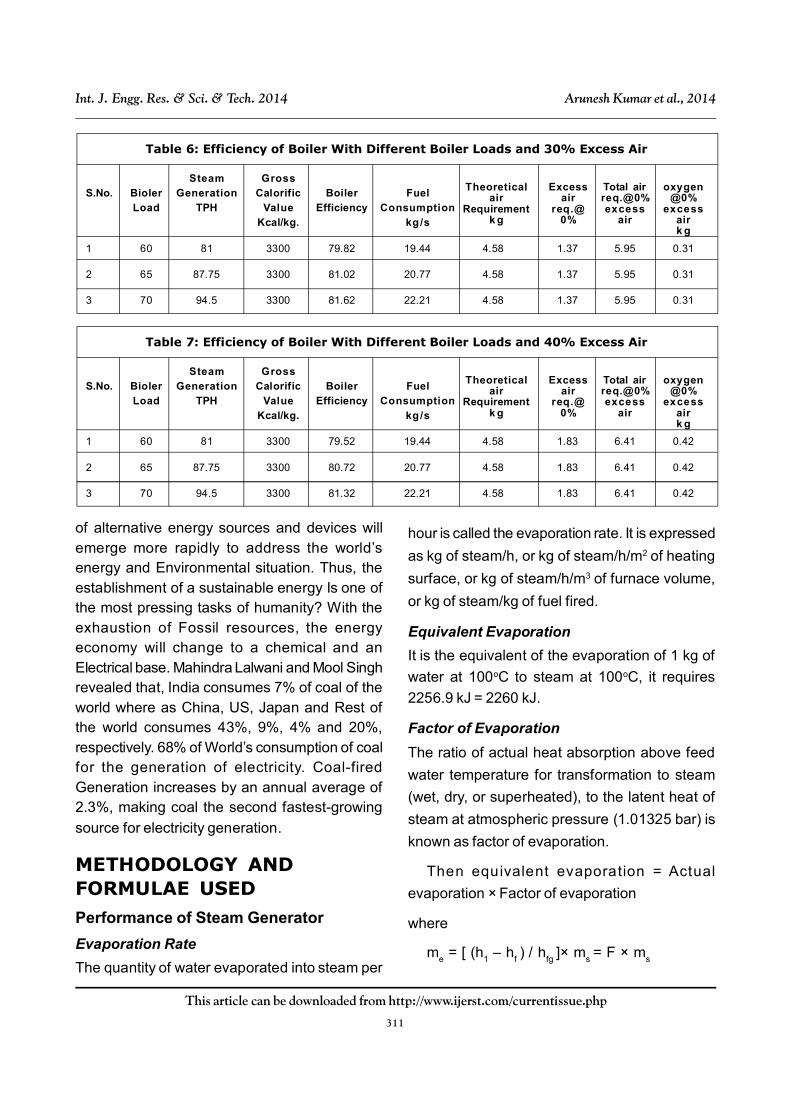
Table 6: Efficiency of Boiler With Different Boiler Loads and 30% Excess Air
Steam GrossS.No. Bioler Generation Calorific Boiler Fuel
Load TPH Value Efficiency ConsumptionKcal/kg. kg/s
1 60 81 3300 79.82 19.44 4.58 1.37 5.95 0.31
2 65 87.75 3300 81.02 20.77 4.58 1.37 5.95 0.31
3 70 94.5 3300 81.62 22.21 4.58 1.37 5.95 0.31
Theoreticalair
Requirementk g
Excessair
req.@0%
Total airreq.@0%excess
air
oxygen@0%
excessairk g
Table 7: Efficiency of Boiler With Different Boiler Loads and 40% Excess Air
Steam GrossS.No. Bioler Generation Calorific Boiler Fuel
Load TPH Value Efficiency ConsumptionKcal/kg. kg/s
1 60 81 3300 79.52 19.44 4.58 1.83 6.41 0.42
2 65 87.75 3300 80.72 20.77 4.58 1.83 6.41 0.42
3 70 94.5 3300 81.32 22.21 4.58 1.83 6.41 0.42
Theoreticalair
Requirementk g
Excessair
req.@0%
Total airreq.@0%excess
air
oxygen@0%
excessairk g
of alternative energy sources and devices willemerge more rapidly to address the world’senergy and Environmental situation. Thus, theestablishment of a sustainable energy Is one ofthe most pressing tasks of humanity? With theexhaustion of Fossil resources, the energyeconomy will change to a chemical and anElectrical base. Mahindra Lalwani and Mool Singhrevealed that, India consumes 7% of coal of theworld where as China, US, Japan and Rest ofthe world consumes 43%, 9%, 4% and 20%,respectively. 68% of World’s consumption of coalfor the generation of electricity. Coal-firedGeneration increases by an annual average of2.3%, making coal the second fastest-growing
source for electricity generation.
METHODOLOGY ANDFORMULAE USEDPerformance of Steam Generator
Evaporation Rate
The quantity of water evaporated into steam per
hour is called the evaporation rate. It is expressed
as kg of steam/h, or kg of steam/h/m2 of heating
surface, or kg of steam/h/m3 of furnace volume,
or kg of steam/kg of fuel fired.
Equivalent Evaporation
It is the equivalent of the evaporation of 1 kg of
water at 100oC to steam at 100oC, it requires
2256.9 kJ = 2260 kJ.
Factor of Evaporation
The ratio of actual heat absorption above feed
water temperature for transformation to steam
(wet, dry, or superheated), to the latent heat of
steam at atmospheric pressure (1.01325 bar) is
known as factor of evaporation.
Then equivalent evaporation = Actual
evaporation × Factor of evaporation
where
me = [ (h1 – hf ) / hfg ]× ms = F × ms
312
This article can be downloaded from http://www.ijerst.com/currentissue.php
Int. J. Engg. Res. & Sci. & Tech. 2014 Arunesh Kumar et al., 2014
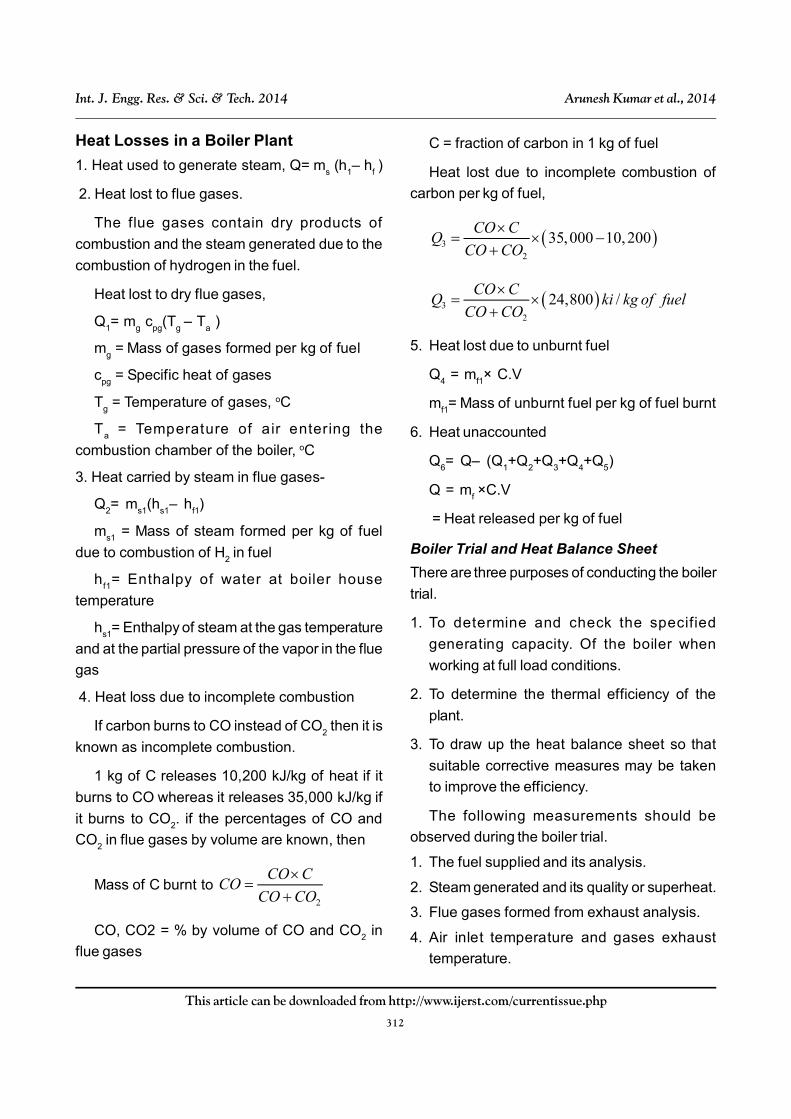
Heat Losses in a Boiler Plant
1. Heat used to generate steam, Q= ms (h1– hf )
2. Heat lost to flue gases.
The flue gases contain dry products of
combustion and the steam generated due to the
combustion of hydrogen in the fuel.
Heat lost to dry flue gases,
Q1= mg cpg(Tg – Ta )
mg = Mass of gases formed per kg of fuel
cpg = Specific heat of gases
Tg = Temperature of gases, oC
Ta = Temperature of air entering the
combustion chamber of the boiler, oC
3. Heat carried by steam in flue gases-
Q2= ms1(hs1– hf1)
ms1 = Mass of steam formed per kg of fuel
due to combustion of H2 in fuel
hf1= Enthalpy of water at boiler house
temperature
hs1= Enthalpy of steam at the gas temperature
and at the partial pressure of the vapor in the flue
gas
4. Heat loss due to incomplete combustion
If carbon burns to CO instead of CO2 then it is
known as incomplete combustion.
1 kg of C releases 10,200 kJ/kg of heat if it
burns to CO whereas it releases 35,000 kJ/kg if
it burns to CO2. if the percentages of CO and
CO2 in flue gases by volume are known, then
Mass of C burnt to 2
CO CCO
CO CO
CO, CO2 = % by volume of CO and CO2 in
flue gases
C = fraction of carbon in 1 kg of fuel
Heat lost due to incomplete combustion of
carbon per kg of fuel,
32
35,000 10,200CO C
QCO CO
32
24,800 /CO C
Q ki kg of fuelCO CO
5. Heat lost due to unburnt fuel
Q4 = mf1× C.V
mf1= Mass of unburnt fuel per kg of fuel burnt
6. Heat unaccounted
Q6= Q– (Q1+Q2+Q3+Q4+Q5)
Q = mf ×C.V
= Heat released per kg of fuel
Boiler Trial and Heat Balance Sheet
There are three purposes of conducting the boiler
trial.
1. To determine and check the specified
generating capacity. Of the boiler when
working at full load conditions.
2. To determine the thermal efficiency of the
plant.
3. To draw up the heat balance sheet so that
suitable corrective measures may be taken
to improve the efficiency.
The following measurements should be
observed during the boiler trial.
1. The fuel supplied and its analysis.
2. Steam generated and its quality or superheat.
3. Flue gases formed from exhaust analysis.
4. Air inlet temperature and gases exhaust
temperature.

313
This article can be downloaded from http://www.ijerst.com/currentissue.php
Int. J. Engg. Res. & Sci. & Tech. 2014 Arunesh Kumar et al., 2014
5. Volumetric analysis of exhaust gases.
6. Mass of fuel left unburnt in ash.
7. Feed water temperature.
The Heat balance sheet is a symmetric
representation of heat released from burning of
fuel and heat distribution on minute, hour or per
kg of fuel basis.
RESULTS AND DISCUSSIONVardhman Group is a leading textile conglomerate
in India having a turnover of $1009 mn. Spanning
over 25 manufacturing facilities in five states
across India, the Group business portfolio
includes Yarn, Greige and Processed Fabric,
Sewing Thread, Acrylic Fiber and Alloy Steel.
Vardhman has evolved through history from a
small beginning in 1965 into a modern textile major
under the dynamic leadership of its chairman, S
P Oswal. His vision and insight has given
Vardhman an enviable position in the textile
industry. Under his leadership, Vardhman is
efficiently using resources to innovate, diversify,
integrate and build its diverse operations into a
dynamic modern enterprise.
Figure 3: Efficiency Versus Excess Air
Figure 4: Efficiency Vesus Excess Air
Figure 5: Efficiency Vesus Excess Air
Figure 6: Efficiency Vesus Excess Air

314
This article can be downloaded from http://www.ijerst.com/currentissue.php
Int. J. Engg. Res. & Sci. & Tech. 2014 Arunesh Kumar et al., 2014
steam generation also varies at different boiler
loads.
4. In this study show the variation of excess air
with fuel consumption and basically 40%
excess air use to reduce the loses and improve
boiler efficiency
5. In this study the calculation of efficiency based
on 20%, 30%, 40% excess air which gives the
excellent variation in boiler efficiency.
6. In this study we see that at minimum boiler
load the efficiency of boiler is minimum in range
which is show in graph and with the variation
of boiler load efficiency of boiler range also vary
which is clearly show in graph.
7. Boiler load and excess air variation help to
show the variation in the boiler efficiency. In
graph 1.1 we are see that at 0% excess air
the boiler efficiency range is maximum and at
40% excess air the boiler efficiency range is
minimum
REFERENCES1. Bejan (2002), “Fundamentals of Exergy
Analysis, Entropy Generation Minimization,
and the Generation of Flow Architecture”,
International Journal of Energy Research,
Vol. 26, No. 7, pp. 545-565.
2. Jin H, Ishida M, Kobayashi M and Nunokawa
M (1997), “Exergy Evaluation of Two Current
Advanced Power Plants: Supercritical
Steam Turbine and Combined Cycle”,
Trans. of ASME, Vol. 119, pp 250-256.
3. Naterer G F, Regulagadda P and Dincer I
(2010), “Exergy analysis of a thermal power
plant with measured boiler and turbine
Losses”, Applied Thermal Engineering, Vol.
30, pp. 970-976.
CONCLUSIONThe following conclusions have been drawn from
the experimental results:
This paper show the enervative ideas to
reduce losses of boiler and improve boiler
efficiency by using the variation of boiler load and
also percentage of excess air
We conclude the following point which points
show in paper and by using of heat balance sheet
clearly indicate unnecessary loss of heat. Give
some ideas to reduce unnecessary loses and
improve boiler efficiency.
1. This study shows the working process of
thermal power plants and indicates the
performance of boiler which can be improving
by using load variation.
2. This study show the performance of Vardhman
Yarns, Satlapur, Mandideep in which steam
generation has been done at a boiler pressure
of 96 bars and temperature approximately 380
degree Celsius.
3. In this study show the variation of fuel
consumption for various boiler loads and also
Figure 7: Efficiency Vesus Excess Air

315
This article can be downloaded from http://www.ijerst.com/currentissue.php
Int. J. Engg. Res. & Sci. & Tech. 2014 Arunesh Kumar et al., 2014
4. Tekin T and Bayramoglu M (1998), “Exergy
Analysis of the Sugar Production Process
from Sugar Beets”, Int. J. of Energy
Research, Vol. 22, pp. 591-601.
5. Wiser Wendell H (2000), “Energy
Resources: Occurrence, Production,
Conversion, Use”, ISBM 0-387-98744-
4(Alk.Paper).