Embed Size (px)
Citation preview
Coalition Formation in a Legislative Voting Game
Nels Christiansen, Sotiris Georganas, John H. Kagel
Appendix
This appendix reports the results from, and motivation for, a parallel treatment conducted
shortly before the treatment reported in the text. The results are quite similar to those reported in
the text but are complicated by the fact that in games with public and private goods, the SSPE
involves mixed strategy play for T2 and T3.
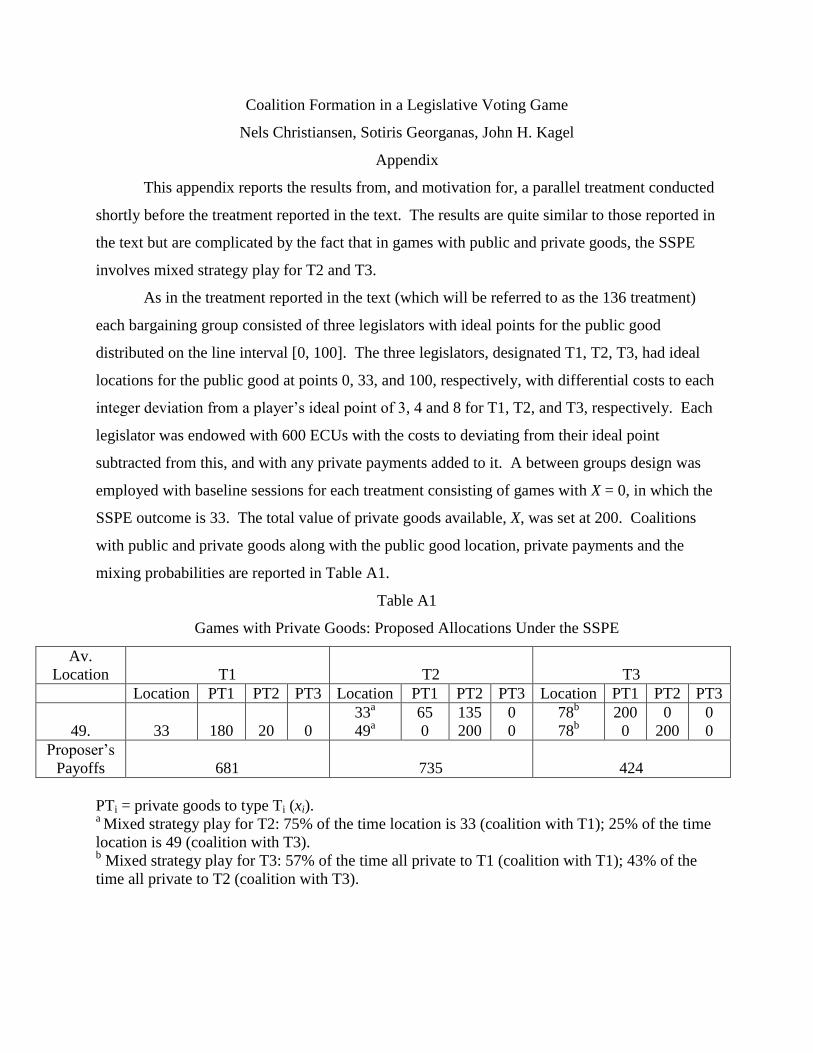
As in the treatment reported in the text (which will be referred to as the 136 treatment)
each bargaining group consisted of three legislators with ideal points for the public good
distributed on the line interval [0, 100]. The three legislators, designated T1, T2, T3, had ideal
locations for the public good at points 0, 33, and 100, respectively, with differential costs to each
integer deviation from a player’s ideal point of 3, 4 and 8 for T1, T2, and T3, respectively. Each
legislator was endowed with 600 ECUs with the costs to deviating from their ideal point
subtracted from this, and with any private payments added to it. A between groups design was
employed with baseline sessions for each treatment consisting of games with X = 0, in which the
SSPE outcome is 33. The total value of private goods available, X, was set at 200. Coalitions
with public and private goods along with the public good location, private payments and the
mixing probabilities are reported in Table A1.
Table A1
Games with Private Goods: Proposed Allocations Under the SSPE
Av.
Location
T1
T2
T3
Location PT1 PT2 PT3 Location PT1 PT2 PT3 Location PT1 PT2 PT3
49.
33
180
20
0
33a
49a
65
0
135
200
0
0
78b
78b
200
0
0
200
0
0
Proposer’s
Payoffs
681
735
424
PTi = private goods to type Ti (xi). a Mixed strategy play for T2: 75% of the time location is 33 (coalition with T1); 25% of the time
location is 49 (coalition with T3). b Mixed strategy play for T3: 57% of the time all private to T1 (coalition with T1); 43% of the
time all private to T2 (coalition with T3).
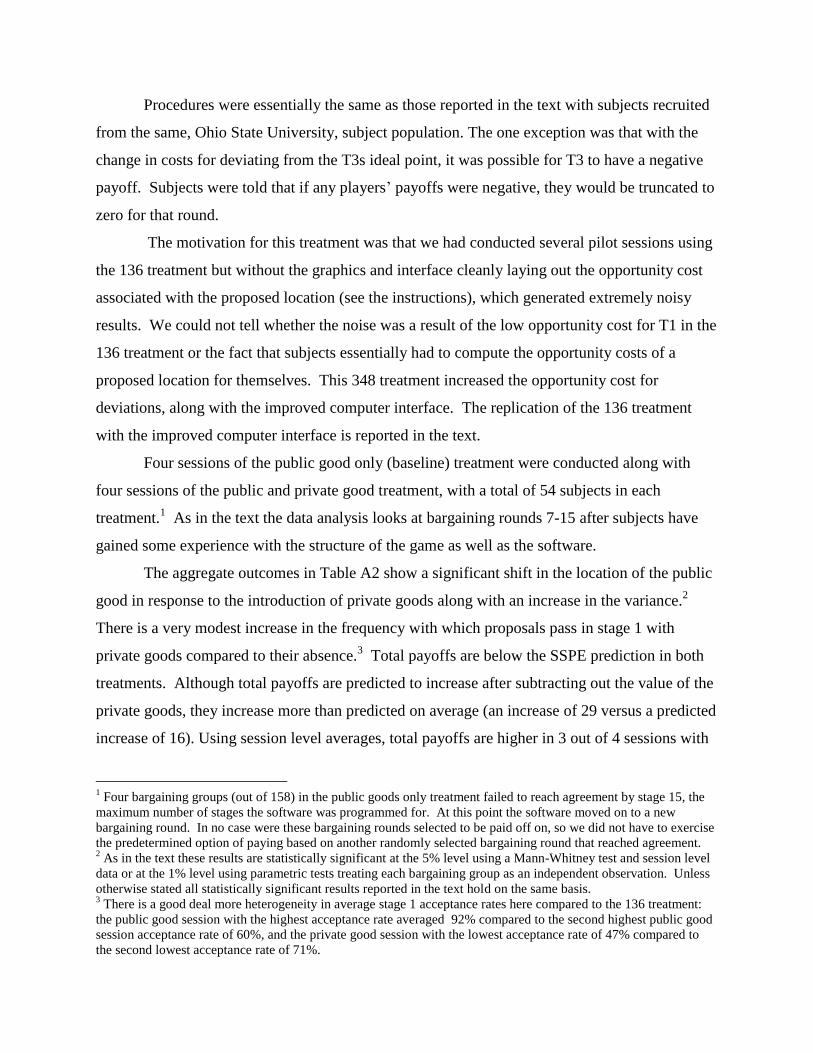
Procedures were essentially the same as those reported in the text with subjects recruited
from the same, Ohio State University, subject population. The one exception was that with the
change in costs for deviating from the T3s ideal point, it was possible for T3 to have a negative
payoff. Subjects were told that if any players’ payoffs were negative, they would be truncated to
zero for that round.
The motivation for this treatment was that we had conducted several pilot sessions using
the 136 treatment but without the graphics and interface cleanly laying out the opportunity cost
associated with the proposed location (see the instructions), which generated extremely noisy
results. We could not tell whether the noise was a result of the low opportunity cost for T1 in the
136 treatment or the fact that subjects essentially had to compute the opportunity costs of a
proposed location for themselves. This 348 treatment increased the opportunity cost for
deviations, along with the improved computer interface. The replication of the 136 treatment
with the improved computer interface is reported in the text.
Four sessions of the public good only (baseline) treatment were conducted along with
four sessions of the public and private good treatment, with a total of 54 subjects in each
treatment.1 As in the text the data analysis looks at bargaining rounds 7-15 after subjects have
gained some experience with the structure of the game as well as the software.
The aggregate outcomes in Table A2 show a significant shift in the location of the public
good in response to the introduction of private goods along with an increase in the variance.2
There is a very modest increase in the frequency with which proposals pass in stage 1 with
private goods compared to their absence.3 Total payoffs are below the SSPE prediction in both
treatments. Although total payoffs are predicted to increase after subtracting out the value of the
private goods, they increase more than predicted on average (an increase of 29 versus a predicted
increase of 16). Using session level averages, total payoffs are higher in 3 out of 4 sessions with
1 Four bargaining groups (out of 158) in the public goods only treatment failed to reach agreement by stage 15, the
maximum number of stages the software was programmed for. At this point the software moved on to a new
bargaining round. In no case were these bargaining rounds selected to be paid off on, so we did not have to exercise
the predetermined option of paying based on another randomly selected bargaining round that reached agreement. 2 As in the text these results are statistically significant at the 5% level using a Mann-Whitney test and session level
data or at the 1% level using parametric tests treating each bargaining group as an independent observation. Unless
otherwise stated all statistically significant results reported in the text hold on the same basis. 3 There is a good deal more heterogeneity in average stage 1 acceptance rates here compared to the 136 treatment:
the public good session with the highest acceptance rate averaged 92% compared to the second highest public good
session acceptance rate of 60%, and the private good session with the lowest acceptance rate of 47% compared to
the second lowest acceptance rate of 71%.
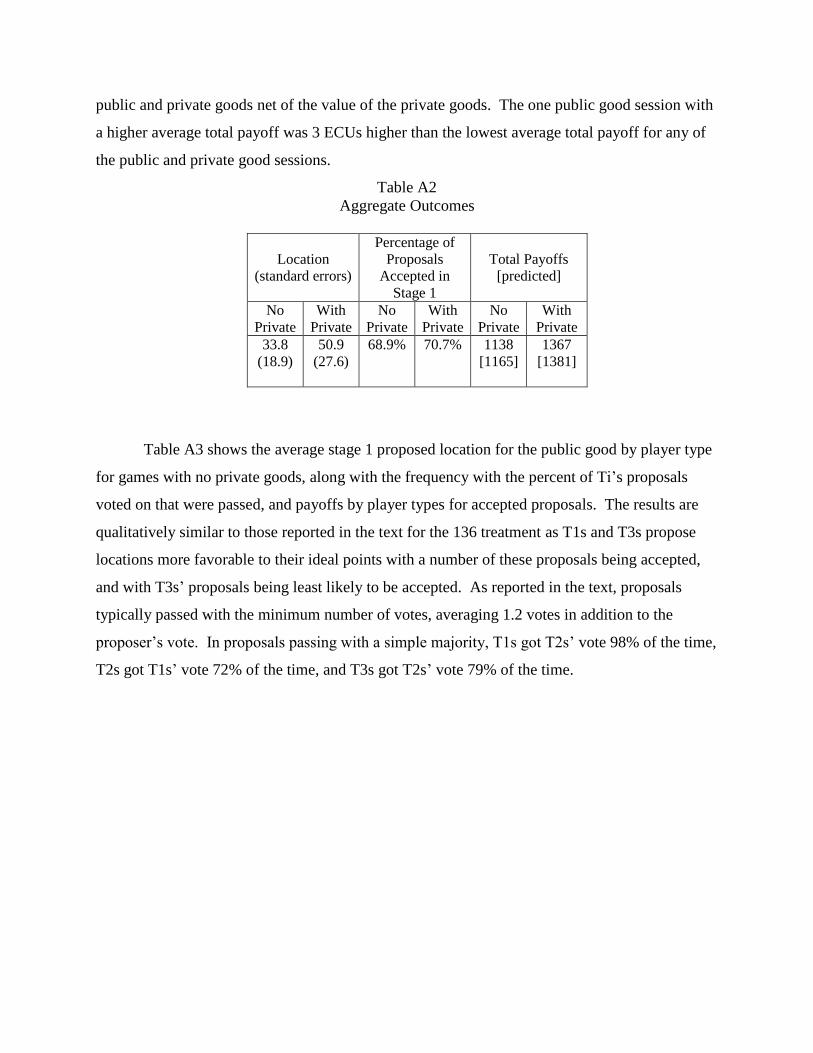
public and private goods net of the value of the private goods. The one public good session with
a higher average total payoff was 3 ECUs higher than the lowest average total payoff for any of
the public and private good sessions.
Table A2
Aggregate Outcomes
Location
(standard errors)
Percentage of
Proposals
Accepted in
Stage 1
Total Payoffs
[predicted]
No
Private
With
Private
No
Private
With
Private
No
Private
With
Private
33.8
(18.9)
50.9
(27.6)
68.9%
70.7% 1138
[1165]
1367
[1381]
Table A3 shows the average stage 1 proposed location for the public good by player type
for games with no private goods, along with the frequency with the percent of Ti’s proposals
voted on that were passed, and payoffs by player types for accepted proposals. The results are
qualitatively similar to those reported in the text for the 136 treatment as T1s and T3s propose
locations more favorable to their ideal points with a number of these proposals being accepted,
and with T3s’ proposals being least likely to be accepted. As reported in the text, proposals
typically passed with the minimum number of votes, averaging 1.2 votes in addition to the
proposer’s vote. In proposals passing with a simple majority, T1s got T2s’ vote 98% of the time,
T2s got T1s’ vote 72% of the time, and T3s got T2s’ vote 79% of the time.
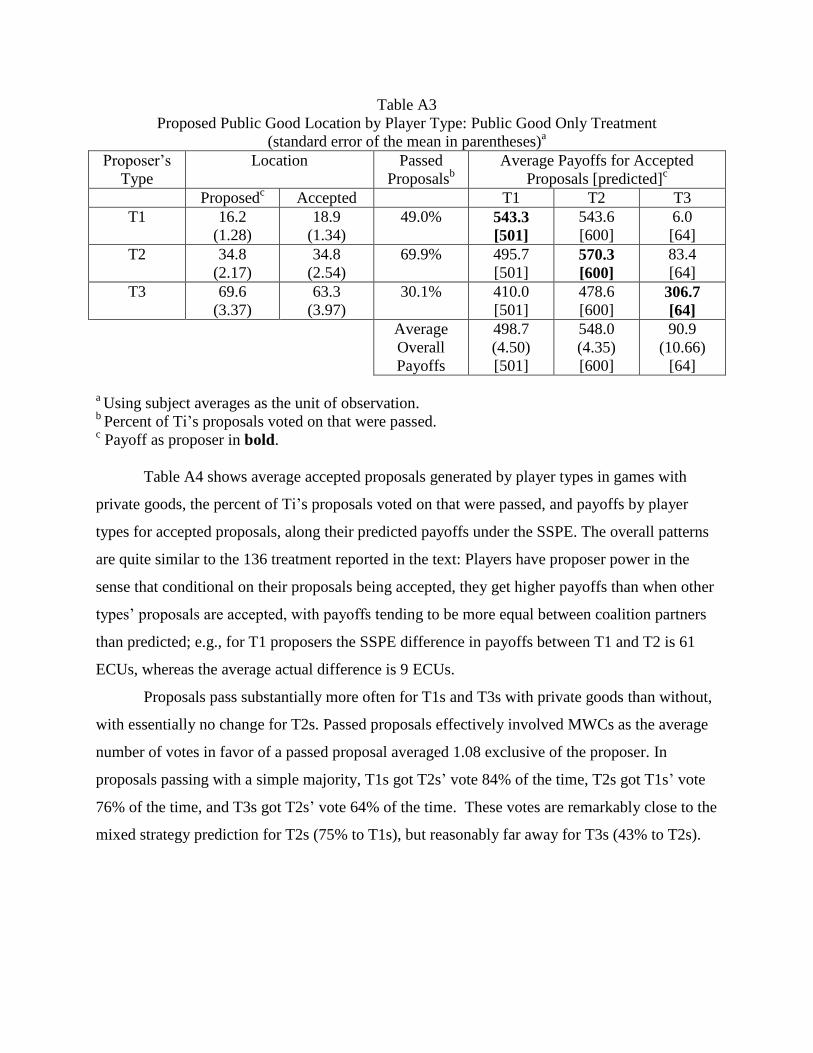
Table A3
Proposed Public Good Location by Player Type: Public Good Only Treatment
(standard error of the mean in parentheses)a
Proposer’s
Type
Location Passed
Proposalsb
Average Payoffs for Accepted
Proposals [predicted]c
Proposedc Accepted T1 T2 T3
T1 16.2
(1.28)
18.9
(1.34)
49.0% 543.3
[501]
543.6
[600]
6.0
[64]
T2 34.8
(2.17)
34.8
(2.54)
69.9% 495.7
[501] 570.3
[600]
83.4
[64]
T3 69.6
(3.37)
63.3
(3.97)
30.1% 410.0
[501]
478.6
[600] 306.7
[64]
Average
Overall
Payoffs
498.7
(4.50)
[501]
548.0
(4.35)
[600]
90.9
(10.66)
[64]
a Using subject averages as the unit of observation.
b Percent of Ti’s proposals voted on that were passed.
c Payoff as proposer in bold.
Table A4 shows average accepted proposals generated by player types in games with
private goods, the percent of Ti’s proposals voted on that were passed, and payoffs by player
types for accepted proposals, along their predicted payoffs under the SSPE. The overall patterns
are quite similar to the 136 treatment reported in the text: Players have proposer power in the
sense that conditional on their proposals being accepted, they get higher payoffs than when other
types’ proposals are accepted, with payoffs tending to be more equal between coalition partners
than predicted; e.g., for T1 proposers the SSPE difference in payoffs between T1 and T2 is 61
ECUs, whereas the average actual difference is 9 ECUs.
Proposals pass substantially more often for T1s and T3s with private goods than without,
with essentially no change for T2s. Passed proposals effectively involved MWCs as the average
number of votes in favor of a passed proposal averaged 1.08 exclusive of the proposer. In
proposals passing with a simple majority, T1s got T2s’ vote 84% of the time, T2s got T1s’ vote
76% of the time, and T3s got T2s’ vote 64% of the time. These votes are remarkably close to the
mixed strategy prediction for T2s (75% to T1s), but reasonably far away for T3s (43% to T2s).
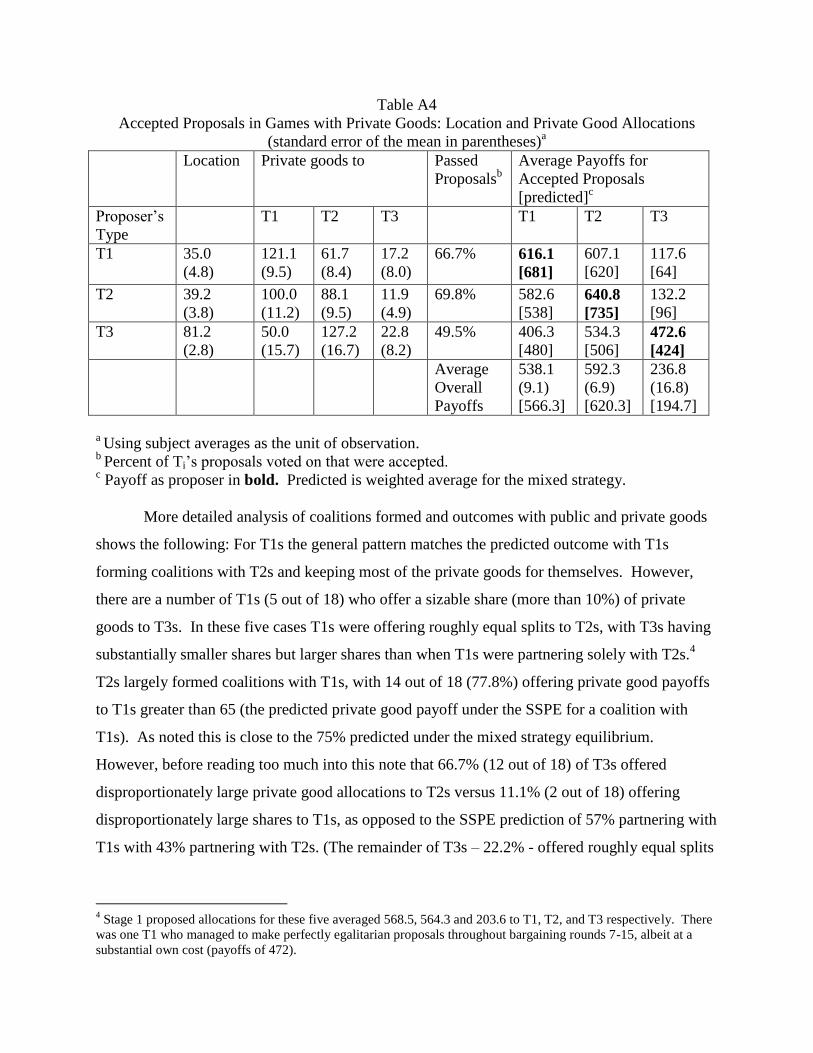
Table A4
Accepted Proposals in Games with Private Goods: Location and Private Good Allocations
(standard error of the mean in parentheses)a
Location Private goods to Passed
Proposalsb
Average Payoffs for
Accepted Proposals
[predicted]c
Proposer’s
Type
T1 T2 T3 T1 T2 T3
T1 35.0
(4.8)
121.1
(9.5)
61.7
(8.4)
17.2
(8.0)
66.7% 616.1
[681]
607.1
[620]
117.6
[64]
T2 39.2
(3.8)
100.0
(11.2)
88.1
(9.5)
11.9
(4.9)
69.8% 582.6
[538] 640.8
[735]
132.2
[96]
T3 81.2
(2.8)
50.0
(15.7)
127.2
(16.7)
22.8
(8.2)
49.5% 406.3
[480]
534.3
[506] 472.6
[424]
Average
Overall
Payoffs
538.1
(9.1)
[566.3]
592.3
(6.9)
[620.3]
236.8
(16.8)
[194.7]
a Using subject averages as the unit of observation.
b Percent of Ti’s proposals voted on that were accepted.
c Payoff as proposer in bold. Predicted is weighted average for the mixed strategy.
More detailed analysis of coalitions formed and outcomes with public and private goods
shows the following: For T1s the general pattern matches the predicted outcome with T1s
forming coalitions with T2s and keeping most of the private goods for themselves. However,
there are a number of T1s (5 out of 18) who offer a sizable share (more than 10%) of private
goods to T3s. In these five cases T1s were offering roughly equal splits to T2s, with T3s having
substantially smaller shares but larger shares than when T1s were partnering solely with T2s.4
T2s largely formed coalitions with T1s, with 14 out of 18 (77.8%) offering private good payoffs
to T1s greater than 65 (the predicted private good payoff under the SSPE for a coalition with
T1s). As noted this is close to the 75% predicted under the mixed strategy equilibrium.
However, before reading too much into this note that 66.7% (12 out of 18) of T3s offered
disproportionately large private good allocations to T2s versus 11.1% (2 out of 18) offering
disproportionately large shares to T1s, as opposed to the SSPE prediction of 57% partnering with
T1s with 43% partnering with T2s. (The remainder of T3s – 22.2% - offered roughly equal splits
4 Stage 1 proposed allocations for these five averaged 568.5, 564.3 and 203.6 to T1, T2, and T3 respectively. There
was one T1 who managed to make perfectly egalitarian proposals throughout bargaining rounds 7-15, albeit at a
substantial own cost (payoffs of 472).
of the private goods to T1s and T2s.5) Further, a sizable number of T3s kept more than 10% of
the private goods for themselves (61.1%; 11 out of 18). This last result is in marked contrast to
the 136 treatment where 25.0% (3 out of 12) of T3s kept more than 10% of private goods. This
difference is statistically significant at better than the 10% level (two-tailed binomial test),
suggesting that the one unit ECU cost to T1s for deviating from their preferred location, in
conjunction with the one unit value for the private good, helped to clarify the utility of using
private goods to buy off T1s.
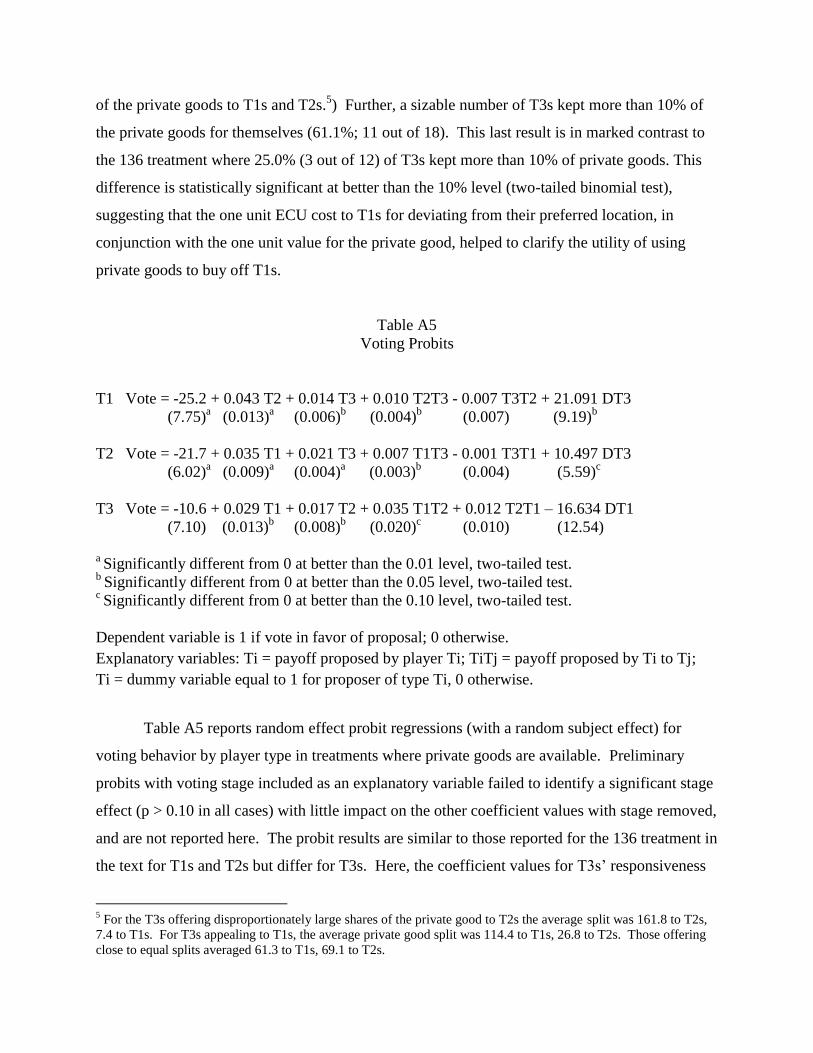
Table A5
Voting Probits
T1 Vote = -25.2 + 0.043 T2 + 0.014 T3 + 0.010 T2T3 - 0.007 T3T2 + 21.091 DT3
(7.75)a (0.013)
a (0.006)
b (0.004)
b (0.007) (9.19)
b
T2 Vote = -21.7 + 0.035 T1 + 0.021 T3 + 0.007 T1T3 - 0.001 T3T1 + 10.497 DT3
(6.02)a (0.009)
a (0.004)
a (0.003)
b (0.004) (5.59)
c
T3 Vote = -10.6 + 0.029 T1 + 0.017 T2 + 0.035 T1T2 + 0.012 T2T1 – 16.634 DT1
(7.10)
(0.013)b (0.008)
b (0.020)
c (0.010) (12.54)
a Significantly different from 0 at better than the 0.01 level, two-tailed test.
b Significantly different from 0 at better than the 0.05 level, two-tailed test.
c Significantly different from 0 at better than the 0.10 level, two-tailed test.
Dependent variable is 1 if vote in favor of proposal; 0 otherwise.
Explanatory variables: Ti = payoff proposed by player Ti; TiTj = payoff proposed by Ti to Tj;
Ti = dummy variable equal to 1 for proposer of type Ti, 0 otherwise.
Table A5 reports random effect probit regressions (with a random subject effect) for
voting behavior by player type in treatments where private goods are available. Preliminary
probits with voting stage included as an explanatory variable failed to identify a significant stage
effect (p > 0.10 in all cases) with little impact on the other coefficient values with stage removed,
and are not reported here. The probit results are similar to those reported for the 136 treatment in
the text for T1s and T2s but differ for T3s. Here, the coefficient values for T3s’ responsiveness
5 For the T3s offering disproportionately large shares of the private good to T2s the average split was 161.8 to T2s,
7.4 to T1s. For T3s appealing to T1s, the average private good split was 114.4 to T1s, 26.8 to T2s. Those offering
close to equal splits averaged 61.3 to T1s, 69.1 to T2s.
to own payoffs from T1s and T2s are positive and significant at the 5% level, with the magnitude
of the response to own payoffs similar to what is reported for T1s and T2s.
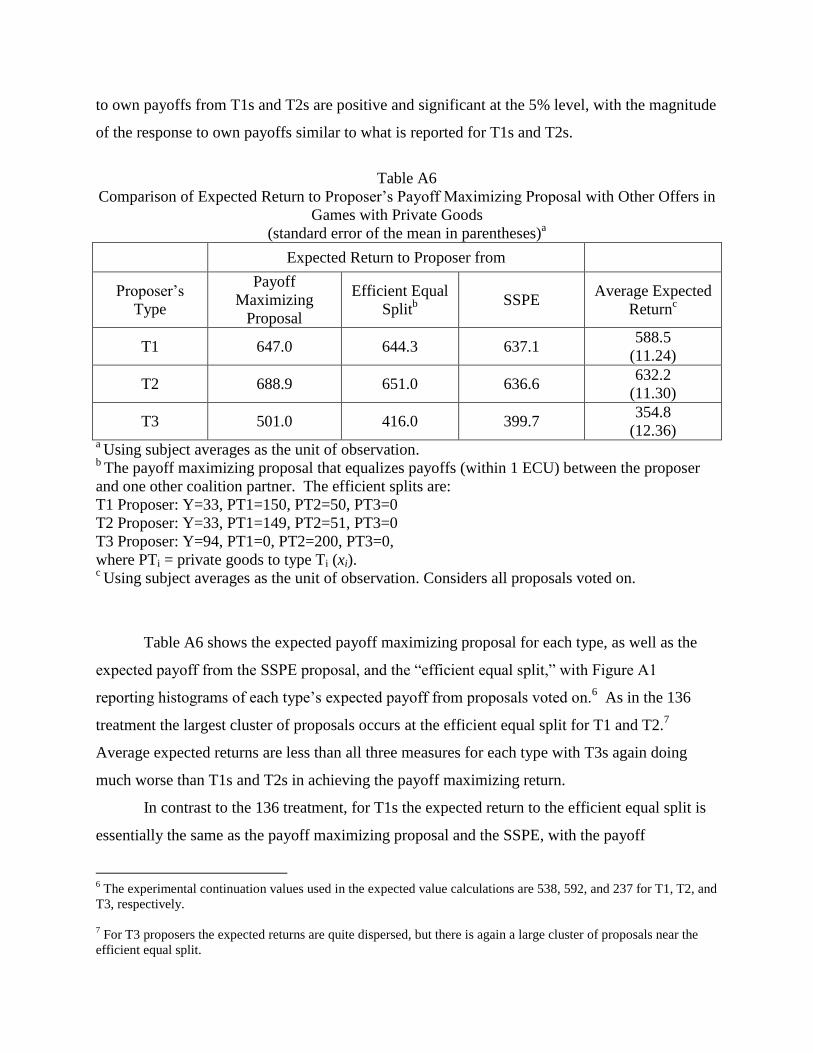
Table A6
Comparison of Expected Return to Proposer’s Payoff Maximizing Proposal with Other Offers in
Games with Private Goods
(standard error of the mean in parentheses)a
Expected Return to Proposer from
Proposer’s
Type
Payoff
Maximizing
Proposal
Efficient Equal
Splitb
SSPE Average Expected
Returnc
T1 647.0 644.3 637.1 588.5
(11.24)
T2 688.9 651.0 636.6 632.2
(11.30)
T3 501.0 416.0 399.7 354.8
(12.36) a Using subject averages as the unit of observation.
b The payoff maximizing proposal that equalizes payoffs (within 1 ECU) between the proposer
and one other coalition partner. The efficient splits are:
T1 Proposer: Y=33, PT1=150, PT2=50, PT3=0
T2 Proposer: Y=33, PT1=149, PT2=51, PT3=0
T3 Proposer: Y=94, PT1=0, PT2=200, PT3=0,
where PTi = private goods to type Ti (xi). c Using subject averages as the unit of observation. Considers all proposals voted on.
Table A6 shows the expected payoff maximizing proposal for each type, as well as the
expected payoff from the SSPE proposal, and the “efficient equal split,” with Figure A1
reporting histograms of each type’s expected payoff from proposals voted on.6 As in the 136
treatment the largest cluster of proposals occurs at the efficient equal split for T1 and T2.7
Average expected returns are less than all three measures for each type with T3s again doing
much worse than T1s and T2s in achieving the payoff maximizing return.
In contrast to the 136 treatment, for T1s the expected return to the efficient equal split is
essentially the same as the payoff maximizing proposal and the SSPE, with the payoff
6 The experimental continuation values used in the expected value calculations are 538, 592, and 237 for T1, T2, and
T3, respectively.
7 For T3 proposers the expected returns are quite dispersed, but there is again a large cluster of proposals near the
efficient equal split.
maximizing proposal substantially higher than the efficient equal split for T2s and T3s. The
difference between the efficient equal split and the payoff maximizing proposal for T2s is
substantially larger than any of the differences in the 136 treatment, with T2s having the highest
empirical continuation value of the three types in the present treatment.8 This relatively large
difference between the efficient equal split and the payoff maximizing proposal leaves
considerable room for improvement in expected payoffs above an equal split with T1s. The
result is as shown in Figure A2, a significant number (35%) of T2s’ proposals fall in the interval
between the expected value maximizing proposal and the efficient equal split with T1s.
8 The difference is 38 ECUs compared to 12 ECUs for T1s in the 136 treatment.
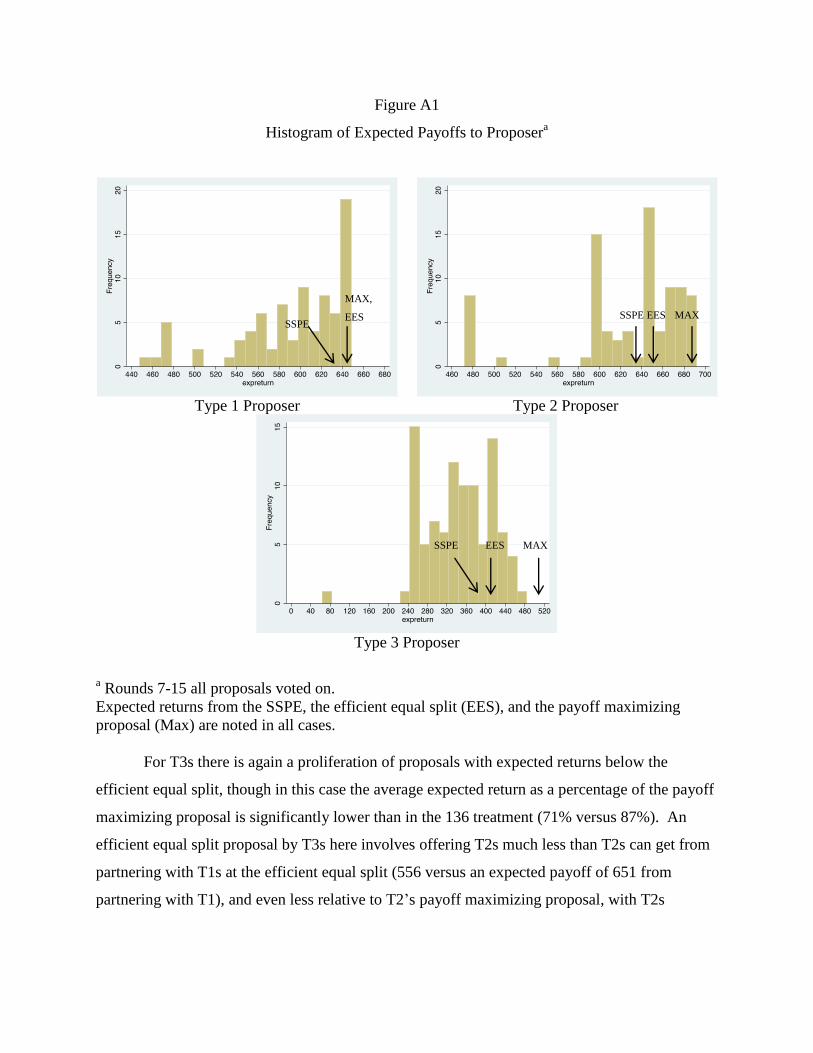
Figure A1
Histogram of Expected Payoffs to Proposera
Type 1 Proposer Type 2 Proposer
Type 3 Proposer
a Rounds 7-15 all proposals voted on.
Expected returns from the SSPE, the efficient equal split (EES), and the payoff maximizing
proposal (Max) are noted in all cases.
For T3s there is again a proliferation of proposals with expected returns below the
efficient equal split, though in this case the average expected return as a percentage of the payoff
maximizing proposal is significantly lower than in the 136 treatment (71% versus 87%). An
efficient equal split proposal by T3s here involves offering T2s much less than T2s can get from
partnering with T1s at the efficient equal split (556 versus an expected payoff of 651 from
partnering with T1), and even less relative to T2’s payoff maximizing proposal, with T2s
SSPE MAX
MAX,
EES SSPE
MAX SSPE EES
EES
rejecting T3’s proposed efficient equal splits more than 50% of the time.9 The data indicate that
T3s largely failed to respond to these high rejection rates with more favorable proposals to T2s
(or T1s), often proposing to give even more to themselves than the efficient equal split,
generating even higher rejection rates. In contrast, for T3s in the 136 treatment the efficient equal
split offered T1s a more favorable payoff relative to what T1s could get partnering with T2s (600
versus 634 for partnering with T2s at the efficient equal split), with the result that efficient equal
split was much less likely to be rejected (a 31% rejection rate).
Table A7 presents the results for political party formation which closely track the results
in the 136 treatment. As in the 136 treatment the parties between T1-T2 and T2-T3 are predicted
to be stable, but the only experimentally stable party is T1-T2. T2-T3 is not experimentally
stable because both T2 and T3 can do better partnering individually with T1. If the efficient
equal split is used to divide the gains from the party instead of the Nash bargaining solution, then
T1-T2 is again the only stable party. This is because T1 partnering with T2 yields 650.5 for each
player under the EES, which is greater than the payoffs each can get partnering with T3. T1
partnering with T3 yields 528 for each player under the EES, while T2 partnering with T3 yields
556.
9 This includes T3 proposals that yield T3 and one other coalition member payoffs within 10 ECUs of one another
and a policy location of at least 85 in order to approximate the efficient equal split.
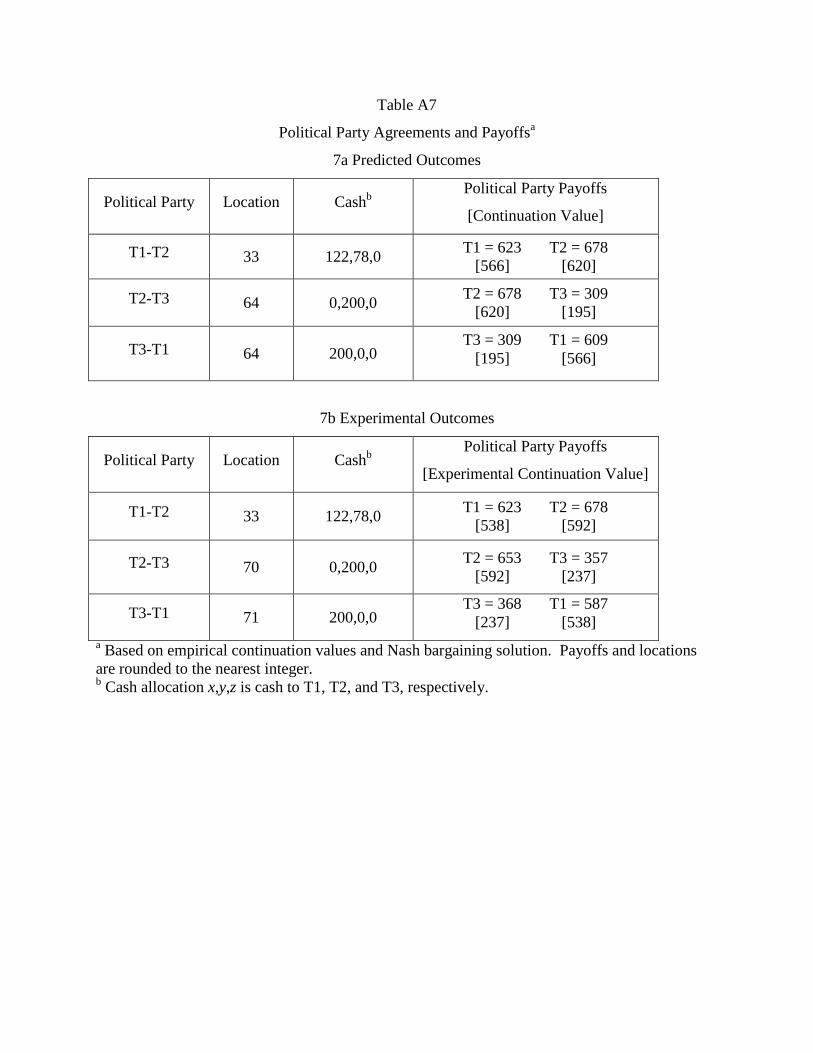
Table A7
Political Party Agreements and Payoffsa
7a Predicted Outcomes
Political Party Location Cashb
Political Party Payoffs
[Continuation Value]
T1-T2 33 122,78,0 T1 = 623 T2 = 678
[566] [620]
T2-T3 64 0,200,0 T2 = 678 T3 = 309
[620] [195]
T3-T1 64 200,0,0 T3 = 309 T1 = 609
[195] [566]
7b Experimental Outcomes
Political Party Location Cashb
Political Party Payoffs
[Experimental Continuation Value]
T1-T2 33 122,78,0 T1 = 623 T2 = 678
[538] [592]
T2-T3 70 0,200,0 T2 = 653 T3 = 357
[592] [237]
T3-T1 71 200,0,0 T3 = 368 T1 = 587
[237] [538]
a Based on empirical continuation values and Nash bargaining solution. Payoffs and locations
are rounded to the nearest integer. b Cash allocation x,y,z is cash to T1, T2, and T3, respectively.
(yi, bi) = (0, 1); (33, 3); (100, 6) Fixed Types
Instructions
This is an experiment in the economics of decision making. Funding for this research has been provided by the
Ohio State University. The instructions are simple, and if you follow them carefully and make good decisions you may
earn a CONSIDERABLE AMOUNT OF MONEY which will be PAID TO YOU IN CASH at the end of the experiment.
1. In this experiment you will act as voters deciding between different policy proposals in a series of bargaining
rounds. In each round you will be in a group of 3 voters. Proposals will be voted up or down (accepted or
rejected) by majority rule; i.e., for proposals to pass they must get 2 or more votes.
2. A proposal consists of a location on a line between 0 and 100. Each voter has a different ideal location on the
line. One way to think about this is that you are choosing a proposed location of a bus stop on a street in your
neighborhood. The numbers 0 to 100 are locations along the street where the bus stop can be placed. Voters each
have a different ideal location for the bus stop. In addition, each of them incurs a “walking cost” in terms of how
far/hard it is for them to walk to the actual location from their ideal location.
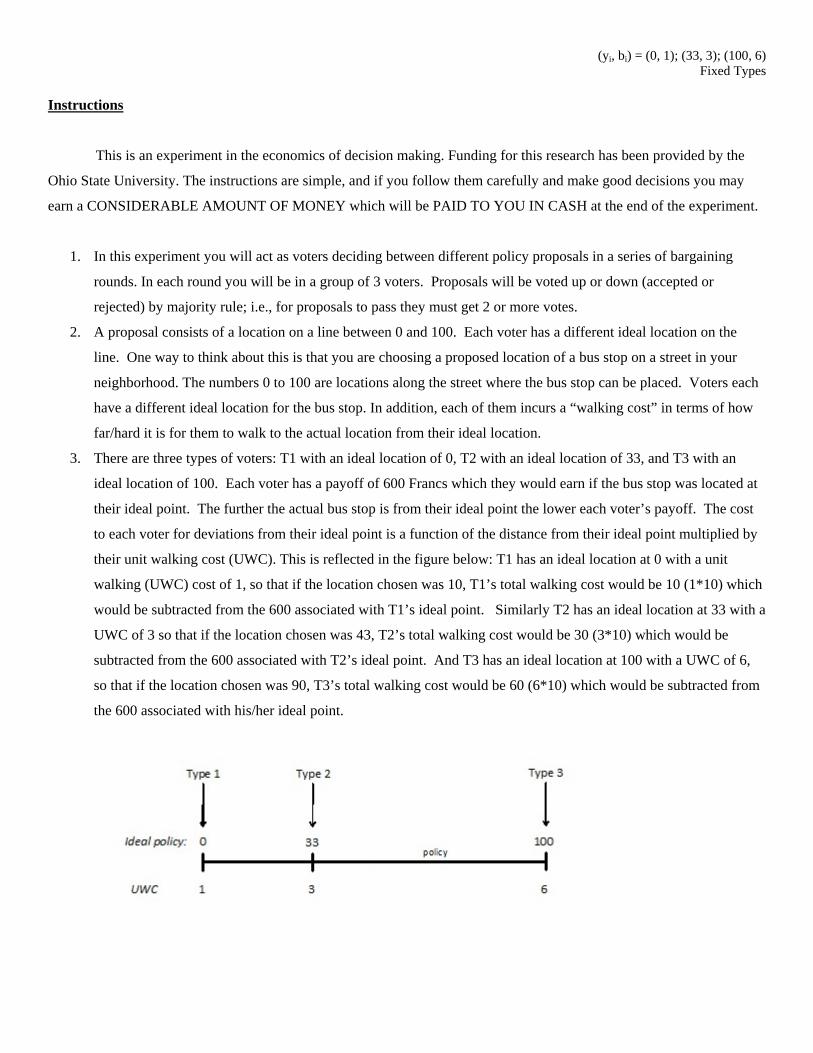
3. There are three types of voters: T1 with an ideal location of 0, T2 with an ideal location of 33, and T3 with an
ideal location of 100. Each voter has a payoff of 600 Francs which they would earn if the bus stop was located at
their ideal point. The further the actual bus stop is from their ideal point the lower each voter’s payoff. The cost
to each voter for deviations from their ideal point is a function of the distance from their ideal point multiplied by
their unit walking cost (UWC). This is reflected in the figure below: T1 has an ideal location at 0 with a unit
walking (UWC) cost of 1, so that if the location chosen was 10, T1’s total walking cost would be 10 (1*10) which
would be subtracted from the 600 associated with T1’s ideal point. Similarly T2 has an ideal location at 33 with a
UWC of 3 so that if the location chosen was 43, T2’s total walking cost would be 30 (3*10) which would be
subtracted from the 600 associated with T2’s ideal point. And T3 has an ideal location at 100 with a UWC of 6,
so that if the location chosen was 90, T3’s total walking cost would be 60 (6*10) which would be subtracted from
the 600 associated with his/her ideal point.
(yi, bi) = (0, 1); (33, 3); (100, 6) Fixed Types
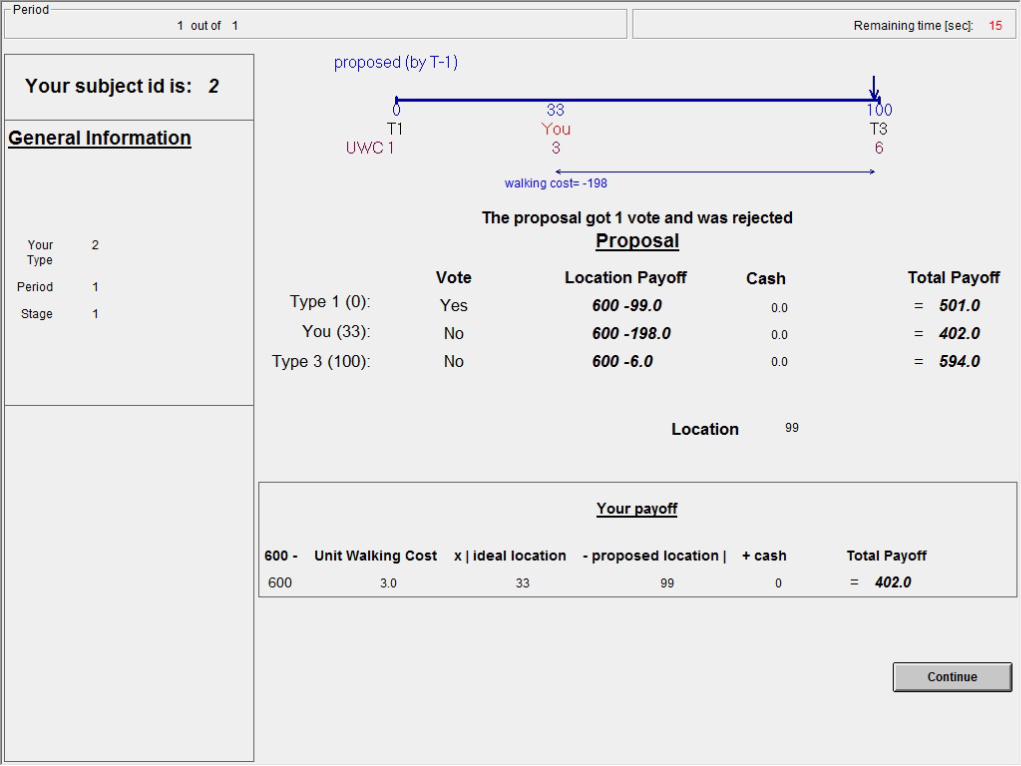
To summarize: Payoffs to each of you for any given proposal depend on your ideal point, the distance between
the proposed location from your ideal point, and your unit walking costs (UWC) according to the following
payoff function:
Payoff = 600 – UWC x | ideal location – proposed location |
Don’t worry about trying to calculate this – the computer will do it automatically for you. Note that for T2 it does
not matter if the deviations are to the right or the left of their ideal point, the cost is the same.
4. In each round everyone will propose an ideal location with one proposal, selected at random, to be voted on. The
proposal, your walking cost, and the walking costs for all other voters will be posted on your computer screens
prior to voting.
If the proposal passes (gets 2 or more votes) – we will move on to the next bargaining round.
If the proposal is defeated (gets less than 2 votes), there will be a call for new proposals and the process will
repeat itself. There is no direct cost to any player when a proposal is rejected. It just means the process will
repeat itself until a proposal passes.
5. Player types will be determined randomly at the beginning of the experiment and will remain the same throughout
the experiment.
6. At each stage in the bargaining process you will have 30 seconds to make your proposal after which you will be
prompted to make a decision. You will also have 60 seconds to vote on the proposal chosen for your group.
7. There are a total of ____ voters in the room. In each round you will be assigned to one of ___ groups of three
voters. Assignments to voting groups will vary randomly from round to round. However, in each round and in
each group, one player will always be type 1, one will by type 2, and one will be type 3.
8. There will be a total of 16 rounds, one practice round and 15 rounds played for cash.
9. At the conclusion of the experiment, one of the 15 rounds played for cash will be randomly selected by computer,
and the money distributed according to the proposal that passed in that round. Thus, in each round, you should
treat it as the round that you will be paid off on. Francs will be converted into dollars the rate of 3 cents per franc.
All payments will be in CASH. In addition, each of you will receive a $6 participation fee.
Are there any questions?

(yi, bi) = (0, 1); (33, 3); (100, 6) Fixed Types
An example might help to clarify the voting and payoff process. The example is not intended to be realistic, just to give
you an idea how the process works.
Example 1. Suppose Subject 3’s proposal is chosen for the group and he proposes a policy of 80. This would yield
payoffs of 520 francs (600 – 1*| 0 – 80 |) for Type 1, 459 francs (600 – 3*| 33 – 80 |) for Type 2, and
480 francs (600 – 6*| 100 – 80 |) for Type 3. Now the votes could be accept, accept, reject – once again ordered by
subject number – in which case the proposal would pass as it has a majority 2 of 3 votes. As such, if this round were paid
off on each subject would get the converted dollar amounts from these payoffs.
Alternatively, the votes could be accept, reject, reject so the proposal does not receive a majority, and the round would go
to the next stage. A new set of policy proposals would be called for, one of which would be selected at random to be voted
on and the voting process repeats itself.
As you can see there are many possibilities here. What should you do? If we knew the answer to this question we would
not have to conduct the experiment. You should do what you think is best.
We are going to start now – please wait for my instructions before doing anything. Also it’s important at this point not to
talk to each other or to play with the computer/open up different browsers as this may crash the system which holds things
up for everyone in the room. As you will see there are inevitably delays as we go along as we must wait for all groups to
finish before moving to the next round – just think about your strategy for the proceedings at hand or deep philosophical
thoughts or about where you would rather be with the money you will earn – just don’t play with the browser.
Also please turn you cell phones off at this point.
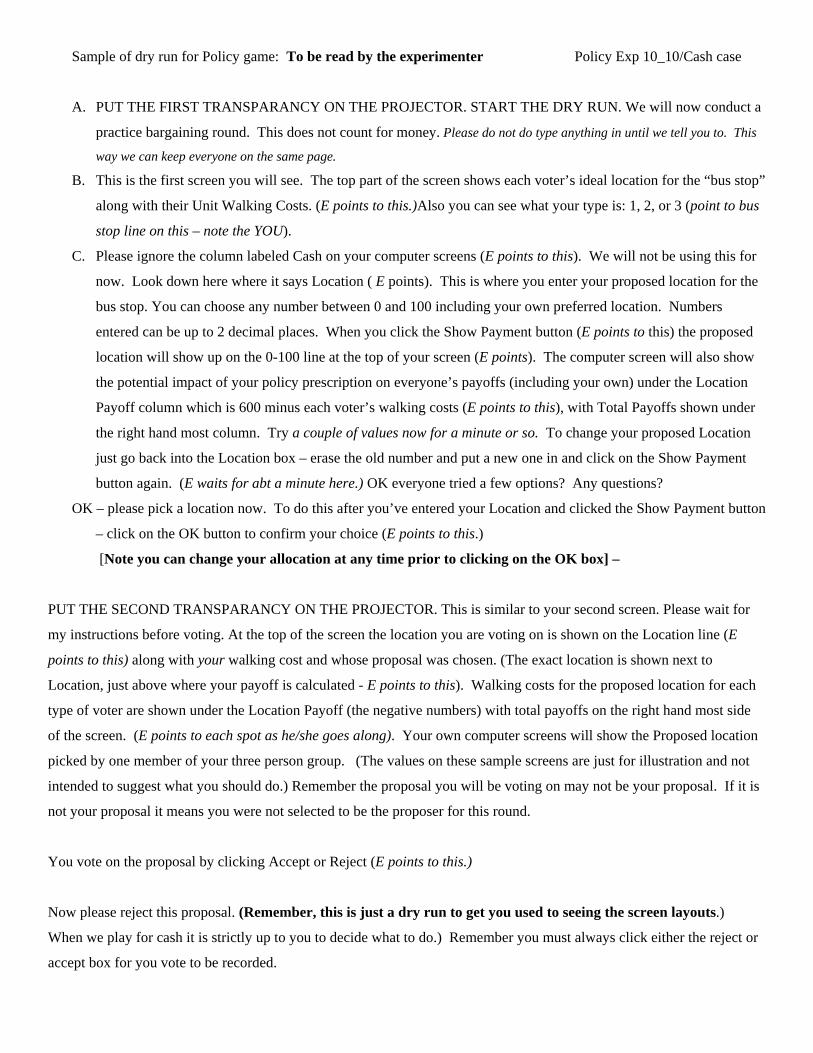
Sample of dry run for Policy game: To be read by the experimenter Policy Exp 10_10/Cash case
A. PUT THE FIRST TRANSPARANCY ON THE PROJECTOR. START THE DRY RUN. We will now conduct a
practice bargaining round. This does not count for money. Please do not do type anything in until we tell you to. This
way we can keep everyone on the same page.
B. This is the first screen you will see. The top part of the screen shows each voter’s ideal location for the “bus stop”
along with their Unit Walking Costs. (E points to this.)Also you can see what your type is: 1, 2, or 3 (point to bus
stop line on this – note the YOU).
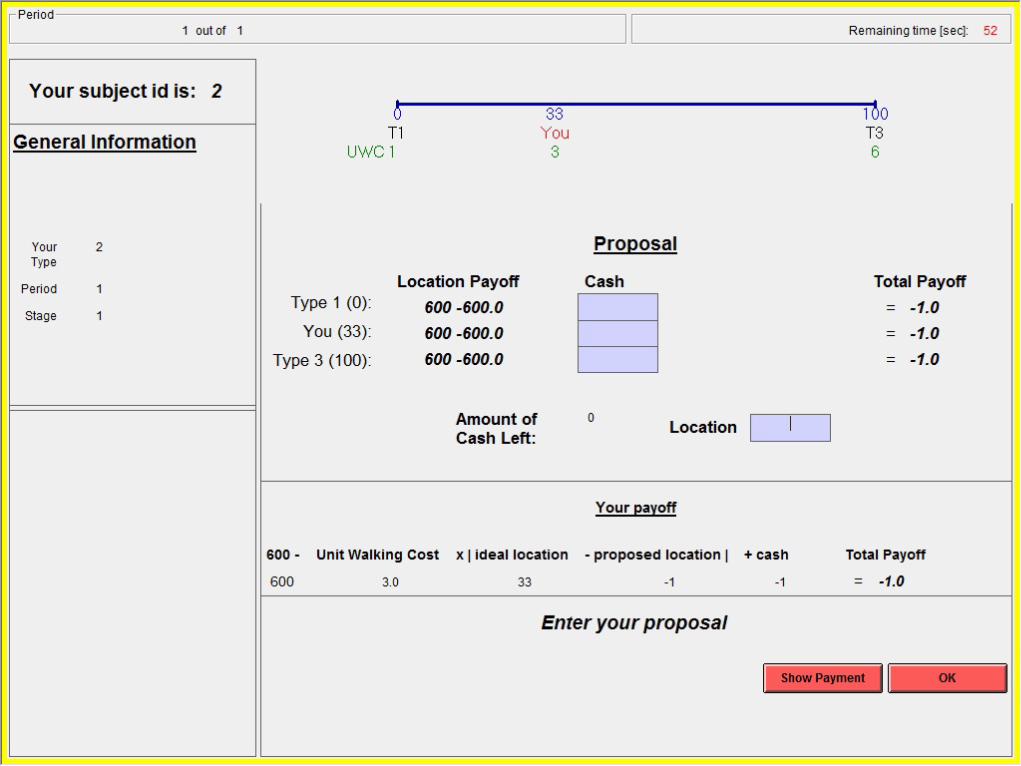
C. Please ignore the column labeled Cash on your computer screens (E points to this). We will not be using this for
now. Look down here where it says Location ( E points). This is where you enter your proposed location for the
bus stop. You can choose any number between 0 and 100 including your own preferred location. Numbers
entered can be up to 2 decimal places. When you click the Show Payment button (E points to this) the proposed
location will show up on the 0-100 line at the top of your screen (E points). The computer screen will also show
the potential impact of your policy prescription on everyone’s payoffs (including your own) under the Location
Payoff column which is 600 minus each voter’s walking costs (E points to this), with Total Payoffs shown under
the right hand most column. Try a couple of values now for a minute or so. To change your proposed Location
just go back into the Location box – erase the old number and put a new one in and click on the Show Payment
button again. (E waits for abt a minute here.) OK everyone tried a few options? Any questions?
OK – please pick a location now. To do this after you’ve entered your Location and clicked the Show Payment button
– click on the OK button to confirm your choice (E points to this.)
[Note you can change your allocation at any time prior to clicking on the OK box] –
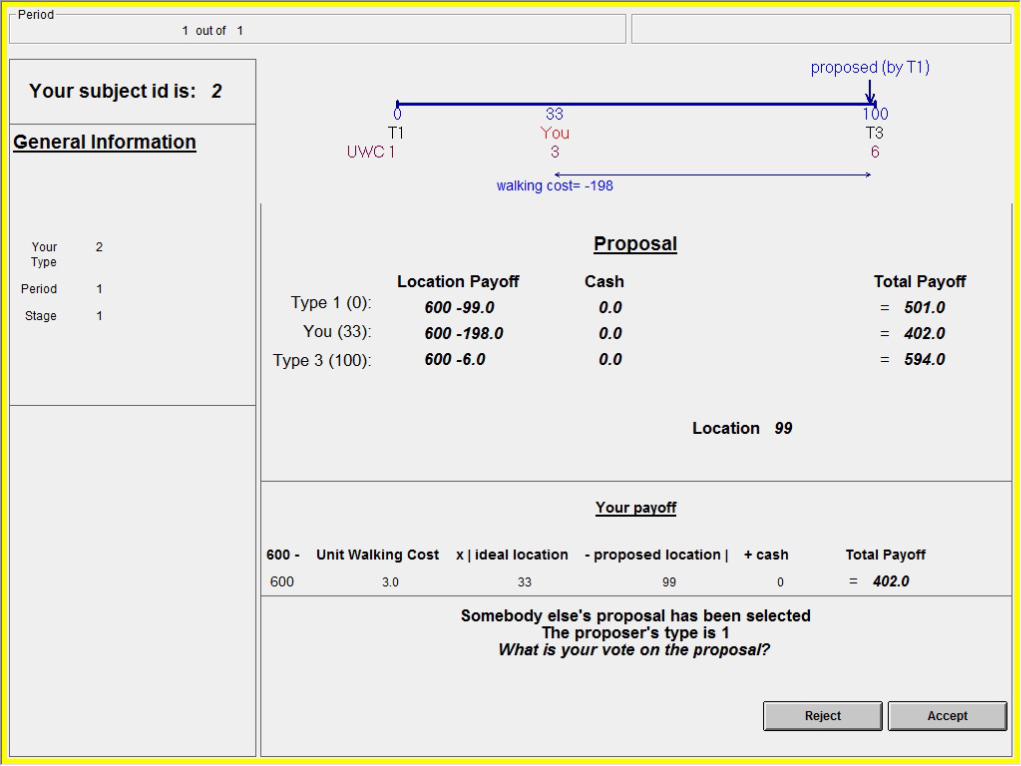
PUT THE SECOND TRANSPARANCY ON THE PROJECTOR. This is similar to your second screen. Please wait for
my instructions before voting. At the top of the screen the location you are voting on is shown on the Location line (E
points to this) along with your walking cost and whose proposal was chosen. (The exact location is shown next to
Location, just above where your payoff is calculated - E points to this). Walking costs for the proposed location for each
type of voter are shown under the Location Payoff (the negative numbers) with total payoffs on the right hand most side
of the screen. (E points to each spot as he/she goes along). Your own computer screens will show the Proposed location
picked by one member of your three person group. (The values on these sample screens are just for illustration and not
intended to suggest what you should do.) Remember the proposal you will be voting on may not be your proposal. If it is
not your proposal it means you were not selected to be the proposer for this round.
You vote on the proposal by clicking Accept or Reject (E points to this.)
Now please reject this proposal. (Remember, this is just a dry run to get you used to seeing the screen layouts.)
When we play for cash it is strictly up to you to decide what to do.) Remember you must always click either the reject or
accept box for you vote to be recorded.
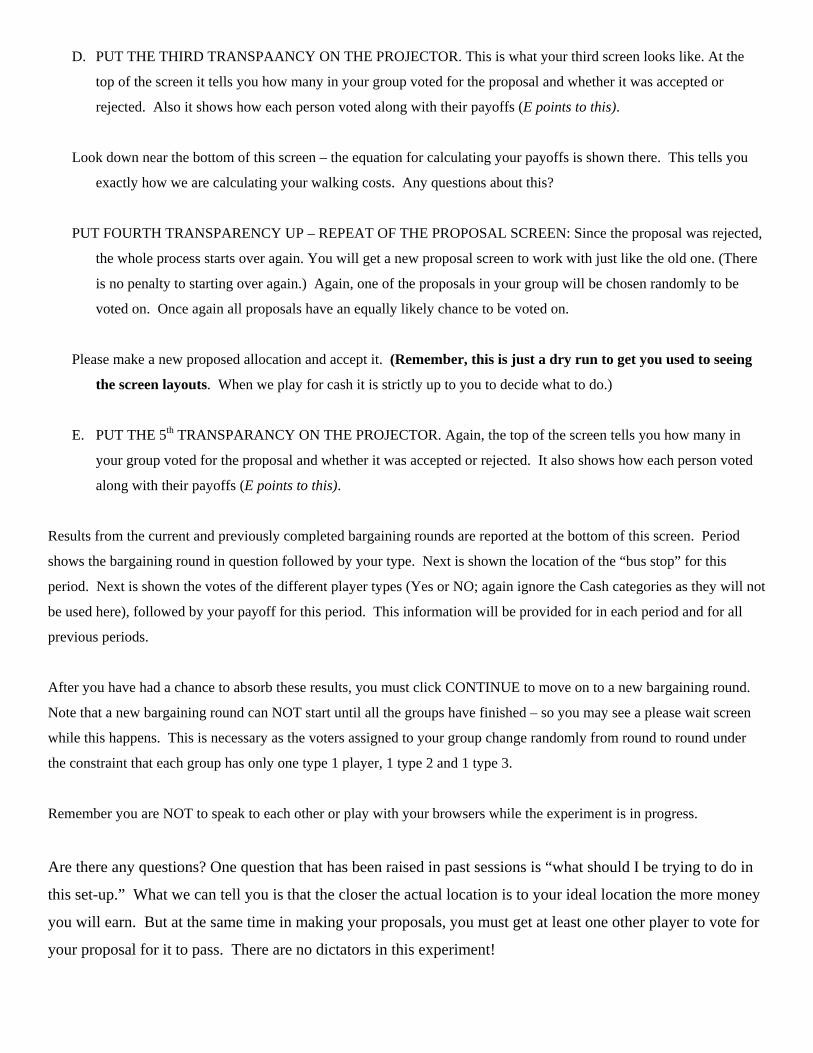
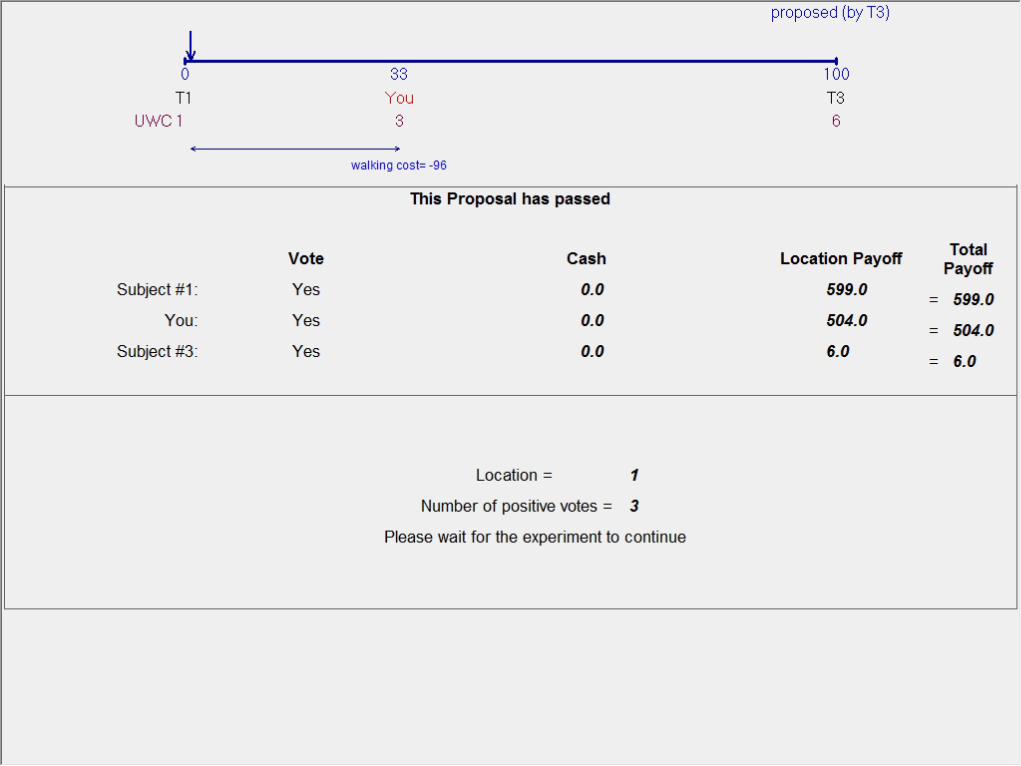
D. PUT THE THIRD TRANSPAANCY ON THE PROJECTOR. This is what your third screen looks like. At the
top of the screen it tells you how many in your group voted for the proposal and whether it was accepted or
rejected. Also it shows how each person voted along with their payoffs (E points to this).
Look down near the bottom of this screen – the equation for calculating your payoffs is shown there. This tells you
exactly how we are calculating your walking costs. Any questions about this?
PUT FOURTH TRANSPARENCY UP – REPEAT OF THE PROPOSAL SCREEN: Since the proposal was rejected,
the whole process starts over again. You will get a new proposal screen to work with just like the old one. (There
is no penalty to starting over again.) Again, one of the proposals in your group will be chosen randomly to be
voted on. Once again all proposals have an equally likely chance to be voted on.
Please make a new proposed allocation and accept it. (Remember, this is just a dry run to get you used to seeing
the screen layouts. When we play for cash it is strictly up to you to decide what to do.)
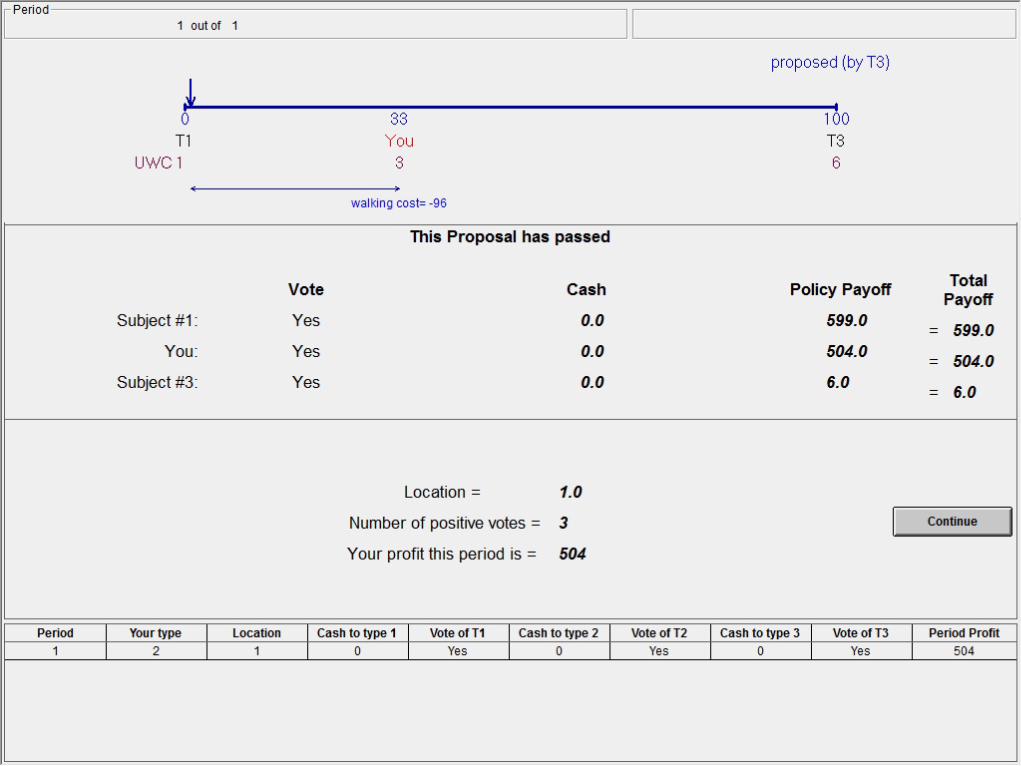
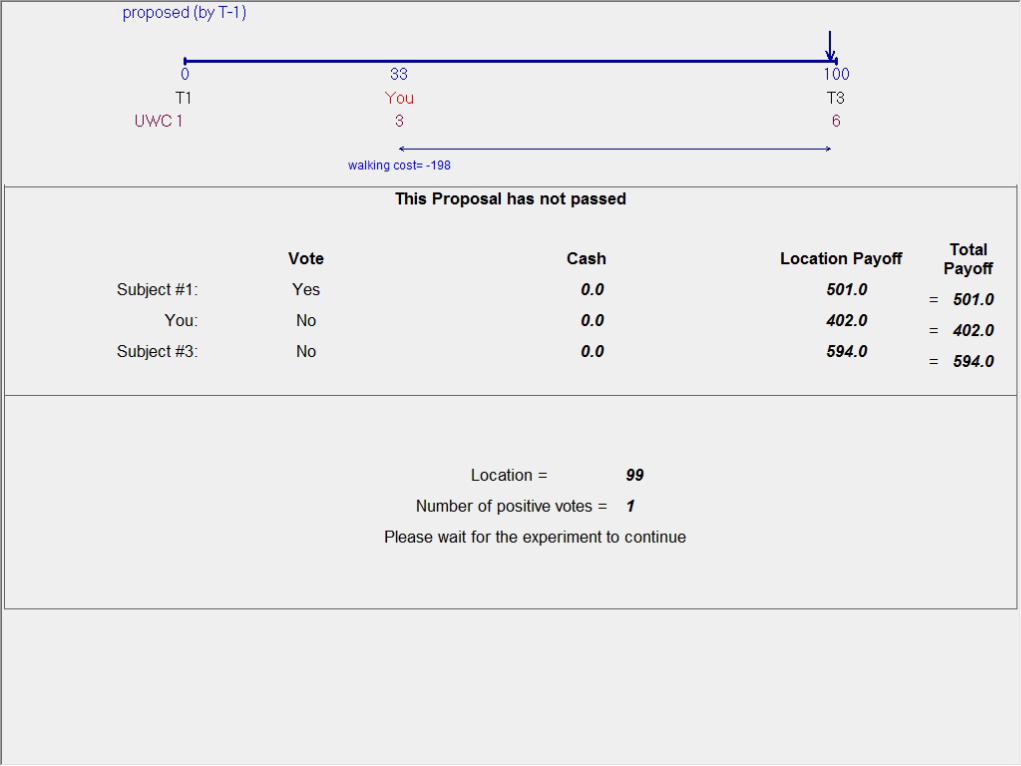
E. PUT THE 5th TRANSPARANCY ON THE PROJECTOR. Again, the top of the screen tells you how many in
your group voted for the proposal and whether it was accepted or rejected. It also shows how each person voted
along with their payoffs (E points to this).
Results from the current and previously completed bargaining rounds are reported at the bottom of this screen. Period
shows the bargaining round in question followed by your type. Next is shown the location of the “bus stop” for this
period. Next is shown the votes of the different player types (Yes or NO; again ignore the Cash categories as they will not
be used here), followed by your payoff for this period. This information will be provided for in each period and for all
previous periods.
After you have had a chance to absorb these results, you must click CONTINUE to move on to a new bargaining round.
Note that a new bargaining round can NOT start until all the groups have finished – so you may see a please wait screen
while this happens. This is necessary as the voters assigned to your group change randomly from round to round under
the constraint that each group has only one type 1 player, 1 type 2 and 1 type 3.
Remember you are NOT to speak to each other or play with your browsers while the experiment is in progress.
Are there any questions? One question that has been raised in past sessions is “what should I be trying to do in
this set-up.” What we can tell you is that the closer the actual location is to your ideal location the more money
you will earn. But at the same time in making your proposals, you must get at least one other player to vote for
your proposal for it to pass. There are no dictators in this experiment!

OK – we will have two practice rounds after which we will change things a bit and play for cash. Please treat
the dry runs seriously as the experience should help you when we start to play for cash.
Fixed types/Y 100
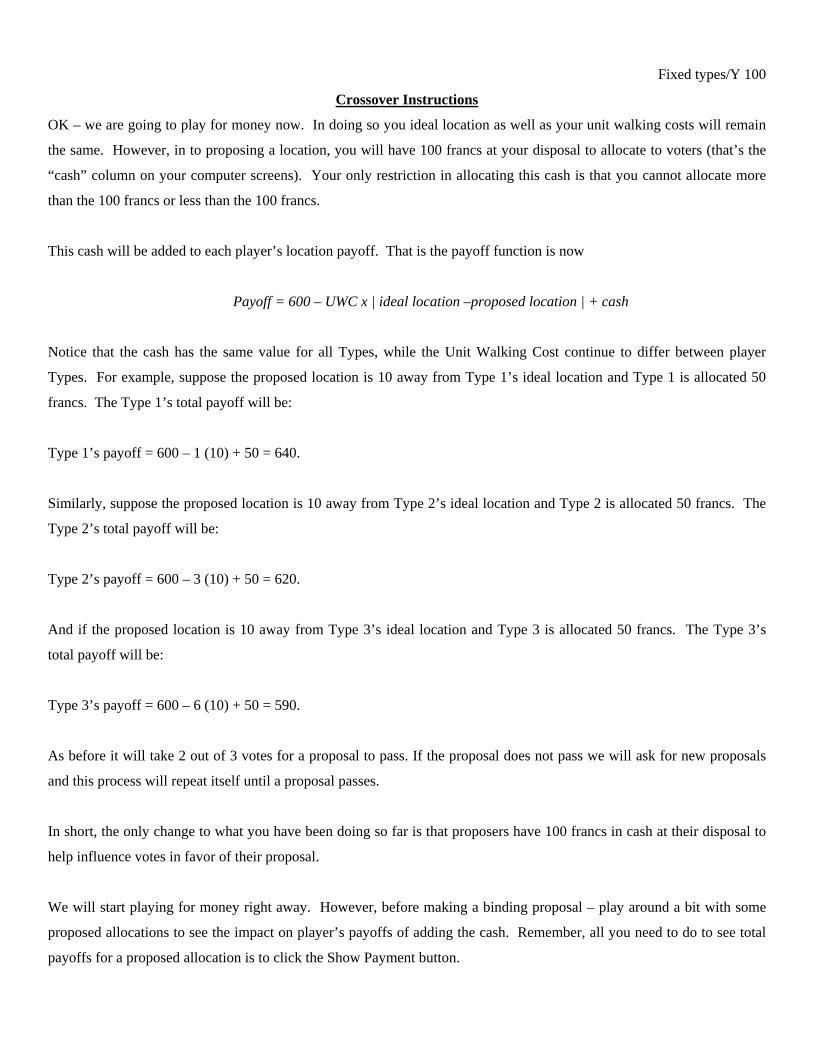
Crossover Instructions
OK – we are going to play for money now. In doing so you ideal location as well as your unit walking costs will remain
the same. However, in to proposing a location, you will have 100 francs at your disposal to allocate to voters (that’s the
“cash” column on your computer screens). Your only restriction in allocating this cash is that you cannot allocate more
than the 100 francs or less than the 100 francs.
This cash will be added to each player’s location payoff. That is the payoff function is now
Payoff = 600 – UWC x | ideal location –proposed location | + cash
Notice that the cash has the same value for all Types, while the Unit Walking Cost continue to differ between player
Types. For example, suppose the proposed location is 10 away from Type 1’s ideal location and Type 1 is allocated 50
francs. The Type 1’s total payoff will be:
Type 1’s payoff = 600 – 1 (10) + 50 = 640.
Similarly, suppose the proposed location is 10 away from Type 2’s ideal location and Type 2 is allocated 50 francs. The
Type 2’s total payoff will be:
Type 2’s payoff = 600 – 3 (10) + 50 = 620.
And if the proposed location is 10 away from Type 3’s ideal location and Type 3 is allocated 50 francs. The Type 3’s
total payoff will be:
Type 3’s payoff = 600 – 6 (10) + 50 = 590.
As before it will take 2 out of 3 votes for a proposal to pass. If the proposal does not pass we will ask for new proposals
and this process will repeat itself until a proposal passes.
In short, the only change to what you have been doing so far is that proposers have 100 francs in cash at their disposal to
help influence votes in favor of their proposal.
We will start playing for money right away. However, before making a binding proposal – play around a bit with some
proposed allocations to see the impact on player’s payoffs of adding the cash. Remember, all you need to do to see total
payoffs for a proposed allocation is to click the Show Payment button.
OK has everyone had a chance try out a couple of allocations? Are there any questions?
We’ll play a total of 15 rounds for money this way.
At the conclusion of the experiment, one of these 15 rounds will be randomly selected by computer, and the money
distributed according to the proposal that passed in that round. Thus, in each round, you should treat it as the round that
you will be paid off on. Francs will be converted into dollars the rate of 3 cents per franc. All payments will be in CASH.
In addition, each of you will receive a $6 participation fee.