Embed Size (px)
Citation preview

Integra Realty Resources Phoenix
Appraisal of Real Property
Former Industrial Warehouse City of Buckeye Owned Property 301 East Centre Avenue Buckeye, Maricopa County, Arizona 85326
Prepared For: City of Buckeye
Date of the Report: June 11, 2021
Report Format: Appraisal Report
IRR - Phoenix File Number: 132-21-192

Subject Photographs
Former Industrial Warehouse 301 East Centre Avenue Buckeye, Arizona

Aerial Photograph

Integra Realty Resources 2999 N. 44th Street T 602.266.5599 Phoenix Suite 512 F 602.266.1515 Phoenix, AZ 85018 www.irr.com
June 11, 2021 David Roderique Economic Development Director City of Buckeye 530 East Monroe Avenue Buckeye, AZ 85326 SUBJECT: Market Value Appraisal
Former Industrial Warehouse 301 East Centre Avenue Buckeye, Maricopa County, Arizona 85326 IRR - Phoenix File No. 132-21-192
Dear Mr. Roderique:
Integra Realty Resources – Phoenix is pleased to submit the accompanying appraisal of the referenced property. The purpose of the appraisal is to develop an opinion of the market value as is, pertaining to the fee simple interest in the property.
The client for the assignment is City of Buckeye. The intended user of this report is the client. The intended use of the report is for property disposition purposes. No other party or parties may use or rely on the information, opinions, and conclusions contained in this report.
The subject is a parcel of vacant land containing an area of 6.51 acres or 283,701 square feet. The property is zoned NMU, Neighborhood Mixed Use, which permits animal pet shop, retail; Art gallery or museum; Bar, lounge, or tavern; Bed and breakfast; Catering service; Community playfields and parks; Day care, commercial; Day care, residential; Dry cleaning and laundry service; Dwelling, duplex; Dwelling, multi-family; Financial institution; Fitness and recreational sports center; General retail; Medical office or clinic; Office, business or professional; Public safety facility; Restaurant; Social service facility; Utility facility, minor; Vehicle service and repair, minor; Veterinary clinic.
The appraisal conforms to the Uniform Standards of Professional Appraisal Practice (USPAP), the Code of Professional Ethics and Standards of Professional Practice of the Appraisal Institute, and applicable state appraisal regulations.

David Roderique City of Buckeye June 11, 2021 Page 2
Standards Rule 2-2 (Content of a Real Property Appraisal Report) contained in the Uniform Standards of Professional Appraisal Practice (USPAP) requires each written real property appraisal report to be prepared as either an Appraisal Report or a Restricted Appraisal Report. This report is prepared as an Appraisal Report as defined by USPAP under Standards Rule 2-2(a), and incorporates practical explanation of the data, reasoning, and analysis that were used to develop the opinion of value.
Based on the valuation analysis in the accompanying report, and subject to the definitions, assumptions, and limiting conditions expressed in the report, the concluded opinions of value are as follows:
Value ConclusionValue Type & Appraisal Premise Interest Appraised Date of Value Value ConclusionMarket Value As Is Fee Simple May 29, 2021 $820,000
Extraordinary Assumptions and Hypothetical Conditions
1. None
1. None
The use of any extraordinary assumption or hypothetical condition may have affected the assignment results.
The value conclusions are based on the following hypothetical conditions. A hypothetical condition is a condition, directly related to a specific assignment, which is contrary to what is known by the appraiser to exist on the effective date of the assignment results, but is used for the purpose of analysis.
The value conclusions are subject to the following extraordinary assumptions. An extraordinary assumption is an assignment-specific assumption as of the effective date regarding uncertain information used in an analysis which, if found to be false, could alter the appraiser’s opinions or conclusions.
If you have any questions or comments, please contact the undersigned. Thank you for the opportunity to be of service.
Respectfully submitted,
Integra Realty Resources - Phoenix
William M. Dominick Arizona Certified General Real Estate Appraiser #30129 Telephone: 602-648-4302 Email: [email protected]

Table of Contents
Former Industrial Warehouse
Quality Assurance 1
Executive Summary 2
Identification of the Appraisal Problem 3 Subject Description 3 Sale History 3 Pending Transactions 3 Appraisal Purpose 4 Value Type Definitions 4 Appraisal Premise Definitions 4 Property Rights Definitions 4 Client and Intended User(s) 5 Intended Use 5 Applicable Requirements 5 Report Format 5 Prior Services 5 Appraiser Competency 5
Scope of Work 6
Economic Analysis 8 Phoenix MSA Area Analysis 8 Surrounding Area Analysis 13 Multifamily Market Analysis 17
Class B/C Multifamily Overview 18 Comparable Property Analysis 27
Property Analysis 30 Land Description and Analysis 30 Real Estate Taxes 40 Highest and Best Use 42
Valuation 44 Valuation Methodology 44 Sales Comparison Approach 45
Analysis and Adjustment of Sales 48 Market Value Conclusion – As Is 51
Reconciliation and Conclusion of Value 52 Exposure Time 52 Marketing Time 52
Certification 53
Assumptions and Limiting Conditions 54
Addenda A. Appraiser Qualifications B. IRR Quality Assurance Survey C. Definitions D. Demolition Estimates E. Comparable Data

Quality Assurance 1
Former Industrial Warehouse
Quality Assurance
IRR Quality Assurance Program At IRR, delivering a quality report is a top priority. Integra has an internal Quality Assurance Program in which managers review material and pass an exam in order to attain IRR Certified Reviewer status. By policy, every Integra valuation assignment is assessed by an IRR Certified Reviewer who holds the MAI designation, or is, at a minimum, a named Director with at least ten years of valuation experience.
This quality assurance assessment consists of reading the report and providing feedback on its quality and consistency. All feedback from the IRR Certified Reviewer is then addressed internally prior to delivery. The intent of this internal assessment process is to maintain report quality.
Designated IRR Certified Reviewer An internal quality assurance assessment was conducted by an IRR Certified Reviewer prior to delivery of this appraisal report. This assessment should not be construed as an appraisal review as defined by USPAP.

Executive Summary 2
Former Industrial Warehouse
Executive Summary Property NameAddress
Property TypeOwner of RecordTax IDLand Area 6.51 acres; 283,701 SFZoning DesignationHighest and Best UseExposure Time; Marketing Period 6 to 12 months; 6 to 12 monthsEffective Date of the Appraisal May 29, 2021Date of the Report June 11, 2021Property Interest AppraisedSales Comparison Approach
Number of Sales 4Range of Sale Dates Nov 20 to May 21Range of Prices per SF (Unadjusted) $4.90 - $6.89Indicated Value Before Final Adjustment $1,517,800 ($5.35/SF)Final Adjustment ($ Amount) -$700,000Description of Final Adjustment
Market Value Conclusion $820,000 ($2.89/SF)
City of Buckeye400-28-001G
Former Industrial Warehouse301 East Centre Avenue Buckeye, Maricopa County, Arizona 85326Land - Light Manufacturing
Demolition of Existing Improvements, Entrepreneurial Reward
The values reported above are subject to the definitions, assumptions, and limiting conditions set forth in the accompanying report of which this summary is a part. No party other than City of Buckeye may use or rely on the information, opinions, and conclusions contained in the report. It is assumed that the users of the report have read the entire report, including all of the definitions, assumptions, and limiting conditions contained therein.
NMU, Neighborhood Mixed UseMixed use - predominantly residential
Fee Simple
Extraordinary Assumptions and Hypothetical Conditions
1. None
1. None
The use of any extraordinary assumption or hypothetical condition may have affected the assignment results.
The value conclusions are based on the following hypothetical conditions. A hypothetical condition is a condition, directly related to a specific assignment, which is contrary to what is known by the appraiser to exist on the effective date of the assignment results, but is used for the purpose of analysis.
The value conclusions are subject to the following extraordinary assumptions. An extraordinary assumption is an assignment-specific assumption as of the effective date regarding uncertain information used in an analysis which, if found to be false, could alter the appraiser’s opinions or conclusions.

Identification of the Appraisal Problem 3
Former Industrial Warehouse
Identification of the Appraisal Problem
Subject Description The subject is a parcel of vacant land containing an area of 6.51 acres or 283,701 square feet. The property is zoned NMU, Neighborhood Mixed Use, which permits animal pet shop, retail; Art gallery or museum; Bar, lounge, or tavern; Bed and breakfast; Catering service; Community playfields and parks; Day care, commercial; Day care, residential; Dry cleaning and laundry service; Dwelling, duplex; Dwelling, multi-family; Financial institution; Fitness and recreational sports center; General retail; Medical office or clinic; Office, business or professional; Public safety facility; Restaurant; Social service facility; Utility facility, minor; Vehicle service and repair, minor; Veterinary clinic. A legal description of the property is provided within the recorded survey shown later in this report.
Property IdentificationProperty Name Former Industrial WarehouseAddress 301 East Centre Avenue
Buckeye, Arizona 85326Tax ID 400-28-001GOwner of Record City of Buckeye
Sale History The most recent closed sale of the subject is summarized as follows:
Sale Date April 1, 1967Seller Buckeye Development Company, Inc.Buyer City of BuckeyeSale Price N/ARecording Instrument Number 7481-276Expenditures Since Purchase N/A
No known sales or transfers of ownership have taken place within a three-year period prior to the effective appraisal date.
Pending Transactions Based on discussions with the appropriate contacts, the property is not subject to an agreement of sale or an option to buy, nor is it listed for sale, as of the effective appraisal date. However, the Client intends to put the property up for auction in the immediate future, pending completion of this appraisal.
Identification of the Appraisal Problem 4
Former Industrial Warehouse
Appraisal Purpose The purpose of the appraisal is to develop the following opinion(s) of value:
· The market value as is of the fee simple interest in the subject property as of the effective date of the appraisal, May 29, 2021
The date of the report is June 11, 2021. The appraisal is valid only as of the stated effective date or dates.
Value Type Definitions The definitions of the value types applicable to this assignment are summarized below.
Market Value The most probable price which a property should bring in a competitive and open market under all conditions requisite to a fair sale, the buyer and seller each acting prudently and knowledgeably, and assuming the price is not affected by undue stimulus. Implicit in this definition is the consummation of a sale as of a specified date and the passing of title from seller to buyer under conditions whereby:
1. Buyer and seller are typically motivated;
2. Both parties are well informed or well advised, and acting in what they consider their own best interests;
3. A reasonable time is allowed for exposure in the open market;
4. Payment is made in terms of cash in U.S. dollars or in terms of financial arrangements comparable thereto; and
5. The price represents the normal consideration for the property sold unaffected by special or creative financing or sales concessions granted by anyone associated with the sale. 1
Appraisal Premise Definitions The definitions of the appraisal premises applicable to this assignment are specified as follows.
As Is Market Value The estimate of the market value of real property in its current physical condition, use, and zoning as of the appraisal date.2
Property Rights Definitions The property rights appraised which are applicable to this assignment are defined as follows.
1 Code of Federal Regulations, Title 12, Chapter I, Part 34.42[h]; also Interagency Appraisal and Evaluation Guidelines, Federal Register, 75 FR 77449, December 10, 2010, page 77472 2Appraisal Institute, The Dictionary of Real Estate Appraisal, 6th ed. (Chicago: Appraisal Institute, 2015)

Identification of the Appraisal Problem 5
Former Industrial Warehouse
Fee Simple Estate Absolute ownership unencumbered by any other interest or estate, subject only to the limitations imposed by the governmental powers of taxation, eminent domain, police power, and escheat.3
Client and Intended User(s) The client and intended user is City of Buckeye. No other party or parties may use or rely on the information, opinions, and conclusions contained in this report.
Intended Use The intended use of the appraisal is for property disposition purposes. The appraisal is not intended for any other use.
Applicable Requirements This appraisal report conforms to the following requirements and regulations:
· Uniform Standards of Professional Appraisal Practice (USPAP);
· Code of Professional Ethics and Standards of Professional Practice of the Appraisal Institute;
· Applicable state appraisal regulations;
Report Format Standards Rule 2-2 (Content of a Real Property Appraisal Report) contained in the Uniform Standards of Professional Appraisal Practice (USPAP) requires each written real property appraisal report to be prepared as either an Appraisal Report or a Restricted Appraisal Report. This report is prepared as an Appraisal Report as defined by USPAP under Standards Rule 2-2(a), and incorporates practical explanation of the data, reasoning, and analysis used to develop the opinion of value.
Prior Services USPAP requires appraisers to disclose to the client any other services they have provided in connection with the subject property in the prior three years, including valuation, consulting, property management, brokerage, or any other services. We have previously appraised the property that is the subject of this report for another client. We have provided no other services, as an appraiser or in any other capacity, regarding the property that is the subject of this report within the three-year period immediately preceding the agreement to perform this assignment.
Appraiser Competency No steps were necessary to meet the competency provisions established under USPAP. The assignment participants have appraised several properties similar to the subject in physical, locational, and economic characteristics, and are familiar with market conditions and trends; therefore, appraiser competency provisions are satisfied for this assignment. Appraiser qualifications and state credentials are included in the addenda of this report.
3 Appraisal Institute, The Dictionary of Real Estate Appraisal, 6th ed. (Chicago: Appraisal Institute, 2015)

Scope of Work 6
Former Industrial Warehouse
Scope of Work
Introduction The appraisal development and reporting processes require gathering and analyzing information about the assignment elements necessary to properly identify the appraisal problem. The scope of work decision includes the research and analyses necessary to develop credible assignment results, given the intended use of the appraisal. Sufficient information includes disclosure of research and analyses performed and might also include disclosure of research and analyses not performed.
To determine the appropriate scope of work for the assignment, the intended use of the appraisal, the needs of the user, the complexity of the property, and other pertinent factors were considered. The concluded scope of work is described below.
Research and Analysis The type and extent of the research and analysis conducted are detailed in individual sections of the report. The steps taken to verify comparable data are disclosed in the addenda of this report. Although effort has been made to confirm the arms-length nature of each sale with a party to the transaction, it is sometimes necessary to rely on secondary verification from sources deemed reliable.
Subject Property Data Sources The legal and physical features of the subject property, including size of the site, flood plain data, seismic zone designation, property zoning, existing easements and encumbrances, access and exposure, and condition of the improvements (as applicable) were confirmed and analyzed.
Contacts In addition to public records and other sources cited in this appraisal, information pertaining to the subject was obtained from the following party: Tammy D. Vogel, Purchasing Supervisor, City of Buckeye.
Inspection Details regarding the property inspection conducted as part of this appraisal assignment are summarized as follows:
Property InspectionParty Inspection Type Inspection DateWilliam M. Dominick Exterior May 29, 2021William M. Dominick Interior and exterior April 4, 2020
The subject property is improved with a vacant industrial warehouse building. My inspection of the property in April 2020 included an interior inspection. I questioned the Client as follows: “I inspected the exterior of the property on Saturday afternoon. There does not appear to be any changes from

Scope of Work 7
Former Industrial Warehouse
when I inspected it (exterior and interior) on April 4, 2020. I plan to use my interior photos from April 2020 in the updated appraisal report as I don’t see a need for re-inspecting the interior, especially if the highest and best use is to demolish for redevelopment. Do you have any objections to that?” The Client’s response was as follows: “There have been no changes at all. We are still anticipating that demo will occur by the new owner. Part of it must be demolished anyway, as the building is over the property line and our solicitation requires the purchaser to correct that situation. I’m confident any pictures you would take now would look identical to last year’s pics.”
Based on the conversation with the Client, no interior inspection of the property as of the current effective date was deemed necessary and as such, no interior inspection was conducted. The photographs contained in this report are a mixture of exterior photos taken on May 29, 2021 and interior photos taken on April 4, 2020.
Valuation Methodology Three approaches to value are typically considered when developing a market value opinion for real property. These are the cost approach, the sales comparison approach, and the income capitalization approach. Use of the approaches in this assignment is summarized as follows:
Approaches to ValueApproach Applicability to Subject Use in AssignmentCost Approach Not Applicable Not UtilizedSales Comparison Approach Applicable UtilizedIncome Capitalization Approach Not Applicable Not Utilized
In developing an opinion of value for the subject, only the sales comparison approach is used. This approach is applicable to the subject because there is an active market for similar properties, and sufficient sales data is available for analysis. (Note: The subject property is improved with a functionally obsolete structure that will be removed at the expense of the prospective buyer. I have been provided with three bids for demolition that range from $557,000 to $744,000. The market value as is will be derived by subtracting the cost to raze the improvements from the value of the underlying land, assuming it were vacant and available for immediate development.)
The cost approach is not applicable because there are no improvements that contribute value to the property, and the income approach is not applicable because the subject is not likely to generate rental income in its current state.

Phoenix MSA Area Analysis 8
Former Industrial Warehouse
Economic Analysis
Phoenix MSA Area Analysis The subject is located in the Phoenix-Mesa-Scottsdale, AZ Metropolitan Statistical Area, hereinafter called the Phoenix MSA, as defined by the U.S. Office of Management and Budget. The Phoenix MSA is 14,566 square miles in size and is the eleventh most populous metropolitan area in the nation.
Population The Phoenix MSA has an estimated 2021 population of 5,081,979, which represents an average annual 1.8% increase over the 2010 census of 4,192,887. The Phoenix MSA added an average of 80,827 residents per year over the 2010-2021 period, and its annual growth rate exceeded the State of Arizona rate of 1.4%.
Looking forward, the Phoenix MSA's population is projected to increase at a 1.3% annual rate from 2021-2026, equivalent to the addition of an average of 70,266 residents per year. The Phoenix MSA's growth rate is expected to exceed that of Arizona, which is projected to be 1.2%.
Population Compound Ann. % Chng2010 Census 2021 Estimate 2026 Projection 2010 - 2021 2021 - 2026
Maricopa County 3,817,117 4,599,590 4,910,576 1.7% 1.3%Phoenix MSA 4,192,887 5,081,979 5,433,311 1.8% 1.3%Arizona 6,392,017 7,438,466 7,888,700 1.4% 1.2%USA 308,745,538 330,946,040 340,574,349 0.6% 0.6%Source: Environics Analytics
Population Trends
Employment Total employment in the Phoenix MSA was estimated at 2,168,600 jobs at year-end 2019. Between year-end 2010 and 2020, employment rose by 439,800 jobs, equivalent to a 25.4% increase over the entire period. There were gains in employment in nine out of the past ten years, as the national economy expanded following the downturn of 2007-2009. The Phoenix MSA's rate of employment growth over the last decade surpassed that of Arizona, which experienced an increase in employment of 19.6% or 476,300 jobs over this period.
A comparison of unemployment rates is another way of gauging an area’s economic health. Over the past decade, the Phoenix MSA unemployment rate has been consistently lower than that of Arizona, with an average unemployment rate of 6.2% in comparison to a 7.0% rate for Arizona. A lower unemployment rate is a positive indicator.
Recent data shows that the Phoenix MSA unemployment rate is 6.0% in comparison to a 6.4% rate for Arizona, a positive sign that is consistent with the fact that the Phoenix MSA has outperformed Arizona in the rate of job growth over the past two years.

Phoenix MSA Area Analysis 9
Former Industrial Warehouse
Employment TrendsTotal Employment (Year End) Unemployment Rate (Ann. Avg.)
Year Phoenix MSA%
Change Arizona%
Change Phoenix MSA Arizona2010 1,728,800 2,429,900 9.6% 10.3%2011 1,762,600 2.0% 2,467,700 1.6% 8.6% 9.4%2012 1,818,300 3.2% 2,531,100 2.6% 7.4% 8.3%2013 1,870,500 2.9% 2,592,200 2.4% 6.7% 7.8%2014 1,919,400 2.6% 2,649,600 2.2% 5.9% 6.8%2015 1,985,500 3.4% 2,718,000 2.6% 5.2% 6.1%2016 2,037,800 2.6% 2,782,500 2.4% 4.6% 5.5%2017 2,105,800 3.3% 2,857,200 2.7% 4.2% 5.0%2018 2,175,900 3.3% 2,943,700 3.0% 4.1% 4.8%2019 2,255,700 3.7% 3,034,200 3.1% 4.1% 4.9%2020 2,168,600 -3.9% 2,906,200 -4.2% 7.3% 7.9%
Overall Change 2010-2020 439,800 25.4% 476,300 19.6%Avg Unemp. Rate 2010-2020 6.2% 7.0%Unemployment Rate - April 2021 6.0% 6.4%
Source: U.S. Bureau of Labor Statistics and Moody's Analytics. Employment figures are from the Current Employment Survey (CES). Unemployment rates are from the Current Population Survey (CPS). The figures are not seasonally adjusted.
Major employers in the Phoenix MSA are shown in the following table.
Name Number of Employees1 Banner Health 26,4602 State of Arizona 23,9503 Frys Food Stores 14,8304 Walmart 14,4705 Wells Fargo 13,8506 Maricopa County 13,4307 City of Phoenix 12,0608 Intel Corporation 10,2909 JPMorgan Chase Bank National Association 10,07010 Arizona State University 9,770
Major Employers - Phoenix MSA
Source: Arizona COG/MPO Employer Database
Gross Domestic Product The Phoenix MSA is the 16th largest metropolitan area economy in the nation based on Gross Domestic Product (GDP).

Phoenix MSA Area Analysis 10
Former Industrial Warehouse
Economic growth, as measured by annual changes in GDP, has been somewhat higher in the Phoenix MSA than Arizona overall during the past eight years. The Phoenix MSA has grown at a 3.0% average annual rate while Arizona has grown at a 2.7% rate.
The Phoenix MSA has a per capita GDP of $47,992, which is 9% greater than Arizona's GDP of $44,161. This means that Phoenix MSA industries and employers are adding relatively more value to the economy than their counterparts in Arizona.
Gross Domestic Product
Year($,000s)Phoenix MSA % Change
($,000s)Arizona % Change
2012 192,596,109 268,068,2002013 194,098,740 0.8% 269,967,400 0.7%2014 198,201,063 2.1% 274,112,900 1.5%2015 205,614,494 3.7% 281,935,600 2.9%2016 212,664,524 3.4% 291,259,600 3.3%2017 220,056,085 3.5% 302,117,800 3.7%2018 229,977,451 4.5% 314,016,100 3.9%2019 237,472,532 3.3% 323,597,600 3.1%Compound % Chg (2012-2019) 3.0% 2.7%GDP Per Capita 2019 $47,992 $44,161
Source: U.S. Bureau of Economic Analysis and Moody's Analytics; data released December 2019. The release of state and local GDP data has a longer lag time than national data. The data represents inflation-adjusted ""real"" GDP stated in 2012 dollars.
Income, Education and Age The Phoenix MSA has a higher level of household income than Arizona. Median household income for the Phoenix MSA is $70,672, which is 9.6% greater than the corresponding figure for Arizona.
MedianPhoenix MSA $70,672Arizona $64,460
Comparison of Phoenix MSA to Arizona + 9.6%Source: Environics Analytics
Median Household Income - 2021
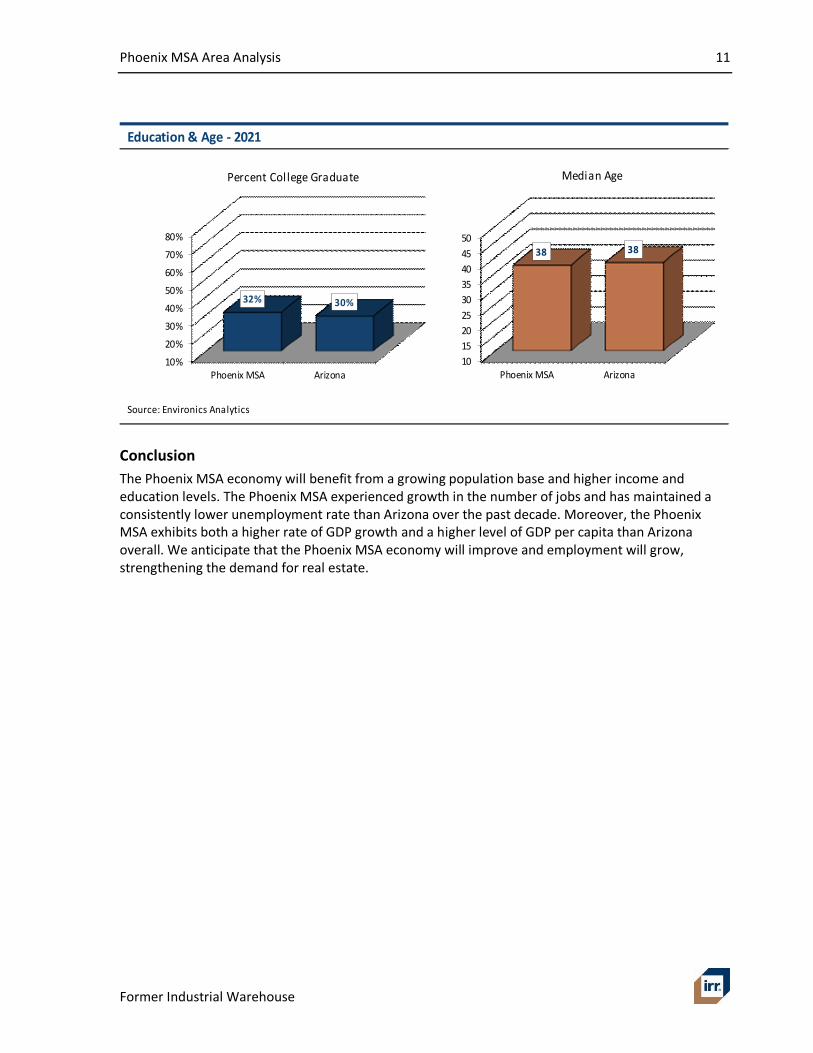
Residents of the Phoenix MSA have a slightly higher level of educational attainment than those of Arizona. An estimated 32% of Phoenix MSA residents are college graduates with four-year degrees, versus 30% of Arizona residents. People in the Phoenix MSA are similar in age to their Arizona counterparts. The median age of both the Phoenix MSA and Arizona is 38 years.
Phoenix MSA Area Analysis 11
Former Industrial Warehouse
Education & Age - 2021
Source: Environics Analytics
10%
20%
30%
40%
50%
60%
70%
80%
Phoenix MSA Arizona
32% 30%
Percent College Graduate
101520253035404550
Phoenix MSA Arizona
38 38
Median Age
Conclusion The Phoenix MSA economy will benefit from a growing population base and higher income and education levels. The Phoenix MSA experienced growth in the number of jobs and has maintained a consistently lower unemployment rate than Arizona over the past decade. Moreover, the Phoenix MSA exhibits both a higher rate of GDP growth and a higher level of GDP per capita than Arizona overall. We anticipate that the Phoenix MSA economy will improve and employment will grow, strengthening the demand for real estate.

Phoenix MSA Area Analysis 12
Former Industrial Warehouse
Area Map

Surrounding Area Analysis 13
Former Industrial Warehouse
Surrounding Area Analysis Location The subject is located in the downtown area of the City of Buckeye. The neighborhood boundaries area defined as follows:
Boundaries & DelineationBoundaries
Market Area Phoenix, AZSubmarket W Phx/SW ValleyArea Type Suburban
DelineationNorth Southern AvenueSouth Hazen RoadEast Watson RoadWest AZ Highway 85
Access & LinkagesVehicular Access
Major Highways AZ Highway 85; Interstate 10Primary Corridors Downtown BuckeyeVehicular Access Rating Average
Public TransitProviders Valley MetroTransit Access Rating Average
Airport(s)Distance 43 milesDriving Time 43 minutes
Primary Transportation Mode Automobile
Public ServicesService Name/Station Distance (Miles) DirectionPolice Department Buckeye Police 1.3 NortheastFire Department Buckeye Fire Station 701 0.1 WestHospital Abrazo Buckeye Emergency
Center7.1 Northeast
Elementary School Buckeye Elementary 0.6 EastMiddle/Junior High School N/A N/A N/AHigh School Buckeye Union High School 1.6 Northeast

Surrounding Area Analysis 14
Former Industrial Warehouse
Demographics A demographic profile of the surrounding area, including population, households, and income data, is presented in the following table.
Surrounding Area Demographics
2021 Estimates1-Mile Radius
3-Mile Radius
5-Mile Radius
Phoenix MSA Arizona USA
Population 2010 4,692 15,612 24,235 4,192,887 6,392,017 308,745,538Population 2021 5,712 22,367 34,322 5,081,979 7,438,466 330,946,040Population 2026 6,160 24,266 37,304 5,433,311 7,888,700 340,574,349Compound % Change 2010-2021 1.8% 3.3% 3.2% 1.8% 1.4% 0.6%Compound % Change 2021-2026 1.5% 1.6% 1.7% 1.3% 1.2% 0.6%
Households 2010 1,519 4,817 7,466 1,537,173 2,380,990 116,716,292Households 2021 1,831 6,815 10,440 1,862,569 2,772,766 125,732,798Households 2026 1,969 7,380 11,308 1,995,220 2,946,790 129,596,282Compound % Change 2010-2021 1.7% 3.2% 3.1% 1.8% 1.4% 0.7%Compound % Change 2021-2026 1.5% 1.6% 1.6% 1.4% 1.2% 0.6%
Median Household Income 2021 $52,687 $60,941 $65,058 $70,672 $64,460 $67,086Average Household Size 3.1 3.3 3.3 5.4 5.2 2.6College Graduate % 7% 12% 14% 32% 30% 32%Median Age 31 31 31 38 38 39Owner Occupied % 52% 70% 73% 66% 66% 65%Renter Occupied % 48% 30% 27% 34% 34% 35%Median Owner Occ. Housing Value $179,188 $202,266 $218,645 $301,197 $270,026 $250,250Median Year Structure Built 1993 2004 2005 1994 1992 1979Average Travel Time to Work in Mins. 30 32 33 58 56 29Source: Environics Analytics
As shown above, the current population within a 3-mile radius of the subject is 22,367, and the average household size is 3.3. Population in the area has grown since the 2010 census, and this trend is projected to continue over the next five years. Compared to the Phoenix MSA overall, the population within a 3-mile radius is projected to grow at a faster rate.
Median household income is $60,941, which is lower than the household income for the Phoenix MSA. Residents within a 3-mile radius have a considerably lower level of educational attainment than those of the Phoenix MSA, while median owner occupied home values are considerably lower.

Surrounding Area Analysis 15
Former Industrial Warehouse
Surrounding Area Land UsesCharacter of Area SuburbanPredominant Age of Improvements (Years) 50+Predominant Quality and Condition Below AverageApproximate Percent Developed 50%Land Use Allocation
Single-Family 25%Multifamily 5%Retail 10%Office 5%Industrial 5%Vacant Land 50%
Infrastructure and Planning AveragePredominant Location of Undeveloped Perimeter of NeighborhoodPrevailing Direction of Growth Indiscriminate
Immediate SurroundingsNorth Older single family residencesSouth Buckeye Senior Apartments & Earl Edgar Recreational FacilityEast Older single family residencesWest Buckeye Senior Center; Fire Department Station 701; Earl Edgar Recreation Park
Surrounding Area RatingsHighway Access GoodDemand Generators AverageConvenience to Support Services AverageConvenience to Public Transit AverageEmployment Stability AverageNeighborhood Amenities GoodPolice and Fire Protection GoodBarriers to Competitive Entry AveragePrice/Value Trends GoodProperty Compatibility Poor

Surrounding Area Analysis 16
Former Industrial Warehouse
Surrounding Area Map
Multifamily Market Analysis 17
Former Industrial Warehouse
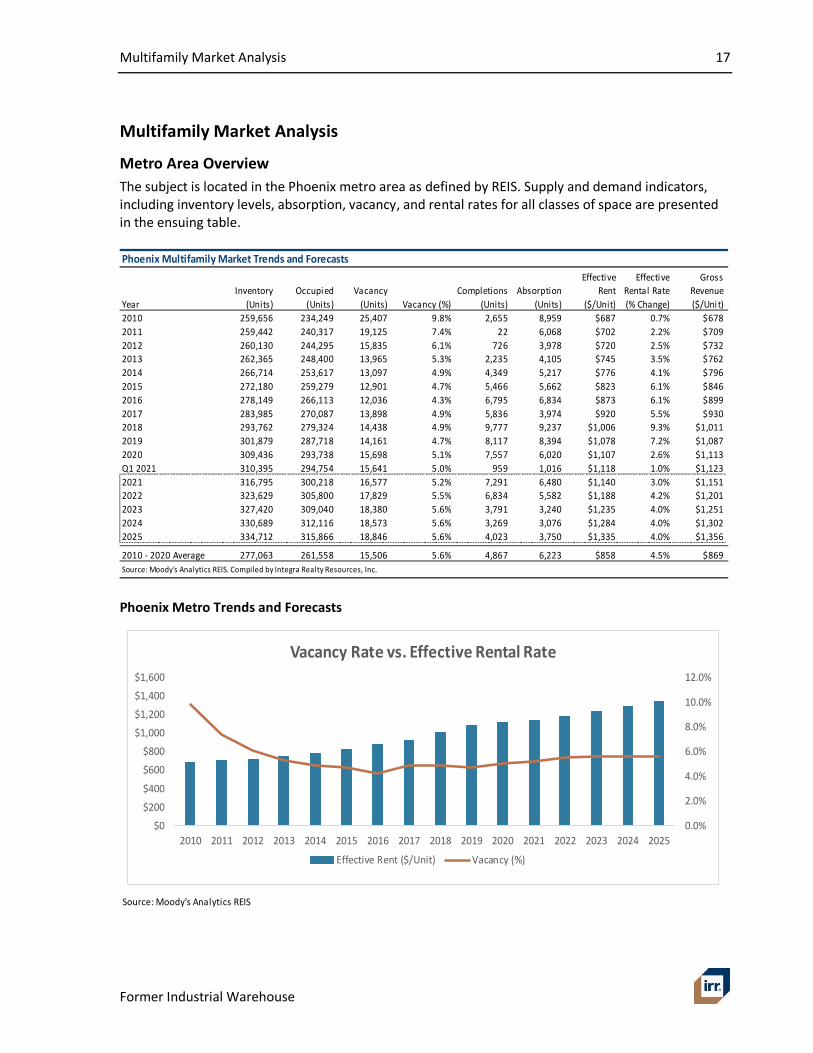
Multifamily Market Analysis Metro Area Overview The subject is located in the Phoenix metro area as defined by REIS. Supply and demand indicators, including inventory levels, absorption, vacancy, and rental rates for all classes of space are presented in the ensuing table.
Phoenix Multifamily Market Trends and Forecasts
YearInventory
(Units)Occupied
(Units)Vacancy
(Units) Vacancy (%)Completions
(Units)Absorption
(Units)
Effective Rent
($/Unit)
Effective Rental Rate (% Change)
Gross Revenue ($/Unit)
2010 259,656 234,249 25,407 9.8% 2,655 8,959 $687 0.7% $6782011 259,442 240,317 19,125 7.4% 22 6,068 $702 2.2% $7092012 260,130 244,295 15,835 6.1% 726 3,978 $720 2.5% $7322013 262,365 248,400 13,965 5.3% 2,235 4,105 $745 3.5% $7622014 266,714 253,617 13,097 4.9% 4,349 5,217 $776 4.1% $7962015 272,180 259,279 12,901 4.7% 5,466 5,662 $823 6.1% $8462016 278,149 266,113 12,036 4.3% 6,795 6,834 $873 6.1% $8992017 283,985 270,087 13,898 4.9% 5,836 3,974 $920 5.5% $9302018 293,762 279,324 14,438 4.9% 9,777 9,237 $1,006 9.3% $1,0112019 301,879 287,718 14,161 4.7% 8,117 8,394 $1,078 7.2% $1,0872020 309,436 293,738 15,698 5.1% 7,557 6,020 $1,107 2.6% $1,113Q1 2021 310,395 294,754 15,641 5.0% 959 1,016 $1,118 1.0% $1,1232021 316,795 300,218 16,577 5.2% 7,291 6,480 $1,140 3.0% $1,1512022 323,629 305,800 17,829 5.5% 6,834 5,582 $1,188 4.2% $1,2012023 327,420 309,040 18,380 5.6% 3,791 3,240 $1,235 4.0% $1,2512024 330,689 312,116 18,573 5.6% 3,269 3,076 $1,284 4.0% $1,3022025 334,712 315,866 18,846 5.6% 4,023 3,750 $1,335 4.0% $1,356
2010 - 2020 Average 277,063 261,558 15,506 5.6% 4,867 6,223 $858 4.5% $869Source: Moody's Analytics REIS. Compiled by Integra Realty Resources, Inc.
Phoenix Metro Trends and Forecasts
Source: Moody's Analytics REIS
0.0%
2.0%
4.0%
6.0%
8.0%
10.0%
12.0%
$0
$200
$400
$600
$800
$1,000
$1,200
$1,400
$1,600
2010 2011 2012 2013 2014 2015 2016 2017 2018 2019 2020 2021 2022 2023 2024 2025
Vacancy Rate vs. Effective Rental Rate
Effective Rent ($/Unit) Vacancy (%)

Multifamily Market Analysis 18
Former Industrial Warehouse
· The current vacancy rate in the metro area is 5.0%; the vacancy rate has increased by 30 bps from 2015.
· Four-year forecasts project a vacancy rate of 5.6% for the metro area, representing an increase of 60 bps by year-end 2025.
· Effective rent averages $1,118/unit in the metro area; future rent values are expected to increase by 19.4% to $1,335/unit by year-end 2025.
Source: Moody's Analytics REIS
0.0%
2.0%
4.0%
6.0%
8.0%
10.0%
12.0%
0
2,000
4,000
6,000
8,000
10,000
12,000
2010 2011 2012 2013 2014 2015 2016 2017 2018 2019 2020 2021 2022 2023 2024 2025
Supply and Demand Trends
Completions(Units)
Absorption(Units)
Vacancy (%)
· The inventory in the metro area has increased by 14.0% from 2015, while the occupied stock has increased by 13.7%.
· Between 2015 and 2020, completions averaged 7,258 units annually and reached a peak of 9,777 units in 2018.
· Between 2015 and 2020, absorption figures reached a peak of 9,237 units in 2018 and a low of 3,974 units in 2017.
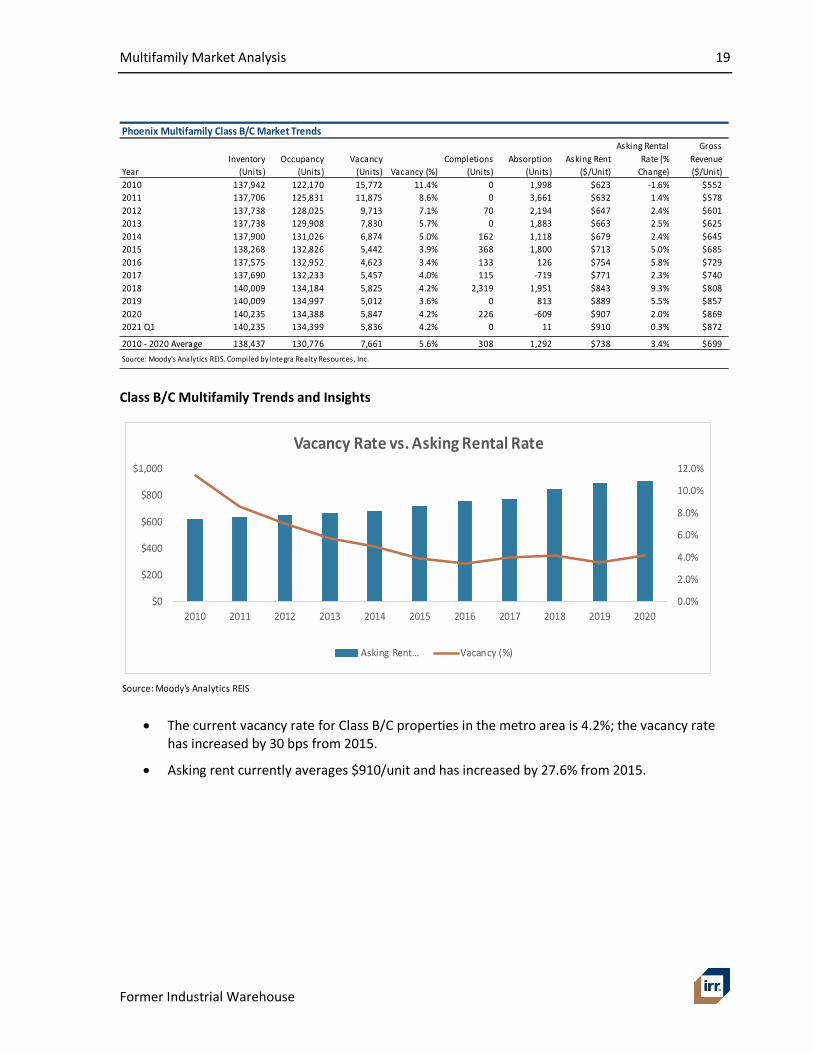
Class B/C Multifamily Overview The subject is a Class C property as defined by REIS. Supply and demand indicators, including inventory levels, absorption, vacancy, and rental rates for all Class B/C space in the Phoenix metro area are presented in the following table.
Multifamily Market Analysis 19
Former Industrial Warehouse
P̀hoenix Multifamily Class B/C Market Trends
YearInventory
(Units)Occupancy
(Units)Vacancy
(Units) Vacancy (%)Completions
(Units)Absorption
(Units)Asking Rent
($/Unit)
Asking Rental Rate (%
Change)
Gross Revenue($/Unit)
2010 137,942 122,170 15,772 11.4% 0 1,998 $623 -1.6% $5522011 137,706 125,831 11,875 8.6% 0 3,661 $632 1.4% $5782012 137,738 128,025 9,713 7.1% 70 2,194 $647 2.4% $6012013 137,738 129,908 7,830 5.7% 0 1,883 $663 2.5% $6252014 137,900 131,026 6,874 5.0% 162 1,118 $679 2.4% $6452015 138,268 132,826 5,442 3.9% 368 1,800 $713 5.0% $6852016 137,575 132,952 4,623 3.4% 133 126 $754 5.8% $7292017 137,690 132,233 5,457 4.0% 115 -719 $771 2.3% $7402018 140,009 134,184 5,825 4.2% 2,319 1,951 $843 9.3% $8082019 140,009 134,997 5,012 3.6% 0 813 $889 5.5% $8572020 140,235 134,388 5,847 4.2% 226 -609 $907 2.0% $8692021 Q1 140,235 134,399 5,836 4.2% 0 11 $910 0.3% $872
2010 - 2020 Average 138,437 130,776 7,661 5.6% 308 1,292 $738 3.4% $699Source: Moody's Analytics REIS. Compiled by Integra Realty Resources, Inc.
Class B/C Multifamily Trends and Insights
Source: Moody's Analytics REIS
0.0%
2.0%
4.0%
6.0%
8.0%
10.0%
12.0%
$0
$200
$400
$600
$800
$1,000
2010 2011 2012 2013 2014 2015 2016 2017 2018 2019 2020
Vacancy Rate vs. Asking Rental Rate
Asking Rent… Vacancy (%)
· The current vacancy rate for Class B/C properties in the metro area is 4.2%; the vacancy rate has increased by 30 bps from 2015.
· Asking rent currently averages $910/unit and has increased by 27.6% from 2015.

Multifamily Market Analysis 20
Former Industrial Warehouse
Source: ©Reis Services, LLC 2021. Reprinted with the permission of Reis Services, LLC. All rights reserved.
0.0%
2.0%
4.0%
6.0%
8.0%
10.0%
12.0%
-1,000
0
1,000
2,000
3,000
4,000
2010 2011 2012 2013 2014 2015 2016 2017 2018 2019 2020
Supply and Demand Trends
Completions(Units)
Absorption(Units)
Vacancy (%)
· Class B/C metro area inventory has increased by 1.4% from 2015, while the occupied stock has increased by 1.2%.
· Between 2015 and 2020, completions have averaged 527 units annually and reached a peak of 2,319 units in 2018.
· Between 2015 and 2020, absorption figures reached a peak of 1,951 units in 2018 and a low of -719 units in 2017.
· Between 2015 and 2020, gross revenue for Class B/C properties in the metro area averaged $781/unit and has increased by 26.9%.
Submarket Overview The subject is located in the Goodyear/Avondale/Tolleson submarket. In order to evaluate the market appeal of the subject’s submarket in comparison to others in the Phoenix metro area, we compare key supply and demand indicators for all classes of space in the following table.

Multifamily Market Analysis 21
Former Industrial Warehouse
Phoenix Multifamily Submarket Comparison
SubmarketInventory
(Buildings)Inventory
(Units)Asking Rent
($/Unit) Vacancy (%)Free Rent
(mos) Expenses %)Central Phoenix North 230 23,837 $909 5.0% 0.81 39.8%Central Phoenix South 181 22,026 $1,188 7.1% 0.85 38.6%Chandler/Gilbert 116 27,648 $1,424 5.8% 0.76 38.3%Deer Valley 80 21,345 $979 3.3% 0.38 37.7%East Mesa 67 12,608 $1,270 5.1% 0.75 37.9%Glendale South 88 11,903 $960 3.8% 0.50 37.7%Goodyear/Avondale/Tolleson 68 11,332 $1,286 3.7% 0.61 38.0%Maryvale 36 9,780 $891 2.3% 0.26 37.4%Northeast Phoenix 163 17,668 $1,107 6.8% 0.75 40.5%North Scottsdale/Fountain Hil ls 93 25,239 $1,570 7.0% 0.78 37.7%North Tempe 155 22,827 $1,333 6.4% 0.85 39.3%Paradise Valley 42 6,803 $1,028 3.8% 0.55 37.9%Peoria/Sun City/Surprise 99 20,712 $1,115 5.7% 0.46 37.9%South Mesa 84 16,275 $1,013 3.4% 0.55 37.9%South Scottsdale 77 13,158 $1,482 5.2% 0.65 40.1%South Tempe/Ahwatukee 94 23,386 $1,329 4.4% 0.74 37.6%Sunnyslope 109 16,369 $909 2.8% 0.34 37.8%West Mesa 65 7,479 $901 3.2% 0.47 38.4%
Market Averages/Totals 1,847 310,395 $1,150 5.0% 0.61 38.4%Source: Moody's Analytics REIS. Compiled by Integra Realty Resources, Inc.
Goodyear/Avondale/Tolleson Submarket Comparison · The submarket contains 3.7% of the metro building inventory and 3.7% of the metro unit
inventory.
· The submarket's asking rent is $1,286/unit, which is greater than the metro average of $1,150/unit.
· The submarket's vacancy rate is 3.7%, which is less than the metro average of 5.0%.
· Operating expenses, as a percentage of potential rent revenue, average 38.0% in the submarket compared to 38.4% for the overall metro area.
· Average free rent in the subject property's submarket (0.61 months) is less than the free rent for the metro area (0.61 months).
Goodyear/Avondale/Tolleson Submarket Trends and Forecasts Supply and demand indicators for all classes of space in the Goodyear/Avondale/Tolleson submarket are displayed in the following table.
Multifamily Market Analysis 22
Former Industrial Warehouse
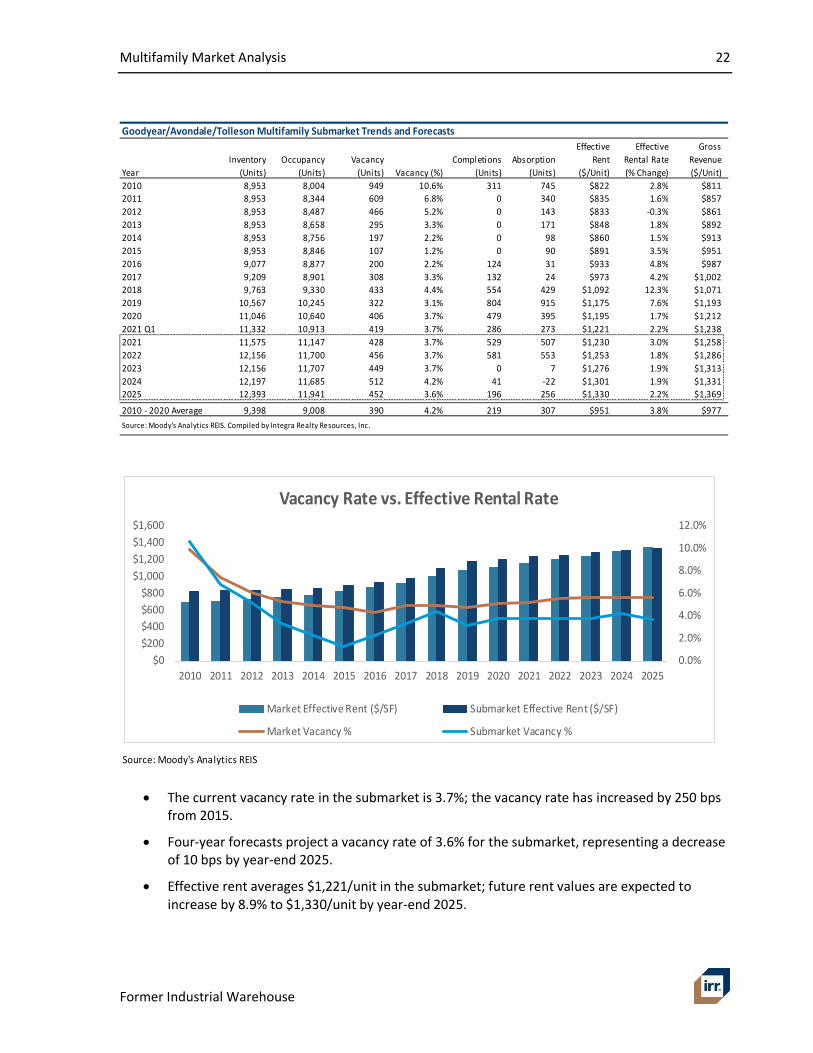
Goodyear/Avondale/Tolleson Multifamily Submarket Trends and Forecasts
YearInventory
(Units)Occupancy
(Units)Vacancy
(Units) Vacancy (%)Completions
(Units)Absorption
(Units)
Effective Rent
($/Unit)
Effective Rental Rate (% Change)
Gross Revenue($/Unit)
2010 8,953 8,004 949 10.6% 311 745 $822 2.8% $8112011 8,953 8,344 609 6.8% 0 340 $835 1.6% $8572012 8,953 8,487 466 5.2% 0 143 $833 -0.3% $8612013 8,953 8,658 295 3.3% 0 171 $848 1.8% $8922014 8,953 8,756 197 2.2% 0 98 $860 1.5% $9132015 8,953 8,846 107 1.2% 0 90 $891 3.5% $9512016 9,077 8,877 200 2.2% 124 31 $933 4.8% $9872017 9,209 8,901 308 3.3% 132 24 $973 4.2% $1,0022018 9,763 9,330 433 4.4% 554 429 $1,092 12.3% $1,0712019 10,567 10,245 322 3.1% 804 915 $1,175 7.6% $1,1932020 11,046 10,640 406 3.7% 479 395 $1,195 1.7% $1,2122021 Q1 11,332 10,913 419 3.7% 286 273 $1,221 2.2% $1,2382021 11,575 11,147 428 3.7% 529 507 $1,230 3.0% $1,2582022 12,156 11,700 456 3.7% 581 553 $1,253 1.8% $1,2862023 12,156 11,707 449 3.7% 0 7 $1,276 1.9% $1,3132024 12,197 11,685 512 4.2% 41 -22 $1,301 1.9% $1,3312025 12,393 11,941 452 3.6% 196 256 $1,330 2.2% $1,369
2010 - 2020 Average 9,398 9,008 390 4.2% 219 307 $951 3.8% $977Source: Moody's Analytics REIS. Compiled by Integra Realty Resources, Inc.
Source: Moody's Analytics REIS
0.0%
2.0%
4.0%
6.0%
8.0%
10.0%
12.0%
$0$200$400$600$800
$1,000$1,200$1,400$1,600
2010 2011 2012 2013 2014 2015 2016 2017 2018 2019 2020 2021 2022 2023 2024 2025
Vacancy Rate vs. Effective Rental Rate
Market Effective Rent ($/SF) Submarket Effective Rent ($/SF)
Market Vacancy % Submarket Vacancy %
· The current vacancy rate in the submarket is 3.7%; the vacancy rate has increased by 250 bps from 2015.
· Four-year forecasts project a vacancy rate of 3.6% for the submarket, representing a decrease of 10 bps by year-end 2025.
· Effective rent averages $1,221/unit in the submarket; future rent values are expected to increase by 8.9% to $1,330/unit by year-end 2025.

Multifamily Market Analysis 23
Former Industrial Warehouse
Source: Moody's Analytics REIS
0.0%
2.0%
4.0%
6.0%
8.0%
10.0%
12.0%
-200
0
200
400
600
800
1,000
2010 2011 2012 2013 2014 2015 2016 2017 2018 2019 2020 2021 2022 2023 2024 2025
Supply and Demand Trends
Completions(Units)
Absorption(Units)
Vacancy (%)
· Current inventory level of 11,332 units is expected to increase by 9.4% through year-end 2025.
· The inventory in the submarket has increased by 26.6% from 2015, while the occupied stock has increased by 23.4%.
· Between 2015 and 2020, completions averaged 349 units annually and reached a peak of 804 units in 2019.
· Between 2015 and 2020, absorption figures reached a peak of 915 units in 2019 and a low of 24 units in 2017.
Class B/C Goodyear/Avondale/Tolleson Submarket Trends and Insights Supply and demand indicators, including inventory levels, absorption, vacancy, and rental rates for Class B/C space in the submarket are presented in the following table.
Goodyear/Avondale/Tolleson Multifamily Class B/C Submarket Trends
YearInventory
(Units)Occupancy
(Units)Vacancy
(Units) Vacancy (%)Completions
(Units)Absorption
(Units)Asking Rent
($/Unit)
Asking Rental Rate (%
Change)Gross Revenue
($/Unit)2010 2,073 1,786 287 13.8% 0 -88 $634 -0.80% $5462011 2,073 1,946 127 6.1% 0 160 $659 3.90% $6192012 2,073 2,003 70 3.4% 0 57 $652 -1.10% $6302013 2,073 2,046 27 1.3% 0 43 $690 5.80% $6812014 2,073 2,021 52 2.5% 0 -25 $701 1.60% $6832015 2,073 2,050 23 1.1% 0 29 $740 5.60% $7322016 2,073 2,027 46 2.2% 0 -23 $768 3.80% $7512017 2,073 2,017 56 2.7% 0 -10 $768 0.00% $7472018 2,073 2,046 27 1.3% 0 29 $846 10.20% $8352019 2,073 2,067 6 0.3% 0 21 $948 12.10% $9452020 2,073 2,030 43 2.1% 0 -37 $978 3.20% $958Q1 2021 2,073 2,032 41 2.0% 0 2 $984 0.60% $965
2010 - 2020 Average 2,073 2,004 69 3.3% 0 14 $762 4.03% $739Source: Moody's Analytics REIS. Compiled by Integra Realty Resources, Inc.

Multifamily Market Analysis 24
Former Industrial Warehouse
Source: Moody's Analytics REIS
$0
$200
$400
$600
$800
$1,000
$1,200
2010 2011 2012 2013 2014 2015 2016 2017 2018 2019 20200.0%2.0%4.0%6.0%8.0%10.0%12.0%14.0%16.0%
Vacancy Rate Vs Asking Rental Rate
Market Class Asking Rent ($/SF) Submarket Class Asking Rent ($/SF)
Market Class Vacancy % Submarket Class Vacancy %
· The current vacancy for Class B/C properties in the submarket area is 2.0%; the vacancy rate has increased by 90 bps from 2015.
· Asking rent currently averages $984/unit and has increased by 33.0% from 2015.
Source: ©Reis Services, LLC 2021. Reprinted with the permission of Reis Services, LLC. All rights reserved.
0.0%
2.0%
4.0%
6.0%
8.0%
10.0%
12.0%
14.0%
16.0%
-150
-100
-50
0
50
100
150
200
2010 2011 2012 2013 2014 2015 2016 2017 2018 2019 2020
Supply and Demand Trends
Completions(Units)
Absorption(Units)
Vacancy (%)
· Class B/C submarket inventory has remained constant from 2015, while the occupied stock has decreased by 0.9%.
· There have not been any Class B/C completions in the submarket between 2015 and 2020.

Multifamily Market Analysis 25
Former Industrial Warehouse
· Between 2015 and 2020, absorption figures reached a peak of 29 units in 2015 and a low of -37 units in 2020.
· Between 2015 and 2020, gross revenue for Class B/C properties in the submarket area averaged $828/unit and increased by 30.9%.
New and Proposed Construction The following charts summarize the properties that have been completed in the Phoenix metro area.
Source: Moody's Analytics REIS
2,1781,383
3,028618
2,3391,076
1,55221
67893
242,371
937840
30071
0 500 1,000 1,500 2,000 2,500 3,000 3,500
Chandler/GilbertEast Mesa
North Scottsdale/Fountain HillsSouth Scottsdale
Central Phoenix SouthGoodyear/Avondale/Tolleson
Peoria/Sun City/SurpriseParadise Valley
SunnyslopeGlendale South
South MesaNorth Tempe
Central Phoenix NorthNortheast Phoenix
South Tempe/AhwatukeeWest Mesa
Total Completions (Units) by Submarket

Multifamily Market Analysis 26
Former Industrial Warehouse
Source: Moody's Analytics REIS
12
4
12
35
30
1
0.0 5.0 10.0 15.0 20.0 25.0 30.0 35.0 40.0
< 25 Units
25-49 Units
50-99 Units
100-249 Units
250-499 Units
500+ Units
Total Projects Completed by Building Size
The following table summarizes properties that are under construction, planned, and/or proposed in the Phoenix metro area.
Phoenix Multifamily Construction by Phase and Subtype
Properties Units Properties Units Properties UnitsApartment 44 11,901 158 37,210 90 25,685Condominiums 6 764 15 1,526 21 1,681Subsidized/Low Income 0 0 0 0 0 0Mixed Income 0 0 0 0 0 0Townhomes 5 182 15 1,129 10 1,109Other 1 253 0 0 2 9,360N/A 1 222 1 475 0 0
Totals 57 13,322 189 40,340 123 37,835
Multifamily Subproperty Type
Under Construction Planned Construction Proposed Construction
Source: Moody's Analytics REIS
Phoenix Multifamily Construction Insights · There are 57 properties under construction, 189 properties in the planned construction phase,
and 123 properties in the proposed construction phase in the metro area.
· Apartment properties within the under-construction phase have an average size of 270 units and range in size between 19 units and 587 units.
· Apartment properties within the planned construction phase have an average size of 236 units and range in size between 8 units and 2,153 units.
· Apartment properties within the proposed construction phase have an average size of 285 units and range in size between 12 units and 3,130 units.

Multifamily Market Analysis 27
Former Industrial Warehouse
· Of the 13,322 units under construction, 89.3% are Apartment properties, 5.7% are Condominium properties, and 1.4% are Townhome properties.
· Of the 40,340 units planned for construction, 92.2% are Apartment properties, 3.8% are Condominium properties, and 2.8% are Townhome properties.
· Of the 37,835 units proposed for construction, 67.9% are Apartment properties, 4.4% are Condominium properties, and 2.9% are Townhome properties.
The following table summarizes properties that are under construction, planned, and/or proposed in the Goodyear/Avondale/Tolleson submarket.
Goodyear/Avondale/Tolleson Submarket Construction by Phase and Subtype
Properties Units Properties Units Properties UnitsApartment 2 372 12 3,511 7 1,708Condominiums 1 44 1 135 1 135Subsidized/Low Income 0 0 0 0 0 0Mixed Income 0 0 0 0 0 0Townhomes 1 69 1 302 2 335Other 0 0 0 0 0 0N/A 0 0 0 0 0 0
Totals 4 485 14 3,948 10 2,178
Multifamily Subproperty Type
Under Construction Planned Construction Proposed Construction
Source: Moody's Analytics REIS
Comparable Property Analysis Most relevant to the subject is the demand and supply of its comparable properties (as defined by REIS) as well as directly competing properties (i.e., peer group). A summary of the comparable and directly competing multifamily properties considered for the subject is shown in the following tables.

Multifamily Market Analysis 28
Former Industrial Warehouse
Comparable Properties
Property Name Address City SubmarketSize (Units)
Year Built Class
Asking Rent
Vacancy Rate
TerraLane at Canyon Trails 195 N 173rd Ave Goodyear Goodyear/Avondale/Tolleson263 2021 $1,556 98.9%Encantada at Canyon Trails 16450 W Van Buren St Goodyear Goodyear/Avondale/Tolleson225 2008 A $1,440 2.7%Lunaire 949 Goodyear Blvd Goodyear Goodyear/Avondale/Tolleson239 2008 A $1,251 2.5%Avi lla Centerra Crossings 15390 West Centerra Drive Goodyear Goodyear/Avondale/Tolleson184 2019 A $1,583 3.3%The Maxx 159 1711 N 159th Ave Goodyear Goodyear/Avondale/Tolleson132 2017 A $1,598 0.0%Christopher Todd Communiti es at Estrella Commons15385 W Fil lmore St Goodyear Goodyear/Avondale/Tolleson286 2021 $1,715 3.9%Acero Estrella Commons 15380 W Fil lmore St Goodyear Goodyear/Avondale/Tolleson352 2020 A $1,638 3.4%Liv Goodyear 15361 W Virgini a Ave Goodyear Goodyear/Avondale/Tolleson326 2019 A $1,276 3.1%The Paseo 4200 N Pebble Creek Goodyear Goodyear/Avondale/Tolleson257 2007 A $1,277 1.9%Aldea at Estrella Falls 2400 N Bullard Ave Goodyear Goodyear/Avondale/Tolleson326 2009 A $1,587 3.4%Edgewater 102 S 4th Ave Avondale Goodyear/Avondale/Tolleson195 1984 BC 3.6%Park Shadows Country Homes 620 N Litchfield Rd Goodyear Goodyear/Avondale/Tolleson237 1940 BC $1,275 3.0%Palm Val ley Villas 4200 N Falcon Dr Goodyear Goodyear/Avondale/Tolleson124 2016 A $1,587 0.8%Greenwood Apartments 1322 N La Joll a Blvd Goodyear Goodyear/Avondale/Tolleson69 1964 BC $912 2.9%Adiamo Palm Valley 2100 N 145 Ave Goodyear Goodyear/Avondale/Tolleson301 2006 A $1,498 2.0%1408 at Palm Valley Casitas 1408 N Central Ave Avondale Goodyear/Avondale/Tolleson165 1978 BC $1,378 0.0%Palm Val ley 1891 N Litchfi eld Rd Goodyear Goodyear/Avondale/Tolleson259 1997 A $1,578 6.2%Desert Sage 1737 N Central Ave Goodyear Goodyear/Avondale/Tolleson207 2003 A $1,366 2.9%Mountain View 333 E Van Buren St Avondale Goodyear/Avondale/Tolleson150 1982 BC $865 3.3%Desert Green Villas 801 E Calle Chulo Rd Goodyear Goodyear/Avondale/Tolleson48 1974 BC $974 4.2%Siesta Pointe Apartments 12851 W Buckeye Rd Avondale Goodyear/Avondale/Tolleson21 2004 BC $954 0.0%Sedona Peaks 12721 W Buckeye Rd Avondale Goodyear/Avondale/Tolleson96 1999 A $1,348 4.2%Country Aire 1701 N Palo Verde Dr Goodyear Goodyear/Avondale/Tolleson60 1983 BC $851 0.0%Rio Santa Fe Apartments 13015 W Rancho Santa Fe Blvd Avondale Goodyear/Avondale/Tolleson334 2000 A $1,299 2.4%Bel la Mirage Apartments 3800 North El Mirage Rd Avondale Goodyear/Avondale/Tolleson712 2009 A $1,374 1.7%Coldwater Spri ngs Apartments 12115 W Van Buren St Avondale Goodyear/Avondale/Tolleson298 2007 A $1,443 3.0%Ashton Pointe 12175 W McDowell Rd Avondale Goodyear/Avondale/Tolleson311 2010 A $1,409 3.2%Crystal Springs 11885 W McDowell Rd Avondale Goodyear/Avondale/Tolleson400 2000 A $1,327 0.0%Versante 11120 W Van Buren St Avondale Goodyear/Avondale/Tolleson335 2007 A $1,420 0.3%Maravi lla Apartments 13621 W Glendale Ave Glendale Glendale South 225 2003 BC $1,266 3.6%Christopher Todd Communites on Camelback 12350 W Camelback Rd Litchfield Park Goodyear/Avondale/Tolleson167 2019 A $1,489 2.4%Desert Gardens Apartments 13517 W Glendale Ave Glendale Glendale South 304 1982 BC $1,000 0.0%Vineyard Apartments 6706 N Dysart Rd Glendale Glendale South 299 1984 BC $1,136 4.7%Christopher Todd Communiti es at Country Place2500 S 99th Ave Phoeni x Goodyear/Avondale/Tolleson154 2018 A $1,856 2.6%Aventura 10350 W McDowell Rd Avondale Goodyear/Avondale/Tolleson407 2001 A $1,242 10.3%Oceana 1700 N 103rd Ave Avondale Goodyear/Avondale/Tolleson240 2004 A $1,465 0.0%Avalon Apartments 2005 N 103rd Ave Avondale Goodyear/Avondale/Tolleson400 2018 A $1,528 0.5%Sundancer Apartments 400 N 96th Ave Tolleson Goodyear/Avondale/Tolleson76 1985 BC $1,034 0.0%Avi lla Camelback Ranch 10770 W Highland Ave Phoeni x Goodyear/Avondale/Tolleson127 2019 A $1,698 0.8%Villa De Paz Apartments 4405 N 103rd Ave Phoeni x Goodyear/Avondale/Tolleson120 1982 BC $1,060 0.8%Vista Verde 4302 N 103rd Ave Phoeni x Goodyear/Avondale/Tolleson76 1979 BC $975 2.6%
Source: Moody's Analytics REIS. Compiled by Integra Realty Resources, Inc.
Comparable Group Summary StatsLow Mean Median High
Current Asking Rent Per Unit $851.00 $1,383.73 $1,370.00 $1,856.00Current Effective Rent Per Unit $808.12 $1,299.81 $1,288.62 $1,762.48Current Vacancy Rate 0.0% 5.3% 2.6% 98.9%Property Size (Unit) 21 303 237 712Year Built 1940 2000 2004 2021Source: Moody's Analytics REIS
Comparable Property Summary · The 41 comparable properties have an average and median asking rent of $1,384/unit and
$1,370/unit respectively.
· The 41 comparable properties have a property size range between 21 and 712 units and an average size of 303 units.
· The comparable properties in the metro area were built between 1940 and 2021.

Multifamily Market Analysis 29
Former Industrial Warehouse
Multifamily Market Outlook and Conclusions Based on the key metro and submarket area trends, construction outlook, and the performance of competing properties, IRR expects the mix of property fundamentals and economic conditions in the Phoenix metro area to have a positive impact on the subject property’s performance in the near-term.

Land Description and Analysis 30
Former Industrial Warehouse
Property Analysis
Land Description and Analysis Land DescriptionLand Area 6.51 acres; 283,701 SFSource of Land Area Public RecordsPrimary Street Frontage East Centre Avenue - 500 feetSecondary Street Frontage South 4th Street - 565 feetShape RectangularCorner YesRail Access NoWater/Port Access NoTopography Generally level and at street gradeDrainage No problems reported or observedEnvironmental Hazards None reported or observedGround Stability No problems reported or observed
Flood Area Panel Number 04013C2180LDate October 16, 2013Zone X (Shaded)Description Within 500-year floodplainInsurance Required? NoZoning; Other RegulationsZoning Jurisdiction City of BuckeyeZoning Designation NMUDescription Neighborhood Mixed UseLegally Conforming? Appears not to be legally conformingZoning Change Likely? NoPermitted Uses Animal pet shop, retail; Art gallery or museum; Bar, lounge, or tavern; Bed and breakfast; Catering service;
Community playfields and parks; Day care, commercial; Day care, residential; Dry cleaning and laundry service; Dwelling, duplex; Dwelling, multi-family; Financial institution; Fitness and recreational sports center; General retail; Medical office or clinic; Office, business or professional; Public safety facility; Restaurant; Social service facility; Utility facility, minor; Vehicle service and repair, minor; Veterinary clinic
Minimum Lot Area N/AMinimum Street Frontage (Feet) N/AMinimum Lot Width (Feet) N/AMinimum Lot Depth (Feet) N/AMinimum Setbacks (Feet) N/AMaximum Building Height 50Maximum Site Coverage 0.7Maximum Density 10Maximum Floor Area Ratio N/AParking Requirement Varies with proposed use, see Article 4.3.1 of the City of Buckeye Development CodeOther The NMU district is intended to provide for small, compact commercial/residential centers within or surrounded
by residential areas, compatible in scale and character with surrounding residential uses, to serve the convenience needs of the immediately surrounding neighborhood. NMU centers are between one-half to five acres in size. Ground-floor small-scale retail and restaurants are encouraged, with upper-story residential and office uses. Continuous commercial frontages, largely uninterrupted by driveways and parking, are encouraged.
Rent Control No
UtilitiesService ProviderWater City of BuckeyeSewer City of BuckeyeElectricity Arizona Public Service CompanyNatural Gas N/ALocal Phone CenturyLink

Land Description and Analysis 31
Former Industrial Warehouse
We are not experts in the interpretation of zoning ordinances. An appropriately qualified land use attorney should be engaged if a determination of compliance with zoning is required.
Potential Development Density Calculating density, based on gross land area to the center of the adjacent streets, increases the north-south dimension of the subject site to 610’ and the east-west dimension to 550’ for a total gross acreage of 335,500 SF or 7.702 acres for density calculation purposes. Based on the maximum density of 10 dwelling units per acre in the current zoning regulations, 77 multifamily dwelling units could be developed on the site. Similar sites are generally developed to a density of 8 to 15 units per acre. Therefore, it appears that the development potential of the site is 77 units.
Easements, Encroachments and Restrictions A current title report was not provided for review. However, based upon a review of the recorded property survey, there are no apparent easements, encroachments, or restrictions that would adversely affect value. The survey identifies exceptions to title, which include various utility and access easements that are typical for a property of this type. A substantial portion of the existing building is encroaching on the property adjacent west, but since the building will be demolished for redevelopment of the property as its highest and best use, there is no adverse impact from this encroachment. This valuation assumes no adverse impacts from the reported easements, encroachments or restrictions, and further assumes that the subject has clear and marketable title.
Opportunity Zone The subject is not located within a Qualified Opportunity Zone (QOZ).
Conclusion of Site Analysis Overall, the physical characteristics and the availability of utilities result in a functional site, suitable for a variety of uses including those permitted by zoning. Uses permitted by zoning include animal pet shop, retail; Art gallery or museum; Bar, lounge, or tavern; Bed and breakfast; Catering service; Community playfields and parks; Day care, commercial; Day care, residential; Dry cleaning and laundry service; Dwelling, duplex; Dwelling, multi-family; Financial institution; Fitness and recreational sports center; General retail; Medical office or clinic; Office, business or professional; Public safety facility; Restaurant; Social service facility; Utility facility, minor; Vehicle service and repair, minor; Veterinary clinic. No other restrictions on development are apparent.
The site has been recently rezoned from general commercial to NMU district with the specific intent of the City of Buckeye to sell the property for immediate redevelopment as a mixed-use, mostly residential project. The subject site is centrally located and has access to all necessary services and infrastructure to support a multi-family residential development.

Land Description and Analysis 32
Former Industrial Warehouse

Land Description and Analysis 33
Former Industrial Warehouse

Land Description and Analysis 34
Former Industrial Warehouse

Land Description and Analysis 35
Former Industrial Warehouse
Aerial Photograph

Land Description and Analysis 36
Former Industrial Warehouse
Survey

Land Description and Analysis 37
Former Industrial Warehouse

Land Description and Analysis 38
Former Industrial Warehouse
Plat Map

Land Description and Analysis 39
Former Industrial Warehouse
Flood Hazard Map

Real Estate Taxes 40
Former Industrial Warehouse
Real Estate Taxes Real estate tax assessments in Arizona are a function of the County Assessor's office and are estimated by jurisdiction on a county-by-county basis. The property under appraisal is located in Maricopa County. Real estate taxes in this state and this jurisdiction represent ad valorem taxes, meaning a tax applied in proportion to value. The real estate taxes for an individual property may be determined by dividing the assessed value for a property by $100, then multiplying the estimate by the composite rate. The composite rate is based on a consistent state tax rate throughout this state, in addition to one or more local taxing district rates.
The State of Arizona employs a dual structure for real estate taxation. Arizona Revised Statutes require that all property have full cash values and limited values established annually. The limited values cannot exceed the full cash values. The full cash and limited values are then adjusted by ratios to determine the assessed value.
The dual tax structure applies a primary tax rate to the limited assessed value and a secondary tax rate to the full cash value. Primary, or limited, values are used for primary property taxes and cannot exceed the full cash value. Limited value is based upon the previous year’s limited value increased by either 10%, or 25% of the difference between the full cash value of the current year and the limited value of the prior year, whichever is greater. The primary rate includes school districts, college funds, Maricopa County and the state of Arizona.
Secondary values are synonymous with the full cash value, or market value, of the property. There is no limit on the amount of growth since it is based on the current market value. This value is used for secondary property taxes. Secondary taxes are used to compute the obligation of voter approved bonds, budget overrides and special taxing districts such as fire, flood control and other limited purpose districts.
Proposition 117, the Arizona Property Tax Assessed Valuation Amendment, was approved by Arizona voters on November 6, 2012. As a result, beginning in tax year 2015 the calculation of the Limited Property Value (LPV) changed and there is a single valuation used for taxation purposes, which is the LPV. The measure limited the annual growth in the limited property value of locally assessed properties to 5%, excluding properties, which have significant changes from the previous year such as new construction or parcel splits.
It should be noted that the sale of the property will not trigger a new assessment, but demolition of the existing improvements and construction of a residential project will require a new assessment. In addition, it should also be noted that the “full cash value”, while based on the assessor’s estimate of market value, is rarely equal to market value. This is due primarily to the assessor’s predominate reliance on the cost approach to value, particularly for new construction. This results in almost no correlation to market value.
Real estate taxes and assessments for the current tax year are shown in the following table.

Real Estate Taxes 41
Former Industrial Warehouse
Taxes and Assessments - 2021Assessed Value Taxes and Assessments
Tax ID Land Improvements Total Tax RateAd Valorem
Taxes Direct Assessments Total400-28-001G $2,426,487 $0 $2,426,487 0.000000% $0 $0 $0
Based on the concluded market value of the subject, the assessed value appears high. However, since the subject is owned by a tax-exempt political subdivision of the State of Arizona and not subject to property taxes, a tax appeal is not warranted. When the property is sold and redeveloped, a new assessment will be conducted reflective of the new improvements.

Highest and Best Use 42
Former Industrial Warehouse
Highest and Best Use The highest and best use of a property is the reasonably probable use resulting in the highest value, and represents the use of an asset that maximizes its productivity.
Process Before a property can be valued, an opinion of highest and best use must be developed for the subject site, both as though vacant, and as improved or proposed. By definition, the highest and best use must be:
· Physically possible.
· Legally permissible under the zoning regulations and other restrictions that apply to the site.
· Financially feasible.
· Maximally productive, i.e., capable of producing the highest value from among the permissible, possible, and financially feasible uses.
As Though Vacant First, the property is evaluated as though vacant, with no improvements.
Physically Possible The physical characteristics of the site do not appear to impose any unusual restrictions on development. Overall, the physical characteristics of the site and the availability of utilities result in functional utility suitable for a variety of uses.
Legally Permissible The site is zoned NMU, Neighborhood Mixed Use. Permitted uses include animal pet shop, retail; Art gallery or museum; Bar, lounge, or tavern; Bed and breakfast; Catering service; Community playfields and parks; Day care, commercial; Day care, residential; Dry cleaning and laundry service; Dwelling, duplex; Dwelling, multi-family; Financial institution; Fitness and recreational sports center; General retail; Medical office or clinic; Office, business or professional; Public safety facility; Restaurant; Social service facility; Utility facility, minor; Vehicle service and repair, minor; Veterinary clinic. There are no apparent legal restrictions, such as easements or deed restrictions, effectively limiting the use of the property. Given prevailing land use patterns in the area, only mixed use - predominantly residential is given further consideration in determining highest and best use of the site, as though vacant.
Financially Feasible Based on the accompanying analysis of the market, there is currently adequate demand for mixed use - predominantly residential in the subject’s area. It appears a newly developed mixed use - predominantly residential on the site would have a value commensurate with its cost. Therefore, mixed use - predominantly residential is considered to be financially feasible.

Highest and Best Use 43
Former Industrial Warehouse
Maximally Productive There does not appear to be any reasonably probable use of the site that would generate a higher residual land value than mixed use - predominantly residential. Accordingly, mixed use - predominantly residential, developed to the normal market density level permitted by zoning, is the maximally productive use of the property.
Conclusion Development of the site for mixed use - predominantly residential is the only use which meets the four tests of highest and best use. Therefore, it is concluded to be the highest and best use of the property as though vacant.
As Improved The subject site is improved with a metal manufacturing building that is at the end of its economic life. The existing improvements are not consistent with the highest and best use as vacant, are in fair to poor condition, are functionally obsolete, are fully depreciated and underutilize the site.
Accordingly, the highest and best use is to redevelop the site for mixed use - predominantly residential.
Most Probable Buyer Taking into account the characteristics of the site, as well as area development trends, the probable buyer is a developer.

Valuation Methodology 44
Former Industrial Warehouse
Valuation
Valuation Methodology Appraisers usually consider three approaches to estimating the market value of real property. These are the cost approach, sales comparison approach and the income capitalization approach.
The cost approach assumes that the informed purchaser would pay no more than the cost of producing a substitute property with the same utility. This approach is particularly applicable when the improvements being appraised are relatively new and represent the highest and best use of the land or when the property has unique or specialized improvements for which there is little or no sales data from comparable properties.
The sales comparison approach assumes that an informed purchaser would pay no more for a property than the cost of acquiring another existing property with the same utility. This approach is especially appropriate when an active market provides sufficient reliable data. The sales comparison approach is less reliable in an inactive market or when estimating the value of properties for which no directly comparable sales data is available. The sales comparison approach is often relied upon for owner-user properties.
The income capitalization approach reflects the market’s perception of a relationship between a property’s potential income and its market value. This approach converts the anticipated net income from ownership of a property into a value indication through capitalization. The primary methods are direct capitalization and discounted cash flow analysis, with one or both methods applied, as appropriate. This approach is widely used in appraising income-producing properties.
Reconciliation of the various indications into a conclusion of value is based on an evaluation of the quantity and quality of available data in each approach and the applicability of each approach to the property type.
The methodology employed in this assignment is summarized as follows:
Approaches to ValueApproach Applicability to Subject Use in AssignmentCost Approach Not Applicable Not UtilizedSales Comparison Approach Applicable UtilizedIncome Capitalization Approach Not Applicable Not Utilized

Sales Comparison Approach 45
Former Industrial Warehouse
Sales Comparison Approach To develop an opinion of the subject’s land value, as if vacant and available to be developed to its highest and best use, we utilize the sales comparison approach. This approach develops an indication of value by researching, verifying, and analyzing sales of similar properties.
Our sales research focused on transactions within the following parameters:
· Location: areas of the western portion of the Phoenix metro exhibiting similar demographic characteristics (age of housing stock, median income levels, median home values, population density, etc.)
· Size: 3 to 15 acres
· Use: Mixed Use - predominantly residential and multifamily (medium density between 5 and 15 dwelling units per acre)
· Transaction Date: within 18 months of date of value
For this analysis, we use price per square foot as the appropriate unit of comparison because market participants typically compare sale prices and property values on this basis. The most relevant sales are summarized in the following table.
Summary of Comparable Land Sales
No. Name/AddressSale Date;Status
Effective Sale Price
SF;Acres
Units;Density(Units/Ac.) Zoning
$/SFLand $/Acre
1 Residential Land - 31 Lot Single Family Nov-20 $1,050,000 194,616 31 PAD $5.40 $235,015Agua Fria Ranch Parkway Closed 4.47 6.9YoungtownMaricopa CountyAZ
2 Residential Land - 163 Unit Multifamily Dec-20 $4,704,444 682,572 163 R-2 $6.89 $300,2262250 North 95th Avenue Closed 15.67 10.4PhoenixMaricopa CountyAZ
3 Residential Land - 138 Unit Senior Living May-21 $1,960,000 384,199 138 R1-5 $5.10 $222,22216520 North Greasewood Street Closed 8.82 15.6SurpriseMaricopa CountyAZ
4 Residential Land - 70 Unit May-21 $1,025,000 209,088 70 R1-4 $4.90 $213,54216234 North 68th Lane Closed 4.80 14.6PeoriaMaricopa CountyAZSubject 283,701 77 NMUFormer Industrial Warehouse 6.51 11.8Buckeye, AZ

Sales Comparison Approach 46
Former Industrial Warehouse
Comparable Land Sales Map

Sales Comparison Approach 47
Former Industrial Warehouse
Sale 1 Residential Land - 31 Lot Single Family
Sale 2 Residential Land - 163 Unit Multifamily
Sale 3 Residential Land - 138 Unit Senior Living
Sale 4 Residential Land - 70 Unit

Sales Comparison Approach 48
Former Industrial Warehouse
Analysis and Adjustment of Sales The sales are compared to the subject and adjusted to account for material differences that affect value. Adjustments are considered for the following factors, in the sequence shown below.
Adjustment Factor Accounts For Comments
Effective Sale Price Atypical economics of a transaction, such as demolition cost or expenditures by buyer at time of purchase.
No adjustments required.
Real Property Rights Fee simple, leased fee, leasehold, partial interest, etc.
No adjustments required.
Financing Terms Seller financing, or assumption of existing financing, at non-market terms.
No adjustments required.
Conditions of Sale Extraordinary motivation of buyer or seller, assemblage, forced sale.
No adjustments required.
Market Conditions Changes in the economic environment over time that affect the appreciation and depreciation of real estate.
Multifamily land values have been increasing over the past 24 months at moderately high levels. A 10% annual appreciation rate is applied.
Location Market or submarket area influences on sale price; surrounding land use influences.
See discussion following this table.
Access/Exposure Convenience to transportation facilities; ease of site access; visibility; traffic counts.
No adjustments required.
Size Inverse relationship that often exists between parcel size and unit value.
Only Sale 2 requires a slight upward adjustment for its much larger size.
Shape and Topography
Primary physical factors that affect the utility of a site for its highest and best use.
No adjustments required.
Zoning/Density Government regulations that affect the types and intensities of uses allowable on a site.
Sale 1 has a lower density than the subject which requires upward adjustment. Sales 3 and 4 have higher densities warranting downward adjustment.

Sales Comparison Approach 49
Former Industrial Warehouse
Adjustment Factor Accounts For Comments
Entitlements The specific level of governmental approvals attained pertaining to development of a site.
The subject is zoned for mixed-use with predominantly residential uses expected. However, no plat or site plan has been approved. Sales 1, 2 and 3 each had approved plats/site plans at the time of contract, or the sale was contingent on these approvals. Thus, they are considered superior and downward adjustments are applied.
Offsite Development Status
The proximity of street and utility improvements in relation to a property to allow for development.
The subject property, and Sales 1, 2 and 3, each have all necessary street and utility improvements in place adjacent to their respective sites to allow for immediate development without significant cost expenditures. Sale 4 has utilities available, but will need to developed streets and side-street improvements as part of development. Thus, an upward adjustment is applied.
Location Adjustment ComparisonSubject Property Comparable 1 Comparable 2 Comparable 3 Comparable 4
3-mile population 18,517 61,359 117,694 87,587 97,335 1-mile median household income 48,749$ 61,667$ 62,690$ 77,434$ 43,310$
1-mile median home value 170,877$ 207,652$ 222,969$ 345,138$ 165,999$ 1-mile median year built 1993 1996 2002 2000 1988
Overall Rating vs. Subject Property Slightly Superior Superior Inferior *** SimilarAdjustment Applied None
Source: CoStar
*** The immediate land use adjacent east of this property is a junk yard which significantly impacts the desirability of this site for residential development.

Sales Comparison Approach 50
Former Industrial Warehouse
The following table summarizes the adjustments we make to each sale.
Land Sales Adjustment Grid Subject Comparable 1 Comparable 2 Comparable 3 Comparable 4
Name Former Industrial Warehouse
Residential Land - 31 Lot Single Family
Residential Land - 163 Unit Multifamily
Residential Land - 138 Unit Senior Living
Residential Land - 70 Unit
Address 301 East Centre Avenue
Agua Fria Ranch Parkway
2250 North 95th Avenue
16520 North Greasewood
16234 North 68th Lane
City Buckeye Youngtown Phoenix Surprise PeoriaSale Date Nov-20 Dec-20 May-21 May-21Sale Status Closed Closed Closed ClosedSale Price $1,050,000 $4,704,000 $1,960,000 $1,025,000Effective Sale Price $1,050,000 $4,704,444 $1,960,000 $1,025,000Square Feet 283,701 194,616 682,572 384,199 209,088Acres 6.51 4.47 15.67 8.82 4.80Zoning Code NMU PAD R-2 R1-5 R1-4Zoned Units 77 31 163 138 70Units Per Acre 11.8 6.9 10.4 15.6 14.6Price per Square Foot $5.40 $6.89 $5.10 $4.90Property Rights Fee Simple Fee Simple Fee Simple Fee Simple
% Adjustment – – – –Financing Terms Cash to seller Cash to seller Cash to seller Cash to seller
% Adjustment – – – –Conditions of Sale Arm's Length Arm's Length Arm's Length Arm's Length
% Adjustment – – – –Market Conditions 5/29/2021 Nov-20 Dec-20 May-21 May-21
Annual % Adjustment 10% 5% 4% – –Cumulative Adjusted Price $5.67 $7.17 $5.10 $4.90Location -5% -15% 10% –Access/Exposure – – – –Size – 5% – –Shape and Topography – – – –Zoning/Density 5% – -5% -5%Entitlements -5% -10% -5% –Offsite Development Status – – – 10%Net $ Adjustment -$0.28 -$1.43 $0.00 $0.25Net % Adjustment -5% -20% 0% 5%Final Adjusted Price $5.38 $5.73 $5.10 $5.15Overall Adjustment 0% -17% 0% 5%
Range of Adjusted Prices $5.10 - $5.73Average $5.34Indicated Value $5.35

Sales Comparison Approach 51
Former Industrial Warehouse
Market Value Conclusion – As Is Prior to adjustment, the sales reflect a range of $4.90 - $6.89 per square foot. After adjustment, the range is narrowed to $5.10 - $5.73 per square foot, with an average of $5.34 per square foot. We give equal weight to all four sales, and arrive at an underlying land value conclusion of $5.34 per square foot.
As previously stated, the existing warehouse improvements, including significant concrete and asphalt pavement, will require demolition prior to redevelopment as a mixed use - predominantly residential project with approximately 77 dwelling units. The prospective buyer will bear the expense and risk of demolishing the improvements.
Demolition cost estimates are contained in the addenda. The estimates vary from $557,000 to $744,000. The cost is projected toward the middle of the range at $650,000. In addition, the prospective buyer must be incentivized to take on the coordination and risk of the project and is entitled to a small entrepreneurial reward. At 5% to 10%, this amount is $32,500 to $65,000; I will add $50,000 to the demolition costs. Thus, $700,000 is subtracted from the underlying land value.
Based on the preceding analysis, the market value as is conclusion is presented as follows:
Market Value Conclusion - As IsIndicated Land Value per Square Foot $5.35Subject Square Feet 283,701Indicated Land Value $1,517,800Adjustments
Demolition of Existing Improvements -$650,000Entrepreneurial Reward -$50,000
Total Adjustments -$700,000Indicated "As Is" Market Value $817,800Rounded $820,000

Reconciliation and Conclusion of Value 52
Former Industrial Warehouse
Reconciliation and Conclusion of Value As discussed previously, we use only the sales comparison approach in developing an opinion of value for the subject. The cost and income approaches are not applicable, and are not used.
Based on the preceding valuation analysis and subject to the definitions, assumptions, and limiting conditions expressed in the report, our value opinion follows:
Value ConclusionValue Type & Appraisal Premise Interest Appraised Date of Value Value ConclusionMarket Value As Is Fee Simple May 29, 2021 $820,000
Extraordinary Assumptions and Hypothetical Conditions
1. None
1. None
The use of any extraordinary assumption or hypothetical condition may have affected the assignment results.
The value conclusions are based on the following hypothetical conditions. A hypothetical condition is a condition, directly related to a specific assignment, which is contrary to what is known by the appraiser to exist on the effective date of the assignment results, but is used for the purpose of analysis.
The value conclusions are subject to the following extraordinary assumptions. An extraordinary assumption is an assignment-specific assumption as of the effective date regarding uncertain information used in an analysis which, if found to be false, could alter the appraiser’s opinions or conclusions.
Exposure Time Exposure time is the length of time the subject property would have been exposed for sale in the market had it sold on the effective valuation date at the concluded market value. Exposure time is always presumed to precede the effective date of the appraisal. Based on our review of recent sales transactions for similar properties and our analysis of supply and demand in the local market, it is our opinion that the probable exposure time for the subject at the concluded market value stated previously is 6 to 12 months.
Marketing Time Marketing time is an estimate of the amount of time it might take to sell a property at the concluded market value immediately following the effective date of value. As we foresee no significant changes in market conditions in the near term, it is our opinion that a reasonable marketing period for the subject is likely to be the same as the exposure time. Accordingly, we estimate the subject’s marketing period at 6 to 12 months.

Certification 53
Former Industrial Warehouse
Certification We certify that, to the best of our knowledge and belief:
1. The statements of fact contained in this report are true and correct.
2. The reported analyses, opinions, and conclusions are limited only by the reported assumptions and limiting conditions, and are our personal, impartial, and unbiased professional analyses, opinions, and conclusions.
3. We have no present or prospective interest in the property that is the subject of this report and no personal interest with respect to the parties involved.
4. We have previously appraised the property that is the subject of this report for another client. We have provided no other services, as an appraiser or in any other capacity, regarding the property that is the subject of this report within the three-year period immediately preceding the agreement to perform this assignment.
5. We have no bias with respect to the property that is the subject of this report or to the parties involved with this assignment.
6. Our engagement in this assignment was not contingent upon developing or reporting predetermined results.
7. Our compensation for completing this assignment is not contingent upon the development or reporting of a predetermined value or direction in value that favors the cause of the client, the amount of the value opinion, the attainment of a stipulated result, or the occurrence of a subsequent event directly related to the intended use of this appraisal.
8. Our analyses, opinions, and conclusions were developed, and this report has been prepared, in conformity with the Uniform Standards of Professional Appraisal Practice as well as applicable state appraisal regulations.
9. The reported analyses, opinions, and conclusions were developed, and this report has been prepared, in conformity with the requirements of the Code of Professional Ethics and Standards of Professional Appraisal Practice of the Appraisal Institute.
10. The use of this report is subject to the requirements of the Appraisal Institute relating to review by its duly authorized representatives.
11. William M. Dominick made a personal inspection of the property that is the subject of this report.
12. No one provided significant real property appraisal assistance to the person(s) signing this certification.
13. We have experience in appraising properties similar to the subject and are in compliance with the Competency Rule of USPAP.
14. As of the date of this report, William M. Dominick has completed the Standards and Ethics Education Requirements for Candidates/Practicing Affiliates of the Appraisal Institute.
William M. Dominick Arizona Certified General Real Estate Appraiser #30129

Assumptions and Limiting Conditions 54
Former Industrial Warehouse
Assumptions and Limiting Conditions
This appraisal and any other work product related to this engagement are limited by the following standard assumptions, except as otherwise noted in the report:
1. The title is marketable and free and clear of all liens, encumbrances, encroachments, easements and restrictions. The property is under responsible ownership and competent management and is available for its highest and best use.
2. There are no existing judgments or pending or threatened litigation that could affect the value of the property.
3. There are no hidden or undisclosed conditions of the land or of the improvements that would render the property more or less valuable. Furthermore, there is no asbestos in the property.
4. The revenue stamps placed on any deed referenced herein to indicate the sale price are in correct relation to the actual dollar amount of the transaction.
5. The property is in compliance with all applicable building, environmental, zoning, and other federal, state and local laws, regulations and codes.
6. The information furnished by others is believed to be reliable, but no warranty is given for its accuracy.
This appraisal and any other work product related to this engagement are subject to the following limiting conditions, except as otherwise noted in the report:
1. An appraisal is inherently subjective and represents our opinion as to the value of the property appraised.
2. The conclusions stated in our appraisal apply only as of the effective date of the appraisal, and no representation is made as to the effect of subsequent events.
3. No changes in any federal, state or local laws, regulations or codes (including, without limitation, the Internal Revenue Code) are anticipated.
4. No environmental impact studies were either requested or made in conjunction with this appraisal, and we reserve the right to revise or rescind any of the value opinions based upon any subsequent environmental impact studies. If any environmental impact statement is required by law, the appraisal assumes that such statement will be favorable and will be approved by the appropriate regulatory bodies.
5. Unless otherwise agreed to in writing, we are not required to give testimony, respond to any subpoena or attend any court, governmental or other hearing with reference to the property without compensation relative to such additional employment.
6. We have made no survey of the property and assume no responsibility in connection with such matters. Any sketch or survey of the property included in this report is for illustrative purposes only and should not be considered to be scaled accurately for size. The appraisal

Assumptions and Limiting Conditions 55
Former Industrial Warehouse
covers the property as described in this report, and the areas and dimensions set forth are assumed to be correct.
7. No opinion is expressed as to the value of subsurface oil, gas or mineral rights, if any, and we have assumed that the property is not subject to surface entry for the exploration or removal of such materials, unless otherwise noted in our appraisal.
8. We accept no responsibility for considerations requiring expertise in other fields. Such considerations include, but are not limited to, legal descriptions and other legal matters such as legal title, geologic considerations such as soils and seismic stability; and civil, mechanical, electrical, structural and other engineering and environmental matters. Such considerations may also include determinations of compliance with zoning and other federal, state, and local laws, regulations and codes.
9. The distribution of the total valuation in the report between land and improvements applies only under the reported highest and best use of the property. The allocations of value for land and improvements must not be used in conjunction with any other appraisal and are invalid if so used. The appraisal report shall be considered only in its entirety. No part of the appraisal report shall be utilized separately or out of context.
10. Neither all nor any part of the contents of this report (especially any conclusions as to value, the identity of the appraisers, or any reference to the Appraisal Institute) shall be disseminated through advertising media, public relations media, news media or any other means of communication (including without limitation prospectuses, private offering memoranda and other offering material provided to prospective investors) without the prior written consent of the persons signing the report.
11. Information, estimates and opinions contained in the report and obtained from third-party sources are assumed to be reliable and have not been independently verified.
12. Any income and expense estimates contained in the appraisal report are used only for the purpose of estimating value and do not constitute predictions of future operating results.
13. If the property is subject to one or more leases, any estimate of residual value contained in the appraisal may be particularly affected by significant changes in the condition of the economy, of the real estate industry, or of the appraised property at the time these leases expire or otherwise terminate.
14. Unless otherwise stated in the report, no consideration has been given to personal property located on the premises or to the cost of moving or relocating such personal property; only the real property has been considered.
15. The current purchasing power of the dollar is the basis for the values stated in the appraisal; we have assumed that no extreme fluctuations in economic cycles will occur.
16. The values found herein are subject to these and to any other assumptions or conditions set forth in the body of this report but which may have been omitted from this list of Assumptions and Limiting Conditions.
17. The analyses contained in the report necessarily incorporate numerous estimates and assumptions regarding property performance, general and local business and economic

Assumptions and Limiting Conditions 56
Former Industrial Warehouse
conditions, the absence of material changes in the competitive environment and other matters. Some estimates or assumptions, however, inevitably will not materialize, and unanticipated events and circumstances may occur; therefore, actual results achieved during the period covered by our analysis will vary from our estimates, and the variations may be material.
18. The Americans with Disabilities Act (ADA) became effective January 26, 1992. We have not made a specific survey or analysis of the property to determine whether the physical aspects of the improvements meet the ADA accessibility guidelines. We claim no expertise in ADA issues, and render no opinion regarding compliance of the subject with ADA regulations. Inasmuch as compliance matches each owner’s financial ability with the cost to cure the non-conforming physical characteristics of a property, a specific study of both the owner’s financial ability and the cost to cure any deficiencies would be needed for the Department of Justice to determine compliance.
19. The appraisal report is prepared for the exclusive benefit of you, your subsidiaries and/or affiliates. It may not be used or relied upon by any other party. All parties who use or rely upon any information in the report without our written consent do so at their own risk.
20. No studies have been provided to us indicating the presence or absence of hazardous materials on the subject property or in the improvements, and our valuation is predicated upon the assumption that the subject property is free and clear of any environment hazards including, without limitation, hazardous wastes, toxic substances and mold. No representations or warranties are made regarding the environmental condition of the subject property. IRR - Phoenix, Integra Realty Resources, Inc., and their respective officers, owners, managers, directors, agents, subcontractors or employees (the “Integra Parties”), shall not be responsible for any such environmental conditions that do exist or for any engineering or testing that might be required to discover whether such conditions exist. Because we are not experts in the field of environmental conditions, the appraisal report cannot be considered as an environmental assessment of the subject property.
21. The persons signing the report may have reviewed available flood maps and may have noted in the appraisal report whether the subject property is located in an identified Special Flood Hazard Area. However, we are not qualified to detect such areas and therefore do not guarantee such determinations. The presence of flood plain areas and/or wetlands may affect the value of the property, and the value conclusion is predicated on the assumption that wetlands are non-existent or minimal.
22. We are not a building or environmental inspector. The Integra Parties do not guarantee that the subject property is free of defects or environmental problems. Mold may be present in the subject property and a professional inspection is recommended.
23. The appraisal report and value conclusions for an appraisal assume the satisfactory completion of construction, repairs or alterations in a workmanlike manner.
24. IRR - Phoenix is an independently owned and operated company. The parties hereto agree that Integra shall not be liable for any claim arising out of or relating to any appraisal report or any information or opinions contained therein as such appraisal report is the sole and exclusive responsibility of IRR - Phoenix. In addition, it is expressly agreed that in any action

Assumptions and Limiting Conditions 57
Former Industrial Warehouse
which may be brought against the Integra Parties arising out of, relating to, or in any way pertaining to the engagement letter, the appraisal reports or any related work product, the Integra Parties shall not be responsible or liable for any incidental or consequential damages or losses, unless the appraisal was fraudulent or prepared with intentional misconduct. It is further expressly agreed that the collective liability of the Integra Parties in any such action shall not exceed the fees paid for the preparation of the assignment (unless the appraisal was fraudulent or prepared with intentional misconduct). It is expressly agreed that the fees charged herein are in reliance upon the foregoing limitations of liability.
25. IRR - Phoenix is an independently owned and operated company, which has prepared the appraisal for the specific intended use stated elsewhere in the report. The use of the appraisal report by anyone other than the Client is prohibited except as otherwise provided. Accordingly, the appraisal report is addressed to and shall be solely for the Client’s use and benefit unless we provide our prior written consent. We expressly reserve the unrestricted right to withhold our consent to your disclosure of the appraisal report or any other work product related to the engagement (or any part thereof including, without limitation, conclusions of value and our identity), to any third parties. Stated again for clarification, unless our prior written consent is obtained, no third party may rely on the appraisal report (even if their reliance was foreseeable).
26. The conclusions of this report are estimates based on known current trends and reasonably foreseeable future occurrences. These estimates are based partly on property information, data obtained in public records, interviews, existing trends, buyer-seller decision criteria in the current market, and research conducted by third parties, and such data are not always completely reliable. The Integra Parties are not responsible for these and other future occurrences that could not have reasonably been foreseen on the effective date of this assignment. Furthermore, it is inevitable that some assumptions will not materialize and that unanticipated events may occur that will likely affect actual performance. While we are of the opinion that our findings are reasonable based on current market conditions, we do not represent that these estimates will actually be achieved, as they are subject to considerable risk and uncertainty. Moreover, we assume competent and effective management and marketing for the duration of the projected holding period of this property.
27. All prospective value opinions presented in this report are estimates and forecasts which are prospective in nature and are subject to considerable risk and uncertainty. In addition to the contingencies noted in the preceding paragraph, several events may occur that could substantially alter the outcome of our estimates such as, but not limited to changes in the economy, interest rates, and capitalization rates, behavior of consumers, investors and lenders, fire and other physical destruction, changes in title or conveyances of easements and deed restrictions, etc. It is assumed that conditions reasonably foreseeable at the present time are consistent or similar with the future.
28. The appraisal is also subject to the following:
Assumptions and Limiting Conditions 58
Former Industrial Warehouse
Extraordinary Assumptions and Hypothetical Conditions
1. None
1. None
The use of any extraordinary assumption or hypothetical condition may have affected the assignment results.
The value conclusions are based on the following hypothetical conditions. A hypothetical condition is a condition, directly related to a specific assignment, which is contrary to what is known by the appraiser to exist on the effective date of the assignment results, but is used for the purpose of analysis.
The value conclusions are subject to the following extraordinary assumptions. An extraordinary assumption is an assignment-specific assumption as of the effective date regarding uncertain information used in an analysis which, if found to be false, could alter the appraiser’s opinions or conclusions.

Addenda
Former Industrial Warehouse
Addendum A
Appraiser Qualifications

William M. Dominick Integra Realty Resources - Phoenix
irr.com
T 602-257-1451
2999 North 44th Street Suite 512 Phoenix, AZ 85018
Experience Mr. William M. Dominick is a Managing Director of Integra Realty Resources – Phoenix (IRR – Phoenix). His wholly owned company, Burke Hansen, LLC, was acquired by IRR – Phoenix in late 2019. He has been engaged in the valuation and analysis of real property since 1985. Clients have consistently returned to work with Mr. Dominick because of his broad base of market knowledge that allows him to precisely quantify the myriad of variables involved in every project. He brings to his practice exacting standards and forthright objectivity. Throughout his career, Mr. Dominick has cultivated his base of knowledge and expanded his scope of vision. He gained exposure to regional and national real estate markets through his experience with a number of firms, including CB Commercial Real Estate Group, Inc. He has developed an extensive database of original information on subdivisions and master planned communities throughout Arizona, Nevada, New Mexico and Colorado. His experience as a homebuilder and land developer has provided invaluable insight into aspects of real estate that most appraisers do not properly understand. Though Mr. Dominick has been a valuation expert since his career began, he has developed extensive skills and knowledge in the fields of new construction, rehabilitation, development, litigation, asset management, appraisal review, brokerage/sales activity, purchase/lease negotiation, and bankruptcy workouts. Because of this broad based experience, he has developed an extensive consulting/valuation practice focused on litigation support and expert witness testimony. 2020 to Present, Managing Director, Integra Realty Resources - Phoenix 2000 to 2019, President and Manager, BURKE HANSEN, LLC 2010 to 2016, Review Appraiser, BILTMORE BANK OF ARIZONA 2004 to 2014, Manager, BALMORAL INVESTMENTS GROUP II, LLC 2004 to 2008, Manager, MODEL HOME SOLUTIONS, LLC 2005 to 2008, President and Manager, MERIT HOMES, LLC 2003 to 2006, Manager, LRN MANAGEMENT, LLC 1996 to 2000, Principal, BURKE HANSEN, INC. 1993 to 1996, Principal, SUNWEST APPRAISAL GROUP, INC. 1989 to 1992, Senior R.E. Analyst, CB COMMERCIAL R. E. GROUP 1989, Associate Appraiser, WILLIS ASSOCIATES, INC. 1988, Senior Appraiser, MOUNTAIN WEST RESEARCH INC. 1985 to 1988, Project Manager, TARANTELLO & COMPANY
Professional Activities & Affiliations Member: Appraisal Institute - Practicing Affiliate Member: Tucson Association of Realtors
Licenses
[email protected] - 602-648-4302

William M. Dominick Integra Realty Resources - Phoenix
irr.com
T 602-257-1451
2999 North 44th Street Suite 512 Phoenix, AZ 85018
Licenses (Cont'd) Arizona, Certified General Real Estate Appraiser, 30129, Expires August 2022 Arizona, Designated Supervisory Appraiser, DSA - DS0154
Education Bachelor of Science - Accounting, Arizona State University, 1985 Over 1,500 hours of education in real estate appraisal, finance, environmental, legal, marketing and management. Appraisal Institute - Hotel/Motel Valuation (September 10-11, 1992; Reno, Nevada) Appraisal Institute - Fair Lending and the Appraiser (October 8, 1993; Scottsdale, Arizona) Appraisal Institute - Understanding Limited Appraisals and Appraisal Reporting Options (September 16, 1994; Scottsdale, Arizona) Appraisal Institute - Standards of Professional Practice: Part A and Part B (September 28-29 and October 12-13, 1995; Tempe, Arizona) Appraisal Institute - Subdivision Analysis (March 29, 1996; Ahwatukee, Arizona) Appraisal Institute – Litigation Valuation Overview (August 15-16, 1998; Tempe, Arizona) International Association of Assessing Officers – Attacking & Defending an Appraisal in Litigation (September 26, 1999; Las Vegas, Nevada) Appraisal Institute - Standards of Professional Practice: Part C (April 13-14, 2000; Tempe, Arizona) National Business Institute – Current Issues in Subdivision Annexation and Zoning Law (November 7, 2001; Phoenix, Arizona) Arizona School of Real Estate & Business – Land Planning & Zoning (August 27, 2002; Scottsdale, Arizona) Arizona School of Real Estate & Business – Subdivision Rules (August 28, 2002; Scottsdale, Arizona) Arizona School of Real Estate & Business - Uniform Standards of Professional Appraisal Practice (November 2003; Scottsdale, Arizona) Arizona School of Real Estate & Business – Vacant Land as an Investment (November 8, 2006; Scottsdale, Arizona) Arizona School of Real Estate & Business – Land Development 101 (November 9, 2006; Scottsdale, Arizona) Arizona School of Real Estate & Business – 1031 Exchanges – Advanced Structures & Issues (November 10, 2006; Scottsdale, Arizona) Arizona School of Real Estate & Business – Uniform Standards (November 17, 2006; Scottsdale, Arizona) Appraisal Institute – Blueprints & Specifications (November 27, 2006; On-line) Appraisal Institute – Residential Property Construction & Inspection (November 28, 2006; On-line) Arizona School of Real Estate & Business – Uniform Standards (November 8, 2008; Scottsdale, Arizona) Appraisal Institute - Subdivision Valuation (November 25, 2008; On-line) Appraisal Institute – Appraising Convenience Stores (February 10, 2009; On-line) Arizona School of Real Estate & Business – Supervising Beginning Appraisers (February 18, 2009; Scottsdale, Arizona) Appraisal Institute – R39937, Appraisal Policy Changes, State Code: ABA #0909-874 (October 1, 2009) Appraisal Institute – I400, 7-Hour National USPAP Update Course, 2010 Version, State
[email protected] - 602-648-4302
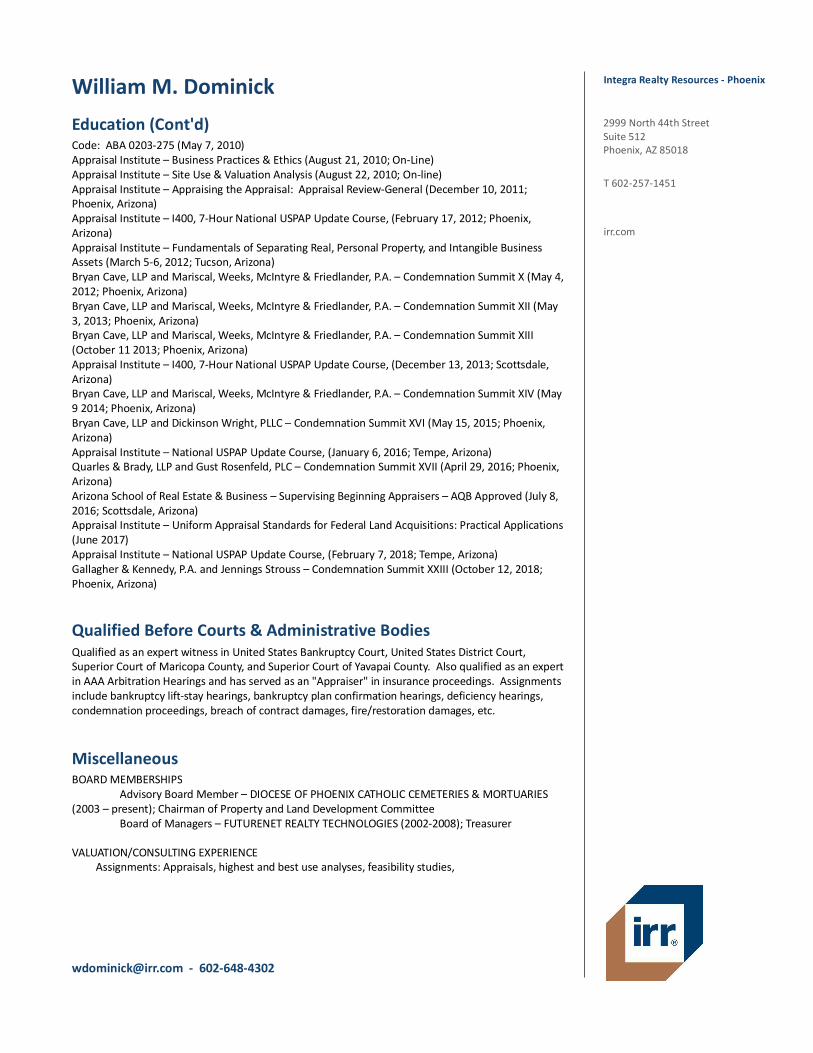
William M. Dominick Integra Realty Resources - Phoenix
irr.com
T 602-257-1451
2999 North 44th Street Suite 512 Phoenix, AZ 85018
Education (Cont'd) Code: ABA 0203-275 (May 7, 2010) Appraisal Institute – Business Practices & Ethics (August 21, 2010; On-Line) Appraisal Institute – Site Use & Valuation Analysis (August 22, 2010; On-line) Appraisal Institute – Appraising the Appraisal: Appraisal Review-General (December 10, 2011; Phoenix, Arizona) Appraisal Institute – I400, 7-Hour National USPAP Update Course, (February 17, 2012; Phoenix, Arizona) Appraisal Institute – Fundamentals of Separating Real, Personal Property, and Intangible Business Assets (March 5-6, 2012; Tucson, Arizona) Bryan Cave, LLP and Mariscal, Weeks, McIntyre & Friedlander, P.A. – Condemnation Summit X (May 4, 2012; Phoenix, Arizona) Bryan Cave, LLP and Mariscal, Weeks, McIntyre & Friedlander, P.A. – Condemnation Summit XII (May 3, 2013; Phoenix, Arizona) Bryan Cave, LLP and Mariscal, Weeks, McIntyre & Friedlander, P.A. – Condemnation Summit XIII (October 11 2013; Phoenix, Arizona) Appraisal Institute – I400, 7-Hour National USPAP Update Course, (December 13, 2013; Scottsdale, Arizona) Bryan Cave, LLP and Mariscal, Weeks, McIntyre & Friedlander, P.A. – Condemnation Summit XIV (May 9 2014; Phoenix, Arizona) Bryan Cave, LLP and Dickinson Wright, PLLC – Condemnation Summit XVI (May 15, 2015; Phoenix, Arizona) Appraisal Institute – National USPAP Update Course, (January 6, 2016; Tempe, Arizona) Quarles & Brady, LLP and Gust Rosenfeld, PLC – Condemnation Summit XVII (April 29, 2016; Phoenix, Arizona) Arizona School of Real Estate & Business – Supervising Beginning Appraisers – AQB Approved (July 8, 2016; Scottsdale, Arizona) Appraisal Institute – Uniform Appraisal Standards for Federal Land Acquisitions: Practical Applications (June 2017) Appraisal Institute – National USPAP Update Course, (February 7, 2018; Tempe, Arizona) Gallagher & Kennedy, P.A. and Jennings Strouss – Condemnation Summit XXIII (October 12, 2018; Phoenix, Arizona)
Qualified Before Courts & Administrative Bodies Qualified as an expert witness in United States Bankruptcy Court, United States District Court, Superior Court of Maricopa County, and Superior Court of Yavapai County. Also qualified as an expert in AAA Arbitration Hearings and has served as an "Appraiser" in insurance proceedings. Assignments include bankruptcy lift-stay hearings, bankruptcy plan confirmation hearings, deficiency hearings, condemnation proceedings, breach of contract damages, fire/restoration damages, etc.
Miscellaneous BOARD MEMBERSHIPS Advisory Board Member – DIOCESE OF PHOENIX CATHOLIC CEMETERIES & MORTUARIES (2003 – present); Chairman of Property and Land Development Committee Board of Managers – FUTURENET REALTY TECHNOLOGIES (2002-2008); Treasurer VALUATION/CONSULTING EXPERIENCE Assignments: Appraisals, highest and best use analyses, feasibility studies,
[email protected] - 602-648-4302

William M. Dominick Integra Realty Resources - Phoenix
irr.com
T 602-257-1451
2999 North 44th Street Suite 512 Phoenix, AZ 85018
Miscellaneous (Cont'd) market/marketability studies, development cash flow analyses, and expert witness testimony. Property Types: Residential and commercial/industrial subdivisions; master planned communities; apartment complexes; office buildings; shopping centers; fast food restaurants; business/industrial parks; restaurants; mini-storage facilities; hotels/motels; c-store and gas stations; retail, industrial, and office developments. Geographic Competency: Arizona (Maricopa, Pinal, Yavapai, Navajo, Coconino, LaPaz, Mohave and Pima Counties); California (San Diego, Orange, Riverside, and San Bernardino Counties); Nevada (Clark and Washoe Counties); Texas (Liberty County); Colorado (El Paso, Adams, and Douglas Counties) Speaking Engagements: Risk Management Association, Arizona Chapter Meeting, September 13, 2012, Panel Member, "The Elements of Valuation," Ritz Carlton Hotel, Phoenix, AZ. Condemnation Summit XII, May 3, 2013, Panel Member, "Professionalism Within the Appraisal and Law Professions: A Current Perspective," Arizona Biltmore Resort, Phoenix, AZ. The Biltmore Bank of Arizona hosted event, November 18, 2014, Presenter, "What Every Arizona Homeowner and Property Investor Needs to Know about Proposition 117," Arizona Country Club, Phoenix, AZ. State Bar of Arizona Convention, June 25, 2015, Faculty Member/Panelist, "Risky Business: Challenges in Real Estate Transactions," Arizona Biltmore Resort, Phoenix, AZ. Condemnation Summit XVI, October 23, 2015, Panel Member, "Special Problems and Common Mistakes in Condemnation Appraisal Practice (Part 1)," Arizona Biltmore Resort, Phoenix, AZ. Condemnation Summit XVII, April 29, 2016, Panel Member, "Special Problems and Common Mistakes in Condemnation Appraisal Practice (Part 2)," Arizona Biltmore Resort, Phoenix, AZ. Past Member, Home Builders Association of Central Arizona Past Member, Urban Land Institute
[email protected] - 602-648-4302

About IRR
Integra Realty Resources, Inc. (IRR) provides world-class commercial real estate valuation, counseling, and advisory services. Routinely ranked among leading property valuation and consulting firms, we are now the largest independent firm in our industry in the United States, with local offices coast to coast and in the Caribbean.
IRR offices are led by MAI-designated Senior Managing Directors, industry leaders who have over 25 years, on average, of commercial real estate experience in their local markets. This experience, coupled with our understanding of how national trends affect the local markets, empowers our clients with the unique knowledge, access, and historical perspective they need to make the most informed decisions.
Many of the nation's top financial institutions, developers, corporations, law firms, and government agencies rely on our professional real estate opinions to best understand the value, use, and feasibility of real estate in their market.
Local Expertise...Nationally!
irr.com

Addenda
Former Industrial Warehouse
Addendum B
IRR Quality Assurance Survey

Addenda
Former Industrial Warehouse
IRR Quality Assurance Survey
We welcome your feedback! At IRR, providing a quality work product and delivering on time is what we strive to accomplish. Our local offices are determined to meet your expectations. Please reach out to your local office contact so they can resolve any issues.
Integra Quality Control Team Integra does have a Quality Control Team that responds to escalated concerns related to a specific assignment as well as general concerns that are unrelated to any specific assignment. We also enjoy hearing from you when we exceed expectations! The members of this team are listed below. You can communicate with this team by clicking on the link below. If you would like a follow up call, please provide your contact information and a member of this Quality Control Team will call contact you.
Link to the IRR Quality Assurance Survey: quality.irr.com
Integra Regional Quality Managers
Region Regional Quality Manager Title
Northeast Region William Kimball, MAI Senior Managing Director
Southeast Region Leslie North, MAI, AI-GRS Managing Director
Central Region Gary Wright, MAI, SRA Senior Managing Director
Southwest Region Rusty Rich, MAI, MRICS Senior Managing Director
West Region Larry Close, MAI Senior Managing Director
Corporate Rob McPherson,
MAI, CCIM Director of Product Development and
Quality

Addenda
Former Industrial Warehouse
Addendum C
Definitions

Addenda
Former Industrial Warehouse
Definitions
The source of the following definitions is the Appraisal Institute, The Dictionary of Real Estate Appraisal, 6th ed. (Chicago: Appraisal Institute, 2015), unless otherwise noted.
As Is Market Value The estimate of the market value of real property in its current physical condition, use, and zoning as of the appraisal date.
Disposition Value The most probable price that a specified interest in property should bring under the following conditions:
1. Consummation of a sale within a specified time, which is shorter than the typical exposure time for such a property in that market.
2. The property is subjected to market conditions prevailing as of the date of valuation.
3. Both the buyer and seller are acting prudently and knowledgeably.
4. The seller is under compulsion to sell.
5. The buyer is typically motivated.
6. Both parties are acting in what they consider to be their best interests.
7. An adequate marketing effort will be made during the exposure time.
8. Payment will be made in cash in U.S. dollars (or the local currency) or in terms of financial arrangements comparable thereto.
9. The price represents the normal consideration for the property sold, unaffected by special or creative financing or sales concessions granted by anyone associated with the sale.
This definition can also be modified to provide for valuation with specified financing terms.
Effective Date 1. The date on which the appraisal or review opinion applies.
2. In a lease document, the date upon which the lease goes into effect.
Entitlement In the context of ownership, use, or development of real estate, governmental approval for annexation, zoning, utility extensions, number of lots, total floor area, construction permits, and occupancy or use permits.
Entrepreneurial Incentive The amount an entrepreneur expects to receive for his or her contribution to a project. Entrepreneurial incentive may be distinguished from entrepreneurial profit (often called developer’s

Addenda
Former Industrial Warehouse
profit) in that it is the expectation of future profit as opposed to the profit actually earned on a development or improvement. The amount of entrepreneurial incentive required for a project represents the economic reward sufficient to motivate an entrepreneur to accept the risk of the project and to invest the time and money necessary in seeing the project through to completion.
Entrepreneurial Profit 1. A market-derived figure that represents the amount an entrepreneur receives for his or her
contribution to a project and risk; the difference between the total cost of a property (cost of development) and its market value (property value after completion), which represents the entrepreneur’s compensation for the risk and expertise associated with development. An entrepreneur is motivated by the prospect of future value enhancement (i.e., the entrepreneurial incentive). An entrepreneur who successfully creates value through new development, expansion, renovation, or an innovative change of use is rewarded by entrepreneurial profit. Entrepreneurs may also fail and suffer losses.
2. In economics, the actual return on successful management practices, often identified with coordination, the fourth factor of production following land, labor, and capital; also called entrepreneurial return or entrepreneurial reward.
Exposure Time 1. The time a property remains on the market.
2. The estimated length of time that the property interest being appraised would have been offered on the market prior to the hypothetical consummation of a sale at market value on the effective date of the appraisal; a retrospective opinion based on an analysis of past events assuming a competitive and open market.
Fee Simple Estate Absolute ownership unencumbered by any other interest or estate, subject only to the limitations imposed by the governmental powers of taxation, eminent domain, police power, and escheat.
Floor Area Ratio (FAR) The relationship between the above-ground floor area of a building, as described by the zoning or building code, and the area of the plot on which it stands; in planning and zoning, often expressed as a decimal, e.g., a ratio of 2.0 indicates that the permissible floor area of a building is twice the total land area.
Highest and Best Use 1. The reasonably probable use of property that results in the highest value. The four criteria
that the highest and best use must meet are legal permissibility, physical possibility, financial feasibility, and maximum productivity.
2. The use of an asset that maximizes its potential and that is possible, legally permissible, and financially feasible. The highest and best use may be for continuation of an asset’s existing use or for some alternative use. This is determined by the use that a market participant would have in mind for the asset when formulating the price that it would be willing to bid. (ISV)

Addenda
Former Industrial Warehouse
3. [The] highest and most profitable use for which the property is adaptable and needed or likely to be needed in the reasonably near future. (Uniform Appraisal Standards for Federal Land Acquisitions)
Investment Value 1. The value of a property to a particular investor or class of investors based on the investor’s
specific requirements. Investment value may be different from market value because it depends on a set of investment criteria that are not necessarily typical of the market.
2. The value of an asset to the owner or a prospective owner for individual investment or operational objectives.
Lease A contract in which rights to use and occupy land, space, or structures are transferred by the owner to another for a specified period of time in return for a specified rent.
Leased Fee Interest The ownership interest held by the lessor, which includes the right to receive the contract rent specified in the lease plus the reversionary right when the lease expires.
Leasehold Interest The right held by the lessee to use and occupy real estate for a stated term and under the conditions specified in the lease.
Liquidation Value The most probable price that a specified interest in real property should bring under the following conditions:
1. Consummation of a sale within a short time period.
2. The property is subjected to market conditions prevailing as of the date of valuation.
3. Both the buyer and seller are acting prudently and knowledgeably.
4. The seller is under extreme compulsion to sell.
5. The buyer is typically motivated.
6. Both parties are acting in what they consider to be their best interests.
7. A normal marketing effort is not possible due to the brief exposure time.
8. Payment will be made in cash in U.S. dollars (or the local currency) or in terms of financial arrangements comparable thereto.
9. The price represents the normal consideration for the property sold, unaffected by special or creative financing or sales concessions granted by anyone associated with the sale.
This definition can also be modified to provide for valuation with specified financing terms.

Addenda
Former Industrial Warehouse
Marketing Time An opinion of the amount of time it might take to sell a real or personal property interest at the concluded market value level during the period immediately after the effective date of an appraisal. Marketing time differs from exposure time, which is always presumed to precede the effective date of an appraisal.
Market Value The most probable price which a property should bring in a competitive and open market under all conditions requisite to a fair sale, the buyer and seller each acting prudently and knowledgeably, and assuming the price is not affected by undue stimulus. Implicit in this definition is the consummation of a sale as of a specified date and the passing of title from seller to buyer under conditions whereby:
· buyer and seller are typically motivated;
· both parties are well informed or well advised, and acting in what they consider their own best interests;
· a reasonable time is allowed for exposure in the open market;
· payment is made in terms of cash in U.S. dollars or in terms of financial arrangements comparable thereto; and
· the price represents the normal consideration for the property sold unaffected by special or creative financing or sales concessions granted by anyone associated with the sale.
(Source: Code of Federal Regulations, Title 12, Chapter I, Part 34.42[h]; also Interagency Appraisal and Evaluation Guidelines, Federal Register, 75 FR 77449, December 10, 2010, page 77472)
Prospective Opinion of Value A value opinion effective as of a specified future date. The term does not define a type of value. Instead, it identifies a value opinion as being effective at some specific future date. An opinion of value as of a prospective date is frequently sought in connection with projects that are proposed, under construction, or under conversion to a new use, or those that have not yet achieved sellout or a stabilized level of long-term occupancy.

Addenda
Former Industrial Warehouse
Addendum D
Demolition Estimates

Addenda
Former Industrial Warehouse

Addenda
Former Industrial Warehouse

Addenda
Former Industrial Warehouse

Addenda
Former Industrial Warehouse

Addenda
Former Industrial Warehouse
Addendum E
Comparable Data

Land Sale Profile Sale No. 1
Location & Property Identification Residential Land - 31 Lot Single Family
Property Name:
Sub-Property Type: Residential
Agua Fria Ranch Parkway Address:
Youngtown, AZ 85363 City/State/Zip:
Maricopa County:
Submarket: NW Phoenix/Glendale
Suburban Market Orientation:
IRR Event ID: 2663381
Sale Information $1,050,000 Sale Price: $1,050,000 Effective Sale Price: 11/25/2020 Sale Date:
Recording Date: 11/25/2020 Sale Status: Closed $/Acre(Gross): $235,015 $/Land SF(Gross): $5.40 $/Acre(Usable): $235,015 $/Land SF(Usable): $5.40
$33,871 /Approved Lot $/Unit: Grantor/Seller: Arizona Developers, LLC Grantee/Buyer: Riley/Smith Development LLC
Property Rights: Fee Simple % of Interest Conveyed: 100.00 Terms of Sale: Arm's length Verification Type: Secondary Verification
Improvement and Site Data 501-45-684H Legal/Tax/Parcel ID: 4.47/4.47 Acres(Usable/Gross): 194,616/194,616 Land-SF(Usable/Gross):
Usable/Gross Ratio: 1.00 No. of Units (Potential): 31 Zoning Code: PAD Zoning Desc.: Planned Area Development
Source of Land Info.: Public Records
Residential Land - 31 Lot Single Family

Land Sale Profile Sale No. 2
Location & Property Identification Residential Land - 163 Unit Multifamily
Property Name:
Sub-Property Type: Residential
2250 North 95th Avenue Address:
Phoenix, AZ 85037 City/State/Zip:
Maricopa County:
Submarket: W Phx/SW Valley
Suburban Market Orientation:
IRR Event ID: 2663995
Sale Information $4,704,000 Sale Price: $4,704,444 Effective Sale Price: 12/20/2020 Sale Date:
Recording Date: 12/02/2020 Sale Status: Closed $/Acre(Gross): $300,226 $/Land SF(Gross): $6.89 $/Acre(Usable): $300,226 $/Land SF(Usable): $6.89
$28,862 /Apt. Unit $/Unit: Grantor/Seller: Hancock Communities Grantee/Buyer: Terralane at Park McDowell,
LLC Property Rights: Fee Simple % of Interest Conveyed: 100.00 Financing: All cash Terms of Sale: Arm's length Document Type: Warranty Deed Recording No.: 20210453434 Verification Type: Secondary Verification
Improvement and Site Data 102-34-016 Legal/Tax/Parcel ID: 15.67/15.67 Acres(Usable/Gross): 682,572/682,572 Land-SF(Usable/Gross):
Usable/Gross Ratio: 1.00
No. of Units (Potential): 163 Zoning Code: R-2 Zoning Desc.: Residential Source of Land Info.: Public Records
Residential Land - 163 Unit Multifamily

Land Sale Profile Sale No. 3
Location & Property Identification Residential Land - 138 Unit Senior Living
Property Name:
Sub-Property Type: Residential
16520 North Greasewood Street
Address:
Surprise, AZ 85374 City/State/Zip:
Maricopa County:
Submarket: NW Phoenix/Glendale
Suburban Market Orientation:
IRR Event ID: 2663380
Sale Information $1,960,000 Sale Price: $1,960,000 Effective Sale Price: 05/17/2021 Sale Date:
Recording Date: 05/17/2021 Sale Status: Closed $/Acre(Gross): $222,222 $/Land SF(Gross): $5.10 $/Acre(Usable): $222,222 $/Land SF(Usable): $5.10
$14,203 /Apt. Unit $/Unit: Grantor/Seller: Home Savers Inc Grantee/Buyer: Fig River Park, LLC Property Rights: Fee Simple % of Interest Conveyed: 100.00 Financing: Cash to seller - buyer obtained
financing Terms of Sale: Arm's length Document Type: Warranty Deed Recording No.: 20210549569 Verification Type: Secondary Verification
Improvement and Site Data 501-81-294, 501-81-295 Legal/Tax/Parcel ID: 8.82/8.82 Acres(Usable/Gross): 384,199/384,199 Land-SF(Usable/Gross):
Usable/Gross Ratio: 1.00 No. of Units (Potential): 138 Zoning Code: R1-5 Zoning Desc.: Residential Source of Land Info.: Public Records
Residential Land - 138 Unit Senior Living

Land Sale Profile Sale No. 4
Location & Property Identification Residential Land - 70 Unit Property Name:
Sub-Property Type: Residential
16234 North 68th Lane Address:
Peoria, AZ 85382 City/State/Zip:
Maricopa County:
Submarket: NW Phoenix/Glendale
Suburban Market Orientation:
IRR Event ID: 2663383
Sale Information $1,025,000 Sale Price: $1,025,000 Effective Sale Price: 05/27/2021 Sale Date:
Recording Date: 05/27/2021 Sale Status: Closed $/Acre(Gross): $213,542 $/Land SF(Gross): $4.90 $/Acre(Usable): $213,542 $/Land SF(Usable): $4.90
$14,643 /Approved Unit $/Unit: Grantor/Seller: Paradise Enclave, LLC Grantee/Buyer: Mesa Verde Holdings, LLC Property Rights: Fee Simple % of Interest Conveyed: 100.00 Financing: All cash Terms of Sale: Arm's length Document Type: Warranty Deed Recording No.: 20210592725 Verification Type: Secondary Verification
Improvement and Site Data 200-53-823 Legal/Tax/Parcel ID: 4.80/4.80 Acres(Usable/Gross): 209,088/209,088 Land-SF(Usable/Gross):
Usable/Gross Ratio: 1.00 No. of Units (Potential): 70 Zoning Code: R1-4
Zoning Desc.: Residential Source of Land Info.: Public Records
Residential Land - 70 Unit