Embed Size (px)
Citation preview

5958
Tokio Marine Holdings, Inc. | Integrated Annual Report 2020P
art 3 | Go
vernan
ce
Career summaryMr. Tsuyoshi Nagano joined Tokio Marine in April 1975. After being engaged mainly in domestic and overseas insurance underwriting, corporate planning and product planning, he served as President & CEO and Chairman of the Board of Tokio Marine & Nichido and the Company. He has been in his current position since June 2019.
Major concurrent postsDirector of Seiko Holdings Corporation (outside director)
Satoru KomiyaRepresentative Director and President & Group CEO
Career summaryMr. Satoru Komiya joined Tokio Marine in April 1983. After being engaged mainly in domestic insurance underwriting, human resources, sales planning and management of the group companies, he served as head of international insurance business as Executive Officer of the Company and now leads the management of Tokio Marine Group as Group CEO. He has been in his current position since June 2019.
Major concurrent postsChairman of the Board of Tokio Marine & Nichido
Takayuki YuasaRepresentative Director and Executive Vice President
Career summaryMr. Yuasa Takayuki joined Tokio Marine in April 1981. After being engaged in corporate planning, finance, accounting and the domestic life and non-life insurance businesses, he served as Executive Officer of Tokio Marine & Nichido and the Company responsible for risk management. His current role is head of capital strategy of the Group as Executive Vice President of the Company, which he has been in since April 2019.
Major concurrent postsExecutive Vice President of Tokio Marine & Nichido
Shinya KatanozakaOutside Director
Reason for appointment Mr. Shinya Katanozaka is expected to fulfill his supervisory functions appropriately and provide valuable advice to the Board of Directors based on his insight as a specialist in business management acquired through many years of experience in a management role. He has been in his current position since June 2020.
Major concurrent postsPresident & Chief Executive Officer, Representative Director of ANA HOLDINGS INC.Chairman of ALL NIPPON AIRWAYS CO., LTD.Vice Chairman of Japan Business Federation (Keidanren)
Shozo MoriAudit & Supervisory Board Member (Full-Time)
Reason for appointment After joining Tokio Marine, Mr. Shozo Mori was engaged mainly in domestic insurance underwriting and product planning. He is expected to fulfill his auditing functions appropriately by leveraging his wealth of experience and the results he has achieved being head of the Group’s underwriting and retention strategy as Executive Officer of the Company. He has been in his current position since June 2018.
Hirokazu FujitaAudit & Supervisory Board Member (Full-Time)
Reason for appointment Mr. Hirokazu Fujita joined Tokio Marine in April 1980. After being engaged mainly in accounting, he served as Executive Officer of Tokio Marine & Nichido and the Company in charge of accounting and financial planning. He is expected to fulfill his auditing functions appropriately by leveraging his wealth of experience and the results he has achieved being head of investment management of the Group as Senior Managing Director of the Company. He has been in his current position since June 2020.
Akira HarashimaRepresentative Director and Senior Managing Director
Career summaryMr. Akira Harashima joined Tokio Marine in April 1984. After being engaged mainly in international insurance business and corporate planning, he was in charge of international insurance business in the Americas, Asia and elsewhere as Executive Officer of the Company. His current role is head of international insurance business as Senior Managing Director of the Company, which he has been in since June 2019.
Major concurrent postsSenior Managing Director of Tokio Marine & Nichido
Tadashi HandaSenior Managing Director
Career summaryMr. Tadashi Handa joined Tokio Marine in April 1984. After being engaged mainly in domestic insurance underwriting, product development and corporate planning, his current role is head of business strategy and synergy of the Group as Senior Managing Director of the Company, which he has been in since June 2020.
Major concurrent postsSenior Managing Director of Tokio Marine & Nichido
Kenji OkadaManaging Director
Career summaryMr. Kenji Okada joined Tokio Marine in April 1986. After being engaged mainly in financial planning, corporate planning and international insurance business, his current role is head of Group legal & compliance and risk management as Managing Director of the Company, which he has been in since June 2019.
Major concurrent postsManaging Director of Tokio Marine & Nichido
Akinari HoriiOutside Audit & Supervisory Board Member
Reason for appointment Mr. Akinari Horii is expected to fulfill his auditing functions appropriately based on his insight acquired through many years of experience in his roles as an executive or a regular employee of the Bank of Japan. He has been in his current position since June 2011.
Major concurrent postsDirector and Special Advisor of The Canon Institute for Global Studies
Akihiro WaniOutside Audit & Supervisory Board Member
Reason for appointment Mr. Akihiro Wani is expected to fulfill his auditing functions appropriately based on his insight related to corporate legal affairs acquired through many years of experience as an attorney-at-law. He has been in his current position since June 2014.
Major concurrent postsAttorney-at-law
Nana OtsukiOutside Audit & Supervisory Board Member
Reason for appointment Ms. Nana Otsuki is expected to fulfill her auditing functions appropriately based on her insight related to business management acquired through many years of experience as an analyst in financial institutions. She has been in her current position since June 2018.
Major concurrent postsExecutive Officer and Chief Analyst of Monex, Inc.Professor, Graduate School of Division of Business Administration, Nagoya University of Commerce & BusinessDirector of Credit Saison Co., Ltd. (outside director)
Yoshinari EndoManaging Director
Career summaryMr. Yoshinari Endo joined Tokio Marine in April 1987. After being engaged mainly in corporate accounting and the domestic life insurance business, he served a leadership role in the financial planning of the Group as Executive Officer and General Manager of the Financial Planning Department of Tokio Marine & Nichido and the Company. His is currently responsible for investment management of the Group as Managing Director of the Company, a role he has had since June 2020.
Major concurrent postsManaging Director of Tokio Marine & Nichido
Shinichi HiroseDirector
Career summaryMr. Shinichi Hirose joined Tokio Marine in April 1982. After being engaged mainly in product planning, sales planning and the domestic life and non-life insurance businesses, he served as President & CEO of Tokio Marine & Nichido Life and as Executive Officer of the Company in charge of international insurance business. He currently has a leadership role in the management of Tokio Marine & Nichido as President & CEO, which he has had since June 2019.
Major concurrent postsPresident & CEO of Tokio Marine & Nichido
Akio MimuraOutside Director
Reason for appointment Mr. Akio Mimura is expected to fulfill his supervisory functions appropriately and provide valuable advice to the Board of Directors based on his insight as a specialist in business management acquired through many years of experience in a management role. He has been in his current position since June 2010.
Major concurrent postsSenior Advisor, Honorary Chairman of Nippon Steel CorporationDirector of JAPAN POST HOLDINGS Co., Ltd. (outside director)Director of Development Bank of Japan Inc.(outside director)Director of Nisshin Seifun Group Inc. (outside director)Chairman of The Japan Chamber of Commerce and IndustryChairman of The Tokyo Chamber of Commerce and Industry
Masako EgawaOutside Director
Reason for appointment Ms. Masako Egawa is expected to fulfill her supervisory functions appropriately and provide valuable advice to the Board of Directors based on her insight into corporate management, etc. acquired through many years of experience in financial institutions, involvement in academic activities related to corporate governance and experience at The University of Tokyo as Executive Vice President. She has been in her current position since June 2015.
Major concurrent postsSpecially Appointed Professor, Graduate School of Business Administration, Hitotsubashi UniversityDirector of Mitsui Fudosan Co., Ltd. (outside director)
Takashi MitachiOutside Director
Reason for appointment Mr. Takashi Mitachi is expected to fulfill his supervisory functions appropriately and provide valuable advice to the Board of Directors based on his insight as a specialist in business management acquired through many years of experience in a consulting firm and a management role. He has been in his current position since June 2017.
Major concurrent postsSenior Advisor of The Boston Consulting GroupDirector of Rakuten, Inc. (outside director)Director of DMG Mori Co., Ltd. (outside director)Director of Unicharm Corporation (outside director)
Nobuhiro EndoOutside Director
Reason for appointment Mr. Nobuhiro Endo is expected to fulfill his supervisory functions appropriately and provide valuable advice to the Board of Directors based on his insight as a specialist in business management acquired through many years of experience in a management role. He has been in his current position since June 2019.
Major concurrent postsChairman of the Board of NEC CorporationDirector of Sumitomo Dainippon Pharma Co., Ltd. (outside director)Director of Japan Exchange Group, Inc. (outside director)Vice Chairman of Japan Association of Corporate Executives
Profile of Directors Profile of Audit & Supervisory Board Members
Skills and Experiences of Directors and Audit & Supervisory Board Members
Name Gender Position and Major Responsibilities
Skills and Experiences
Corporate Management
Finance & Economy Accounting Legal &
ComplianceHuman
Resource
Governance & Risk
ManagementTechnology Internationality Insurance
Business
Tsuyoshi Nagano Male Chairman of the Board
Satoru Komiya Male President & Group CEO
Takayuki Yuasa Male Executive Vice President
Akira Harashima Male Senior Managing Director
Tadashi Handa Male Senior Managing Director
Kenji Okada Male Managing Director
Yoshinari Endo Male Managing Director
Shinichi Hirose Male Director
Akio Mimura Male Outside Director
Masako Egawa Female Outside Director
Takashi Mitachi Male Outside Director
Nobuhiro Endo Male Outside Director
Shinya Katanozaka Male Outside Director
Shozo Mori Male Audit & Supervisory Board Member (Full-Time)
Hirokazu Fujita Male Audit & Supervisory Board Member (Full-Time)
Akinari Horii Male Outside Audit & Supervisory Board Member
Akihiro Wani Male Outside Audit & Supervisory Board Member
Nana Otsuki Female Outside Audit & Supervisory Board Member
Tsuyoshi NaganoChairman of the Board
Part 3 ESG, the Foundation of Value Creation

Tokio Marine Holdings, Inc. | Integrated Annual Report 2020
6160
Part 3 | G
overn
ance
Corporate Governance
Fundamental Policy
Tokio Marine Holdings (the “Company”) is committed to the continuous enhancement of corporate value by fulfilling its responsibilities to customers, shareholders, employees, society, and other stakeholders as set forth in the “Tokio Marine Group Corporate Philosophy.”
For this purpose, the Company hereby establishes a sound and transparent corporate governance system and, as a holding company, recognizes the importance of appropriate control over its Group companies and has formulated the “Tokio Marine Holdings Fundamental Corporate Governance Policy.”
In this policy, the Company defines the rights of shareholders and securing fairness, and the responsibilities of the Board of Directors, etc.
Corporate Governance System
The corporate governance system of the Company is designed as a hybrid structure whereby the Nomination Committee and Compensation Committee are discretionarily established in addition to the fundamental structure of a company with an Audit & Supervisory Board. The Company believes that the above structure is optimal at this point and in light of the following measures taken: the Company determines significant business execution by resolution of the Board of Directors as an insurance holding company, and makes high-quality decisions reflecting the insight of Outside Directors and Outside Audit & Supervisory Board Members; Audit & Supervisory Board Members who hold no voting rights at the Board of Directors’ meeting conduct unbiased and objective audits; and the transparency of the decision-making process of nomination and compensation of and for Directors, Audit & Supervisory Board Members, and Executive Officers is ensured by those issues being deliberated at the Nomination Committee and Compensation Committee.
Appointment of Overseas Top Management as Group Co-Heads
Functional Global Committees, etc.
Donald ShermanCo-CIO(Group Co-Chief Investment Officer)Delphi Financial Group CEO
Christopher WilliamsCo-Head of International BusinessCo-CRSO(Group Co-Chief Retention Strategy Officer)
ERM Retention Strategy
International Insurance Investment
Digital IT
Enterprize Risk Management Committee
Global Retention StrategyCommittee
International Executive Committee
Global Investment StrategyCommittee
Digital RoundTable
Global Information Technology Committee
Corporate Governance System
Record of Measures to Strengthen Corporate Governance
Well-balanced Member Composition
All of the Company’s corporate governance committees feature memberships with a balanced composition representing viewpoints and specializations from diverse fields.
Involvement of Diverse Talent in Management
The functional global committees are staffed by diverse individuals with skills in globalization, diversity, and other areas, and through open and dynamic debate, these committees help to solve the Group management issues.
AuditBoard of Directors
(Directors)
Management Meeting
Planning andManagement Divisions
Accounting audit
(Group companies)
Internal audit
Internal audit
Recommendations
Recommendations
Report
Appointment/dismissalAppointment/dismissalAppointment/dismissal
CoordinationBusinessexecution
Audit & Supervisory BoardMembers
(Audit & Supervisory Board)
Internal Audit Section
Ind
epen
den
t Au
dito
rs
CoordinationNomination Committee
Internal Control Committee
Compensation Committee
Evaluation of theappropriateness ofaccounting audit
General Meeting of Shareholders
Board of Directors
Number of Outside Officers
5 of 13 Directors
The ratio of Outside Directors was raised to one-third in June 2019 to invigorate meetings of the Board of Directors and facilitate further enhancement of corporate governance.
Audit and Supervisory Board
Number of Outside Officers
3 of 5 Members
As an independent body entrusted by shareholders, the Audit & Supervisory Board comprises a majority of Outside Audit & Supervisory Board Members and audits the performance of Directors.
Nomination Committee
Number of Outside Officers
5 of 7 Members
The Nomination Committee and the Compensation Committee comprise a majority of outside officersand both are chaired by an outside officer.
Compensation Committee
Number of Outside Officers
5 of 6 Members
FY2002 FY2004 FY2005 FY2011 FY2013 FY2015 FY2016 FY2017 FY2018 FY2019
Structure
Mem
bership
OutsideDirectors
Non-JapaneseExecutiveOfficers
Outside Audit &Supervisory
Board Members
Policies
Compensation
AprilMillea Holdings(currently Tokio Marine Holdings)established as a company withan Audit & Supervisory Board
JulyNominationCommittee andCompensationCommitteediscretionallyestablished
NovemberEvaluations of effectiveness of Board of Directors(surveys administered to all Directors and Audit & Supervisory Board Members) commenced
3 June4
JuneRatio of OutsideDirectors raisedto one-third
2 3 (decreased in fiscal 2005)
JuneFirst non-Japanese ExecutiveOfficer appointed
August4
June6
April5
April June6
June5
JulyStock options introduced
JulySame asprevious update
JulyRatios of performance-linked bonuses increased for certain officers
AprilMillea Group CorporatePhilosophy established
MayCorporate Governance Policy formulated
MayCorporate Governance Policy renamedTokio Marine Holdings Fundamental CorporateGovernance Policy
NovemberTokio Marine HoldingsFundamental CorporateGovernance Policy revised(Major areas of revision:Appointment conditions and dismissalpolicies for the President)
Tokio Marine Holdings, Inc. | Integrated Annual Report 2020
6362
Part 3 | G
overn
ance
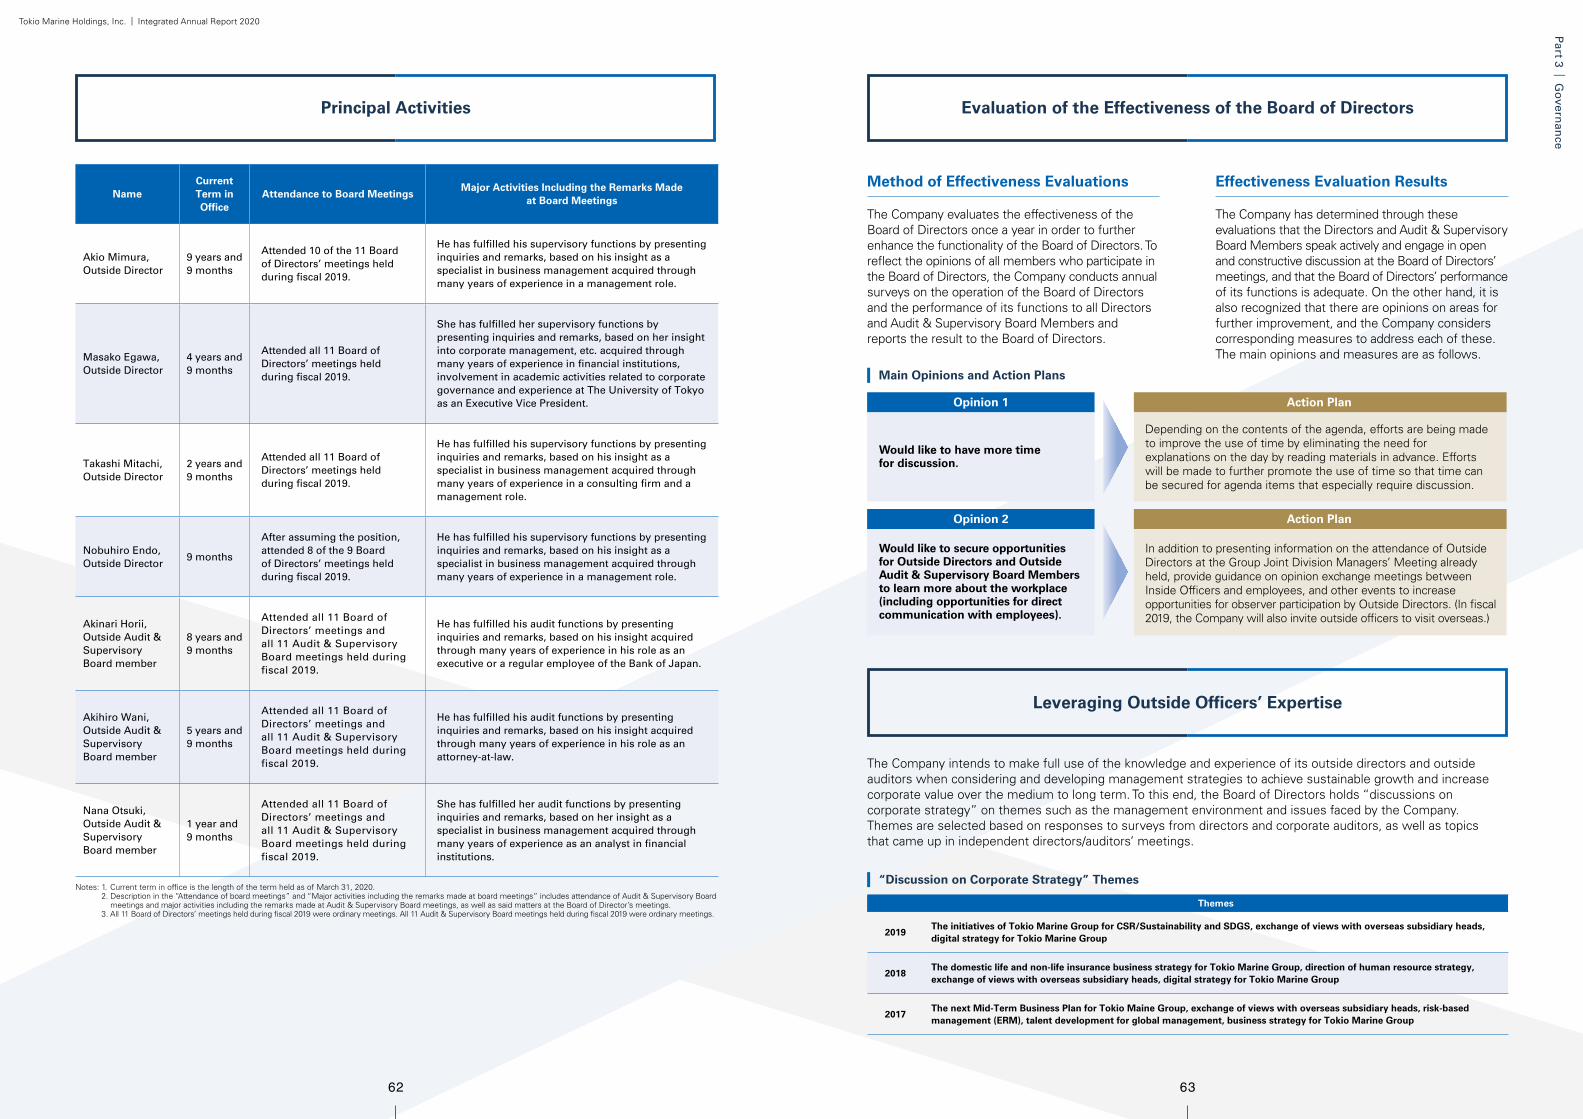
Themes
2019The initiatives of Tokio Marine Group for CSR/Sustainability and SDGS, exchange of views with overseas subsidiary heads, digital strategy for Tokio Marine Group
2018The domestic life and non-life insurance business strategy for Tokio Marine Group, direction of human resource strategy, exchange of views with overseas subsidiary heads, digital strategy for Tokio Marine Group
2017The next Mid-Term Business Plan for Tokio Maine Group, exchange of views with overseas subsidiary heads, risk-based management (ERM), talent development for global management, business strategy for Tokio Marine Group
NameCurrent Term in Office
Attendance to Board MeetingsMajor Activities Including the Remarks Made
at Board Meetings
Akio Mimura, Outside Director
9 years and 9 months
Attended 10 of the 11 Board of Directors’ meetings held during fiscal 2019.
He has fulfilled his supervisory functions by presenting inquiries and remarks, based on his insight as a specialist in business management acquired through many years of experience in a management role.
Masako Egawa, Outside Director
4 years and 9 months
Attended all 11 Board of Directors’ meetings held during fiscal 2019.
She has fulfilled her supervisory functions by presenting inquiries and remarks, based on her insight into corporate management, etc. acquired through many years of experience in financial institutions, involvement in academic activities related to corporate governance and experience at The University of Tokyo as an Executive Vice President.
Takashi Mitachi, Outside Director
2 years and 9 months
Attended all 11 Board of Directors’ meetings held during fiscal 2019.
He has fulfilled his supervisory functions by presenting inquiries and remarks, based on his insight as a specialist in business management acquired through many years of experience in a consulting firm and a management role.
Nobuhiro Endo, Outside Director
9 months
After assuming the position, attended 8 of the 9 Board of Directors’ meetings held during fiscal 2019.
He has fulfilled his supervisory functions by presenting inquiries and remarks, based on his insight as a specialist in business management acquired through many years of experience in a management role.
Akinari Horii, Outside Audit & Supervisory Board member
8 years and 9 months
Attended all 11 Board of Directors’ meetings and all 11 Audit & Supervisory Board meetings held during fiscal 2019.
He has fulfilled his audit functions by presenting inquiries and remarks, based on his insight acquired through many years of experience in his role as an executive or a regular employee of the Bank of Japan.
Akihiro Wani, Outside Audit & Supervisory Board member
5 years and 9 months
Attended all 11 Board of Directors’ meetings and all 11 Audit & Supervisory Board meetings held during fiscal 2019.
He has fulfilled his audit functions by presenting inquiries and remarks, based on his insight acquired through many years of experience in his role as an attorney-at-law.
Nana Otsuki, Outside Audit & Supervisory Board member
1 year and 9 months
Attended all 11 Board of Directors’ meetings and all 11 Audit & Supervisory Board meetings held during fiscal 2019.
She has fulfilled her audit functions by presenting inquiries and remarks, based on her insight as a specialist in business management acquired through many years of experience as an analyst in financial institutions.
Notes: 1. Current term in office is the length of the term held as of March 31, 2020.2. Description in the “Attendance of board meetings” and “Major activities including the remarks made at board meetings” includes attendance of Audit & Supervisory Board
meetings and major activities including the remarks made at Audit & Supervisory Board meetings, as well as said matters at the Board of Director’s meetings.3. All 11 Board of Directors’ meetings held during fiscal 2019 were ordinary meetings. All 11 Audit & Supervisory Board meetings held during fiscal 2019 were ordinary meetings.
Principal Activities Evaluation of the Effectiveness of the Board of Directors
Leveraging Outside Officers’ Expertise
Main Opinions and Action Plans
“Discussion on Corporate Strategy” Themes
Method of Effectiveness Evaluations
The Company evaluates the effectiveness of the Board of Directors once a year in order to further enhance the functionality of the Board of Directors. To reflect the opinions of all members who participate in the Board of Directors, the Company conducts annual surveys on the operation of the Board of Directors and the performance of its functions to all Directors and Audit & Supervisory Board Members and reports the result to the Board of Directors.
The Company intends to make full use of the knowledge and experience of its outside directors and outside auditors when considering and developing management strategies to achieve sustainable growth and increase corporate value over the medium to long term. To this end, the Board of Directors holds “discussions on corporate strategy” on themes such as the management environment and issues faced by the Company. Themes are selected based on responses to surveys from directors and corporate auditors, as well as topics that came up in independent directors/auditors’ meetings.
Effectiveness Evaluation Results
The Company has determined through these evaluations that the Directors and Audit & Supervisory Board Members speak actively and engage in open and constructive discussion at the Board of Directors’ meetings, and that the Board of Directors’ performance of its functions is adequate. On the other hand, it is also recognized that there are opinions on areas for further improvement, and the Company considers corresponding measures to address each of these. The main opinions and measures are as follows.
Opinion 1
Would like to have more time for discussion.
Action Plan
Depending on the contents of the agenda, efforts are being made to improve the use of time by eliminating the need for explanations on the day by reading materials in advance. Efforts will be made to further promote the use of time so that time can be secured for agenda items that especially require discussion.
Opinion 2
Would like to secure opportunities for Outside Directors and Outside Audit & Supervisory Board Members to learn more about the workplace (including opportunities for direct communication with employees).
Action Plan
In addition to presenting information on the attendance of Outside Directors at the Group Joint Division Managers’ Meeting already held, provide guidance on opinion exchange meetings between Inside Officers and employees, and other events to increase opportunities for observer participation by Outside Directors. (In fiscal 2019, the Company will also invite outside officers to visit overseas.)
Tokio Marine Holdings, Inc. | Integrated Annual Report 2020
6564
Part 3 | G
overn
ance
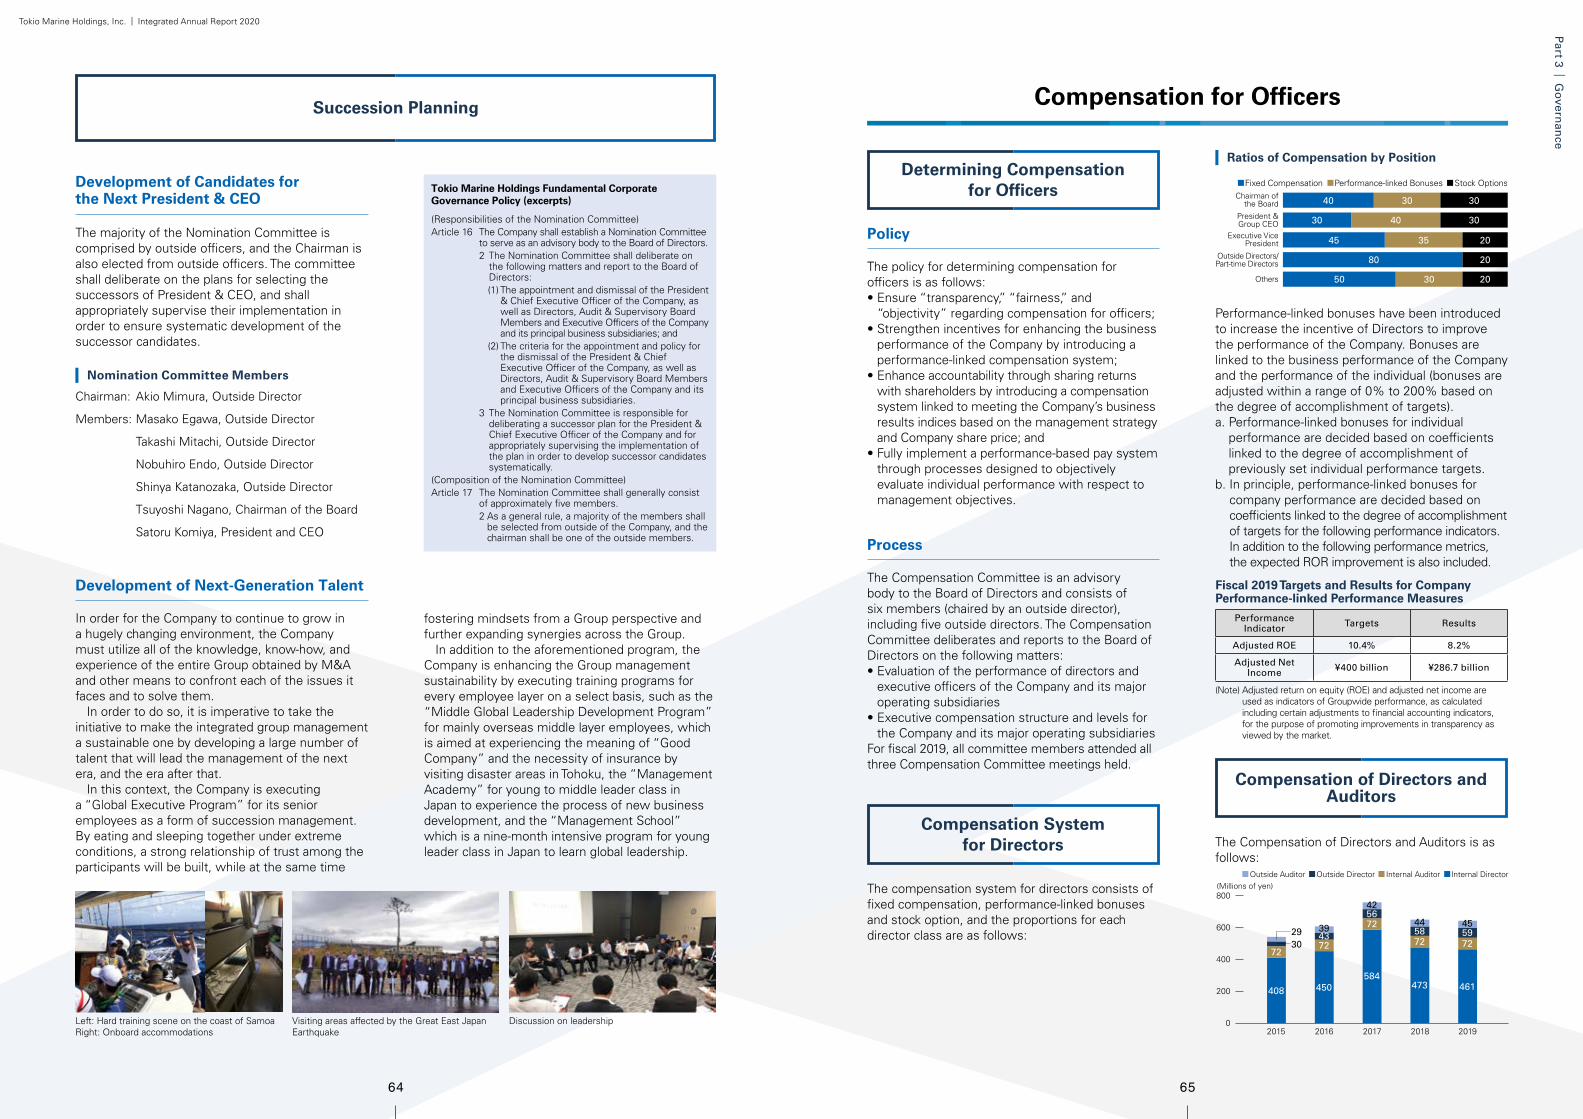
Performance-linked bonuses have been introduced to increase the incentive of Directors to improve the performance of the Company. Bonuses are linked to the business performance of the Company and the performance of the individual (bonuses are adjusted within a range of 0% to 200% based on the degree of accomplishment of targets).a. Performance-linked bonuses for individual
performance are decided based on coefficients linked to the degree of accomplishment of previously set individual performance targets.
b. In principle, performance-linked bonuses for company performance are decided based on coefficients linked to the degree of accomplishment of targets for the following performance indicators. In addition to the following performance metrics, the expected ROR improvement is also included.
Compensation of Directors and Auditors
The Compensation of Directors and Auditors is as follows:
Left: Hard training scene on the coast of SamoaRight: Onboard accommodations
Visiting areas affected by the Great East Japan Earthquake
Discussion on leadership
Performance Indicator Targets Results
Adjusted ROE 10.4% 8.2%
Adjusted Net Income ¥400 billion ¥286.7 billion
(Note) Adjusted return on equity (ROE) and adjusted net income are used as indicators of Groupwide performance, as calculated including certain adjustments to financial accounting indicators, for the purpose of promoting improvements in transparency as viewed by the market.
Fiscal 2019 Targets and Results for Company Performance-linked Performance Measures
Nomination Committee Members
Succession Planning
Chairman: Akio Mimura, Outside Director
Members: Masako Egawa, Outside Director
Takashi Mitachi, Outside Director
Nobuhiro Endo, Outside Director
Shinya Katanozaka, Outside Director
Tsuyoshi Nagano, Chairman of the Board
Satoru Komiya, President and CEO
Tokio Marine Holdings Fundamental Corporate Governance Policy (excerpts)
(Responsibilities of the Nomination Committee)Article 16 The Company shall establish a Nomination Committee to serve as an advisory body to the Board of Directors. 2 The Nomination Committee shall deliberate on
the following matters and report to the Board of Directors: (1) The appointment and dismissal of the President
& Chief Executive Officer of the Company, as well as Directors, Audit & Supervisory Board Members and Executive Officers of the Company and its principal business subsidiaries; and
(2) The criteria for the appointment and policy for the dismissal of the President & Chief Executive Officer of the Company, as well as Directors, Audit & Supervisory Board Members and Executive Officers of the Company and its principal business subsidiaries.
3 The Nomination Committee is responsible for deliberating a successor plan for the President & Chief Executive Officer of the Company and for appropriately supervising the implementation of the plan in order to develop successor candidates systematically.
(Composition of the Nomination Committee)Article 17 The Nomination Committee shall generally consist of approximately five members. 2 As a general rule, a majority of the members shall
be selected from outside of the Company, and the chairman shall be one of the outside members.
Ratios of Compensation by Position
Development of Candidates forthe Next President & CEO
The majority of the Nomination Committee is comprised by outside officers, and the Chairman is also elected from outside officers. The committee shall deliberate on the plans for selecting the successors of President & CEO, and shall appropriately supervise their implementation in order to ensure systematic development of the successor candidates.
Development of Next-Generation Talent
In order for the Company to continue to grow in a hugely changing environment, the Company must utilize all of the knowledge, know-how, and experience of the entire Group obtained by M&A and other means to confront each of the issues it faces and to solve them.
In order to do so, it is imperative to take the initiative to make the integrated group management a sustainable one by developing a large number of talent that will lead the management of the next era, and the era after that.
In this context, the Company is executing a “Global Executive Program” for its senior employees as a form of succession management. By eating and sleeping together under extreme conditions, a strong relationship of trust among the participants will be built, while at the same time
fostering mindsets from a Group perspective and further expanding synergies across the Group.
In addition to the aforementioned program, the Company is enhancing the Group management sustainability by executing training programs for every employee layer on a select basis, such as the “Middle Global Leadership Development Program” for mainly overseas middle layer employees, which is aimed at experiencing the meaning of “Good Company” and the necessity of insurance by visiting disaster areas in Tohoku, the “Management Academy” for young to middle leader class in Japan to experience the process of new business development, and the “Management School” which is a nine-month intensive program for young leader class in Japan to learn global leadership.
Compensation for Officers
Determining Compensationfor Officers
Policy
The policy for determining compensation for officers is as follows:• Ensure “transparency,” “fairness,” and
“objectivity” regarding compensation for officers;• Strengthen incentives for enhancing the business
performance of the Company by introducing a performance-linked compensation system;
• Enhance accountability through sharing returns with shareholders by introducing a compensation system linked to meeting the Company’s business results indices based on the management strategy and Company share price; and
• Fully implement a performance-based pay system through processes designed to objectively evaluate individual performance with respect to management objectives.
Process
The Compensation Committee is an advisory body to the Board of Directors and consists of six members (chaired by an outside director), including five outside directors. The Compensation Committee deliberates and reports to the Board of Directors on the following matters:• Evaluation of the performance of directors and
executive officers of the Company and its major operating subsidiaries
• Executive compensation structure and levels for the Company and its major operating subsidiaries
For fiscal 2019, all committee members attended all three Compensation Committee meetings held.
Compensation Systemfor Directors
The compensation system for directors consists of fixed compensation, performance-linked bonuses and stock option, and the proportions for each director class are as follows:
0
200
400
600
800
2015 2016 2017 2018 2019
Outside Auditor Outside Director Internal Auditor Internal Director
408
72
450
7243
3029 39
473
725844
461
725945
584
725642
(Millions of yen)
40 30 30
30 40 30
45 35 20
50 30 20
80 20
Chairman ofthe Board
Outside Directors/Part-time Directors
Others
President &Group CEO
Executive VicePresident
Fixed Compensation Performance-linked Bonuses Stock Options
Tokio Marine Holdings, Inc. | Integrated Annual Report 2020
6766
Part 3 | G
overn
ance
dialogues were held on topics of interest to investors. Participating investors commented on the meeting, saying, “I gained confidence in Tokio Marine Holdings after hearing about the Company’s approach and efforts in M&A and PMI from top overseas executives,” and “I could feel that the integrated group management is progressing smoothly with excellent relationships among top management.”
Dialogue with Individual Investors
In fiscal 2019, the Company held a total of eight information sessions conducted by the Group CFO, Deputy CFO and the Investor Relations Department, in addition to the information sessions with the Group CEO. The Company also provides easy-to-understand explanations of the “Group’s management strategy” and “shareholder return,” which are of great interest to individual investors.
Feedback
The Company is also making efforts to report the opinions obtained through dialogue with shareholders and investors widely to management and other members of the Company, and to reflect them in improvement of management. Through these efforts, employees feel more familiar with IR activities, which leads to improvements in their day-to-day work.
The Company will strive to enhance the trust of the capital markets by providing information about the Company in a timely, fair and continuous manner while ensuring transparency and accountability in its disclosures, and to promote understanding of its efforts to increase corporate value and a correct assessment of the Company. Furthermore, through constructive dialogue between management and shareholders and investors, the Company will gain an appropriate understanding of how it is viewed and the state of the capital markets, and provide that understanding and feedback to management and within the Company to further enhance its corporate value.
Dialogue with Investors
Dialogue with Institutional Investors
In order to engage in dialogue with a wide range of shareholders and investors, the Company will not only hold financial results conference calls and IR conferences, but will also hold individual meetings in Japan and overseas IR meetings, and in fiscal 2019, the Company held dialogues with a total of 723 companies.
In New York, a special meeting was held with the participation of the heads of major overseas Group companies, where thorough and constructive
Functional Chief Officer System
Special meeting in New York
Role playing a meeting with investors by IR Group members
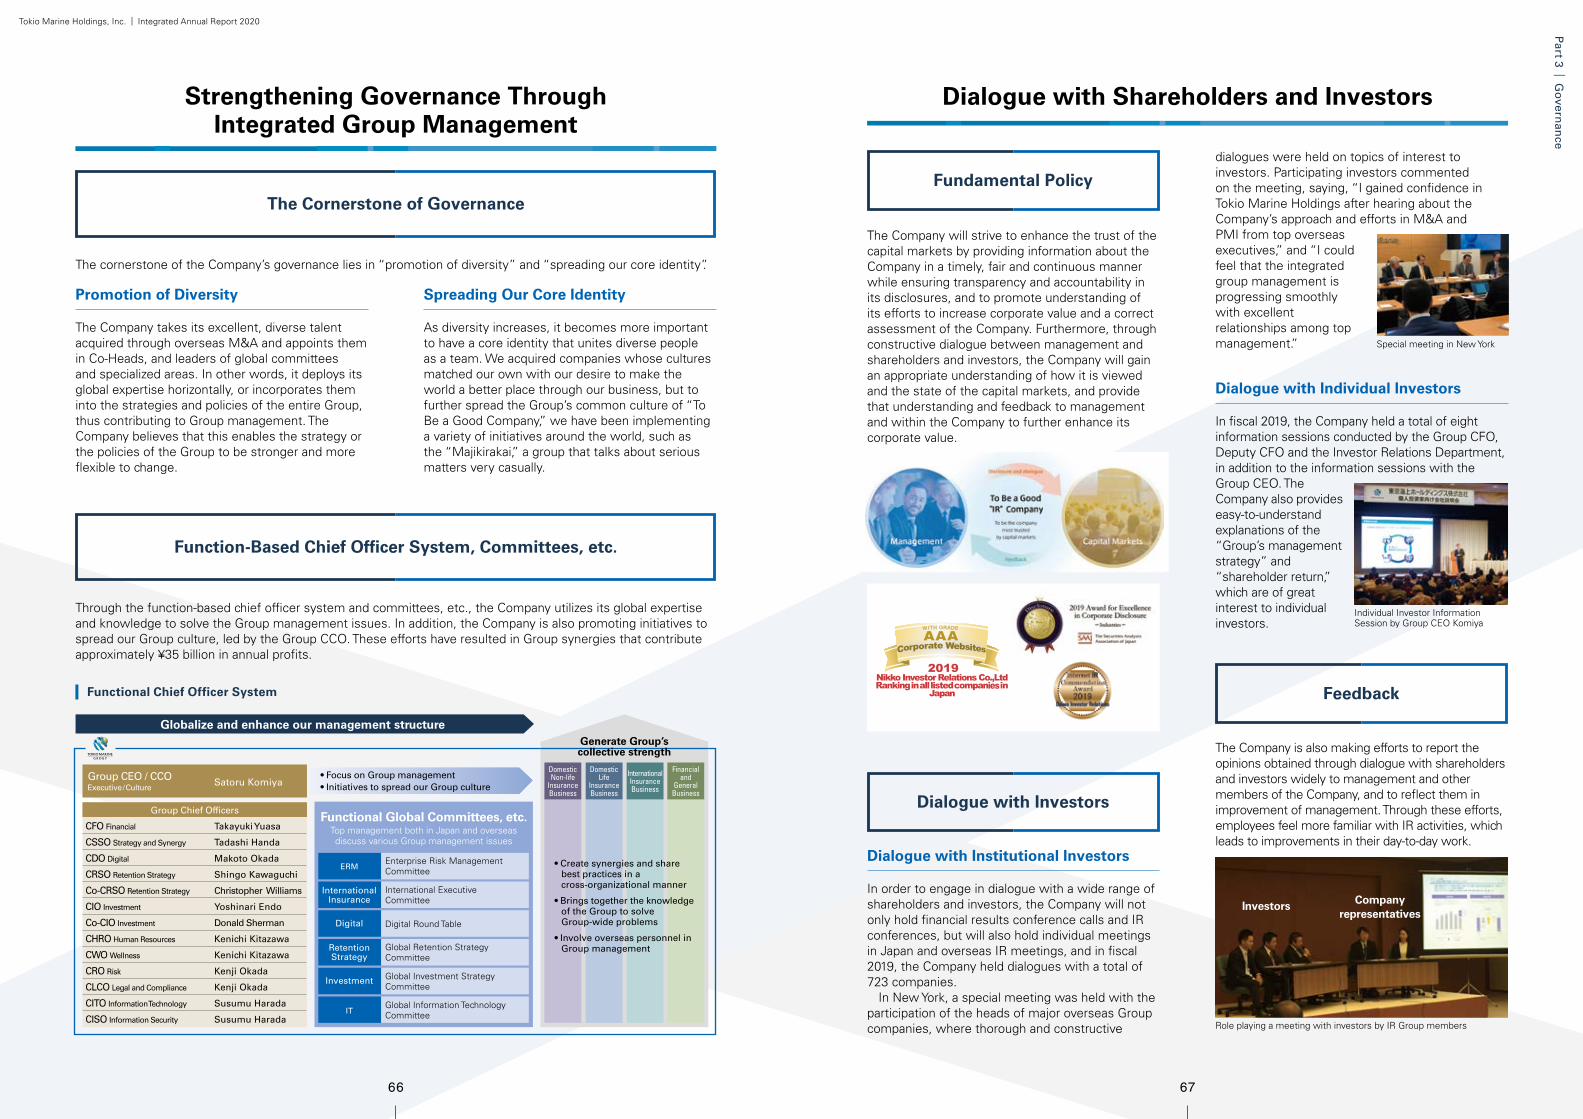
Function-Based Chief Officer System, Committees, etc.
The Cornerstone of Governance
Through the function-based chief officer system and committees, etc., the Company utilizes its global expertise and knowledge to solve the Group management issues. In addition, the Company is also promoting initiatives to spread our Group culture, led by the Group CCO. These efforts have resulted in Group synergies that contribute approximately ¥35 billion in annual profits.
The cornerstone of the Company’s governance lies in “promotion of diversity” and “spreading our core identity”.
Dialogue with Shareholders and InvestorsStrengthening Governance ThroughIntegrated Group Management
Promotion of Diversity
The Company takes its excellent, diverse talent acquired through overseas M&A and appoints them in Co-Heads, and leaders of global committees and specialized areas. In other words, it deploys its global expertise horizontally, or incorporates them into the strategies and policies of the entire Group, thus contributing to Group management. The Company believes that this enables the strategy or the policies of the Group to be stronger and more flexible to change.
Spreading Our Core Identity
As diversity increases, it becomes more important to have a core identity that unites diverse people as a team. We acquired companies whose cultures matched our own with our desire to make the world a better place through our business, but to further spread the Group’s common culture of “To Be a Good Company,” we have been implementing a variety of initiatives around the world, such as the “Majikirakai,” a group that talks about serious matters very casually.
Fundamental Policy
Globalize and enhance our management structureGenerate Group’scollective strength
• Create synergies and share best practices in a cross-organizational manner
• Brings together the knowledge of the Group to solve Group-wide problems
• Involve overseas personnel in Group management
• Focus on Group management• Initiatives to spread our Group culture
Functional Global Committees, etc.Top management both in Japan and overseasdiscuss various Group management issues
ERMEnterprise Risk Management Committee
InternationalInsurance
International ExecutiveCommittee
Digital Digital Round Table
RetentionStrategy
Global Retention StrategyCommittee
Investment Global Investment StrategyCommittee
ITGlobal Information TechnologyCommittee
Group CEO / CCOExecutive/Culture
Group Chief Officers
CFO Financial
CSSO Strategy and Synergy
CDO Digital
CRSO Retention Strategy
Co-CRSO Retention Strategy
CIO Investment
Co-CIO Investment
CHRO Human Resources
CWO Wellness
CRO Risk
CLCO Legal and Compliance
CITO Information Technology
CISO Information Security
Satoru Komiya
Takayuki Yuasa
Tadashi Handa
Makoto Okada
Shingo Kawaguchi
Christopher Williams
Yoshinari Endo
Donald Sherman
Kenichi Kitazawa
Kenichi Kitazawa
Kenji Okada
Kenji Okada
Susumu Harada
Susumu Harada
DomesticNon-life
InsuranceBusiness
DomesticLife
InsuranceBusiness
InternationalInsuranceBusiness
Financialand
GeneralBusiness
Individual Investor Information Session by Group CEO Komiya
Investors Company representatives

Tokio Marine Holdings, Inc. | Integrated Annual Report 2020
6968
Part 3 | G
overn
ance
Results of the Resolutions
Item Number of Affirmative Votes
Number of Negative Votes
Number of Abstentions Approval Ratio (%) Result of the
Resolution
Item 1 5,880,914 1,216 107 99.92 Approved
Item 2
Tsuyoshi Nagano 5,646,430 119,713 116,111 95.94 Approved
Satoru Komiya 5,688,360 77,780 116,111 96.65 Approved
Takayuki Yuasa 5,655,540 144,404 82,310 96.09 Approved
Akira Harashima 5,664,567 135,377 82,310 96.25 Approved
Kenji Okada 5,664,401 135,543 82,310 96.24 Approved
Shinichi Hirose 5,664,534 135,410 82,310 96.25 Approved
Akio Mimura 5,459,291 365,369 57,588 92.76 Approved
Masako Egawa 5,877,656 4,498 107 99.87 Approved
Takashi Mitachi 5,852,530 29,624 107 99.44 Approved
Nobuhiro Endo 5,860,869 21,286 107 99.58 Approved
Shinya Katanozaka 5,464,783 359,878 57,588 92.85 Approved
Tadashi Handa 5,650,311 149,633 82,310 96.00 Approved
Yoshinari Endo 5,650,246 149,698 82,310 96.00 Approved
Item 3 5,781,219 85,524 15,594 98.23 Approved
History of Book Value of Business-related Equities*
Details of the Resolutions
Policy for Dialogue
Examples of Dialogues with Investee
General Meeting of Shareholders
* March 31, 2002, is set at an index value of 100.
For more other dialogue examples and the results of exercises of voting rights, please refer to the overview of our stewardship activities available on Tokio Marine & Nichido’s website. (Japanese only):https://www.tokiomarine-nichido.co.jp/company/about/policy/stewardship.html
Reduction of Business-Related Equities
Initiatives to Reducethe Total Value
Business-related equities are held primarily to strengthen business relationships and enhance the Group’s corporate value, but the Company will continue to reduce the total value of shares held with a view to improving capital efficiency.
In fact, the Company began its efforts well before the release of the Corporate Governance Code, and since fiscal 2002, the Company sold a total of 2.2 trillion yen (based on market value at the time of sale), and the book value has decreased to 36% of the March 31, 2002 level. Under the current mid-term business plan, the Company plans to sell more than ¥100 billion per year.
For listed domestic business-related equities, the Board of Directors examines the risk/return of holding these stocks, both in the overall portfolio and on an individual basis, to validate the economic rationale for holding them.
Dialogue Based onthe Stewardship Code
Throughout the year, the Company holds “dialogues with companies with particularly large market values” and “dialogues based on market value and financial conditions,” as well as “dialogues based on voting rights exercise criteria” in the process of scrutinizing proposals for general meetings of shareholders of the companies in which the Company invests, and exercises voting rights based on these dialogues.
Presentation by the Group CEO
In order to promote a deeper understanding of the Company’s business, the Group’s CEO routinely conducts a presentation on management strategy and other matters. At the 18th Ordinary General Meeting of Shareholders, under the theme of “Business Strategy of Tokio Marine Group,” the Group CEO gave an easy-to-understand presentation on topics of business performance, its business purpose and efforts to achieve them, and the future image of the Group.
Item 1: Appropriation of SurplusMatters regarding distribution of dividends and its aggregate amountAmount of cash dividend per common share of the Company: 95 yenAggregate amount of cash dividends: 66,297,684,675 yen
Item 2: Election of Thirteen (13) Directors Election of the following thirteen individuals as directors: Tsuyoshi Nagano, Satoru Komiya, Takayuki Yuasa, Akira Harashima, Kenji Okada, Shinichi Hirose, Akio Mimura, Masako Egawa, Takashi Mitachi, Nobuhiro Endo, Shinya Katanozaka, Tadashi Handa and Yoshinari Endo.
Item 3: Election of One (1) Audit & Supervisory Board Member Election of the following one individual as an audit & supervisory board member: Hirokazu Fujita.
Results of Exercise of Voting Rights
The results of the exercise of voting rights at the 18th Ordinary General Meeting of Shareholders are as follows:
100
Mar. 31,2002
Mar. 31,2007
Mar. 31,2012
Mar. 31,2017
82
57
42
Mar. 31,2020
36
0
20
40
60
80
100
1 Dialogue with companies withparticularly large market values
HeldMarketValue
Dialogue based on the impact onthe market and the value ofthe Company’s assets.
2 Dialogue based on marketvalue and financial conditions
The Company decides which investee to engage in a dialogue, by taking into account the financial conditions of the companies with the top market values
Regarding the proposals at the General Meeting of Shareholders of all listed companies, the Company will engage in a dialogue, if necessary in accordance with the Company’s voting criteria.
3 Dialogues based on votingrights exercise criteria
Content of the Dialogue
For companies that show concerns about future cost increases as a result of increased competition and new environmental regulations, the Company has identified measures to improve profitability.
Response of Investee
The Company responded that it would seek to reduce costs and increase profits by divesting less profitable businesses and reviewing business relationships and pursuing ”selection and focus.“Subsequently, it was announced that the Company would pursue structural reforms to improve profitability.

Tokio Marine Holdings, Inc. | Integrated Annual Report 2020
7170
Part 3 | G
overn
ance
The Company has formulated the “Tokio Marine Group Basic Policies for Compliance” and the “Tokio Marine Group Code of Conduct,” and a compliance system is in place Groupwide based on this framework. Also, the Company has built a structure to ensure Groupwide compliance by periodically monitoring the status of compliance within the Group; receiving reports from Group companies on important matters; discussing these matters among the Board of Directors, the Management Meeting, and the Internal Control Committee; and providing guidance and advice about the activities of Group companies when necessary.
Information Security Management
Tokio Marine recognizes the importance of personal information and confidential information (“information assets”). To ensure the appropriateness and trustworthiness of Tokio Marine Group’s operations, we have formulated the “Tokio Marine Group Basic Policies for Information Security Management” and use appropriate methods to conduct information security management at each company in accordance with their line of business, scale, location, and other factors.
Based on the “Tokio Marine Group Basic Policies for Information Security Management,” each company establishes departments to oversee information security management and formulate policies and regulations. To protect information assets from various information leakage risks, including leak, loss, and unauthorized use, we ensure the confidentiality of information assets and manage them so that they can be used when
Internal Control System
Compliance System
Fundamental Policy
Internal Control System
The Company has formulated “Basic Policies for Internal Controls.” In accordance with these policies, the Company has established an internal control system for the entire Tokio Marine Group that encompasses structures for management control, compliance, risk management, and internal auditing of Group companies. In addition, the Company monitors the status and practical application of its internal control system. The Internal Control Committee deliberates on the results of this monitoring, and the Board of Directors confirms the details of these deliberations. Moreover, the Company continually strengthens and improves its internal control system in light of the results of this monitoring. The Internal Audit Section maintains close coordination with Audit & Supervisory Board Members to ensure the effectiveness of their audits.
necessary. Furthermore, the Company regularly monitors the information security management of group companies, setting up structures and providing information when necessary.
Crisis Management System
Tokio Marine Group has established a crisis management system to minimize economic losses and other impacts incurred in an emergency and immediately restore ordinary business operations.
The Company has formulated the “Tokio Marine Group Basic Policy for Crisis Management” and the “Tokio Marine Group Crisis Management Manual” based on the policy, and has set forth the crisis management systems necessary for Group companies to carry out their own roles.
Group companies formulate crisis management policies in line with policies of the Group to develop crisis management systems that include establishing a department in charge of crisis management, decision-making procedures for emergency situations, and securing the chain of command. In addition to developing the crisis management system during normal conditions, the department in charge of crisis management plays the role of secretariat for response during emergency situations, including reporting to the Company.
When conditions that may develop into an emergency situation arise, in addition to each Group company determining whether or not these conditions correspond to an emergency situation, the Company determines, if necessary, whether or not these conditions correspond to an emergency situation for the Group. This system enables the Company to properly instruct Group companies and make sure necessary actions as a Group can be made.
Internal/External Audits, etc.
Regarding internal audits, there is a statutory audit conducted by Audit & Supervisory Board Members in accordance with the Companies Act and an internal audit performed by the Internal Audit Department. The internal audit is performed based on the “Internal Auditing Rules” that have been approved by the Board of Directors.
Regarding external audits, there is an accounting audit based on the Companies Act and the Financial Instruments and Exchange Act and an internal control audit based on the Financial Instruments and Exchange Act conducted by PricewaterhouseCoopers Aarata.
Tokio Marine Holdings is also subject to inspections by the Financial Services Agency of Japan pursuant to the Insurance Business Law.
Compliance
Tokio Marine Holdings
Board of Directors(Directors)
ManagementMeeting
Internal ControlCommittee
Director in Charge of Internal Controls
Coordination
Report
Internal Audit
CoordinationInternalControl AuditAccounting Audit
Evaluating theappropriateness ofaccounting audit
Domestic Non-lifeInsurance Business
Domestic LifeInsurance Business
International InsuranceBusiness
Financial andGeneral Business
P
A D
C
P
A D
C
P
A D
C
P
A D
C
P
A D
C
P Plan
D Do
C Check
A Act
Compliance CustomerProtection
InformationSecurity
Management
Response toAnti-Social
Forces
RiskManagement
InternalAudit
Auditor’sAudit
FinancialAuditors
Internal AuditSection
RespectiveSections
Basic Policies forInternal Controls
Management, Guidance, Adjustments, Monitoring, Reporting, others
Group Companies
Audit
Audit
Office of Audit &Supervisory Board
Audit & SupervisoryBoard Members
(Audit & SupervisoryBoard) Legal and Compliance Department, Individual Business Divisions
Tokio Marine Holdings
Audit & SupervisoryBoard Members
(Audit & Supervisory Board)Board of Directors
Internal Control Committee Management Meeting
Audit & SupervisoryBoard Members
(Audit & Supervisory Board)Board of Directors
Compliance Committee, etc.(Tailored to actual conditions at each company)
Compliance Department
GroupCompanies
Indication of basicpolicies, guidance,
administration, monitoringReporting, etc.
Tokio Marine Holdings, Inc. | Integrated Annual Report 2020
7372
Part 3 | G
overn
ance
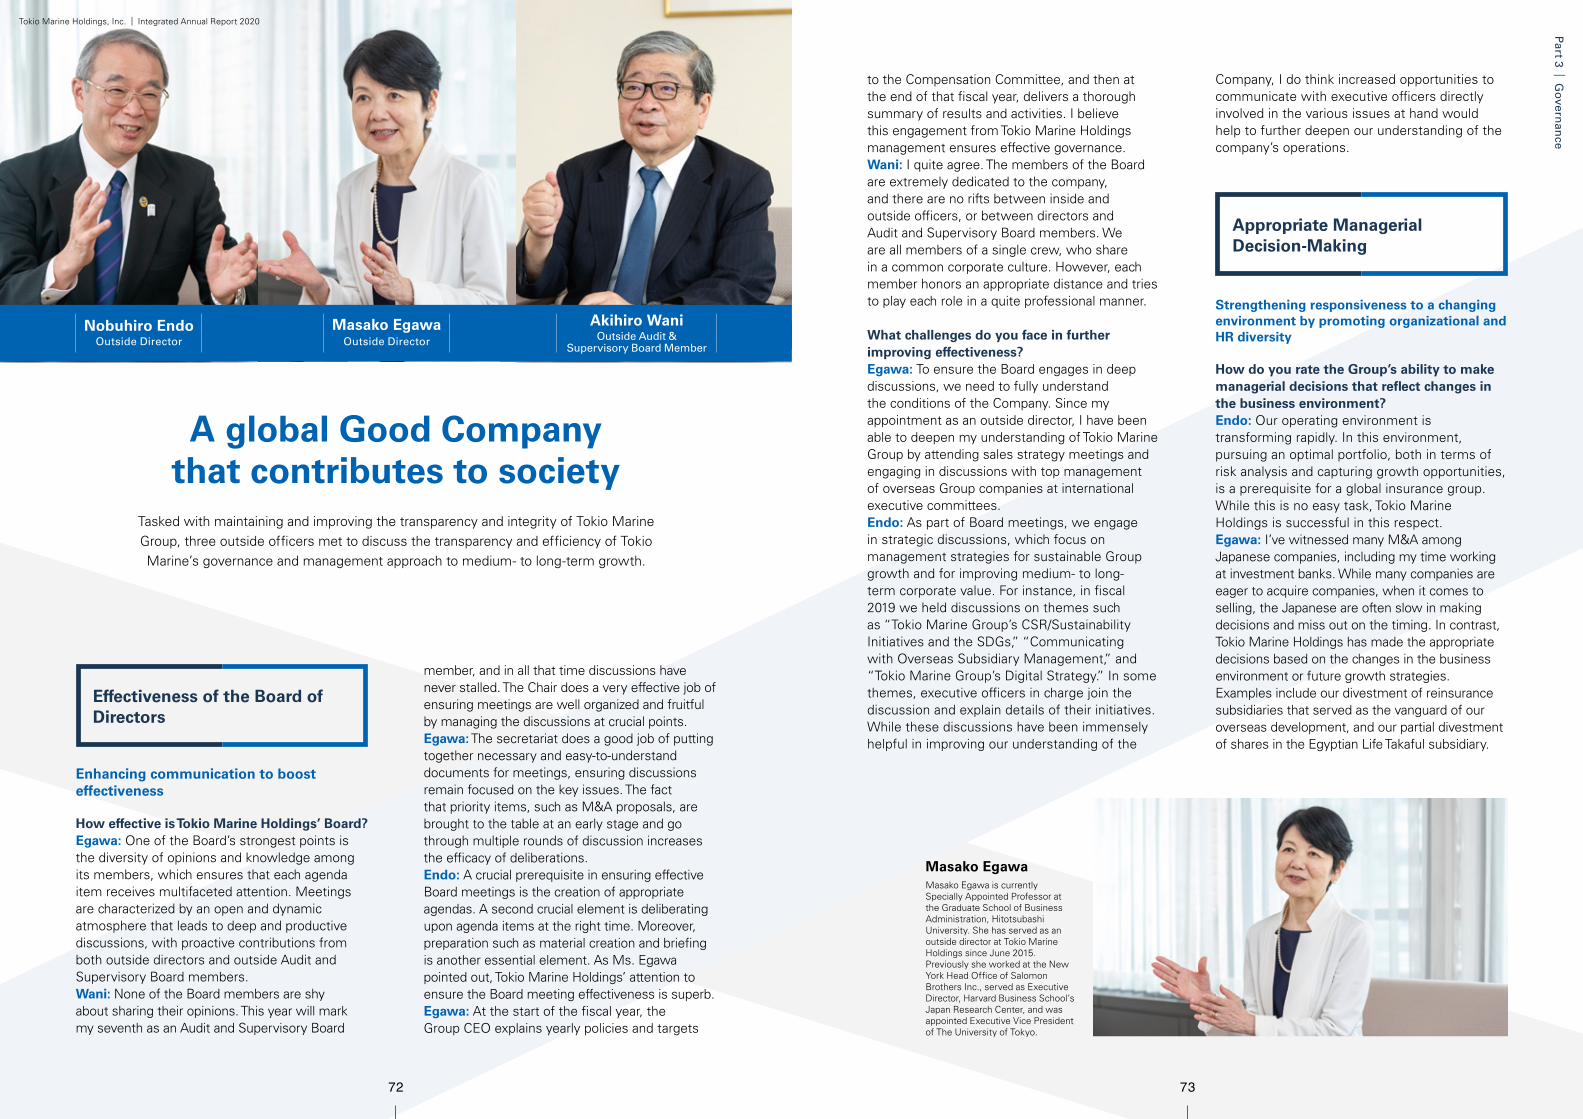
A global Good Companythat contributes to society
Tasked with maintaining and improving the transparency and integrity of Tokio Marine Group, three outside officers met to discuss the transparency and efficiency of Tokio Marine’s governance and management approach to medium- to long-term growth.
Masako EgawaOutside Director
Akihiro WaniOutside Audit &
Supervisory Board Member
Masako Egawa is currently Specially Appointed Professor at the Graduate School of Business Administration, Hitotsubashi University. She has served as an outside director at Tokio Marine Holdings since June 2015. Previously she worked at the New York Head Office of Salomon Brothers Inc., served as Executive Director, Harvard Business School’s Japan Research Center, and was appointed Executive Vice President of The University of Tokyo.
Masako Egawa
Effectiveness of the Board of Directors
Enhancing communication to boost effectiveness
How effective is Tokio Marine Holdings’ Board?Egawa: One of the Board’s strongest points is the diversity of opinions and knowledge among its members, which ensures that each agenda item receives multifaceted attention. Meetings are characterized by an open and dynamic atmosphere that leads to deep and productive discussions, with proactive contributions from both outside directors and outside Audit and Supervisory Board members.Wani: None of the Board members are shy about sharing their opinions. This year will mark my seventh as an Audit and Supervisory Board
member, and in all that time discussions have never stalled. The Chair does a very effective job of ensuring meetings are well organized and fruitful by managing the discussions at crucial points.Egawa: The secretariat does a good job of putting together necessary and easy-to-understand documents for meetings, ensuring discussions remain focused on the key issues. The fact that priority items, such as M&A proposals, are brought to the table at an early stage and go through multiple rounds of discussion increases the efficacy of deliberations.Endo: A crucial prerequisite in ensuring effective Board meetings is the creation of appropriate agendas. A second crucial element is deliberating upon agenda items at the right time. Moreover, preparation such as material creation and briefing is another essential element. As Ms. Egawa pointed out, Tokio Marine Holdings’ attention to ensure the Board meeting effectiveness is superb. Egawa: At the start of the fiscal year, the Group CEO explains yearly policies and targets
to the Compensation Committee, and then at the end of that fiscal year, delivers a thorough summary of results and activities. I believe this engagement from Tokio Marine Holdings management ensures effective governance.Wani: I quite agree. The members of the Board are extremely dedicated to the company, and there are no rifts between inside and outside officers, or between directors and Audit and Supervisory Board members. We are all members of a single crew, who share in a common corporate culture. However, each member honors an appropriate distance and tries to play each role in a quite professional manner.
What challenges do you face in further improving effectiveness?Egawa: To ensure the Board engages in deep discussions, we need to fully understand the conditions of the Company. Since my appointment as an outside director, I have been able to deepen my understanding of Tokio Marine Group by attending sales strategy meetings and engaging in discussions with top management of overseas Group companies at international executive committees. Endo: As part of Board meetings, we engage in strategic discussions, which focus on management strategies for sustainable Group growth and for improving medium- to long-term corporate value. For instance, in fiscal 2019 we held discussions on themes such as “Tokio Marine Group’s CSR/Sustainability Initiatives and the SDGs,” “Communicating with Overseas Subsidiary Management,” and “Tokio Marine Group’s Digital Strategy.” In some themes, executive officers in charge join the discussion and explain details of their initiatives. While these discussions have been immensely helpful in improving our understanding of the
Company, I do think increased opportunities to communicate with executive officers directly involved in the various issues at hand would help to further deepen our understanding of the company’s operations.
Appropriate Managerial Decision-Making
Strengthening responsiveness to a changing environment by promoting organizational and HR diversity
How do you rate the Group’s ability to make managerial decisions that reflect changes in the business environment?Endo: Our operating environment is transforming rapidly. In this environment, pursuing an optimal portfolio, both in terms of risk analysis and capturing growth opportunities, is a prerequisite for a global insurance group. While this is no easy task, Tokio Marine Holdings is successful in this respect.Egawa: I’ve witnessed many M&A among Japanese companies, including my time working at investment banks. While many companies are eager to acquire companies, when it comes to selling, the Japanese are often slow in making decisions and miss out on the timing. In contrast, Tokio Marine Holdings has made the appropriate decisions based on the changes in the business environment or future growth strategies. Examples include our divestment of reinsurance subsidiaries that served as the vanguard of our overseas development, and our partial divestment of shares in the Egyptian Life Takaful subsidiary.
Tokio Marine Holdings, Inc. | Integrated Annual Report 2020
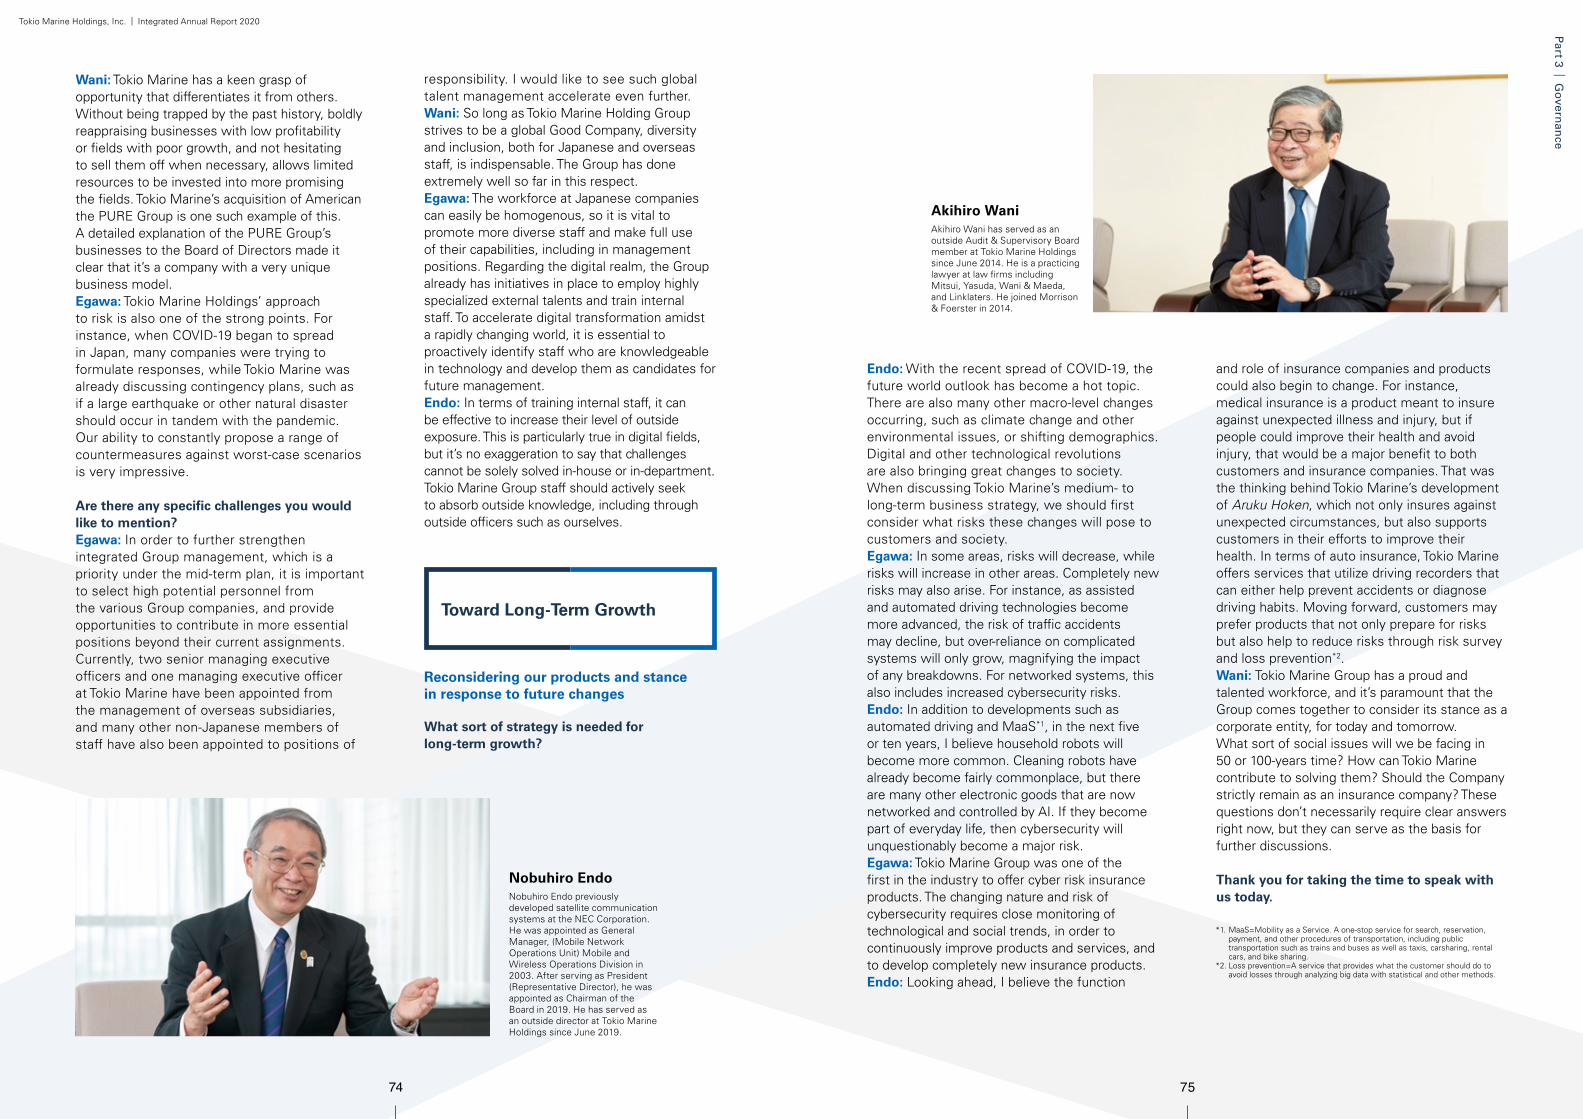
Nobuhiro EndoOutside Director
Tokio Marine Holdings, Inc. | Integrated Annual Report 2020
7574
Part 3 | G
overn
ance
*1. MaaS=Mobility as a Service. A one-stop service for search, reservation, payment, and other procedures of transportation, including public transportation such as trains and buses as well as taxis, carsharing, rental cars, and bike sharing.
*2. Loss prevention=A service that provides what the customer should do to avoid losses through analyzing big data with statistical and other methods.
Wani: Tokio Marine has a keen grasp of opportunity that differentiates it from others. Without being trapped by the past history, boldly reappraising businesses with low profitability or fields with poor growth, and not hesitating to sell them off when necessary, allows limited resources to be invested into more promising the fields. Tokio Marine’s acquisition of American the PURE Group is one such example of this. A detailed explanation of the PURE Group’s businesses to the Board of Directors made it clear that it’s a company with a very unique business model. Egawa: Tokio Marine Holdings’ approach to risk is also one of the strong points. For instance, when COVID-19 began to spread in Japan, many companies were trying to formulate responses, while Tokio Marine was already discussing contingency plans, such as if a large earthquake or other natural disaster should occur in tandem with the pandemic. Our ability to constantly propose a range of countermeasures against worst-case scenarios is very impressive.
Are there any specific challenges you would like to mention?Egawa: In order to further strengthen integrated Group management, which is a priority under the mid-term plan, it is important to select high potential personnel from the various Group companies, and provide opportunities to contribute in more essential positions beyond their current assignments. Currently, two senior managing executive officers and one managing executive officer at Tokio Marine have been appointed from the management of overseas subsidiaries, and many other non-Japanese members of staff have also been appointed to positions of
responsibility. I would like to see such global talent management accelerate even further.Wani: So long as Tokio Marine Holding Group strives to be a global Good Company, diversity and inclusion, both for Japanese and overseas staff, is indispensable. The Group has done extremely well so far in this respect.Egawa: The workforce at Japanese companies can easily be homogenous, so it is vital to promote more diverse staff and make full use of their capabilities, including in management positions. Regarding the digital realm, the Group already has initiatives in place to employ highly specialized external talents and train internal staff. To accelerate digital transformation amidst a rapidly changing world, it is essential to proactively identify staff who are knowledgeable in technology and develop them as candidates for future management.Endo: In terms of training internal staff, it can be effective to increase their level of outside exposure. This is particularly true in digital fields, but it’s no exaggeration to say that challenges cannot be solely solved in-house or in-department. Tokio Marine Group staff should actively seek to absorb outside knowledge, including through outside officers such as ourselves.
Toward Long-Term Growth
Reconsidering our products and stance in response to future changes
What sort of strategy is needed for long-term growth?
Endo: With the recent spread of COVID-19, the future world outlook has become a hot topic. There are also many other macro-level changes occurring, such as climate change and other environmental issues, or shifting demographics. Digital and other technological revolutions are also bringing great changes to society. When discussing Tokio Marine’s medium- to long-term business strategy, we should first consider what risks these changes will pose to customers and society.Egawa: In some areas, risks will decrease, while risks will increase in other areas. Completely new risks may also arise. For instance, as assisted and automated driving technologies become more advanced, the risk of traffic accidents may decline, but over-reliance on complicated systems will only grow, magnifying the impact of any breakdowns. For networked systems, this also includes increased cybersecurity risks.Endo: In addition to developments such as automated driving and MaaS*1, in the next five or ten years, I believe household robots will become more common. Cleaning robots have already become fairly commonplace, but there are many other electronic goods that are now networked and controlled by AI. If they become part of everyday life, then cybersecurity will unquestionably become a major risk.Egawa: Tokio Marine Group was one of the first in the industry to offer cyber risk insurance products. The changing nature and risk of cybersecurity requires close monitoring of technological and social trends, in order to continuously improve products and services, and to develop completely new insurance products.Endo: Looking ahead, I believe the function
and role of insurance companies and products could also begin to change. For instance, medical insurance is a product meant to insure against unexpected illness and injury, but if people could improve their health and avoid injury, that would be a major benefit to both customers and insurance companies. That was the thinking behind Tokio Marine’s development of Aruku Hoken, which not only insures against unexpected circumstances, but also supports customers in their efforts to improve their health. In terms of auto insurance, Tokio Marine offers services that utilize driving recorders that can either help prevent accidents or diagnose driving habits. Moving forward, customers may prefer products that not only prepare for risks but also help to reduce risks through risk survey and loss prevention*2. Wani: Tokio Marine Group has a proud and talented workforce, and it’s paramount that the Group comes together to consider its stance as a corporate entity, for today and tomorrow.What sort of social issues will we be facing in 50 or 100-years time? How can Tokio Marine contribute to solving them? Should the Company strictly remain as an insurance company? These questions don’t necessarily require clear answers right now, but they can serve as the basis for further discussions.
Thank you for taking the time to speak with us today.
Akihiro Wani has served as an outside Audit & Supervisory Board member at Tokio Marine Holdings since June 2014. He is a practicing lawyer at law firms including Mitsui, Yasuda, Wani & Maeda, and Linklaters. He joined Morrison & Foerster in 2014.
Akihiro Wani
Nobuhiro Endo previously developed satellite communication systems at the NEC Corporation. He was appointed as General Manager, (Mobile Network Operations Unit) Mobile and Wireless Operations Division in 2003. After serving as President (Representative Director), he was appointed as Chairman of the Board in 2019. He has served as an outside director at Tokio Marine Holdings since June 2019.
Nobuhiro Endo
Tokio Marine Holdings, Inc. | Integrated Annual Report 2020
7776
Part 3 | E
nviro
nm
ent/S
ociety
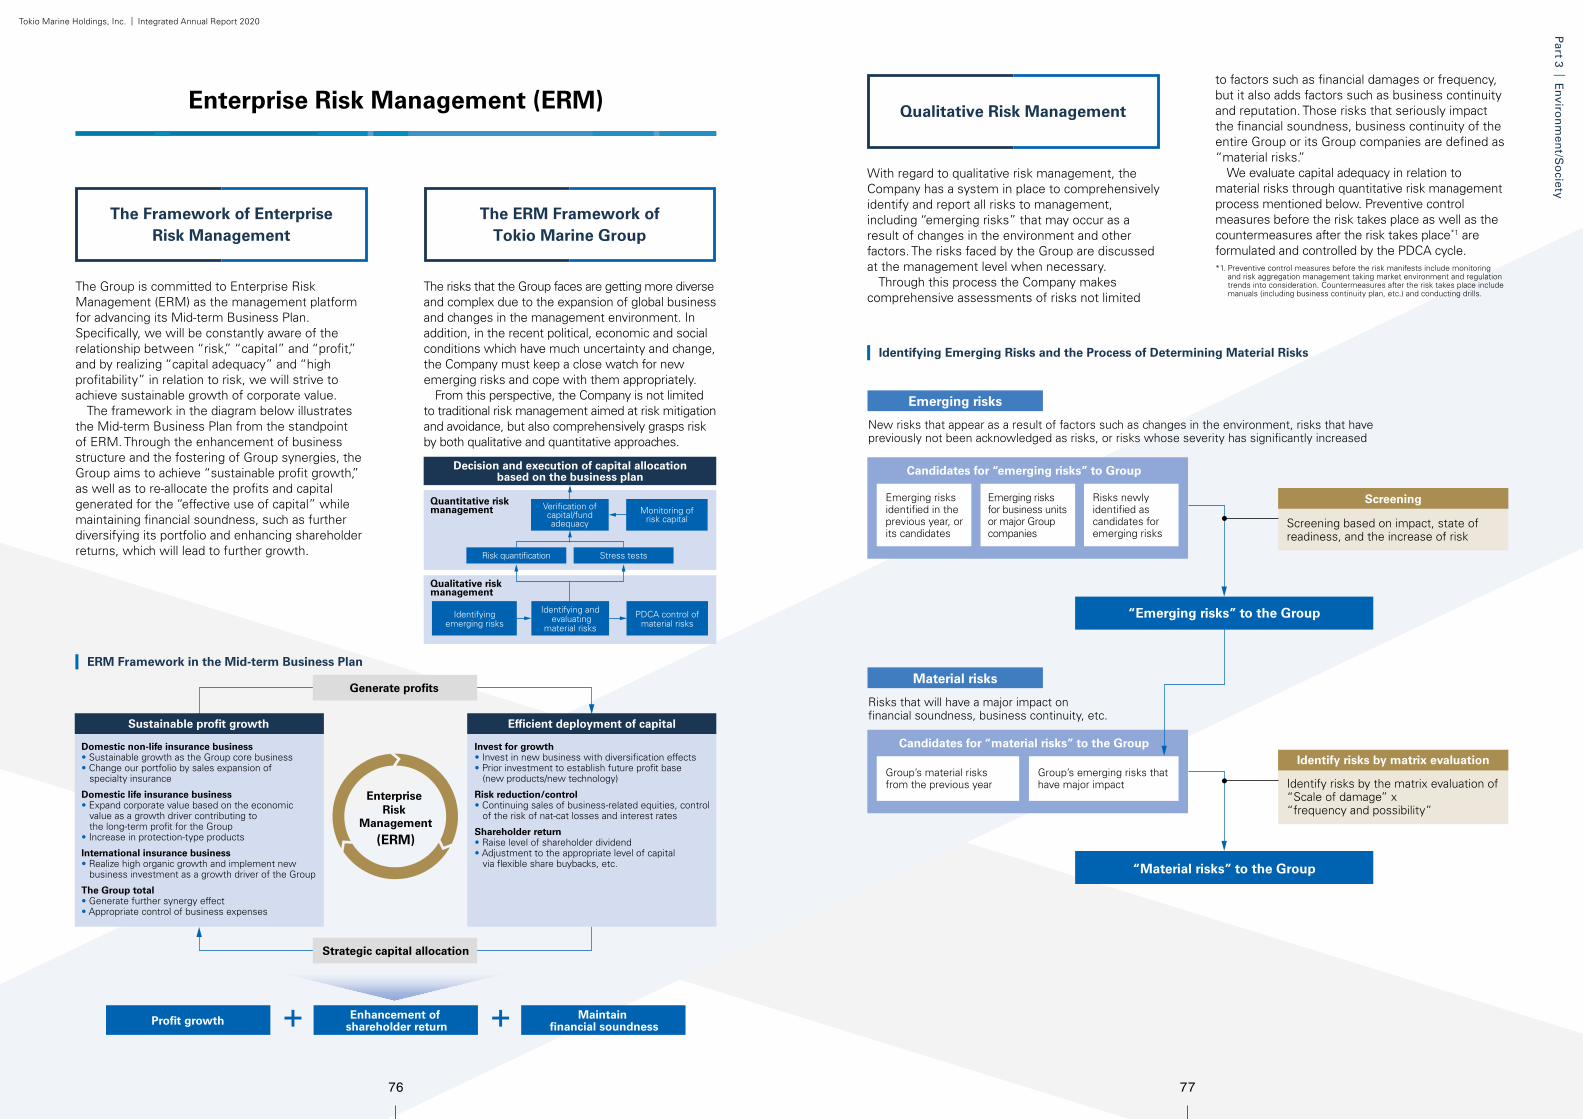
The Framework of EnterpriseRisk Management
The Group is committed to Enterprise Risk Management (ERM) as the management platform for advancing its Mid-term Business Plan. Specifically, we will be constantly aware of the relationship between “risk,” “capital” and “profit,” and by realizing “capital adequacy” and “high profitability” in relation to risk, we will strive to achieve sustainable growth of corporate value.
The framework in the diagram below illustrates the Mid-term Business Plan from the standpoint of ERM. Through the enhancement of business structure and the fostering of Group synergies, the Group aims to achieve “sustainable profit growth,” as well as to re-allocate the profits and capital generated for the “effective use of capital” while maintaining financial soundness, such as further diversifying its portfolio and enhancing shareholder returns, which will lead to further growth.
Qualitative Risk Management
With regard to qualitative risk management, the Company has a system in place to comprehensively identify and report all risks to management, including “emerging risks” that may occur as a result of changes in the environment and other factors. The risks faced by the Group are discussed at the management level when necessary.
Through this process the Company makes comprehensive assessments of risks not limited
The ERM Framework ofTokio Marine Group
The risks that the Group faces are getting more diverse and complex due to the expansion of global business and changes in the management environment. In addition, in the recent political, economic and social conditions which have much uncertainty and change, the Company must keep a close watch for new emerging risks and cope with them appropriately.
From this perspective, the Company is not limited to traditional risk management aimed at risk mitigation and avoidance, but also comprehensively grasps risk by both qualitative and quantitative approaches.
Enterprise Risk Management (ERM)
ERM Framework in the Mid-term Business Plan
Identifying Emerging Risks and the Process of Determining Material Risks
to factors such as financial damages or frequency, but it also adds factors such as business continuity and reputation. Those risks that seriously impact the financial soundness, business continuity of the entire Group or its Group companies are defined as “material risks.”
We evaluate capital adequacy in relation to material risks through quantitative risk management process mentioned below. Preventive control measures before the risk takes place as well as the countermeasures after the risk takes place*1 are formulated and controlled by the PDCA cycle.*1. Preventive control measures before the risk manifests include monitoring
and risk aggregation management taking market environment and regulation trends into consideration. Countermeasures after the risk takes place include manuals (including business continuity plan, etc.) and conducting drills.
Screening based on impact, state ofreadiness, and the increase of risk
Screening
Identify risks by the matrix evaluation of“Scale of damage” x“frequency and possibility”
Identify risks by matrix evaluation
Emerging risks
“Emerging risks” to the Group
“Material risks” to the Group
Material risks
New risks that appear as a result of factors such as changes in the environment, risks that havepreviously not been acknowledged as risks, or risks whose severity has significantly increased
Risks that will have a major impact onfinancial soundness, business continuity, etc.
Emerging risks identified in the previous year, or its candidates
Emerging risks for business units or major Group companies
Risks newly identified as candidates for emerging risks
Group’s material risks from the previous year
Group’s emerging risks that have major impact
Candidates for “emerging risks” to Group
Candidates for “material risks” to the Group
Enterprise Risk
Management
(ERM)
Profit growth Enhancement of shareholder return
Maintain financial soundness
Generate profits
Strategic capital allocation
Domestic non-life insurance business• Sustainable growth as the Group core business• Change our portfolio by sales expansion of
specialty insurance
Domestic life insurance business• Expand corporate value based on the economic
value as a growth driver contributing tothe long-term profit for the Group
• Increase in protection-type products
International insurance business• Realize high organic growth and implement new
business investment as a growth driver of the Group
The Group total• Generate further synergy effect• Appropriate control of business expenses
Sustainable profit growth
Invest for growth• Invest in new business with diversification effects• Prior investment to establish future profit base
(new products/new technology)
Risk reduction/control• Continuing sales of business-related equities, control
of the risk of nat-cat losses and interest rates
Shareholder return• Raise level of shareholder dividend• Adjustment to the appropriate level of capital
via flexible share buybacks, etc.
Efficient deployment of capital
Decision and execution of capital allocationbased on the business plan
Quantitative riskmanagement
Qualitative riskmanagement
Verification ofcapital/fundadequacy
Monitoring ofrisk capital
Risk quantification Stress tests
PDCA control ofmaterial risks
Identifying and evaluating
material risks
Identifyingemerging risks
Tokio Marine Holdings, Inc. | Integrated Annual Report 2020
7978
Part 3 | E
nviro
nm
ent/S
ociety
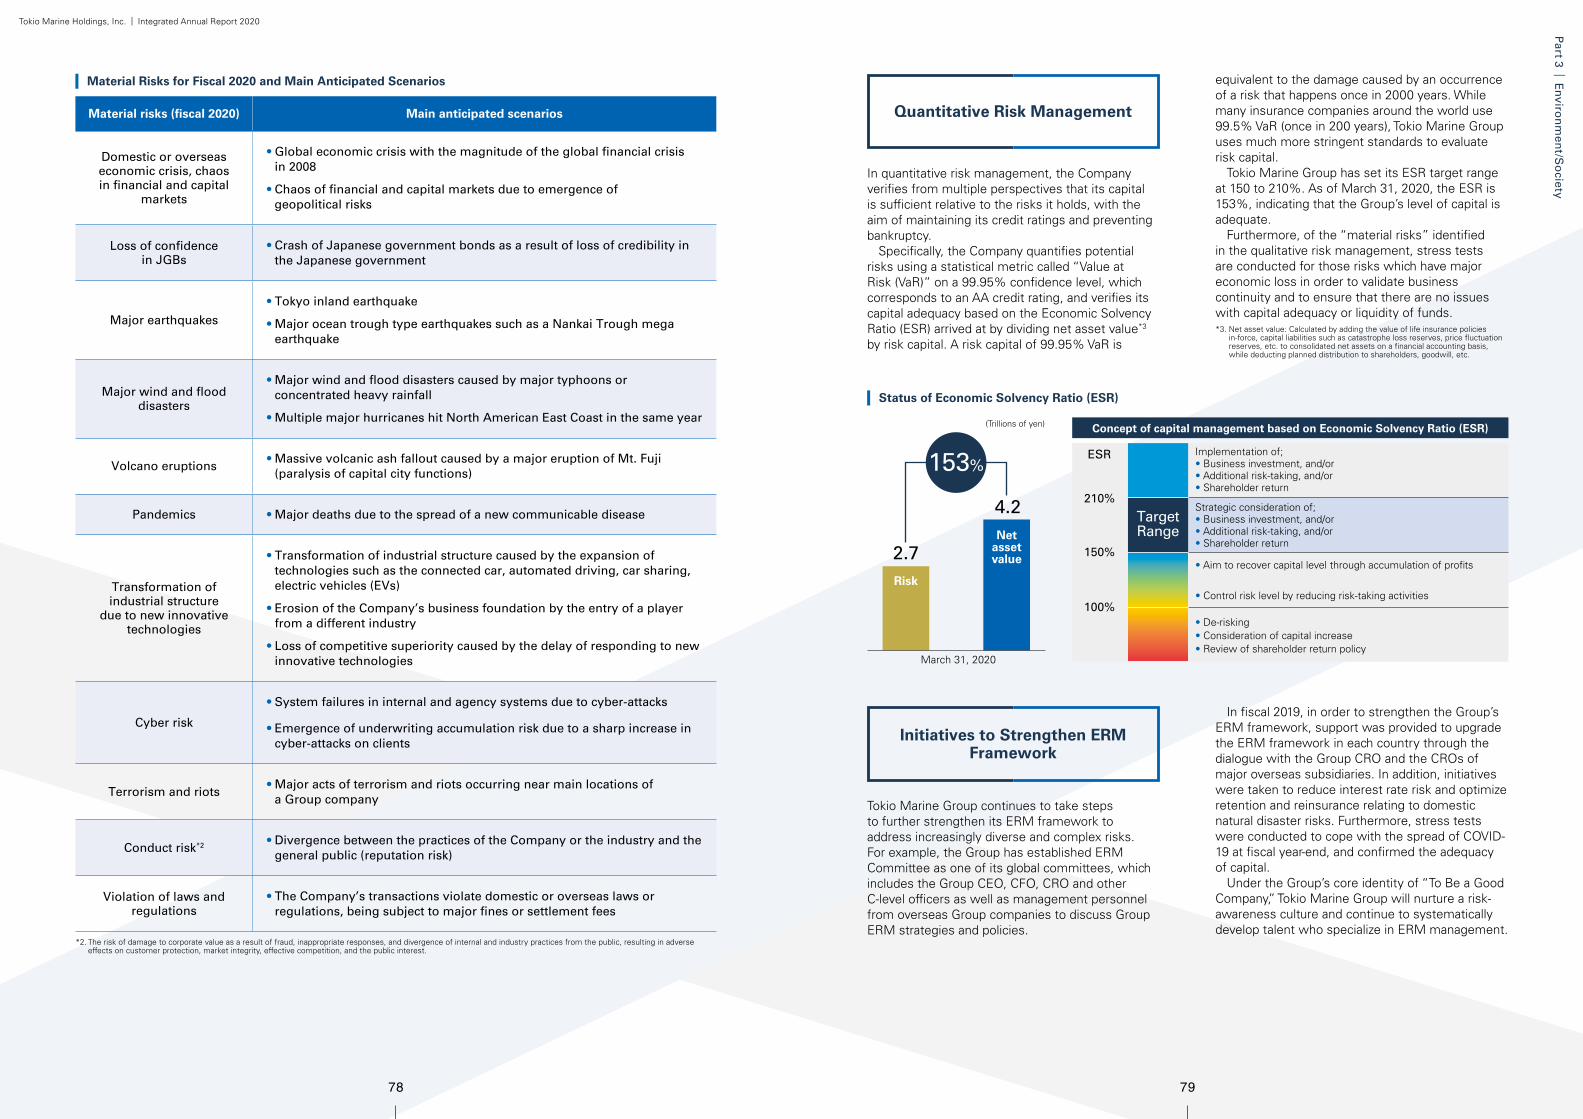
Material risks (fiscal 2020) Main anticipated scenarios
Domestic or overseas economic crisis, chaos in financial and capital
markets
• Global economic crisis with the magnitude of the global financial crisis in 2008
• Chaos of financial and capital markets due to emergence of geopolitical risks
Loss of confidencein JGBs
• Crash of Japanese government bonds as a result of loss of credibility in the Japanese government
Major earthquakes
• Tokyo inland earthquake
• Major ocean trough type earthquakes such as a Nankai Trough mega earthquake
Major wind and flood disasters
• Major wind and flood disasters caused by major typhoons or concentrated heavy rainfall
• Multiple major hurricanes hit North American East Coast in the same year
Volcano eruptions• Massive volcanic ash fallout caused by a major eruption of Mt. Fuji
(paralysis of capital city functions)
Pandemics • Major deaths due to the spread of a new communicable disease
Transformation of industrial structure
due to new innovative technologies
• Transformation of industrial structure caused by the expansion of technologies such as the connected car, automated driving, car sharing, electric vehicles (EVs)
• Erosion of the Company’s business foundation by the entry of a player from a different industry
• Loss of competitive superiority caused by the delay of responding to new innovative technologies
Cyber risk
• System failures in internal and agency systems due to cyber-attacks
• Emergence of underwriting accumulation risk due to a sharp increase in cyber-attacks on clients
Terrorism and riots• Major acts of terrorism and riots occurring near main locations of
a Group company
Conduct risk*2 • Divergence between the practices of the Company or the industry and the general public (reputation risk)
Violation of laws and regulations
• The Company’s transactions violate domestic or overseas laws or regulations, being subject to major fines or settlement fees
Material Risks for Fiscal 2020 and Main Anticipated Scenarios
Status of Economic Solvency Ratio (ESR)
*2. The risk of damage to corporate value as a result of fraud, inappropriate responses, and divergence of internal and industry practices from the public, resulting in adverse effects on customer protection, market integrity, effective competition, and the public interest.
Quantitative Risk Management
In quantitative risk management, the Company verifies from multiple perspectives that its capital is sufficient relative to the risks it holds, with the aim of maintaining its credit ratings and preventing bankruptcy.
Specifically, the Company quantifies potential risks using a statistical metric called “Value at Risk (VaR)” on a 99.95% confidence level, which corresponds to an AA credit rating, and verifies its capital adequacy based on the Economic Solvency Ratio (ESR) arrived at by dividing net asset value*3 by risk capital. A risk capital of 99.95% VaR is
Initiatives to Strengthen ERM Framework
Tokio Marine Group continues to take steps to further strengthen its ERM framework to address increasingly diverse and complex risks. For example, the Group has established ERM Committee as one of its global committees, which includes the Group CEO, CFO, CRO and other C-level officers as well as management personnel from overseas Group companies to discuss Group ERM strategies and policies.
equivalent to the damage caused by an occurrence of a risk that happens once in 2000 years. While many insurance companies around the world use 99.5% VaR (once in 200 years), Tokio Marine Group uses much more stringent standards to evaluate risk capital.
Tokio Marine Group has set its ESR target range at 150 to 210%. As of March 31, 2020, the ESR is 153%, indicating that the Group’s level of capital is adequate.
Furthermore, of the “material risks” identified in the qualitative risk management, stress tests are conducted for those risks which have major economic loss in order to validate business continuity and to ensure that there are no issues with capital adequacy or liquidity of funds.
In fiscal 2019, in order to strengthen the Group’s ERM framework, support was provided to upgrade the ERM framework in each country through the dialogue with the Group CRO and the CROs of major overseas subsidiaries. In addition, initiatives were taken to reduce interest rate risk and optimize retention and reinsurance relating to domestic natural disaster risks. Furthermore, stress tests were conducted to cope with the spread of COVID-19 at fiscal year-end, and confirmed the adequacy of capital.
Under the Group’s core identity of “To Be a Good Company,” Tokio Marine Group will nurture a risk-awareness culture and continue to systematically develop talent who specialize in ERM management.
*3. Net asset value: Calculated by adding the value of life insurance policies in-force, capital liabilities such as catastrophe loss reserves, price fluctuation reserves, etc. to consolidated net assets on a financial accounting basis, while deducting planned distribution to shareholders, goodwill, etc.
(Trillions of yen)
2.7
4.2
Risk
Netassetvalue
153%
March 31, 2020
Concept of capital management based on Economic Solvency Ratio (ESR)
Implementation of;• Business investment, and/or• Additional risk-taking, and/or• Shareholder return
Strategic consideration of;• Business investment, and/or• Additional risk-taking, and/or• Shareholder return
• De-risking• Consideration of capital increase• Review of shareholder return policy
• Aim to recover capital level through accumulation of profits
• Control risk level by reducing risk-taking activities
TargetRange
ESR
210%
150%
100%
Tokio Marine Holdings, Inc. | Integrated Annual Report 2020
8180
Part 3 | E
nviro
nm
ent/S
ociety
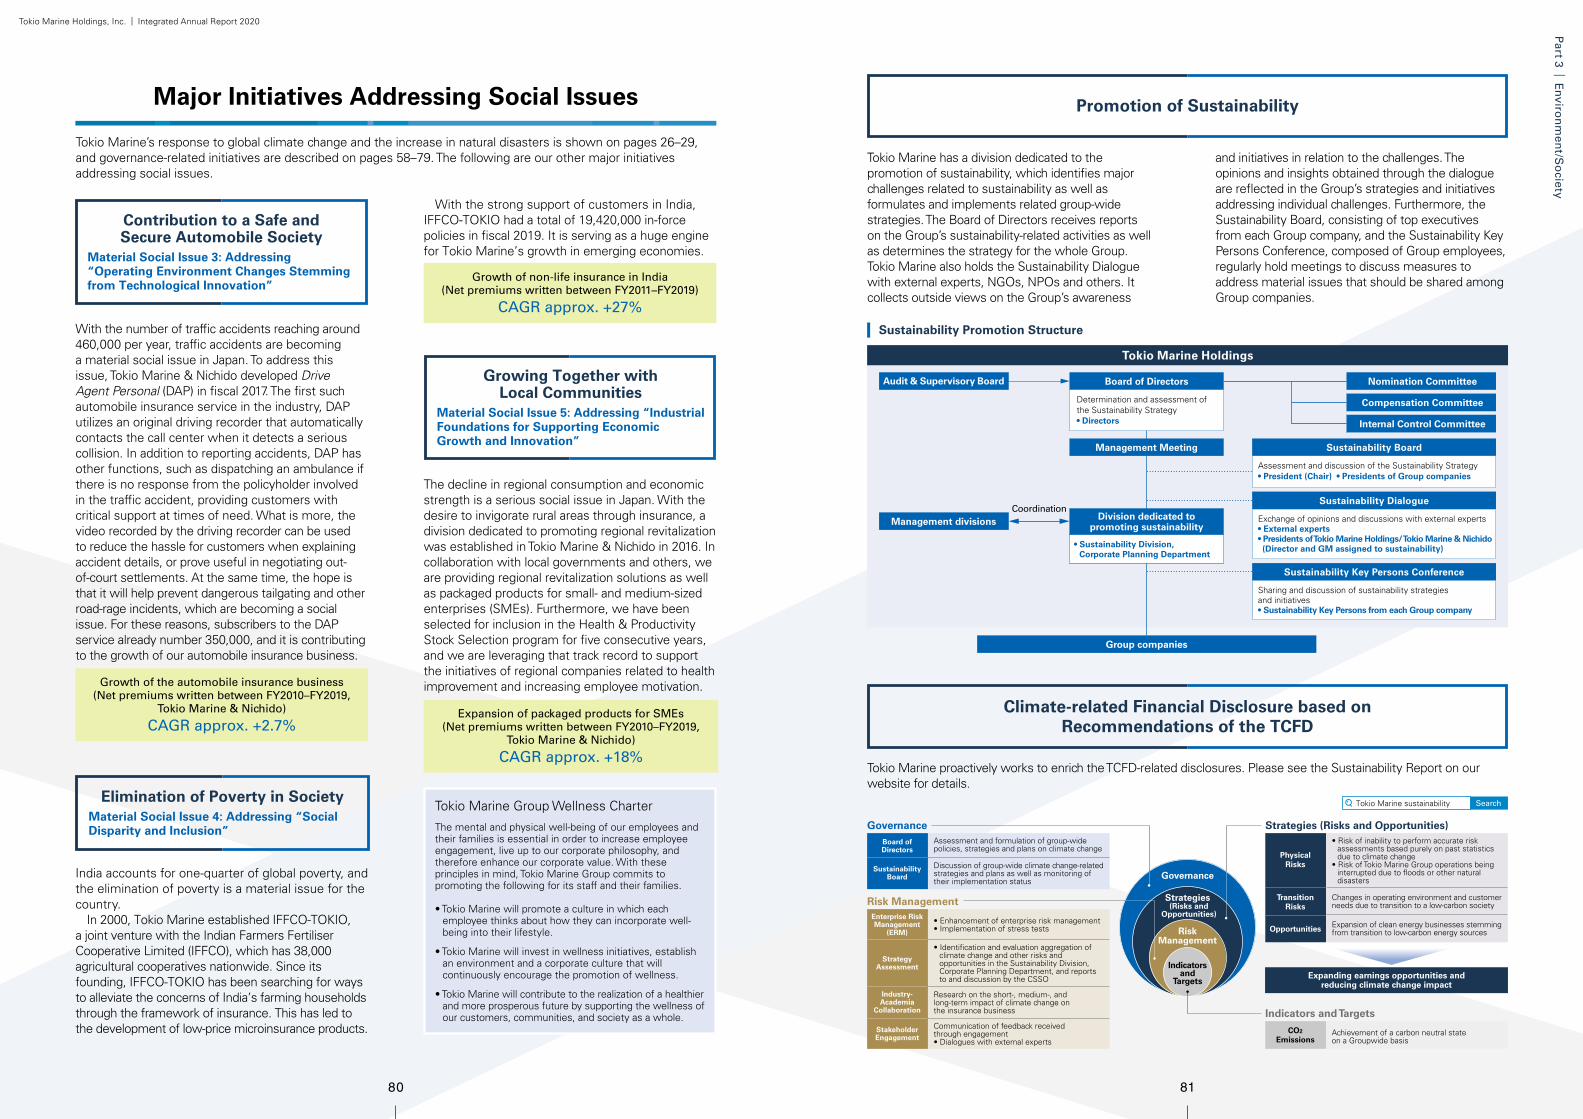
Major Initiatives Addressing Social Issues
Sustainability Promotion Structure
Promotion of Sustainability
Climate-related Financial Disclosure based on Recommendations of the TCFD
Audit & Supervisory Board Nomination Committee
Compensation Committee
Internal Control Committee
Board of Directors
Determination and assessment ofthe Sustainability Strategy• Directors
Sustainability Board
Assessment and discussion of the Sustainability Strategy• President (Chair) • Presidents of Group companies
Sustainability Key Persons Conference
Sharing and discussion of sustainability strategiesand initiatives• Sustainability Key Persons from each Group company
Sustainability Dialogue
Exchange of opinions and discussions with external experts• External experts• Presidents of Tokio Marine Holdings/ Tokio Marine & Nichido (Director and GM assigned to sustainability)
Management Meeting
Division dedicated topromoting sustainability
• Sustainability Division, Corporate Planning Department
Management divisionsCoordination
Group companies
Tokio Marine Holdings
Governance
Strategies (Risks and
Opportunities)
RiskManagement
Indicatorsand
Targets
GovernanceBoard ofDirectors
Assessment and formulation of group-wide policies, strategies and plans on climate change
SustainabilityBoard
Discussion of group-wide climate change-related strategies and plans as well as monitoring of their implementation status
Indicators and Targets
CO2
EmissionsAchievement of a carbon neutral state on a Groupwide basis
Strategies (Risks and Opportunities)
PhysicalRisks
• Risk of inability to perform accurate risk assessments based purely on past statistics due to climate change
• Risk of Tokio Marine Group operations being interrupted due to floods or other natural disasters
TransitionRisks
Changes in operating environment and customer needs due to transition to a low-carbon society
Opportunities Expansion of clean energy businesses stemming from transition to low-carbon energy sources
Risk ManagementEnterprise RiskManagement
(ERM)
• Enhancement of enterprise risk management• Implementation of stress tests
StakeholderEngagement
Communication of feedback received through engagement• Dialogues with external experts
StrategyAssessment
• Identification and evaluation aggregation of climate change and other risks and opportunities in the Sustainability Division, Corporate Planning Department, and reports to and discussion by the CSSO
Industry-Academia
Collaboration
Research on the short-, medium-, and long-term impact of climate change on the insurance business
Expanding earnings opportunities andreducing climate change impact
Contribution to a Safe andSecure Automobile Society
Material Social Issue 3: Addressing “Operating Environment Changes Stemming from Technological Innovation”
With the number of traffic accidents reaching around 460,000 per year, traffic accidents are becoming a material social issue in Japan. To address this issue, Tokio Marine & Nichido developed Drive Agent Personal (DAP) in fiscal 2017. The first such automobile insurance service in the industry, DAP utilizes an original driving recorder that automatically contacts the call center when it detects a serious collision. In addition to reporting accidents, DAP has other functions, such as dispatching an ambulance if there is no response from the policyholder involved in the traffic accident, providing customers with critical support at times of need. What is more, the video recorded by the driving recorder can be used to reduce the hassle for customers when explaining accident details, or prove useful in negotiating out-of-court settlements. At the same time, the hope is that it will help prevent dangerous tailgating and other road-rage incidents, which are becoming a social issue. For these reasons, subscribers to the DAP service already number 350,000, and it is contributing to the growth of our automobile insurance business.
Growth of the automobile insurance business(Net premiums written between FY2010–FY2019,
Tokio Marine & Nichido)
CAGR approx. +2.7%
Elimination of Poverty in SocietyMaterial Social Issue 4: Addressing “Social Disparity and Inclusion”
India accounts for one-quarter of global poverty, and the elimination of poverty is a material issue for the country.
In 2000, Tokio Marine established IFFCO-TOKIO, a joint venture with the Indian Farmers Fertiliser Cooperative Limited (IFFCO), which has 38,000 agricultural cooperatives nationwide. Since its founding, IFFCO-TOKIO has been searching for ways to alleviate the concerns of India’s farming households through the framework of insurance. This has led to the development of low-price microinsurance products.
Tokio Marine’s response to global climate change and the increase in natural disasters is shown on pages 26–29, and governance-related initiatives are described on pages 58–79. The following are our other major initiatives addressing social issues.
Tokio Marine has a division dedicated to the promotion of sustainability, which identifies major challenges related to sustainability as well as formulates and implements related group-wide strategies. The Board of Directors receives reports on the Group’s sustainability-related activities as well as determines the strategy for the whole Group. Tokio Marine also holds the Sustainability Dialogue with external experts, NGOs, NPOs and others. It collects outside views on the Group’s awareness
Tokio Marine proactively works to enrich the TCFD-related disclosures. Please see the Sustainability Report on our website for details.
and initiatives in relation to the challenges. The opinions and insights obtained through the dialogue are reflected in the Group’s strategies and initiatives addressing individual challenges. Furthermore, the Sustainability Board, consisting of top executives from each Group company, and the Sustainability Key Persons Conference, composed of Group employees, regularly hold meetings to discuss measures to address material issues that should be shared among Group companies.
Tokio Marine Group Wellness Charter
The mental and physical well-being of our employees and their families is essential in order to increase employee engagement, live up to our corporate philosophy, and therefore enhance our corporate value. With these principles in mind, Tokio Marine Group commits to promoting the following for its staff and their families.
• Tokio Marine will promote a culture in which each employee thinks about how they can incorporate well-being into their lifestyle.
• Tokio Marine will invest in wellness initiatives, establish an environment and a corporate culture that will continuously encourage the promotion of wellness.
• Tokio Marine will contribute to the realization of a healthier and more prosperous future by supporting the wellness of our customers, communities, and society as a whole.
SearchTokio Marine sustainability
With the strong support of customers in India, IFFCO-TOKIO had a total of 19,420,000 in-force policies in fiscal 2019. It is serving as a huge engine for Tokio Marine’s growth in emerging economies.
Growth of non-life insurance in India(Net premiums written between FY2011–FY2019)
CAGR approx. +27%
Growing Together withLocal Communities
Material Social Issue 5: Addressing “Industrial Foundations for Supporting Economic Growth and Innovation”
The decline in regional consumption and economic strength is a serious social issue in Japan. With the desire to invigorate rural areas through insurance, a division dedicated to promoting regional revitalization was established in Tokio Marine & Nichido in 2016. In collaboration with local governments and others, we are providing regional revitalization solutions as well as packaged products for small- and medium-sized enterprises (SMEs). Furthermore, we have been selected for inclusion in the Health & Productivity Stock Selection program for five consecutive years, and we are leveraging that track record to support the initiatives of regional companies related to health improvement and increasing employee motivation.
Expansion of packaged products for SMEs(Net premiums written between FY2010–FY2019,
Tokio Marine & Nichido)
CAGR approx. +18%
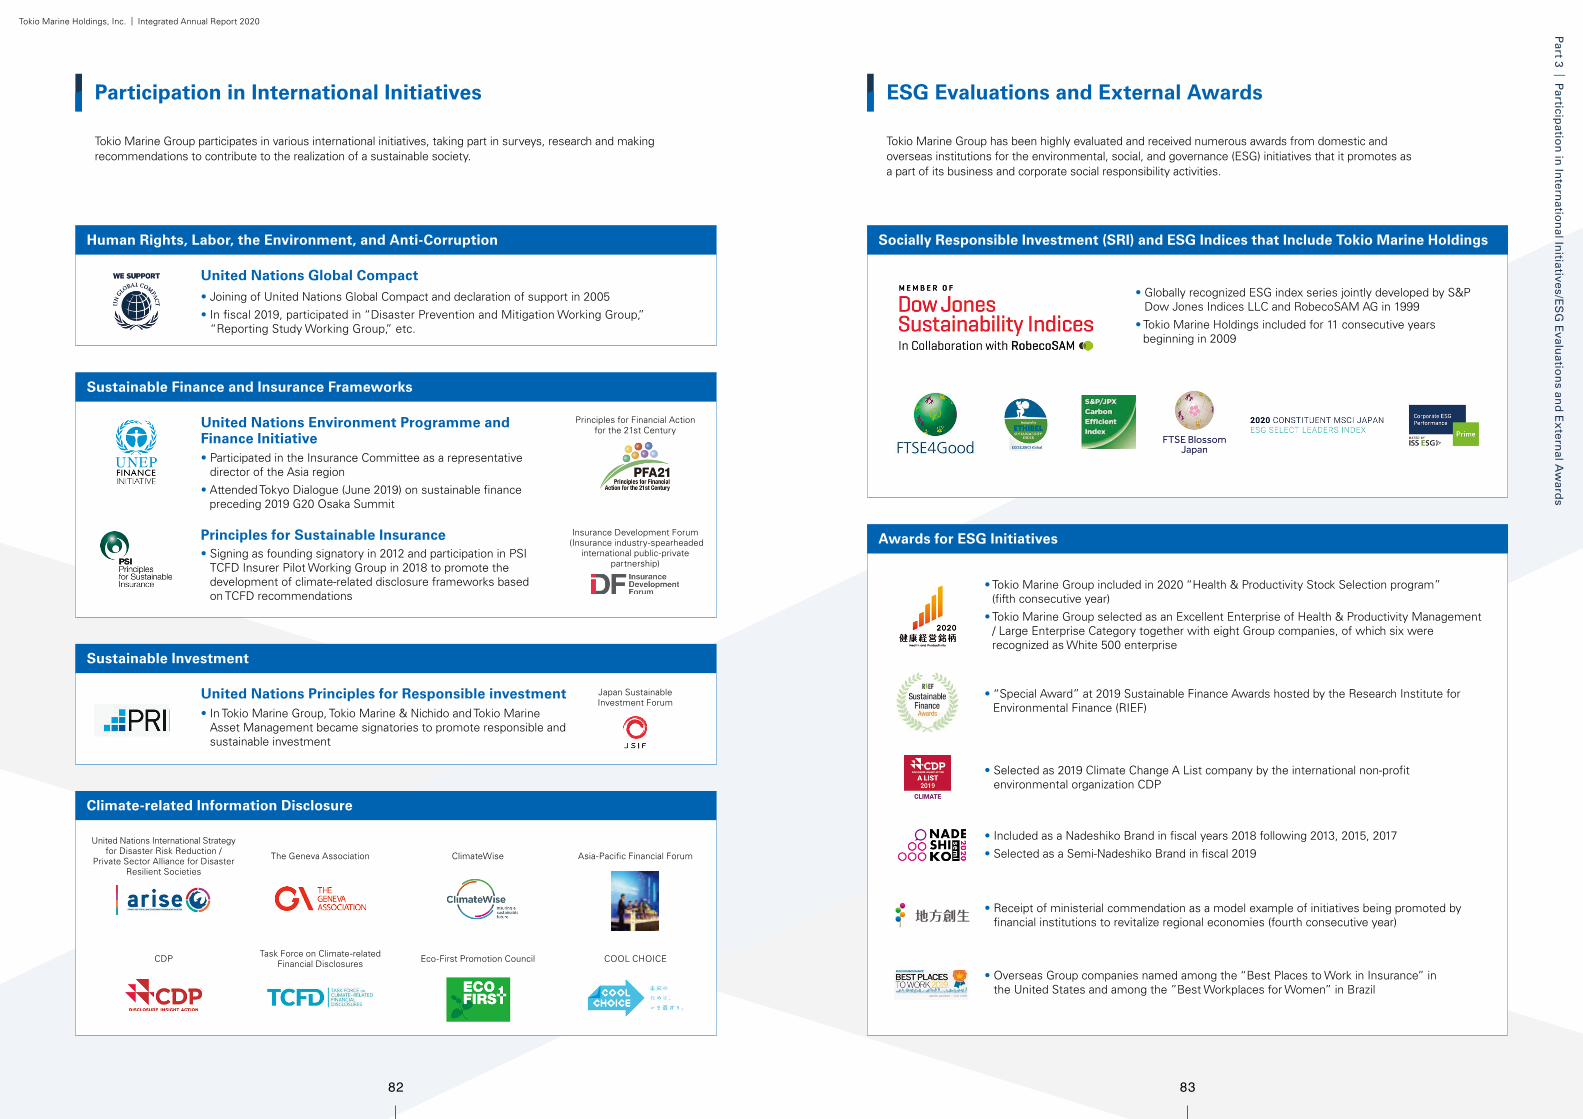
Tokio Marine Holdings, Inc. | Integrated Annual Report 2020
8382
Human Rights, Labor, the Environment, and Anti-Corruption
United Nations Global Compact
Sustainable Finance and Insurance Frameworks
United Nations Environment Programme and Finance Initiative
Principles for Sustainable Insurance• Signing as founding signatory in 2012 and participation in PSI
TCFD Insurer Pilot Working Group in 2018 to promote the development of climate-related disclosure frameworks based on TCFD recommendations
Insurance Development Forum (Insurance industry-spearheaded
international public-private partnership)
Sustainable Investment
United Nations Principles for Responsible investment• In Tokio Marine Group, Tokio Marine & Nichido and Tokio Marine
Asset Management became signatories to promote responsible and sustainable investment
Japan Sustainable Investment Forum
Climate-related Information Disclosure
United Nations International Strategy for Disaster Risk Reduction /
Private Sector Alliance for Disaster Resilient Societies
CDP
The Geneva Association
Task Force on Climate-related Financial Disclosures
ClimateWise
Eco-First Promotion Council
Asia-Pacific Financial Forum
COOL CHOICE
Socially Responsible Investment (SRI) and ESG Indices that Include Tokio Marine Holdings
• Globally recognized ESG index series jointly developed by S&P Dow Jones Indices LLC and RobecoSAM AG in 1999
• Tokio Marine Holdings included for 11 consecutive years beginning in 2009
Awards for ESG Initiatives
• Tokio Marine Group included in 2020 “Health & Productivity Stock Selection program”(fifth consecutive year)
• Tokio Marine Group selected as an Excellent Enterprise of Health & Productivity Management / Large Enterprise Category together with eight Group companies, of which six were recognized as White 500 enterprise
• Included as a Nadeshiko Brand in fiscal years 2018 following 2013, 2015, 2017
• Selected as a Semi-Nadeshiko Brand in fiscal 2019
• “Special Award” at 2019 Sustainable Finance Awards hosted by the Research Institute for Environmental Finance (RIEF)
• Selected as 2019 Climate Change A List company by the international non-profit environmental organization CDP
• Receipt of ministerial commendation as a model example of initiatives being promoted by financial institutions to revitalize regional economies (fourth consecutive year)
• Overseas Group companies named among the “Best Places to Work in Insurance” in the United States and among the ”Best Workplaces for Women” in Brazil
Participation in International Initiatives ESG Evaluations and External Awards
Principles for Financial Action for the 21st Century
• Participated in the Insurance Committee as a representative director of the Asia region
• Attended Tokyo Dialogue (June 2019) on sustainable finance preceding 2019 G20 Osaka Summit
Tokio Marine Group participates in various international initiatives, taking part in surveys, research and making recommendations to contribute to the realization of a sustainable society.
Tokio Marine Group has been highly evaluated and received numerous awards from domestic and overseas institutions for the environmental, social, and governance (ESG) initiatives that it promotes as a part of its business and corporate social responsibility activities.
• Joining of United Nations Global Compact and declaration of support in 2005
• In fiscal 2019, participated in “Disaster Prevention and Mitigation Working Group,” “Reporting Study Working Group,” etc.
Part 3 | P
articipatio
n in
Intern
ation
al Initiatives/E
SG
Evalu
ation
s and
Ex
ternal A
ward
s
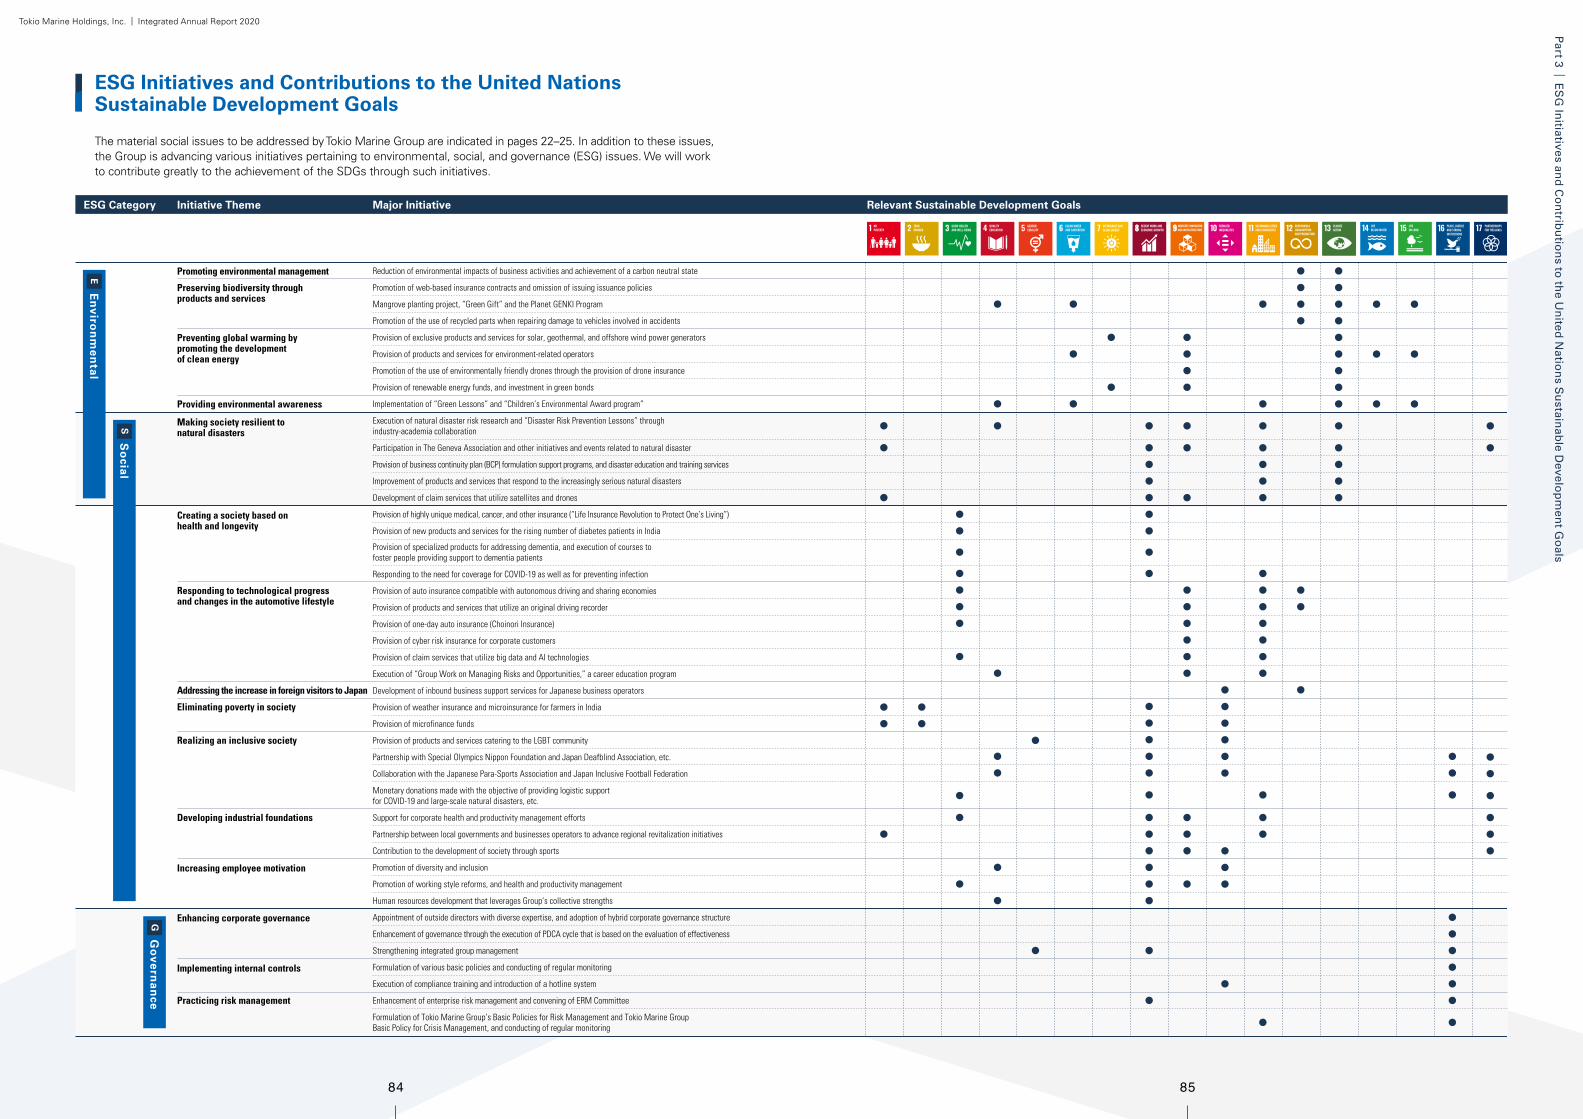
Tokio Marine Holdings, Inc. | Integrated Annual Report 2020
8584
ESG Initiatives and Contributions to the United Nations Sustainable Development Goals
The material social issues to be addressed by Tokio Marine Group are indicated in pages 22–25. In addition to these issues, the Group is advancing various initiatives pertaining to environmental, social, and governance (ESG) issues. We will work to contribute greatly to the achievement of the SDGs through such initiatives.
Part 3 | E
SG
Initiatives an
d C
on
tribu
tion
s to th
e Un
ited N
ation
s Su
stainab
le Develo
pm
ent G
oals
Relevant Sustainable Development GoalsESG Category Initiative Theme Major Initiative
En
viro
nm
en
tal
E
So
cial
S
Go
ve
rna
nce
G
Promoting environmental management
Providing environmental awareness
Preserving biodiversity throughproducts and services
Making society resilient tonatural disasters
Creating a society based onhealth and longevity
Responding to technological progressand changes in the automotive lifestyle
Addressing the increase in foreign visitors to Japan
Eliminating poverty in society
Realizing an inclusive society
Developing industrial foundations
Increasing employee motivation
Enhancing corporate governance
Implementing internal controls
Practicing risk management
Preventing global warming bypromoting the developmentof clean energy
Reduction of environmental impacts of business activities and achievement of a carbon neutral state
Promotion of web-based insurance contracts and omission of issuing issuance policies
Mangrove planting project, “Green Gift” and the Planet GENKI Program
Promotion of the use of recycled parts when repairing damage to vehicles involved in accidents
Provision of exclusive products and services for solar, geothermal, and offshore wind power generators
Provision of products and services for environment-related operators
Promotion of the use of environmentally friendly drones through the provision of drone insurance
Provision of renewable energy funds, and investment in green bonds
Implementation of “Green Lessons” and “Children’s Environmental Award program”
Execution of natural disaster risk research and “Disaster Risk Prevention Lessons” throughindustry-academia collaboration
Participation in The Geneva Association and other initiatives and events related to natural disaster
Provision of business continuity plan (BCP) formulation support programs, and disaster education and training services
Improvement of products and services that respond to the increasingly serious natural disasters
Development of claim services that utilize satellites and drones
Provision of highly unique medical, cancer, and other insurance (“Life Insurance Revolution to Protect One’s Living”)
Provision of new products and services for the rising number of diabetes patients in India
Provision of specialized products for addressing dementia, and execution of courses tofoster people providing support to dementia patients
Responding to the need for coverage for COVID-19 as well as for preventing infection
Provision of auto insurance compatible with autonomous driving and sharing economies
Provision of products and services that utilize an original driving recorder
Provision of one-day auto insurance (Choinori Insurance)
Provision of cyber risk insurance for corporate customers
Provision of claim services that utilize big data and AI technologies
Execution of “Group Work on Managing Risks and Opportunities,” a career education program
Development of inbound business support services for Japanese business operators
Provision of weather insurance and microinsurance for farmers in India
Provision of microfinance funds
Provision of products and services catering to the LGBT community
Partnership with Special Olympics Nippon Foundation and Japan Deafblind Association, etc.
Collaboration with the Japanese Para-Sports Association and Japan Inclusive Football Federation
Monetary donations made with the objective of providing logistic supportfor COVID-19 and large-scale natural disasters, etc.
Support for corporate health and productivity management efforts
Partnership between local governments and businesses operators to advance regional revitalization initiatives
Contribution to the development of society through sports
Promotion of diversity and inclusion
Promotion of working style reforms, and health and productivity management
Human resources development that leverages Group’s collective strengths
Appointment of outside directors with diverse expertise, and adoption of hybrid corporate governance structure
Enhancement of governance through the execution of PDCA cycle that is based on the evaluation of effectiveness
Strengthening integrated group management
Formulation of various basic policies and conducting of regular monitoring
Execution of compliance training and introduction of a hotline system
Enhancement of enterprise risk management and convening of ERM Committee
Formulation of Tokio Marine Group’s Basic Policies for Risk Management and Tokio Marine GroupBasic Policy for Crisis Management, and conducting of regular monitoring
●
●
●
●
●
●
●
●
●
●
●
●
●
●
●
●
●
●
●
●
●
●
●
●
●
●
●
●
●
●
●
●
●
●
●
●
●
●
●
●
●
●
●
●
●
●
●
●
●
●
●
●
●
●
●
●
●
●
●
●
●
●
●
●
●
●
●
●
●
●
●
●
●
●
●
●
●
●
●
●
●
●
●
●
●
●
●
●
●
●
●
●
●
●
●
●
●
●
●
●
●
●
●
●
●
●
●
●
●
●
●
●
●
●
●
●
●
●
●
●
●
●
●
●
●
●
●
●
●
●
●
●
●
●
●
●
●
●
●
●
●
●
●
●
●
●
●

Tokio Marine Holdings, Inc. | Integrated Annual Report 2020
8786
Part 4 | M
arket for In
suran
ce
Global Insurance Market
Profit growth in the U.S., which has the world’s largest insurance market, and stable growth in Japan, which has the world’s third-largest market (No. 4 in non-life insurance, and No. 3 in life insurance), are the key.The global insurance market in 2017 was worth $4,891 billion, with the U.S. in first place for both life and non-life insurance. Following China, Japan was in third place with the fourth largest non-life insurance and the third largest life insurance markets.
In addition to stable growth in developed markets, capturing booming emerging markets is the key.
Non-life premiums grow in tandem with economic growth in developed markets. However, in emerging markets, which have low levels of insurance penetration and upward trends in populations, insurance premiums show growth that exceeds economic growth. Note that increases in life premiums are greatly impacted by such factors as interest rates, market regulations, and taxation systems, so they are not necessary linked to economic growth.
Ranking Country Life premiumsNon-life
premiums*2
Total premiums
AmountChange against
2016 (%)Share of the
global total (%)
1 United States*3, 4 546,800 830,315 1,377,114 2.0 28.15
2 China*5 317,570 223,876 541,446 16.2 11.07
3 Japan*4, 6 307,232 114,818 422,050 -6.5 8.63
4 United Kingdom*4 189,833 93,499 283,331 -2.6 5.79
5 France*7 153,520 88,083 241,603 1.8 4.94
6 Germany*7, 8 96,973 126,005 222,978 3.8 4.56
7 South Korea*4, 6 102,839 78,378 181,218 2.4 3.70
8 Italy*4 113,947 41,562 155,509 -2.6 3.18
9 Canada*4, 9 51,592 67,927 119,520 5.5 2.44
10 Taiwan 98,602 18,873 117,474 15.8 2.40
Ten Largest Insurance Markets in Direct Premiums Written for Life Insurance and Non-life Insurance in 2017*1
Life and Non-Life Insurance Premiums in 2017, and Penetration through 1960–2017(Ratio of Insurance Premiums to GDP)
Insurance Penetration through 1960–2017(Ratio of Insurance Premiums to GDP)
Growth in Non-life and Life Premiums, and Growth in Real GDP (Seven-Year Moving Average)(Unit: Millions of USD)
*1. Before reinsurance*2. Includes personal accident insurance and health insurance*3. Non-life premiums include state funds
Life insurance premiums include the estimated value of group annuities premiums
*4. Estimated figures*5. Provisional figures*6. Fiscal year between April 1, 2017 and March 31, 2018*7. Figure for non-life premiums is provisional*8. Figure for life premiums is an estimate*9. Net premiums are shown for life premium amount
Source: Swiss Re Institute, sigma No. 3, 2018 Source: Swiss Re Institute, sigma No. 3, 2018
Source: Swiss Re Institute, sigma No. 3, 2018
Russia$21 billion
(0.4%)
RegionPremium
(Share)
(of which, Brazil)$83 billion
(1.7%)
Developed Europe, Middle East,and Africa (EMEA)
8%
6%
4%
2%
01960 2017
Emerging EMEA
2.5%
2.0%
1.5%
1.0%
0.5%
01960 2017
Emerging AsiaEmerging Asia
2.5%
2.0%
1.5%
1.0%
0.5%
01960 2017
Developed Asia-Pacific
8%
6%
4%
2%
01960 2017
Central and South America
2.5%
2.0%
1.5%
1.0%
0.5%
01960 2017
North America
8%
6%
4%
2%
01960 2017
Life insurance
Non-life insurance Insurance Penetration through 1960–2017(Ratio of Insurance Premiums to GDP)
* Circle size gives a visual idea of the size of premiums
North America$1,496 billion
(30.6%)
Western Europe$1,416 billion
(28.9%)
China$541 billion
(11.0%)
Japan$422 billion
(8.6%)
Central andSouth America
$167 billion(3.4%)
ASEAN$102 billion
(2.1%)
India$98 billion
(2.0%)
Oceania$90 billion
(1.8%)
Africa$66 billion
(1.3%)
1970
Developed Markets14%
12%
10%
8%
6%
4%
2%
0%
-2%1980 1990 2000 2010
Life insurance Non-life insurance Real GDP Life insurance Non-life insurance Real GDP
1970
Emerging Markets14%
12%
10%
8%
6%
4%
2%
0%
-2%1980 1990 2000 2010
Part 4 Business Summary and Data
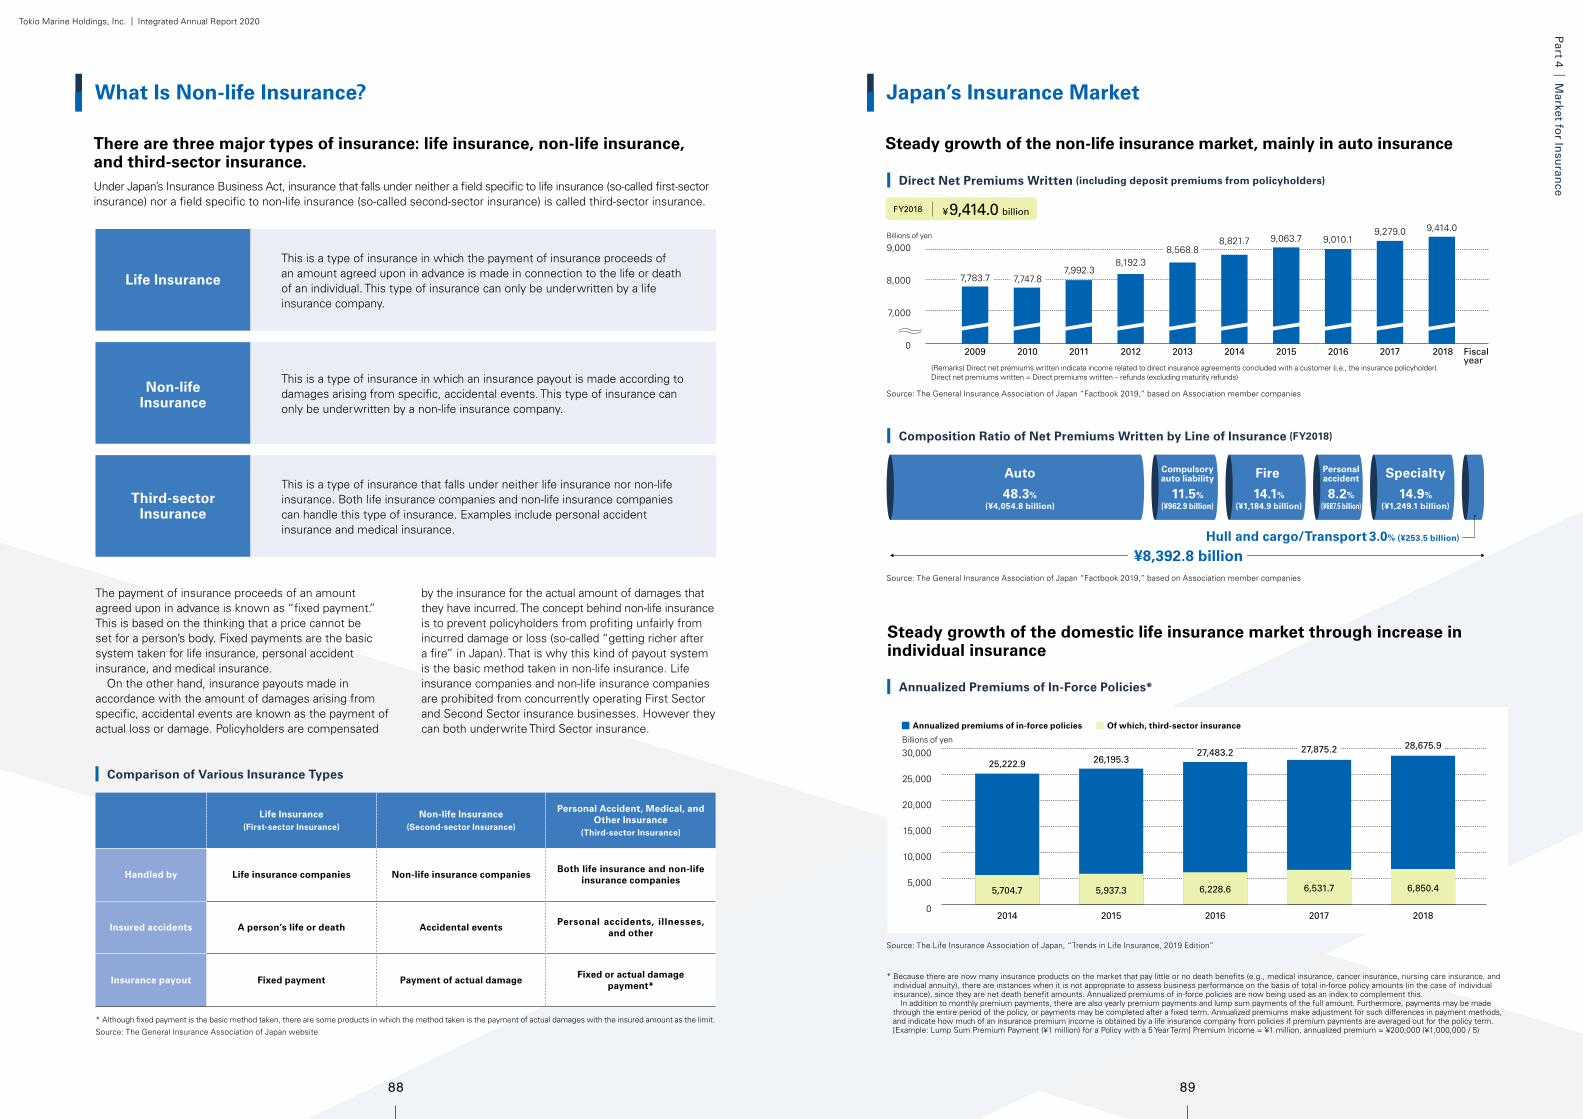
Tokio Marine Holdings, Inc. | Integrated Annual Report 2020
8988
Part 4 | M
arket for In
suran
ce
There are three major types of insurance: life insurance, non-life insurance, and third-sector insurance.Under Japan’s Insurance Business Act, insurance that falls under neither a field specific to life insurance (so-called first-sector insurance) nor a field specific to non-life insurance (so-called second-sector insurance) is called third-sector insurance.
Steady growth of the non-life insurance market, mainly in auto insurance
Steady growth of the domestic life insurance market through increase in individual insurance
What Is Non-life Insurance? Japan’s Insurance Market
The payment of insurance proceeds of an amount agreed upon in advance is known as “fixed payment.” This is based on the thinking that a price cannot be set for a person’s body. Fixed payments are the basic system taken for life insurance, personal accident insurance, and medical insurance.
On the other hand, insurance payouts made in accordance with the amount of damages arising from specific, accidental events are known as the payment of actual loss or damage. Policyholders are compensated
by the insurance for the actual amount of damages that they have incurred. The concept behind non-life insurance is to prevent policyholders from profiting unfairly from incurred damage or loss (so-called “getting richer after a fire” in Japan). That is why this kind of payout system is the basic method taken in non-life insurance. Life insurance companies and non-life insurance companies are prohibited from concurrently operating First Sector and Second Sector insurance businesses. However they can both underwrite Third Sector insurance.
* Because there are now many insurance products on the market that pay little or no death benefits (e.g., medical insurance, cancer insurance, nursing care insurance, and individual annuity), there are instances when it is not appropriate to assess business performance on the basis of total in-force policy amounts (in the case of individual insurance), since they are net death benefit amounts. Annualized premiums of in-force policies are now being used as an index to complement this.
In addition to monthly premium payments, there are also yearly premium payments and lump sum payments of the full amount. Furthermore, payments may be made through the entire period of the policy, or payments may be completed after a fixed term. Annualized premiums make adjustment for such differences in payment methods, and indicate how much of an insurance premium income is obtained by a life insurance company from policies if premium payments are averaged out for the policy term.[Example: Lump Sum Premium Payment (¥1 million) for a Policy with a 5 Year Term] Premium Income = ¥1 million, annualized premium = ¥200,000 (¥1,000,000 / 5)
Source: The General Insurance Association of Japan “Factbook 2019,” based on Association member companies
Source: The Life Insurance Association of Japan, “Trends in Life Insurance, 2019 Edition”
* Although fixed payment is the basic method taken, there are some products in which the method taken is the payment of actual damages with the insured amount as the limit.
Source: The General Insurance Association of Japan website
Life Insurance
This is a type of insurance in which the payment of insurance proceeds of an amount agreed upon in advance is made in connection to the life or death of an individual. This type of insurance can only be underwritten by a life insurance company.
Non-life Insurance
This is a type of insurance in which an insurance payout is made according to damages arising from specific, accidental events. This type of insurance can only be underwritten by a non-life insurance company.
Third-sector Insurance
This is a type of insurance that falls under neither life insurance nor non-life insurance. Both life insurance companies and non-life insurance companies can handle this type of insurance. Examples include personal accident insurance and medical insurance.
Life Insurance(First-sector Insurance)
Non-life Insurance(Second-sector Insurance)
Personal Accident, Medical, and Other Insurance
(Third-sector Insurance)
Handled by Life insurance companies Non-life insurance companiesBoth life insurance and non-life
insurance companies
Insured accidents A person’s life or death Accidental eventsPersonal accidents, illnesses,
and other
Insurance payout Fixed payment Payment of actual damageFixed or actual damage
payment*
Comparison of Various Insurance Types
Direct Net Premiums Written (including deposit premiums from policyholders)
Annualized Premiums of In-Force Policies*
Composition Ratio of Net Premiums Written by Line of Insurance (FY2018)
Source: The General Insurance Association of Japan “Factbook 2019,” based on Association member companies
(Remarks) Direct net premiums written indicate income related to direct insurance agreements concluded with a customer (i.e., the insurance policyholder).Direct net premiums written = Direct premiums written – refunds (excluding maturity refunds)
Billions of yen
0
8,000
7,000
9,000
FY2018 ¥9,414.0 billion
7,783.7 7,747.87,992.3
8,192.38,568.8
8,821.7 9,063.7 9,010.19,279.0 9,414.0
2009 2010 2011 2012 2013 2014 2015 2016 2017 2018 Fiscalyear
Billions of yen
0
5,000
10,000
15,000
20,000
25,000
30,000
2014
25,222.9
Annualized premiums of in-force policies Of which, third-sector insurance
2015
26,195.3
2016
27,483.2
2017
27,875.2
2018
28,675.9
5,704.7 5,937.3 6,228.6 6,531.7 6,850.4
Auto
48.3%(¥4,054.8 billion)
Compulsoryauto liability
11.5%(¥962.9 billion)
Hull and cargo/Transport 3.0% (¥253.5 billion)
Fire
14.1%(¥1,184.9 billion)
Specialty
14.9%(¥1,249.1 billion)
¥8,392.8 billion
Personalaccident
8.2%(¥687.5 billion)
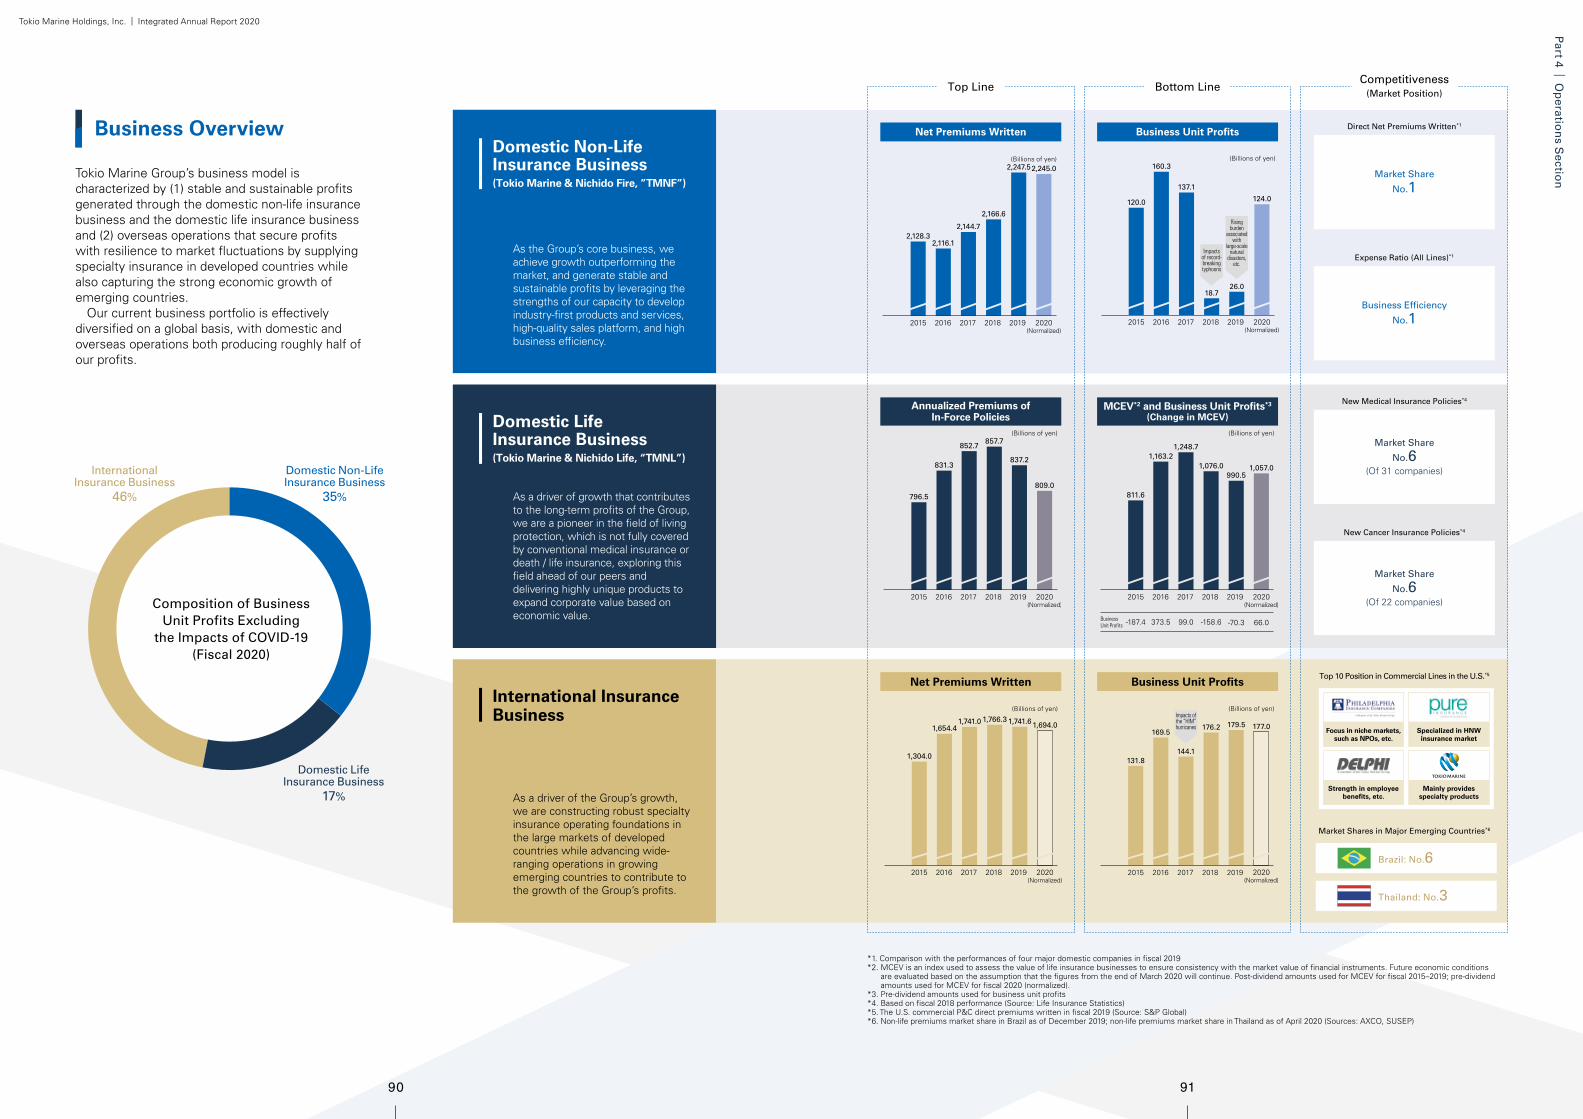
Tokio Marine Holdings, Inc. | Integrated Annual Report 2020
9190
Part 4 | O
peratio
ns S
ection
*1. Comparison with the performances of four major domestic companies in fiscal 2019*2. MCEV is an index used to assess the value of life insurance businesses to ensure consistency with the market value of financial instruments. Future economic conditions
are evaluated based on the assumption that the figures from the end of March 2020 will continue. Post-dividend amounts used for MCEV for fiscal 2015–2019; pre-dividend amounts used for MCEV for fiscal 2020 (normalized).
*3. Pre-dividend amounts used for business unit profits*4. Based on fiscal 2018 performance (Source: Life Insurance Statistics)*5. The U.S. commercial P&C direct premiums written in fiscal 2019 (Source: S&P Global)*6. Non-life premiums market share in Brazil as of December 2019; non-life premiums market share in Thailand as of April 2020 (Sources: AXCO, SUSEP)
As the Group’s core business, we achieve growth outperforming the market, and generate stable and sustainable profits by leveraging the strengths of our capacity to develop industry-first products and services, high-quality sales platform, and high business efficiency.
Domestic Non-Life Insurance Business(Tokio Marine & Nichido Fire, ”TMNF”)
Domestic Life Insurance Business(Tokio Marine & Nichido Life, “TMNL”)
As a driver of growth that contributes to the long-term profits of the Group, we are a pioneer in the field of living protection, which is not fully covered by conventional medical insurance or death / life insurance, exploring this field ahead of our peers and delivering highly unique products to expand corporate value based on economic value.
As a driver of the Group’s growth, we are constructing robust specialty insurance operating foundations in the large markets of developed countries while advancing wide-ranging operations in growing emerging countries to contribute to the growth of the Group’s profits.
International Insurance Business
Competitiveness(Market Position)
Bottom LineTop Line
Net Premiums Written
Annualized Premiums ofIn-Force Policies
Net Premiums Written
Business Unit Profits
MCEV*2 and Business Unit Profits*3
(Change in MCEV)
Business Unit Profits
Market Share
No.1
Direct Net Premiums Written*1
Business Efficiency
No.1
Expense Ratio (All Lines)*1
Market Share
No.6(Of 31 companies)
New Medical Insurance Policies*4
Market Share
No.6(Of 22 companies)
New Cancer Insurance Policies*4
Market Shares in Major Emerging Countries*6
Top 10 Position in Commercial Lines in the U.S.*5
Brazil: No.6
Business Overview
Specialized in HNWinsurance market
Focus in niche markets,such as NPOs, etc.
Strength in employeebenefits, etc.
Mainly providesspecialty products
Thailand: No.3
Tokio Marine Group’s business model is characterized by (1) stable and sustainable profits generated through the domestic non-life insurance business and the domestic life insurance business and (2) overseas operations that secure profits with resilience to market fluctuations by supplying specialty insurance in developed countries while also capturing the strong economic growth of emerging countries.
Our current business portfolio is effectively diversified on a global basis, with domestic and overseas operations both producing roughly half of our profits.
Domestic Non-LifeInsurance Business
35%
Domestic LifeInsurance Business
17%
InternationalInsurance Business
46%
Composition of BusinessUnit Profits Excluding
the Impacts of COVID-19(Fiscal 2020)
2,128.32,116.1
2,144.7
2,166.6
2,247.52,245.0(Billions of yen)
2018 2019 2020(Normalized)
20172015 2016
120.0
160.3
137.1
18.726.0
124.0
2018 2019 2020(Normalized)
20172015 2016
Impacts of record-breaking typhoons
Rising burden
associated with
large-scale natural
disasters, etc.
(Billions of yen)
796.5
831.3
852.7857.7
837.2
809.0
2018 2019 2020(Normalized)
20172015 2016
(Billions of yen)
811.6
1,163.21,248.7
1,076.0990.5
1,057.0
2018 2019 2020(Normalized)
20172015 2016
-187.4 373.5 99.0 -158.6 -70.3 66.0BusinessUnit Profits
(Billions of yen)
1,304.0
1,654.41,741.0 1,766.3 1,741.6 1,694.0
2018 2019 2020(Normalized)
20172015 2016
(Billions of yen)
131.8
169.5
144.1
176.2 179.5 177.0
2018 2019 2020(Normalized)
20172015 2016
Impacts of the “HIM” hurricanes
(Billions of yen)
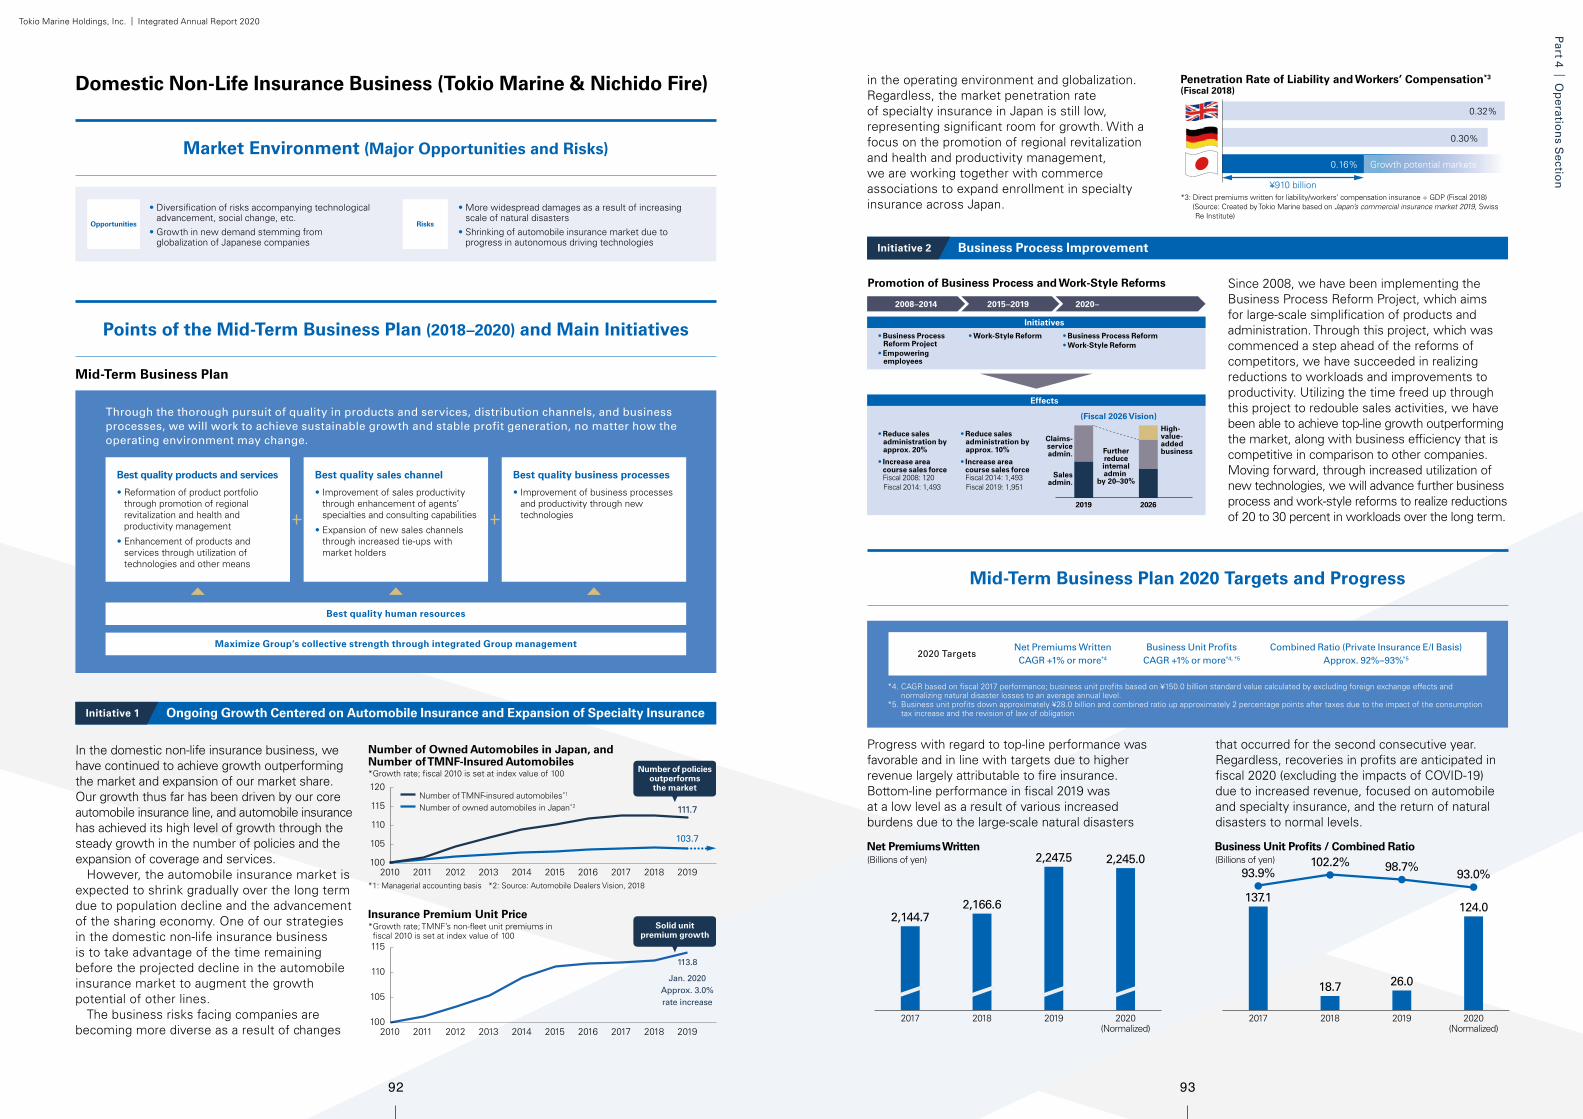
Tokio Marine Holdings, Inc. | Integrated Annual Report 2020
9392
Part 4 | O
peratio
ns S
ection
Mid-Term Business Plan 2020 Targets and Progress
Points of the Mid-Term Business Plan (2018–2020) and Main Initiatives
Mid-Term Business Plan
Market Environment (Major Opportunities and Risks)
• Diversification of risks accompanying technological advancement, social change, etc.
• Growth in new demand stemming from globalization of Japanese companies
Opportunities Risks
• More widespread damages as a result of increasing scale of natural disasters
• Shrinking of automobile insurance market due to progress in autonomous driving technologies
Through the thorough pursuit of quality in products and services, distribution channels, and business processes, we will work to achieve sustainable growth and stable profit generation, no matter how the operating environment may change.
Best quality human resources
Maximize Group’s collective strength through integrated Group management
Best quality products and services
• Reformation of product portfolio through promotion of regional revitalization and health and productivity management
• Enhancement of products and services through utilization of technologies and other means
Best quality sales channel
• Improvement of sales productivity through enhancement of agents’ specialties and consulting capabilities
• Expansion of new sales channels through increased tie-ups with market holders
Best quality business processes
• Improvement of business processes and productivity through new technologies
*4. CAGR based on fiscal 2017 performance; business unit profits based on ¥150.0 billion standard value calculated by excluding foreign exchange effects and normalizing natural disaster losses to an average annual level.
*5. Business unit profits down approximately ¥28.0 billion and combined ratio up approximately 2 percentage points after taxes due to the impact of the consumption tax increase and the revision of law of obligation
2020 TargetsNet Premiums WrittenCAGR +1% or more*4
Business Unit ProfitsCAGR +1% or more*4, *5
Combined Ratio (Private Insurance E/I Basis) Approx. 92%–93%*5
Ongoing Growth Centered on Automobile Insurance and Expansion of Specialty InsuranceInitiative 1
Business Process ImprovementInitiative 2
Domestic Non-Life Insurance Business (Tokio Marine & Nichido Fire)
In the domestic non-life insurance business, we have continued to achieve growth outperforming the market and expansion of our market share. Our growth thus far has been driven by our core automobile insurance line, and automobile insurance has achieved its high level of growth through the steady growth in the number of policies and the expansion of coverage and services.
However, the automobile insurance market is expected to shrink gradually over the long term due to population decline and the advancement of the sharing economy. One of our strategies in the domestic non-life insurance business is to take advantage of the time remaining before the projected decline in the automobile insurance market to augment the growth potential of other lines.
The business risks facing companies are becoming more diverse as a result of changes
Since 2008, we have been implementing the Business Process Reform Project, which aims for large-scale simplification of products and administration. Through this project, which was commenced a step ahead of the reforms of competitors, we have succeeded in realizing reductions to workloads and improvements to productivity. Utilizing the time freed up through this project to redouble sales activities, we have been able to achieve top-line growth outperforming the market, along with business efficiency that is competitive in comparison to other companies. Moving forward, through increased utilization of new technologies, we will advance further business process and work-style reforms to realize reductions of 20 to 30 percent in workloads over the long term.
Progress with regard to top-line performance was favorable and in line with targets due to higher revenue largely attributable to fire insurance. Bottom-line performance in fiscal 2019 was at a low level as a result of various increased burdens due to the large-scale natural disasters
in the operating environment and globalization. Regardless, the market penetration rate of specialty insurance in Japan is still low, representing significant room for growth. With a focus on the promotion of regional revitalization and health and productivity management, we are working together with commerce associations to expand enrollment in specialty insurance across Japan.
that occurred for the second consecutive year. Regardless, recoveries in profits are anticipated in fiscal 2020 (excluding the impacts of COVID-19) due to increased revenue, focused on automobile and specialty insurance, and the return of natural disasters to normal levels.
*3: Direct premiums written for liability/workers’ compensation insurance ÷ GDP (Fiscal 2018)(Source: Created by Tokio Marine based on Japan’s commercial insurance market 2019, Swiss Re Institute)
Penetration Rate of Liability and Workers’ Compensation*3
(Fiscal 2018)
0.32%
0.30%
0.16%
¥910 billion
Growth potential markets
137.1
18.7 26.0
124.0
93.9%102.2% 98.7%
93.0%
2,144.72,166.6
2,247.5 2,245.0
2020(Normalized)
201920182017
(Billions of yen) (Billions of yen)Net Premiums Written Business Unit Profits / Combined Ratio
2020(Normalized)
201920182017
Promotion of Business Process and Work-Style Reforms
• Business Process Reform Project
• Empowering employees
• Work-Style Reform • Business Process Reform• Work-Style Reform
Initiatives
• Reduce sales administration by approx. 20%
• Increase area course sales forceFiscal 2008: 120Fiscal 2014: 1,493
• Reduce sales administration by approx. 10%
• Increase area course sales forceFiscal 2014: 1,493Fiscal 2019: 1,951
Effects
2008–2014 2015–2019 2020–
(Fiscal 2026 Vision)
2019 2026
Salesadmin.
Claims-serviceadmin. Further
reduceinternaladmin
by 20–30%
High-value-addedbusiness
*1: Managerial accounting basis *2: Source: Automobile Dealers Vision, 2018
Number of Owned Automobiles in Japan, and Number of TMNF-Insured Automobiles
Number of policiesoutperformsthe market
100
105
110
115
120*Growth rate; fiscal 2010 is set at index value of 100
2010 2011 2012 2013 2014 2015 2016 2017 2018 2019
103.7
111.7
Number of TMNF-insured automobiles*1
Number of owned automobiles in Japan*2
Insurance Premium Unit Price
100
105
110
115
*Growth rate; TMNF’s non-fleet unit premiums in fiscal 2010 is set at index value of 100
2010 2011 2012 2013 2014 2015 2016 2017 2018 2019
113.8
Jan. 2020Approx. 3.0%rate increase
Solid unitpremium growth
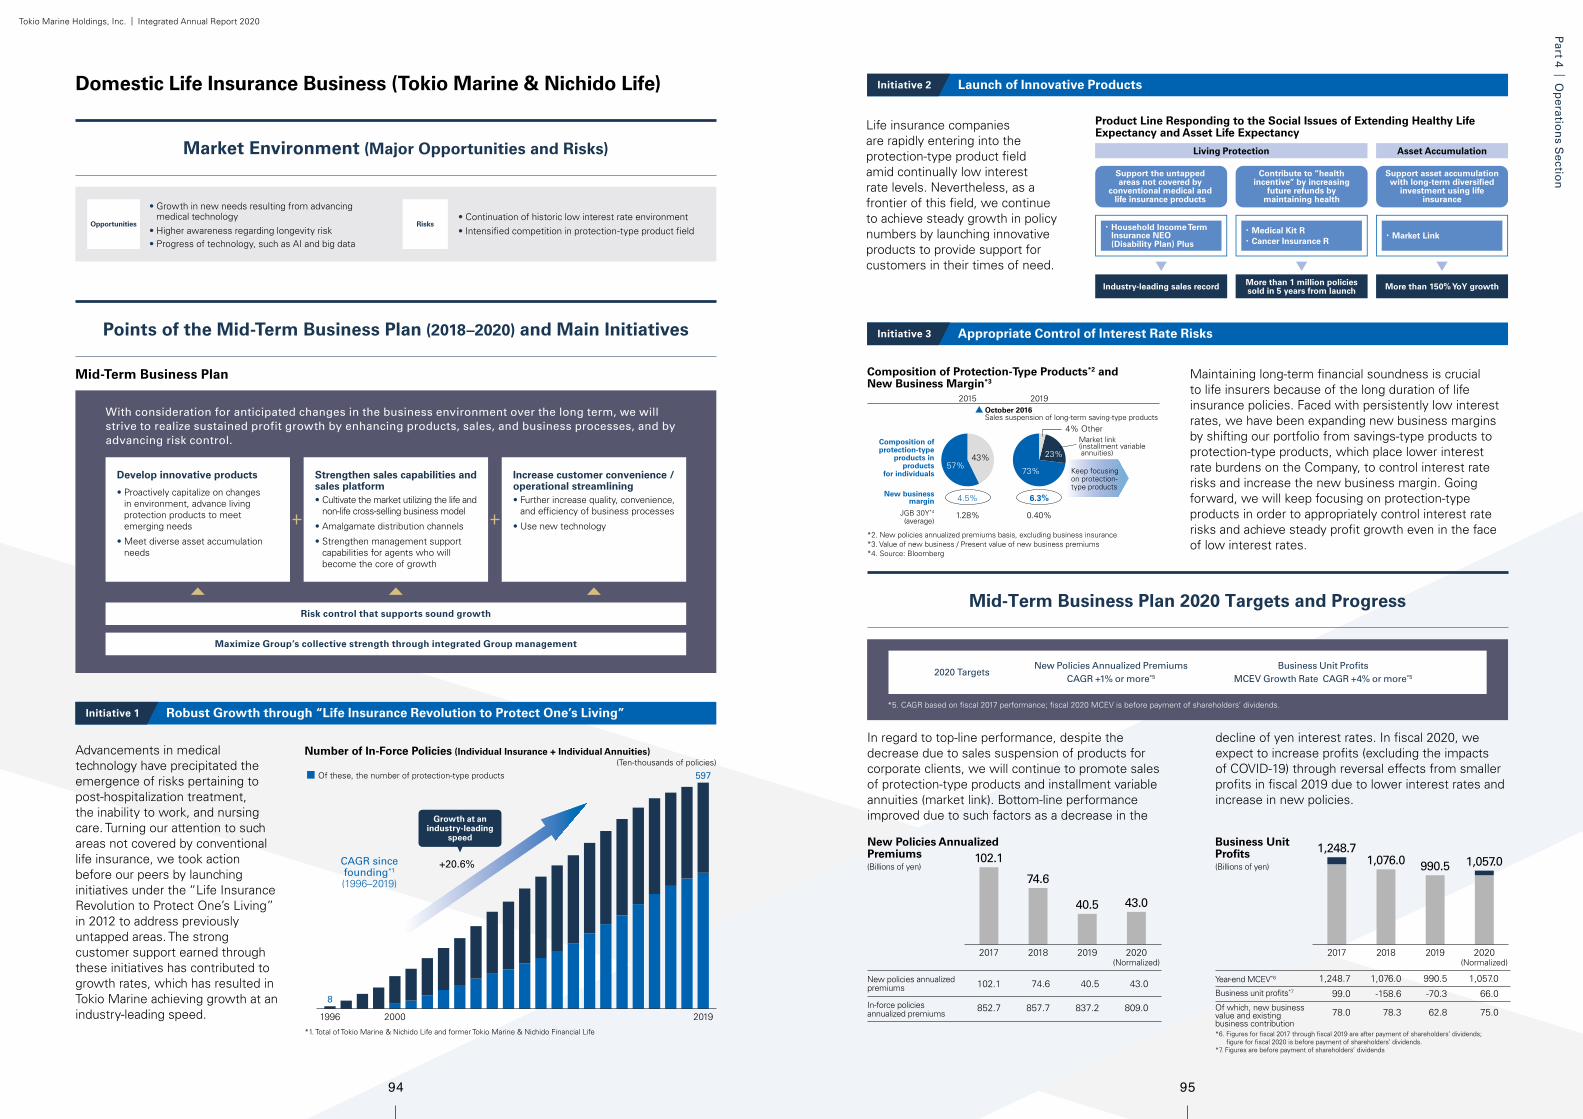
Tokio Marine Holdings, Inc. | Integrated Annual Report 2020
9594
Part 4 | O
peratio
ns S
ection
Mid-Term Business Plan 2020 Targets and Progress
*5. CAGR based on fiscal 2017 performance; fiscal 2020 MCEV is before payment of shareholders’ dividends.
2020 TargetsNew Policies Annualized Premiums
CAGR +1% or more*5
Business Unit ProfitsMCEV Growth Rate CAGR +4% or more*5
Points of the Mid-Term Business Plan (2018–2020) and Main Initiatives
Mid-Term Business Plan
Market Environment (Major Opportunities and Risks)
• Growth in new needs resulting from advancing medical technology
• Higher awareness regarding longevity risk• Progress of technology, such as AI and big data
Opportunities Risks• Continuation of historic low interest rate environment• Intensified competition in protection-type product field
With consideration for anticipated changes in the business environment over the long term, we will strive to realize sustained profit growth by enhancing products, sales, and business processes, and by advancing risk control.
Risk control that supports sound growth
Maximize Group’s collective strength through integrated Group management
Develop innovative products
• Proactively capitalize on changes in environment, advance living protection products to meet emerging needs
• Meet diverse asset accumulation needs
Strengthen sales capabilities and sales platform • Cultivate the market utilizing the life and
non-life cross-selling business model
• Amalgamate distribution channels
• Strengthen management support capabilities for agents who will become the core of growth
Increase customer convenience / operational streamlining • Further increase quality, convenience,
and efficiency of business processes
• Use new technology
Robust Growth through “Life Insurance Revolution to Protect One’s Living”Initiative 1
Domestic Life Insurance Business (Tokio Marine & Nichido Life)
Advancements in medical technology have precipitated the emergence of risks pertaining to post-hospitalization treatment, the inability to work, and nursing care. Turning our attention to such areas not covered by conventional life insurance, we took action before our peers by launching initiatives under the “Life Insurance Revolution to Protect One’s Living” in 2012 to address previously untapped areas. The strong customer support earned through these initiatives has contributed to growth rates, which has resulted in Tokio Marine achieving growth at an industry-leading speed.
Maintaining long-term financial soundness is crucial to life insurers because of the long duration of life insurance policies. Faced with persistently low interest rates, we have been expanding new business margins by shifting our portfolio from savings-type products to protection-type products, which place lower interest rate burdens on the Company, to control interest rate risks and increase the new business margin. Going forward, we will keep focusing on protection-type products in order to appropriately control interest rate risks and achieve steady profit growth even in the face of low interest rates.
Life insurance companies are rapidly entering into the protection-type product field amid continually low interest rate levels. Nevertheless, as a frontier of this field, we continue to achieve steady growth in policy numbers by launching innovative products to provide support for customers in their times of need.
Launch of Innovative ProductsInitiative 2
Appropriate Control of Interest Rate RisksInitiative 3
In regard to top-line performance, despite the decrease due to sales suspension of products for corporate clients, we will continue to promote sales of protection-type products and installment variable annuities (market link). Bottom-line performance improved due to such factors as a decrease in the
decline of yen interest rates. In fiscal 2020, we expect to increase profits (excluding the impacts of COVID-19) through reversal effects from smaller profits in fiscal 2019 due to lower interest rates and increase in new policies.
Product Line Responding to the Social Issues of Extending Healthy LifeExpectancy and Asset Life Expectancy
Living Protection Asset Accumulation
・ Household Income TermInsurance NEO(Disability Plan) Plus
・ Market Link
Industry-leading sales record More than 150% YoY growth
・ Medical Kit R・ Cancer Insurance R
More than 1 million policiessold in 5 years from launch
Support the untapped areas not covered by
conventional medical and life insurance products
Contribute to “health incentive” by increasing
future refunds by maintaining health
Support asset accumulation with long-term diversified
investment using life insurance
*2. New policies annualized premiums basis, excluding business insurance*3. Value of new business / Present value of new business premiums*4. Source: Bloomberg
Composition of Protection-Type Products*2 andNew Business Margin*3
Composition ofprotection-type
products inproducts
for individuals
New businessmargin
JGB 30Y*4
(average)
Keep focusingon protection-type products
4% OtherMarket link(installment variable annuities)
2015 2019October 2016Sales suspension of long-term saving-type products
1.28% 0.40%
4.5% 6.3%
57%43%
73%
23%
*6. Figures for fiscal 2017 through fiscal 2019 are after payment of shareholders’ dividends; figure for fiscal 2020 is before payment of shareholders’ dividends.*7. Figures are before payment of shareholders’ dividends
1,248.71,076.0 990.5 1,057.0102.1
74.6
40.5 43.0
2020(Normalized)
201920182017
(Billions of yen) (Billions of yen)
1,248.7
99.0
78.0
1,076.0
-158.6
78.3
990.5
-70.3
62.8
1,057.0
66.0
75.0Of which, new businessvalue and existing business contribution
Business unit profits*7
Year-end MCEV*6
In-force policies annualized premiums
New policies annualizedpremiums
New Policies AnnualizedPremiums
Business UnitProfits
2020(Normalized)
201920182017
102.1
852.7
74.6
857.7
40.5
837.2
43.0
809.0
*1. Total of Tokio Marine & Nichido Life and former Tokio Marine & Nichido Financial Life
Number of In-Force Policies (Individual Insurance + Individual Annuities)
Growth at an industry-leading
speed
(Ten-thousands of policies)
CAGR sincefounding*1
(1996–2019)
+20.6%
1996 2000 2019
8
597Of these, the number of protection-type products

Tokio Marine Holdings, Inc. | Integrated Annual Report 2020
9796
Part 4 | O
peratio
ns S
ection
Points of the Mid-Term Business Plan (2018–2020) and Main Initiatives
Mid-Term Business Plan
Market Environment (Major Opportunities and Risks)
• Stable growth in the U.S. and other developed countries• Economic growth and growth of the middle class in
emerging countries, primarily Asia• Hardening insurance market (increase in rates)
focused on North America
Opportunities Risks
• More widespread damages as a result of increasing scale of natural disasters
• Global economic uncertainty due to factors such as U.S.-China trade dispute
• Social inflation (rising cost of insurance claims) in the U.S.
We will strengthen integrated group management and take steps to pursue both sustainable organic growth and strategic M&A. In this way, we will be the driver of risk diversification and sustainable profit growth for the Group.
International Insurance Business
Maximize Group’s collective strength through integrated Group management
Sustainable organic growth
• Achieve sustainable growth by companies with robust business models while also leveraging new technologies
Strategic M&A (see page 48)
• Achieve balanced growth by diversifying risks and incorporating growth in both developed markets and emerging markets
Organic Growth Strategies in Developed CountriesInitiative 1
Tokio Marine Group has earned a top 10 position*1 in commercial lines in the United States and showed presence as a top-class player in the specialty insurance market. By building a robust specialty insurance business platform in developed countries, we are achieving rapid growth that outperforms the market, coupled with high profitability while remaining relatively unaffected by market fluctuations. Going forward, we will look to sustain this rapid growth in developed countries by further honing the strengths of Group companies and conducting bolt-on M&A.
About 80% of Tokio Marine Group’s overseas profits are generated in the United States. The drivers behind these profits are the three acquired North American companies. We practice a disciplined approach toward M&A, based on the three acquisition principles of culture fit, high profitability, and strong business models. Since joining the Group, all three acquired companies have been achieving growth that outperforms the market. We will aim for further profit growth with the participation of the PURE Group, the acquisition of which was completed in February 2020.
Organic Growth Strategies in Emerging CountriesInitiative 2
Tokio Marine Group is also developing a wide range of businesses in emerging countries with a focus on those countries with large markets projected to experience significant growth. In fiscal 2019, we announced the establishment of a joint venture in Brazil with Caixa Bank, which has an approximately 70% share of the mortgage market there
(scheduled to commence operations in February 2021). Meanwhile, we completed integration of existing subsidiaries with Safety Insurance in Thailand that was acquired in August 2018. Looking ahead, we plan to continue capitalizing on the strong growth of the emerging countries to achieve ongoing growth.
Mid-Term Business Plan 2020 Targets and Progress
*4. CAGR is calculated based on the figure of ¥1,648.0 billion, adjusting fiscal 2017 performance based on foreign exchange rates on March 31, 2018.*5. CAGR is calculated based on a normalized basis of ¥145.0 billion in fiscal 2017.
Adjustments for producing a normalized basis included lowering natural disasters to a normal level and excluding the impacts of foreign exchange rate fluctuations and the one-time effect of the tax reforms in the United States.
2020 TargetsNet Premiums WrittenCAGR approx. +5%*4
Business Unit ProfitsCAGR approx. +11%*5
Despite the negative impact of the reinsurance businesses divestment as part of business portfolio revisions in March 2019, we worked to compensate for this negative impact to achieve profit growth. A
decline in profits is anticipated in 2020 (excluding the impacts of COVID-19) due to the further rise of the yen, however, increased profits are anticipated on a local-currency basis that excludes this impact.
144.1176.2 179.5 177.01,741.0 1,766.3 1,741.6 1,694.0
2020(Normalized)
201920182017
160.2 163.2 179.5 177.0
Dec. 31, 2017¥113.0
Dec. 31, 2018¥110.0
Dec. 31, 2019¥109.5
Mar. 31, 2020¥108.8
Dec. 31, 2017¥113.0
Dec. 31, 2018¥110.0
Dec. 31, 2019¥109.5
Mar. 31, 2020¥108.8
1,594.8 1,636.6 1,741.6 1,694.0(Reference) Excluding reinsurance business
Applied FX rate(USD/JPY)
(Reference) Excluding reinsurance business
Applied FX rate(USD/JPY)
Net PremiumsWritten
Business UnitProfits
2020(Normalized)
201920182017
(Billions of yen)(Billions of yen)*1. The U.S. commercial P&C direct premiums written in fiscal 2019 (Source: S&P Global)
*2. Annual after-tax profit on a local accounting basis. For 2017, the one-time impact of U.S. tax reforms was excluded.*3. Source: S&P Global
Top-class player in U.S. specialty insurance
High profit growth and profitability exceedingthe U.S. market
<Bottom line*2>2015–2019 CAGR
6.6%vs. Market*3 +4.7 pt
<Combined ratio>2015–2019 Average
95.5%vs. Market*3 4.0 pt. Favorable
Focus in niche markets,such as NPOs, etc.
Strength in employeebenefit, etc.
Specialized in HNWinsurance market
Mainly providesspecialty products
Profit: Business unit profitsSource of M/S:Note: The percentage in parenthesis to the right of each company name represents TMHD’s shareholding ratio as of Dec. 2019. The figures in the circle are P&C insurance premiums in each country for FY2018 (estimate). The size of the circle indicates market size. (Source: Swiss Re Institute)
Our Major P&C Business Network in Emerging Countries
M/S
PT Asuransi Tokio Marine Indonesia (60.0%)
Indonesia
Profit2018 2019
M/S
Hollard Holdings (22.5%)
South Africa
Profit2018
(New consolidation)
2019
¥1.3 billion
No. 2 (10%)M/S
IFFCO-TOKIO General Insurance (49.0%)
India
Profit2018
1.22019
No. 9 (4%)M/S
Tokio Marine (Thailand) (99.95%)Safety Insurance (98.6%)
Thailand
Profit2018 2019
Malayan Insurance (19.4%)
Philippines
Profit2018 2019
M/S
Tokio Marine Seguradora(97.8%)
Brazil
Profit2018 2019
M/S
Tokio Marine Insurans(Malaysia) (100%)
Malaysia
Profit2018 2019
M/S
¥1.3 billion 20No. 1 (12%)
¥10 million 9.1No. 6 (5%)
¥10.8 billion2.0 ¥4.7 billion
2.3No. 7 (5%)
¥2.8 billion 0.4No. 14 (2%)
¥0.5 billion
No. 3 (8%)M/S
¥2.9 trillion
¥3.7trillion
¥1.1trillion
¥0.9trillion
¥0.6trillion ¥0.5
trillion
¥0.2trillion
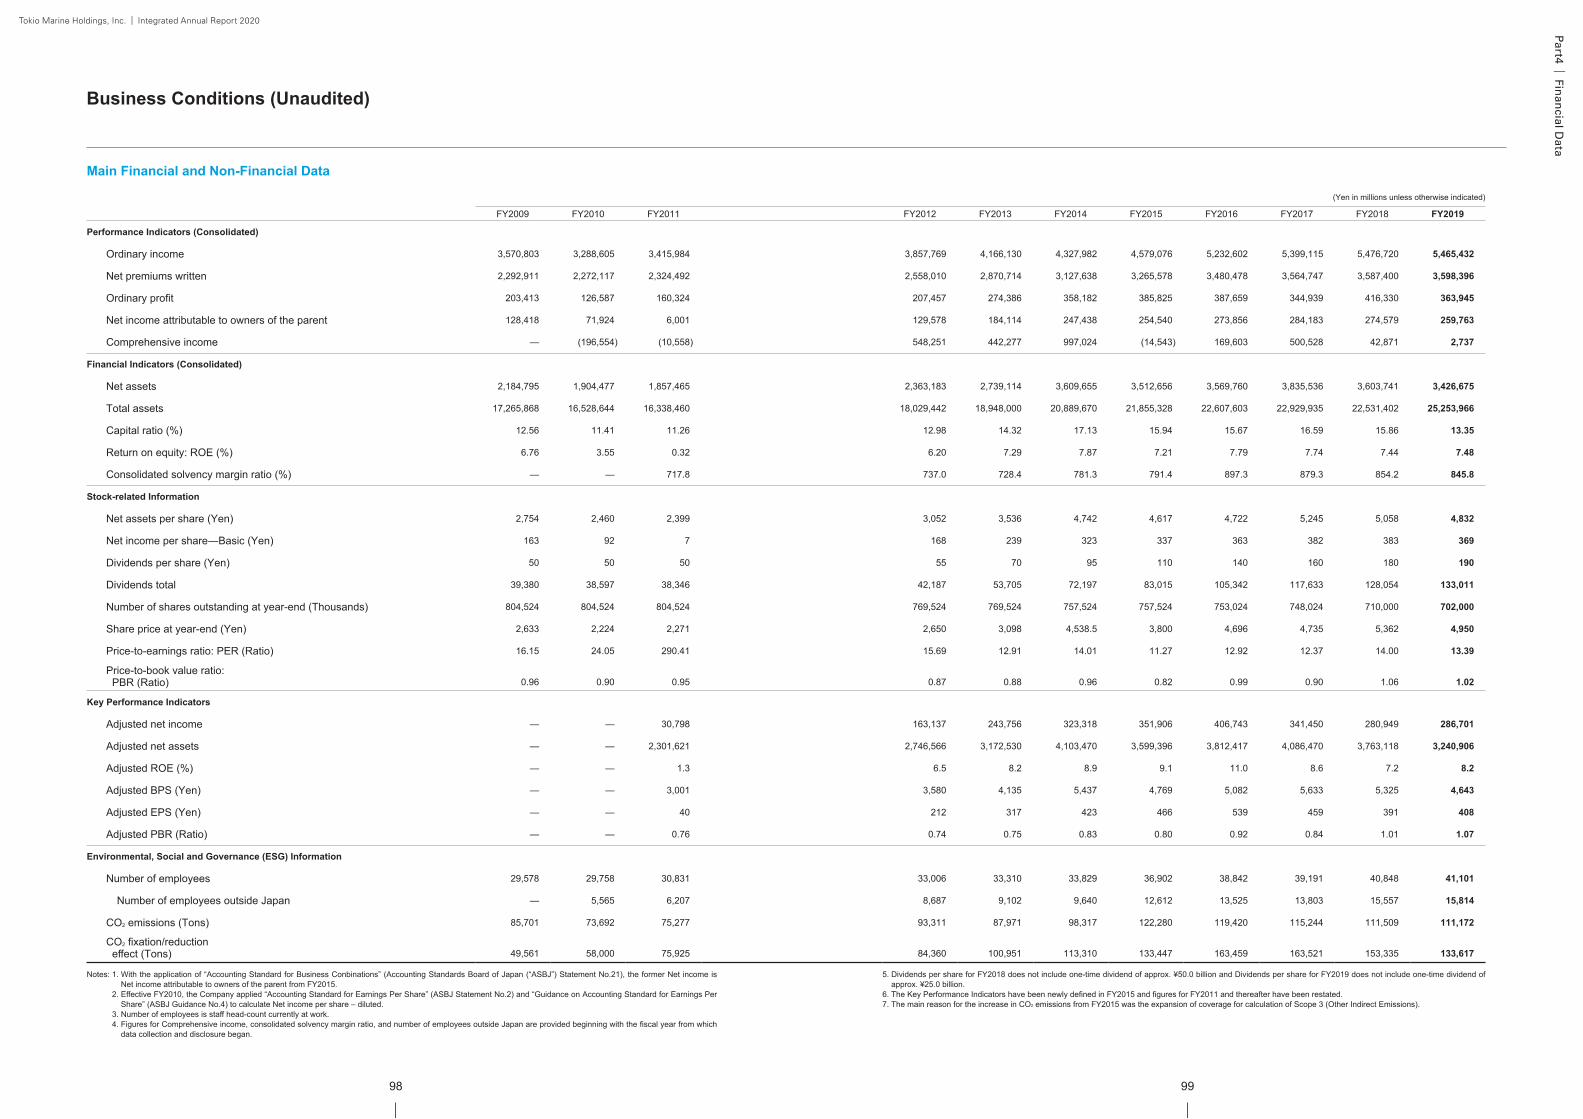
Main Financial and Non-Financial Data
FY2009 FY2010 FY2011 FY2012 FY2013 FY2014 FY2015 FY2016 FY2017 FY2018 FY2019
Performance Indicators (Consolidated)
Ordinary income 3,570,803 3,288,605 3,415,984 3,857,769 4,166,130 4,327,982 4,579,076 5,232,602 5,399,115 5,476,720 5,465,432
Net premiums written 2,292,911 2,272,117 2,324,492 2,558,010 2,870,714 3,127,638 3,265,578 3,480,478 3,564,747 3,587,400 3,598,396
Ordinary profit 203,413 126,587 160,324 207,457 274,386 358,182 385,825 387,659 344,939 416,330 363,945
Net income attributable to owners of the parent 128,418 71,924 6,001 129,578 184,114 247,438 254,540 273,856 284,183 274,579 259,763
Comprehensive income — (196,554) (10,558) 548,251 442,277 997,024 (14,543) 169,603 500,528 42,871 2,737
Financial Indicators (Consolidated)
Net assets 2,184,795 1,904,477 1,857,465 2,363,183 2,739,114 3,609,655 3,512,656 3,569,760 3,835,536 3,603,741 3,426,675
Total assets 17,265,868 16,528,644 16,338,460 18,029,442 18,948,000 20,889,670 21,855,328 22,607,603 22,929,935 22,531,402 25,253,966
Capital ratio (%) 12.56 11.41 11.26 12.98 14.32 17.13 15.94 15.67 16.59 15.86 13.35
Return on equity: ROE (%) 6.76 3.55 0.32 6.20 7.29 7.87 7.21 7.79 7.74 7.44 7.48
Consolidated solvency margin ratio (%) — — 717.8 737.0 728.4 781.3 791.4 897.3 879.3 854.2 845.8
Stock-related Information
Net assets per share (Yen) 2,754 2,460 2,399 3,052 3,536 4,742 4,617 4,722 5,245 5,058 4,832
Net income per share―Basic (Yen) 163 92 7 168 239 323 337 363 382 383 369
Dividends per share (Yen) 50 50 50 55 70 95 110 140 160 180 190
Dividends total 39,380 38,597 38,346 42,187 53,705 72,197 83,015 105,342 117,633 128,054 133,011
Number of shares outstanding at year-end (Thousands) 804,524 804,524 804,524 769,524 769,524 757,524 757,524 753,024 748,024 710,000 702,000
Share price at year-end (Yen) 2,633 2,224 2,271 2,650 3,098 4,538.5 3,800 4,696 4,735 5,362 4,950
Price-to-earnings ratio: PER (Ratio) 16.15 24.05 290.41 15.69 12.91 14.01 11.27 12.92 12.37 14.00 13.39
Price-to-book value ratio: PBR (Ratio) 0.96 0.90 0.95 0.87 0.88 0.96 0.82 0.99 0.90 1.06 1.02
Key Performance Indicators
Adjusted net income — — 30,798 163,137 243,756 323,318 351,906 406,743 341,450 280,949 286,701
Adjusted net assets — — 2,301,621 2,746,566 3,172,530 4,103,470 3,599,396 3,812,417 4,086,470 3,763,118 3,240,906
Adjusted ROE (%) — — 1.3 6.5 8.2 8.9 9.1 11.0 8.6 7.2 8.2
Adjusted BPS (Yen) — — 3,001 3,580 4,135 5,437 4,769 5,082 5,633 5,325 4,643
Adjusted EPS (Yen) — — 40 212 317 423 466 539 459 391 408
Adjusted PBR (Ratio) — — 0.76 0.74 0.75 0.83 0.80 0.92 0.84 1.01 1.07
Environmental, Social and Governance (ESG) Information
Number of employees 29,578 29,758 30,831 33,006 33,310 33,829 36,902 38,842 39,191 40,848 41,101
Number of employees outside Japan — 5,565 6,207 8,687 9,102 9,640 12,612 13,525 13,803 15,557 15,814
CO2 emissions (Tons) 85,701 73,692 75,277 93,311 87,971 98,317 122,280 119,420 115,244 111,509 111,172
CO2 fixation/reductioneffect (Tons) 49,561 58,000 75,925 84,360 100,951 113,310 133,447 163,459 163,521 153,335 133,617
Notes: 1. With the application of “Accounting Standard for Business Conbinations” (Accounting Standards Board of Japan (“ASBJ”) Statement No.21), the former Net income is Net income attributable to owners of the parent from FY2015.
2. Effective FY2010, the Company applied “Accounting Standard for Earnings Per Share” (ASBJ Statement No.2) and “Guidance on Accounting Standard for Earnings Per Share” (ASBJ Guidance No.4) to calculate Net income per share ‒ diluted.
3. Number of employees is staff head-count currently at work.4. Figures for Comprehensive income, consolidated solvency margin ratio, and number of employees outside Japan are provided beginning with the fiscal year from which
data collection and disclosure began.
Business Conditions (Unaudited)
Tokio Marine Holdings, Inc. | Integrated Annual Report 2020
2020/09/17 18:08:12 / 20654695_東京海上ホールディングス株式会社_総会その他(C)
98
Mid-Term Business Plan Initiatives
FY2009 FY2010 FY2011 FY2012 FY2013 FY2014 FY2015 FY2016 FY2017 FY2018 FY2019
Performance Indicators (Consolidated)
Ordinary income 3,570,803 3,288,605 3,415,984 3,857,769 4,166,130 4,327,982 4,579,076 5,232,602 5,399,115 5,476,720 5,465,432
Net premiums written 2,292,911 2,272,117 2,324,492 2,558,010 2,870,714 3,127,638 3,265,578 3,480,478 3,564,747 3,587,400 3,598,396
Ordinary profit 203,413 126,587 160,324 207,457 274,386 358,182 385,825 387,659 344,939 416,330 363,945
Net income attributable to owners of the parent 128,418 71,924 6,001 129,578 184,114 247,438 254,540 273,856 284,183 274,579 259,763
Comprehensive income — (196,554) (10,558) 548,251 442,277 997,024 (14,543) 169,603 500,528 42,871 2,737
Financial Indicators (Consolidated)
Net assets 2,184,795 1,904,477 1,857,465 2,363,183 2,739,114 3,609,655 3,512,656 3,569,760 3,835,536 3,603,741 3,426,675
Total assets 17,265,868 16,528,644 16,338,460 18,029,442 18,948,000 20,889,670 21,855,328 22,607,603 22,929,935 22,531,402 25,253,966
Capital ratio (%) 12.56 11.41 11.26 12.98 14.32 17.13 15.94 15.67 16.59 15.86 13.35
Return on equity: ROE (%) 6.76 3.55 0.32 6.20 7.29 7.87 7.21 7.79 7.74 7.44 7.48
Consolidated solvency margin ratio (%) — — 717.8 737.0 728.4 781.3 791.4 897.3 879.3 854.2 845.8
Stock-related Information
Net assets per share (Yen) 2,754 2,460 2,399 3,052 3,536 4,742 4,617 4,722 5,245 5,058 4,832
Net income per share―Basic (Yen) 163 92 7 168 239 323 337 363 382 383 369
Dividends per share (Yen) 50 50 50 55 70 95 110 140 160 180 190
Dividends total 39,380 38,597 38,346 42,187 53,705 72,197 83,015 105,342 117,633 128,054 133,011
Number of shares outstanding at year-end (Thousands) 804,524 804,524 804,524 769,524 769,524 757,524 757,524 753,024 748,024 710,000 702,000
Share price at year-end (Yen) 2,633 2,224 2,271 2,650 3,098 4,538.5 3,800 4,696 4,735 5,362 4,950
Price-to-earnings ratio: PER (Ratio) 16.15 24.05 290.41 15.69 12.91 14.01 11.27 12.92 12.37 14.00 13.39
Price-to-book value ratio: PBR (Ratio) 0.96 0.90 0.95 0.87 0.88 0.96 0.82 0.99 0.90 1.06 1.02
Key Performance Indicators
Adjusted net income — — 30,798 163,137 243,756 323,318 351,906 406,743 341,450 280,949 286,701
Adjusted net assets — — 2,301,621 2,746,566 3,172,530 4,103,470 3,599,396 3,812,417 4,086,470 3,763,118 3,240,906
Adjusted ROE (%) — — 1.3 6.5 8.2 8.9 9.1 11.0 8.6 7.2 8.2
Adjusted BPS (Yen) — — 3,001 3,580 4,135 5,437 4,769 5,082 5,633 5,325 4,643
Adjusted EPS (Yen) — — 40 212 317 423 466 539 459 391 408
Adjusted PBR (Ratio) — — 0.76 0.74 0.75 0.83 0.80 0.92 0.84 1.01 1.07
Environmental, Social and Governance (ESG) Information
Number of employees 29,578 29,758 30,831 33,006 33,310 33,829 36,902 38,842 39,191 40,848 41,101
Number of employees outside Japan — 5,565 6,207 8,687 9,102 9,640 12,612 13,525 13,803 15,557 15,814
CO2 emissions (Tons) 85,701 73,692 75,277 93,311 87,971 98,317 122,280 119,420 115,244 111,509 111,172
CO2 fixation/reductioneffect (Tons) 49,561 58,000 75,925 84,360 100,951 113,310 133,447 163,459 163,521 153,335 133,617
(Yen in millions unless otherwise indicated)
5. Dividends per share for FY2018 does not include one-time dividend of approx. ¥50.0 billion and Dividends per share for FY2019 does not include one-time dividend of approx. ¥25.0 billion.
6. The Key Performance Indicators have been newly defined in FY2015 and figures for FY2011 and thereafter have been restated.7. The main reason for the increase in CO2 emissions from FY2015 was the expansion of coverage for calculation of Scope 3 (Other Indirect Emissions).
Part4 | Fin
ancial D
ata
2020/09/17 18:08:12 / 20654695_東京海上ホールディングス株式会社_総会その他(C)
99
Mid-Term Business Plan Initiatives

Business Conditions (Unaudited)
Tokio Marine Holdings, Inc. | Integrated Annual Report 2020
2020/09/17 18:08:12 / 20654695_東京海上ホールディングス株式会社_総会その他(C)
Adjusted Net Income, Adjusted Net Assets, and Adjusted ROE
Tokio Marine Group has set adjusted net income, adjusted net assets, and adjusted ROE, as defined below, as indicators for its management plans and shareholder return to enhance transparency and comparability as well as ensure linkage with shareholder return. These are indicators that clarify profit or loss attributable to the reporting period, excluding the effect of various reserves specific to the Japanese insurance business as well as deducting special factors of the period such as gains or losses on sales or valuation of assets, etc. (Below are figures for FY2019.)
Adjusted Net Income1
¥286.7 billion ¥259.7 billion ¥(49.7) billion ¥0.8 billion ¥6.9 billion ¥12.5 billion
¥77.7 billion ¥(8.5) billion ¥4.8 billion
Adjusted Net Assets1
¥3,240.9 billion ¥3,372.1 billion ¥691.5 billion ¥41.6 billion ¥85.1 billion ¥949.5 billion
Adjusted ROE
Adjusted ROE
8.2% ¥286.7 billion ¥3,502.0 billion
Net income(consolidated)2
Adjustednet income
Provision forcatastrophe loss
reserves3
Provision forcontingency
reserves3
Provision forprice fluctuation
reserves3
Gains or losses onsales or valuation of
ALM4 bonds andinterest rate swaps
Amortization ofgoodwill and
other intangiblefixed assets
Gains or losses onsales or valuationof fixed assets and
business invest-ment equities
Other extraordinarygains/losses,
valuationallowances, etc.
Adjustednet assets
Net assets(consolidated)
Catastropheloss reserves
Contingencyreserves
Price fluctuationreserves
Goodwill andother intangible
fixed assets
Adjustednet income
Adjustednet assets5
1 Each adjustment is on an after-tax basis2 Net income attributable to owners of the parent3 In case of reversal, it is subtracted from the equation4 ALM: Asset Liability Management. Excluded since it is counterbalance of ALM-related liabilities5 Average balance basis
Business Unit ProfitsFrom the perspective of accurately assessing corporate value including economic value, etc., and expanding it in the long-term, business unit profits are defined as below.Non-Life Insurance Business
Life Insurance Business4
Other Businesses
Businessunit
profits1
Netincome
Provision forcatastrophe
loss reserves2
Provisionfor price
fluctuationreserves2
Gains or losseson sales orvaluation of
ALM3 bonds andinterest rate
swaps
Gains or losses onsales or valuation of
fixed assets, business-related equitiesand business
investment equities
Otherextraordinarygains/losses,
valuationallowances, etc.
Businessunit
profits1
Increase in EV5
during thecurrent fiscal year
Capitaltransactions
such ascapital increase
Net income determined inaccordance with financial
accounting principles
1 Each adjustment is on an after-tax basis2 In case of reversal, it is subtracted from the equation3 ALM: Asset Liability Management. Excluded since it is counterbalance of ALM-related liabilities4 For some of the life insurance companies, Business Unit Profit is calculated by using the definition in other businesses (head office expenses, etc., are deducted from profits)5 EV: Embedded Value. An index that shows the sum of the net present value of profits to be gained from policies in-force and the net asset value
100
Adjusted Net Income, Adjusted Net Assets, and Adjusted ROE
Part4 | Fin
ancial D
ata
2020/09/17 18:08:12 / 20654695_東京海上ホールディングス株式会社_総会その他(C)
Overview of Business Results (Unaudited)1. Consolidated Results of OperationsDuring the fiscal year 2019, despite some positive signs such as a lull in trade frictions between the U.S. and China in the second half, the world economy slowed dramatically towards the end of the fiscal year due to the global spread of coronavirus disease 2019 (COVID-19), and financial and capital markets became increasingly unstable. In Japan, the economy experienced a significant downturn due to the spread of COVID-19, in addition to weak foreign demand and natural disasters. Under these circumstances, as a result of our efforts to expand our business, which is centered on non-life insurance and life insurance, our consolidated results of operations for the fiscal year 2019 were as follows: Ordinary income decreased by 11.2 billion yen to 5,465.4 billion yen from the previous fiscal year, the main components of which were Underwriting income of 4,701.9 billion yen and Investment income of 642.2 billion yen. Ordinary expenses increased by 41.0 billion yen to 5,101.4 billion yen from the previous fiscal year, the main components of which were Underwriting expenses of 4,096.2 billion yen, Investment expenses of 82.9 billion yen, and Operating and general administrative expenses of 892.7 billion yen. As a result, Ordinary profit decreased by 52.3 billion yen to 363.9 billion yen from the previous fiscal year. Net income attributable to owners of the parent, composed of Ordinary profit plus Extraordinary gains minus Extraordinary losses and Total income taxes, decreased by 14.8 billion yen to 259.7 billion yen from the previous fiscal year.
Domestic Non-Life Insurance (Unaudited)In the Domestic non-life insurance business, Ordinary income decreased by 64.6 billion yen to 2,782.5 billion yen from the previous fiscal year. Ordinary profit decreased by 48.7 billion yen to 179.5 billion yen from the previous fiscal year.Figures pertaining to insurance underwriting and investment in the Domestic non-life insurance business are as follows.
UnderwritingDirect premiums written (including deposit premiums from policyholders)
(Yen in millions)
FY2019(April 1, 2019 to March 31, 2020)
FY2018(April 1, 2018 to March 31, 2019)
Amount Composition ratio(%)
Rate of change(%) Amount Composition ratio
(%)Rate of change
(%)
Fire and allied lines 466,568 16.88 11.93 416,848 15.57 6.96Hull and cargo 71,519 2.59 5.70 67,663 2.53 3.37Personal accident 265,036 9.59 2.36 258,922 9.67 (2.79)Voluntary automobile 1,200,041 43.42 1.29 1,184,723 44.26 0.36Compulsory automobile liability 281,885 10.20 (0.43) 283,097 10.58 0.40Others 478,778 17.32 2.85 465,531 17.39 2.52Total 2,763,830 100.00 3.25 2,676,786 100.00 1.47
Deposit premiums frompolicyholders 77,041 2.79 (4.41) 80,592 3.01 (14.04)
Note: 1. Figures are amounts before the elimination of internal transactions with other operating segments.2. Direct premiums written including deposit premiums from policyholders = Gross premiums written - Surrender benefits of direct policies - Other refunds of direct policies (including
deposit premiums from policyholders)
101
Overview of Business Results (Unaudited)、Domestic Non-Life Insurance (Unaudited)
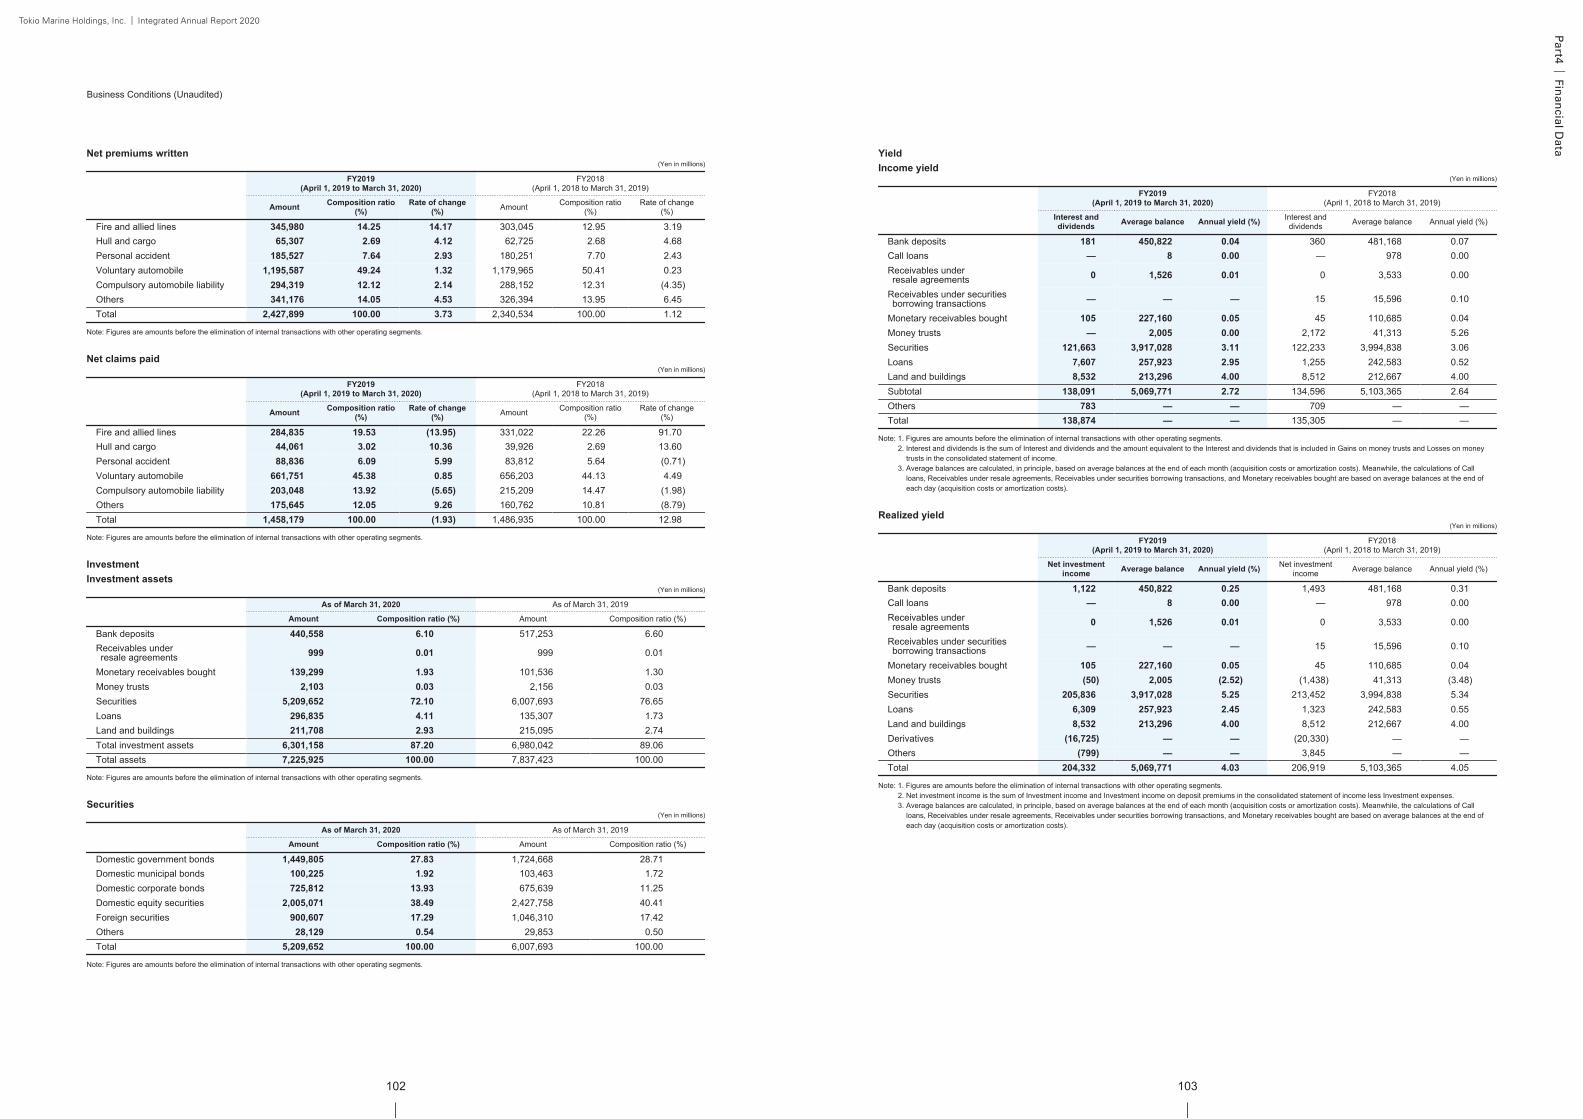
Business Conditions (Unaudited)
Tokio Marine Holdings, Inc. | Integrated Annual Report 2020
2020/09/17 18:08:12 / 20654695_東京海上ホールディングス株式会社_総会その他(C)
Net premiums written(Yen in millions)
FY2019(April 1, 2019 to March 31, 2020)
FY2018(April 1, 2018 to March 31, 2019)
Amount Composition ratio(%)
Rate of change(%) Amount Composition ratio
(%)Rate of change
(%)
Fire and allied lines 345,980 14.25 14.17 303,045 12.95 3.19Hull and cargo 65,307 2.69 4.12 62,725 2.68 4.68Personal accident 185,527 7.64 2.93 180,251 7.70 2.43Voluntary automobile 1,195,587 49.24 1.32 1,179,965 50.41 0.23Compulsory automobile liability 294,319 12.12 2.14 288,152 12.31 (4.35)Others 341,176 14.05 4.53 326,394 13.95 6.45Total 2,427,899 100.00 3.73 2,340,534 100.00 1.12
Note: Figures are amounts before the elimination of internal transactions with other operating segments.
Net claims paid(Yen in millions)
FY2019(April 1, 2019 to March 31, 2020)
FY2018(April 1, 2018 to March 31, 2019)
Amount Composition ratio(%)
Rate of change(%) Amount Composition ratio
(%)Rate of change
(%)
Fire and allied lines 284,835 19.53 (13.95) 331,022 22.26 91.70Hull and cargo 44,061 3.02 10.36 39,926 2.69 13.60Personal accident 88,836 6.09 5.99 83,812 5.64 (0.71)Voluntary automobile 661,751 45.38 0.85 656,203 44.13 4.49Compulsory automobile liability 203,048 13.92 (5.65) 215,209 14.47 (1.98)Others 175,645 12.05 9.26 160,762 10.81 (8.79)Total 1,458,179 100.00 (1.93) 1,486,935 100.00 12.98
Note: Figures are amounts before the elimination of internal transactions with other operating segments.
InvestmentInvestment assets
(Yen in millions)
As of March 31, 2020 As of March 31, 2019
Amount Composition ratio (%) Amount Composition ratio (%)
Bank deposits 440,558 6.10 517,253 6.60Receivables underresale agreements 999 0.01 999 0.01
Monetary receivables bought 139,299 1.93 101,536 1.30Money trusts 2,103 0.03 2,156 0.03Securities 5,209,652 72.10 6,007,693 76.65Loans 296,835 4.11 135,307 1.73Land and buildings 211,708 2.93 215,095 2.74Total investment assets 6,301,158 87.20 6,980,042 89.06Total assets 7,225,925 100.00 7,837,423 100.00
Note: Figures are amounts before the elimination of internal transactions with other operating segments.
Securities(Yen in millions)
As of March 31, 2020 As of March 31, 2019
Amount Composition ratio (%) Amount Composition ratio (%)
Domestic government bonds 1,449,805 27.83 1,724,668 28.71Domestic municipal bonds 100,225 1.92 103,463 1.72Domestic corporate bonds 725,812 13.93 675,639 11.25Domestic equity securities 2,005,071 38.49 2,427,758 40.41Foreign securities 900,607 17.29 1,046,310 17.42Others 28,129 0.54 29,853 0.50Total 5,209,652 100.00 6,007,693 100.00
Note: Figures are amounts before the elimination of internal transactions with other operating segments.
102
Domestic Non-Life Insurance (Unaudited)
Part4 | Fin
ancial D
ata
2020/09/17 18:08:12 / 20654695_東京海上ホールディングス株式会社_総会その他(C)
YieldIncome yield
(Yen in millions)
FY2019(April 1, 2019 to March 31, 2020)
FY2018(April 1, 2018 to March 31, 2019)
Interest anddividends Average balance Annual yield (%) Interest and
dividends Average balance Annual yield (%)
Bank deposits 181 450,822 0.04 360 481,168 0.07Call loans — 8 0.00 — 978 0.00Receivables underresale agreements 0 1,526 0.01 0 3,533 0.00
Receivables under securitiesborrowing transactions — — — 15 15,596 0.10
Monetary receivables bought 105 227,160 0.05 45 110,685 0.04Money trusts — 2,005 0.00 2,172 41,313 5.26Securities 121,663 3,917,028 3.11 122,233 3,994,838 3.06Loans 7,607 257,923 2.95 1,255 242,583 0.52Land and buildings 8,532 213,296 4.00 8,512 212,667 4.00Subtotal 138,091 5,069,771 2.72 134,596 5,103,365 2.64Others 783 — — 709 — —Total 138,874 — — 135,305 — —
Note: 1. Figures are amounts before the elimination of internal transactions with other operating segments.2. Interest and dividends is the sum of Interest and dividends and the amount equivalent to the Interest and dividends that is included in Gains on money trusts and Losses on money
trusts in the consolidated statement of income.3. Average balances are calculated, in principle, based on average balances at the end of each month (acquisition costs or amortization costs). Meanwhile, the calculations of Call
loans, Receivables under resale agreements, Receivables under securities borrowing transactions, and Monetary receivables bought are based on average balances at the end of each day (acquisition costs or amortization costs).
Realized yield(Yen in millions)
FY2019(April 1, 2019 to March 31, 2020)
FY2018(April 1, 2018 to March 31, 2019)
Net investmentincome Average balance Annual yield (%) Net investment
income Average balance Annual yield (%)
Bank deposits 1,122 450,822 0.25 1,493 481,168 0.31Call loans — 8 0.00 — 978 0.00Receivables underresale agreements 0 1,526 0.01 0 3,533 0.00
Receivables under securitiesborrowing transactions — — — 15 15,596 0.10
Monetary receivables bought 105 227,160 0.05 45 110,685 0.04Money trusts (50) 2,005 (2.52) (1,438) 41,313 (3.48)Securities 205,836 3,917,028 5.25 213,452 3,994,838 5.34Loans 6,309 257,923 2.45 1,323 242,583 0.55Land and buildings 8,532 213,296 4.00 8,512 212,667 4.00Derivatives (16,725) — — (20,330) — —Others (799) — — 3,845 — —Total 204,332 5,069,771 4.03 206,919 5,103,365 4.05
Note: 1. Figures are amounts before the elimination of internal transactions with other operating segments.2. Net investment income is the sum of Investment income and Investment income on deposit premiums in the consolidated statement of income less Investment expenses.3. Average balances are calculated, in principle, based on average balances at the end of each month (acquisition costs or amortization costs). Meanwhile, the calculations of Call
loans, Receivables under resale agreements, Receivables under securities borrowing transactions, and Monetary receivables bought are based on average balances at the end of each day (acquisition costs or amortization costs).
103
Domestic Non-Life Insurance (Unaudited)

Business Conditions (Unaudited)
Tokio Marine Holdings, Inc. | Integrated Annual Report 2020
2020/09/17 18:08:12 / 20654695_東京海上ホールディングス株式会社_総会その他(C)
Domestic Life Insurance (Unaudited)In the Domestic life insurance business, Ordinary income decreased by 31.2 billion yen to 748.1 billion yen from the previous fiscal year. Ordinary profit increased by 11.5 billion yen to 51.8 billion yen from the previous fiscal year. Figures pertaining to insurance underwriting and investment in the Domestic life insurance business are as follows.
UnderwritingTotal amount of business in force
(Yen in millions)
As of March 31, 2020 As of March 31, 2019
Total Rate of change (%) Total Rate of change (%)
Individual insurance 29,334,366 (0.77) 29,561,288 3.71Individual annuities 2,146,807 (6.00) 2,283,755 (8.09)Group insurance 2,195,007 (3.13) 2,266,042 (4.91)Group annuities 3,161 (1.36) 3,205 (1.40)
Note: 1. Figures are amounts before the elimination of internal transactions with other operating segments.2. Amounts of individual annuities represent the sums of funds to be held at the time annuity payments are to commence for an annuity for which payment has not yet commenced, and
the amount of underwriting reserves for an annuity for which payments have commenced.3. Amounts of group annuities represent amounts of underwriting reserves.
Total amount of new business(Yen in millions)
FY2019(April 1, 2019 to March 31, 2020)
FY2018(April 1, 2018 to March 31, 2019)
New business +Net increase on
conversionNew business Net increase on
conversion
New business +Net increase on
conversionNew business Net increase on
conversion
Individual insurance 2,144,067 2,144,067 — 3,415,408 3,415,408 —Individual annuities — — — — — —Group insurance 14,379 14,379 — 7,017 7,017 —Group annuities — — — — — —
Note: 1. Figures are amounts before the elimination of internal transactions with other operating segments.2. Amounts of individual annuities under new business represent the sums of annuity funds at the beginning of the annuity payment.3. Amounts of group annuities under new business represent the first installment of premium payments.
InvestmentInvestment assets
(Yen in millions)
As of March 31, 2020 As of March 31, 2019
Amount Composition ratio (%) Amount Composition ratio (%)
Bank deposits 119,220 1.30 73,472 0.99Receivables under securitiesborrowing transactions 4,612 0.05 9,084 0.12
Monetary receivables bought — — 138,998 1.88Securities 8,728,238 94.86 6,934,724 93.89Loans 205,021 2.23 96,219 1.30Land and buildings 421 0.00 470 0.01Total investment assets 9,057,514 98.44 7,252,969 98.20Total assets 9,200,998 100.00 7,385,957 100.00
Note: Figures are amounts before the elimination of internal transactions with other operating segments.
104
Domestic Life Insurance (Unaudited)
Part4 | Fin
ancial D
ata
2020/09/17 18:08:12 / 20654695_東京海上ホールディングス株式会社_総会その他(C)
Securities(Yen in millions)
As of March 31, 2020 As of March 31, 2019
Amount Composition ratio (%) Amount Composition ratio (%)
Domestic government bonds 7,823,712 89.64 6,112,210 88.14Domestic municipal bonds 47,843 0.55 25,348 0.37Domestic corporate bonds 414,668 4.75 243,058 3.50Domestic equity securities 176 0.00 166 0.00Foreign securities 340,334 3.90 434,898 6.27Others 101,503 1.16 119,042 1.72Total 8,728,238 100.00 6,934,724 100.00
Note: Figures are amounts before the elimination of internal transactions with other operating segments.
YieldIncome yield
(Yen in millions)
FY2019(April 1, 2019 to March 31, 2020)
FY2018(April 1, 2018 to March 31, 2019)
Interest anddividends Average balance Annual yield (%) Interest and
dividends Average balance Annual yield (%)
Bank deposits 1 77,993 0.00 2 65,753 0.00Call loans — 0 0.00 — 1 0.00Receivables under securitiesborrowing transactions 0 3,183 0.02 2 14,207 0.02
Monetary receivables bought 4 48,132 0.01 14 150,650 0.01Securities 101,128 7,415,148 1.36 98,706 6,472,998 1.52Loans 8,066 188,713 4.27 2,696 93,050 2.90Land and buildings — 477 0.00 — 527 0.00Subtotal 109,201 7,733,650 1.41 101,421 6,797,189 1.49Others — — — — — —Total 109,201 — — 101,421 — —
Note: 1. Figures are amounts before the elimination of internal transactions with other operating segments and exclude investment gains and assets on separate accounts specified in Article 118 of the Insurance Business Act.
2. Interest and dividends represents Interest and dividends in the consolidated statement of income.3. Average balances are calculated, in principle, based on average balances at the end of each month (acquisition costs or amortization costs). Meanwhile, the calculations of Call
loans, Receivables under securities borrowing transactions, and Monetary receivables bought are based on average balances at the end of each day (acquisition costs or amortization costs).
Realized yield(Yen in millions)
FY2019(April 1, 2019 to March 31, 2020)
FY2018(April 1, 2018 to March 31, 2019)
Net investmentincome Average balance Annual yield (%) Net investment
income Average balance Annual yield (%)
Bank deposits (9) 77,993 (0.01) 58 65,753 0.09Call loans — 0 0.00 — 1 0.00Receivables under securitiesborrowing transactions 0 3,183 0.02 2 14,207 0.02
Monetary receivables bought 4 48,132 0.01 14 150,650 0.01Securities 101,924 7,415,148 1.37 87,957 6,472,998 1.36Loans 8,077 188,713 4.28 2,696 93,050 2.90Land and buildings — 477 0.00 — 527 0.00Derivatives (7,380) — — 87 — —Others — — — — — —Total 102,617 7,733,650 1.33 90,816 6,797,189 1.34
Note: 1. Figures are amounts before the elimination of internal transactions with other operating segments and exclude investment gains and assets on separate accounts specified in Article 118 of the Insurance Business Act.
2. Net investment income represents Investment income in the consolidated statement of income less Investment expenses.3. Average balances are calculated, in principle, based on average balances at the end of each month (acquisition costs or amortization costs). Meanwhile, the calculations of Call
loans, Receivables under securities borrowing transactions, and Monetary receivables bought are based on average balances at the end of each day (acquisition costs or amortization costs).
105
Domestic Life Insurance (Unaudited)
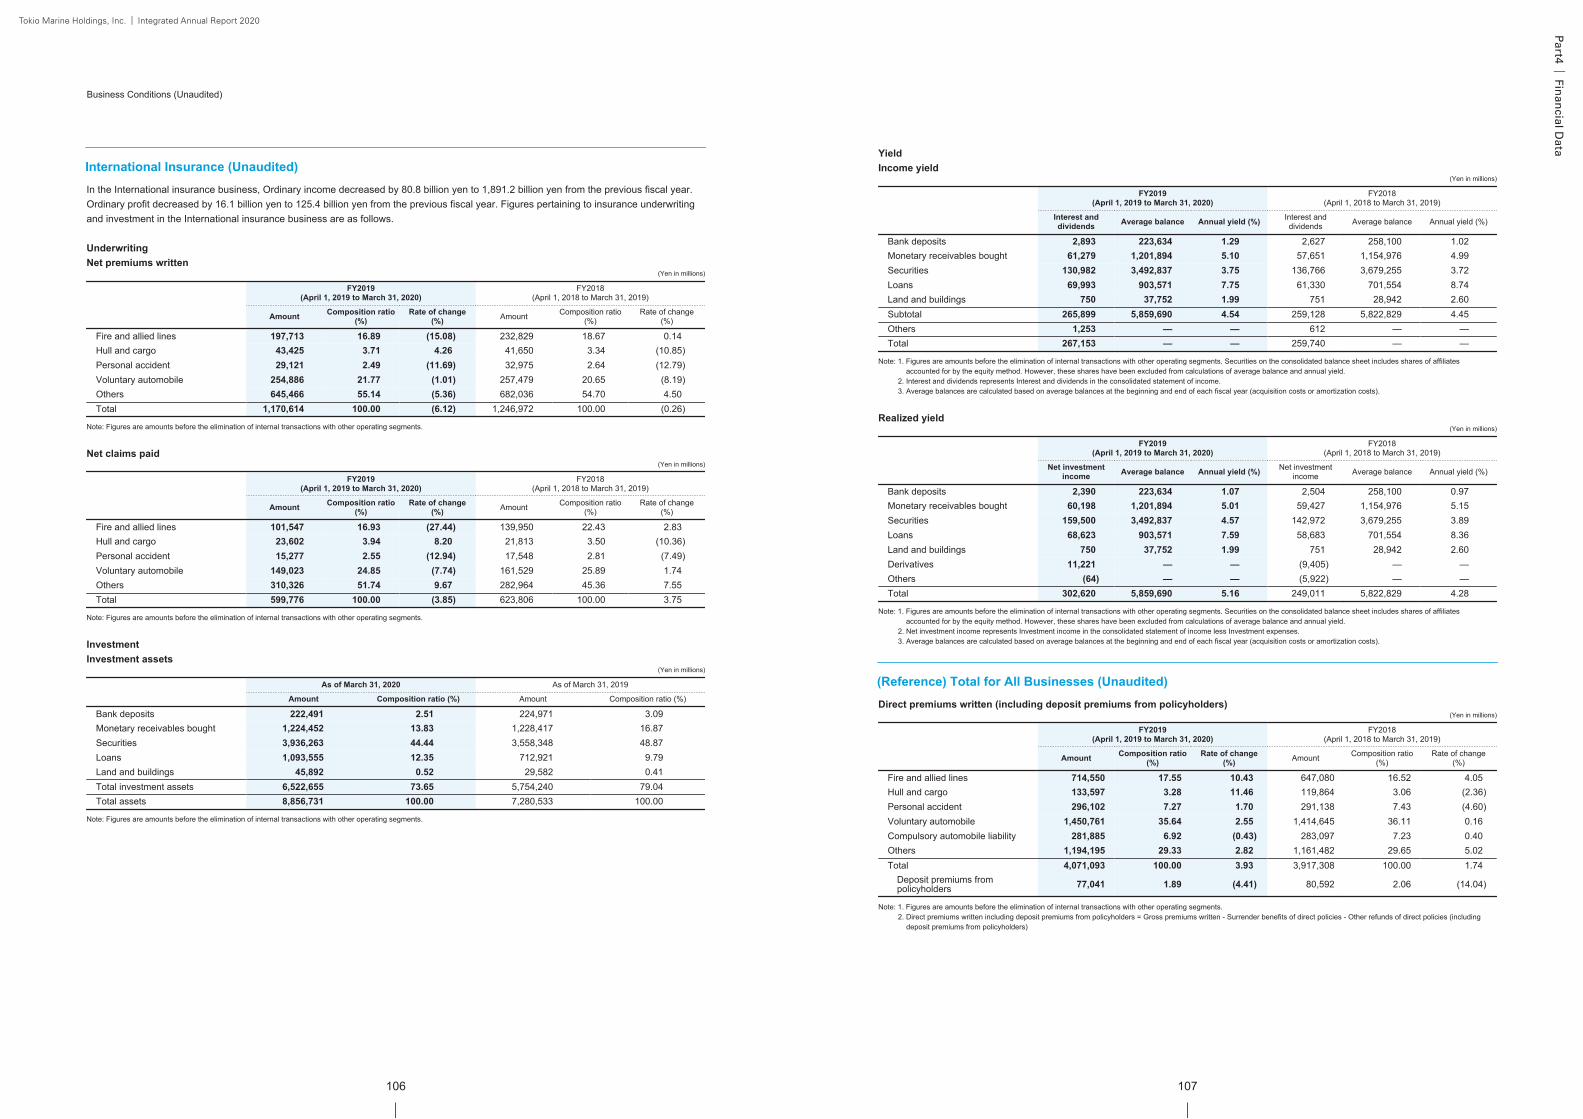
Business Conditions (Unaudited)
Tokio Marine Holdings, Inc. | Integrated Annual Report 2020
2020/09/17 18:08:12 / 20654695_東京海上ホールディングス株式会社_総会その他(C)
International Insurance (Unaudited)In the International insurance business, Ordinary income decreased by 80.8 billion yen to 1,891.2 billion yen from the previous fiscal year.Ordinary profit decreased by 16.1 billion yen to 125.4 billion yen from the previous fiscal year. Figures pertaining to insurance underwriting and investment in the International insurance business are as follows.
UnderwritingNet premiums written
(Yen in millions)
FY2019(April 1, 2019 to March 31, 2020)
FY2018(April 1, 2018 to March 31, 2019)
Amount Composition ratio(%)
Rate of change(%) Amount Composition ratio
(%)Rate of change
(%)
Fire and allied lines 197,713 16.89 (15.08) 232,829 18.67 0.14Hull and cargo 43,425 3.71 4.26 41,650 3.34 (10.85)Personal accident 29,121 2.49 (11.69) 32,975 2.64 (12.79)Voluntary automobile 254,886 21.77 (1.01) 257,479 20.65 (8.19)Others 645,466 55.14 (5.36) 682,036 54.70 4.50Total 1,170,614 100.00 (6.12) 1,246,972 100.00 (0.26)
Note: Figures are amounts before the elimination of internal transactions with other operating segments.
Net claims paid(Yen in millions)
FY2019(April 1, 2019 to March 31, 2020)
FY2018(April 1, 2018 to March 31, 2019)
Amount Composition ratio(%)
Rate of change(%) Amount Composition ratio
(%)Rate of change
(%)
Fire and allied lines 101,547 16.93 (27.44) 139,950 22.43 2.83Hull and cargo 23,602 3.94 8.20 21,813 3.50 (10.36)Personal accident 15,277 2.55 (12.94) 17,548 2.81 (7.49)Voluntary automobile 149,023 24.85 (7.74) 161,529 25.89 1.74Others 310,326 51.74 9.67 282,964 45.36 7.55Total 599,776 100.00 (3.85) 623,806 100.00 3.75
Note: Figures are amounts before the elimination of internal transactions with other operating segments.
InvestmentInvestment assets
(Yen in millions)
As of March 31, 2020 As of March 31, 2019
Amount Composition ratio (%) Amount Composition ratio (%)
Bank deposits 222,491 2.51 224,971 3.09Monetary receivables bought 1,224,452 13.83 1,228,417 16.87Securities 3,936,263 44.44 3,558,348 48.87Loans 1,093,555 12.35 712,921 9.79Land and buildings 45,892 0.52 29,582 0.41Total investment assets 6,522,655 73.65 5,754,240 79.04Total assets 8,856,731 100.00 7,280,533 100.00
Note: Figures are amounts before the elimination of internal transactions with other operating segments.
106
Overseas Insurance (Unaudited)
Part4 | Fin
ancial D
ata
2020/09/17 18:08:12 / 20654695_東京海上ホールディングス株式会社_総会その他(C)
YieldIncome yield
(Yen in millions)
FY2019(April 1, 2019 to March 31, 2020)
FY2018(April 1, 2018 to March 31, 2019)
Interest anddividends Average balance Annual yield (%) Interest and
dividends Average balance Annual yield (%)
Bank deposits 2,893 223,634 1.29 2,627 258,100 1.02Monetary receivables bought 61,279 1,201,894 5.10 57,651 1,154,976 4.99Securities 130,982 3,492,837 3.75 136,766 3,679,255 3.72Loans 69,993 903,571 7.75 61,330 701,554 8.74Land and buildings 750 37,752 1.99 751 28,942 2.60Subtotal 265,899 5,859,690 4.54 259,128 5,822,829 4.45Others 1,253 — — 612 — —Total 267,153 — — 259,740 — —
Note: 1. Figures are amounts before the elimination of internal transactions with other operating segments. Securities on the consolidated balance sheet includes shares of affiliates accounted for by the equity method. However, these shares have been excluded from calculations of average balance and annual yield.
2. Interest and dividends represents Interest and dividends in the consolidated statement of income.3. Average balances are calculated based on average balances at the beginning and end of each fiscal year (acquisition costs or amortization costs).
Realized yield(Yen in millions)
FY2019(April 1, 2019 to March 31, 2020)
FY2018(April 1, 2018 to March 31, 2019)
Net investmentincome Average balance Annual yield (%) Net investment
income Average balance Annual yield (%)
Bank deposits 2,390 223,634 1.07 2,504 258,100 0.97Monetary receivables bought 60,198 1,201,894 5.01 59,427 1,154,976 5.15Securities 159,500 3,492,837 4.57 142,972 3,679,255 3.89Loans 68,623 903,571 7.59 58,683 701,554 8.36Land and buildings 750 37,752 1.99 751 28,942 2.60Derivatives 11,221 — — (9,405) — —Others (64) — — (5,922) — —Total 302,620 5,859,690 5.16 249,011 5,822,829 4.28
Note: 1. Figures are amounts before the elimination of internal transactions with other operating segments. Securities on the consolidated balance sheet includes shares of affiliates accounted for by the equity method. However, these shares have been excluded from calculations of average balance and annual yield.
2. Net investment income represents Investment income in the consolidated statement of income less Investment expenses.3. Average balances are calculated based on average balances at the beginning and end of each fiscal year (acquisition costs or amortization costs).
(Reference) Total for All Businesses (Unaudited)Direct premiums written (including deposit premiums from policyholders)
(Yen in millions)
FY2019(April 1, 2019 to March 31, 2020)
FY2018(April 1, 2018 to March 31, 2019)
Amount Composition ratio(%)
Rate of change(%) Amount Composition ratio
(%)Rate of change
(%)
Fire and allied lines 714,550 17.55 10.43 647,080 16.52 4.05Hull and cargo 133,597 3.28 11.46 119,864 3.06 (2.36)Personal accident 296,102 7.27 1.70 291,138 7.43 (4.60)Voluntary automobile 1,450,761 35.64 2.55 1,414,645 36.11 0.16Compulsory automobile liability 281,885 6.92 (0.43) 283,097 7.23 0.40Others 1,194,195 29.33 2.82 1,161,482 29.65 5.02Total 4,071,093 100.00 3.93 3,917,308 100.00 1.74
Deposit premiums frompolicyholders 77,041 1.89 (4.41) 80,592 2.06 (14.04)
Note: 1. Figures are amounts before the elimination of internal transactions with other operating segments.2. Direct premiums written including deposit premiums from policyholders = Gross premiums written - Surrender benefits of direct policies - Other refunds of direct policies (including
deposit premiums from policyholders)
107
Overseas Insurance (Unaudited)、(Reference) Total for All Businesses (Unaudited)
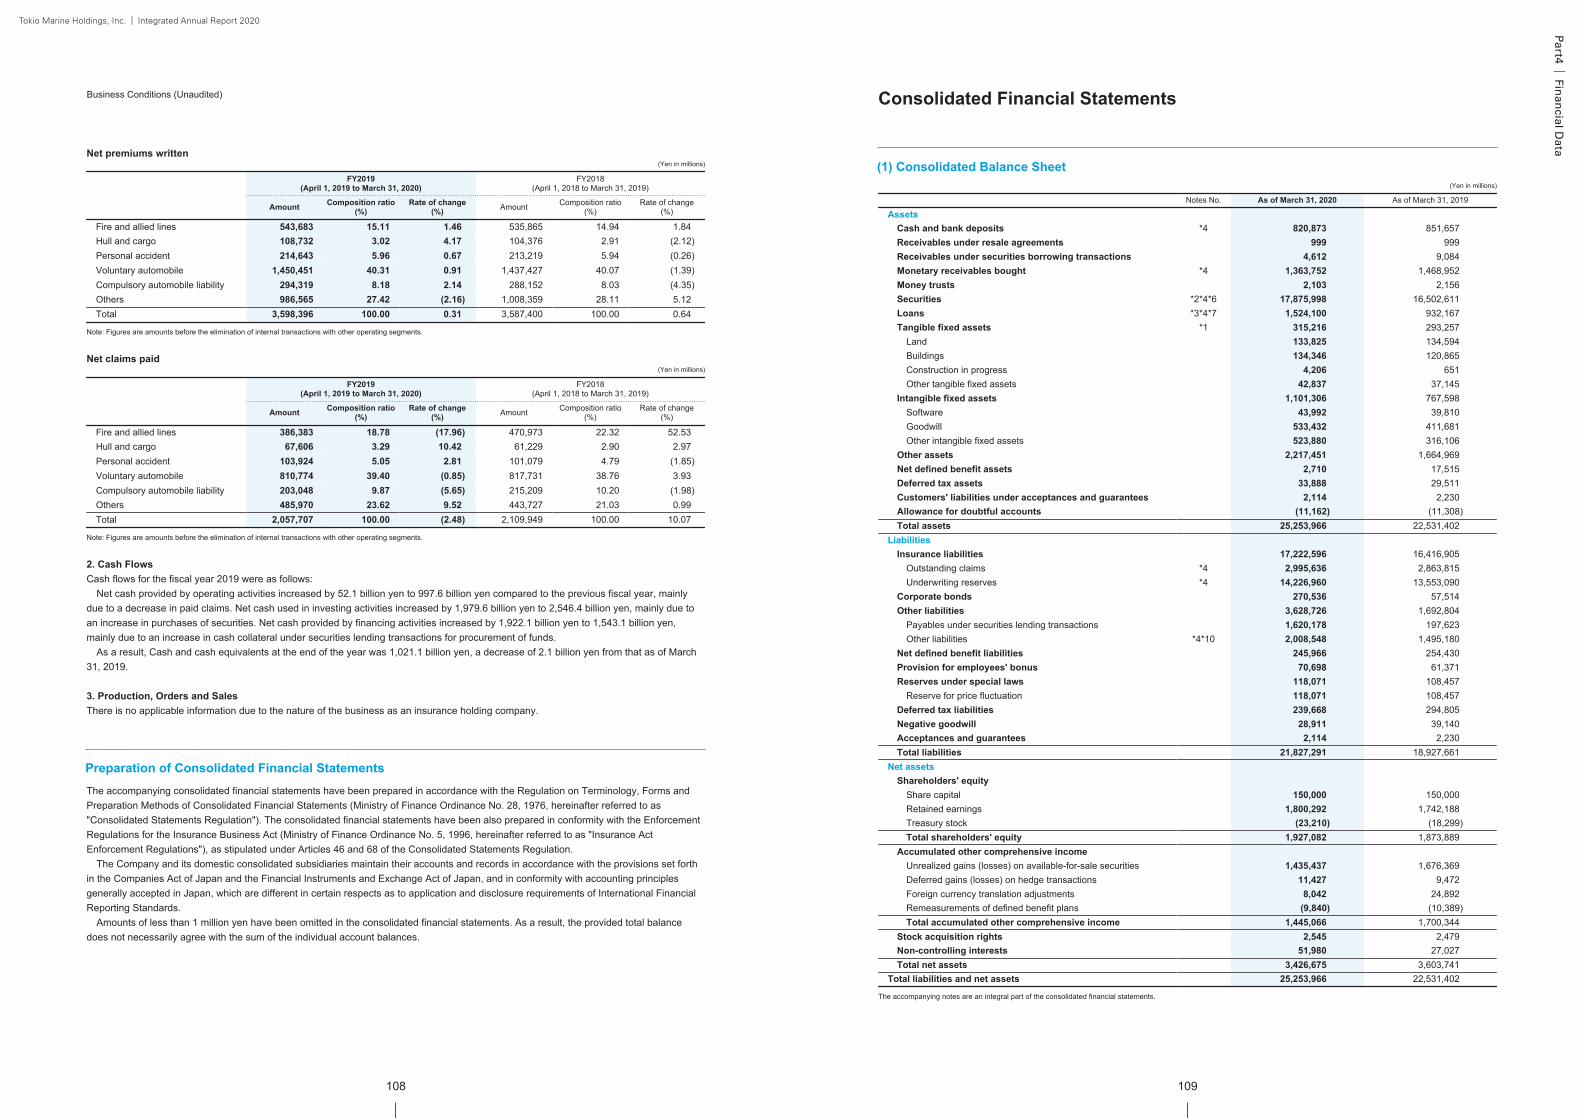
Business Conditions (Unaudited)
Tokio Marine Holdings, Inc. | Integrated Annual Report 2020
2020/09/17 18:08:12 / 20654695_東京海上ホールディングス株式会社_総会その他(C)
Net premiums written(Yen in millions)
FY2019(April 1, 2019 to March 31, 2020)
FY2018(April 1, 2018 to March 31, 2019)
Amount Composition ratio(%)
Rate of change(%) Amount Composition ratio
(%)Rate of change
(%)
Fire and allied lines 543,683 15.11 1.46 535,865 14.94 1.84Hull and cargo 108,732 3.02 4.17 104,376 2.91 (2.12)Personal accident 214,643 5.96 0.67 213,219 5.94 (0.26)Voluntary automobile 1,450,451 40.31 0.91 1,437,427 40.07 (1.39)Compulsory automobile liability 294,319 8.18 2.14 288,152 8.03 (4.35)Others 986,565 27.42 (2.16) 1,008,359 28.11 5.12Total 3,598,396 100.00 0.31 3,587,400 100.00 0.64
Note: Figures are amounts before the elimination of internal transactions with other operating segments.
Net claims paid(Yen in millions)
FY2019(April 1, 2019 to March 31, 2020)
FY2018(April 1, 2018 to March 31, 2019)
Amount Composition ratio(%)
Rate of change(%) Amount Composition ratio
(%)Rate of change
(%)
Fire and allied lines 386,383 18.78 (17.96) 470,973 22.32 52.53Hull and cargo 67,606 3.29 10.42 61,229 2.90 2.97Personal accident 103,924 5.05 2.81 101,079 4.79 (1.85)Voluntary automobile 810,774 39.40 (0.85) 817,731 38.76 3.93Compulsory automobile liability 203,048 9.87 (5.65) 215,209 10.20 (1.98)Others 485,970 23.62 9.52 443,727 21.03 0.99Total 2,057,707 100.00 (2.48) 2,109,949 100.00 10.07
Note: Figures are amounts before the elimination of internal transactions with other operating segments.
2. Cash FlowsCash flows for the fiscal year 2019 were as follows: Net cash provided by operating activities increased by 52.1 billion yen to 997.6 billion yen compared to the previous fiscal year, mainly due to a decrease in paid claims. Net cash used in investing activities increased by 1,979.6 billion yen to 2,546.4 billion yen, mainly due to an increase in purchases of securities. Net cash provided by financing activities increased by 1,922.1 billion yen to 1,543.1 billion yen, mainly due to an increase in cash collateral under securities lending transactions for procurement of funds. As a result, Cash and cash equivalents at the end of the year was 1,021.1 billion yen, a decrease of 2.1 billion yen from that as of March 31, 2019.
3. Production, Orders and SalesThere is no applicable information due to the nature of the business as an insurance holding company.
Preparation of Consolidated Financial StatementsThe accompanying consolidated financial statements have been prepared in accordance with the Regulation on Terminology, Forms and Preparation Methods of Consolidated Financial Statements (Ministry of Finance Ordinance No. 28, 1976, hereinafter referred to as "Consolidated Statements Regulation"). The consolidated financial statements have been also prepared in conformity with the Enforcement Regulations for the Insurance Business Act (Ministry of Finance Ordinance No. 5, 1996, hereinafter referred to as "Insurance Act Enforcement Regulations"), as stipulated under Articles 46 and 68 of the Consolidated Statements Regulation. The Company and its domestic consolidated subsidiaries maintain their accounts and records in accordance with the provisions set forth in the Companies Act of Japan and the Financial Instruments and Exchange Act of Japan, and in conformity with accounting principles generally accepted in Japan, which are different in certain respects as to application and disclosure requirements of International Financial Reporting Standards. Amounts of less than 1 million yen have been omitted in the consolidated financial statements. As a result, the provided total balance does not necessarily agree with the sum of the individual account balances.
108
(Reference) Total for All Businesses (Unaudited)、Consolidated Balance Sheet
Consolidated Financial Statements
Part4 | Fin
ancial D
ata
2020/09/17 18:08:12 / 20654695_東京海上ホールディングス株式会社_総会その他(C)
(1) Consolidated Balance Sheet(Yen in millions)
Notes No. As of March 31, 2020 As of March 31, 2019
AssetsCash and bank deposits *4 820,873 851,657Receivables under resale agreements 999 999Receivables under securities borrowing transactions 4,612 9,084Monetary receivables bought *4 1,363,752 1,468,952Money trusts 2,103 2,156Securities *2*4*6 17,875,998 16,502,611Loans *3*4*7 1,524,100 932,167Tangible fixed assets *1 315,216 293,257
Land 133,825 134,594Buildings 134,346 120,865Construction in progress 4,206 651Other tangible fixed assets 42,837 37,145
Intangible fixed assets 1,101,306 767,598Software 43,992 39,810Goodwill 533,432 411,681Other intangible fixed assets 523,880 316,106
Other assets 2,217,451 1,664,969Net defined benefit assets 2,710 17,515Deferred tax assets 33,888 29,511Customers' liabilities under acceptances and guarantees 2,114 2,230Allowance for doubtful accounts (11,162) (11,308)Total assets 25,253,966 22,531,402
LiabilitiesInsurance liabilities 17,222,596 16,416,905
Outstanding claims *4 2,995,636 2,863,815Underwriting reserves *4 14,226,960 13,553,090
Corporate bonds 270,536 57,514Other liabilities 3,628,726 1,692,804
Payables under securities lending transactions 1,620,178 197,623Other liabilities *4*10 2,008,548 1,495,180
Net defined benefit liabilities 245,966 254,430Provision for employees' bonus 70,698 61,371Reserves under special laws 118,071 108,457
Reserve for price fluctuation 118,071 108,457Deferred tax liabilities 239,668 294,805Negative goodwill 28,911 39,140Acceptances and guarantees 2,114 2,230Total liabilities 21,827,291 18,927,661
Net assetsShareholders' equity
Share capital 150,000 150,000Retained earnings 1,800,292 1,742,188Treasury stock (23,210) (18,299)Total shareholders' equity 1,927,082 1,873,889
Accumulated other comprehensive incomeUnrealized gains (losses) on available-for-sale securities 1,435,437 1,676,369Deferred gains (losses) on hedge transactions 11,427 9,472Foreign currency translation adjustments 8,042 24,892Remeasurements of defined benefit plans (9,840) (10,389)Total accumulated other comprehensive income 1,445,066 1,700,344
Stock acquisition rights 2,545 2,479Non-controlling interests 51,980 27,027Total net assets 3,426,675 3,603,741
Total liabilities and net assets 25,253,966 22,531,402
The accompanying notes are an integral part of the consolidated financial statements.
109
Consolidated Balance Sheet

Consolidated Financial Statements
Tokio Marine Holdings, Inc. | Integrated Annual Report 2020
2020/09/17 18:08:12 / 20654695_東京海上ホールディングス株式会社_総会その他(C)
(2) Consolidated Statement of Income and Consolidated Statement of Comprehensive IncomeConsolidated Statement of Income
(Yen in millions)
Notes No. FY2019(April 1, 2019–March 31, 2020)
FY2018(April 1, 2018–March 31, 2019)
Ordinary income 5,465,432 5,476,720Underwriting income 4,701,979 4,769,640
Net premiums written 3,598,396 3,587,400Deposit premiums from policyholders 77,041 80,592Investment income on deposit premiums 39,466 42,624Life insurance premiums 981,900 1,053,520Other underwriting income 5,174 5,503
Investment income 642,214 589,247Interest and dividends 513,041 492,962Gains on money trusts — 101Gains on trading securities 18,016 6,708Gains on sales of securities 142,625 121,973Gains on redemption of securities 541 2,011Other investment income 7,456 8,114Transfer of investment income on deposit premiums (39,466) (42,624)
Other ordinary income 121,238 117,831Amortization of negative goodwill 10,229 10,229Other ordinary income 111,009 107,602
Ordinary expenses 5,101,486 5,060,389Underwriting expenses 4,096,249 4,079,779
Net claims paid 2,057,707 2,109,949Loss adjustment expenses *1 145,299 141,980Agency commissions and brokerage *1 694,708 707,591Maturity refunds to policyholders 158,337 164,761Dividends to policyholders 18 28Life insurance claims 412,721 492,276Provision for outstanding claims 128,992 170,883Provision for underwriting reserves 489,344 287,010Other underwriting expenses 9,120 5,296
Investment expenses 82,938 90,259Losses on money trusts 50 1,540Losses on sales of securities 12,723 18,967Impairment losses on securities 26,577 9,835Losses on redemption of securities 772 1,081Losses on derivatives 12,809 29,648Investment losses on separate accounts 8,449 3,530Other investment expenses 21,554 25,655
Operating and general administrative expenses *1 892,776 861,365Other ordinary expenses 29,522 28,985
Interest expenses 18,940 17,039Increase in allowance for doubtful accounts 808 —Losses on bad debts 133 308Equity in losses of affiliates 4,445 3,310Amortization of deferred assets under Article 113of the Insurance Business Act — 3,826
Other ordinary expenses 5,195 4,500Ordinary profit 363,945 416,330Extraordinary gains 9,695 5,011
Gains on disposal of fixed assets 173 1,352Gains on step acquisitions 4,454 2,891Gains on sales of investment in subsidiaries and affiliates 4,336 431Other extraordinary gains *2 731 334
Extraordinary losses 19,513 35,607Losses on disposal of fixed assets 1,941 1,908Impairment losses on fixed assets *3 6,386 3,248Provision for reserves under special laws 9,614 7,945
Provision for reserve for price fluctuation 9,614 7,945Losses on advanced depreciation of real estates 0 —Losses on sales of investment in subsidiaries and affiliates 209 22,504Other extraordinary losses 1,359 —
Income before income taxes and non-controlling interests 354,127 385,733Income taxes–current 118,662 119,450Income taxes–deferred (26,372) (9,437)Total income taxes 92,289 110,013Net income 261,838 275,720Net income attributable to non-controlling interests 2,074 1,140Net income attributable to owners of the parent 259,763 274,579
The accompanying notes are an integral part of the consolidated financial statements.
110
Consolidated Statement of Income and Consolidated Statement of Comprehensive Income
Part4 | Fin
ancial D
ata
2020/09/17 18:08:12 / 20654695_東京海上ホールディングス株式会社_総会その他(C)
Consolidated Statement of Comprehensive Income(Yen in millions)
Note No. FY2019(April 1, 2019–March 31, 2020)
FY2018(April 1, 2018–March 31, 2019)
Net income 261,838 275,720Other comprehensive income
Unrealized gains (losses) on available-for-sale securities (244,344) (188,327)Deferred gains (losses) on hedge transactions 1,394 (1,357)Foreign currency translation adjustments (13,968) (49,377)Remeasurements of defined benefit plans 544 9,676Share of other comprehensive income ofaffiliates accounted for by the equity method (2,726) (3,464)
Total other comprehensive income * (259,100) (232,848)Total comprehensive income 2,737 42,871Comprehensive income attributable to:
Owners of the parent (715) 43,133Non-controlling interests 3,452 (262)
The accompanying notes are an integral part of the consolidated financial statements.
(3) Consolidated Statement of Changes in Shareholders’ EquityFY2019 (April 1, 2019 –March 31, 2020)
(Yen in millions)
Shareholders' equity
Share capital Retained earnings Treasury stock Total shareholders’ equity
Beginning balance 150,000 1,742,188 (18,299) 1,873,889Cumulative effects of revision in accountingstandards for overseas subsidiaries (3,565) (3,565)
Restated balance 150,000 1,738,622 (18,299) 1,870,323Changes during the year
Dividends (154,882) (154,882)Net income attributable to owners of the parent 259,763 259,763Purchases of treasury stock (50,940) (50,940)Disposal of treasury stock (321) 1,066 744Cancellation of treasury stock (44,962) 44,962 —Changes in the scope of consolidation 2,272 2,272Changes in equity resulted from increase incapital of consolidated subsidiaries —
Others (199) (199)Net changes in items other than shareholders' equity
Total changes during the year — 61,669 (4,910) 56,759Ending balance 150,000 1,800,292 (23,210) 1,927,082
Accumulated other comprehensive income
Stockacquisition rights
Non-controllinginterests Total net assets
Unrealizedgains (losses) onavailable-for-sale
securities
Deferredgains (losses)
on hedgetransactions
Foreigncurrency
translationadjustments
Remeasurementsof defined
benefit plans
Beginning balance 1,676,369 9,472 24,892 (10,389) 2,479 27,027 3,603,741Cumulative effects of revision in accountingstandards for overseas subsidiaries 3,565 —
Restated balance 1,679,935 9,472 24,892 (10,389) 2,479 27,027 3,603,741Changes during the year
Dividends (154,882)Net income attributable to owners of the parent 259,763Purchases of treasury stock (50,940)Disposal of treasury stock 744Cancellation of treasury stock —Changes in the scope of consolidation 2,272Changes in equity resulted from increase incapital of consolidated subsidiaries —
Others (199)Net changes in items other than shareholders' equity (244,498) 1,955 (16,850) 548 66 24,953 (233,825)
Total changes during the year (244,498) 1,955 (16,850) 548 66 24,953 (177,066)Ending balance 1,435,437 11,427 8,042 (9,840) 2,545 51,980 3,426,675
111
Consolidated Statement of Income and Consolidated Statement of Comprehensive Income、Consolidated Statement of Changes in Shareholders’ Equity
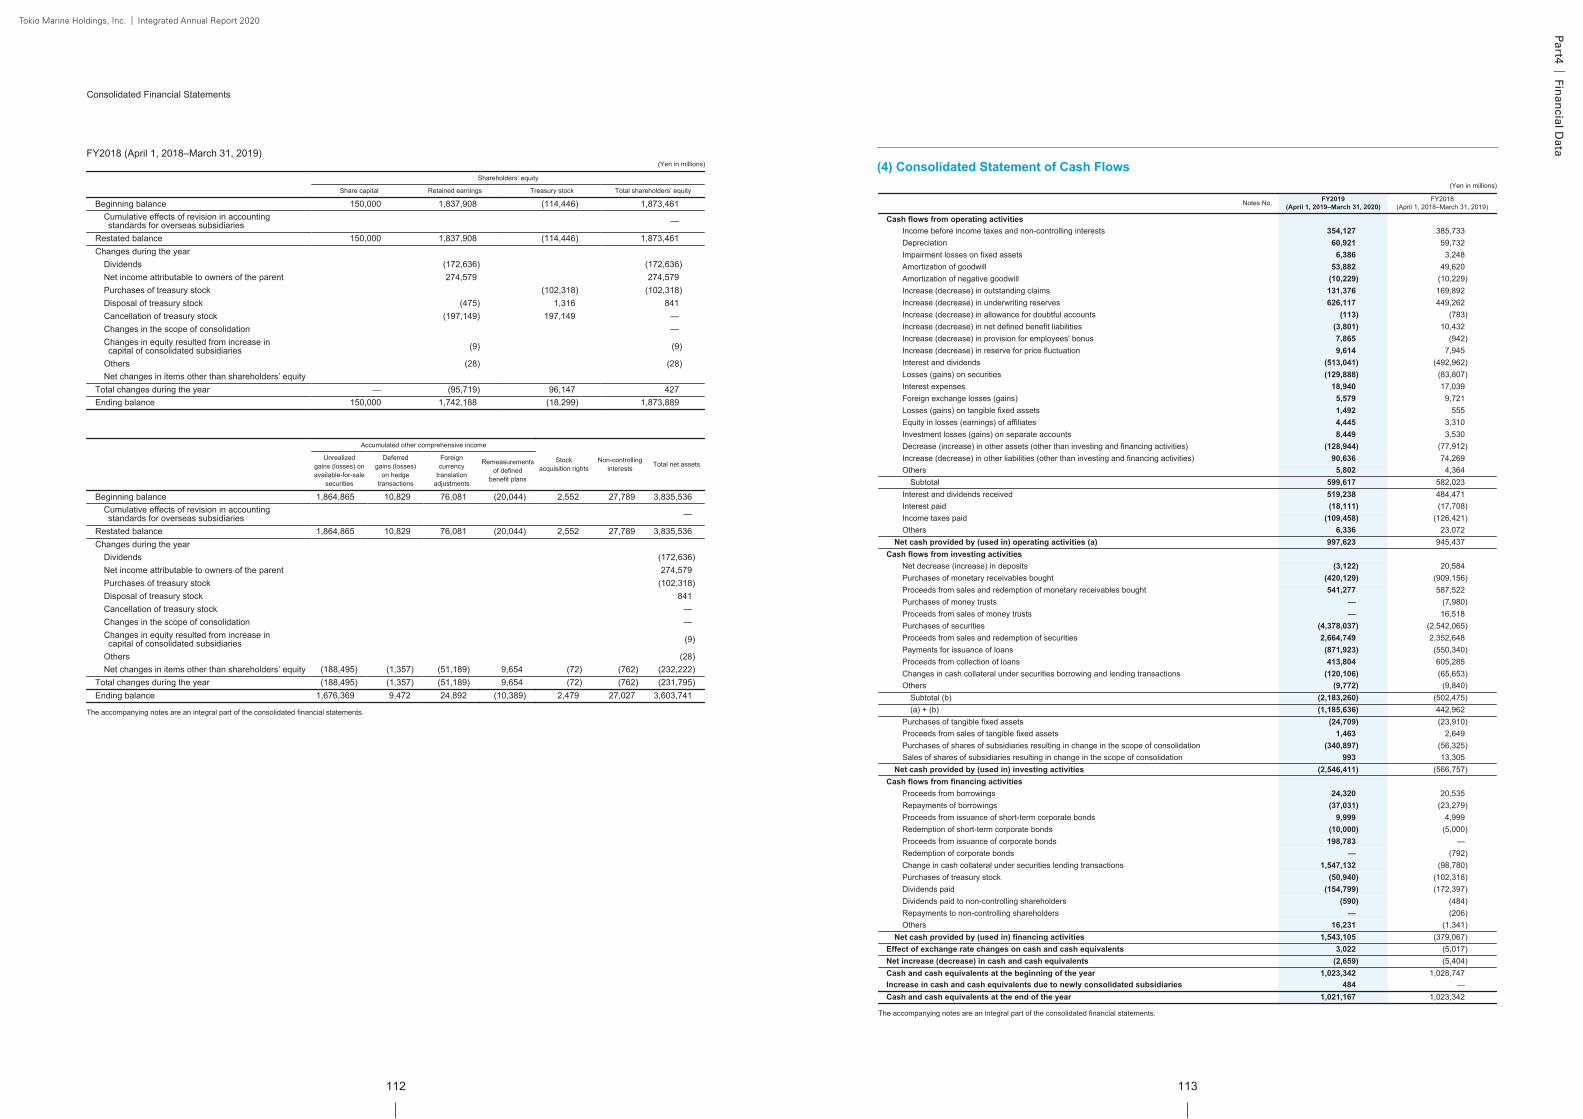
Consolidated Financial Statements
Tokio Marine Holdings, Inc. | Integrated Annual Report 2020
2020/09/17 18:08:12 / 20654695_東京海上ホールディングス株式会社_総会その他(C)
FY2018 (April 1, 2018–March 31, 2019)(Yen in millions)
Shareholders’ equity
Share capital Retained earnings Treasury stock Total shareholders’ equity
Beginning balance 150,000 1,837,908 (114,446) 1,873,461Cumulative effects of revision in accountingstandards for overseas subsidiaries —
Restated balance 150,000 1,837,908 (114,446) 1,873,461Changes during the year
Dividends (172,636) (172,636)Net income attributable to owners of the parent 274,579 274,579Purchases of treasury stock (102,318) (102,318)Disposal of treasury stock (475) 1,316 841Cancellation of treasury stock (197,149) 197,149 —Changes in the scope of consolidation —Changes in equity resulted from increase incapital of consolidated subsidiaries (9) (9)
Others (28) (28)Net changes in items other than shareholders’ equity
Total changes during the year — (95,719) 96,147 427Ending balance 150,000 1,742,188 (18,299) 1,873,889
Accumulated other comprehensive income
Stockacquisition rights
Non-controllinginterests Total net assets
Unrealizedgains (losses) onavailable-for-sale
securities
Deferredgains (losses)
on hedgetransactions
Foreigncurrency
translationadjustments
Remeasurementsof defined
benefit plans
Beginning balance 1,864,865 10,829 76,081 (20,044) 2,552 27,789 3,835,536Cumulative effects of revision in accountingstandards for overseas subsidiaries —
Restated balance 1,864,865 10,829 76,081 (20,044) 2,552 27,789 3,835,536Changes during the year
Dividends (172,636)Net income attributable to owners of the parent 274,579Purchases of treasury stock (102,318)Disposal of treasury stock 841Cancellation of treasury stock —Changes in the scope of consolidation —Changes in equity resulted from increase incapital of consolidated subsidiaries (9)
Others (28)Net changes in items other than shareholders’ equity (188,495) (1,357) (51,189) 9,654 (72) (762) (232,222)
Total changes during the year (188,495) (1,357) (51,189) 9,654 (72) (762) (231,795)Ending balance 1,676,369 9,472 24,892 (10,389) 2,479 27,027 3,603,741
The accompanying notes are an integral part of the consolidated financial statements.
112
Consolidated Statement of Changes in Shareholders’ Equity
Part4 | Fin
ancial D
ata
2020/09/17 18:08:12 / 20654695_東京海上ホールディングス株式会社_総会その他(C)
(4) Consolidated Statement of Cash Flows(Yen in millions)
Notes No. FY2019(April 1, 2019–March 31, 2020)
FY2018(April 1, 2018–March 31, 2019)
Cash flows from operating activitiesIncome before income taxes and non-controlling interests 354,127 385,733Depreciation 60,921 59,732Impairment losses on fixed assets 6,386 3,248Amortization of goodwill 53,882 49,620Amortization of negative goodwill (10,229) (10,229)Increase (decrease) in outstanding claims 131,376 169,892Increase (decrease) in underwriting reserves 626,117 449,262Increase (decrease) in allowance for doubtful accounts (113) (783)Increase (decrease) in net defined benefit liabilities (3,801) 10,432Increase (decrease) in provision for employees' bonus 7,865 (942)Increase (decrease) in reserve for price fluctuation 9,614 7,945Interest and dividends (513,041) (492,962)Losses (gains) on securities (129,888) (83,807)Interest expenses 18,940 17,039Foreign exchange losses (gains) 5,579 9,721Losses (gains) on tangible fixed assets 1,492 555Equity in losses (earnings) of affiliates 4,445 3,310Investment losses (gains) on separate accounts 8,449 3,530Decrease (increase) in other assets (other than investing and financing activities) (128,944) (77,912)Increase (decrease) in other liabilities (other than investing and financing activities) 90,636 74,269Others 5,802 4,364
Subtotal 599,617 582,023Interest and dividends received 519,238 484,471Interest paid (18,111) (17,708)Income taxes paid (109,458) (126,421)Others 6,336 23,072
Net cash provided by (used in) operating activities (a) 997,623 945,437Cash flows from investing activities
Net decrease (increase) in deposits (3,122) 20,584Purchases of monetary receivables bought (420,129) (909,156)Proceeds from sales and redemption of monetary receivables bought 541,277 587,522Purchases of money trusts — (7,980)Proceeds from sales of money trusts — 16,518Purchases of securities (4,378,037) (2,542,065)Proceeds from sales and redemption of securities 2,664,749 2,352,648Payments for issuance of loans (871,923) (550,340)Proceeds from collection of loans 413,804 605,285Changes in cash collateral under securities borrowing and lending transactions (120,106) (65,653)Others (9,772) (9,840)
Subtotal (b) (2,183,260) (502,475)(a) + (b) (1,185,636) 442,962
Purchases of tangible fixed assets (24,709) (23,910)Proceeds from sales of tangible fixed assets 1,463 2,649Purchases of shares of subsidiaries resulting in change in the scope of consolidation (340,897) (56,325)Sales of shares of subsidiaries resulting in change in the scope of consolidation 993 13,305
Net cash provided by (used in) investing activities (2,546,411) (566,757)Cash flows from financing activities
Proceeds from borrowings 24,320 20,535Repayments of borrowings (37,031) (23,279)Proceeds from issuance of short-term corporate bonds 9,999 4,999Redemption of short-term corporate bonds (10,000) (5,000)Proceeds from issuance of corporate bonds 198,783 —Redemption of corporate bonds — (792)Change in cash collateral under securities lending transactions 1,547,132 (98,780)Purchases of treasury stock (50,940) (102,318)Dividends paid (154,799) (172,397)Dividends paid to non-controlling shareholders (590) (484)Repayments to non-controlling shareholders — (206)Others 16,231 (1,341)
Net cash provided by (used in) financing activities 1,543,105 (379,067)Effect of exchange rate changes on cash and cash equivalents 3,022 (5,017)Net increase (decrease) in cash and cash equivalents (2,659) (5,404)Cash and cash equivalents at the beginning of the year 1,023,342 1,028,747Increase in cash and cash equivalents due to newly consolidated subsidiaries 484 —Cash and cash equivalents at the end of the year 1,021,167 1,023,342
The accompanying notes are an integral part of the consolidated financial statements.
113
Consolidated Statement of Cash Flows

Consolidated Financial Statements
Tokio Marine Holdings, Inc. | Integrated Annual Report 2020
2020/09/17 18:08:12 / 20654695_東京海上ホールディングス株式会社_総会その他(C)
Significant Accounting Policies1. Scope of consolidation
(1) Number of consolidated companies: 164 companiesFor details of the Company’s major consolidated subsidiaries, please refer to "Tokio Marine Holdings and its Subsidiaries" in "Corporate Data". Privilege Underwriters, Inc. and 12 other companies are included in the scope of consolidation from the fiscal year 2019 due to the acquisition of shares and other events. Safety Insurance Public Company Limited, which was a consolidated subsidiary in the fiscal year 2018, was dissolved through the merger with Tokio Marine Insurance (Thailand) Public Company Limited, and Tokio Marine Safety Insurance (Thailand) Public Company Limited was newly established as a result of the merger as a consolidated subsidiary. In addition, Bail USA, Inc. and three other companies have been excluded from the scope of consolidation due to the sales of 100% of their shares and other events.
(2) Names of major non-consolidated subsidiaries(Names of major companies)• Tokio Marine & Nichido Adjusting Service Co., Ltd.• Tokio Marine Life Insurance (Thailand) Public Company Limited(Reason for exclusion from the scope of consolidation) Each non-consolidated subsidiary is small in scale in terms of total assets, sales, net income or loss and retained earnings. As such non-consolidated subsidiaries are not considered to materially affect any reasonable determination as to the Group’s financial condition and results of operations, these companies are excluded from the consolidation.
2. Application of the equity method(1) Number of affiliates accounted for by the equity method: 7 companies
For details of major affiliates accounted for by the equity method, please refer to "Tokio Marine Holdings and its Subsidiaries" in "Corporate Data". NAS Insurance Services, LLC, which became a subsidiary due to the acquisition of additional shares, and one other company, have been excluded from the scope of application of the equity method from the fiscal year 2019.
(2) The non-consolidated subsidiaries (Tokio Marine & Nichido Adjusting Service Co., Ltd., Tokio Marine Life Insurance (Thailand) Public Company Limited, etc.) and other affiliates (Alinma Tokio Marine Company, etc.) are not accounted for by the equity method because these companies have an immaterial effect on the Company’s consolidated net income or loss as well as consolidated retained earnings.
(3) The Company owns 30.1% of the total voting rights of Japan Earthquake Reinsurance Co., Ltd. through Tokio Marine & Nichido and Nisshin Fire. However, the Company does not consider Japan Earthquake Reinsurance Co., Ltd. to be its affiliate since it cannot exert a significant influence on any decision making of its policies given the highly public nature of their business.
(4) When a company accounted for by the equity method has a different closing date from that of the Company, in principle, the financial statements prepared at its closing date are used for presentation in the consolidated financial results.
3. Balance sheet date of consolidated subsidiariesThere are three domestic subsidiaries and 152 overseas subsidiaries whose balance sheet dates are December 31. The consolidated financial statements incorporate the results of these subsidiaries for the period ended December 31. Necessary adjustments for the consolidation are made for material transactions that occur during the three-month lag between the balance sheet dates of these subsidiaries and the consolidated balance sheet date.
4. Accounting policies(1) Valuation of securities
a. Trading securities are valued at fair value, with the costs of their sales being calculated based on the moving-average method.b. Bonds held to maturity are recorded at amortized cost based on the moving-average method (straight-line method).c. Bonds earmarked for underwriting reserves are stated at amortized cost under the straight-line method in accordance with the
Industry Audit Committee Report No. 21 "Temporary Treatment of Accounting and Auditing Concerning Securities Earmarked for Underwriting Reserve in Insurance Industry" issued by the Japanese Institute of Certified Public Accountants (the "JICPA"), November 16, 2000.
114
Significant Accounting Policies
Part4 | Fin
ancial D
ata
2020/09/17 18:08:12 / 20654695_東京海上ホールディングス株式会社_総会その他(C)
The following is a summary of the risk management policy concerning bonds earmarked for underwriting reserves. In order to adequately manage interest rate risk related to assets and liabilities, Tokio Marine & Nichido Life has established "part of underwriting reserve for individual insurance policies (non-participating or participating)" as an underwriting reserve subgroup. Tokio Marine & Nichido Life's policy is to match the duration of the underwriting reserve in the subgroup with the same or similar duration of bonds that are earmarked for underwriting reserves. From the fiscal year 2019, Tokio Marine & Nichido Life has expanded the subgroup "part of underwriting reserve for individual insurance policies (non-participating)" to "part of underwriting reserve for individual insurance policies (non-participating or participating)" from the viewpoint of enhancing Asset Liability Management ("ALM"). There is no impact on the consolidated financial statements as a result of this change. In addition, the subgroups for single payment individual annuity insurance and single payment whole-life insurance were eliminated as of March 31, 2020, and Bonds earmarked for underwriting reserves in the subgroups were reclassified to Available-for-sale securities. Since the balance of underwriting reserves pertaining to these subgroups has decreased, it has become less material to reflect the interest rate risk which is managed by matching assets and liabilities to the consolidated financial statements. The impact of this change to the consolidated financial statements is immaterial.
d. Available-for-sale securities with fair value are measured at fair value mainly based upon the market price on the closing date. Unrealized gains/losses on available-for-sale securities are included in net assets and costs of sales are calculated using the moving-average method.
e. Available-for-sale securities whose fair value cannot be measured reliably are stated at original cost by the moving-average method.
f. Investments in non-consolidated subsidiaries and affiliates that are not subject to the equity method are stated at original cost by the moving-average method.
g. Securities held in individually managed money trusts that are mainly invested in securities for trading are measured at fair value.
(2) Valuation of derivative transactionsDerivative financial instruments are measured at fair value.
(3) Depreciation methods for material depreciable assetsa. Tangible fixed assets
Depreciation of tangible fixed assets is calculated using the straight-line method.b. Intangible fixed assets
Intangible fixed assets recognized in acquisitions of overseas subsidiaries are amortized over the estimated useful life reflecting the pattern of the assets’ future economic benefits.
(4) Accounting policies for significant reserves and allowancesa. Allowance for doubtful accounts
In order to prepare for losses from bad debts, allowances are provided pursuant to the rules of asset self-assessment and the rules of asset write-off. Allowances are provided by major domestic consolidated subsidiaries as follows. For receivables from any debtor who has legally, or in practice, become insolvent (due to bankruptcy, special liquidation or suspension of transactions with banks based on the rules governing clearing houses, etc.) and for receivables from any debtor who has substantially become insolvent, allowances are provided based on the amount of any such receivables less the amount expected to be collectible calculated based on the disposal of collateral or execution of guarantees. For receivables from any debtor who is likely to become insolvent in the near future, allowances are provided based on the amount of any such receivables less the amount expected to be collectible through the disposal of collateral or execution of guarantees and the overall solvency assessment of the relevant debtor. For receivables other than those described above, allowances are the amount of receivables multiplied by the default rate, which is calculated based on historical default experience in certain previous periods. In addition, all receivables are assessed by the asset accounting department and the asset management department in accordance with the rules of asset self-assessment. Subsequently, the asset auditing departments, which are independent from other asset-related departments, conduct audits of the assessment results of the other asset-related departments. Allowances are provided based on such assessment results as stated above.
b. Provision for employees’ bonusTo provide for payment of bonuses to employees, the Company and its major consolidated domestic subsidiaries recognize provisions for employees’ bonuses based on the expected amount to be paid.
c. Reserve for price fluctuationDomestic consolidated insurance subsidiaries recognize reserves in accordance with Article 115 of the Insurance Business Act in order to provide for possible losses or damages arising from fluctuation of share prices, etc.
(5) Accounting methods for retirement benefitsa. The method of attributing expected retirement benefits to periods
In calculating the retirement benefit obligations, the method of attributing expected retirement benefits to periods is based on the benefit formula basis.
115
Significant Accounting Policies

Consolidated Financial Statements
Tokio Marine Holdings, Inc. | Integrated Annual Report 2020
2020/09/17 18:08:12 / 20654695_東京海上ホールディングス株式会社_総会その他(C)
b. The method of amortization of actuarial gains and losses and past service costsActuarial differences for each fiscal year are amortized proportionally from the following fiscal year using the straight-line method over a certain number of years (5 to 13 years) within the average remaining work period of employees at the time of occurrence. Past service costs are amortized by the straight-line method over a certain number of years (7 to 13 years) within the average remaining work period of employees at the time of occurrence.
(6) Consumption taxesFor the Company and its domestic consolidated subsidiaries, consumption taxes are accounted for by the tax-excluded method except for costs such as Operating and general administrative expenses incurred by domestic consolidated insurance subsidiaries which are accounted for by the tax-included method. In addition, any non-deductible consumption taxes, in respect of assets, are included in other assets and are amortized over five years using the straight-line method.
(7) Hedge accountinga. Interest rate
To mitigate interest rate fluctuation risks associated with long-term insurance policies, Tokio Marine & Nichido and Tokio Marine & Nichido Life conduct Asset Liability Management ("ALM") to control such risks by evaluating and analyzing financial assets and insurance liabilities simultaneously. As for interest rate swap transactions that are used to manage such risks, Tokio Marine & Nichido and Tokio Marine & Nichido Life apply deferred hedge accounting to the swap transactions based upon the Industry Audit Committee Report No. 26, "Accounting and Auditing Treatments related to Application of Accounting for Financial Instruments in the Insurance Industry" (issued by the JICPA, September 3, 2002). Assessment of hedge effectiveness is omitted because the companies group hedged insurance liabilities with the interest rate swaps that are the hedging instruments, based on the period remaining for the instruments, and the hedge is highly effective.
b. Foreign exchangeMajor domestic consolidated insurance subsidiaries apply fair value hedge accounting, deferred hedge accounting or assignment accounting for certain foreign exchange forward contracts and certain currency swaps utilized to reduce future currency risk such as in assets denominated in foreign currency. Assessment of hedge effectiveness is omitted because the principal term of the hedging instruments and the hedged items are identical and the hedge is highly effective. In addition, Tokio Marine & Nichido applies deferred hedge accounting to borrowings denominated in foreign currency utilized to reduce currency risk in overseas subsidiaries. Hedge effectiveness is determined based on the change in value of hedging instruments and hedged items during the period from the inception of the hedge to the time of assessment comparing the cumulative changes in their market values.
(8) Methods and periods of amortization for goodwillRegarding goodwill recognized as an asset on the consolidated balance sheet, goodwill in connection with Philadelphia Consolidated Holding Corp. is amortized over 20 years using the straight-line method. Goodwill in connection with HCC Insurance Holdings, Inc. is amortized over 10 years using the straight-line method. Goodwill in connection with Privilege Underwriters, Inc. is amortized over 15 years using the straight-line method. Other goodwill is amortized over 5 to 15 years using the straight-line method. Other goodwill in small amounts is amortized immediately. Negative goodwill incurred before March 31, 2010 and recognized as a liability on the consolidated balance sheet is amortized over 20 years using the straight-line method.
(9) Scope of cash and cash equivalents included in the consolidated statement of cash flowsCash and cash equivalents in the consolidated statement of cash flows consist of cash on hand, demand deposits and short-term investments such as time deposits with original maturities or redemption of three months or less at the date of acquisition.
116
Significant Accounting Policies
Part4 | Fin
ancial D
ata
2020/09/17 18:08:12 / 20654695_東京海上ホールディングス株式会社_総会その他(C)
Accounting Standards Not Yet Adopted by the Company• Practical Solution on Unification of Accounting Policies Applied to Foreign Subsidiaries, etc. for Consolidated Financial Statements
(Practical Issue Task Force ("PITF") No. 18, September 14, 2018)• Practical Solution on Unification of Accounting Policies Applied to Associates Accounted for Using the Equity Method (PITF No. 24,
September 14, 2018)
1. OverviewThe Accounting Standards Board of Japan ("ASBJ") has revised PITF No. 18 "Practical Solution on Unification of Accounting Policies Applied to Foreign Subsidiaries, etc. for Consolidated Financial Statements" and PITF No. 24 "Practical Solution on Unification of Accounting Policies Applied to Associates Accounted for Using the Equity Method". The major amendments are as follows. For overseas subsidiaries that present subsequent changes in fair value of investment in equity instruments in Other comprehensive income, when investments in the equity instruments are sold, an adjustment is to be made to recognize the difference between the acquisition cost and sales price as a gain or loss for the corresponding fiscal year within the consolidation process, in accordance with the Tentative Practical Solution of "Unification of Accounting Policies Applied to Foreign Subsidiaries, etc. for the Consolidation Process". For overseas subsidiaries that need to recognize any asset impairment, an adjustment is to be made to recognize the valuation difference as a loss for the corresponding fiscal year within the consolidation process.
2. Date of applicationThe Company plans to adopt the aforementioned standards from the beginning of the fiscal year following the fiscal year in which itsoverseas subsidiaries adopt IFRS 9 "Financial Instruments".
3. Impact of application of standardsThe Company has not yet evaluated the impact of the application of the aforementioned standards at the timing of the preparation of its consolidated financial statements.
• Accounting Standard for Fair Value Measurement (ASBJ Statement No. 30, July 4, 2019)• Implementation Guidance on Accounting Standard for Fair Value Measurement (ASBJ Guidance No. 31, July 4, 2019)• Accounting Standard for Financial Instruments (ASBJ Statement No. 10, July 4, 2019)• Implementation Guidance on Disclosures about Fair Value of Financial Instruments (ASBJ Guidance No. 19, July 4, 2019)
1. OverviewTo improve comparability with international accounting standards, "Accounting Standard for Fair Value Measurement" and "Implementation Guidance on Accounting Standard for Fair Value Measurement" (hereinafter referred to as "Fair Value Accounting Standards") were developed and guidance for measuring fair value was established. The Fair Value Accounting Standards are applied to the fair value of financial instruments in "Accounting Standard for Financial Instruments". In addition, "Implementation Guidance on Disclosures about Fair Value of Financial Instruments" was revised to stipulate disclosure requirements for financial instruments based on their fair value levels.
2. Date of applicationThe Company and its domestic consolidated subsidiaries plan to adopt the aforementioned standards from the beginning of the fiscal year 2021.
3. Impact of application of standardsThe Company has not yet evaluated the impact of the application of the aforementioned standards at the timing of the preparation of its consolidated financial statements.
Additional InformationConsolidated overseas subsidiaries that apply US GAAP have adopted Accounting Standards Update 2016-01: Recognition and Measurement of Financial Assets and Financial Liabilities (hereinafter referred to as "ASU 2016-01") issued by the Financial Accounting Standards Board from the beginning of the fiscal year 2019. ASU 2016-01 requires equity investments (except those accounted for under the equity method of accounting or those that result in consolidation of the investee) to be measured at fair value with changes in fair value recognized in net income or loss. In accordance with ASU 2016-01, the Company has recognized the changes in fair value for certain equity investments in net income or loss from the beginning of the fiscal year 2019, which were previously recognized in Other comprehensive income. The Company has reclassified Unrealized losses on available-for-sale securities (3,565 million yen) to Retained earnings at the beginning of the fiscal year 2019, and certain securities that were classified in Available-for-sale securities at the end of the fiscal year 2018 (65,355 million yen) have been included in Trading securities. The impacts to Ordinary profit and Income before income taxes and non-controlling interests for the fiscal year 2019 are immaterial.
117
Significant Accounting Policies

Consolidated Financial Statements
Tokio Marine Holdings, Inc. | Integrated Annual Report 2020
2020/09/17 18:08:12 / 20654695_東京海上ホールディングス株式会社_総会その他(C)
Notes to Consolidated Balance Sheet*1. Accumulated depreciation of tangible fixed assets and advanced depreciation of tangible fixed assets, deducted from acquisition costs
are as follows:(Yen in millions)
As of March 31, 2020 As of March 31, 2019
Accumulated depreciation 363,575 366,231Advanced depreciation of tangible fixed assets 18,454 18,607
*2. Securities of non-consolidated subsidiaries and affiliates, etc. are as follows:(Yen in millions)
As of March 31, 2020 As of March 31, 2019
Securities (equity) 163,753 322,976Securities (partnership) 29,035 33,364
*3. Amounts of loans to borrowers in bankruptcy are as follows:(Yen in millions)
As of March 31, 2020 As of March 31, 2019
Loans to borrowers in bankruptcy 19,589 —Loans past due 36,625 17,945Loans past due for three months or more 732 11Restructured loans — 4Total 56,947 17,960
Note: Loans are generally placed on non-accrual status when there is no expectation of the collection of the loans when loans are past due for a certain period or for other reasons (hereinafter referred to as "Non-accrual status loans"; any part of bad debt written-off is excluded). Loans to borrowers in bankruptcy represent Non-accrual status loans after a partial charge-off of claims is deemed uncollectible, which are defined in Article 96, paragraph 1, subparagraph 3 (a) to (e) (maximum amount transferable to allowance for doubtful accounts) and subparagraph 4 of the Enforcement Ordinance of the Corporation Tax Law (Ordinance No. 97, 1965). Loans past due are Non-accrual status loans, other than Loans to borrowers in bankruptcy and loans on which interest payments are deferred in order to assist business restructuring or financial recovery of the borrowers. Loans past due for three months or more are defined as loans on which any principal or interest payments are delayed for three months or more from the date following the due date. Loans classified as Loans to borrowers in bankruptcy and Loans past due are excluded. Restructured loans are loans on which concessions (e.g. reduction of the stated interest rate, deferral of interest payment, extension of the maturity date, forgiveness of debt) are granted to borrowers in financial difficulties to assist them in their corporate restructuring or financial recovery by improving their ability to repay creditors. Restructured loans do not include loans classified as Loans to borrowers in bankruptcy, Loans past due, or Loans past due for three months or more.
*4. The value of assets pledged as collateral and collateralized corresponding debt obligations are as follows:(Yen in millions)
As of March 31, 2020 As of March 31, 2019
Assets pledged as collateralBank deposits 42,061 42,170Monetary receivables bought 24,559 20,089Securities 346,071 302,309Loans 125,181 13,345
Collateralized corresponding debt obligationsOutstanding claims 152,710 149,562Underwriting reserves 166,587 112,346Other liabilities (foreign reinsurance accounts payable, etc.) 73,658 58,682
5. The fair value of securities and other instruments received from securities borrowing transactions with cash collateral which the Company has the right to dispose of by sale and rehypothecation is as follows:They are wholly held by the Company.
(Yen in millions)
As of March 31, 2020 As of March 31, 2019
5,610 10,165
*6. Securities lent under loan agreements are as follows:(Yen in millions)
As of March 31, 2020 As of March 31, 2019
1,978,262 454,358
*7. The outstanding balance of undrawn loan commitments is as follows:(Yen in millions)
As of March 31, 2020 As of March 31, 2019
Total loan commitments 955,147 530,988Balance of drawn loan commitments 685,003 383,059Undrawn loan commitments 270,144 147,929
118
Notes to Consolidated Balance Sheet
Part4 | Fin
ancial D
ata
2020/09/17 18:08:12 / 20654695_東京海上ホールディングス株式会社_総会その他(C)
8. The amount of assets or liabilities in separate accounts as prescribed in Article 118 of the Insurance Business Act is as follows:(Yen in millions)
As of March 31, 2020 As of March 31, 2019
123,242 141,276
9. Tokio Marine & Nichido guarantees the liabilities of the following subsidiary.(Yen in millions)
As of March 31, 2020 As of March 31, 2019
Tokio Marine Compania de Seguros, S.A. de C.V. 5,884 17,592
*10. Subordinated term loans, included in Other liabilities, of which the repayment is subordinated to other obligations, are as follows:(Yen in millions)
As of March 31, 2020 As of March 31, 2019
100,000 100,000
Notes to Consolidated Statement of Income*1. Major components of business expenses are as follows:
(Yen in millions)
FY2019(April 1, 2019–March 31, 2020)
FY2018(April 1, 2018–March 31, 2019)
Agency commissions, etc. 598,016 577,592Salaries 303,785 311,321
Note: Business expenses consist of Loss adjustment expenses, Operating and general administrative expenses, and Agency commissions and brokerage as shown in the accompanying consolidated statement of income.
*2. Other extraordinary gains for the fiscal year 2018 were reversal of impairment losses on leased assets of 202 million yen and gains on business transfer recognized by subsidiaries and affiliates of 83 million yen.
*3. The Company recognized impairment losses on the following assets:
FY2019 (April 1, 2019–March 31, 2020)(Yen in millions)
Purpose of use Category LocationImpairment loss
Land Building Others Total
Properties for business use(General business(nursing care business))
Buildings3 properties,including buildingsin Setagaya-ku, Tokyo
— 3 15 18
Properties for business use(General business(other business))
Buildings, goodwilland other intangiblefixed assets
Fixtures attached tobuildings in Yokohama-City,Kanagawa
— 24 3,117 3,141
Properties for rent Land andbuildings
2 properties, includingbuildings in Aizuwakamatsu-City,Fukushima
92 190 — 283
Idle properties or propertiesplanned for sale
Land andbuildings
6 properties, includingbuildings in Numazu-City,Shizuoka
242 1,159 — 1,401
Idle assets Software — — — 1,540 1,540Total 335 1,377 4,673 6,386
Properties are classified as follows: (a) properties for use in insurance business and other businesses are grouped by each consolidated company and (b) other properties including properties for rent, idle properties, or properties planned for sale and properties for business use in general business (nursing care business) are grouped on an individual basis. The total amount of projected future cash flows generated from general business (nursing care business) fell below the book values of the properties used for this business. Consequently, the Company wrote off the excess of the book values of such properties over the recoverable amounts and recognized such write-offs as impairment losses in Extraordinary losses. The recoverable amount of the relevant property is calculated by discounting future cash flows at a rate of 6.0%. The Company wrote off the excess of the book values over the recoverable amounts of Goodwill and Other intangible fixed assets arising from business acquisition classified as properties for business use in general business (other business), and recognized any such write-offs as impairment losses in Extraordinary losses, as the Company no longer expects to earn the profits assumed in the business plan. The recoverable amount of the relevant assets is determined by value in use and calculated by discounting future cash flows at a rate of 7.0%. The Company wrote off the excess of the book values over the recoverable amount for properties for rent, mainly due to decline in property values, and recognized any such write-offs as impairment losses in Extraordinary losses. The recoverable amount of the relevant assets is the higher of the net sales price or value in use. Net sales price is the appraisal value by real estate appraisers less anticipated expenses for disposal of the relevant property.
119
Notes to Consolidated Balance Sheet、Notes to Consolidated Statement of Income

Consolidated Financial Statements
Tokio Marine Holdings, Inc. | Integrated Annual Report 2020
2020/09/17 18:08:12 / 20654695_東京海上ホールディングス株式会社_総会その他(C)
The Company wrote off the excess of the book values over the recoverable amount for certain idle properties or properties planned for sale, mainly due to the decision to sell the properties, and recognized any such write-offs as impairment losses in Extraordinary losses. The recoverable amount is the net sales price of each property. Net sales price is the appraisal value by real estate appraisers less anticipated expenses for disposal of the relevant property. The Company wrote off the entire book value of idle assets that are not expected to be used in the future, and recognized any such write-offs as impairment losses in Extraordinary losses.
FY2018 (April 1, 2018–March 31, 2019)(Yen in millions)
Purpose of use Category LocationImpairment loss
Land Building Others Total
Properties for business use(General business(nursing care business))
Land andbuildings
3 properties,including buildingsin Setagaya-ku, Tokyo
25 12 8 46
Properties for business use(General business(other business))
Buildings andother intangiblefixed assets
Fixtures attached to buildingsin Yokohama-City, Kanagawa — 19 1,656 1,675
Idle properties or propertiesplanned for sale
Land andbuildings
4 properties, includingtraining facilitiesin Inzai-City, Chiba
419 1,106 — 1,526
Total 445 1,138 1,664 3,248
Properties are classified as follows: (a) properties for use in insurance business and other businesses are grouped by each consolidated company and (b) other properties including properties for rent, idle properties, or properties planned for sale and properties for business use in general business (nursing care business) are grouped on an individual basis. The total amount of projected future cash flows generated from general business (nursing care business) fell below the book values of the properties used for this business. Consequently, the Company wrote off the excess of the book values of such properties over the recoverable amounts and recognized such write-offs as impairment losses in Extraordinary losses. The recoverable amount of the relevant property is calculated by discounting future cash flows at a rate of 6.0%. The Company re-estimated its future cash flows regarding Other intangible fixed assets arising from business acquisition classified as properties for business use in general business (other business), since the sales continued to be lower than expected. As a result, the Company wrote off the excess of the book values over the recoverable amount of certain properties as the future cash flows are not expected to be realized as originally planned, and recognized any such write-offs as impairment losses in Extraordinary losses. The recoverable amount of the relevant assets is determined by value in use and calculated by discounting future cash flows at a rate of 7.0%. The Company wrote off the excess of the book values over the recoverable amount for certain idle properties or properties planned for sale, mainly due to decline in property values, and recognized any such write-offs as impairment losses in Extraordinary losses. The recoverable amount is the net sales price of each property. Net sales price is the appraisal value by real estate appraisers less anticipated expenses for disposal of the relevant property.
120
Notes to Consolidated Statement of Income
Part4 | Fin
ancial D
ata
2020/09/17 18:08:12 / 20654695_東京海上ホールディングス株式会社_総会その他(C)
Notes to Consolidated Statement of Comprehensive Income* Reclassification adjustments and tax effects relating to Other comprehensive income
(Yen in millions)
FY2019(April 1, 2019–March 31, 2020)
FY2018(April 1, 2018–March 31, 2019)
Unrealized gains (losses) on available-for-sale securitiesAmount arising during the year (254,362) (161,892)Reclassification adjustment (96,639) (87,241)
Before tax effect adjustment (351,001) (249,133)Tax effect 106,656 60,806Unrealized gains (losses) on available-for-sale securities (244,344) (188,327)
Deferred gains (losses) on hedge transactionsAmount arising during the year 3,223 244Reclassification adjustment (1,285) (1,763)Adjustments of asset acquisition cost — (361)
Before tax effect adjustment 1,938 (1,881)Tax effect (543) 524Deferred gains (losses) on hedge transactions 1,394 (1,357)
Foreign currency translation adjustmentsAmount arising during the year (13,968) (61,990)Reclassification adjustment — 12,613
Foreign currency translation adjustments (13,968) (49,377)Remeasurements of defined benefit plans
Amount arising during the year (3,560) 10,368Reclassification adjustment 4,279 3,062
Before tax effect adjustment 718 13,430Tax effect (174) (3,753)Remeasurements of defined benefit plans 544 9,676
Share of other comprehensive income ofaffiliates accounted for by the equity methodAmount arising during the year (2,248) (3,498)Reclassification adjustment (478) 33
Share of other comprehensive income ofaffiliates accounted for by the equity method (2,726) (3,464)
Total other comprehensive income (259,100) (232,848)
121
Notes to Consolidated Statement of Comprehensive Income

Consolidated Financial Statements
Tokio Marine Holdings, Inc. | Integrated Annual Report 2020
2020/09/17 18:08:12 / 20654695_東京海上ホールディングス株式会社_総会その他(C)
Notes to Consolidated Statement of Changes in Shareholders’ EquityFY2019 (April 1, 2019–March 31, 2020)1. Type and number of issued stock and treasury stock
(Unit: thousand shares)
Number of sharesas of April 1, 2019
Increase duringthe fiscal year 2019
Decrease duringthe fiscal year 2019
Number of sharesas of March 31, 2020
Issued stockCommon stock 710,000 — 8,000 702,000
Total 710,000 — 8,000 702,000Treasury stock
Common stock 3,443 8,886 8,199 4,129Total 3,443 8,886 8,199 4,129
Note: 1. The decrease of 8,000 thousand shares of common stock is entirely attributable to the cancellation of treasury stock.2. The increase of 8,886 thousand shares of common stock is primarily attributable to the acquisition of 8,811 thousand shares of treasury stock conducted based on resolution by the
Board of Directors.3. The decrease of 8,199 thousand shares of common stock is primarily attributable to the cancellation of 8,000 thousand shares of treasury stock.
2. Stock acquisition rights (including those owned by the Company)
Category Nature of stock acquisition rights Amount as of March 31, 2020 (Yen in millions)
The Company (parent company) Stock acquisition rights as stock options 2,545
3. Dividends(1) Amount of dividends
Resolution Type of stock Amount ofdividends paid
Dividendsper share Record date Effective date
Ordinary general meetingof shareholders held onJune 24, 2019
Commonstock 63,590 million yen 90.00 yen March 31, 2019 June 25, 2019
Meeting of the Board ofDirectors held onNovember 19, 2019
Commonstock 91,292 million yen 130.00 yen September 30, 2019 December 6, 2019
Note: For dividends resolved at the meeting of the Board of Directors held on November 19, 2019, the amount of dividends per share consists of 95 yen of ordinary dividend and 35 yen of one-time dividend for the capital level adjustment.
(2) Dividends of which the record date falls within the fiscal year 2019, and the effective date falls after March 31, 2020
Resolution Type of stock Amount ofdividends paid
Source ofdividends
Dividendsper share Record date Effective date
Ordinary general meetingof shareholders held onJune 29, 2020
Commonstock 66,297 million yen Retained
earnings 95.00 yen March 31, 2020 June 30, 2020
FY2018 (April 1, 2018–March 31, 2019)1. Type and number of issued stock and treasury stock
(Unit: thousand shares)
Number of sharesas of April 1, 2018
Increase duringthe fiscal year 2018
Decrease duringthe fiscal year 2018
Number of sharesas of March 31, 2019
Issued stockCommon stock 748,024 — 38,024 710,000
Total 748,024 — 38,024 710,000Treasury stock
Common stock 22,591 19,135 38,283 3,443Total 22,591 19,135 38,283 3,443
Note: 1. The decrease of 38,024 thousand shares of common stock is entirely attributable to the cancellation of treasury stock.2. The increase of 19,135 thousand shares of common stock is primarily attributable to the acquisition of 19,039 thousand shares of treasury stock conducted based on resolution by the
Board of Directors.3. The decrease of 38,283 thousand shares of common stock is primarily attributable to the cancellation of 38,024 thousand shares of treasury stock.
122
Notes to Consolidated Statement of Changes in Shareholders’ Equity
Part4 | Fin
ancial D
ata
2020/09/17 18:08:12 / 20654695_東京海上ホールディングス株式会社_総会その他(C)
2. Stock acquisition rights (including those owned by the Company)
Category Nature of stock acquisition rights Amount as of March 31, 2019 (Yen in millions)
The Company (parent company) Stock acquisition rights as stock options 2,479
3. Dividends(1) Amount of dividends
Resolution Type of stock Amount ofdividends paid
Dividendsper share Record date Effective date
Ordinary general meetingof shareholders held onJune 25, 2018
Commonstock 58,034 million yen 80.00 yen March 31, 2018 June 26, 2018
Meeting of the Board ofDirectors held onNovember 19, 2018
Commonstock 114,601 million yen 160.00 yen September 30, 2018 December 11, 2018
Note: For dividends resolved at the meeting of the Board of Directors held on November 19, 2018, the amount of dividends per share consists of 90 yen of ordinary dividend and 70 yen of one-time dividend for the capital level adjustment.
(2) Dividends of which the record date falls within the fiscal year 2018, and the effective date falls after March 31, 2019
Resolution Type of stock Amount ofdividends paid
Source ofdividends
Dividendsper share Record date Effective date
Ordinary general meetingof shareholders held onJune 24, 2019
Commonstock 63,590 million yen Retained
earnings 90.00 yen March 31, 2019 June 25, 2019
Notes to Consolidated Statement of Cash Flows*1. Reconciliation of cash and cash equivalents to the amounts disclosed in the consolidated balance sheet is provided as follows:
(Yen in millions)
FY2019(April 1, 2019–March 31, 2020)
FY2018(April 1, 2018–March 31, 2019)
Cash and bank deposits 820,873 851,657Monetary receivables bought 1,363,752 1,468,952Securities 17,875,998 16,502,611Time deposits with initial term over three months to maturity (95,342) (92,183)Monetary receivables bought not included in cash equivalents (1,255,686) (1,309,355)Securities not included in cash equivalents (17,688,427) (16,398,340)Cash and cash equivalents 1,021,167 1,023,342
*2. Cash flows from investing activities include cash flows arising from asset management relating to insurance business.
*3. Assets and liabilities of a newly consolidated subsidiary through the acquisition of shares
FY2019 (April 1, 2019–March 31, 2020)The following table shows the main components of assets and liabilities assumed at the date of acquisition of Privilege Underwriters, Inc. ("Pure") and the connection between the acquisition cost of Pure and cash paid for the acquisition of shares (net of cash assumed).
(Yen in millions)
Total assets 372,980Securities 53,300Intangible fixed assets 244,249
Goodwill 163,910Total liabilities (158,805)
Insurance liabilities (45,980)Deferred tax liabilities (66,409)
Non-controlling interests (22,127)Others (14,916)Acquisition cost of Pure shares 341,041Foreign currency translation differences (1,014)Cash and cash equivalents held by Pure at the date of acquisition (9,347)Difference: Payments for the acquisition of Pure 330,679
123
Notes to Consolidated Statement of Changes in Shareholders’ Equity、Notes to Consolidated Statement of Cash Flows
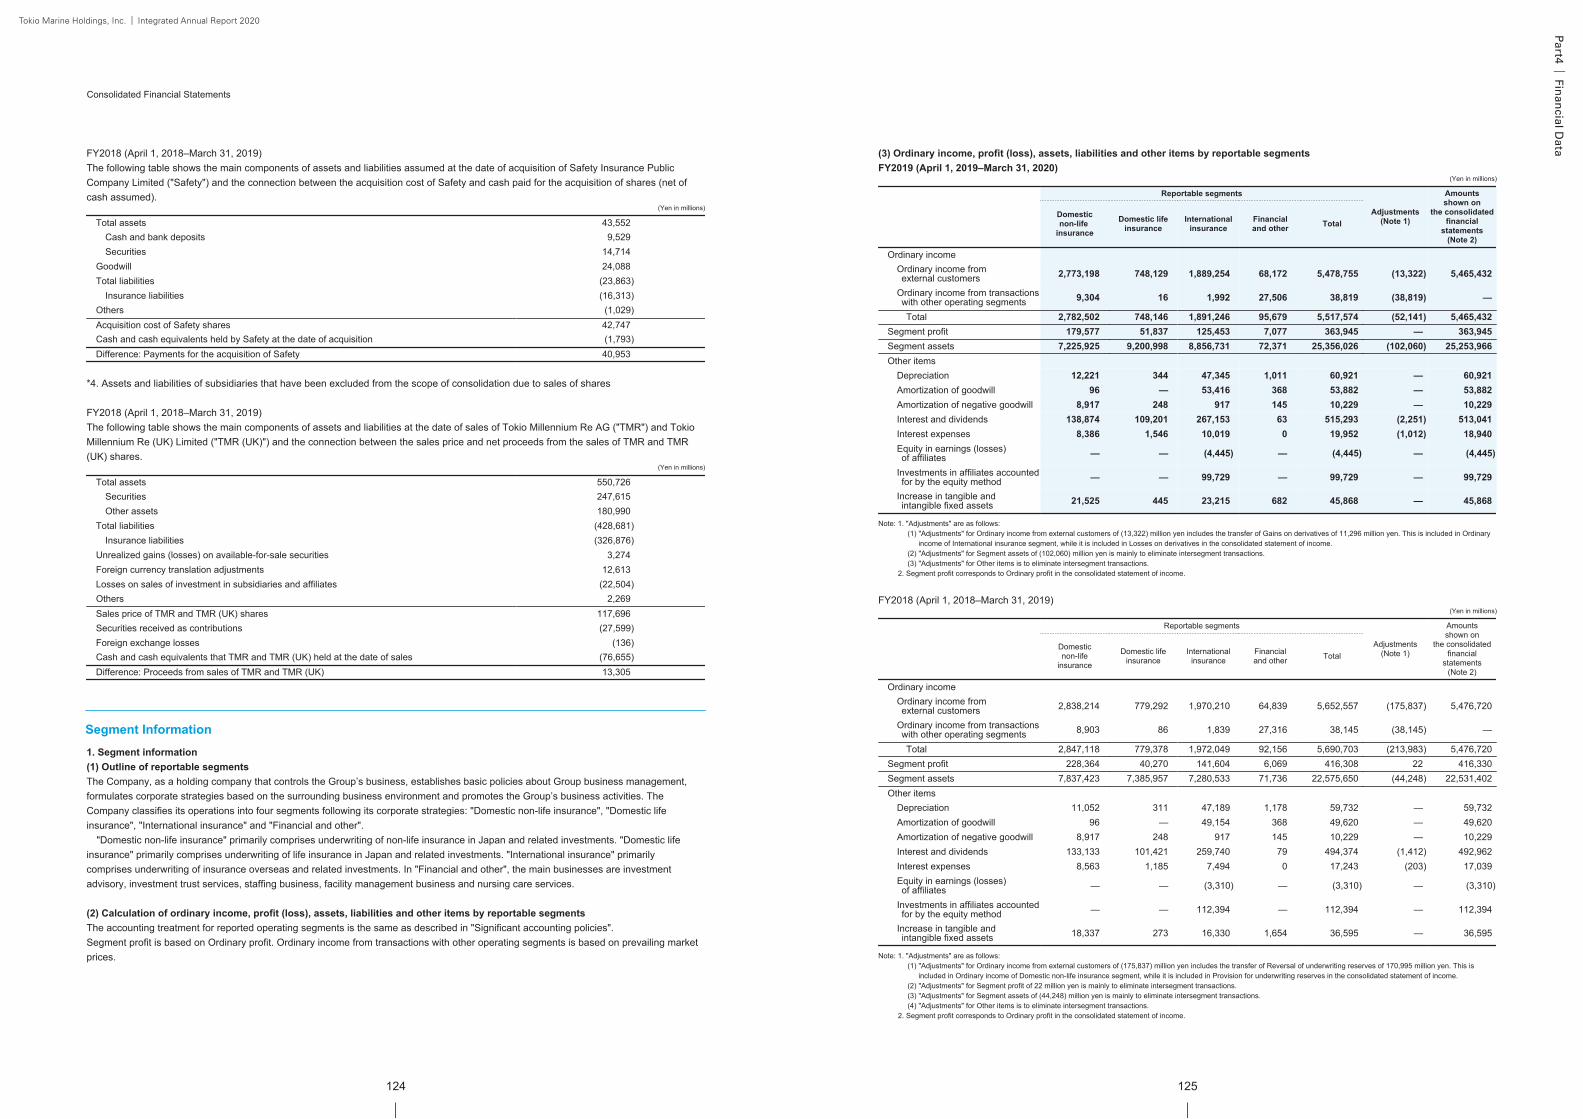
Consolidated Financial Statements
Tokio Marine Holdings, Inc. | Integrated Annual Report 2020
2020/09/17 18:08:12 / 20654695_東京海上ホールディングス株式会社_総会その他(C)
FY2018 (April 1, 2018–March 31, 2019)The following table shows the main components of assets and liabilities assumed at the date of acquisition of Safety Insurance Public Company Limited ("Safety") and the connection between the acquisition cost of Safety and cash paid for the acquisition of shares (net of cash assumed).
(Yen in millions)
Total assets 43,552Cash and bank deposits 9,529Securities 14,714
Goodwill 24,088Total liabilities (23,863)
Insurance liabilities (16,313)Others (1,029)Acquisition cost of Safety shares 42,747Cash and cash equivalents held by Safety at the date of acquisition (1,793)Difference: Payments for the acquisition of Safety 40,953
*4. Assets and liabilities of subsidiaries that have been excluded from the scope of consolidation due to sales of shares
FY2018 (April 1, 2018–March 31, 2019)The following table shows the main components of assets and liabilities at the date of sales of Tokio Millennium Re AG ("TMR") and Tokio Millennium Re (UK) Limited ("TMR (UK)") and the connection between the sales price and net proceeds from the sales of TMR and TMR (UK) shares.
(Yen in millions)
Total assets 550,726Securities 247,615Other assets 180,990
Total liabilities (428,681)Insurance liabilities (326,876)
Unrealized gains (losses) on available-for-sale securities 3,274Foreign currency translation adjustments 12,613Losses on sales of investment in subsidiaries and affiliates (22,504)Others 2,269Sales price of TMR and TMR (UK) shares 117,696Securities received as contributions (27,599)Foreign exchange losses (136)Cash and cash equivalents that TMR and TMR (UK) held at the date of sales (76,655)Difference: Proceeds from sales of TMR and TMR (UK) 13,305
Segment Information1. Segment information(1) Outline of reportable segmentsThe Company, as a holding company that controls the Group’s business, establishes basic policies about Group business management, formulates corporate strategies based on the surrounding business environment and promotes the Group’s business activities. The Company classifies its operations into four segments following its corporate strategies: "Domestic non-life insurance", "Domestic life insurance", "International insurance" and "Financial and other". "Domestic non-life insurance" primarily comprises underwriting of non-life insurance in Japan and related investments. "Domestic life insurance" primarily comprises underwriting of life insurance in Japan and related investments. "International insurance" primarily comprises underwriting of insurance overseas and related investments. In "Financial and other", the main businesses are investment advisory, investment trust services, staffing business, facility management business and nursing care services.
(2) Calculation of ordinary income, profit (loss), assets, liabilities and other items by reportable segmentsThe accounting treatment for reported operating segments is the same as described in "Significant accounting policies".Segment profit is based on Ordinary profit. Ordinary income from transactions with other operating segments is based on prevailing market prices.
124
Notes to Consolidated Statement of Cash Flows、Segment Information
Part4 | Fin
ancial D
ata
2020/09/17 18:08:12 / 20654695_東京海上ホールディングス株式会社_総会その他(C)
(3) Ordinary income, profit (loss), assets, liabilities and other items by reportable segmentsFY2019 (April 1, 2019–March 31, 2020)
(Yen in millions)
Reportable segments
Adjustments(Note 1)
Amountsshown on
the consolidatedfinancial
statements(Note 2)
Domesticnon-life
insurance
Domestic lifeinsurance
Internationalinsurance
Financialand other Total
Ordinary incomeOrdinary income fromexternal customers 2,773,198 748,129 1,889,254 68,172 5,478,755 (13,322) 5,465,432
Ordinary income from transactionswith other operating segments 9,304 16 1,992 27,506 38,819 (38,819) —
Total 2,782,502 748,146 1,891,246 95,679 5,517,574 (52,141) 5,465,432Segment profit 179,577 51,837 125,453 7,077 363,945 — 363,945Segment assets 7,225,925 9,200,998 8,856,731 72,371 25,356,026 (102,060) 25,253,966Other items
Depreciation 12,221 344 47,345 1,011 60,921 — 60,921Amortization of goodwill 96 — 53,416 368 53,882 — 53,882Amortization of negative goodwill 8,917 248 917 145 10,229 — 10,229Interest and dividends 138,874 109,201 267,153 63 515,293 (2,251) 513,041Interest expenses 8,386 1,546 10,019 0 19,952 (1,012) 18,940Equity in earnings (losses)of affiliates — — (4,445) — (4,445) — (4,445)
Investments in affiliates accountedfor by the equity method — — 99,729 — 99,729 — 99,729
Increase in tangible andintangible fixed assets 21,525 445 23,215 682 45,868 — 45,868
Note: 1. "Adjustments" are as follows:(1) "Adjustments" for Ordinary income from external customers of (13,322) million yen includes the transfer of Gains on derivatives of 11,296 million yen. This is included in Ordinary
income of International insurance segment, while it is included in Losses on derivatives in the consolidated statement of income.(2) "Adjustments" for Segment assets of (102,060) million yen is mainly to eliminate intersegment transactions.(3) "Adjustments" for Other items is to eliminate intersegment transactions.
2. Segment profit corresponds to Ordinary profit in the consolidated statement of income.
FY2018 (April 1, 2018–March 31, 2019)(Yen in millions)
Reportable segments
Adjustments(Note 1)
Amountsshown on
the consolidatedfinancial
statements(Note 2)
Domesticnon-life
insurance
Domestic lifeinsurance
Internationalinsurance
Financialand other Total
Ordinary incomeOrdinary income fromexternal customers 2,838,214 779,292 1,970,210 64,839 5,652,557 (175,837) 5,476,720
Ordinary income from transactionswith other operating segments 8,903 86 1,839 27,316 38,145 (38,145) —
Total 2,847,118 779,378 1,972,049 92,156 5,690,703 (213,983) 5,476,720Segment profit 228,364 40,270 141,604 6,069 416,308 22 416,330Segment assets 7,837,423 7,385,957 7,280,533 71,736 22,575,650 (44,248) 22,531,402Other items
Depreciation 11,052 311 47,189 1,178 59,732 — 59,732Amortization of goodwill 96 — 49,154 368 49,620 — 49,620Amortization of negative goodwill 8,917 248 917 145 10,229 — 10,229Interest and dividends 133,133 101,421 259,740 79 494,374 (1,412) 492,962Interest expenses 8,563 1,185 7,494 0 17,243 (203) 17,039Equity in earnings (losses)of affiliates — — (3,310) — (3,310) — (3,310)
Investments in affiliates accountedfor by the equity method — — 112,394 — 112,394 — 112,394
Increase in tangible andintangible fixed assets 18,337 273 16,330 1,654 36,595 — 36,595
Note: 1. "Adjustments" are as follows:(1) "Adjustments" for Ordinary income from external customers of (175,837) million yen includes the transfer of Reversal of underwriting reserves of 170,995 million yen. This is
included in Ordinary income of Domestic non-life insurance segment, while it is included in Provision for underwriting reserves in the consolidated statement of income.(2) "Adjustments" for Segment profit of 22 million yen is mainly to eliminate intersegment transactions.(3) "Adjustments" for Segment assets of (44,248) million yen is mainly to eliminate intersegment transactions.(4) "Adjustments" for Other items is to eliminate intersegment transactions.
2. Segment profit corresponds to Ordinary profit in the consolidated statement of income.
125
Segment Information
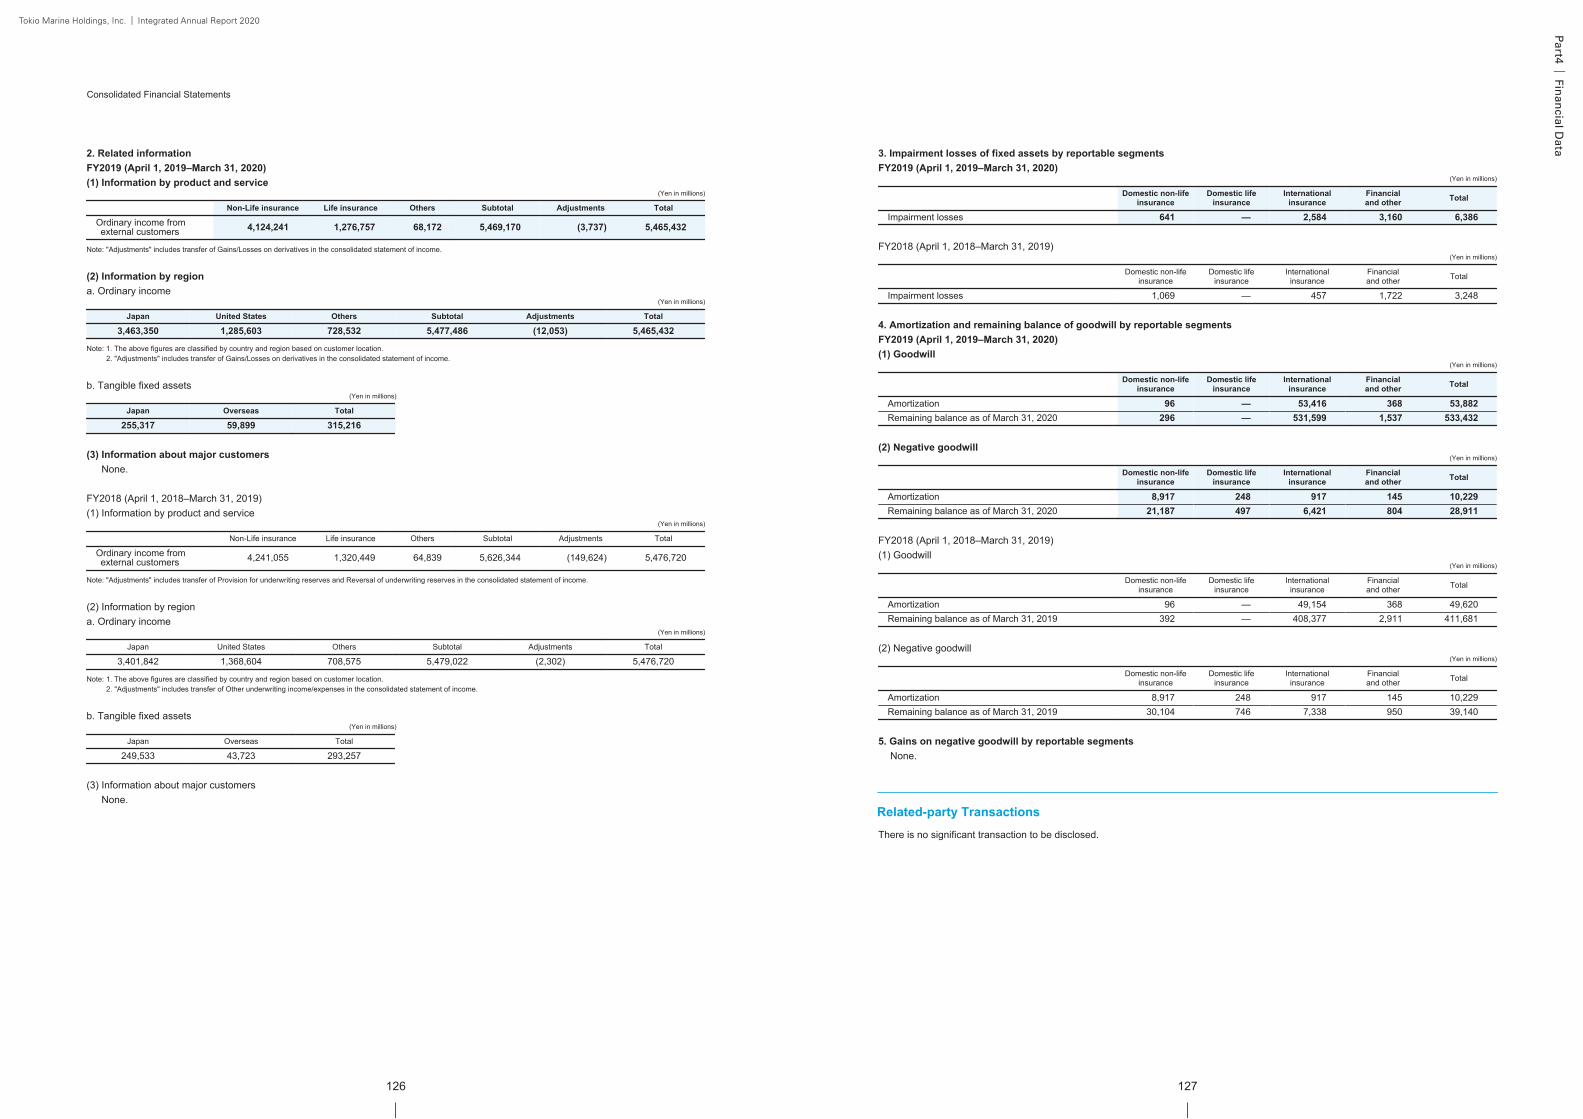
Consolidated Financial Statements
Tokio Marine Holdings, Inc. | Integrated Annual Report 2020
2020/09/17 18:08:12 / 20654695_東京海上ホールディングス株式会社_総会その他(C)
2. Related informationFY2019 (April 1, 2019–March 31, 2020)(1) Information by product and service
(Yen in millions)
Non-Life insurance Life insurance Others Subtotal Adjustments Total
Ordinary income fromexternal customers 4,124,241 1,276,757 68,172 5,469,170 (3,737) 5,465,432
Note: "Adjustments" includes transfer of Gains/Losses on derivatives in the consolidated statement of income.
(2) Information by regiona. Ordinary income
(Yen in millions)
Japan United States Others Subtotal Adjustments Total
3,463,350 1,285,603 728,532 5,477,486 (12,053) 5,465,432
Note: 1. The above figures are classified by country and region based on customer location.2. "Adjustments" includes transfer of Gains/Losses on derivatives in the consolidated statement of income.
b. Tangible fixed assets(Yen in millions)
Japan Overseas Total
255,317 59,899 315,216
(3) Information about major customersNone.
FY2018 (April 1, 2018–March 31, 2019)(1) Information by product and service
(Yen in millions)
Non-Life insurance Life insurance Others Subtotal Adjustments Total
Ordinary income fromexternal customers 4,241,055 1,320,449 64,839 5,626,344 (149,624) 5,476,720
Note: "Adjustments" includes transfer of Provision for underwriting reserves and Reversal of underwriting reserves in the consolidated statement of income.
(2) Information by regiona. Ordinary income
(Yen in millions)
Japan United States Others Subtotal Adjustments Total
3,401,842 1,368,604 708,575 5,479,022 (2,302) 5,476,720
Note: 1. The above figures are classified by country and region based on customer location.2. "Adjustments" includes transfer of Other underwriting income/expenses in the consolidated statement of income.
b. Tangible fixed assets(Yen in millions)
Japan Overseas Total
249,533 43,723 293,257
(3) Information about major customersNone.
126
Segment Information
Part4 | Fin
ancial D
ata
2020/09/17 18:08:12 / 20654695_東京海上ホールディングス株式会社_総会その他(C)
3. Impairment losses of fixed assets by reportable segmentsFY2019 (April 1, 2019–March 31, 2020)
(Yen in millions)
Domestic non-lifeinsurance
Domestic lifeinsurance
Internationalinsurance
Financialand other Total
Impairment losses 641 — 2,584 3,160 6,386
FY2018 (April 1, 2018–March 31, 2019)(Yen in millions)
Domestic non-lifeinsurance
Domestic lifeinsurance
Internationalinsurance
Financialand other Total
Impairment losses 1,069 — 457 1,722 3,248
4. Amortization and remaining balance of goodwill by reportable segmentsFY2019 (April 1, 2019–March 31, 2020)(1) Goodwill
(Yen in millions)
Domestic non-lifeinsurance
Domestic lifeinsurance
Internationalinsurance
Financialand other Total
Amortization 96 — 53,416 368 53,882Remaining balance as of March 31, 2020 296 — 531,599 1,537 533,432
(2) Negative goodwill(Yen in millions)
Domestic non-lifeinsurance
Domestic lifeinsurance
Internationalinsurance
Financialand other Total
Amortization 8,917 248 917 145 10,229Remaining balance as of March 31, 2020 21,187 497 6,421 804 28,911
FY2018 (April 1, 2018–March 31, 2019)(1) Goodwill
(Yen in millions)
Domestic non-lifeinsurance
Domestic lifeinsurance
Internationalinsurance
Financialand other Total
Amortization 96 — 49,154 368 49,620Remaining balance as of March 31, 2019 392 — 408,377 2,911 411,681
(2) Negative goodwill(Yen in millions)
Domestic non-lifeinsurance
Domestic lifeinsurance
Internationalinsurance
Financialand other Total
Amortization 8,917 248 917 145 10,229Remaining balance as of March 31, 2019 30,104 746 7,338 950 39,140
5. Gains on negative goodwill by reportable segmentsNone.
Related-party TransactionsThere is no significant transaction to be disclosed.
127
Segment Information

Consolidated Financial Statements
Tokio Marine Holdings, Inc. | Integrated Annual Report 2020
2020/09/17 18:08:12 / 20654695_東京海上ホールディングス株式会社_総会その他(C)
Lease TransactionsOperating leasesFuture lease payments related to non-cancelable operating leases
(Yen in millions)
As of March 31, 2020 As of March 31, 2019
As lessee:Due within one year 8,944 8,934Due after one year 51,542 45,209Total 60,486 54,143
As lessor:Due within one year 1,601 1,643Due after one year 9,537 9,557Total 11,138 11,201
Deferred Tax Accounting1. Major components of deferred tax assets and deferred tax liabilities
(Yen in millions)
As of March 31, 2020 As of March 31, 2019
Deferred tax assetsUnderwriting reserves 350,720 342,821Net defined benefit liabilities 70,320 68,831Outstanding claims 59,689 55,234Reserve for price fluctuation 32,957 30,271Impairment losses on securities 23,126 19,026Net operating loss carry forward (Note) 18,631 19,125Others 110,478 103,722
Subtotal 665,923 639,032Valuation allowance on net operating loss carry forward (Note) (15,702) (16,121)Valuation allowance on deducible temporary differences (30,162) (27,408)
Subtotal (45,864) (43,530)Total deferred tax assets 620,058 595,502Deferred tax liabilities
Unrealized gains on available-for-sale securities (543,993) (645,722)Unrealized gains on consolidated subsidiaries (186,801) (127,204)Others (95,042) (87,869)
Total deferred tax liabilities (825,838) (860,796)Net deferred tax assets (liabilities) (205,779) (265,294)
(Note) Schedule by expiration of net operating loss carry forward and the corresponding deferred tax assetsAs of March 31, 2020
(Yen in millions)
Within 1 year Over 1 to2 years
Over 2 to3 years
Over 3 to4 years
Over 4 to5 years Over 5 years Total
Net operating loss carry forward (*) 1,003 1,234 1,443 2,748 1,781 10,418 18,631Valuation allowance (1,003) (1,234) (1,443) (2,748) (1,781) (7,489) (15,702)Deferred tax assets — — — 0 — 2,928 2,929
(*) The amounts of net operating loss carry forward are calculated by using statutory income tax rate.
As of March 31, 2019(Yen in millions)
Within 1 year Over 1 to2 years
Over 2 to3 years
Over 3 to4 years
Over 4 to5 years Over 5 years Total
Net operating loss carry forward (*) 1,164 1,003 1,395 1,443 2,748 11,369 19,125Valuation allowance (1,164) (1,003) (1,234) (1,443) (2,748) (8,526) (16,121)Deferred tax assets — — 160 — — 2,842 3,003
(*) The amounts of net operating loss carry forward are calculated by using statutory income tax rate.
128
Lease Transactions、Deferred Tax Accounting
Part4 | Fin
ancial D
ata
2020/09/17 18:08:12 / 20654695_東京海上ホールディングス株式会社_総会その他(C)
2. Reconciliation of the statutory income tax rate and the effective tax rate after the application of deferred tax accounting when there is a significant difference
(%)
As of March 31, 2020 As of March 31, 2019
Japanese statutory tax rate 30.6 30.6(Adjustments)
Permanent differences such as dividends received (4.5) (4.4)Permanent differences such as entertainment expenses 0.9 1.0Tax rate applied to consolidated subsidiaries (4.9) (4.9)Amortization of goodwill and negative goodwill 3.8 2.8Valuation allowance 0.7 (0.5)Impact of sales of investment in subsidiaries and affiliates — 2.8Others (0.4) 1.1
Effective tax rate 26.1 28.5
Information on Financial Instruments1. Qualitative information on financial instruments(1) Investment policies
The core operation of the Group is its insurance business, and it invests utilizing the cash inflows mainly arising from insurance premiums. Therefore, the Group seeks to appropriately control risks based on the characteristics of insurance products primarily through ALM. We thereby aim to ensure stable, long-term earnings while realizing efficient management of liquidity. Specifically, our approach entails controlling interest risks associated with insurance liabilities by utilizing interest rate swaps and other transactions while assuming a certain degree of credit risks by investing in bonds with high credit ratings. At the same time, we are endeavoring to ensure medium-to-long-term earnings by dispersing risks and diversifying management asset methods in Japan and overseas through the utilization of a wide range of products including foreign securities and alternative investments. Foreign exchange forwards and other derivative transactions are used to mitigate risks associated with the Company’s asset portfolio. The Group also utilizes financial options as one of the ways to control risks related to variable annuities which guarantee minimum amounts of benefits which are not subject to the result of investment. Through these approaches, the Group aims to increase investment income in order to maximize net asset value in the medium-to-long-term and maintain financial soundness. With regard to financing, the Group issues corporate bonds and undertakes borrowings mainly to secure funds for investments. When financing is necessary, amounts and methodologies are determined based on the Group’s cash flow status.
(2) Details of financial instruments and their riskThe Group holds financial instruments including equity securities, bonds, and other securities; loans and derivatives. These instruments are exposed to market risk, which refers to the risk of losses arising from fluctuations in stock prices, exchange rates, interest rates, and other market indicators. They are also exposed to credit risk, which refers to the risk of losses when the value of an investment declines or is lost due to deterioration in the financial condition of the debtor. Other risks to which these instruments are exposed include market liquidity risk, which refers to the risk of losses that may occur from being unable to make transactions due to disorderly market conditions or being forced to make transactions at extremely unfavorable prices. Some currency risk is hedged through foreign exchange forwards, currency swaps and other such transactions. Hedge accounting is applied to some of these transactions.
129
Deferred Tax Accounting、Information on Financial Instruments

Consolidated Financial Statements
Tokio Marine Holdings, Inc. | Integrated Annual Report 2020
2020/09/17 18:08:12 / 20654695_東京海上ホールディングス株式会社_総会その他(C)
Credit risk associated with derivative transactions includes the risk of losses when the counterparties fail to fulfill their obligations due to insolvency or for other reasons. In order to reduce such credit risk, netting arrangements may be used with financial institutions and other counterparties with whom there are frequent transactions. Also, interest rate risk associated with long-term insurance liabilities is hedged by interest rate swaps and other transactions for which hedge accounting is applied in some cases. With regard to hedging instruments, hedged items, hedging policies and evaluation of hedge effectiveness, please refer to "Significant Accounting Policies - 4. Accounting policies - (7) Hedge accounting".
(3) Risk management structure(i) Market risk and credit risk management
Based on the "Investment risk management policy" established by the Board of Directors, Tokio Marine & Nichido executes risk management activities both quantitatively and qualitatively to control investment risk related to financial instruments, such as market risk and credit risk, at the risk management department, which is independent of trading departments. In accordance with the policy, "Investment guidelines" are established, which set the rules for which instruments to invest in, risk limits, and actions to take when limits are exceeded for each segment set in the annual investment plan. Investment risk is quantitatively measured using VaR-like concepts. Compliance with the guidelines and investment risk and return are reported on a regular basis to directors. Tokio Marine & Nichido appropriately manages credit risk by regularly monitoring the concentration and the status of issuers and borrowers using internal credit rating guidelines set by the "Guidelines for managing credit risk concentration". In order to control individual investments, Tokio Marine & Nichido also executes pre-investment review and post-investment monitoring according to the "Review guidelines" and others. Risk monitoring operations are regularly reported to the Board of Directors. Other consolidated subsidiaries maintain risk management structures based on the aforementioned risks.
(ii) Liquidity risk managementThe Group manages liquidity risk by controlling payment schedules and ensuring various ways of financing through treasury management by each consolidated subsidiary and by the Group as a whole.
(4) Supplementary information on fair value of financial instrumentsThe fair value of financial instruments is calculated in commonly used and recognized methodologies when market prices are not available. Such fair values are measured under certain assumptions, therefore they may differ under other assumptions.
130
Information on Financial Instruments
Part4 | Fin
ancial D
ata
2020/09/17 18:08:12 / 20654695_東京海上ホールディングス株式会社_総会その他(C)
2. Fair value of financial instrumentsThe table below shows carrying amounts shown on the consolidated balance sheet, fair value, and differences of financial instruments, excluding investment in non-consolidated subsidiaries and other instruments for which fair value cannot be measured reliably. (Refer to Note 2.)
As of March 31, 2020(Yen in millions)
Carrying amount shownon balance sheet Fair value Difference
(1) Cash and bank deposits 820,873 820,942 69(2) Receivables under resale agreements 999 999 —(3) Receivables under securities borrowing transactions 4,612 4,612 —(4) Monetary receivables bought 1,363,752 1,363,752 —(5) Money trusts 2,103 2,103 —(6) Securities
Trading securities 465,487 465,487 —Bonds held to maturity 5,092,780 5,985,487 892,707Bonds earmarked for underwriting reserves 1,859,815 1,870,691 10,876Available-for-sale securities 10,133,026 10,133,026 —
(7) Loans 1,396,273Allowance for doubtful accounts (*1) (3,052)
1,393,221 1,393,529 308Total financial assets 21,136,673 22,040,634 903,960(1) Corporate bonds 270,536 263,145 (7,391)(2) Payables under securities lending transactions 1,620,178 1,620,178 —Total financial liabilities 1,890,715 1,883,323 (7,391)
Derivative assets and liabilities (*2)
Hedge accounting not applied 28,504 28,504 —Hedge accounting applied 6,051 6,051 —
Total derivative assets and liabilities 34,555 34,555 —
(*1) Allowance for doubtful accounts earmarked for loans are deducted from the carrying amounts.(*2) Derivative assets and liabilities are presented on a net basis. Debits and credits arising from derivative transactions are netted. Net debits are shown in parentheses.
As of March 31, 2019(Yen in millions)
Carrying amount shownon balance sheet Fair value Difference
(1) Cash and bank deposits 851,657 851,708 51(2) Receivables under resale agreements 999 999 —(3) Receivables under securities borrowing transactions 9,084 9,084 —(4) Monetary receivables bought 1,468,952 1,468,952 —(5) Money trusts 2,156 2,156 —(6) Securities
Trading securities 373,044 373,044 —Bonds held to maturity 4,674,069 5,562,441 888,372Bonds earmarked for underwriting reserves 377,030 397,151 20,120Available-for-sale securities 10,615,751 10,615,751 —
(7) Loans 809,399Allowance for doubtful accounts (*1) (2,845)
806,554 807,413 858Total financial assets 19,179,300 20,088,703 909,402(1) Corporate bonds 57,514 56,559 (955)(2) Payables under securities lending transactions 197,623 197,623 —Total financial liabilities 255,138 254,182 (955)
Derivative assets and liabilities (*2)
Hedge accounting not applied 16,368 16,368 —Hedge accounting applied 8,242 8,242 —
Total derivative assets and liabilities 24,610 24,610 —
(*1) Allowance for doubtful accounts earmarked for loans are deducted from the carrying amounts.(*2) Derivative assets and liabilities are presented on a net basis. Debits and credits arising from derivative transactions are netted. Net debits are shown in parentheses.
131
Information on Financial Instruments
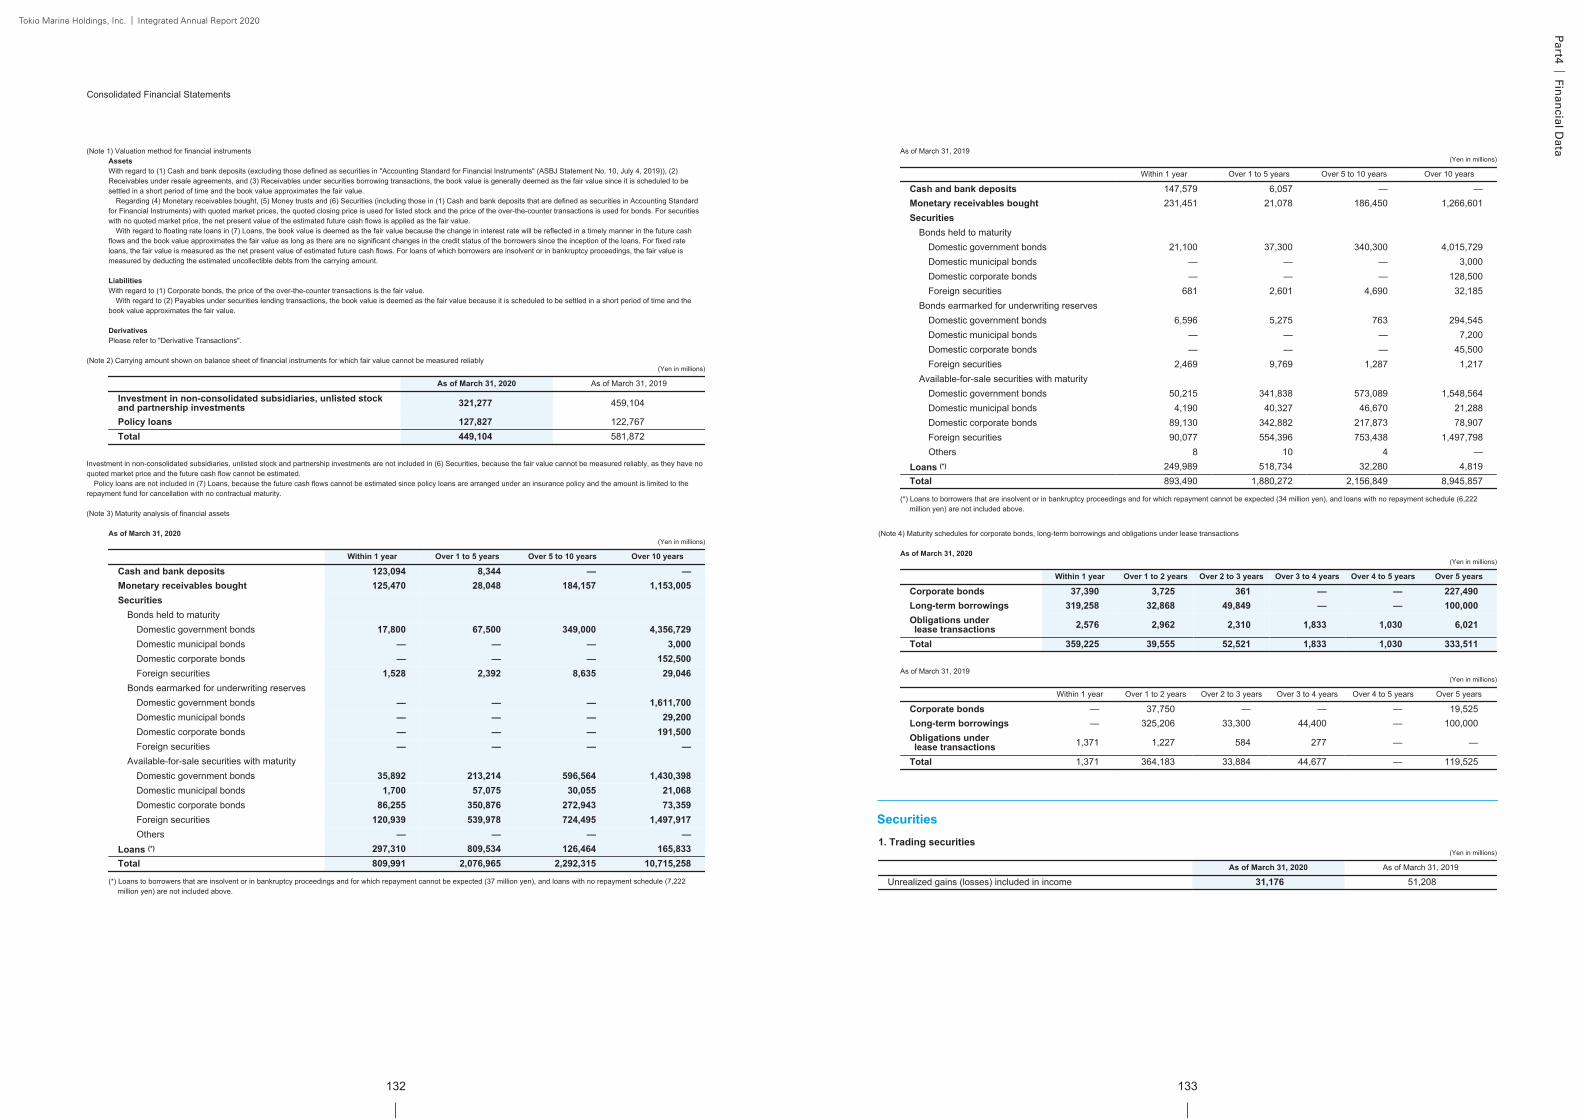
Consolidated Financial Statements
Tokio Marine Holdings, Inc. | Integrated Annual Report 2020
2020/09/17 18:08:12 / 20654695_東京海上ホールディングス株式会社_総会その他(C)
(Note 1) Valuation method for financial instrumentsAssetsWith regard to (1) Cash and bank deposits (excluding those defined as securities in "Accounting Standard for Financial Instruments" (ASBJ Statement No. 10, July 4, 2019)), (2) Receivables under resale agreements, and (3) Receivables under securities borrowing transactions, the book value is generally deemed as the fair value since it is scheduled to be settled in a short period of time and the book value approximates the fair value. Regarding (4) Monetary receivables bought, (5) Money trusts and (6) Securities (including those in (1) Cash and bank deposits that are defined as securities in Accounting Standard for Financial Instruments) with quoted market prices, the quoted closing price is used for listed stock and the price of the over-the-counter transactions is used for bonds. For securities with no quoted market price, the net present value of the estimated future cash flows is applied as the fair value. With regard to floating rate loans in (7) Loans, the book value is deemed as the fair value because the change in interest rate will be reflected in a timely manner in the future cash flows and the book value approximates the fair value as long as there are no significant changes in the credit status of the borrowers since the inception of the loans. For fixed rate loans, the fair value is measured as the net present value of estimated future cash flows. For loans of which borrowers are insolvent or in bankruptcy proceedings, the fair value is measured by deducting the estimated uncollectible debts from the carrying amount.
LiabilitiesWith regard to (1) Corporate bonds, the price of the over-the-counter transactions is the fair value. With regard to (2) Payables under securities lending transactions, the book value is deemed as the fair value because it is scheduled to be settled in a short period of time and the book value approximates the fair value.
DerivativesPlease refer to "Derivative Transactions".
(Note 2) Carrying amount shown on balance sheet of financial instruments for which fair value cannot be measured reliably(Yen in millions)
As of March 31, 2020 As of March 31, 2019
Investment in non-consolidated subsidiaries, unlisted stockand partnership investments 321,277 459,104
Policy loans 127,827 122,767Total 449,104 581,872
Investment in non-consolidated subsidiaries, unlisted stock and partnership investments are not included in (6) Securities, because the fair value cannot be measured reliably, as they have no quoted market price and the future cash flow cannot be estimated. Policy loans are not included in (7) Loans, because the future cash flows cannot be estimated since policy loans are arranged under an insurance policy and the amount is limited to the repayment fund for cancellation with no contractual maturity.
(Note 3) Maturity analysis of financial assets
As of March 31, 2020(Yen in millions)
Within 1 year Over 1 to 5 years Over 5 to 10 years Over 10 years
Cash and bank deposits 123,094 8,344 — —Monetary receivables bought 125,470 28,048 184,157 1,153,005Securities
Bonds held to maturityDomestic government bonds 17,800 67,500 349,000 4,356,729Domestic municipal bonds — — — 3,000Domestic corporate bonds — — — 152,500Foreign securities 1,528 2,392 8,635 29,046
Bonds earmarked for underwriting reservesDomestic government bonds — — — 1,611,700Domestic municipal bonds — — — 29,200Domestic corporate bonds — — — 191,500Foreign securities — — — —
Available-for-sale securities with maturityDomestic government bonds 35,892 213,214 596,564 1,430,398Domestic municipal bonds 1,700 57,075 30,055 21,068Domestic corporate bonds 86,255 350,876 272,943 73,359Foreign securities 120,939 539,978 724,495 1,497,917Others — — — —
Loans (*) 297,310 809,534 126,464 165,833Total 809,991 2,076,965 2,292,315 10,715,258
(*) Loans to borrowers that are insolvent or in bankruptcy proceedings and for which repayment cannot be expected (37 million yen), and loans with no repayment schedule (7,222 million yen) are not included above.
132
Information on Financial Instruments
Part4 | Fin
ancial D
ata
2020/09/17 18:08:12 / 20654695_東京海上ホールディングス株式会社_総会その他(C)
As of March 31, 2019(Yen in millions)
Within 1 year Over 1 to 5 years Over 5 to 10 years Over 10 years
Cash and bank deposits 147,579 6,057 — —Monetary receivables bought 231,451 21,078 186,450 1,266,601Securities
Bonds held to maturityDomestic government bonds 21,100 37,300 340,300 4,015,729Domestic municipal bonds — — — 3,000Domestic corporate bonds — — — 128,500Foreign securities 681 2,601 4,690 32,185
Bonds earmarked for underwriting reservesDomestic government bonds 6,596 5,275 763 294,545Domestic municipal bonds — — — 7,200Domestic corporate bonds — — — 45,500Foreign securities 2,469 9,769 1,287 1,217
Available-for-sale securities with maturityDomestic government bonds 50,215 341,838 573,089 1,548,564Domestic municipal bonds 4,190 40,327 46,670 21,288Domestic corporate bonds 89,130 342,882 217,873 78,907Foreign securities 90,077 554,396 753,438 1,497,798Others 8 10 4 —
Loans (*) 249,989 518,734 32,280 4,819Total 893,490 1,880,272 2,156,849 8,945,857
(*) Loans to borrowers that are insolvent or in bankruptcy proceedings and for which repayment cannot be expected (34 million yen), and loans with no repayment schedule (6,222 million yen) are not included above.
(Note 4) Maturity schedules for corporate bonds, long-term borrowings and obligations under lease transactions
As of March 31, 2020(Yen in millions)
Within 1 year Over 1 to 2 years Over 2 to 3 years Over 3 to 4 years Over 4 to 5 years Over 5 years
Corporate bonds 37,390 3,725 361 — — 227,490Long-term borrowings 319,258 32,868 49,849 — — 100,000Obligations underlease transactions 2,576 2,962 2,310 1,833 1,030 6,021
Total 359,225 39,555 52,521 1,833 1,030 333,511
As of March 31, 2019(Yen in millions)
Within 1 year Over 1 to 2 years Over 2 to 3 years Over 3 to 4 years Over 4 to 5 years Over 5 years
Corporate bonds — 37,750 — — — 19,525Long-term borrowings — 325,206 33,300 44,400 — 100,000Obligations underlease transactions 1,371 1,227 584 277 — —
Total 1,371 364,183 33,884 44,677 — 119,525
Securities1. Trading securities
(Yen in millions)
As of March 31, 2020 As of March 31, 2019
Unrealized gains (losses) included in income 31,176 51,208
133
Information on Financial Instruments、Securities
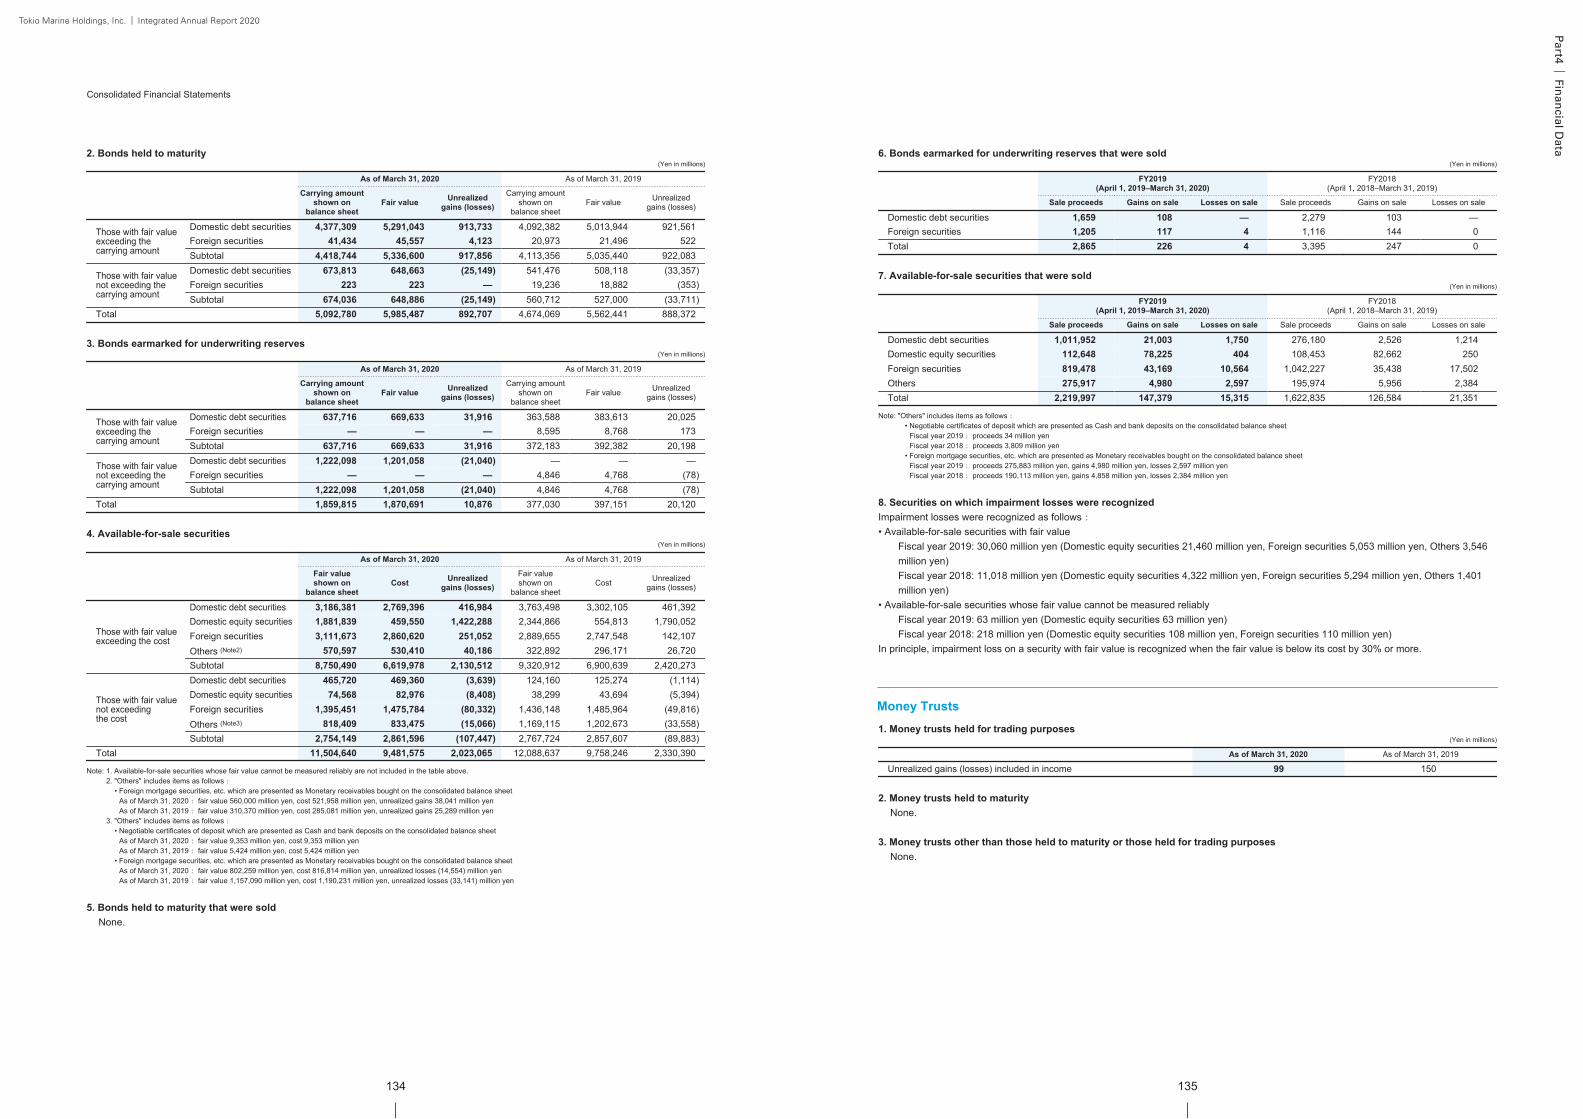
Consolidated Financial Statements
Tokio Marine Holdings, Inc. | Integrated Annual Report 2020
2020/09/17 18:08:12 / 20654695_東京海上ホールディングス株式会社_総会その他(C)
2. Bonds held to maturity(Yen in millions)
As of March 31, 2020 As of March 31, 2019
Carrying amountshown on
balance sheetFair value Unrealized
gains (losses)
Carrying amountshown on
balance sheetFair value Unrealized
gains (losses)
Those with fair valueexceeding thecarrying amount
Domestic debt securities 4,377,309 5,291,043 913,733 4,092,382 5,013,944 921,561Foreign securities 41,434 45,557 4,123 20,973 21,496 522Subtotal 4,418,744 5,336,600 917,856 4,113,356 5,035,440 922,083
Those with fair valuenot exceeding thecarrying amount
Domestic debt securities 673,813 648,663 (25,149) 541,476 508,118 (33,357)Foreign securities 223 223 — 19,236 18,882 (353)Subtotal 674,036 648,886 (25,149) 560,712 527,000 (33,711)
Total 5,092,780 5,985,487 892,707 4,674,069 5,562,441 888,372
3. Bonds earmarked for underwriting reserves(Yen in millions)
As of March 31, 2020 As of March 31, 2019
Carrying amountshown on
balance sheetFair value Unrealized
gains (losses)
Carrying amountshown on
balance sheetFair value Unrealized
gains (losses)
Those with fair valueexceeding thecarrying amount
Domestic debt securities 637,716 669,633 31,916 363,588 383,613 20,025Foreign securities — — — 8,595 8,768 173Subtotal 637,716 669,633 31,916 372,183 392,382 20,198
Those with fair valuenot exceeding thecarrying amount
Domestic debt securities 1,222,098 1,201,058 (21,040) — — —Foreign securities — — — 4,846 4,768 (78)Subtotal 1,222,098 1,201,058 (21,040) 4,846 4,768 (78)
Total 1,859,815 1,870,691 10,876 377,030 397,151 20,120
4. Available-for-sale securities(Yen in millions)
As of March 31, 2020 As of March 31, 2019
Fair valueshown on
balance sheetCost Unrealized
gains (losses)
Fair valueshown on
balance sheetCost Unrealized
gains (losses)
Those with fair valueexceeding the cost
Domestic debt securities 3,186,381 2,769,396 416,984 3,763,498 3,302,105 461,392Domestic equity securities 1,881,839 459,550 1,422,288 2,344,866 554,813 1,790,052Foreign securities 3,111,673 2,860,620 251,052 2,889,655 2,747,548 142,107Others (Note2) 570,597 530,410 40,186 322,892 296,171 26,720Subtotal 8,750,490 6,619,978 2,130,512 9,320,912 6,900,639 2,420,273
Those with fair valuenot exceedingthe cost
Domestic debt securities 465,720 469,360 (3,639) 124,160 125,274 (1,114)Domestic equity securities 74,568 82,976 (8,408) 38,299 43,694 (5,394)Foreign securities 1,395,451 1,475,784 (80,332) 1,436,148 1,485,964 (49,816)Others (Note3) 818,409 833,475 (15,066) 1,169,115 1,202,673 (33,558)Subtotal 2,754,149 2,861,596 (107,447) 2,767,724 2,857,607 (89,883)
Total 11,504,640 9,481,575 2,023,065 12,088,637 9,758,246 2,330,390
Note: 1. Available-for-sale securities whose fair value cannot be measured reliably are not included in the table above.2. "Others" includes items as follows:
• Foreign mortgage securities, etc. which are presented as Monetary receivables bought on the consolidated balance sheetAs of March 31, 2020: fair value 560,000 million yen, cost 521,958 million yen, unrealized gains 38,041 million yenAs of March 31, 2019: fair value 310,370 million yen, cost 285,081 million yen, unrealized gains 25,289 million yen
3. "Others" includes items as follows:• Negotiable certificates of deposit which are presented as Cash and bank deposits on the consolidated balance sheet
As of March 31, 2020: fair value 9,353 million yen, cost 9,353 million yenAs of March 31, 2019: fair value 5,424 million yen, cost 5,424 million yen
• Foreign mortgage securities, etc. which are presented as Monetary receivables bought on the consolidated balance sheetAs of March 31, 2020: fair value 802,259 million yen, cost 816,814 million yen, unrealized losses (14,554) million yenAs of March 31, 2019: fair value 1,157,090 million yen, cost 1,190,231 million yen, unrealized losses (33,141) million yen
5. Bonds held to maturity that were soldNone.
134
Securities
Part4 | Fin
ancial D
ata
2020/09/17 18:08:12 / 20654695_東京海上ホールディングス株式会社_総会その他(C)
6. Bonds earmarked for underwriting reserves that were sold(Yen in millions)
FY2019(April 1, 2019–March 31, 2020)
FY2018(April 1, 2018–March 31, 2019)
Sale proceeds Gains on sale Losses on sale Sale proceeds Gains on sale Losses on sale
Domestic debt securities 1,659 108 — 2,279 103 —Foreign securities 1,205 117 4 1,116 144 0Total 2,865 226 4 3,395 247 0
7. Available-for-sale securities that were sold(Yen in millions)
FY2019(April 1, 2019–March 31, 2020)
FY2018(April 1, 2018–March 31, 2019)
Sale proceeds Gains on sale Losses on sale Sale proceeds Gains on sale Losses on sale
Domestic debt securities 1,011,952 21,003 1,750 276,180 2,526 1,214Domestic equity securities 112,648 78,225 404 108,453 82,662 250Foreign securities 819,478 43,169 10,564 1,042,227 35,438 17,502Others 275,917 4,980 2,597 195,974 5,956 2,384Total 2,219,997 147,379 15,315 1,622,835 126,584 21,351
Note: "Others" includes items as follows:• Negotiable certificates of deposit which are presented as Cash and bank deposits on the consolidated balance sheet
Fiscal year 2019: proceeds 34 million yenFiscal year 2018: proceeds 3,809 million yen
• Foreign mortgage securities, etc. which are presented as Monetary receivables bought on the consolidated balance sheetFiscal year 2019: proceeds 275,883 million yen, gains 4,980 million yen, losses 2,597 million yenFiscal year 2018: proceeds 190,113 million yen, gains 4,858 million yen, losses 2,384 million yen
8. Securities on which impairment losses were recognizedImpairment losses were recognized as follows:• Available-for-sale securities with fair value
Fiscal year 2019: 30,060 million yen (Domestic equity securities 21,460 million yen, Foreign securities 5,053 million yen, Others 3,546 million yen)Fiscal year 2018: 11,018 million yen (Domestic equity securities 4,322 million yen, Foreign securities 5,294 million yen, Others 1,401 million yen)
• Available-for-sale securities whose fair value cannot be measured reliablyFiscal year 2019: 63 million yen (Domestic equity securities 63 million yen)Fiscal year 2018: 218 million yen (Domestic equity securities 108 million yen, Foreign securities 110 million yen)
In principle, impairment loss on a security with fair value is recognized when the fair value is below its cost by 30% or more.
Money Trusts1. Money trusts held for trading purposes
(Yen in millions)
As of March 31, 2020 As of March 31, 2019
Unrealized gains (losses) included in income 99 150
2. Money trusts held to maturityNone.
3. Money trusts other than those held to maturity or those held for trading purposesNone.
135
Securities、Money Trusts

Consolidated Financial Statements
Tokio Marine Holdings, Inc. | Integrated Annual Report 2020
2020/09/17 18:08:12 / 20654695_東京海上ホールディングス株式会社_総会その他(C)
Derivative Transactions"Principal amount" as shown in the tables is the nominal contract amount or notional principal amount of derivative transactions. The amount itself does not represent the market or credit risk of such derivative transactions.
1. Derivative transactions to which hedge accounting is not applied(1) Foreign currency-related instruments
(Yen in millions)
As of March 31, 2020 As of March 31, 2019
Principal amountFair value Unrealized
gains (losses)Principal amount
Fair value Unrealizedgains (losses)Over 1 year Over 1 year
Markettransactions
Currency futuresShort 1,927 — — — 1,903 — — —Long 873 — — — 122 — — —
Over-the-countertransactions
Foreign exchangeforwards
Short 554,872 — 1,429 1,429 477,431 420 3,784 3,784Long 179,463 — (75) (75) 70,970 — (366) (366)
Currency swapsPay foreign/Rec. yen 12,435 12,435 1,136 1,136 12,435 12,435 56 56Pay foreign/Rec. foreign 45,008 — (1,597) (1,597) 18,932 — (10) (10)
Total — — 893 893 — — 3,464 3,464
Note: 1. The fair value of currency futures is based on the closing prices in principal markets.2. The fair value of foreign exchange forwards is mainly based on the prices calculated from forward markets or obtained from counterparties.3. The fair value of currency swaps is mainly based on prices obtained from external vendors or the prices measured by discounting estimated future cash flows to present value.
(2) Interest rate-related instruments(Yen in millions)
As of March 31, 2020 As of March 31, 2019
Principal amountFair value Unrealized
gains (losses)Principal amount
Fair value Unrealizedgains (losses)Over 1 year Over 1 year
Markettransactions
Interest rate futuresShort 17,341 — — — 272,780 162,370 (705) (705)Long 1,737 — — — 2,061 — — —
Over-the-countertransactions
Interest rate swapsRec. fix/Pay float 1,510,149 1,439,332 131,746 131,746 1,251,600 1,173,768 112,273 112,273Rec. float/Pay fix 1,295,487 1,208,210 (117,720) (117,720) 1,160,559 1,100,727 (97,005) (97,005)Rec. float/Pay float 270,677 5,485 427 427 276,152 276,152 (349) (349)Rec. fix/Pay fix — — — — 128 — (142) (142)
Total — — 14,453 14,453 — — 14,071 14,071
Note: 1. The fair value of interest rate futures is based on the closing prices in principal markets.2. The fair value of interest rate swaps is mainly measured by discounting estimated future cash flows to present value based on the interest rates at the end of period or is based on
prices obtained from external vendors.
(3) Equity-related instruments(Yen in millions)
As of March 31, 2020 As of March 31, 2019
Principal amountFair value Unrealized
gains (losses)Principal amount
Fair value Unrealizedgains (losses)Over 1 year Over 1 year
Markettransactions
Equity index futuresShort 6,977 — (168) (168) 14,337 — (103) (103)Long 2,179 — — — 1,355 — (1) (1)
Over-the-countertransactions
Equity index optionsShort 111,722 — 145,488 —
[5,487] [—] 14,241 (8,754) [5,102] [—] 929 4,172Long 163,099 3,000 213,915 4,500
[15,687] [1,166] 29,829 14,141 [15,522] [1,720] 3,171 (12,351)Total — — 43,902 5,218 — — 3,995 (8,283)
Note: 1. The fair value of equity index futures is based on the closing prices in principal markets.2. The fair value of equity index options is mainly based on prices obtained from external vendors.3. For option contracts, the figures below the principal amount denoted with [ ] are option premiums.
136
Derivative Transactions
Part4 | Fin
ancial D
ata
2020/09/17 18:08:12 / 20654695_東京海上ホールディングス株式会社_総会その他(C)
(4) Bond-related instruments(Yen in millions)
As of March 31, 2020 As of March 31, 2019
Principal amountFair value Unrealized
gains (losses)Principal amount
Fair value Unrealizedgains (losses)Over 1 year Over 1 year
Markettransactions
Bond futuresShort 5,112 — (158) (158) 136,101 — (1,855) (1,855)Long 152 — 0 0 38,180 — 292 292
Over-the-countertransactions
Bond over-the-counteroptions
Short 352,007 — 91,664 —[2,312] [—] 3,184 (872) [310] [—] 403 (93)
Long 352,007 — 91,664 —[2,231] [—] 3,404 1,173 [338] [—] 427 88
Total — — 6,430 142 — — (732) (1,568)
Note: 1. The fair value of bond futures is based on the closing prices in principal markets.2. The fair value of bond over-the-counter options is mainly based on prices obtained from external vendors.3. For option contracts, the figures below the principal amount denoted with [ ] are option premiums.
(5) Commodity-related instruments(Yen in millions)
As of March 31, 2020 As of March 31, 2019
Principal amountFair value Unrealized
gains (losses)Principal amount
Fair value Unrealizedgains (losses)Over 1 year Over 1 year
Markettransactions
Commodity futuresShort 871 — — — 911 — — —Long 327 — — — 586 — — —
Total — — — — — — — —
Note: The fair value of commodity futures is based on the closing prices in principal markets.
(6) Others(Yen in millions)
As of March 31, 2020 As of March 31, 2019
Principal amountFair value Unrealized
gains (losses)Principal amount
Fair value Unrealizedgains (losses)Over 1 year Over 1 year
Over-the-countertransactions
Natural catastrophederivatives
Short 30,313 16,121 30,929 6,519[1,967] [853] 2,145 (177) [2,522] [915] 1,269 1,253
Long 19,000 15,000 19,000 4,000[452] [333] 23 (428) [641] [—] (47) (689)
Weather derivativesShort 13 — 19 —
[1] [—] 0 0 [2] [—] 2 0Others
Short 21,912 21,912 22,200 22,200[2,519] [2,519] 1,172 1,347 [2,553] [2,553] 1,445 1,107
Long 10,708 10,708 11,339 11,339[1,133] [1,133] 970 (163) [1,148] [1,148] 1,001 (147)
Total — — 4,313 578 — — 3,670 1,524
Note: 1. The fair value of natural catastrophe derivatives is measured using an internal valuation model or based on option premiums.2. The fair value of weather derivatives is measured considering weather conditions, terms of contracts, and other components.3. The fair value of others is measured using an internal valuation model.4. For option contracts, the figures below the principal amount denoted with [ ] are option premiums.
137
Derivative Transactions
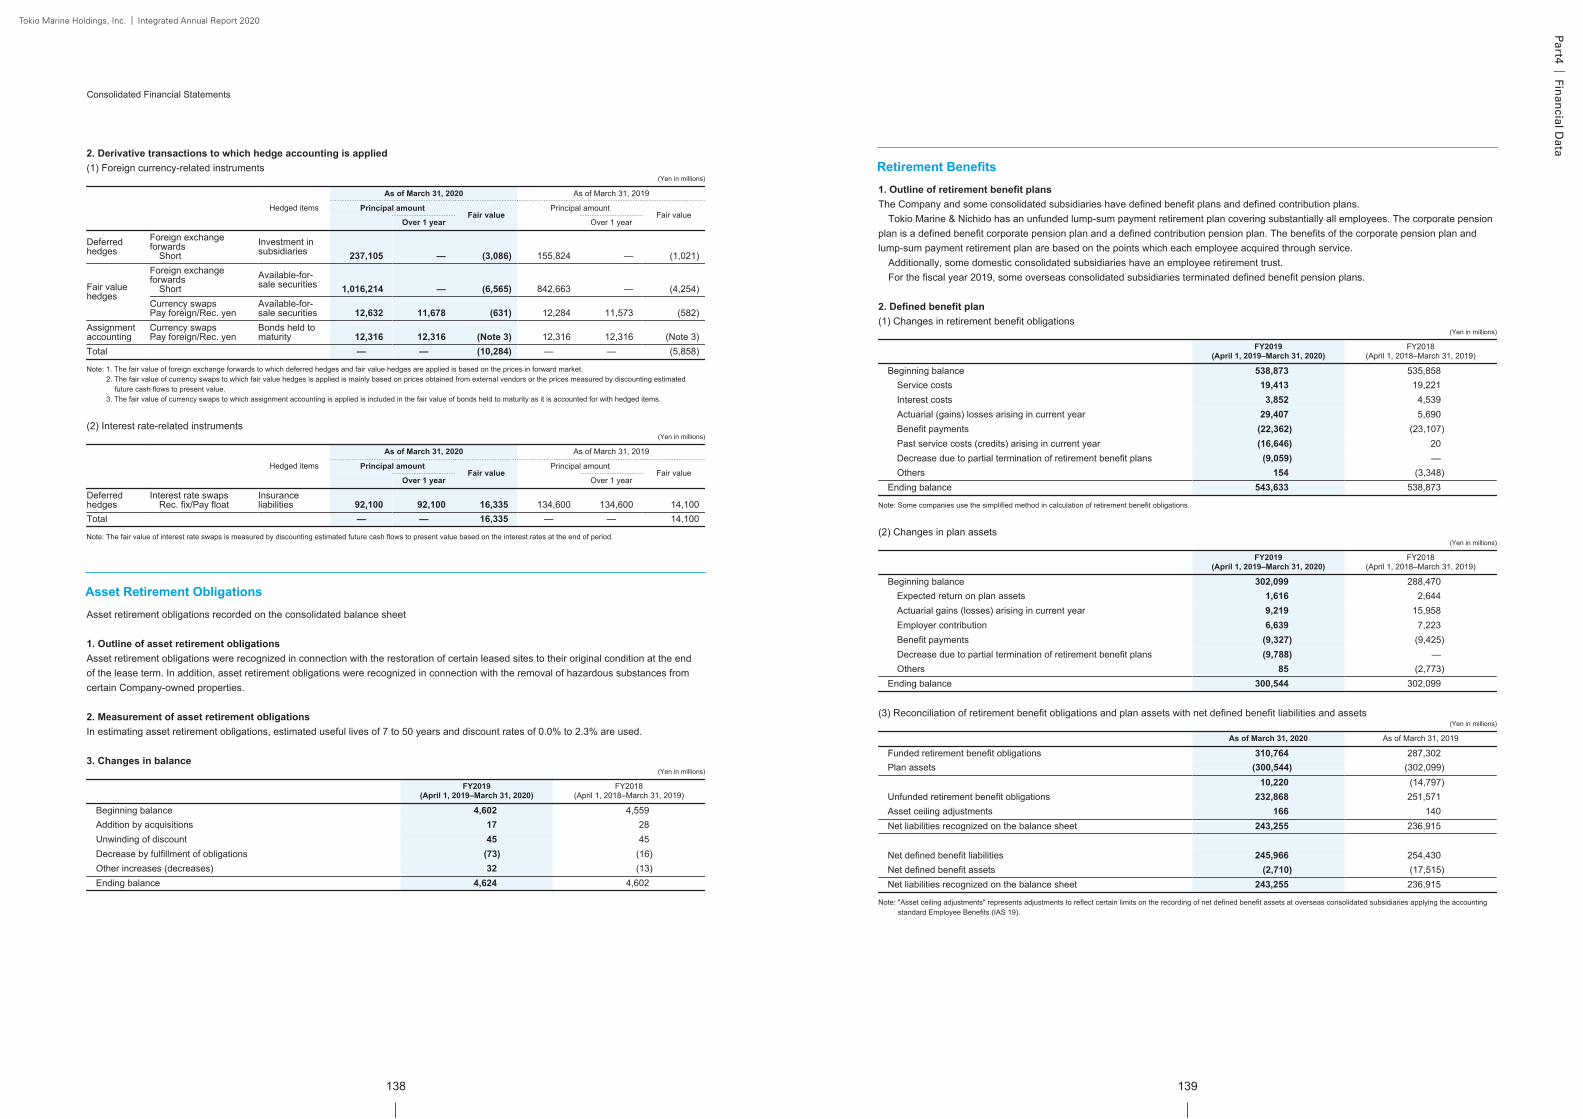
Consolidated Financial Statements
Tokio Marine Holdings, Inc. | Integrated Annual Report 2020
2020/09/17 18:08:12 / 20654695_東京海上ホールディングス株式会社_総会その他(C)
2. Derivative transactions to which hedge accounting is applied(1) Foreign currency-related instruments
(Yen in millions)
Hedged items
As of March 31, 2020 As of March 31, 2019
Principal amountFair value
Principal amountFair value
Over 1 year Over 1 year
Deferredhedges
Foreign exchangeforwards
ShortInvestment insubsidiaries 237,105 — (3,086) 155,824 — (1,021)
Fair valuehedges
Foreign exchangeforwards
ShortAvailable-for-sale securities 1,016,214 — (6,565) 842,663 — (4,254)
Currency swapsPay foreign/Rec. yen
Available-for-sale securities 12,632 11,678 (631) 12,284 11,573 (582)
Assignmentaccounting
Currency swapsPay foreign/Rec. yen
Bonds held to maturity 12,316 12,316 (Note 3) 12,316 12,316 (Note 3)
Total — — (10,284) — — (5,858)
Note: 1. The fair value of foreign exchange forwards to which deferred hedges and fair value hedges are applied is based on the prices in forward market.2. The fair value of currency swaps to which fair value hedges is applied is mainly based on prices obtained from external vendors or the prices measured by discounting estimated
future cash flows to present value.3. The fair value of currency swaps to which assignment accounting is applied is included in the fair value of bonds held to maturity as it is accounted for with hedged items.
(2) Interest rate-related instruments(Yen in millions)
Hedged items
As of March 31, 2020 As of March 31, 2019
Principal amountFair value
Principal amountFair value
Over 1 year Over 1 year
Deferredhedges
Interest rate swaps Rec. fix/Pay float
Insuranceliabilities 92,100 92,100 16,335 134,600 134,600 14,100
Total — — 16,335 — — 14,100
Note: The fair value of interest rate swaps is measured by discounting estimated future cash flows to present value based on the interest rates at the end of period.
Asset Retirement ObligationsAsset retirement obligations recorded on the consolidated balance sheet
1. Outline of asset retirement obligationsAsset retirement obligations were recognized in connection with the restoration of certain leased sites to their original condition at the end of the lease term. In addition, asset retirement obligations were recognized in connection with the removal of hazardous substances from certain Company-owned properties.
2. Measurement of asset retirement obligationsIn estimating asset retirement obligations, estimated useful lives of 7 to 50 years and discount rates of 0.0% to 2.3% are used.
3. Changes in balance(Yen in millions)
FY2019(April 1, 2019–March 31, 2020)
FY2018(April 1, 2018–March 31, 2019)
Beginning balance 4,602 4,559Addition by acquisitions 17 28Unwinding of discount 45 45Decrease by fulfillment of obligations (73) (16)Other increases (decreases) 32 (13)Ending balance 4,624 4,602
138
Derivative Transactions、Asset Retirement Obligations
Part4 | Fin
ancial D
ata
2020/09/17 18:08:12 / 20654695_東京海上ホールディングス株式会社_総会その他(C)
Retirement Benefits1. Outline of retirement benefit plansThe Company and some consolidated subsidiaries have defined benefit plans and defined contribution plans. Tokio Marine & Nichido has an unfunded lump-sum payment retirement plan covering substantially all employees. The corporate pension plan is a defined benefit corporate pension plan and a defined contribution pension plan. The benefits of the corporate pension plan and lump-sum payment retirement plan are based on the points which each employee acquired through service. Additionally, some domestic consolidated subsidiaries have an employee retirement trust. For the fiscal year 2019, some overseas consolidated subsidiaries terminated defined benefit pension plans.
2. Defined benefit plan(1) Changes in retirement benefit obligations
(Yen in millions)
FY2019(April 1, 2019–March 31, 2020)
FY2018(April 1, 2018–March 31, 2019)
Beginning balance 538,873 535,858Service costs 19,413 19,221Interest costs 3,852 4,539Actuarial (gains) losses arising in current year 29,407 5,690Benefit payments (22,362) (23,107)Past service costs (credits) arising in current year (16,646) 20Decrease due to partial termination of retirement benefit plans (9,059) —Others 154 (3,348)
Ending balance 543,633 538,873
Note: Some companies use the simplified method in calculation of retirement benefit obligations.
(2) Changes in plan assets(Yen in millions)
FY2019(April 1, 2019–March 31, 2020)
FY2018(April 1, 2018–March 31, 2019)
Beginning balance 302,099 288,470Expected return on plan assets 1,616 2,644Actuarial gains (losses) arising in current year 9,219 15,958Employer contribution 6,639 7,223Benefit payments (9,327) (9,425)Decrease due to partial termination of retirement benefit plans (9,788) —Others 85 (2,773)
Ending balance 300,544 302,099
(3) Reconciliation of retirement benefit obligations and plan assets with net defined benefit liabilities and assets(Yen in millions)
As of March 31, 2020 As of March 31, 2019
Funded retirement benefit obligations 310,764 287,302Plan assets (300,544) (302,099)
10,220 (14,797)Unfunded retirement benefit obligations 232,868 251,571Asset ceiling adjustments 166 140Net liabilities recognized on the balance sheet 243,255 236,915
Net defined benefit liabilities 245,966 254,430Net defined benefit assets (2,710) (17,515)Net liabilities recognized on the balance sheet 243,255 236,915
Note: "Asset ceiling adjustments" represents adjustments to reflect certain limits on the recording of net defined benefit assets at overseas consolidated subsidiaries applying the accounting standard Employee Benefits (IAS 19).
139
Retirement Benefits
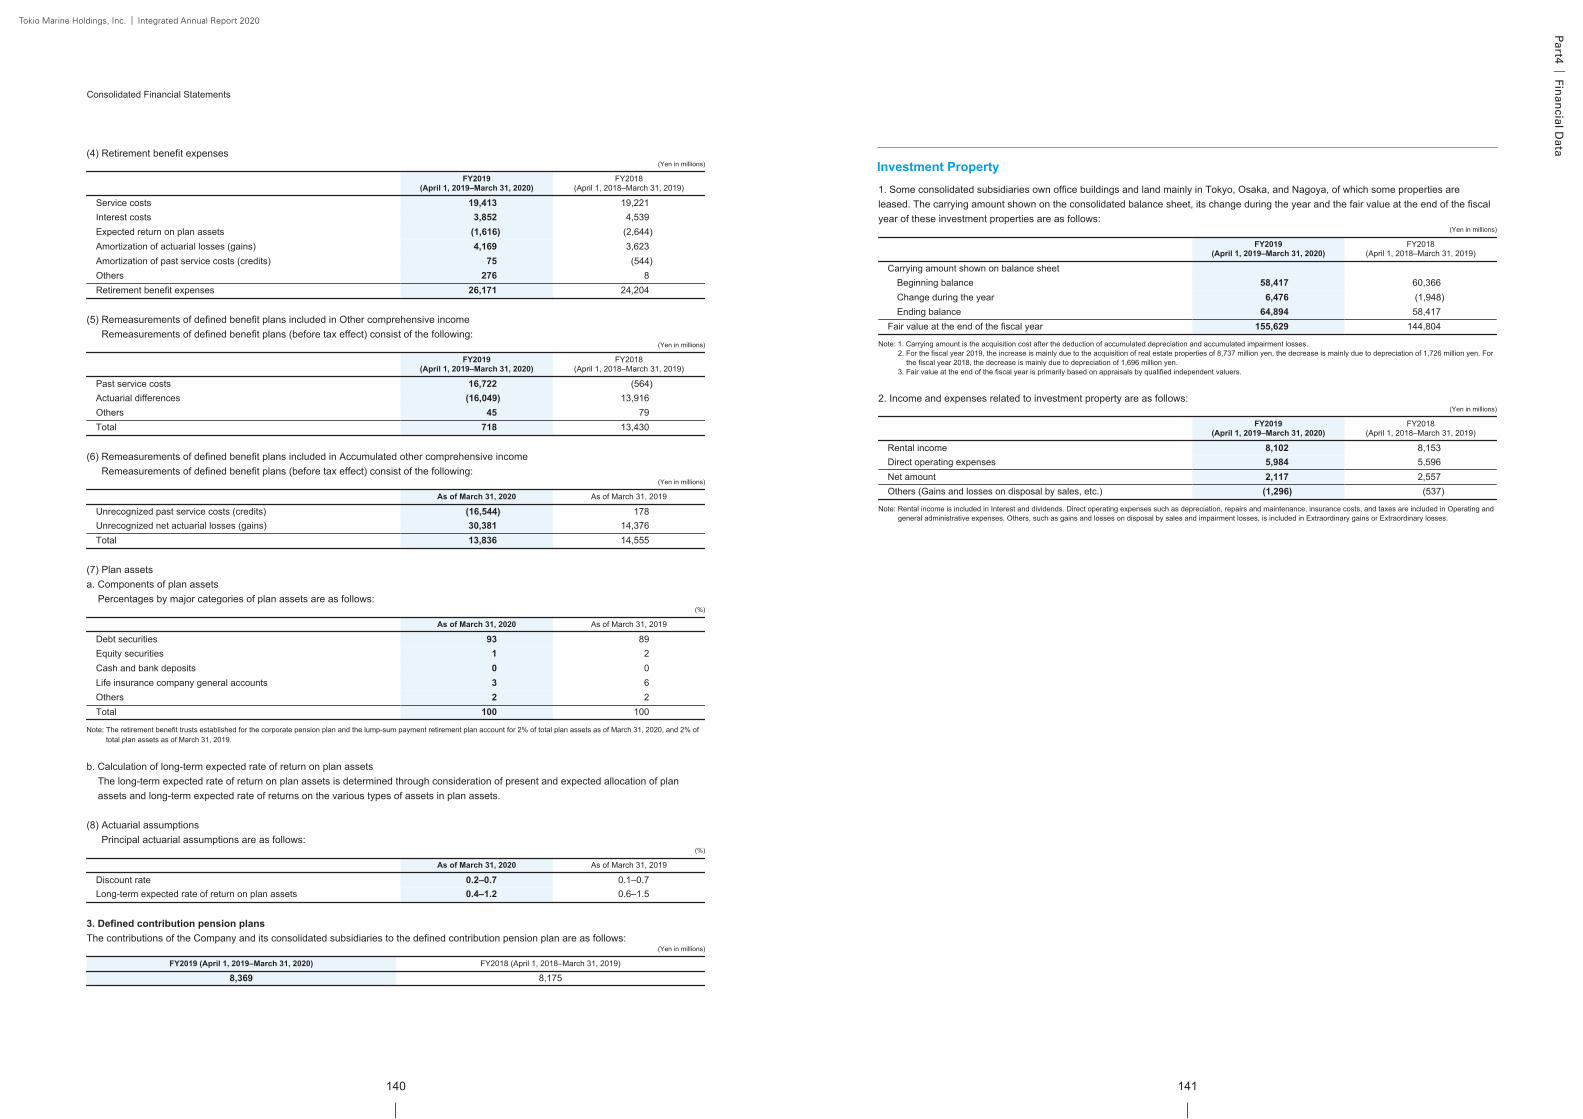
Consolidated Financial Statements
Tokio Marine Holdings, Inc. | Integrated Annual Report 2020
2020/09/17 18:08:12 / 20654695_東京海上ホールディングス株式会社_総会その他(C)
(4) Retirement benefit expenses(Yen in millions)
FY2019(April 1, 2019–March 31, 2020)
FY2018(April 1, 2018–March 31, 2019)
Service costs 19,413 19,221Interest costs 3,852 4,539Expected return on plan assets (1,616) (2,644)Amortization of actuarial losses (gains) 4,169 3,623Amortization of past service costs (credits) 75 (544)Others 276 8Retirement benefit expenses 26,171 24,204
(5) Remeasurements of defined benefit plans included in Other comprehensive incomeRemeasurements of defined benefit plans (before tax effect) consist of the following:
(Yen in millions)
FY2019(April 1, 2019–March 31, 2020)
FY2018(April 1, 2018–March 31, 2019)
Past service costs 16,722 (564)Actuarial differences (16,049) 13,916Others 45 79Total 718 13,430
(6) Remeasurements of defined benefit plans included in Accumulated other comprehensive incomeRemeasurements of defined benefit plans (before tax effect) consist of the following:
(Yen in millions)
As of March 31, 2020 As of March 31, 2019
Unrecognized past service costs (credits) (16,544) 178Unrecognized net actuarial losses (gains) 30,381 14,376Total 13,836 14,555
(7) Plan assetsa. Components of plan assets
Percentages by major categories of plan assets are as follows:(%)
As of March 31, 2020 As of March 31, 2019
Debt securities 93 89Equity securities 1 2Cash and bank deposits 0 0Life insurance company general accounts 3 6Others 2 2Total 100 100
Note: The retirement benefit trusts established for the corporate pension plan and the lump-sum payment retirement plan account for 2% of total plan assets as of March 31, 2020, and 2% of total plan assets as of March 31, 2019.
b. Calculation of long-term expected rate of return on plan assetsThe long-term expected rate of return on plan assets is determined through consideration of present and expected allocation of plan assets and long-term expected rate of returns on the various types of assets in plan assets.
(8) Actuarial assumptionsPrincipal actuarial assumptions are as follows:
(%)
As of March 31, 2020 As of March 31, 2019
Discount rate 0.2–0.7 0.1–0.7Long-term expected rate of return on plan assets 0.4–1.2 0.6–1.5
3. Defined contribution pension plansThe contributions of the Company and its consolidated subsidiaries to the defined contribution pension plan are as follows:
(Yen in millions)
FY2019 (April 1, 2019–March 31, 2020) FY2018 (April 1, 2018–March 31, 2019)
8,369 8,175
140
Retirement Benefits
Part4 | Fin
ancial D
ata
2020/09/17 18:08:12 / 20654695_東京海上ホールディングス株式会社_総会その他(C)
Investment Property1. Some consolidated subsidiaries own office buildings and land mainly in Tokyo, Osaka, and Nagoya, of which some properties are leased. The carrying amount shown on the consolidated balance sheet, its change during the year and the fair value at the end of the fiscal year of these investment properties are as follows:
(Yen in millions)
FY2019(April 1, 2019–March 31, 2020)
FY2018(April 1, 2018–March 31, 2019)
Carrying amount shown on balance sheetBeginning balance 58,417 60,366Change during the year 6,476 (1,948)Ending balance 64,894 58,417
Fair value at the end of the fiscal year 155,629 144,804
Note: 1. Carrying amount is the acquisition cost after the deduction of accumulated depreciation and accumulated impairment losses.2. For the fiscal year 2019, the increase is mainly due to the acquisition of real estate properties of 8,737 million yen, the decrease is mainly due to depreciation of 1,726 million yen. For
the fiscal year 2018, the decrease is mainly due to depreciation of 1,696 million yen.3. Fair value at the end of the fiscal year is primarily based on appraisals by qualified independent valuers.
2. Income and expenses related to investment property are as follows:(Yen in millions)
FY2019(April 1, 2019–March 31, 2020)
FY2018(April 1, 2018–March 31, 2019)
Rental income 8,102 8,153Direct operating expenses 5,984 5,596Net amount 2,117 2,557Others (Gains and losses on disposal by sales, etc.) (1,296) (537)
Note: Rental income is included in Interest and dividends. Direct operating expenses such as depreciation, repairs and maintenance, insurance costs, and taxes are included in Operating and general administrative expenses. Others, such as gains and losses on disposal by sales and impairment losses, is included in Extraordinary gains or Extraordinary losses.
141
Investment Property
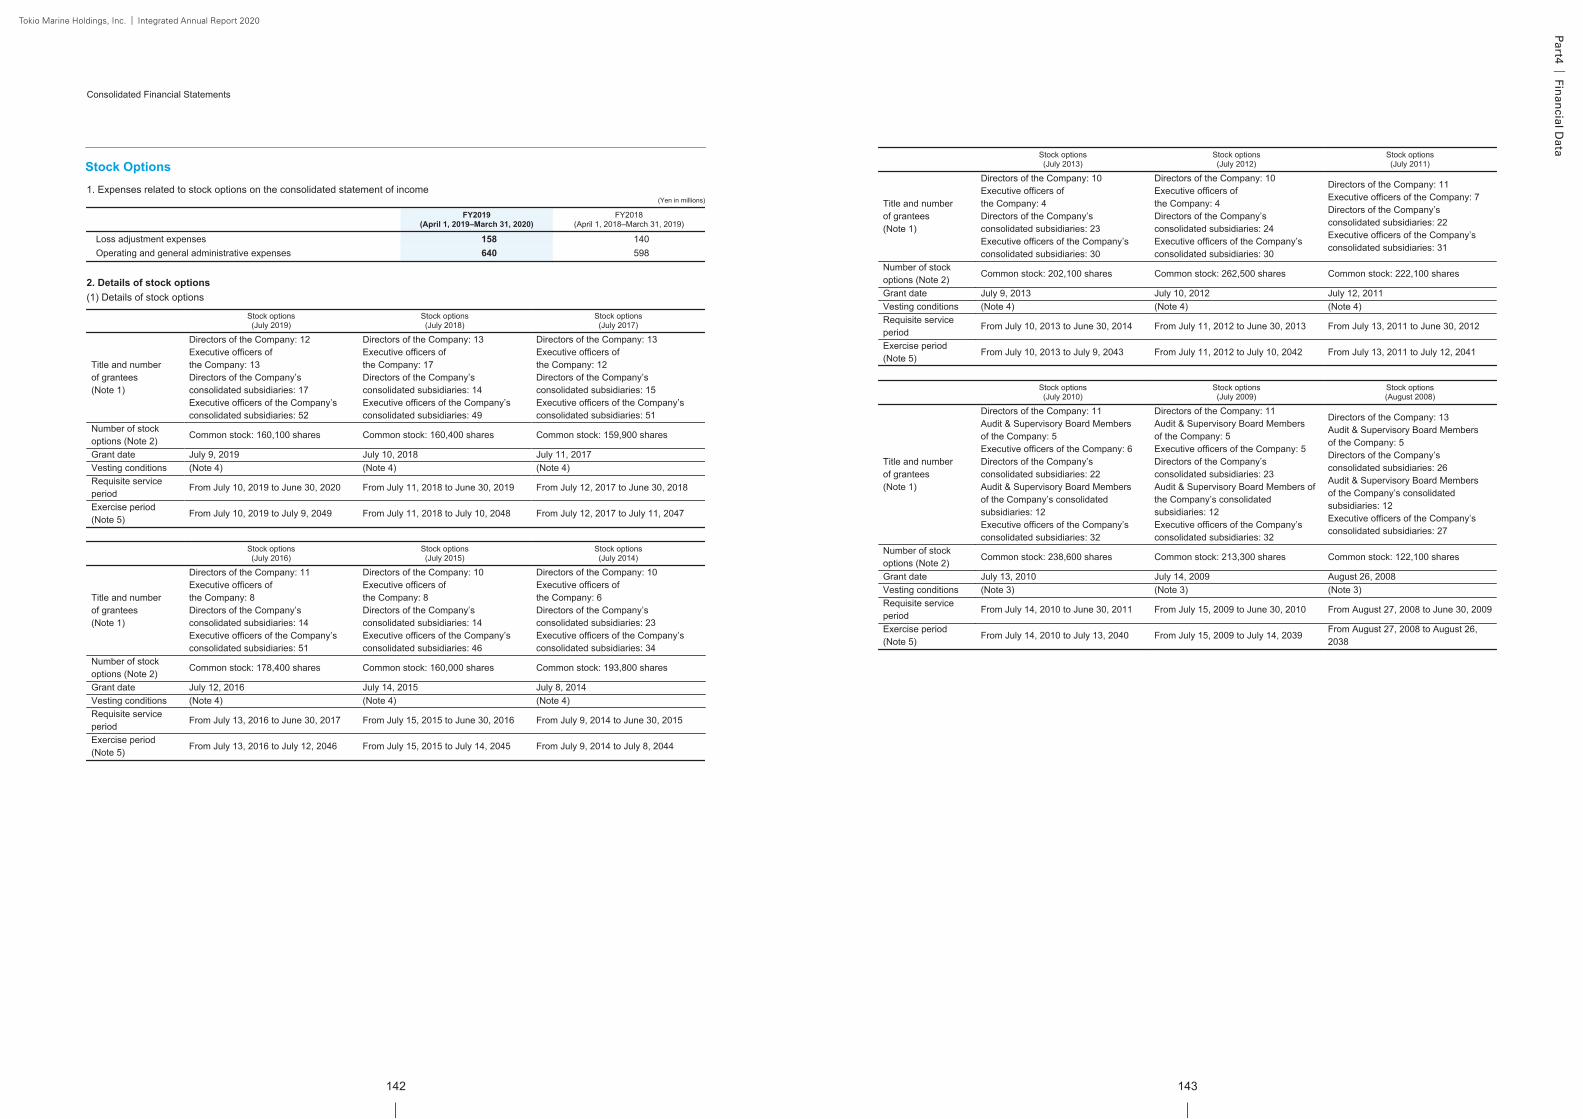
Consolidated Financial Statements
Tokio Marine Holdings, Inc. | Integrated Annual Report 2020
2020/09/17 18:08:12 / 20654695_東京海上ホールディングス株式会社_総会その他(C)
Stock Options1. Expenses related to stock options on the consolidated statement of income
(Yen in millions)
FY2019(April 1, 2019–March 31, 2020)
FY2018(April 1, 2018–March 31, 2019)
Loss adjustment expenses 158 140Operating and general administrative expenses 640 598
2. Details of stock options(1) Details of stock options
Stock options(July 2019)
Stock options(July 2018)
Stock options(July 2017)
Title and numberof grantees(Note 1)
Directors of the Company: 12Executive officers ofthe Company: 13Directors of the Company’sconsolidated subsidiaries: 17Executive officers of the Company’sconsolidated subsidiaries: 52
Directors of the Company: 13Executive officers ofthe Company: 17Directors of the Company’sconsolidated subsidiaries: 14Executive officers of the Company’sconsolidated subsidiaries: 49
Directors of the Company: 13Executive officers ofthe Company: 12Directors of the Company’sconsolidated subsidiaries: 15Executive officers of the Company’sconsolidated subsidiaries: 51
Number of stockoptions (Note 2)
Common stock: 160,100 shares Common stock: 160,400 shares Common stock: 159,900 shares
Grant date July 9, 2019 July 10, 2018 July 11, 2017Vesting conditions (Note 4) (Note 4) (Note 4)Requisite serviceperiod
From July 10, 2019 to June 30, 2020 From July 11, 2018 to June 30, 2019 From July 12, 2017 to June 30, 2018
Exercise period(Note 5)
From July 10, 2019 to July 9, 2049 From July 11, 2018 to July 10, 2048 From July 12, 2017 to July 11, 2047
Stock options(July 2016)
Stock options(July 2015)
Stock options(July 2014)
Title and numberof grantees(Note 1)
Directors of the Company: 11Executive officers ofthe Company: 8Directors of the Company’sconsolidated subsidiaries: 14Executive officers of the Company’sconsolidated subsidiaries: 51
Directors of the Company: 10Executive officers ofthe Company: 8Directors of the Company’sconsolidated subsidiaries: 14Executive officers of the Company’sconsolidated subsidiaries: 46
Directors of the Company: 10Executive officers ofthe Company: 6Directors of the Company’sconsolidated subsidiaries: 23Executive officers of the Company’sconsolidated subsidiaries: 34
Number of stockoptions (Note 2)
Common stock: 178,400 shares Common stock: 160,000 shares Common stock: 193,800 shares
Grant date July 12, 2016 July 14, 2015 July 8, 2014Vesting conditions (Note 4) (Note 4) (Note 4)Requisite serviceperiod
From July 13, 2016 to June 30, 2017 From July 15, 2015 to June 30, 2016 From July 9, 2014 to June 30, 2015
Exercise period(Note 5)
From July 13, 2016 to July 12, 2046 From July 15, 2015 to July 14, 2045 From July 9, 2014 to July 8, 2044
142
Stock Options
Part4 | Fin
ancial D
ata
2020/09/17 18:08:12 / 20654695_東京海上ホールディングス株式会社_総会その他(C)
Stock options(July 2013)
Stock options(July 2012)
Stock options(July 2011)
Title and numberof grantees(Note 1)
Directors of the Company: 10Executive officers ofthe Company: 4Directors of the Company’sconsolidated subsidiaries: 23Executive officers of the Company’sconsolidated subsidiaries: 30
Directors of the Company: 10Executive officers ofthe Company: 4Directors of the Company’sconsolidated subsidiaries: 24Executive officers of the Company’sconsolidated subsidiaries: 30
Directors of the Company: 11Executive officers of the Company: 7Directors of the Company’sconsolidated subsidiaries: 22Executive officers of the Company’sconsolidated subsidiaries: 31
Number of stockoptions (Note 2)
Common stock: 202,100 shares Common stock: 262,500 shares Common stock: 222,100 shares
Grant date July 9, 2013 July 10, 2012 July 12, 2011Vesting conditions (Note 4) (Note 4) (Note 4)Requisite serviceperiod
From July 10, 2013 to June 30, 2014 From July 11, 2012 to June 30, 2013 From July 13, 2011 to June 30, 2012
Exercise period(Note 5)
From July 10, 2013 to July 9, 2043 From July 11, 2012 to July 10, 2042 From July 13, 2011 to July 12, 2041
Stock options(July 2010)
Stock options(July 2009)
Stock options(August 2008)
Title and numberof grantees(Note 1)
Directors of the Company: 11Audit & Supervisory Board Membersof the Company: 5Executive officers of the Company: 6Directors of the Company’sconsolidated subsidiaries: 22Audit & Supervisory Board Membersof the Company’s consolidatedsubsidiaries: 12Executive officers of the Company’sconsolidated subsidiaries: 32
Directors of the Company: 11Audit & Supervisory Board Membersof the Company: 5Executive officers of the Company: 5Directors of the Company’sconsolidated subsidiaries: 23Audit & Supervisory Board Members ofthe Company’s consolidatedsubsidiaries: 12Executive officers of the Company’sconsolidated subsidiaries: 32
Directors of the Company: 13Audit & Supervisory Board Membersof the Company: 5Directors of the Company’sconsolidated subsidiaries: 26Audit & Supervisory Board Membersof the Company’s consolidatedsubsidiaries: 12Executive officers of the Company’sconsolidated subsidiaries: 27
Number of stockoptions (Note 2)
Common stock: 238,600 shares Common stock: 213,300 shares Common stock: 122,100 shares
Grant date July 13, 2010 July 14, 2009 August 26, 2008Vesting conditions (Note 3) (Note 3) (Note 3)Requisite serviceperiod
From July 14, 2010 to June 30, 2011 From July 15, 2009 to June 30, 2010 From August 27, 2008 to June 30, 2009
Exercise period(Note 5)
From July 14, 2010 to July 13, 2040 From July 15, 2009 to July 14, 2039From August 27, 2008 to August 26, 2038
143
Stock Options
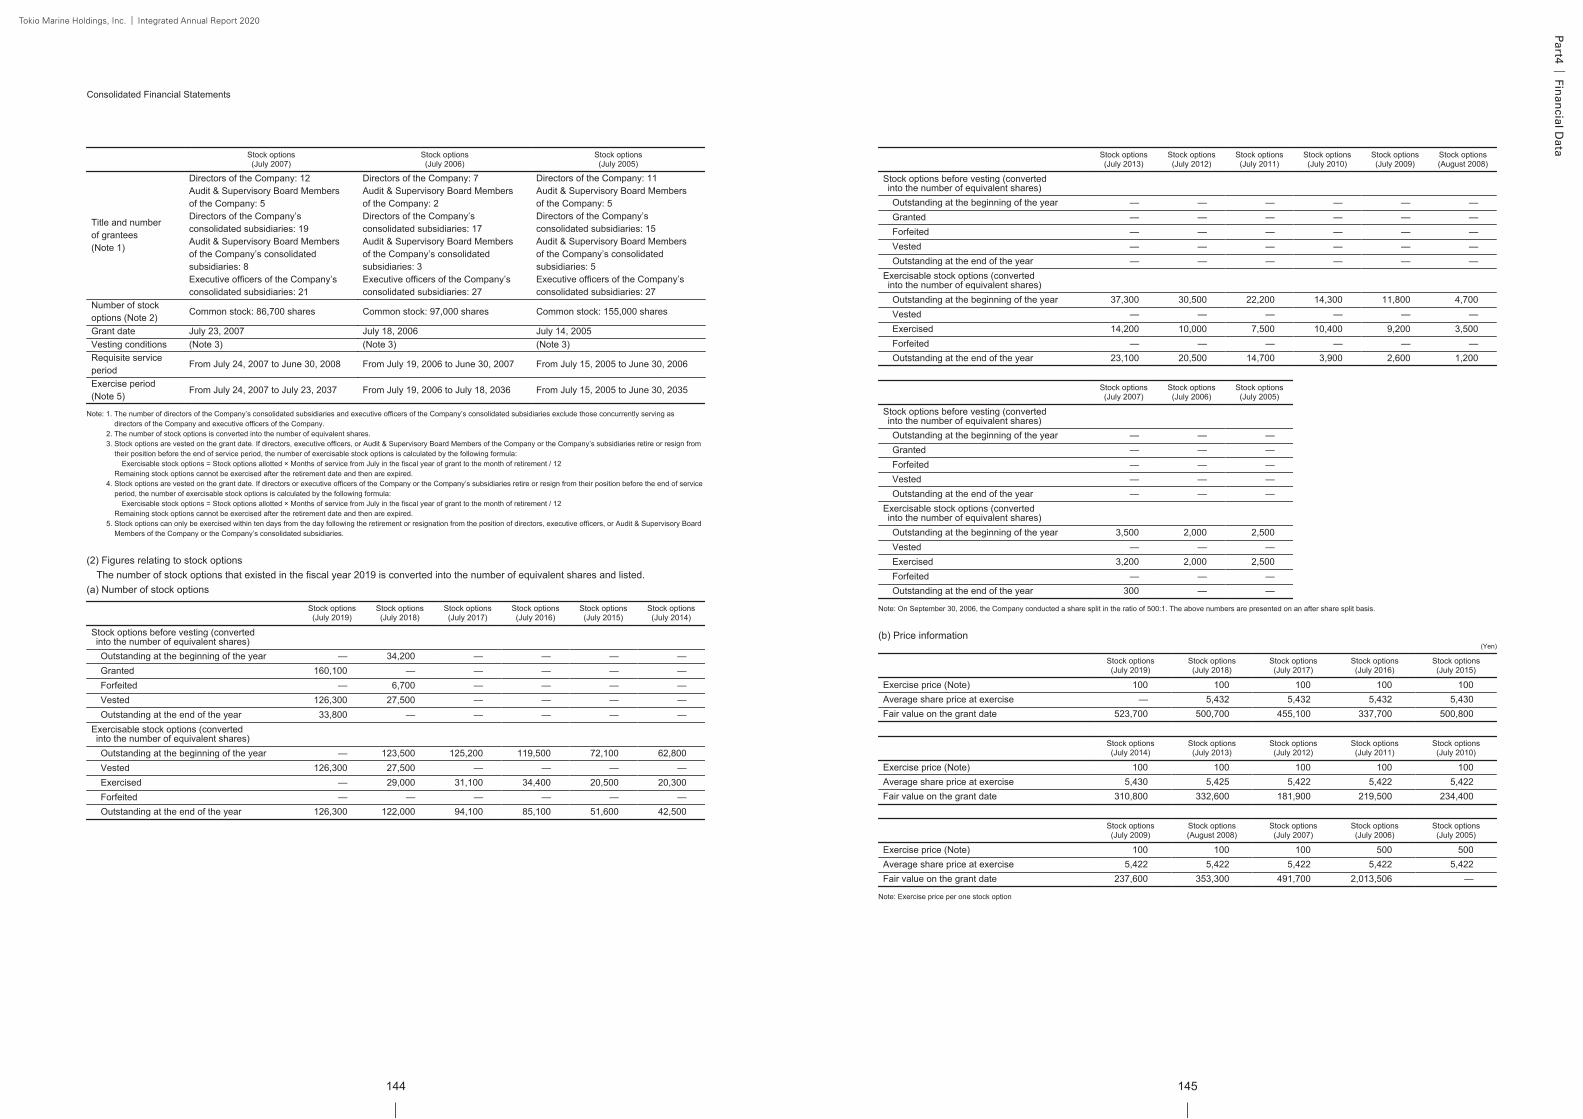
Consolidated Financial Statements
Tokio Marine Holdings, Inc. | Integrated Annual Report 2020
2020/09/17 18:08:12 / 20654695_東京海上ホールディングス株式会社_総会その他(C)
Stock options(July 2007)
Stock options(July 2006)
Stock options(July 2005)
Title and numberof grantees(Note 1)
Directors of the Company: 12Audit & Supervisory Board Membersof the Company: 5Directors of the Company’sconsolidated subsidiaries: 19Audit & Supervisory Board Membersof the Company’s consolidatedsubsidiaries: 8Executive officers of the Company’sconsolidated subsidiaries: 21
Directors of the Company: 7Audit & Supervisory Board Membersof the Company: 2Directors of the Company’sconsolidated subsidiaries: 17Audit & Supervisory Board Membersof the Company’s consolidatedsubsidiaries: 3Executive officers of the Company’sconsolidated subsidiaries: 27
Directors of the Company: 11Audit & Supervisory Board Membersof the Company: 5Directors of the Company’sconsolidated subsidiaries: 15Audit & Supervisory Board Membersof the Company’s consolidatedsubsidiaries: 5Executive officers of the Company’sconsolidated subsidiaries: 27
Number of stockoptions (Note 2)
Common stock: 86,700 shares Common stock: 97,000 shares Common stock: 155,000 shares
Grant date July 23, 2007 July 18, 2006 July 14, 2005Vesting conditions (Note 3) (Note 3) (Note 3)Requisite serviceperiod
From July 24, 2007 to June 30, 2008 From July 19, 2006 to June 30, 2007 From July 15, 2005 to June 30, 2006
Exercise period(Note 5)
From July 24, 2007 to July 23, 2037 From July 19, 2006 to July 18, 2036 From July 15, 2005 to June 30, 2035
Note: 1. The number of directors of the Company’s consolidated subsidiaries and executive officers of the Company’s consolidated subsidiaries exclude those concurrently serving as directors of the Company and executive officers of the Company.
2. The number of stock options is converted into the number of equivalent shares.3. Stock options are vested on the grant date. If directors, executive officers, or Audit & Supervisory Board Members of the Company or the Company’s subsidiaries retire or resign from
their position before the end of service period, the number of exercisable stock options is calculated by the following formula: Exercisable stock options = Stock options allotted × Months of service from July in the fiscal year of grant to the month of retirement / 12Remaining stock options cannot be exercised after the retirement date and then are expired.
4. Stock options are vested on the grant date. If directors or executive officers of the Company or the Company’s subsidiaries retire or resign from their position before the end of service period, the number of exercisable stock options is calculated by the following formula: Exercisable stock options = Stock options allotted × Months of service from July in the fiscal year of grant to the month of retirement / 12Remaining stock options cannot be exercised after the retirement date and then are expired.
5. Stock options can only be exercised within ten days from the day following the retirement or resignation from the position of directors, executive officers, or Audit & Supervisory Board Members of the Company or the Company’s consolidated subsidiaries.
(2) Figures relating to stock optionsThe number of stock options that existed in the fiscal year 2019 is converted into the number of equivalent shares and listed.
(a) Number of stock options
Stock options(July 2019)
Stock options(July 2018)
Stock options(July 2017)
Stock options(July 2016)
Stock options(July 2015)
Stock options(July 2014)
Stock options before vesting (convertedinto the number of equivalent shares)Outstanding at the beginning of the year — 34,200 — — — —Granted 160,100 — — — — —Forfeited — 6,700 — — — —Vested 126,300 27,500 — — — —Outstanding at the end of the year 33,800 — — — — —
Exercisable stock options (convertedinto the number of equivalent shares)Outstanding at the beginning of the year — 123,500 125,200 119,500 72,100 62,800Vested 126,300 27,500 — — — —Exercised — 29,000 31,100 34,400 20,500 20,300Forfeited — — — — — —Outstanding at the end of the year 126,300 122,000 94,100 85,100 51,600 42,500
144
Stock Options
Part4 | Fin
ancial D
ata
2020/09/17 18:08:12 / 20654695_東京海上ホールディングス株式会社_総会その他(C)
Stock options(July 2013)
Stock options(July 2012)
Stock options(July 2011)
Stock options(July 2010)
Stock options(July 2009)
Stock options(August 2008)
Stock options before vesting (convertedinto the number of equivalent shares)Outstanding at the beginning of the year — — — — — —Granted — — — — — —Forfeited — — — — — —Vested — — — — — —Outstanding at the end of the year — — — — — —
Exercisable stock options (convertedinto the number of equivalent shares)Outstanding at the beginning of the year 37,300 30,500 22,200 14,300 11,800 4,700Vested — — — — — —Exercised 14,200 10,000 7,500 10,400 9,200 3,500Forfeited — — — — — —Outstanding at the end of the year 23,100 20,500 14,700 3,900 2,600 1,200
Stock options(July 2007)
Stock options(July 2006)
Stock options(July 2005)
Stock options before vesting (convertedinto the number of equivalent shares)Outstanding at the beginning of the year — — —Granted — — —Forfeited — — —Vested — — —Outstanding at the end of the year — — —
Exercisable stock options (convertedinto the number of equivalent shares)Outstanding at the beginning of the year 3,500 2,000 2,500Vested — — —Exercised 3,200 2,000 2,500Forfeited — — —Outstanding at the end of the year 300 — —
Note: On September 30, 2006, the Company conducted a share split in the ratio of 500:1. The above numbers are presented on an after share split basis.
(b) Price information(Yen)
Stock options(July 2019)
Stock options(July 2018)
Stock options(July 2017)
Stock options(July 2016)
Stock options(July 2015)
Exercise price (Note) 100 100 100 100 100Average share price at exercise — 5,432 5,432 5,432 5,430Fair value on the grant date 523,700 500,700 455,100 337,700 500,800
Stock options(July 2014)
Stock options(July 2013)
Stock options(July 2012)
Stock options(July 2011)
Stock options(July 2010)
Exercise price (Note) 100 100 100 100 100Average share price at exercise 5,430 5,425 5,422 5,422 5,422Fair value on the grant date 310,800 332,600 181,900 219,500 234,400
Stock options(July 2009)
Stock options(August 2008)
Stock options(July 2007)
Stock options(July 2006)
Stock options(July 2005)
Exercise price (Note) 100 100 100 500 500Average share price at exercise 5,422 5,422 5,422 5,422 5,422Fair value on the grant date 237,600 353,300 491,700 2,013,506 —
Note: Exercise price per one stock option
145
Stock Options
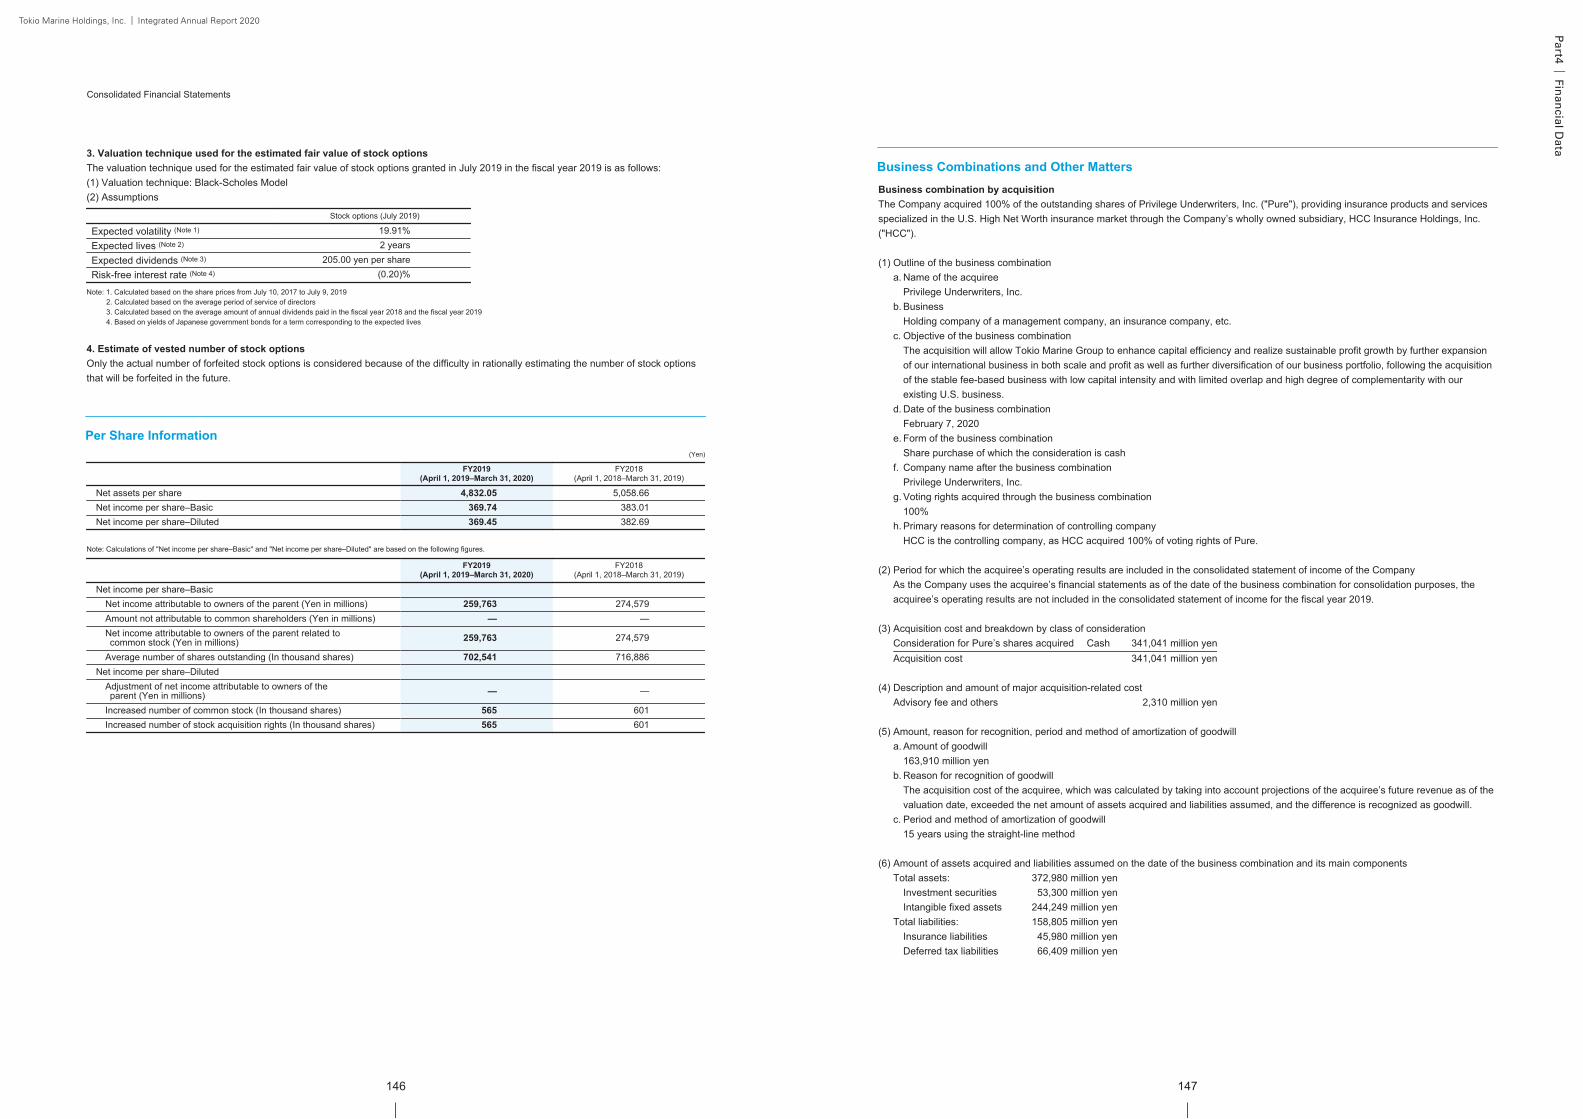
Consolidated Financial Statements
Tokio Marine Holdings, Inc. | Integrated Annual Report 2020
2020/09/17 18:08:12 / 20654695_東京海上ホールディングス株式会社_総会その他(C)
3. Valuation technique used for the estimated fair value of stock optionsThe valuation technique used for the estimated fair value of stock options granted in July 2019 in the fiscal year 2019 is as follows:(1) Valuation technique: Black-Scholes Model(2) Assumptions
Stock options (July 2019)
Expected volatility (Note 1) 19.91%Expected lives (Note 2) 2 years
Expected dividends (Note 3) 205.00 yen per shareRisk-free interest rate (Note 4) (0.20)%
Note: 1. Calculated based on the share prices from July 10, 2017 to July 9, 20192. Calculated based on the average period of service of directors3. Calculated based on the average amount of annual dividends paid in the fiscal year 2018 and the fiscal year 20194. Based on yields of Japanese government bonds for a term corresponding to the expected lives
4. Estimate of vested number of stock optionsOnly the actual number of forfeited stock options is considered because of the difficulty in rationally estimating the number of stock options that will be forfeited in the future.
Per Share Information(Yen)
FY2019(April 1, 2019–March 31, 2020)
FY2018(April 1, 2018–March 31, 2019)
Net assets per share 4,832.05 5,058.66Net income per share–Basic 369.74 383.01Net income per share–Diluted 369.45 382.69
Note: Calculations of "Net income per share–Basic" and "Net income per share–Diluted" are based on the following figures.
FY2019(April 1, 2019–March 31, 2020)
FY2018(April 1, 2018–March 31, 2019)
Net income per share–BasicNet income attributable to owners of the parent (Yen in millions) 259,763 274,579Amount not attributable to common shareholders (Yen in millions) — —Net income attributable to owners of the parent related tocommon stock (Yen in millions) 259,763 274,579
Average number of shares outstanding (In thousand shares) 702,541 716,886Net income per share–Diluted
Adjustment of net income attributable to owners of theparent (Yen in millions) — —
Increased number of common stock (In thousand shares) 565 601Increased number of stock acquisition rights (In thousand shares) 565 601
146
Stock Options、Per Share Information
Part4 | Fin
ancial D
ata
2020/09/17 18:08:12 / 20654695_東京海上ホールディングス株式会社_総会その他(C)
Business Combinations and Other MattersBusiness combination by acquisitionThe Company acquired 100% of the outstanding shares of Privilege Underwriters, Inc. ("Pure"), providing insurance products and services specialized in the U.S. High Net Worth insurance market through the Company’s wholly owned subsidiary, HCC Insurance Holdings, Inc. ("HCC").
(1) Outline of the business combinationa. Name of the acquiree
Privilege Underwriters, Inc.b. Business
Holding company of a management company, an insurance company, etc.c. Objective of the business combination
The acquisition will allow Tokio Marine Group to enhance capital efficiency and realize sustainable profit growth by further expansion of our international business in both scale and profit as well as further diversification of our business portfolio, following the acquisition of the stable fee-based business with low capital intensity and with limited overlap and high degree of complementarity with our existing U.S. business.
d. Date of the business combinationFebruary 7, 2020
e. Form of the business combinationShare purchase of which the consideration is cash
f. Company name after the business combinationPrivilege Underwriters, Inc.
g. Voting rights acquired through the business combination100%
h. Primary reasons for determination of controlling companyHCC is the controlling company, as HCC acquired 100% of voting rights of Pure.
(2) Period for which the acquiree’s operating results are included in the consolidated statement of income of the CompanyAs the Company uses the acquiree’s financial statements as of the date of the business combination for consolidation purposes, the acquiree’s operating results are not included in the consolidated statement of income for the fiscal year 2019.
(3) Acquisition cost and breakdown by class of considerationConsideration for Pure’s shares acquired Cash 341,041 million yenAcquisition cost 341,041 million yen
(4) Description and amount of major acquisition-related costAdvisory fee and others 2,310 million yen
(5) Amount, reason for recognition, period and method of amortization of goodwilla. Amount of goodwill
163,910 million yenb. Reason for recognition of goodwill
The acquisition cost of the acquiree, which was calculated by taking into account projections of the acquiree’s future revenue as of the valuation date, exceeded the net amount of assets acquired and liabilities assumed, and the difference is recognized as goodwill.
c. Period and method of amortization of goodwill15 years using the straight-line method
(6) Amount of assets acquired and liabilities assumed on the date of the business combination and its main componentsTotal assets: 372,980 million yen
Investment securities 53,300 million yenIntangible fixed assets 244,249 million yen
Total liabilities: 158,805 million yenInsurance liabilities 45,980 million yenDeferred tax liabilities 66,409 million yen
147
Business Combinations and Other Matters

Consolidated Financial Statements
Tokio Marine Holdings, Inc. | Integrated Annual Report 2020
2020/09/17 18:08:12 / 20654695_東京海上ホールディングス株式会社_総会その他(C)
(7) Amounts allocated to intangible fixed assets other than goodwill, breakdown by component and weighted average amortization period by componentTotal amount allocated to intangible fixed assets other than goodwill: 242,639 million yen
Policyholder Relationships 111,751 million yen (15 years)Broker Relationships 96,412 million yen (15 years)
(8) Allocation of acquisition costThe Company provisionally accounted for the business combination based on relevant information available as of March 31, 2020, because the purchase price allocation has not been completed within a short period from the date of the business combination.
(9) Approximate impact on the consolidated statement of income and its calculation methods, assuming that the business combination took place on the first day of the fiscal year 2019Ordinary income 58,750 million yenOrdinary profit (31,772) million yenNet income attributable to owners of the parent (22,966) million yen
(Calculation methods for approximate impact)These amounts of approximate impact represent the difference between the hypothetical amounts of Ordinary income, Ordinary profit and Net income attributable to owners of the parent calculated assuming that the business combination was completed at the beginning of the fiscal year 2019, and their corresponding amounts on consolidated statement of income of the Company for the fiscal year 2019. The amortized amount of intangible fixed assets (incl. goodwill) is included in the calculation by assuming that the entire intangible fixed assets arising from the business combination was recognized at the beginning of the fiscal year 2019. These amounts of the approximate impact and its calculation methods have been unaudited.
Subsequent EventsNot applicable.
148
Business Combinations and Other Matters、Subsequent Events
Part4 | Fin
ancial D
ata
2020/09/17 18:08:12 / 20654695_東京海上ホールディングス株式会社_総会その他(C)
Supplementary Schedule(Schedule of corporate bonds)
Issuer Series Issue dateBeginningbalance
(Yen in millions)
Endingbalance
(Yen in millions)
Coupon(%) Collateral Maturity date
Tokio Marine &Nichido FireInsurance Co., Ltd.
4th Unsecured Bond Sep. 20, 2000 10,000 10,000[10,000] 2.78 N/A Sep. 18, 2020
First series of domestic subordinated unsecured bonds with interest deferral option and early redemption option
Dec. 24, 2019 — 200,000 0.96 N/A Dec. 24, 2079
FX Linked Coupon Bond Aug. 9, 2007 100 100 0.00 N/A Aug. 10, 2037
Delphi FinancialGroup, Inc.
Subordinated Bondin USD May. 23, 2007
19,011(USD 171,273
thousand)
18,781(USD 171,423
thousand)5.10–5.87 N/A May 1, 2067
Straight Bond in USD Jan. 20, 201028,403
(USD 255,887thousand)
27,441(USD 250,473
thousand)[27,441]
7.88 N/A Jan. 31, 2020
Privilege Underwriters Reciprocal Exchange Surplus Note Jun. 13, 2007 to
Jan. 18, 2018 —14,213
(USD 129,735thousand)
1.92–9.50 N/A Jul. 31, 2021 toJan. 18, 2028
Total — 57,514 270,536[37,441] — — —
Note: 1. The figures denoted with ( ) in the columns for beginning balance and ending balance are the amounts denominated in foreign currency.2. The figures denoted with [ ] in the columns for ending balance are the amounts of corporate bonds to be redeemed within 1 year.3. Principal amounts to be redeemed within 5 years after the closing date are as follows:
(Yen in millions)
Within 1 year Over 1 to 2 years Over 2 to 3 years Over 3 to 4 years Over 4 to 5 years
37,390 3,725 361 — —
(Schedule of borrowings)
Beginningbalance
(Yen in millions)
Endingbalance
(Yen in millions)
Averageinterest rate
(%)Maturity date
Short-term borrowings 24,975 5,695 2.8 —Long-term borrowings to be repaid within 1 year — 319,446 1.9 —Obligations under lease transactions to be repaid within 1 year 1,213 2,324 5.0 —
Long-term borrowings other than those to be repaid within 1 year 503,355 182,689 1.7 Sep. 7, 2021 toNov. 30, 2043
Obligations under lease transactions other than those to be repaidwithin 1 year 1,945 12,911 3.1 Jan. 1, 2021 to
Oct. 6, 2031Total 531,489 523,067 — —
Note: 1. Average interest rate is calculated based on the interest rate as of the end of the fiscal year and the outstanding principal amount.2. The above amount is included in Other liabilities in the consolidated balance sheet.3. Repayment schedule of long-term borrowings and lease obligations to be repaid within 5 years (excluding the amount to be repaid within 1 year) after the closing date is as follows:
(Yen in millions)
Over 1 to 2 years Over 2 to 3 years Over 3 to 4 years Over 4 to 5 years
Long-term borrowings 32,868 49,849 — —Lease obligations 2,962 2,310 1,833 1,030
(Schedule of asset retirement obligations)Detailed information is omitted due to its immateriality.
149
Supplementary Schedule
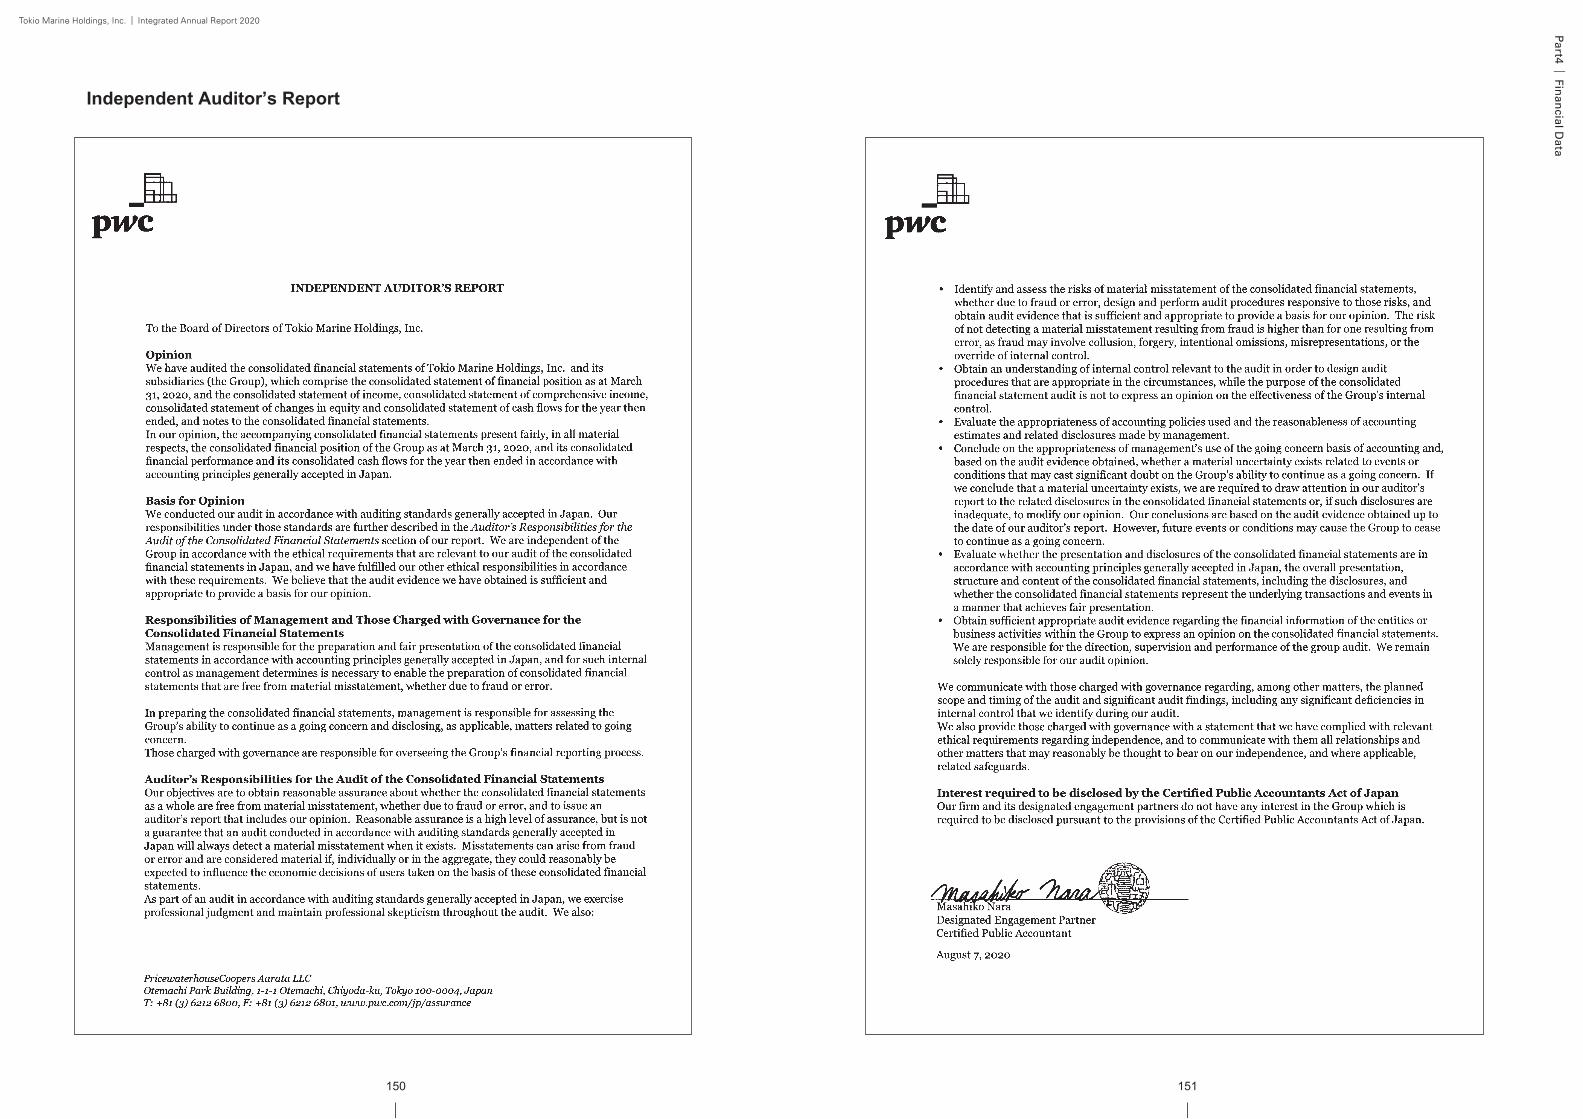
Independent Auditor’s Report
Tokio Marine Holdings, Inc. | Integrated Annual Report 2020
2020/09/17 18:08:12 / 20654695_東京海上ホールディングス株式会社_総会その他(C)
150
Independent Auditor’s Report
Part4 | Fin
ancial D
ata
2020/09/17 18:08:12 / 20654695_東京海上ホールディングス株式会社_総会その他(C)
151
Independent Auditor’s Report

Solvency Margin Ratio (Unaudited)
Tokio Marine Holdings, Inc. | Integrated Annual Report 2020
2020/09/17 18:08:12 / 20654695_東京海上ホールディングス株式会社_総会その他(C)
Sufficiency of solvency of insurance holding company and its subsidiaries, etc. to fulfillpayment obligations such as insurance claims
Tokio Marine Holdings’ solvency margin ratio (consolidated)(Yen in millions)
As of March 31, 2020 As of March 31, 2019
(A) Total amount of solvency margin 5,064,907 5,284,950Shareholders’ equity less adjusting items 891,439 1,154,895Reserve for price fluctuation 118,071 108,457Contingency reserve 57,854 56,705Catastrophe loss reserve 972,525 1,041,011General allowance for doubtful accounts 1,973 2,075Unrealized gains (losses) on available-for-sale securities and deferred gains(losses) on hedge transactions before tax effect deductions 1,838,462 2,098,278
Unrealized gains (losses) on land 250,588 235,371Total amount of unrecognized actuarial difference and unrecognizedprior service costs before tax effect deductions (14,213) (14,896)
Excess of premium reserve, etc. 312,273 319,977Subordinated debt, etc. 300,000 100,000Amounts within "Excess of premium reserve, etc." and"Subordinated debt, etc." not calculated into the margin — —
Total margin of Small Amount and Short Term Insurers 299 215Deductions 178,267 317,751Others 513,898 500,611
(B) Total amount of risks1,197,647 1,237,259√(√(R1
2+R22)+R3+R4)2+(R5+R6+R7)2+R8+R9
General insurance risk on non-life insurance contracts (R1) 367,085 350,053Life insurance risk (R2) 31,391 31,507Third sector insurance risk (R3) 43,714 46,925Insurance risk of Small Amount and Short Term Insurers (R4) 9 8Assumed interest rate risk (R5) 24,747 26,079Minimum guarantee risk on life insurance contracts (R6) 2,501 2,439Asset management risk (R7) 765,263 818,629Business administration risk (R8) 30,178 30,916Catastrophe risk on non-life insurance contracts (R9) 274,192 270,188
(C) Solvency margin ratio on a consolidated basis [(A)/{(B) × 1/2}] ×100 845.8% 854.2%
Note: "Solvency margin ratio on a consolidated basis" is calculated in accordance with Article 210-11-3 and 210-11-4 of the Ordinance for Enforcement of the Insurance Business Act and Public Notice No. 23 issued by the Financial Services Agency in 2011.
Solvency margin ratio (consolidated)1. Most subsidiaries in Tokio Marine Group engage in non-life insurance business, life insurance business and Small Amount and Short
Term insurance business. In addition to reserves to cover claim payments, payments for maturity refunds of saving type insurance policies, etc., it is necessary for insurance groups to maintain sufficient solvency in order to cover risks that exceed normal estimates, e.g. occurrences of a major catastrophe, or a significant decline in value of assets held by insurance groups.
2. (C) Solvency margin ratio is the ratio of (A) Total amount of solvency margin (i.e. solvency of insurance company groups in terms of their capital, reserves, etc.) to (B) Total amount of risks (i.e. risks that exceed normal estimates) which is calculated in accordance with the Insurance Business Act.
3. "Risks that exceed normal estimates" is composed of risks described below.(1) General insurance risk on non-life insurance contracts, life insurance risk, third sector insurance risk and insurance risk of Small
Amount and Short Term Insurers: risk that insurance claims occur in excess of normal estimates excluding catastrophe risk onnon-life insurance contracts.
(2) Assumed interest rate risk: risk that invested assets fail to yield assumed interest rates due to factors such as downturn of investment conditions.
(3) Minimum guarantee risk on life insurance contracts: risk that value of assets related to the minimum guarantee for benefits of insurance contracts, which are managed as a separate account, fluctuates in excess of normal estimates and falls below the minimum guaranteed benefits when they are to be paid.
(4) Asset management risk: risk that the prices of retained securities and other assets fluctuate in excess of normal estimates.
152
Tokio Marine Holdings’ solvency margin ratio (consolidated)
Part4 | Fin
ancial D
ata
2020/09/17 18:08:12 / 20654695_東京海上ホールディングス株式会社_総会その他(C)
(5) Business administration risk: risk that occurs in excess of normal estimates and does not fall under other categories.(6) Catastrophe risk on non-life insurance contracts: risk that a major catastrophe in excess of normal estimates which is equivalent to
the Great Kanto Earthquake or Isewan Typhoon or overseas major catastrophe occurs.
4. Subsidiaries that were excluded from the scope of consolidation in preparation of the consolidated financial statements due to immateriality were included within the calculation of the consolidated solvency margin ratio.
5. Solvency of insurance company groups in terms of their capital, reserves, etc. ((A) Total amount of solvency margin) is the total amount of net assets excluding planned outflows, certain reserves (e.g. price fluctuation reserve, contingency reserve, catastrophe loss reserve, etc.) and part of unrealized gains (losses) on land, etc.
6. Solvency margin ratio on a consolidated basis is one of the objective indicators used by the regulatory authority to supervise corporate groups headed by an insurance holdings company. A ratio exceeding 200% indicates sufficient solvency to fulfill payment obligations such as insurance claims.
Sufficiency of solvency of major domestic subsidiaries to fulfill payment obligations such as insurance claims
Solvency margin ratio (non-consolidated) for Tokio Marine & Nichido Fire Insurance Co., Ltd.(Yen in millions)
As of March 31, 2020 As of March 31, 2019
(A) Total amount of solvency margin 4,681,376 4,891,588Shareholders’ equity less adjusting items 1,383,131 1,345,853Reserve for price fluctuation 102,874 96,859Contingency reserve 6,213 5,449Catastrophe loss reserve 913,540 979,088General allowance for doubtful accounts 196 240Unrealized gains (losses) on available-for-sale securities and deferredgains (losses) on hedge transactions before tax effect deductions 1,424,499 1,840,342
Unrealized gains (losses) on land 230,253 216,476Excess of policyholders’ contract deposits — —Subordinated debt, etc. 200,000 —Amounts within "Excess of policyholders’ contract deposits" and"Subordinated debt, etc." not calculated into the margin — —
Deductions — —Others 420,667 407,277
(B) Total amount of risks √(R1+R2)2+(R3+R4)2+R5+R6 1,148,493 1,185,150General insurance risk (R1) 192,865 184,654Third sector insurance risk (R2) — —Assumed interest rate risk (R3) 18,765 20,092Asset management risk (R4) 933,404 963,630Business administration risk (R5) 25,922 26,522Catastrophe risk (R6) 151,065 157,725
(C) Solvency margin ratio [(A)/{(B) × 1/2}] × 100 815.2% 825.4%
Note: "Solvency margin ratio" is calculated in accordance with Article 86 and 87 of the Ordinance for Enforcement of the Insurance Business Act and with Ministry of Finance Official Notification No. 50 issued in 1996.
153
Tokio Marine Holdings’ solvency margin ratio (consolidated)、Solvency margin ratio (non-consolidated) for Tokio Marine & Nichido Fire Insurance Co., Ltd.
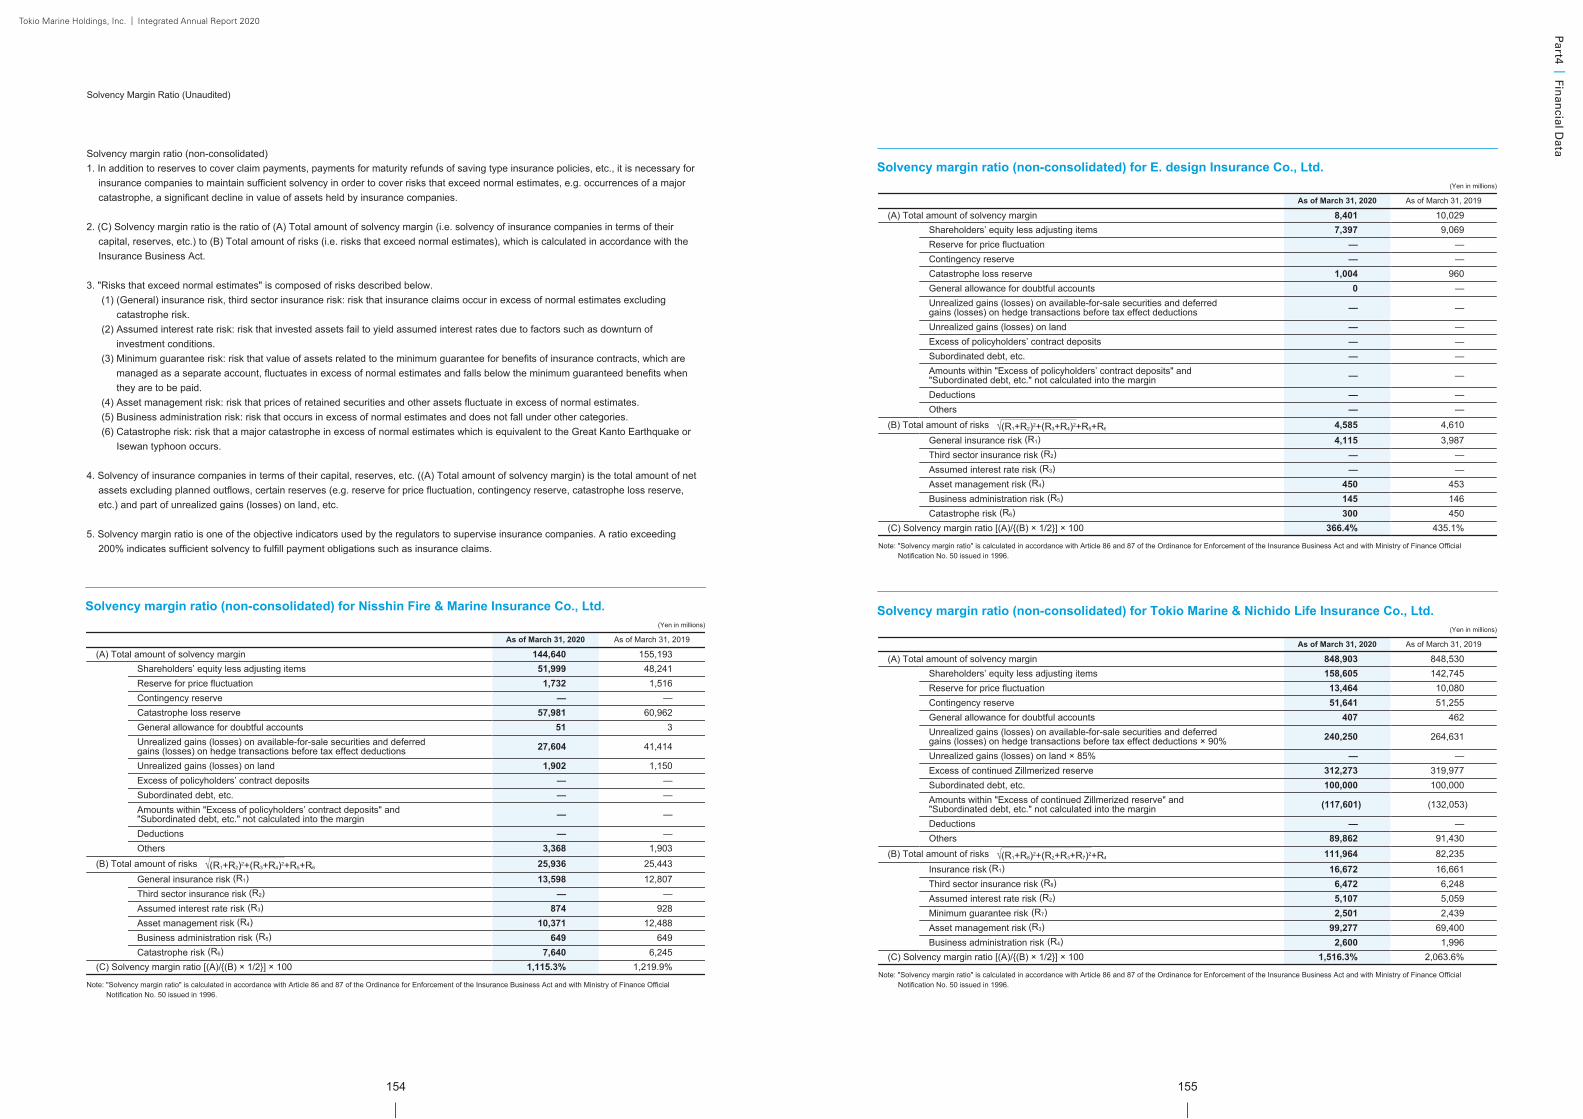
Solvency Margin Ratio (Unaudited)
Tokio Marine Holdings, Inc. | Integrated Annual Report 2020
2020/09/17 18:08:12 / 20654695_東京海上ホールディングス株式会社_総会その他(C)
Solvency margin ratio (non-consolidated)1. In addition to reserves to cover claim payments, payments for maturity refunds of saving type insurance policies, etc., it is necessary for
insurance companies to maintain sufficient solvency in order to cover risks that exceed normal estimates, e.g. occurrences of a major catastrophe, a significant decline in value of assets held by insurance companies.
2. (C) Solvency margin ratio is the ratio of (A) Total amount of solvency margin (i.e. solvency of insurance companies in terms of their capital, reserves, etc.) to (B) Total amount of risks (i.e. risks that exceed normal estimates), which is calculated in accordance with the Insurance Business Act.
3. "Risks that exceed normal estimates" is composed of risks described below.(1) (General) insurance risk, third sector insurance risk: risk that insurance claims occur in excess of normal estimates excluding
catastrophe risk.(2) Assumed interest rate risk: risk that invested assets fail to yield assumed interest rates due to factors such as downturn of
investment conditions.(3) Minimum guarantee risk: risk that value of assets related to the minimum guarantee for benefits of insurance contracts, which are
managed as a separate account, fluctuates in excess of normal estimates and falls below the minimum guaranteed benefits when they are to be paid.
(4) Asset management risk: risk that prices of retained securities and other assets fluctuate in excess of normal estimates.(5) Business administration risk: risk that occurs in excess of normal estimates and does not fall under other categories.(6) Catastrophe risk: risk that a major catastrophe in excess of normal estimates which is equivalent to the Great Kanto Earthquake or
Isewan typhoon occurs.
4. Solvency of insurance companies in terms of their capital, reserves, etc. ((A) Total amount of solvency margin) is the total amount of net assets excluding planned outflows, certain reserves (e.g. reserve for price fluctuation, contingency reserve, catastrophe loss reserve, etc.) and part of unrealized gains (losses) on land, etc.
5. Solvency margin ratio is one of the objective indicators used by the regulators to supervise insurance companies. A ratio exceeding 200% indicates sufficient solvency to fulfill payment obligations such as insurance claims.
Solvency margin ratio (non-consolidated) for Nisshin Fire & Marine Insurance Co., Ltd.(Yen in millions)
As of March 31, 2020 As of March 31, 2019
(A) Total amount of solvency margin 144,640 155,193Shareholders’ equity less adjusting items 51,999 48,241Reserve for price fluctuation 1,732 1,516Contingency reserve — —Catastrophe loss reserve 57,981 60,962General allowance for doubtful accounts 51 3Unrealized gains (losses) on available-for-sale securities and deferredgains (losses) on hedge transactions before tax effect deductions 27,604 41,414
Unrealized gains (losses) on land 1,902 1,150Excess of policyholders’ contract deposits — —Subordinated debt, etc. — —Amounts within "Excess of policyholders’ contract deposits" and"Subordinated debt, etc." not calculated into the margin — —
Deductions — —Others 3,368 1,903
(B) Total amount of risks √(R1+R2)2+(R3+R4)2+R5+R6 25,936 25,443General insurance risk (R1) 13,598 12,807Third sector insurance risk (R2) — —Assumed interest rate risk (R3) 874 928Asset management risk (R4) 10,371 12,488Business administration risk (R5) 649 649Catastrophe risk (R6) 7,640 6,245
(C) Solvency margin ratio [(A)/{(B) × 1/2}] × 100 1,115.3% 1,219.9%
Note: "Solvency margin ratio" is calculated in accordance with Article 86 and 87 of the Ordinance for Enforcement of the Insurance Business Act and with Ministry of Finance Official Notification No. 50 issued in 1996.
154
Solvency margin ratio (non-consolidated) for Tokio Marine & Nichido Fire Insurance Co., Ltd.、Solvency margin ratio (non-consolidated) for Nisshin Fire & Marine Insurance Co., Ltd.
Part4 | Fin
ancial D
ata
2020/09/17 18:08:12 / 20654695_東京海上ホールディングス株式会社_総会その他(C)
Solvency margin ratio (non-consolidated) for E. design Insurance Co., Ltd.(Yen in millions)
As of March 31, 2020 As of March 31, 2019
(A) Total amount of solvency margin 8,401 10,029Shareholders’ equity less adjusting items 7,397 9,069Reserve for price fluctuation — —Contingency reserve — —Catastrophe loss reserve 1,004 960General allowance for doubtful accounts 0 —Unrealized gains (losses) on available-for-sale securities and deferredgains (losses) on hedge transactions before tax effect deductions — —
Unrealized gains (losses) on land — —Excess of policyholders’ contract deposits — —Subordinated debt, etc. — —Amounts within "Excess of policyholders’ contract deposits" and"Subordinated debt, etc." not calculated into the margin — —
Deductions — —Others — —
(B) Total amount of risks √(R1+R2)2+(R3+R4)2+R5+R6 4,585 4,610General insurance risk (R1) 4,115 3,987Third sector insurance risk (R2) — —Assumed interest rate risk (R3) — —Asset management risk (R4) 450 453Business administration risk (R5) 145 146Catastrophe risk (R6) 300 450
(C) Solvency margin ratio [(A)/{(B) × 1/2}] × 100 366.4% 435.1%
Note: "Solvency margin ratio" is calculated in accordance with Article 86 and 87 of the Ordinance for Enforcement of the Insurance Business Act and with Ministry of Finance Official Notification No. 50 issued in 1996.
Solvency margin ratio (non-consolidated) for Tokio Marine & Nichido Life Insurance Co., Ltd.(Yen in millions)
As of March 31, 2020 As of March 31, 2019
(A) Total amount of solvency margin 848,903 848,530Shareholders’ equity less adjusting items 158,605 142,745Reserve for price fluctuation 13,464 10,080Contingency reserve 51,641 51,255General allowance for doubtful accounts 407 462Unrealized gains (losses) on available-for-sale securities and deferredgains (losses) on hedge transactions before tax effect deductions × 90% 240,250 264,631
Unrealized gains (losses) on land × 85% — —Excess of continued Zillmerized reserve 312,273 319,977Subordinated debt, etc. 100,000 100,000Amounts within "Excess of continued Zillmerized reserve" and"Subordinated debt, etc." not calculated into the margin (117,601) (132,053)
Deductions — —Others 89,862 91,430
(B) Total amount of risks √(R1+R8)2+(R2+R3+R7)2+R4 111,964 82,235Insurance risk (R1) 16,672 16,661Third sector insurance risk (R8) 6,472 6,248Assumed interest rate risk (R2) 5,107 5,059Minimum guarantee risk (R7) 2,501 2,439Asset management risk (R3) 99,277 69,400Business administration risk (R4) 2,600 1,996
(C) Solvency margin ratio [(A)/{(B) × 1/2}] × 100 1,516.3% 2,063.6%
Note: "Solvency margin ratio" is calculated in accordance with Article 86 and 87 of the Ordinance for Enforcement of the Insurance Business Act and with Ministry of Finance Official Notification No. 50 issued in 1996.
155
Solvency margin ratio (non-consolidated) for E. design Insurance Co., Ltd.、Solvency margin ratio (non-consolidated) for Tokio Marine & Nichido Life Insurance Co., Ltd.
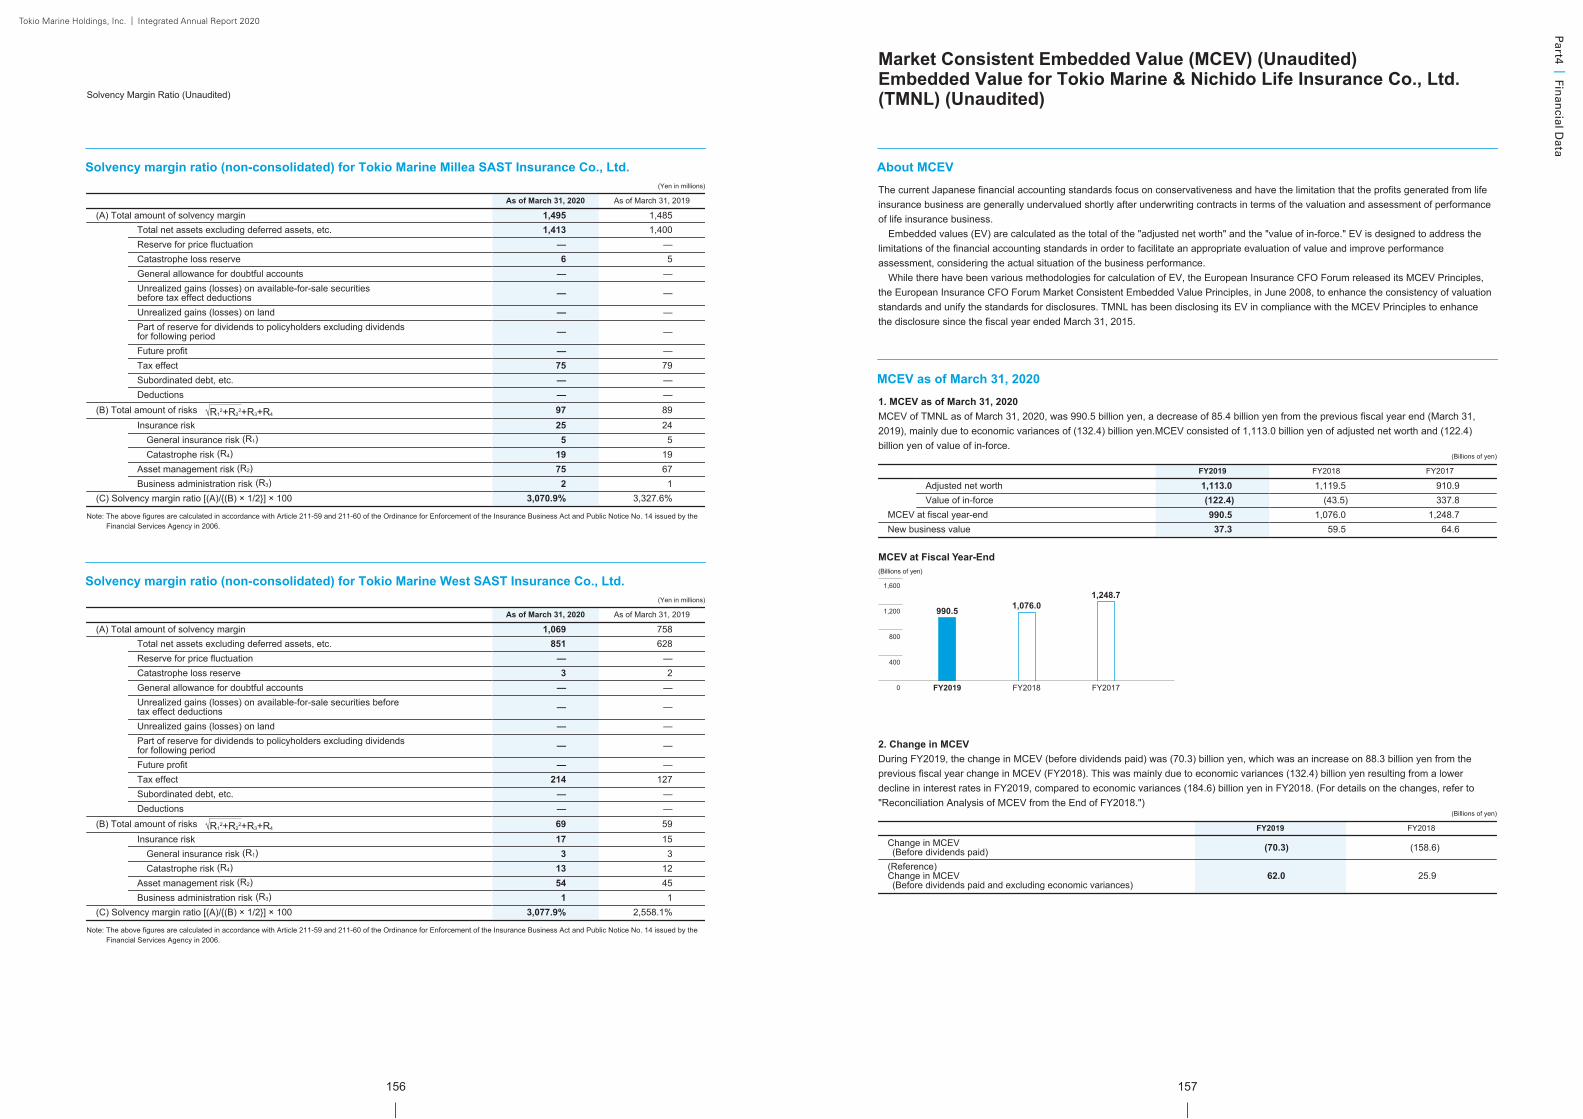
Solvency Margin Ratio (Unaudited)
Tokio Marine Holdings, Inc. | Integrated Annual Report 2020
2020/09/17 18:08:12 / 20654695_東京海上ホールディングス株式会社_総会その他(C)
Solvency margin ratio (non-consolidated) for Tokio Marine Millea SAST Insurance Co., Ltd.(Yen in millions)
As of March 31, 2020 As of March 31, 2019
(A) Total amount of solvency margin 1,495 1,485Total net assets excluding deferred assets, etc. 1,413 1,400Reserve for price fluctuation — —Catastrophe loss reserve 6 5General allowance for doubtful accounts — —Unrealized gains (losses) on available-for-sale securitiesbefore tax effect deductions — —
Unrealized gains (losses) on land — —Part of reserve for dividends to policyholders excluding dividendsfor following period — —
Future profit — —Tax effect 75 79Subordinated debt, etc. — —Deductions — —
(B) Total amount of risks √R12+R2
2+R3+R4 97 89Insurance risk 25 24
General insurance risk (R1) 5 5Catastrophe risk (R4) 19 19
Asset management risk (R2) 75 67Business administration risk (R3) 2 1
(C) Solvency margin ratio [(A)/{(B) × 1/2}] × 100 3,070.9% 3,327.6%
Note: The above figures are calculated in accordance with Article 211-59 and 211-60 of the Ordinance for Enforcement of the Insurance Business Act and Public Notice No. 14 issued by the Financial Services Agency in 2006.
Solvency margin ratio (non-consolidated) for Tokio Marine West SAST Insurance Co., Ltd.(Yen in millions)
As of March 31, 2020 As of March 31, 2019
(A) Total amount of solvency margin 1,069 758Total net assets excluding deferred assets, etc. 851 628Reserve for price fluctuation — —Catastrophe loss reserve 3 2General allowance for doubtful accounts — —Unrealized gains (losses) on available-for-sale securities beforetax effect deductions — —
Unrealized gains (losses) on land — —Part of reserve for dividends to policyholders excluding dividendsfor following period — —
Future profit — —Tax effect 214 127Subordinated debt, etc. — —Deductions — —
(B) Total amount of risks √R12+R2
2+R3+R4 69 59Insurance risk 17 15
General insurance risk (R1) 3 3Catastrophe risk (R4) 13 12
Asset management risk (R2) 54 45Business administration risk (R3) 1 1
(C) Solvency margin ratio [(A)/{(B) × 1/2}] × 100 3,077.9% 2,558.1%
Note: The above figures are calculated in accordance with Article 211-59 and 211-60 of the Ordinance for Enforcement of the Insurance Business Act and Public Notice No. 14 issued by the Financial Services Agency in 2006.
156
Solvency margin ratio (non-consolidated) for Tokio Marine Millea SAST Insurance Co., Ltd.、Solvency margin ratio (non-consolidated) for Tokio Marine West SAST Insurance Co., Ltd.
Market Consistent Embedded Value (MCEV) (Unaudited)Embedded Value for Tokio Marine & Nichido Life Insurance Co., Ltd.(TMNL) (Unaudited)
Part4 | Fin
ancial D
ata
2020/09/17 18:08:12 / 20654695_東京海上ホールディングス株式会社_総会その他(C)
About MCEVThe current Japanese financial accounting standards focus on conservativeness and have the limitation that the profits generated from life insurance business are generally undervalued shortly after underwriting contracts in terms of the valuation and assessment of performance of life insurance business. Embedded values (EV) are calculated as the total of the "adjusted net worth" and the "value of in-force." EV is designed to address the limitations of the financial accounting standards in order to facilitate an appropriate evaluation of value and improve performance assessment, considering the actual situation of the business performance. While there have been various methodologies for calculation of EV, the European Insurance CFO Forum released its MCEV Principles, the European Insurance CFO Forum Market Consistent Embedded Value Principles, in June 2008, to enhance the consistency of valuation standards and unify the standards for disclosures. TMNL has been disclosing its EV in compliance with the MCEV Principles to enhance the disclosure since the fiscal year ended March 31, 2015.
MCEV as of March 31, 20201. MCEV as of March 31, 2020MCEV of TMNL as of March 31, 2020, was 990.5 billion yen, a decrease of 85.4 billion yen from the previous fiscal year end (March 31, 2019), mainly due to economic variances of (132.4) billion yen.MCEV consisted of 1,113.0 billion yen of adjusted net worth and (122.4) billion yen of value of in-force.
(Billions of yen)
FY2019 FY2018 FY2017
Adjusted net worth 1,113.0 1,119.5 910.9Value of in-force (122.4) (43.5) 337.8
MCEV at fiscal year-end 990.5 1,076.0 1,248.7New business value 37.3 59.5 64.6
0
400
800
1,200
1,600
1,076.01,248.7
990.5
FY2018 FY2017FY2019
MCEV at Fiscal Year-End(Billions of yen)
2. Change in MCEVDuring FY2019, the change in MCEV (before dividends paid) was (70.3) billion yen, which was an increase on 88.3 billion yen from the previous fiscal year change in MCEV (FY2018). This was mainly due to economic variances (132.4) billion yen resulting from a lower decline in interest rates in FY2019, compared to economic variances (184.6) billion yen in FY2018. (For details on the changes, refer to "Reconciliation Analysis of MCEV from the End of FY2018.")
(Billions of yen)
FY2019 FY2018
Change in MCEV(Before dividends paid) (70.3) (158.6)
(Reference)Change in MCEV(Before dividends paid and excluding economic variances)
62.0 25.9
157
About MCEV、MCEV as of March 31, 2020

Market Consistent Embedded Value (MCEV) (Unaudited)Embedded Value for Tokio Marine & Nichido Life Insurance Co., Ltd.(TMNL) (Unaudited)
Tokio Marine Holdings, Inc. | Integrated Annual Report 2020
2020/09/17 18:08:12 / 20654695_東京海上ホールディングス株式会社_総会その他(C)
Reconciliation Analysis of MCEV from the End of FY 2018The table below shows the reconciliation analysis of MCEV as of March 31, 2020 with the MCEV as of March 31, 2019.
(Billions of yen)
MCEV
Opening MCEV (MCEV as of March 31, 2019) 1,076.0(1) Dividends paid (15.1)
Adjusted opening MCEV 1,060.9(2) New business value 37.3(3) Expected existing business contribution (risk-free rate) 22.1(4) Expected existing business contribution (in excess of risk-free rate) 3.3(5) Actuarial experience variances (21.7)(6) Actuarial assumption changes 16.7(7) Other operating variances 4.2(8) Operating MCEV earnings ((2)–(7)) 62.0(9) Economic variances (132.4)(10) Other non-operating variances ―
Total MCEV earnings (before dividends paid) (70.3)Closing MCEV (MCEV as of March 31, 2020) 990.5
Sensitivity AnalysisThe impacts of changing specified assumptions underlying the MCEV are as follows.Sensitivity analysis of change in MCEV
(Billions of yen)
Assumption Change in assumption MCEV Change in amount Rate of change
Base case: MCEV at the end of March 2020 No change 990.5 ― ―(1) Interest rates 50bp decrease 809.0 (181.4) (18.3%)
50bp increase 1,055.3 64.7 6.5%Swap 489.5 (501.0) (50.6%)Constant fwd rate 887.4 (103.0) (10.4%)Ultimate fwd rate 1,469.8 479.3 48.4%
(2) Stock/real estate market values 10% decrease 987.8 (2.7) (0.3%)(3) Stock/real estate implied volatility 25% increase 988.4 (2.1) (0.2%)(4) Interest swaption implied volatility 25% increase 958.3 (32.2) (3.3%)(5) Maintenance expenses 10% decrease 1,034.9 44.4 4.5%(6) Surrender and lapse rates ×0.9 929.1 (61.4) (6.2%)(7) Mortality rates Death protection products: ×0.95 1,009.3 18.7 1.9%
A&H products and annuityproducts: ×0.95 974.8 (15.6) (1.6%)
(8) Morbidity rates ×0.95 1,069.8 79.3 8.0%(9) Required capital Solvency margin ratio of 200% 990.5 ― ―(10) Foreign exchange rates 10% appreciation of JPY 991.6 1.1 0.1%
Assumptions1. Risk-Free RatesWe have used government bond yields as of the end of March 2020.Although the 1-year forward rates in the 41st year and thereafter are usually equal to the 1-year forward rate in the 40th year, starting with the information disclosed as of the end of March 2020, the Company has changed to an estimation method that adjusts the 1-year forward rate of government bonds in the 41st year and thereafter according to the past yield fluctuations in the 40-year spot rate.We have adjusted and used Bloomberg’s government bond yields as our data source.The government bond yields (spot rates) for key terms are shown below.
JPY
Term End of March 2020 End of March 2020(Prev. Method) End of March 2019
1 year (0.14%) (0.14%) (0.18%)5 years (0.12%) (0.12%) (0.21%)
10 years 0.04% 0.04% (0.08%)20 years 0.35% 0.35% 0.37%30 years 0.45% 0.45% 0.55%40 years 0.44% 0.44% 0.62%50 years 0.53% 0.41% 0.67%
158
Reconciliation Analysis of MCEV from the End of Fiscal 2018、Sensitivity Analysis、Assumptions
Part4 | Fin
ancial D
ata
2020/09/17 18:08:12 / 20654695_東京海上ホールディングス株式会社_総会その他(C)
The sensitivity analysis in P.158 presented the impact of changing the extrapolation of JPY-interest rates beyond the 40th year to use an ultimate forward rate (UFR) method. This UFR method entails setting the JPY ultimate forward rate to 3.8%, extrapolating rates from year 30,and applying the Smith-Wilson method so that forward rates from the 31st year onwards approach to the UFR in 30 years. This method was established with reference to the global Insurance Capital Standard (ICS) currently in development by the International Association of Insurance Supervisors (IAIS). Representative JPY interest rates are as follows:
JPY
Term End of March 20201 year (0.14%)5 years (0.12%)
10 years 0.04%20 years 0.35%30 years 0.45%40 years 0.92%50 years 1.45%
We have not included a liquidity premium in the risk-free rates given that definitions in the MCEV Principles are not clear and generally accepted practice has not yet been established. Negative interest rates are not floored at zero.
2. Insurance Assumptions
Assumptions Basis of assumptions
Mortality and morbidity rates
Mortality and morbidity rates are developed based on claims experience of the latest 1–3 years,in principle, by type of protection, policy year, attained age, and other attributes.For policy years with no experience data, assumptions are developed with reference toindustry data.We have reflected improvement trends for mortality rates and improving trends or deteriorating trends for A&H morbidity rates of some benefits. The projection period for which these trends are reflected is limited to 5 years.
Surrender and lapse ratesSurrender and lapse rates are developed based on the experience of the most recent year,in principle, by line of business, premium mode, and policy year.
Renewal ratesRenewal rates are developed based on past experience. Policies for which renewals are projectedare A&H products, whose impact is large due to a high number of limited term in-force policies.For the sake of simplicity, we have not reflected future renewals for some riders.
Operating expense rates
Operating expense rates are developed from past experience based on the ratio (unit cost) of overall actual operating expenditures to the policy count or the premium separately for acquisition and maintenance expenses. Some of the operating expense rates were adjusted by removing one-off costs which are not ordinarily expected to be incurred in future periods. The removed one-off cost is 290 million yen, which is tied primarily to a portion of system development costs. With regard to system development costs for policy acquisition and maintenance, and the information technology device costs for policy maintenance, the average amount incurred over the past five years is reflected in the corresponding unit costs. An increase due to inflation is reflected in future maintenance expenses.Corporate administration costs paid to the parent company are reflected in unit costs. Other than this, there is no look-through effect with regards to other companies within the Tokio Marine Group that needs to be reflected.
Effective tax rateThe effective tax rate is set as follows:Fiscal 2019 and thereafter: 28.0%
Consumption tax rateThe consumption tax rate is set as follows:April 2018‒September 2019: 8%October 2019 and thereafter: 10%
Inflation rate
With reference to the break-even inflation rate from the most recently issued inflation index-linked government bond and the past Consumer Price Index (CPI), as well as the impact of the consumption tax increase and other factors, inflation rates are set as shown below.MCEV as of March 31, 2020: 0.3%
Policyholder dividendFor products with interest dividends paid every 5 years, dividend rates are set based onthe interest rate level in future periods using the method consistent with the one applied todetermine the most recent dividend results.
Reinsurance
Reinsurance premiums are recorded as expenses and reinsurance claims are recorded as profitto reflect the fact that the Company cedes mortality risks on death protection insurance, thirdsector risks on third sector and part of the minimum guarantee risks of variable annuities.Reinsurance premiums and reinsurance claims are based on reinsurance agreements.
CaveatsEmbedded values are calculated using various assumptions about the drivers of future results and the risks and uncertainties inherent in those results; future experience may deviate, possibly materially, from that underlying the forecasts used in the EV calculation. Also, the actual market value is determined as a result of informed judgments of investors and may differ materially from an embedded value. As such, embedded values should be used with sufficient caution.
159
Assumptions、Caveats

Corporate Overview
Tokio Marine Holdings, Inc. | Integrated Annual Report 2020
2020/09/17 18:08:12 / 20654695_東京海上ホールディングス株式会社_総会その他(C)
Tokio Marine Holdings and Its Subsidiaries(As of March 31, 2020)
Description of BusinessTokio Marine Group consists of Tokio Marine Holdings, Inc., 252 subsidiaries and 22 affiliates, and is engaged in the domestic non-life insurance, domestic life insurance, international insurance, and financial and general businesses. In addition, Tokio Marine Holdings is a specified listed company. Due to the specified listed company designation, the de minimis standard for insider trading regulations is determined on a consolidated basis. The following is a diagram of businesses as of March 31, 2020.
Business Diagram
Tokio Marine Holdings, Inc.
Domestic Non-Life Insurance Business
Property and casualty insurance business
Small-amount short-term insurance business
Domestic Life Insurance Business
International Insurance Business
International non-life insurance business
International life insurance business
Other business
Financial and General Businesses
Investment advisory and investment trust services
Note: indicates consolidated subsidiaries; indicates equity-method affiliates
Tokio Marine & Nichido Fire Insurance Co., Ltd.Nisshin Fire & Marine Insurance Co., Ltd.E. design Insurance Co., Ltd.
Tokio Marine Millea SAST Insurance Co., Ltd.
Tokio Marine & Nichido Life Insurance Co., Ltd.
Tokio Marine Asset Management Co., Ltd.
Philadelphia Indemnity Insurance CompanyFirst Insurance Company of Hawaii, Ltd.Tokio Marine America Insurance CompanySafety National Casualty CorporationHouston Casualty CompanyU.S. Specialty Insurance CompanyTokio Marine Underwriting LimitedHCC International Insurance Company PLCTokio Marine Insurance Singapore Ltd.Tokio Marine Insurans (Malaysia) BerhadTokio Marine Safety Insurance (Thailand) Public Company LimitedTokio Marine Seguradora S.A.IFFCO-TOKIO General Insurance Company Limited
Reliance Standard Life Insurance CompanyReliance Standard Life Insurance Company of TexasHCC Life Insurance CompanyTokio Marine Life Insurance Singapore Ltd.Tokio Marine Life Insurance Malaysia Bhd.Edelweiss Tokio Life Insurance Company Limited
Tokio Marine North America, Inc.Philadelphia Consolidated Holding Corp.Delphi Financial Group, Inc.HCC Insurance Holdings, Inc.Privilege Underwriters, Inc.Tokio Marine Kiln Group Limited Tokio Marine Asia Pte. Ltd. Hollard Holdings Proprietary LimitedHollard International Proprietary Limited
160
Tokio Marine Holdings and Its Subsidiaries
Part4 | C
orp
orate O
verview
2020/09/17 18:08:12 / 20654695_東京海上ホールディングス株式会社_総会その他(C)
Major Subsidiaries(As of March 31, 2020)
Company nameDate of
incorpora-tion
Paid-in capital
Ratio ofTokio Marine
Holdings’voting rights1
(%)
Ratio ofTokio Marine
Holdings’subsidiaries’voting rights2
(%)
Location Major business
Tokio Marine & Nichido Fire Insurance Mar. 20,19443
JPY101,994million 100 0 2-1, Marunouchi 1-chome, Chiyoda-ku,
Tokyo, JapanDomestic non-lifeinsurance
Nisshin Fire & Marine Insurance Co., Ltd. June 10,1908
JPY20,389million 100 0 3, Kanda-Surugadai 2-chome, Chiyoda-ku,
Tokyo, JapanDomestic non-lifeinsurance
E. design Insurance Co., Ltd. Jan. 26,2009
JPY29,303million 95.2 0 20-2, Nishi-Shinjuku 3-chome, Shinjuku- ku,
Tokyo, JapanDomestic non-lifeinsurance
Tokio Marine & Nichido Life InsuranceCo., Ltd.
Aug. 6,1996
JPY55,000million 100 0 2-1, Marunouchi 1-chome, Chiyoda-ku,
Tokyo, JapanDomestic lifeinsurance
Tokio Marine Millea SAST Insurance Co.,Ltd.
Sept. 1,2003
JPY895million 100 0 2-1-1, Minatomirai 2-chome, Nishi-ku,
Yokohama, Kanagawa Prefecture, JapanDomestic non-lifeinsurance
Tokio Marine Asset Management Co., Ltd. Dec. 9,1985
JPY2,000million 100 0 Tekko Building 8-2, Marunouchi 1-chome,
Chiyoda-ku, Tokyo, JapanFinancial andgeneralbusinesses
Tokio Marine North America, Inc. June 29,2011
USD0thousand 0 100 251 Little Falls Drive Wilmington, DE 19808 USA International
insurance
Philadelphia Consolidated Holding Corp. July 6,1981
USD1thousand 0 100 One Bala Plaza, Suite 100, Bala Cynwyd, PA
19004 USAInternationalinsurance
Philadelphia Indemnity InsuranceCompany
Feb. 4,1927
USD4,500thousand 0 100 One Bala Plaza, Suite 100, Bala Cynwyd, PA
19004 USAInternationalinsurance
First Insurance Company of Hawaii, Ltd. Aug. 6,1982
USD4,272thousand 0 100 1100 Ward Avenue, Honolulu, Hawaii 96814 USA International
insurance
Tokio Marine America InsuranceCompany
Aug. 13,1998
USD5,000thousand 0 100 1221 Avenue of the Americas, Ste 1500,
New York, NY 10020 USAInternationalinsurance
Delphi Financial Group, Inc. May 27,1987
USD1thousand 0 100 1105 North Market Street, Suite 1230,
Wilmington, DE 19801 USAInternationalinsurance
Safety National Casualty Corporation Nov. 28,1942
USD30,000thousand 0 100 1832 Schuetz Road, St. Louis, MO 63146 USA International
insurance
Reliance Standard Life InsuranceCompany
April 2,1907
USD56,003thousand 0 100 1100 E. Woodfield Road, Suite 437
Schaumburg, IL 60173 USAInternationalinsurance
Reliance Standard Life InsuranceCompany of Texas
Aug. 16,1983
USD700thousand 0 100 7600 West Tidwell Road, Suite 111 Houston,
TX 77040 USAInternationalinsurance
HCC Insurance Holdings, Inc. Mar. 27,1991
USD1thousand 0 100 1209 Orange St. Wilmington, DE 19801 USA International
insurance
Houston Casualty Company May 27,1981
USD5,000thousand 0 100 1999 Bryan St. Suite 900 Dallas,
TX 75201-3136 USAInternationalinsurance
U.S. Specialty Insurance Company Oct. 28,1986
USD4,200thousand 0 100 1999 Bryan St. Suite 900 Dallas,
TX 75201-3136 USAInternationalinsurance
HCC Life Insurance Company Dec. 3,1980
USD2,500thousand 0 100 150 West Market Street Suite 800
Indianapolis, IN 46204 USAInternationalinsurance
Privilege Underwriters, Inc. Jan. 5,2006
USD0thousand 0 100
3411 Silverside Road Tatnall Building #104, City ofWilmington, County of New Castle, Delaware19805 USA
Internationalinsurance
Tokio Marine Kiln Group Limited July 11,1994
GBP1,010thousand 0 100 20 Fenchurch Street, London, EC3M 3BY, UK International
insurance
Tokio Marine Underwriting Limited Oct. 27,2008
GBP0thousand 0 100 20 Fenchurch Street, London, EC3M 3BY, UK International
insurance
HCC International Insurance CompanyPLC
July 22,1981
USD70,197thousand
GBP96,047thousand
0 100 1 Aldgate, London, EC3N 1RE, UK Internationalinsurance
Tokio Marine Asia Pte. Ltd. Mar. 12,1992
SGD1,250,971thousand
THB542,000thousand
ZAR5,000,000thousand
0 100 20 McCallum Street, #13-01 Tokio MarineCentre, Singapore 069046, Singapore
Internationalinsurance
Tokio Marine Insurance Singapore Ltd. July 11,1923
SGD100,000thousand 0 100 20 McCallum Street, #09-01 Tokio Marine
Centre, Singapore 069046, SingaporeInternationalinsurance
Tokio Marine Life Insurance SingaporeLtd.
May 21,1948
SGD36,000thousand 0 85.7 20 McCallum Street, #07-01 Tokio Marine
Centre, Singapore 069046, SingaporeInternationalinsurance
Tokio Marine Insurans (Malaysia) Berhad April 28,1999
MYR403,471thousand 0 100 Level 23, Menara Tokio Marine Life 189, Jalan
Tun Razak, 50400, Kuala Lumpur, MalaysiaInternationalinsurance
Tokio Marine Life Insurance MalaysiaBhd.
Feb. 11,1998
MYR226,000thousand 0 100 Level 23, Menara Tokio Marine Life 189, Jalan
Tun Razak, 50400 Kuala Lumpur, MalaysiaInternationalinsurance
Tokio Marine Safety Insurance (Thailand)Public Company Limited
Feb. 3,2020
THB4,096,958thousand 0 99.3
No. 26/5-8, 26/10-11, 26/16-19 Orakarn Building,1st, 2nd, 4th and 6th Floors, Chidlom Road,Khwaeng Lumpini, Khet Pathumwan, Bangkok, Thailand
Internationalinsurance
Tokio Marine Seguradora S.A. June 23,1937
BRL965,163thousand 0 97.8 R. Sampaio Viana, 44 CEP: 04004-902
São Paulo, SP, BrazilInternationalinsurance
Affiliate accounted for by the equity method
IFFCO-TOKIO General InsuranceCompany Limited
Sept. 8,2000
INR2,742,183thousand 0 49 IFFCO Sadan, C-1, Distt, Centre, Saket,
New Delhi 110017, IndiaInternationalinsurance
Edelweiss Tokio Life Insurance CompanyLimited
Nov. 25,2009
INR3,126,208thousand 0 49
6th Floor, Tower 3, Wing B, Kohinoor City Mall,Kohinoor City, Kirol Road, Kurla(west),Mumbai-400 070, India
Internationalinsurance
Hollard Holdings Proprietary Limited Mar. 30,1972
ZAR9thousand 0 22.5 22 Oxford Road,
Parktown, Johannesburg 2193 South AfricaInternationalinsurance
Hollard International Proprietary Limited April 20,2015
ZAR4,188,313thousand 0 22.5 22 Oxford Road,
Parktown, Johannesburg 2193 South AfricaInternationalinsurance
1 The ratio of voting rights of said subsidiaries held by Tokio Marine Holdings to total voting rights2 The ratio of voting rights of said subsidiaries held by Tokio Marine Holdings’ subsidiaries to total voting rights3 Founded on August 1, 1879
161
Tokio Marine Holdings and Its Subsidiaries
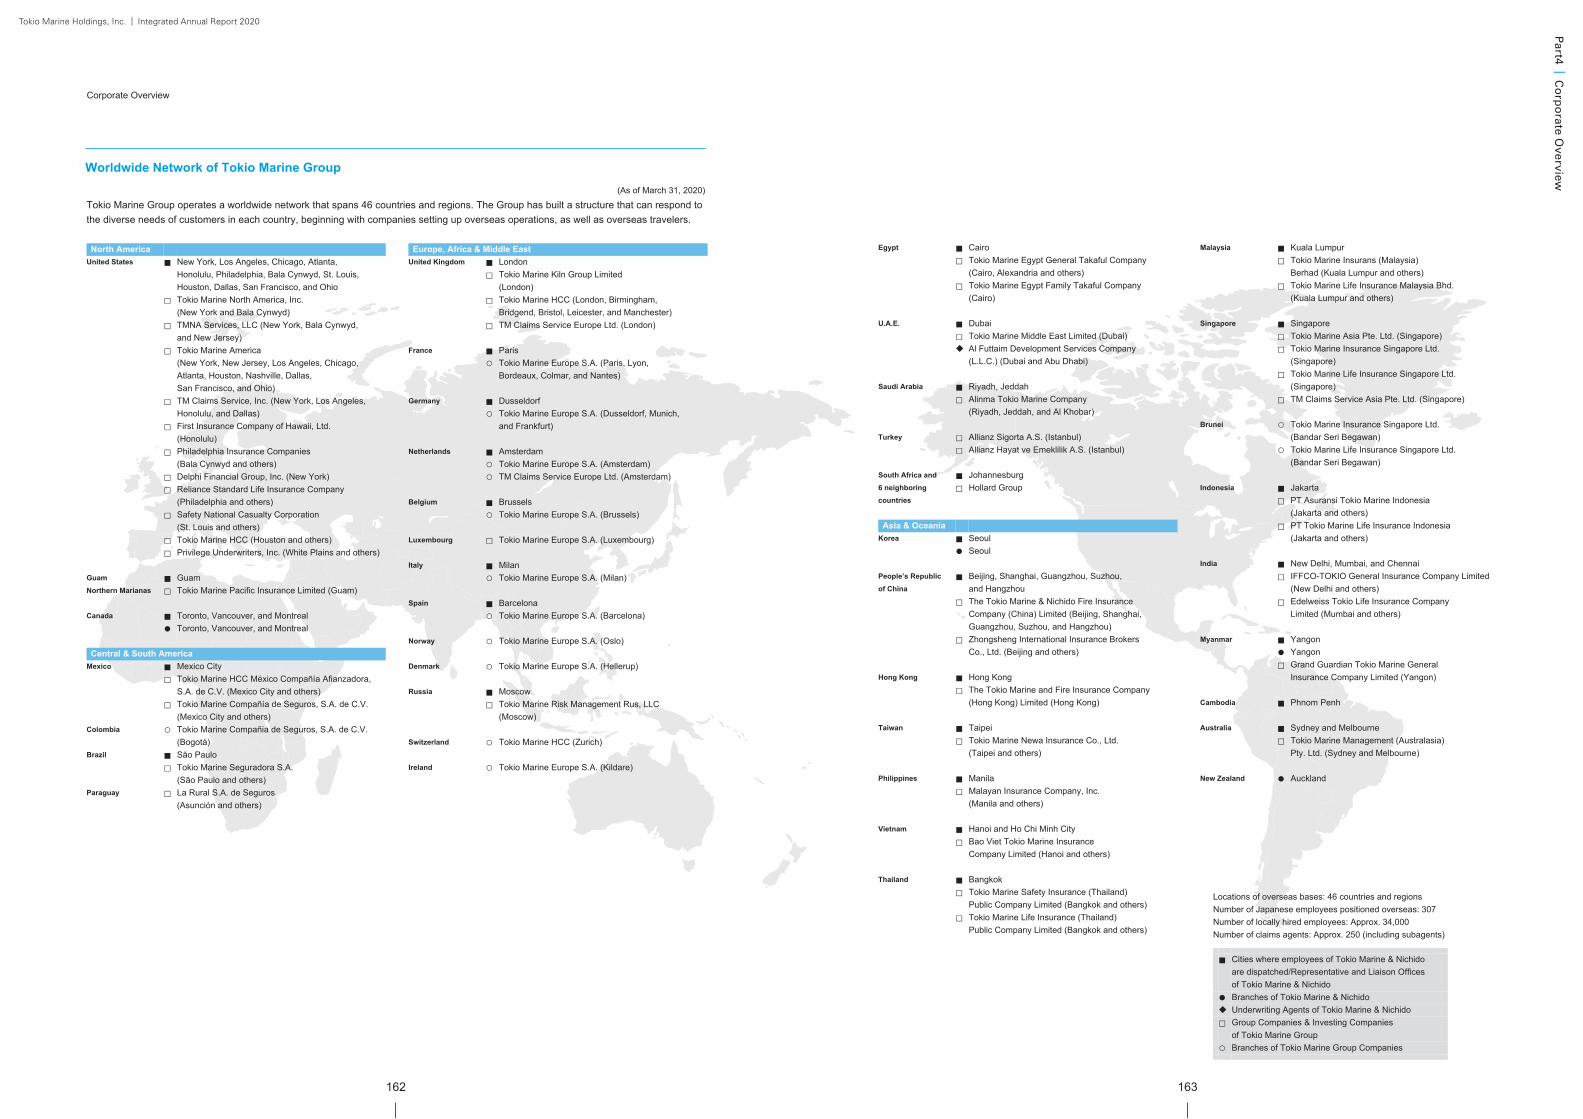
Corporate Overview
Tokio Marine Holdings, Inc. | Integrated Annual Report 2020
2020/09/17 18:08:12 / 20654695_東京海上ホールディングス株式会社_総会その他(C)
Worldwide Network of Tokio Marine Group(As of March 31, 2020)
Tokio Marine Group operates a worldwide network that spans 46 countries and regions. The Group has built a structure that can respond to the diverse needs of customers in each country, beginning with companies setting up overseas operations, as well as overseas travelers.
North AmericaUnited States ■ New York, Los Angeles, Chicago, Atlanta,
Honolulu, Philadelphia, Bala Cynwyd, St. Louis,Houston, Dallas, San Francisco, and Ohio
□ Tokio Marine North America, Inc.(New York and Bala Cynwyd)
□ TMNA Services, LLC (New York, Bala Cynwyd,and New Jersey)
□ Tokio Marine America(New York, New Jersey, Los Angeles, Chicago,Atlanta, Houston, Nashville, Dallas,San Francisco, and Ohio)
□ TM Claims Service, Inc. (New York, Los Angeles,Honolulu, and Dallas)
□ First Insurance Company of Hawaii, Ltd.(Honolulu)
□ Philadelphia Insurance Companies(Bala Cynwyd and others)
□ Delphi Financial Group, Inc. (New York)□ Reliance Standard Life Insurance Company
(Philadelphia and others)□ Safety National Casualty Corporation
(St. Louis and others)□ Tokio Marine HCC (Houston and others)□ Privilege Underwriters, Inc. (White Plains and others)
Guam ■ GuamNorthern Marianas □ Tokio Marine Pacific Insurance Limited (Guam)
Canada ■ Toronto, Vancouver, and Montreal● Toronto, Vancouver, and Montreal
Central & South AmericaMexico ■ Mexico City
□ Tokio Marine HCC México Compañía Afianzadora,S.A. de C.V. (Mexico City and others)
□ Tokio Marine Compañía de Seguros, S.A. de C.V.(Mexico City and others)
Colombia ○ Tokio Marine Compañia de Seguros, S.A. de C.V.(Bogotá)
Brazil ■ São Paulo□ Tokio Marine Seguradora S.A.
(São Paulo and others)Paraguay □ La Rural S.A. de Seguros
(Asunción and others)
Europe, Africa & Middle EastUnited Kingdom ■ London
□ Tokio Marine Kiln Group Limited(London)
□ Tokio Marine HCC (London, Birmingham,Bridgend, Bristol, Leicester, and Manchester)
□ TM Claims Service Europe Ltd. (London)
France ■ Paris○ Tokio Marine Europe S.A. (Paris, Lyon,
Bordeaux, Colmar, and Nantes)
Germany ■ Dusseldorf○ Tokio Marine Europe S.A. (Dusseldorf, Munich,
and Frankfurt)
Netherlands ■ Amsterdam○ Tokio Marine Europe S.A. (Amsterdam)○ TM Claims Service Europe Ltd. (Amsterdam)
Belgium ■ Brussels○ Tokio Marine Europe S.A. (Brussels)
Luxembourg □ Tokio Marine Europe S.A. (Luxembourg)
Italy ■ Milan○ Tokio Marine Europe S.A. (Milan)
Spain ■ Barcelona○ Tokio Marine Europe S.A. (Barcelona)
Norway ○ Tokio Marine Europe S.A. (Oslo)
Denmark ○ Tokio Marine Europe S.A. (Hellerup)
Russia ■ Moscow□ Tokio Marine Risk Management Rus, LLC
(Moscow)
Switzerland ○ Tokio Marine HCC (Zurich)
Ireland ○ Tokio Marine Europe S.A. (Kildare)
162
Worldwide Network of Tokio Marine Group
Part4 | C
orp
orate O
verview
2020/09/17 18:08:12 / 20654695_東京海上ホールディングス株式会社_総会その他(C)
Egypt ■ Cairo□ Tokio Marine Egypt General Takaful Company
(Cairo, Alexandria and others)□ Tokio Marine Egypt Family Takaful Company
(Cairo)
U.A.E. ■ Dubai□ Tokio Marine Middle East Limited (Dubai)◆ Al Futtaim Development Services Company
(L.L.C.) (Dubai and Abu Dhabi)
Saudi Arabia ■ Riyadh, Jeddah□ Alinma Tokio Marine Company
(Riyadh, Jeddah, and Al Khobar)
Turkey □ Allianz Sigorta A.S. (Istanbul)□ Allianz Hayat ve Emeklilik A.S. (Istanbul)
South Africa and6 neighboringcountries
■ Johannesburg□ Hollard Group
Asia & OceaniaKorea ■ Seoul
● Seoul
People’s Republicof China
■ Beijing, Shanghai, Guangzhou, Suzhou,and Hangzhou
□ The Tokio Marine & Nichido Fire InsuranceCompany (China) Limited (Beijing, Shanghai,Guangzhou, Suzhou, and Hangzhou)
□ Zhongsheng International Insurance BrokersCo., Ltd. (Beijing and others)
Hong Kong ■ Hong Kong□ The Tokio Marine and Fire Insurance Company
(Hong Kong) Limited (Hong Kong)
Taiwan ■ Taipei□ Tokio Marine Newa Insurance Co., Ltd.
(Taipei and others)
Philippines ■ Manila□ Malayan Insurance Company, Inc.
(Manila and others)
Vietnam ■ Hanoi and Ho Chi Minh City□ Bao Viet Tokio Marine Insurance
Company Limited (Hanoi and others)
Thailand ■ Bangkok□ Tokio Marine Safety Insurance (Thailand)
Public Company Limited (Bangkok and others)□ Tokio Marine Life Insurance (Thailand)
Public Company Limited (Bangkok and others)
Malaysia ■ Kuala Lumpur□ Tokio Marine Insurans (Malaysia)
Berhad (Kuala Lumpur and others)□ Tokio Marine Life Insurance Malaysia Bhd.
(Kuala Lumpur and others)
Singapore ■ Singapore□ Tokio Marine Asia Pte. Ltd. (Singapore)□ Tokio Marine Insurance Singapore Ltd.
(Singapore)□ Tokio Marine Life Insurance Singapore Ltd.
(Singapore)□ TM Claims Service Asia Pte. Ltd. (Singapore)
Brunei ○ Tokio Marine Insurance Singapore Ltd.(Bandar Seri Begawan)
○ Tokio Marine Life Insurance Singapore Ltd.(Bandar Seri Begawan)
Indonesia ■ Jakarta□ PT Asuransi Tokio Marine Indonesia
(Jakarta and others)□ PT Tokio Marine Life Insurance Indonesia
(Jakarta and others)
India ■ New Delhi, Mumbai, and Chennai□ IFFCO-TOKIO General Insurance Company Limited
(New Delhi and others)□ Edelweiss Tokio Life Insurance Company
Limited (Mumbai and others)
Myanmar ■ Yangon● Yangon□ Grand Guardian Tokio Marine General
Insurance Company Limited (Yangon)
Cambodia ■ Phnom Penh
Australia ■ Sydney and Melbourne□ Tokio Marine Management (Australasia)
Pty. Ltd. (Sydney and Melbourne)
New Zealand ● Auckland
Locations of overseas bases: 46 countries and regionsNumber of Japanese employees positioned overseas: 307Number of locally hired employees: Approx. 34,000Number of claims agents: Approx. 250 (including subagents)
■ Cities where employees of Tokio Marine & Nichidoare dispatched/Representative and Liaison Officesof Tokio Marine & Nichido
● Branches of Tokio Marine & Nichido◆ Underwriting Agents of Tokio Marine & Nichido□ Group Companies & Investing Companies
of Tokio Marine Group○ Branches of Tokio Marine Group Companies
163
Worldwide Network of Tokio Marine Group

Corporate Overview
Tokio Marine Holdings, Inc. | Integrated Annual Report 2020
2020/09/17 18:08:12 / 20654695_東京海上ホールディングス株式会社_総会その他(C)
Organizational Chart(As of April 1, 2020)
General Meeting ofShareholders
Audit & SupervisoryBoard Members
Audit &Supervisory Board
Office of Audit &Supervisory Board
Board of Directors
ManagementMeeting
Directors in Charge
NominationCommittee
CompensationCommittee
Internal ControlCommittee
Internal AuditDepartment
Legal &ComplianceDepartment
CorporatePlanning
Department
DigitalStrategy
Department
HumanResourcesDepartment
CorporateAdministration
Department
CorporateAccountingDepartment
RiskManagementDepartment
IT PlanningDepartment
GlobalRetention &ReinsuranceDepartment
InternationalBusiness
DevelopmentDepartment
FinancialPlanning
Department
Matters relating to internal audits of Tokio Marine Group
Matters relating to General Meeting of Shareholders, Board of Directors, and compliance, J-SOX, customer protection and others of Tokio Marine Group
Matters relating to business strategic planning, corporate communications, IR, M&A, development and management support for domestic subsidiaries, sustainability and others of Tokio Marine Group
Matters relating to digital strategy and others of Tokio Marine Group
Matters relatingto personnel strategies andothers of TokioMarine Group
Matters relating to general affairs and administration, assistance to executives, and disaster risk, business continuity management and others of Tokio Marine Group
Matters relating to financial reporting, taxes and others of Tokio Marine Group
Matters relating to integrated risk management and others of Tokio Marine Group
Matters relatingto IT strategiesand others ofTokio MarineGroup
Matters relating to underwriting, retention, reinsurance and others of Tokio Marine Group
Matters relating to strategies for international business, provision of business administration for overseas subsidiaries and others of Tokio Marine Group
Matters relating to asset management lead, strategies for financial business, provision of business administration for subsidiaries related to financial business and other businesses and others of Tokio Marine Group
Employees(As of March 31, 2020)
Number of employees 752Average age of employees 43.2 years oldAverage length of service of employees 19.0 years
Note: Most employees of Tokio Marine Holdings are seconded from its subsidiaries. Average length of service includes the years of service at these subsidiaries.
164
Organizational Chart、Employees
Facilities
Part4 | C
orp
orate O
verview
2020/09/17 18:08:12 / 20654695_東京海上ホールディングス株式会社_総会その他(C)
Overview of Capital InvestmentTokio Marine Group makes capital investments to improve customer services and streamline workflows. The following is a breakdown of capital investment in the fiscal year ended March 31, 2020.
Business segment Amount (Yen in millions)
Domestic non-life insurance 21,525Domestic life insurance 445International insurance 23,458Financial and general businesses 682Total 46,111
Status of Major FacilitiesThe following are the major facilities of Tokio Marine Holdings and its consolidated subsidiaries.
Tokio Marine Holdings (As of March 31, 2020)
Company name Office name (Location) Business segmentCarrying amount (Yen in millions) Number of
employeesRent (Yen in
millions)Land (m2) Buildings Movables
Tokio Marine Holdings Headquarters (Chiyoda-ku, Tokyo) Holding company―
(―)136 113 752 ―
Domestic subsidiaries (As of March 31, 2020)
Company name Office name (Location) Business segmentCarrying amount (Yen in millions) Number of
employeesRent (Yen in
millions)Land (m2) Buildings Movables
Tokio Marine & NichidoFire Insurance Co., Ltd.
Headquarters (Chiyoda-ku, Tokyo) in-cluding each Service Dept., TokyoCorporate Division, Tokyo AutomobileDivision, Commercial Lines ClaimsDept. 1, Claims Service Dept. 2, TokyoAutomobile Claims Service Dept.,Marketing Promotion Dept.(Governmental), Government SectorDept. 1&2, Health Care & WelfareInstitution Sector Dept., GroupAccount Marketing Dept., andFinancial Institutions Dept. andoverseas branches.
Domesticnon-lifeinsurance
34,985(65,929)
27,999 18,290 4,058 761
HokkaidoHokkaido Branch (Chuo-ku, Sapporo)and 6 other branches
Domesticnon-lifeinsurance
831(6,168)
962 454 662 532
TohokuSendai Branch (Aoba-ku, Sendai) and9 other branches
Domesticnon-lifeinsurance
2,507(10,237)
3,253 708 1,041 238
KantoTokyo Chuo Branch (Minato-ku, Tokyo)and 32 other branches
Domesticnon-lifeinsurance
8,023(13,026)
6,643 2,070 3,831 2,279
Tokai/HokurikuAichi Minami Branch (Naka-ku,Nagoya) and 26 other branches
Domesticnon-lifeinsurance
3,425(11,639)
8,323 1,311 2,337 936
KansaiOsaka Minami Branch (Chuo-ku,Osaka) and 24 other branches
Domesticnon-lifeinsurance
5,580(9,879)
4,965 1,495 2,275 1,641
Chugoku/ShikokuHiroshima Branch (Naka-ku,Hiroshima) and 14 other branches
Domesticnon-lifeinsurance
2,455(7,211)
3,141 838 1,324 834
KyushuFukuoka Chuo Branch (Hakata-ku,Fukuoka) and 13 other branches
Domesticnon-lifeinsurance
5,575(10,487)
4,432 858 1,549 278
165
Overview of Capital Investment、Status of Major Facilities
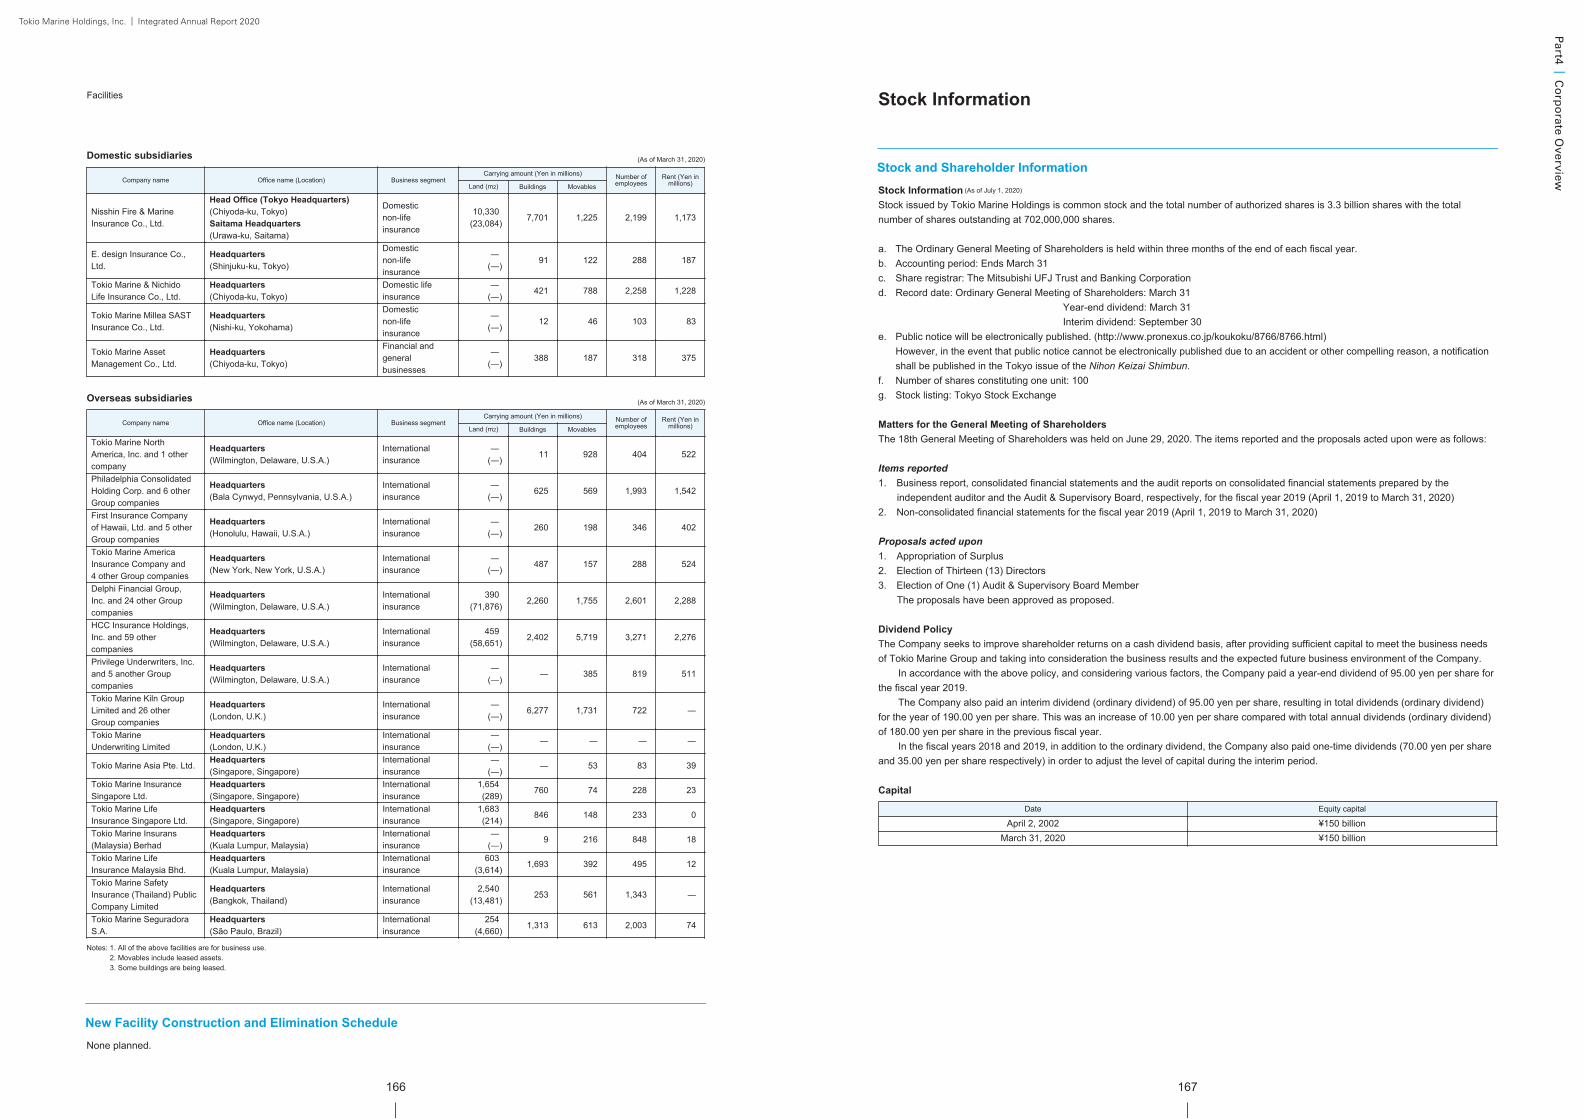
Facilities
Tokio Marine Holdings, Inc. | Integrated Annual Report 2020
2020/09/17 18:08:12 / 20654695_東京海上ホールディングス株式会社_総会その他(C)
Domestic subsidiaries (As of March 31, 2020)
Company name Office name (Location) Business segmentCarrying amount (Yen in millions) Number of
employeesRent (Yen in
millions)Land (m2) Buildings Movables
Nisshin Fire & MarineInsurance Co., Ltd.
Head Office (Tokyo Headquarters)(Chiyoda-ku, Tokyo)Saitama Headquarters(Urawa-ku, Saitama)
Domesticnon-lifeinsurance
10,330(23,084)
7,701 1,225 2,199 1,173
E. design Insurance Co.,Ltd.
Headquarters(Shinjuku-ku, Tokyo)
Domesticnon-lifeinsurance
―(―)
91 122 288 187
Tokio Marine & NichidoLife Insurance Co., Ltd.
Headquarters(Chiyoda-ku, Tokyo)
Domestic lifeinsurance
―(―)
421 788 2,258 1,228
Tokio Marine Millea SASTInsurance Co., Ltd.
Headquarters(Nishi-ku, Yokohama)
Domesticnon-lifeinsurance
―(―)
12 46 103 83
Tokio Marine AssetManagement Co., Ltd.
Headquarters(Chiyoda-ku, Tokyo)
Financial andgeneralbusinesses
―(―)
388 187 318 375
Overseas subsidiaries (As of March 31, 2020)
Company name Office name (Location) Business segmentCarrying amount (Yen in millions) Number of
employeesRent (Yen in
millions)Land (m2) Buildings Movables
Tokio Marine NorthAmerica, Inc. and 1 othercompany
Headquarters(Wilmington, Delaware, U.S.A.)
Internationalinsurance
―(―)
11 928 404 522
Philadelphia ConsolidatedHolding Corp. and 6 otherGroup companies
Headquarters(Bala Cynwyd, Pennsylvania, U.S.A.)
Internationalinsurance
―(―)
625 569 1,993 1,542
First Insurance Companyof Hawaii, Ltd. and 5 otherGroup companies
Headquarters(Honolulu, Hawaii, U.S.A.)
Internationalinsurance
―(―)
260 198 346 402
Tokio Marine AmericaInsurance Company and4 other Group companies
Headquarters(New York, New York, U.S.A.)
Internationalinsurance
―(―)
487 157 288 524
Delphi Financial Group,Inc. and 24 other Groupcompanies
Headquarters(Wilmington, Delaware, U.S.A.)
Internationalinsurance
390(71,876)
2,260 1,755 2,601 2,288
HCC Insurance Holdings,Inc. and 59 othercompanies
Headquarters(Wilmington, Delaware, U.S.A.)
Internationalinsurance
459(58,651)
2,402 5,719 3,271 2,276
Privilege Underwriters, Inc.and 5 another Groupcompanies
Headquarters(Wilmington, Delaware, U.S.A.)
Internationalinsurance
―(―)
― 385 819 511
Tokio Marine Kiln GroupLimited and 26 otherGroup companies
Headquarters(London, U.K.)
Internationalinsurance
―(―)
6,277 1,731 722 ―
Tokio MarineUnderwriting Limited
Headquarters(London, U.K.)
Internationalinsurance
―(―)
― ― ― ―
Tokio Marine Asia Pte. Ltd.Headquarters(Singapore, Singapore)
Internationalinsurance
―(―)
― 53 83 39
Tokio Marine InsuranceSingapore Ltd.
Headquarters(Singapore, Singapore)
Internationalinsurance
1,654(289)
760 74 228 23
Tokio Marine LifeInsurance Singapore Ltd.
Headquarters(Singapore, Singapore)
Internationalinsurance
1,683(214)
846 148 233 0
Tokio Marine Insurans(Malaysia) Berhad
Headquarters(Kuala Lumpur, Malaysia)
Internationalinsurance
―(―)
9 216 848 18
Tokio Marine LifeInsurance Malaysia Bhd.
Headquarters(Kuala Lumpur, Malaysia)
Internationalinsurance
603(3,614)
1,693 392 495 12
Tokio Marine SafetyInsurance (Thailand) PublicCompany Limited
Headquarters(Bangkok, Thailand)
Internationalinsurance
2,540(13,481)
253 561 1,343 ―
Tokio Marine SeguradoraS.A.
Headquarters(São Paulo, Brazil)
Internationalinsurance
254(4,660)
1,313 613 2,003 74
Notes: 1. All of the above facilities are for business use.2. Movables include leased assets.3. Some buildings are being leased.
New Facility Construction and Elimination ScheduleNone planned.
166
Status of Major Facilities、New Facility Construction and Elimination Schedule
Stock Information
Part4 | C
orp
orate O
verview
2020/09/17 18:08:12 / 20654695_東京海上ホールディングス株式会社_総会その他(C)
Stock and Shareholder InformationStock Information (As of July 1, 2020)
Stock issued by Tokio Marine Holdings is common stock and the total number of authorized shares is 3.3 billion shares with the total number of shares outstanding at 702,000,000 shares.
a. The Ordinary General Meeting of Shareholders is held within three months of the end of each fiscal year.b. Accounting period: Ends March 31c. Share registrar: The Mitsubishi UFJ Trust and Banking Corporationd. Record date: Ordinary General Meeting of Shareholders: March 31
Year-end dividend: March 31Interim dividend: September 30
e. Public notice will be electronically published. (http://www.pronexus.co.jp/koukoku/8766/8766.html)However, in the event that public notice cannot be electronically published due to an accident or other compelling reason, a notification shall be published in the Tokyo issue of the Nihon Keizai Shimbun.
f. Number of shares constituting one unit: 100g. Stock listing: Tokyo Stock Exchange
Matters for the General Meeting of ShareholdersThe 18th General Meeting of Shareholders was held on June 29, 2020. The items reported and the proposals acted upon were as follows:
Items reported1. Business report, consolidated financial statements and the audit reports on consolidated financial statements prepared by the
independent auditor and the Audit & Supervisory Board, respectively, for the fiscal year 2019 (April 1, 2019 to March 31, 2020)2. Non-consolidated financial statements for the fiscal year 2019 (April 1, 2019 to March 31, 2020)
Proposals acted upon1. Appropriation of Surplus2. Election of Thirteen (13) Directors3. Election of One (1) Audit & Supervisory Board Member
The proposals have been approved as proposed.
Dividend PolicyThe Company seeks to improve shareholder returns on a cash dividend basis, after providing sufficient capital to meet the business needs of Tokio Marine Group and taking into consideration the business results and the expected future business environment of the Company. In accordance with the above policy, and considering various factors, the Company paid a year-end dividend of 95.00 yen per share for the fiscal year 2019. The Company also paid an interim dividend (ordinary dividend) of 95.00 yen per share, resulting in total dividends (ordinary dividend) for the year of 190.00 yen per share. This was an increase of 10.00 yen per share compared with total annual dividends (ordinary dividend) of 180.00 yen per share in the previous fiscal year. In the fiscal years 2018 and 2019, in addition to the ordinary dividend, the Company also paid one-time dividends (70.00 yen per share and 35.00 yen per share respectively) in order to adjust the level of capital during the interim period.
Capital
Date Equity capital
April 2, 2002 ¥150 billionMarch 31, 2020 ¥150 billion
167
Stock and Shareholder Information

Stock Information
Tokio Marine Holdings, Inc. | Integrated Annual Report 2020
2020/09/17 18:08:12 / 20654695_東京海上ホールディングス株式会社_総会その他(C)
Stock Ownership DistributionAs of March 31, 2020, the number of shareholders was 75,979. The percentage of major stock ownership was 39.96% and 36.61% for financial institutions and foreign shareholders, respectively.
a. Types of shareholders (As of March 31, 2020)
Category Number of shareholders Number of shares Shareholding ratio (%)
Government/Local government 1 500 0.00Financial institutions 236 280,517,818 39.96Financial instruments firms 54 30,104,011 4.29Other domestic companies 1,403 46,467,594 6.62Foreign shareholders 1,020 256,993,953 36.61Individuals and others 73,264 83,786,489 11.94Treasury stocks 1 4,129,635 0.59Total 75,979 702,000,000 100.00
b. Breakdown by region (As of March 31, 2020)
Category Number of shareholders Shareholder ratio (%) Number of shares Shareholding ratio (%)
Hokkaido 1,020 1.34 1,847,814 0.26Tohoku 1,747 2.30 3,616,902 0.52Kanto 37,334 49.14 385,133,213 54.86Chubu 11,230 14.78 22,031,042 3.14Kinki 16,087 21.17 22,559,367 3.21Chugoku 2,779 3.66 2,822,782 0.40Shikoku 1,738 2.29 2,508,918 0.36Kyushu 2,966 3.90 4,396,829 0.63Overseas and others 1,078 1.42 257,083,133 36.62Total 75,979 100.00 702,000,000 100.00
c. Breakdown by number of shares held (As of March 31, 2020)
Category 5,000 units or more 1,000 units or more 500 units or more 100 units or more 50 units or more
Number of shareholders 167 256 200 1,340 2,272Composition ratios to totalnumber of shareholders (%) 0.22 0.34 0.26 1.76 2.99
Number of shares 540,920,819 58,995,222 14,250,952 25,322,321 14,753,732Composition ratios to totalnumber of shares (%) 77.05 8.40 2.03 3.61 2.10
Category 10 units or more 5 units or more 1 unit or more Less than 1 unit Total
Number of shareholders 18,043 14,793 29,010 9,898 75,979Composition ratios to totalnumber of shareholders (%) 23.75 19.47 38.18 13.03 100.00
Number of shares 33,912,828 8,370,357 5,145,248 328,521 702,000,000Composition ratios to totalnumber of shares (%) 4.83 1.19 0.73 0.05 100.00
168
Stock Ownership Distribution
Part4 | C
orp
orate O
verview
2020/09/17 18:08:12 / 20654695_東京海上ホールディングス株式会社_総会その他(C)
Top 10 Shareholders (As of March 31, 2020)
Shareholders AddressNumber ofshares held
(Thousand shares)
Composition ratios tototal number of shares
(excluding treasury stock)(%)
The Master Trust Bank of Japan, Ltd. (Trust Account)11-3, Hamamatsucho 2-chome, Minato-ku,Tokyo
62,433 8.95
Japan Trustee Services Bank, Ltd. (Trust Account) 8-11, Harumi 1-chome, Chuo-ku, Tokyo 46,105 6.61
Meiji Yasuda Life Insurance Company(Custodian: Trust & Custody Services Bank, Ltd.)
1-1, Marunouchi 2-chome, Chiyoda-ku,Tokyo (Harumi Island Triton Square OfficeTower Z, 8-12, Harumi 1-chome, Chuo-ku,Tokyo)
15,779 2.26
Japan Trustee Services Bank, Ltd. (Trust Account 5) 8-11, Harumi 1-chome, Chuo-ku, Tokyo 14,368 2.06SSBTC CLIENT OMNIBUS ACCOUNT(Custodian: Tokyo branch, The Hongkong andShanghai Banking Corporation Limited)
ONE LINCOLN STREET, BOSTON MA USA02111 (11-1, Nihonbashi 3-chome,Chuo-ku, Tokyo)
13,973 2.00
Japan Trustee Services Bank, Ltd. (Trust Account 9) 8-11, Harumi 1-chome, Chuo-ku, Tokyo 13,499 1.93Japan Trustee Services Bank, Ltd. (Trust Account 7) 8-11, Harumi 1-chome, Chuo-ku, Tokyo 13,158 1.89
JP MORGAN CHASE BANK 385151(Custodian: Mizuho Bank, Ltd. Settlement &Clearing Services Division)
25 BANK STREET, CANARY WHARF, LONDON,E14 5JP, UNITED KINGDOM (ShinagawaIntercity A Building, 15-1 Konan 2-chome,Minato-ku, Tokyo)
11,513 1.65
The Master Trust Bank of Japan, Ltd.(Retirement Benefits Trust Account for MitsubishiCorporation)
11-3, Hamamatsucho 2-chome,Minato-ku, Tokyo
10,832 1.55
STATE STREET BANK WEST CLIENT - TREATY 505234(Custodian: Mizuho Bank, Ltd. Settlement &Clearing Services Division)
1776 HERITAGE DRIVE,NORTH QUINCY, MA 02171, U.S.A.(Shinagawa Intercity ABuilding, 15-1 Konan 2-chome,Minato-ku, Tokyo)
9,867 1.41
0
1,000
2,000
3,000
4,000
5,000
6,000
0
20,000
40,000
60,000
80,000
100,000
120,000
Mar.2017
Mar.2018
Mar.2020
Mar.2019
Stock Price Range and Trading Volume(Yen) (Thousands of shares)
Stock price (left scale) Trading volume (right scale)
169
Stock Ownership Distribution(4C)
2020 Integrated
An
nu
al Rep
ort
This product is made of material from well-managed, FSC®-certified forests, and other controlled sources with vegetable oil ink.Printed in Japan
Protecting customers and societyin their times of need
To Bea GoodCompany”
”
Tokio Marine Nichido Building Shinkan, 2-1, Marunouchi 1-chome, Chiyoda-ku, Tokyo 100-0005, JapanTel: +81-3-6212-3333
Integrated Annual Report