Embed Size (px)
Citation preview

i
INTEGRATED APPRAISAL OF A REGIONAL AFRICAN SATELLITE
PROJECT
By
Glenn P. Jenkins Eastern Mediterranean University, North Cyprus
Queen’s University, Canada
Tumani Dembajang Queen’s University, Kingston, Canada
Development of Discussion Paper Number: 2005-02
Abstract
This paper reports on an integrated investment appraisal of a Pan African Development rural
satellite projects. The project’s main aim is to provide telecommunication services in rural
areas of Africa on a large scale at very low costs by using appropriate technology. The
objective is to complement the existing terrestrial fixed and mobile networks by providing
satellite services to areas which cannot be served economically by terrestrial infrastructure.
The project is expected to enhance inter-urban links within the borders of each African
country and provide direct links between all African countries without exception. With the
implementation of this project, the continent is expected to realize substantial savings of fees
currently being paid out as transit charges for intra-African traffic. Another feature of the
proposed satellite project is to facilitate television broadcasting, internet and other value-
added services for telecoms, internet service providers, TV broadcasters and data content
providers.
Report Prepared for: African Development Bank Tunis, Tunisia
JEL code(s): H43
Key words: Rural Telecommunication, telecommunication services, African
telecommunication, Rascom

ii
APPRAISAL OF REGIONAL AFRICAN SATELLITE
PROJECT (RASCOMSTAR-QAF)
PROJECT FEASIBILITY STUDY
Prepared for African Development Bank
Tunis, Tunisia
Prepared by John Deutsch International Executive Programs
Queen's University, Kingston, Ontario, Canada
October 2005

iii
AKNOWLEDGEMENTS
This project feasibility study has been prepared by John Deutsch International Executive
Programs, Queen's University, through the Showcase Projects Initiative undertaken by the
African Development Bank as part of the President’s project Quality Enhancement Initiative.
The project appraisal team wishes to thank the Canadian International Development Agency
for funding and its continuous encouragement of the Showcase Projects Initiative. The FFMA
department has hosted the Queen’s team and provided extensive logistics and support.
The feasibility study presented here is largely based on the information provided by the
OPSD department, undertaking the Rascom project on behalf of the African Development
Bank. The invaluable contribution of the Bank’s project appraisal team has been highly
appreciated. The Queen’s team wishes to thank Mr. Hassan H. Farah (Chief Investment
Officer), Ms. Isabelle Van Grunderbeeck (Investment Officer), Mr. Mahib Cisse (Senior
Infrastructure Engineer), and Mr. Ousseynou Nakoulima (Investment Officer). The Queen’s
team wishes to thank also the management of RascomStar-QAF for their assistance in
providing information.
The quality of the feasibility study has been enriched through numerous contributions by
Messrs. Geoffrey Manley (FFMA), Tony E.O. Onyango (FFMA), Sanders Mutandwa
(FFMA), James Tabi (FFMA), Raymond Zoukpo (FFMA), Timothy Turner (FFMA).
The Queen's University group working on this effort included the following individuals:
Zakaria Bellot (Investment Appraisal Analyst), Arkins .M. Kabungo (Investment Appraisal
Analyst), Tumani Dembajang (Investment Appraisal Analyst, and the lead analyst on this
project), Andrey Klevchuk (Project Manager), Chun-Yan (George) Kuo (Senior Fellow), and
Glenn P. Jenkins (Director).
iv
TABLE OF CONTENTS
1. INTRODUCTION ............................................................................................................ 1
2. PROJECT DESCRIPTION ............................................................................................... 3
2.1 Project Components ................................................................................................. 3
2.2 Project Costs ............................................................................................................ 4
2.3 Project Financing ..................................................................................................... 5
2.4 Satellite Services ...................................................................................................... 5
3. PROJECT REVENUES .................................................................................................... 7
3.1 TES Revenue ........................................................................................................... 8
3.2 TRS Revenue ........................................................................................................... 8
3.3 BLS Revenue ........................................................................................................... 8
4. TELECOMS’ INVESTMENT COST AND REVENUE ................................................. 9
4.1 Investment Costs for Telecoms ................................................................................ 9
4.2 Telecoms’ Revenue ................................................................................................ 10
5 FINANCIAL APPRAISAL ............................................................................................ 10
5.1 Approach ................................................................................................................ 10
5.2 Assumptions and Parameters ................................................................................. 11
5.3 Feasibility of RSQ Project ..................................................................................... 12
5.4 Financial Impact on Telecoms Operators .............................................................. 15
5.5 Financial Sensitivity Analysis................................................................................ 15
6. ECONOMIC APPARAISAL.......................................................................................... 22
6.1 Approach and Parameters ...................................................................................... 22
6.2. Economic Value of Telecommunication Services ................................................. 22
6.3 Economic Value of Cost Items .............................................................................. 26
6.4 Economic Feasibility of Project ............................................................................. 28
6.5 Economic Sensitivity Analysis .............................................................................. 30
7. STAKEHOLDER ANALYSIS ....................................................................................... 30
7.1 Identification of Externalities ................................................................................ 31
7.2 Distributive Analysis .................................................................................................
8. RISK ANALYSIS ........................................................................................................... 35
8.1 Selection of Risk Variables and Probability Distributions .................................... 36
8.2 Interpretation of Results ......................................................................................... 38
9. CONCLUSION ............................................................................................................... 41
9.1 Findings.................................................................................................................. 41
9.2 Risk and Mitigating Measures ............................................................................... 42
BIBLIOGRAPHY AND REFERENCES ................................................................................ 43

v
ABBREVIATIONS
ADSCR = Annual debt service coverage ratio
AfDB = African Development Bank, also “Bank”
BLS = Bandwidth lease service
CNS = Control and network station
CSM = Communication system monitoring
DSCR = Debt service coverage ratio
DVB = Digital video broadcasting
EIB = European Investment Bank
EIRR = Economic internal rate of return
EOCK = Economic cost of capital
EOCL = Economic cost of labor
FEP = Foreign exchange premium
FIRR = Financial internal rate of return
GDP = Gross domestic product
GPTC = General Post and Telecommunication Company
GSM = Global system of mobile communication
ICS = Integrated communication system
IOD = In-orbit delivery
IOT = In-orbit test
IsDB = Islamic Development Bank
LEOP = Low early orbit phase
LIBOR = London interbank lending rate
LAFB = Libyan Arab Foreign Bank
NPV = Net present value
MDG = Millennium development goal
MCC = Mission control center
O&M = Operation and maintenance
p.a. = Per annum
PTSN = Public switch telephone network
RASCOM = Regional African Satellite Communications Organization
RSQ = RascomStar-QAF
SCC = Satellite control center
SPNTO = Shadow price of non-tradable outlays
TES = Telephony service
TRS = Trunking service
VSAT = Very small aperture terminal

1
APPRAISAL OF REGIONAL AFRICAN SATELLITE
PROJECT (RASCOMSTAR-QAF)
Project Feasibility Study
1. INTRODUCTION
Africa has a large disparity in per capita income, ranging from a high of over US$ 3,000 in
South Africa and Mauritius to just US$ 80 in the neighbouring Mozambique. There is also a
great disparity in basic telecommunication services on the continent. The services vary
according to levels of sophistication, availability, and quality. While some countries
witnessed progress in increasing telephone coverage in their respective countries, other
countries such as Angola and Madagascar have experienced a decrease in teledensity in
recent years. Due to lack of connectivity within and among African countries, compounded
with its sparsely populated areas, Africa still pays one of the highest transit costs to foreign
satellite operators for intra-African traffic. It is estimated that transit intra-continental
telephone calls outside the continent cost African countries over US$ 900 million annually.1
There is also a great disparity in the public switch telephone network (PSTN), commonly
referred to as "fixed telephony" in volume, availability, and quality. The fact that close to
80% of the population live in the rural areas where only 20% of the phones are installed
illustrates just how seriously the telecommunication services are lacking for the majority of
people in the region. Since early 1990s, the demand for both fixed and mobile telephone lines
has been increasing rapidly. The average increase in annual demand for telephone services
between 1995 and 2005 was about 22.47%. Telecom operators responded to this increase in
demand by expanding their coverage but focused mainly on urban areas. Telephone service in
rural communities has been neglected. In recent years many governments realized that they
cannot achieve significant socio-economic developments without a good communication
infrastructure, particularly in the rural areas. African governments and the development
partners pledged to realize a sustainable information society by the year 2010 where every
man and woman, school child, village, government office, business has access to information
and knowledge resources through computers and telecommunications. Now five years into
the millennium, this appears to be a largely unfulfilled dream.
In response to the problems facing African telecommunication operators in the late 1980’s, it
was proposed that a satellite-borne telecommunication infrastructure might be a partial
solution. Hence the governments of Africa decided to join efforts and ordered a
comprehensive feasibility study conducted by 600 African experts under the supervision of
the International Telecommunication Union (ITU). The report adopted at the African
telecommunication ministers’ meeting in Abuja 1991 concluded that a dedicated satellite
system is the best solution to meet the African requirement. In 1992, ministers responsible for
telecommunication met in Abidjan, Ivory Coast and created the intergovernmental
organization called Regional African Satellite Communications Organization (RASCOM).
RASCOM is an inter-governmental organization created by 44 African countries to promote
the development of telecommunications throughout the continent. RASCOM headquartered
in Abidjan, Ivory Coast became operational in 1993. In 1997, following a notification and
evaluation process, RASCOM identified a short list of four suitably qualified bidders for the
1 International Federation of Library Associations and Institutions. Occasional Paper #7, 2000.

2
project: Alcatel S.A., Alenia Aerospazio, Comsat RSI and Hughes Space and
Communications (now Boeing).
In 1998 Alcatel was selected as preferred bidder and began negotiating the Execution
Agreement with RASCOM. The negotiations were successfully completed in 1999, when
Alcatel started the development phase of the project and entered into discussions with a
number of parties regarding the implementation of the project. In 2001, the RascomStar-QAF
(RSQ) was created and registered in Mauritius. RascomStar-QAF (RSQ) is a “special
purpose vehicle” company with the mission to provide interconnectivity and reliable services
to all regions of the African continent. The services of the enterprise will be given to the
existing and potential telecommunication companies on a commercial basis. Having access to
the communication facilities provided by this proposed project, it is expected that the country
telecoms will be able to expand their coverage and lower their transmission costs.
In carrying out its mission, RSQ has designed and ordered a geo-synchronous earth orbit
satellite system to provide services throughout Africa from point to multipoint, including
satellite trunking, broadcasting and telephony services. These services are designed to be
fully integrated and complimentary to the existing PSTN. This would enable existing
terrestrial operators to extend ground coverage at a low marginal cost, and to offer direct
satellite communications where currently there is no ground infrastructure. RSQ will provide
a combination of transponder lease and airtime capacity to ground operators who will, in turn,
market and sell these services to the end users.
The project sponsors have submitted a request to the African Development Bank (AfDB) for
financing the proposed project. This report presents the assessment of the proposed
investment using an integrated approach that covers the evaluation of the financial, economic,
stakeholder, and risk aspects of the project in a single consistent model. The evaluation of the
satellite project is essentially the assessment of the incremental services provided only by this
satellite and the substitution of services provided by other satellites that have higher transit
cost to the African telecom operators.
As such, the proposed investment must be evaluated from the perspective of the RSQ as well
as from the perspective of the telecom operators. From the RSQ’s perspective, the approach
allows us to examine the financial viability of the project and its ability to service its debt
obligations. The analysis is further extended to evaluate the viability of the telecom
operators’ participation in the same satellite project.
The financial analysis of the proposed project is focused on the assessment of the role of the
RSQ in providing satellite telecommunication services to the rural areas of Africa and
savings in transits costs to the participating telecom operators. In addition, the financial
model includes a projection of the RSQ’s cash flows in order to examine its ability to service
the debt repayments. Within the integrated appraisal framework, the economic analysis is
built directly on the financial cash flows of the project and the telecom operators and the
economic treatment of project benefits is measured by the savings in coping costs expressed
in economic terms. This case-study report presents the analysis of the proposed project. Six
specific questions need to be asked about the proposed RascomStar-QAF project:

3
1) Does the project ensure the least-cost way of expanding telecommunication services
in Africa?
2) What is the magnitude of financial benefits realized by the RSQ and telecom
operators?
3) What are the cash flow implications for the RSQ in terms of servicing its debt
obligations?
4) To what extent does this project contribute to the African economy?
5) Who are the stakeholders and by how much do they benefit, or lose, as a consequence
of this project?
6) What are the risk factors that affect the project and how can the uncertainty and risk
exposure be mitigated?
2. PROJECT DESCRIPTION
The project’s main aim is to provide telecommunication services in rural areas of Africa on a
large scale at very low costs by using appropriate technology. The objective is to complement
the existing terrestrial fixed and mobile networks by providing satellite services to areas
which can not be served economically by terrestrial infrastructure. The project is expected to
enhance inter-urban links within the borders of each African country and provide direct links
between all African countries without exception. With the implementation of this project, the
continent is expected to realize substantial savings of fees currently being paid out as transit
charges for intra-African traffic. Another feature of the proposed satellite project is to
facilitate television broadcasting, internet and other value-added services for telecoms,
internet service providers, TV broadcasters and data content providers.
2.1 Project Components
The project consists of two components, the space segment and ground segment. The space
segment component includes a geo-synchronous earth orbit satellite which will cover the
entire African continent using two spot beams in Ku band and global coverage in C band; it
also includes the associated ground control facilities, mission control center and
communications facilities. The mission facilities consist of a mission control center (MCC)
and communication system monitoring (CSMs). The mission center is used for planning,
controlling and monitoring all customer services.
The ground segment includes centralized network stations, gateways and terminals. This
network management system, operated by the RSQ, is in charge of the establishment of all
communications (national, regional, continental and international). The centralized network
station (CNS) establishes communication circuits between telecoms’ terminals and gateways.
They monitor the network elements and generate the data required for customer care and
billing.
Gateways are owned and operated by the individual country telecom operators. They are
generally installed near a PSTN switch and physically connect the space network to the
operator’s terrestrial network. Terminals are also owned by the telecom operators and
deployed throughout the country. They provide the end-users with the integrated
communication services. According to the needs, the satellite terminals may support only
telephony service or also include internet access.
4
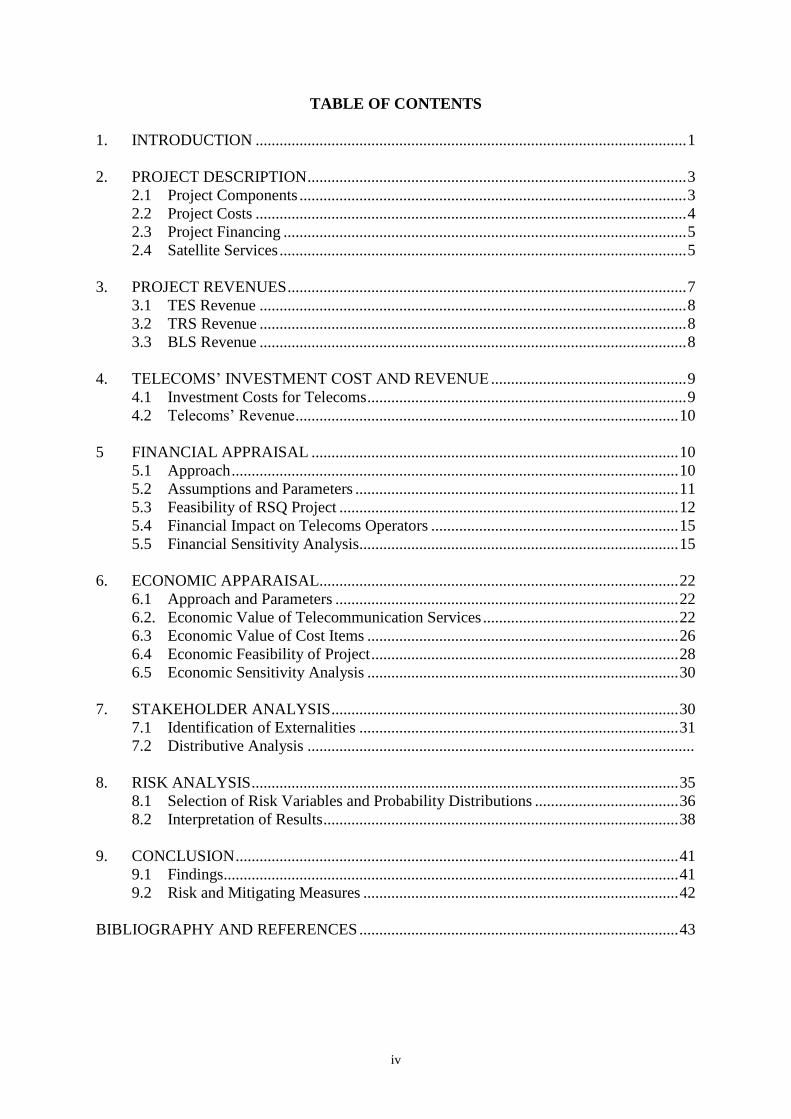
2.2 Project Costs
The construction of the satellite was started in 2003 and it is scheduled for launch in mid-
2006. The total capital expenditure is approximately US$ 355.92 million. The components of
the total costs and timing of expenditures are presented in Table 1. The cost of the satellite is
US$ 119.8 million, the single largest component of project costs.
Table.1: Capital Expenditures by Category, Nominal (US$ million)
Phase 2003 2004 2005 2006 2007 Total
Satellite A 35.94 40.73 27.55 15.57 0.00 119.80
Launcher B 0.00 0.00 2.00 46.50 7.00 55.00
Insurance C 0.00 0.00 4.25 38.23 0.00 42.48
Ground control system A 4.58 5.19 3.51 1.98 0.00 15.26
Launch campaign, LEOP, IOT/Scc/ttc (Ariane) A 3.51 3.98 2.69 1.52 0.00 11.70
Ground design D 1.06 3.18 0.00 0.00 0.00 4.24
Ground infrastructure development E 0.00 0.00 10.21 32.99 0.00 43.20
Terminals F 0.00 0.00 20.50 0.00 0.00 20.50
Other ICS and BLS development 0.00 0.00 4.69 1.56 0.00 6.25
Pre operating expenses 12.17 4.39 6.25 3.92 4.76 31.49
License fees 3.00 0.00 0.00 0.00 0.00 3.00
Contingencies 0.00 0.00 0.75 2.25 0.00 3.00
Total 60.26 57.47 82.40 144.03 11.76 355.92
Source: Analysys Consulting Limited, “Lenders’ Model June 2nd
2005”
Satellite refers to the manufacture and delivery of the satellite into orbit by Alcatel Space,
which will launch the satellite from a site in France.
Insurance is a contract signed with AON, an international insurance broker. It covers the cost
of a replacement satellite in the event of failure of the first satellite during launch.
Ground Control System refers to the development and delivery of one satellite control center
including spare parts and civil work.
Launch Campaign LEOP, IOT/Scct/ttc includes the cost of deploying equipment and
engineers to sites under each beam prior to the in-orbit acceptance review.
Ground Design covers the development of the ground segment specifications prior to
development.
Ground Infrastructure Development refers to Phase C/D contract with Alcatel. This includes
the delivery of 1 network station, 20 rural terminals, and 2 gateways for field tests, a backup
Network Station and training and other services.
Terminals refer to the purchase of 15,000 rural terminals to be provided free to telecom
operators against an early commitment.
Other ICS and BLS Development covers the development of 2 control and service monitoring
(CSM) stations for Bandwidth lease service.
Pre-operating expenses covers the right to occupy FT 30
orbit by the satellite.
A license fee refers to the execution agreement between RSQ and Rascom.
Contingencies are set aside to cover any unexpected cost during construction period.

5
2.3 Project Financing
Equity
Project sponsors include 44 African telecom operators, Alcatel Space, and General Post and
Telecommunication Company (GPTC), a Libyan telecom operator. During the first round of
financial completion in 2003, the shareholders raised US$ 86.27 million in equity. The
second round of equity contribution was completed in 2005 amounting to US$ 65 million.
Libyan Arab Foreign Bank Loan
In addition to the equity contributed by the shareholders, RSQ requested a US$ 85 million
loan from the Libyan Arab Foreign Bank (LAFB). The LAFB offered a 4-year grace period
during which interest will be capitalized. After that the principal with the accumulated
interest will be repaid in 6 annual installments.2 It is assumed that an additional 2 years of
grace period for the principal repayment is obtained and the actual principal repayments start
in 2009.
Additional Loan
Additional loan facilities have been requested from the African Development Bank (AfDB),
European Investment Bank (EIB), Islamic Development Bank (IsDB) and Proparco to
complete the final phase of the project implementation. The AfDB, EIB, IsDB and Proparco
together were asked to lend a total of US$ 126 million. The new loans will be repaid in 9
annual installments with a grace period of 3 years.3
Interest, Fees and Charges A base interest rate of 3.40% real is to be charged on the loan from the LAFB and the
additional loan facilities. A front-end fee amounting to 1% of loan amount is effectively
deducted from the available loan amount at the time of signing the contract. Commitment
charges, on the other hand, are 0.5% of the un-disbursed loan amount payable every year,
even during the grace period. Table 2 provides the details of equity and debt financing for the
RSQ project. 4
Table 2: Equity and Debt Financing (US$ million)
Contribution Disbursement Schedule
Sponsor 2003 2005 Total Lender 2003 2004 2005 2006 2007 Total
Rascom 25.00 5.00 30.00 LAFB 23.28 51.32 10.40 85.00
GPTC 43.52 7.00 50.52 AfDB 28.00 3.50 31.50
Alcatel 17.75 7.00 24.75 EIB 47.00 4.60 51.60
Others 00.00 46.00 46.00 IsDB 15.00 3.90 18.90
Total 86.27 65.00 151.27 Proparco 20.40 3.60 24.00
Source: Analysis Consulting Limited “Lenders’ Final Model”, Paris, France, June 2, 2005.
2.4. Satellite Services
The project will provide three categories of services to the whole of the African continent in
which telecom operators play a critical element in the success of delivering services to the
2 The assumption is subject change based on the results of the final negations with lenders.
3 Analysys Consulting Limited, “Lenders’ Final Model; Paris, France, June 2, 2005.
4 Analysys Consulting Limited, “Lenders’ Final Model, Paris, France, June 2, 2005.

6
end users. These three services are rural communication service, connectivity on-demand,
and bandwidth leasing service.
2.4.1 Rural Communication (TES)
The satellite will allow the African telecom operators to expand their coverage over the hard-
to-reach rural areas. Many rural regions are currently excluded from the network due to
prohibitive cost of land-line linkage and sparse population density for wireless coverage.
Telecom operators will deploy terminals in phone booths, tele-centers, private or residential
sites in rural areas. The terminals will be interconnected through the satellite so that a phone
call from one rural terminal goes directly to another rural terminal only passing through the
satellite and gateway, hence avoiding completely the other public or private phone networks.
In addition, gateways will provide an interface between terminals and the satellite, as well as
link terminals to the existing public telephone networks. The scope of the services available
to the end users through the terminal interface is the phone voice, TV, and internet access.
Figure 1 illustrates the services provided by terminals and shows the link between the
terminal and the existing networks. Any individual terminal in a remote rural area will be
able not only link to the domestic phone network but also to establish a direct communication
with any other country’s network or any other rural terminal in Africa.5
Figure 1: Rural Communication Services (TES)
2.4.2 Connectivity On-Demand (TRS)
Through the satellite, participating African telecoms can link directly with each other, instead
of resorting to costly international satellite facilities provided by third parties. This will allow
direct interconnection of all calls between the existing PSTNs of African telecom operators
and also with the outside world. In order to participate in the exchange, telecoms need to
purchase and install gateways that will link their existing telephone networks with that of
other countries via the satellite. Figure 2 illustrates the nature of the connectivity on-demand
services. At present, telecoms have to route their international traffic through European and
5 International calls are possible provided that the two telecom operators have proper agreements to establish
such calls.

7
US satellites, which results in a poor quality of service and high transmission costs to the
operator and to the end users. No single existing satellite covers the whole surface of the
African continent, and often an inter-African call has to go through two satellites.
2.4.3 Bandwidth Lease (BLS)
This service targets TV broadcasters, internet service providers (ISPs) and big corporations
with fixed annual subscriptions. These services include trunking services for low and high
rate links over the whole continent and also between Africa, Europe and Middle East,
broadcasting, internet services, global system of mobile communication (GSM) backhauling,
and other services such as very small aperture terminal (VSAT) for private or corporate
networks and news gathering services. The satellite will provide a dedicated bandwidth for a
period of time, and the customer will transmit the data from location to another. The satellite
will be conveniently positioned for inter-continental transmission as well as for European and
Middle East customers.
Figure 2: Connectivity On-Demand Services (TRS)
3. PROJECT REVENUES
The satellite will be equipped with 24 transponders that will transmit signals between the
satellite and the ground networks. The allocation of the transponders among the three services
is such that the priority is given to the TES transponders driven by demand from the
telecoms. Then the TRS services are given a slot in the transponders according to the
indicated demand by the telecom operators. Finally, the usage of TES and TRS transponders

8
will determine the capacity available for BLS. The number of transponders used for TES and
TRS are projected and the remaining balance of transponders will be rented out to BLS
subscribers. It is assumed that all transponders will be utilized at 85% of their capacity.6
3.1 TES Revenue
The gross revenue from TES services depends on the number of rural terminals and the
average usage per terminal. The number of rural terminals to be deployed in the rural areas is
based on the commitment expressed by telecom operators in each African country while the
usage per terminal is estimated at 70 minutes per day in year one of operation, and 74
minutes thereafter.7 The usage rate of terminals is not expected to increase more than 74
minutes per day for the rest of the project life. It is estimated that by 2008, the number of
rural terminals deployed by telecoms will reach about 35,100 and gradually grow to 94,288
by 2012, and then will remain at this level throughout the project life. There are two rates for
TES: domestic and international tariff. At the beginning of the operations, the real tariffs to
telecoms are set at US$ 0.033 and US$ 0.086 per minute in 2007 for domestic and
international calls, respectively.
3.2 TRS Revenue
The revenue from TRS is determined by the volume of traffic forwarded by the telecoms
through the RSQ, which is expressed in minutes a year. The commitment from telecom
operators is currently at a level of 103.8 million minutes for the first year of operation in
2007. It is assumed that by 2012, the demand for TRS will reach 559.0 million minutes a
year. Then, the volume of traffic is assumed to grow by 20% between 2012 and 2021. The
RSQ will charge telecoms US$ 0.051 real per minute for TRS transmission. It is assumed that
the TRS tariff will also fall over time at a real rate of 7.32% a year.
3.3 BLS Revenue
The demand for BLS transponders in Africa has greatly increased in recent years. However, it
is expected that in the near future the number of available transponders in Africa will actually
fall because some of the existing satellites are reaching the end of their useful life and will
not be replaced immediately. It is assumed that any excess transponders from TES and TRS
can be sold to BLS subscribers on a short-term basis at a 15.0% discount. The transponders
sold at a discount have an additional 5.0% loss of their useful capacity, as it is needed for
switching of transponders from TES/TRS to BLS. Unlike TES and TRS, the revenue from
BLS is determined by the number of transponders rented out to subscribers. The full rental
charge for a BLS transponder is US$ 1.81 million in real (2005) prices per year. The
discounted charge for the BLS transponders after switching from TES/TRS is US$ 1.54
million real a year. It is assumed that the real price of BLS transponders will fall at a rate of
2.5% per year.
3.4 Prices charged for TES and TRS and their movement over time
Due to technological advances and increased competition amongst the supplies of these
services, over time, the prices of telephone communication services have been falling. It is
estimated that the market or nominal price of TES and TRS expressed in US$ will fall at
about annual rate of 5 percent a year.8 If the general US price level increases at a rate of 2.5
6 RSQ’s Revised Business Plan April, 2005.
7 The data on the number of rural terminals and usage rate of the terminals are obtained from RSQ and
Analysys Consulting Limited, “Lender’s Final Model, June 14 2005”. 8 Source: RSQ’s Revised Business Plan 2005.

9
percent per annum due to inflation, thus the decrease in the real tariffs for TES and TRS will
need to be 7.32 percent a year over the life of the project in order to yield the assumed 5
percent nominal decline.9
There is a high degree of uncertainty surrounding the rate of real price decline over time. If
one considers the historical long distance telephone rates charged in the EU countries in the
period 1991 to 2001, one finds that the annual reduction in these tariffs evaluated in real
terms, have been more than 15 percent a year. In the same period, the local telephone rates
(real) in Africa were falling at an annual rate of 6.2 percent. 10
Increase competition in the telephone sector has tended to cause long distance telephone rates
to fall while increasing the real rates for local services. In Africa however, even local
telephone rates have been falling. Hence, the based case assumption of a fall in real tariff
rates charged by the RSQ at a rate of 7.32 percent appears to be reasonable, but this issue is
examined further in the sensitivity and risk analyses.
4. TELECOMS’ INVESTMENT COST AND REVENUE
Telecom operators are an indispensable component of the project. Their commitment to the
project is essential for the success of its implementation.
4.1 Investment Costs for Telecoms
To provide the intended services to the end users, telecom operators have to deploy ground
infrastructure equipment to support the space segment. The ground segment includes rural
terminals and gateways. Telecoms will purchase and install their own terminals and gateways
directly from those suppliers approved by RSQ. Table 3 shows the unit cost estimates for a
gateway and rural terminal.
Table 3: Unit Costs of Terminals and Gateways for Telecoms, 2004 Prices
(US dollar)
Item Unit Cost Installation Cost Transportation Cost
TES gateway 700,000 70,000 2,000
TRS gateway 300,000 30,000 2,000
Terminal 1,100 300 140
Source: RSQ,”Telecom Business Plan July 2004”.
All terminals will have the basic telecenter equipment for recording call time and cost.
Telecenter equipment costs US$ 288 each in 2004 prices. The final cost of a terminal depends
on the additional equipment bundle installed on it. There are four options that are being
offered to telecoms. The possible hardware configuration for terminals is as follows:
a) Solar panel allows the terminal to be powered independently from the electric
grid. The additional cost is US$ 750 in 2004 prices per terminal. It is expected
that 50% of the terminals will be equipped with this system.
9 Source: RSQ’s Revised Business Plan 2005.
10 Source: World Bank Online Data www.devdta.worldbank.org

10
b) BVD receiver uses the second line for TV reception. The additional cost is
US$ 150 in 2004 prices per terminal, and 25% of the terminals will have this
feature.
c) Fax and copier can be added to the standard telephone equipment at an
additional cost of US$ 500 in 2004 prices per terminal. It is expected that
12.5% of the terminals will use this option.
d) Fax, copier and computer is another possible combination that telecoms can
select. The additional cost is US$ 1,500 in 2004 prices per terminal, and
12.5% of the terminals will have this option. 11
4.2 Telecoms’ Revenue
From the telecoms perspective, domestic TES services are treated differently for local calls
and long-distance calls within the same country. The telecoms will charge the end users US$
0.114 in 2005 prices per minute for local calls and US$ 0.152 per minute for long-distance
calls. TES international calls will be charged to the end users at US$ 0.619 per minute. For
TRS calls, telecoms will charge the users US$ 0.428 per minute at the start of operation in
2007. It is assumed that the real value of all tariffs to the end users will fall at a rate of 7.32%
a year.
5 FINANCIAL APPRAISAL
5.1 Approach
The financial analysis constitutes the first part of the integrated analysis of this project. The
prime focus of this analysis is to see whether the project is financially viable and bankable.
The financial analysis of the project considers two perspectives, namely the total investment
(banker’s) perspective and the equity holder (owner’s) perspective. For the equity holder, the
appraisal examines the ability of the RSQ to generate enough cash to recover the investment
costs and to provide a competitive return on equity. From the total investment, or banker’s
perspective, the analysis focuses on the capability of the RSQ to meet the debt repayment
obligations. In addition to the stand-alone assessment of the project, it is necessary to
evaluate the investment from the telecom operators’ perspective. Since no debt financing of
the telecoms’ incremental costs is linked to the project financing of the RSQ, the analysis of
the incremental impact on the participating telecoms is done only from the equity perspective
of the operators. For the telecom operators, the appraisal looks into the telecoms ability to
generate enough additional cash to recover their incremental capital and operating costs and
to provide a target return on equity.
As the launching of the RSQ entails the expansion of telecommunication services into rural
areas of Africa, the analysis accounts for revenues and expenditures relevant to the project
that are incremental to what would have occurred “without the project”. The central tool of
the financial analysis is the cash flow statement, which projects the annual cash inflows and
outflows over the life of the RSQ project from the perspective of its shareholders. The
analysis serves to bring together the construction costs, operating costs, financial revenues
and project financing into a single cash flow statement in order to determine whether the
initial capital investment is justified from the owners’ perspective. All cash flows are initially
11
Source: Rascom,”Business plan for telecom operators”.

11
estimated using nominal prices and then converted to real values using the price level of 2005
as the base year. Consistency is maintained between the rates of inflation used in the analysis
and the annual interest rates. The financial viability of the RSQ is assessed by estimating the
net present value (NPV) using the required rate of return on equity.
From the banker’s perspective, the project’s debt service ratios must be high enough so that
even in adverse conditions there would be adequate cash flows to meet the scheduled debt
service. Following the same logic, a cash flow statement for all participating telecoms is
constructed including only incremental inflows and outflows relating to this project. Finally,
the NPV of the net financial benefits is derived, using the appropriate target rate of return for
the telecom operators.
5.2 Assumptions and Parameters
In order to conduct an effective financial analysis of the proposed project, a number of
assumptions have to be made, based on the information obtained from the project sponsors.
RSQ Investment Costs
The construction of the satellite began in 2003 and will be completed by mid-2006, as
shown in Table 1.
The total construction cost of the project is expected to amount to US$ 355.92 million in
nominal prices; if expressed in 2005 prices, it is US$ 356.65 million.
The project’s life is considered to be 15 years after the launch of the satellite in 2006.
Investment Cost for Telecoms
Telecoms are expected to start deploying terminals and gateways in 2007 when the
satellite is launched.
The total cost of terminals and gateways to all participating telecoms is estimated at US$
298.1 million. Details of their unit costs are shown in Table 3 and number of terminals in
Appendix A.
Terminals donated by the RSQ are free to the telecom operators.
All fixed assets for telecoms will be depreciated over 15 years based on their economic
life.
RSQ Operating Costs
Operation is expected to start in 2007 and last for 15 years. 12
Spare parts and equipment will cost US$ 2.26 million annually in 2005 prices.
Marketing costs are estimated at US$ 0.65 million per year in 2005 prices.
Annual manpower requirement starting from 2005 until 2021 is estimated to be 61
person-years.
Annual insurance premium for the satellite is about 2.6% of the maximum value of either
the outstanding debt or the satellite book value.
Annual fee to Rascom is 1.2% of the annual gross revenue with a minimum of US$ 1.2
million.
Bad debt is assumed at 1.4% of the accounts receivable held by RSQ at the beginning of
each year
12
Source: RSQ business plan and Analysys’ report, “Lenders’ Final Model Paris, France, 2005

12
Operating Cost for Telecoms
Operation is expected to start in 2007 and last for 15 years.
Maintenance cost is assumed at 15% of the capital cost.
Manpower requirement is taken at 2 technicians for every 500 terminals deployed and 2
personnel for customer service of every 500 terminals.
Bad debt for telecoms is assumed to be 10% of the accounts receivable annually.
RSQ’s Working Capital
Average collection time for bills from telecoms is assumed to be 12 weeks.
Accounts payable are assumed to be 6 weeks of operating costs excluding labor expenses.
Cash balance is assumed to be 15% of all the operating costs excluding labor.
Working Capital for Telecoms
Average collection time for bills from the end users is assumed to be 12 weeks.
Accounts payable are assumed to be equal to 12 weeks of the operating costs excluding
labor expenses.
The desired level of cash balances is assumed to be equal to 15% of all operating costs.
Taxation
The corporate income tax for the RSQ will be 3.2% of the taxable income. There are no
taxes or import duties on materials and equipment of the RSQ project.
The average corporate income tax for telecoms in Africa is assumed to be 30% of taxable
income.
The average import duty on materials and equipment purchased by telecoms operators is
assumed to be 25% of the cif prices of the items.
Inflation
The annual US inflation is assumed to be 2.5% throughout the project’s life.
Required Rates of Return
The opportunity cost of capital for equity holders of the RSQ is assumed to be a real rate
of 15%.
The targeted return on equity for the telecoms is also taken as 15% real.
5.3 Feasibility of RSQ Project
Table 4 presents the projected cash flow statement for the project from the equity holder’s
point of view. The revenues of the project are basically the fees collected from the telecoms
for TES, TRS and BLS provided. Some of the ground infrastructure will have a residual
value at the end of operation. The change in the accounts receivable from the telecoms is also
included in the cash inflow. On the expenditure side, the project has the initial investment
costs of the satellite and the ground infrastructure, plus the operating costs of the project. The
changes in the working capital are represented by the annual change in the stock of the
payables and cash balance held. The project will pay income tax. The resulting net cash flow
before financing is then compared with the scheduled debt service of all loans. The project’s
debt service rations are estimated at the bottom of Table 4.

13
The RSQ is a stand-alone project implying that the equity holders will expect to receive a rate
of return on the project no less than their target real (net of inflation) rate of return on equity
of 15 percent. In other words, the present value of the discounted net financial cash flow over
the life of the project should not be less than zero. Table 4 shows that in the base case
scenario the financial NPV of the project is US$ 72.6 million, using a real discount rate of
15%. The discounted net cash flows of the RSQ project for this case recover not only the
investment costs of the project but also earn a return higher than 15% real. This is also shown
by the financial internal rate of return (FIRR) of 20.6% real.
The annual debt service ratios of the proposed project shows that the annual net cash flows of
the project before financing are above the debt repayments of the corresponding years.13
The
minimum net cash flow before financing is at least 178% of the scheduled debt payment. In
all other periods, the project is expected to meet its debt repayment obligations. The debt
service capacity ratios are all greater than one, indicating that the present value of the
project’s net cash flows over the period that there is outstanding debt are all greater than the
present value of the interest and loan repayments.
13
The annual debt service coverage ratios (ADSCR) are the ratios of the net cash flow of the project before
financing over the amount of scheduled debt repayment in the current year. The debt service capacity ratio
(DSCR) is defined as the present value of the cash flow before financing during the loan repayment period
over the present value of the remaining debt obligations.

14
Table 4: Cash flow Statement: RSQ Equity Holder’s Perspective, 2005 Prices (US$ million)
Year 2003 2004 2005 2006 2007 2008 2009 2010 2011 2012 2013 2014 2015 2016 2017 2018 2019 2020 2021 2022
INFLOW
TES - - - - 1.9 29.6 57.9 67.8 66.7 62.3 57.7 53.5 49.6 45.9 42.6 39.5 36.6 33.9 31.4 -
TRS - - - - 5.3 8.8 16.3 19.7 19.6 19.5 19.3 18.4 17.4 16.4 15.5 14.6 13.6 12.7 11.8 -
BLS - - - - 38.2 34.0 28.3 25.0 23.5 22.5 21.5 20.7 20.1 19.5 18.9 18.3 17.8 17.3 16.8 -
Change in accounts receivable - - - - -10.5 -6.6 -7.6 -3.2 -0.4 0.3 0.4 0.5 0.5 0.4 0.4 0.4 0.4 0.3 0.3 13.3
Residual value - - - - - - - - - - - - - - - - - - - 5.0
Total Inflow - - - - 34.9 65.8 94.9 109.2 109.5 104.6 98.9 93.1 87.5 82.2 77.3 72.7 68.3 64.2 60.4 18.3
OUTFLOW
Investment Costs 63.1 59.2 82.4 140.5 11.5 - - - - - - - - - - - - - - -
Operating Costs
General operating costs - - - - 13.1 12.9 12.9 11.9 10.8 9.7 8.6 7.6 6.6 6.0 5.5 5.0 4.8 4.6 4.5 -
Labor - - 2.7 2.7 2.7 2.8 2.8 2.8 2.8 2.8 2.8 2.8 2.9 2.9 2.9 2.9 2.9 2.9 2.9 -
Change in accounts payable - - - - -1.5 0.0 0.0 0.1 0.1 0.1 0.1 0.1 0.1 0.0 0.0 0.0 0.0 0.0 0.0 0.5
Change in cash balance - - - - 2.0 0.0 0.0 -0.1 -0.1 -0.1 -0.1 -0.1 -0.1 -0.1 -0.1 -0.1 0.0 0.0 0.0 -0.7
Income tax - - - - 0.0 1.0 1.7 2.1 2.1 2.1 2.0 1.9 1.8 1.7 1.6 1.5 1.4 1.3 1.2 -
Total Outflow 63.1 59.2 85.1 143.2 27.8 16.7 17.4 16.8 15.7 14.5 13.4 12.3 11.3 10.6 10.0 9.4 9.1 8.9 8.6 -0.2
NET CASH FLOW
BEFORE FINANCING -63.1 -59.2 -85.1 -143.2 7.1 49.1 77.5 92.5 93.8 90.0 85.5 80.8 76.2 71.6 67.3 63.3 59.2 55.4 51.8 18.5
Add: Loan disbursement 24.5 52.9 10.4 109.3 14.8 - - - - - - - - - - - - - - -
Less: Loan repayment plus interest 1.2 0.1 0.0 1.3 3.2 2 43.4 40.6 37.9 35.3 32.8 30.4 14.0 13.0 12.0 - - - - -
NET CASH FLOW
AFTER FINANCING -39.8 -6.4 -74.7 -35.3 18.8 47.4 34.1 51.8 55.9 54.7 52.7 50.4 62.2 58.6 55.3 63.3 59.2 55.4 51.8 18.5
ADSCR - - - - - - 1.78 2.28 2.47 2.55 2.60 2.66 5.44 5.52 5.62 - - - - -
DSCR - - - - - - 2.76 2.98 3.16 3.37 3.68 4.22 5.52 5.56 5.62 - - - - -
FNPV @ ROE 15% Real: 72.6 US$ million
FIRR: 20.6% Real

15
5.4 Financial Impact on Telecoms Operators
The proposed project does not supply its services directly to the end users of the
telecommunication services. Hence, the impact on the immediate customers of the RSQ, the
participating African telecoms, must be examined in order to judge whether they would be
willing to engage into the scheme. Table 5 presents the financial cash flow statement for all
telecom operators participating in the project. This statement is based on the lenders’ adopted
conservative schedule of the telecoms’ subscription to the RSQ. The inflows of the telecoms are
essentially the incremental revenues from the resale of the services from the RSQ to the ultimate
users. The change in the incremental accounts receivable is also added to the inflows as well as
the residual value of the terminals and gateways. 14
Among the incremental costs associated with this project, the telecoms would count the initial
investment expenditures of gateway and terminal deployment and all operating and maintenance
costs of running these facilities. The operators would also have to pay income tax on the net
profit they earn from this activity. The resulting net cash flow represents the incremental net
financial impact on all the participating telecom operators. The net present value, using a
discount rate of 15% real, stands at US$ 89.4 million. In other words, there is substantial
expected financial gain to the telecom operators who participate in the project. The financial rate
of return of 37.7% real, resulting from using the services provided by the RSQ indicates a
substantial return on the equity they need to contribute in order to use the services of the project.
5.5 Financial Sensitivity Analysis
Sensitivity tests carried out on key project variables indicated that the projected annual decrease
in tariffs over the life of the project has a major impact on the project outcomes. Other variables
that have a major impact on the project outcomes are: the initial tariff charged to telecoms for
domestic TES, investment cost over-runs, the US inflation rate, daily traffic per terminal, the
US$ real interest rate, the price of BLS transponders, and the number of rural terminals installed.
14
The service life of both rural terminal and gateway is taken as 15 years, but the timing of installation will lead to
a situation when the equipment installed after year 2007 will have some residual value at the end of the project
in year 2021.

16
Table 5: Cash flow Statement: Telecoms Perspective, 2005 Prices (US$ million)
Year 2007 2008 2009 2010 2011 2012 2013 2014 2015 2016 2017 2018 2019 2020 2021 2022
INFLOWS
Revenue
TES 4.4 68.9 134.7 157.7 155.3 144.8 134.2 124.4 115.3 106.9 99.0 91.8 85.1 78.8 73.1 -
TRS 22.2 36.9 68.5 82.6 82.4 81.9 81.2 77.3 73.0 68.9 64.9 61.2 57.2 53.3 49.6 -
Total revenue 26.7 105.8 203.2 240.3 237.7 226.7 215.4 201.8 188.3 175.7 164.0 153.0 142.3 132.1 122.6 -
Change in accounts receivable -6.2 -19.0 -25.5 -14.3 -6.2 -4.2 -3.8 -2.9 -2.6 -2.4 -2.2 -2.1 -1.8 -1.7 -1.5 24.8
Residual values - - - - - - - - - - - - - - - 50.6
Total Inflows 20.5 86.8 177.8 226.0 231.5 222.6 211.6 198.9 185.7 173.3 161.7 150.9 140.5 130.5 121.1 75.5
OUTFLOWS
Investment Cost 20.0 41.2 107.3 54.1 16.3 2.5 0.8 0.4 0.2 0.2 0.2 0.2 0.1 0.1 0.0 -
Operating Cost
Airtime cost 7.2 38.4 74.2 87.5 86.4 81.8 77.0 71.9 67.0 62.3 58.0 54.0 50.2 46.6 43.2 -
Operating & maintenance costs 3.0 9.1 25.0 32.5 34.1 33.7 33.0 32.2 31.5 30.8 30.0 29.3 28.6 28.0 27.3 -
Labor 1.5 3.8 8.0 10.2 10.9 11.0 11.1 11.1 11.2 11.3 11.3 11.4 11.4 11.5 11.5 -
Change in accounts payable -2.7 -9.2 -13.2 -5.9 -1.0 0.4 0.5 0.7 0.7 0.6 0.6 0.5 0.5 0.5 0.4 18.5
Change in cash balance 1.8 6.0 8.6 3.8 0.7 -0.3 -0.3 -0.4 -0.4 -0.4 -0.4 -0.3 -0.3 -0.3 -0.3 -12.0
Income tax 4.5 16.2 28.1 31.7 30.3 28.5 26.8 24.5 22.2 20.1 18.2 16.4 14.6 12.9 11.3 -
Total Outflows 35.2 105.4 238.1 213.8 177.6 157.6 148.9 140.4 132.3 124.9 118.0 111.5 105.1 99.1 93.5 6.5
NET CASH FLOW -14.7 -18.6 -60.3 12.2 53.9 64.9 62.7 58.5 53.4 48.4 43.7 39.4 35.3 31.3 27.6 69.0
FNPV @ ROE 15% Real: 89.4 US$ million
FIRR: 37.7% Real
17
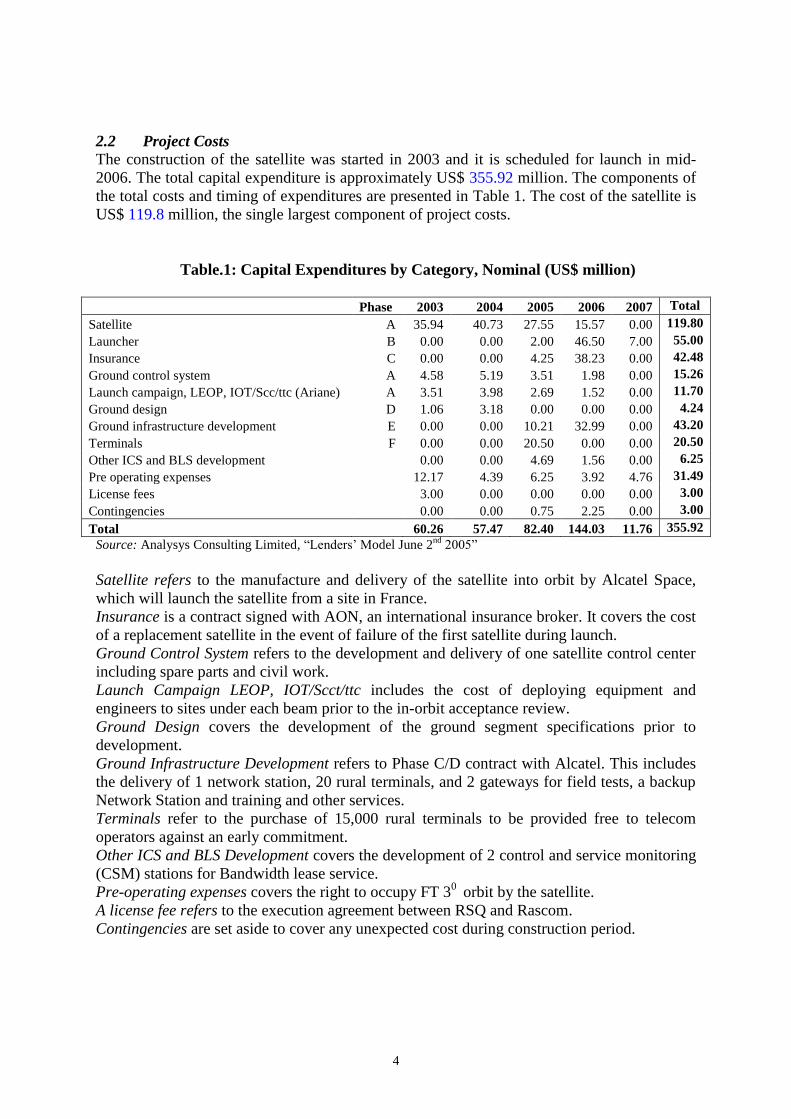
Annual Decrease in Real Tariff: TES and TRS tariffs to telecoms and end users are expected to
decrease by 7.32% real per year, starting from the second year of operation. As shown in Table 6,
the annual decrease in the tariffs has a major impact on both the RSQ and telecoms. If the real
tariffs were to decrease by 10% real a year instead of 7.32% as expected, the RSQ’s net present
value will decline by US$ 37.1 million. This loss is equivalent to 10.2% of the investment value of
the project.15
The pace of tariff decrease has also an effect on the telecoms’ NPV. With a 10.0%
real annual decrease in the tariffs, telecoms’ NPV drops by US$ 45.5 million, which is equivalent
to 32.7% of the incremental investment value of telecoms participation.16
This indicates that the
RSQ’s financial viability will be affected if tariffs decrease by more than the expected 7.32% real
per annum. The annual debt service coverage ratios and the debt service capacity ratios are also
sensitive to the pace of decrease in the tariffs rates.
Table 6: Sensitivity Test of Annual Decrease in Real Tariff Rates
Annual
Decrease
in Tariffs
FNPV
RSQ
(US$ m)
FIRR
RSQ
ADSCR
2009
ADSCR
2010
ADSCR
2011
ADSCR
2012
ADSCR
2013
DSCR
2009
FNPV
Telecoms
(US$ m)
-2.00% 169.43 25.55% 1.94 2.61 2.98 3.23 3.46 3.61 208.94
-5.00% 110.50 22.80% 1.85 2.42 2.69 2.83 2.95 3.10 136.13
-7.32% 72.60 20.63% 1.78 2.28 2.47 2.55 2.60 2.76 89.42
-10.00% 35.47 18.05% 1.71 2.12 2.25 2.26 2.25 2.42 43.90
-15.00% -18.80 13.05% 1.57 1.85 1.87 1.80 1.72 1.91 -23.81
Initial Tariff to Telecoms for Domestic TES: The impact of changes in the initial tariff rate for
rural domestic TES on the project’s the NPV, debt service ratios, and telecoms’ NPV is presented
in Table 7. Setting the right tariff for rural domestic communication service is important given the
fact that tariffs are expected to decrease by 7.32% real per year. Another reason is that more than
half of the RSQ’s revenues are expected to come from this service. If the RSQ starts by charging
telecoms below US$ 0.033 per minute, for example at US$ 0.030 per minute and tariffs decrease as
expected, the project’s NPV will fall by US$ 18.2 million, which is equivalent to a 5.0% loss of the
investment value of the project. At the same time, there will be a boost in the telecoms’ NPV by
US$ 13.6 million.
Table 7: Sensitivity Test of Changes in Initial Tariff to Telecoms for Domestic TES
Initial Tariff
Domestic TES
(US$/minute)
FNPV
RSQ
(US$ m)
FIRR
RSQ
ADSCR
2009
ADSCR
2010
ADSCR
2011
ADSCR
2012
ADSCR
2013
DSCR
2009
FNPV
Telecoms
(US$ m)
0.025 26.86 17.23% 1.54 1.94 2.10 2.17 2.23 2.36 123.56
0.030 54.43 19.33% 1.69 2.14 2.33 2.40 2.45 2.60 102.99
0.033 72.60 20.63% 1.78 2.28 2.47 2.55 2.60 2.76 89.42
0.040 109.47 23.07% 1.99 2.55 2.77 2.85 2.91 3.08 61.86
0.045 136.98 24.75% 2.14 2.75 3.00 3.08 3.14 3.32 41.29
0.050 164.48 26.32% 2.28 2.96 3.22 3.31 3.36 3.56 20.73
15
The value of investment is equal to the present value of investment cost (initial asset value real). It is US$ 364.7
million for the base case. 16
The value of invest for telecoms is the present value of incremental investment cost. It is approximately US$
139.1 million for the base case.

18
Cost Over-runs: The sensitivity test on the investment cost over-runs in Table 8 shows that the
financial viability of the RSQ and the telecoms are both affected by this parameter. A cost over-run
of 5% will reduce the RSQ’s NPV by US$ 7.7 million or 2.1% of the investment value of the
project. An unexpected escalation in costs will also put the project financing in distress and reduce
the value of the telecoms’ investment in this satellite project. Thus, a 5% cost over-run in the
investment costs of telecoms will make them lose US$ 10.9 million which is equivalent to 7.8% of
their incremental value of project involvement. Table 8 shows the resulting financial outcomes
under a range of possible cost over-runs. However, the high degree to which the cost of the
satellite, the gateways and the rural terminals are now known due to fixed price contracts will
greatly reduce the risk of there being large cost over-runs for the overall project.
Table 8: Sensitivity Test of Cost Over-runs
Cost Over-run
Factor
FNPV
RSQ
(US$ m)
FIRR
RSQ
ADSCR
2009
ADSCR
2010
ADSCR
2011
ADSCR
2012
ADSCR
2013
DSCR
2009
FNPV
Telecoms
(US$ m)
-10.00% 89.07 22.24% 1.78 2.28 2.47 2.55 2.60 2.76 111.19
-5.00% 80.78 21.40% 1.78 2.28 2.47 2.55 2.60 2.76 100.30
0.00% 72.60 20.63% 1.78 2.28 2.47 2.55 2.60 2.76 89.42
5.00% 64.92 19.95% 1.78 2.28 2.47 2.55 2.60 2.76 78.53
10.00% 57.25 19.29% 1.78 2.28 2.47 2.55 2.60 2.76 67.64
15.00% 49.57 18.66% 1.78 2.28 2.47 2.55 2.60 2.76 56.76
20.00% 41.90 18.04% 1.78 2.28 2.47 2.55 2.60 2.76 45.87
25.00% 34.22 17.44% 1.78 2.28 2.47 2.55 2.60 2.76 34.98
US Inflation Rate: The sensitivity test of the US inflation rate on the project and telecoms’
financial outcome is presented in Table 9. An additional 1.0% increase in the rate of US inflation
from 2.5% to 3.5% will decrease the RSQ’s NPV by US$ 0.6 million, which is about 0.2% of the
value of investment. A higher rate of US inflation will erode the debt service ratios of the project.
Of course, the assumption about the interest rates charged on US$ loans are based on the
assumption of the US having a rate of 2.5% annual inflation rate. In this analysis it assumed that
the tariff rates charged by RSQ for the services, and the nominal interest rate charged on its debt
will be fully adjusted for the change in the inflation rate. Any lag in the adjustment of tariffs for
inflation will have a serious impact on its financial performance.
Table 9: Sensitivity Test of US Inflation Rate
US Inflation
Rate
FNPV
RSQ
(US$ m)
FIRR
RSQ
ADSCR
2009
ADSCR
2010
ADSCR
2011
ADSCR
2012
ADSCR
2013
DSCR
2009
FNPV
Telecoms
(US$ m)
1.00% 73.39 20.72% 1.90 2.37 2.51 2.53 2.52 2.74 89.44
1.50% 73.14 20.69% 1.86 2.34 2.50 2.53 2.55 2.75 89.48
2.00% 72.88 20.66% 1.82 2.31 2.49 2.54 2.58 2.75 89.47
2.50% 72.60 20.63% 1.78 2.28 2.47 2.55 2.60 2.76 89.42
3.00% 72.31 20.60% 1.75 2.25 2.46 2.56 2.63 2.76 89.32
3.50% 72.01 20.57% 1.72 2.22 2.45 2.57 2.66 2.77 89.19
4.00% 71.71 20.54% 1.69 2.20 2.44 2.58 2.70 2.78 89.03

19
Traffic per Terminal: The usage rate of rural terminals is a critical factor that has to be examined
since about half of the total revenues are expected to come from TES. By observing the range of
possible terminal utilization in Table 10, it is obvious that a drop in daily traffic from 70 to 60
minutes will result in a decrease in the project’s NPV of US$ 25.8 million, which represents 7.1%
of the investment value. The same reduction in traffic will result in US$ 23.2 million decrease in
telecoms’ NPV, which is equivalent to 16.7% of the incremental investment value for the
participating telecoms.
Table 10: Sensitivity Test of Traffic per Terminal
Daily Traffic
(minutes/terminal)
FNPV
RSQ
(US$ m)
FIRR
RSQ
ADSCR
2009
ADSCR
2010
ADSCR
2011
ADSCR
2012
ADSCR
2013
DSCR
2009
FNPV
Telecoms
(US$ m)
50 20.90 16.75% 1.50 1.88 2.05 2.12 2.18 2.31 43.07
60 46.77 18.77% 1.64 2.08 2.26 2.33 2.39 2.53 66.24
70 72.60 20.63% 1.78 2.28 2.47 2.55 2.60 2.76 89.42
80 98.41 22.36% 1.93 2.47 2.69 2.77 2.82 2.98 112.59
Loan Interest Rate: Table 11 shows the results of a sensitivity test on the base interest rate for the
additional loan requested from the project lenders. If the real interest rate charged is increased to
4.0%, the financial NPV of the RSQ will decline by about US$ 4.5 million from US$ 72.60 million
to US$ 68.13 million. This represents a loss equivalent to 1.2% of the value of the investment in the
project. The telecom operators are essentially not affected by this parameter as expected. A higher
lending rate will reduce the debt service ratios for the RSQ, since a larger amount of the project’s
net cash flows have to be spent on loan repayments.
Table 11: Sensitivity Test of Real Interest Rate
Annual Real
Interest Rate
FNPV
RSQ
(US$ m)
FIRR
RSQ
ADSCR
2009
ADSCR
2010
ADSCR
2011
ADSCR
2012
ADSCR
2013
DSCR
2009
1.00% 89.53 21.88% 2.19 2.75 2.94 2.98 2.99 3.28
2.00% 82.65 21.37% 2.00 2.54 2.73 2.79 2.82 3.05
2.50% 79.12 21.11% 1.92 2.44 2.64 2.70 2.74 2.94
3.00% 75.52 20.85% 1.84 2.35 2.54 2.62 2.66 2.84
3.40% 72.60 20.63% 1.78 2.28 2.47 2.55 2.60 2.76
4.00% 68.13 20.29% 1.70 2.18 2.37 2.46 2.52 2.65
5.00% 60.47 19.72% 1.57 2.02 2.22 2.31 2.38 2.47
BLS Transponder Price: A sensitivity test on the price of a BLS transponder charged by the RSQ
to institutional subscribers is carried out and the results are presented in Table 12. In the early years
of operations, there is low demand for TES and TRS and the project will largely rely on the
revenues from BLS transponders rented out to subscribers. If the price per BLS transponder were to
fall, say from US$ 1.81 million per transponder to US$ 1.50 million nominal, the NPV of the
project will decrease by about US$ 24.1 million. This loss represents about 6.6% of the value of the
project’s investment.

20
Table 12: Sensitivity Test of Rental Price per BLS Transponder
BLS Price
(US$ million/transponder)
FNPV
RSQ
(US$ m)
FIRR
RSQ
ADSCR
2009
ADSCR
2010
ADSCR
2011
ADSCR
2012
ADSCR
2013
DSCR
2009
0.75 0.21 15.02% 1.41 1.92 2.12 2.19 2.24 2.33
1.00 17.34 16.38% 1.50 2.01 2.21 2.28 2.32 2.43
1.50 51.46 19.03% 1.67 2.17 2.37 2.45 2.50 2.63
1.81 72.60 20.63% 1.78 2.28 2.47 2.55 2.60 2.76
2.00 85.55 21.59% 1.85 2.34 2.54 2.61 2.67 2.84
2.50 119.59 24.06% 2.03 2.50 2.70 2.78 2.84 3.04
Reduction in RSQ Total Revenue: The sensitivity test of a reduction of RSQ’s gross revenue from
all three types of services is presented in Table 13. If for any reason the RSQ’s gross revenue falls
by 5%, the NPV of the project will decrease by US$ 20.7 million which is equivalent to a 5.7% loss
of the project’s investment value. The project will have a negative NPV if the gross revenues
decrease more than 18.0%. In terms of debt service, the RSQ will be able to pay off the debt
repayments timely as long as it’s expected gross revenues are not reduced below 20.0%.
Table 13: Sensitivity Test of Reduction in RSQ’s Gross Revenue
Reduction in
Gross Revenue
FNPV
RSQ
(US$ m)
FIRR
RSQ
ADSCR
2009
ADSCR
2010
ADSCR
2011
ADSCR
2012
ADSCR
2013
DSCR
2009
0.00% 72.60 20.63% 1.78 2.28 2.47 2.55 2.60 2.76
5.00% 51.87 19.12% 1.68 2.14 2.33 2.40 2.45 2.60
10.00% 31.15 17.54% 1.57 2.01 2.19 2.25 2.30 2.44
15.00% 10.42 15.87% 1.46 1.87 2.04 2.11 2.15 2.28
18.00% -2.02 14.83% 1.39 1.79 1.95 2.02 2.06 2.18
20.00% -10.31 14.11% 1.35 1.74 1.90 1.96 2.00 2.12
Break-even Number of Terminals: In the base case of financial analysis, built on the conservative
schedule of terminal deployment endorsed by the telecom operators, the expectation is that the
maximum number of terminals will not exceed 94,288 terminals. This sensitivity test challenges
this expectation by examining the ability of the project to withstand a possible reduction in the
number of terminals installed and actually used. As Table 14 shows, for the project to break-even,
assuming that all excess transponders from TES and TRS are not utilized by BLS subscribers, there
has to be at least 52,051 terminals deployed. If the actual number of terminals installed and used is
more than that, the project’s NPV will become positive. For example, in a case telecoms were able
to deploy 70,000 terminals; the NPV of the project will be US$ 42.48 million. The project will be
able to make annual payments of its loans as long as the number of terminals installed is above
40,000. If the actual deployment is less than that level, ADCRS in year 2009 will be lower than
one.

21
Table 14: Sensitivity Test for Number of Terminals Installed
Number of
Terminals
Installed
FNPV
RSQ
(US$ m)
FIRR
RSQ
ADSCR
2009
ADSCR
2010
ADSCR
2011
ADSCR
2012
ADSCR
2013
DSCR
2009
FNPV
Telecoms
(US$ m)
40,000 -28.66 12.35% 1.35 1.50 1.57 1.64 1.71 1.85 13.51
45,000 -16.77 13.47% 1.43 1.58 1.65 1.72 1.79 1.95 24.30
52,051 0.00 15.00% 1.55 1.70 1.77 1.83 1.90 2.08 39.52
55,000 7.01 15.62% 1.60 1.75 1.82 1.88 1.95 2.13 45.88
65,000 30.71 17.63% 1.77 1.91 1.98 2.04 2.11 2.31 67.46
70,000 42.48 18.59% 1.85 1.99 2.06 2.12 2.19 2.41 78.25
75,000 54.25 19.52% 1.94 2.07 2.14 2.20 2.27 2.50 89.04
80,000 66.01 20.42% 2.02 2.16 2.23 2.28 2.35 2.59 99.83
Transponder Availability: The base case assumption about the availability of transponders in the
satellite is 100 percent. In the sensitivity analysis, this assumption is challenged to determine the
effect of possible ranges of transponder availability on the project outcome. The technical
reliability of the satellite is very critical since the amount of revenues generated by the RSQ and
telecoms are determined by the volume of services transmitted by the satellite. Table 15 presents
the effects of possible ranges of transponder availability of the satellite on the RSQ and telecoms’
financial outcomes. If there are technical failures in the satellite that cause transponder failures 5%
of the time during the operation period, the NPV of the project will fall by US$ 19.9 million. This
loss is equivalent to 5.4% of the value of the investment by the project. The same reduction in
transponder availability will reduce the NPV of the participating telecoms by US$ 15.1 million
which is equivalent to 10.9% of their investment value in this project.
Table 15: Sensitivity Test for the Availability of Satellite Transponders
Availability Factor
(Satellite transponders)
FNPV
RSQ
(US$ m)
FIRR
RSQ
ADSCR
2009
ADSCR
2010
ADSCR
2011
ADSCR
2012
ADSCR
2013
DSCR
2009
FNPV
Telecoms
(US$ m)
0.50 -126.92 1.64% 0.73 0.76 1.07 1.13 1.15 1.15 -61.63
0.65 -67.18 8.70% 1.06 1.37 1.50 1.55 1.59 1.68 -16.31
0.75 -27.05 12.61% 1.26 1.63 1.78 1.84 1.88 1.99 13.90
0.85 12.93 16.08% 1.47 1.89 2.06 2.12 2.17 2.30 44.10
0.95 52.73 19.18% 1.68 2.15 2.34 2.41 2.46 2.61 74.31
1.00 72.60 20.63% 1.78 2.28 2.47 2.55 2.60 2.76 89.42
Break Even Analysis: In addition to the sensitivity analysis that has been carried out above, a
break-even analysis of some of the critical variables is also carried out on the RSQ and telecoms’
financial outcomes. The financial NPV of the RSQ break even at the following levels: increase of
investment cost overruns of +47%; traffic per terminal of 42 minutes/day, annual real decrease in
tariffs of 13.1%. The financial break-even points for the telecoms taken together are: +41% cost
over-runs, annual decrease in tariffs 13.1%, and a daily traffic of 31 minutes/terminal.
22
6. ECONOMIC APPARAISAL
6.1 Approach and Parameters
The economic analysis measures the economic impact of the proposed project on the economy as a
whole. In the case of this particular project, the economic analysis is carried out from the point of
view of the economy of the African continent rather than from the perspective of a single country.
Since the RSQ is partly financed by external funds to Africa, any profits generated by the project
and transferred out of the African continent would not accrue to African countries. The remaining
profit is attributed to the share of the equity contributed by Rascom and GPTC. This share of the
benefits, amounting to approximately 53 percent of the total should be accounted for as part of the
economic net benefit to this project. The remaining 47 percent should be netted out of the economic
benefits. The task of the evaluation is to examine if the RSQ project would generate a positive net
economic benefits to the people of the African continent as a whole. The relevant discount rate for
the economic resource flow statement is the economic opportunity cost of capital (EOCK) that was
taken as 11% real. 17
The prices of all outputs and inputs in the economic analysis are measured in economic terms. To
ensure a consistent transformation from the financial model to the economic analysis, economic
conversion factors for most of the cash flow items are calculated in order to arrive at the economic
value of the corresponding item in the economic resource flow statement. The economic value of
the project’s output, telecommunication services, is estimated on the basis of the consumers’
willingness to pay.
Project inputs belong to either international tradable goods or goods and services whose prices are
determined only by the local market. For tradable goods, such as equipment, machinery, steel, and
fuel, used by the project and telecoms, the value of foreign exchange premium has to be accounted
for because the economic price of foreign exchange differs from the market price. Expenditures on
non-tradable goods such as bricks, freight, and electricity are adjusted for a series of tax distortions
as well as for the shadow price of non-tradable outlays (SPNTO). For Africa as a whole, the foreign
exchange premium is estimated at 9% and the shadow price of non-tradable outlays (SPNTO) is
taken at 1%.
6.2. Economic Value of Telecommunication Services One of the most important considerations in the evaluation of this project is to measure the
economic value of telecommunication services provided to the telecom operators, end users and
bandwidth subscribers. The provision of satellite telecommunication services will affect largely
three groups of users: rural communities who currently do not have access to telecommunication
services, the users of existing public telephone services, and participating African telecom
operators. An important element of the economic evaluation is the user’s willingness to pay for the
service which is used to measure the economic value of the three types of services provided by the
RSQ. This is especially important as the project provides telecommunication services to rural areas
17
While no specific analysis was done in regard to estimation of the economic opportunity cost of capital (EOCK)
for Africa, a comprehensive study was carried out for South Africa. The EOCK for South Africa was estimated to
be equal to a real rate of 11%. The same rate was used for the whole of Africa for the purpose of this analysis. See
Kuo, C.Y., Jenkins, G. P. and Mphahlele, M.B. “The Economic Opportunity Cost of Capital in South Africa”,
South African Journal of Economics, September 2003.

23
which were never served before. Although even without this satellite, it is likely that sometime in
the future they would get telephone services from another source. In the case of services that are
currently provided to the users of the existing PSTN, both African telecoms and end users are going
to benefit from cheaper intra-Africa and international connection tariff rates charged by the project.
In the economic analysis, these benefits need to be properly accounted for, while converting the
financial cash flow statement into the economic resource flow statement.
6.2.1 Telecom Operators (TRS)
At present, the telecoms purchase airtime from other satellites and resell them to the ultimate users.
By implementing the project, the telecom subscribers to the RSQ will benefit as a result of a
reduction in the costs they would have otherwise paid to other satellite service providers. In the
case of TRS, the net economic benefits can be measured by the cost savings enjoyed by the
telecoms because the RSQ is expected to charge them a price for the satellite service that is less
than what they would have to pay elsewhere. Using Figure 3 as an illustration, it is clear that
telecoms operators will witness a reduction in unit cost from P0 (US$ 0.069 per minute in 2005
prices) to a level of P1 (US$ 0.051 per minute) that would be charged by the project. As a result, the
quantity demanded of international calls for PSTN users would increase from Q0 to Q1. The net
economic benefits can be measured by the area P1P0DC.
The end users are, in fact, the driving force behind the demand for telecommunication services. The
people who are currently connected to the existing PSTNs will benefit from the reduction in tariff
rates due to the project. They will pay less for the existing services and may consume more services
at a lower rate. This is assuming that the telecoms operate in enough of a competitive environment
so that the cost reduction they achieve will be passed on fully to the end users. Telecoms now
charge the end users a tariff T0 per minute but as a result of this project, the price charged to the
end users would be lower, T1 per minute. One would expect that most of the cost savings by the
telecoms would be passed through to end users by way of price reductions. The net economic
benefit to the end users will be measured by T1T0FE, which is exactly the same amount as the gain
by the telecoms.18
This will occur during the same time period, say a year. The increase in demand
for telecommunication services as a result of tariff reduction can be estimated by using an estimate
of the elasticity of demand for the telephone services. The elasticity of demand for such telephone
services is approximately -0.5.19
In a competitive market, a reduction of the tariff rates will take place over time, and so will
alternative coping costs regardless to what happens to the RSQ project. As a result, all rates are
expected to decline as the project is expected to improve the well-being of the African consumers.
It is expected that new technologies will emerge in the future and therefore, the economic benefits
that should be attributed to this project in terms of the cost savings enjoyed by the rural and PSTN
users should be reduced as time passes.
18
In calculating the value of net economic benefits, the foreign exchange premium associated with the savings is
accounted for. 19
Vodaphone “Review of Price Elasticities of Demand for Fixed Line and Mobile Telecommunication Services”
2003. www.comcom.govt.nz/industryregulation/telecommunications/telecommunicationservicesobligations

24
Figure 3: Economic Value of TRS Service for Telecoms and End Users
For a Given Year (2007)
6.2.2 End Users (TES)
For the end users, the telecommunication services provided by the RSQ include both TES and TRS.
In the case of TES, the services provided are domestic and international telephony. Since at present
there is virtually no telephone service in rural areas at the moment, all telephone calls are a result of
this project. The net economic benefits of incremental services to end users can be measured by the
area ACP1 as shown in Figure 4, in which A stands for the maximum willingness to pay (MWTP).
In the absence of the project, people living in rural areas have to engage in costly means such as
traveling or sending mail.20
In the case of domestic calls, rural customers will pay a tariff of P1 (e.g.
US$ 0.114 per minute in 2007) to a local telecom operator. The volume of service demanded at this
tariff level is Q1. By paying tariff P1 per minute, the end users enjoy a net gain which is measured
by the area P1AC. For international TES calls, the net economic benefits for rural customers are
valued in a similar fashion, and the corresponding values for P0 and P1 are estimated at US$ 1.445
and US$ 0.619 per minute, respectively. New technologies are expected to emerge in the future and
the reduction in coping cost would be greater than the reduction in tariffs charged by telecom
operators. It is assumed that the coping cost will decline by 9% per year for TES and as a result, the
20 To estimate the maximum willingness to pay or coping costs of telephone service for people in rural areas, it is
typically examined what people in similar circumstances have shown what they are willing to pay. In carrying out
this analysis a very conservative evaluation of what people are willing to pay is adopted. Let’s begin by
postulating that the wealthiest customers that will receive the telephone service now in the rural areas have
approximately the same (or likely higher) income than the marginal users of telephone services elsewhere in the
country had 10 years ago. Furthermore, we know that the local telephone rates 10 years ago were 2.35 times the
rates that are going to be charged to the rural customers. Hence we set a value of the maximum willingness to pay
equal to 2.35 times the tariff of US$ 0.114 per minute or US$ 0.268 per minute.
Demand by
Telecoms
P0 = 0.069
P1 = 0.051
T1
T0
0 Q0 Q1
D
C
F
E
Traffic (minutes/year)
Demand by
End Users
Tariff/Coping Cost
(US$/minute)
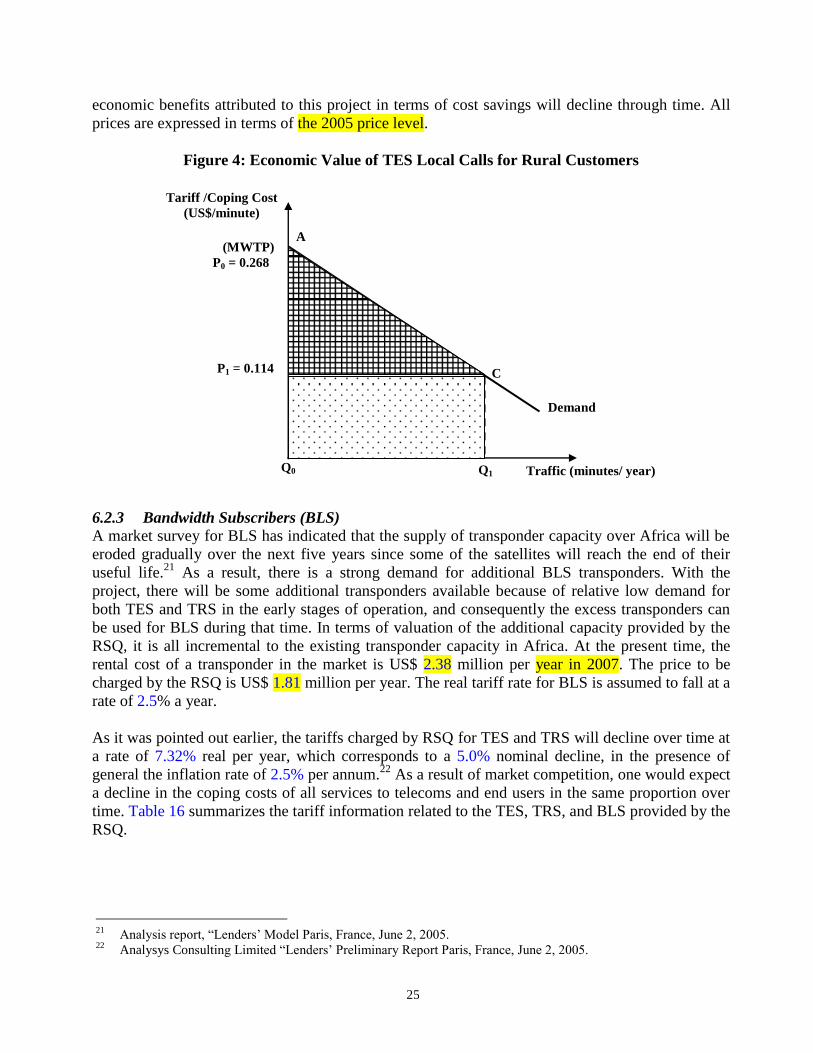
25
economic benefits attributed to this project in terms of cost savings will decline through time. All
prices are expressed in terms of the 2005 price level.
Figure 4: Economic Value of TES Local Calls for Rural Customers
6.2.3 Bandwidth Subscribers (BLS)
A market survey for BLS has indicated that the supply of transponder capacity over Africa will be
eroded gradually over the next five years since some of the satellites will reach the end of their
useful life.21
As a result, there is a strong demand for additional BLS transponders. With the
project, there will be some additional transponders available because of relative low demand for
both TES and TRS in the early stages of operation, and consequently the excess transponders can
be used for BLS during that time. In terms of valuation of the additional capacity provided by the
RSQ, it is all incremental to the existing transponder capacity in Africa. At the present time, the
rental cost of a transponder in the market is US$ 2.38 million per year in 2007. The price to be
charged by the RSQ is US$ 1.81 million per year. The real tariff rate for BLS is assumed to fall at a
rate of 2.5% a year.
As it was pointed out earlier, the tariffs charged by RSQ for TES and TRS will decline over time at
a rate of 7.32% real per year, which corresponds to a 5.0% nominal decline, in the presence of
general the inflation rate of 2.5% per annum.22
As a result of market competition, one would expect
a decline in the coping costs of all services to telecoms and end users in the same proportion over
time. Table 16 summarizes the tariff information related to the TES, TRS, and BLS provided by the
RSQ.
21
Analysis report, “Lenders’ Model Paris, France, June 2, 2005. 22
Analysys Consulting Limited “Lenders’ Preliminary Report Paris, France, June 2, 2005.
Demand
A
Q0
P1 = 0.114 C
Traffic (minutes/ year) Q1
(MWTP)
P0 = 0.268
Tariff /Coping Cost
(US$/minute)

26
Table 16: Tariffs and Coping Costs for Telecommunication Services, 2007
Service
Telecom Operators End Users
Tariff Charged to
Telecoms
Cost Savings of
Telecoms
Tariff Charged to
End Users
Coping Savings
of End Users
TES: Domestic local US$ 0.033 Not Applicable US$ 0.114 US$ 0.268 TES: Long distance US$ 0.033 Not Applicable US$ 0.152 US$ 0.358 TES: International US$ 0.086 Not Applicable US$ 0.619 US$ 1.447 TRS US$ 0.051 US$ 0.069 US$ 0.428 US$ 0.446 BLS US$ 1.81 million US$ 2.38 million Not Applicable Not Applicable
Source: RSQ management June 2005.
6.3 Economic Value of Cost Items
All financial investment and operating costs are converted to economic values using the principles
of applied welfare economics. They are briefly discussed below.
Investment Costs: The investment cost items for this project and for telecom operators are mainly
imported commodities with the exception of the ground control system, ground infrastructure
development and ICS/BLS facilities. For this particular project, all imported inputs are exempted
from import duties and other indirect taxes. For tradable items, the values of foreign exchange
premium have to be incorporated. For the non-tradable components, such as the ground control
system, ground infrastructure development and ICS and BLS facilities, the analysis looks at the
distortions in the inputs markets (i.e., taxes and subsidies on the goods and services used in these
items) and also accounts for the shadow price of non-tradable outlays.23
Hence, tradable inputs
attract both import duties and indirect taxes, while non-tradable inputs are only subject to indirect
taxes.
RSQ Operation and Maintenance Costs: The main components of these expenditures are
replacement parts and equipment necessary to ensure a smooth operation of the satellite monitoring
and control centers and network stations of the project. Since there are no other distortions on the
operating inputs, it is only the value of foreign exchange premium that has to be factored in the
estimation of the economic cost of all these items.
Telecoms operating and Maintenance Costs: The main component of the telecoms’ operating and
maintenance cost are the airtime cost they pay to the RSQ and expenditures on the importation of
spare parts for terminals and gateways. In the case of airtime cost, this is not counted as an
economic resource cost to the continent because this payment is made to the RSQ. The value of
foreign exchange premium is applied on all the other operating costs in order to derive their
economic values.
23
The detailed explanation for non-tradable goods can be found in Cambridge Resources International, Inc,
Integrated Investment Appraisal: Concepts and Practices, prepared for the Department of Finance and Economic
Development, Limpopo Provincial Government, Republic of South Africa, (2005), Appendix F.

27
Labor: The economic cost of labor (EOCL) employed by the project is estimated using the supply
price approach. The approach starts with the wage paid by the project and adjusts for all applicable
personal income taxes and social security contributions to arrive at the economic opportunity cost
of labor. 24
The average rate of personal income tax and social security contributions are assumed
to be 20% and 10%, respectively.
Summary of Economic Conversion Factors
The resulting economic conversion factors (CFs) are summarized in Table 17. Multiplying these
conversion factors by the corresponding cash flow items in the financial statement of the project
and telecoms will arrive at the economic values for the economic resource statement.
Table 17: Economic Conversion Factors
Item CF
RSQ
Satellite / Launcher / Insurance/ launch campaign / Ground design / Terminals / Pre-
operating expenses / License fees / Contingencies 1.090
Ground control system/Ground infrastructure development / ICS & BLS development 0.927
Residual values RSQ 0.927
Maintenance & Miscellaneous Exp. / Marketing / Ground infrastructure & technical costs /
General & management cost / In-orbit insurance / Periodic fee 1.090
Change in cash balance 1.000
Labor
Management/Engineers/ Marketing & Sales 0.935
Technicians/ Support staff 0.892
Telecoms
Terminals equipped with solar panel 0.958
Terminals equipped with DVB receiver 0.923
Terminals equipped with telephone fax copier 0.946
Terminals equipped with telephone fax copier & computer 0.986
TES gateway/ TRS gateway 0.876
Residual values/ Maintenance cost 0.940
Labor
Technical staff 0.963
Headquarters 0.967
24 The EOCL is equal to the willingness of people to supply labor for the project activities, net of taxes and social
security contributions: EOCL = Gross IncomeProject
– Soc.SecurityProject
– [TaxesProject
– (TaxesAlternative
*
ShareAlternative
) – Soc.SecurityAlternative
].
28
6.4 Economic Feasibility of Project
Once all items in the financial cash flow statement are adjusted to their corresponding economic
values, the economic resource flow statement of the project is constructed and presented in Table
18. The economic benefits of the project services are basically the economic values of
telecommunication services, TES, TRS, and BLS, presented in Section 6.2. In addition, the changes
in the accounts receivable and residual values are counted as part of the project-related benefits.
The economic costs are represented by the initial investment costs incurred by both the project and
the participating telecoms operators. The labor, operating, and maintenance costs of both the
project and telecoms are also included. Finally, the changes in the accounts payable and cash
balance are added to the costs. These costs are all described in Section 6.3.
The resulting net resource flow indicates the net contribution of the project to the African economy.
In order to estimate the economic NPV of the proposed project, the flow of annual net benefits is
discounted by the economic cost of capital, taken as 11% real. The NPV of the net economic
benefits yields US$ 2,285.2 million. This result indicates that the net economic impact accruing to
the African users, telecoms and African population is significantly greater than the alternative use
of the resources employed by the project for launching the satellite and maintaining the necessary
ground infrastructure over time.
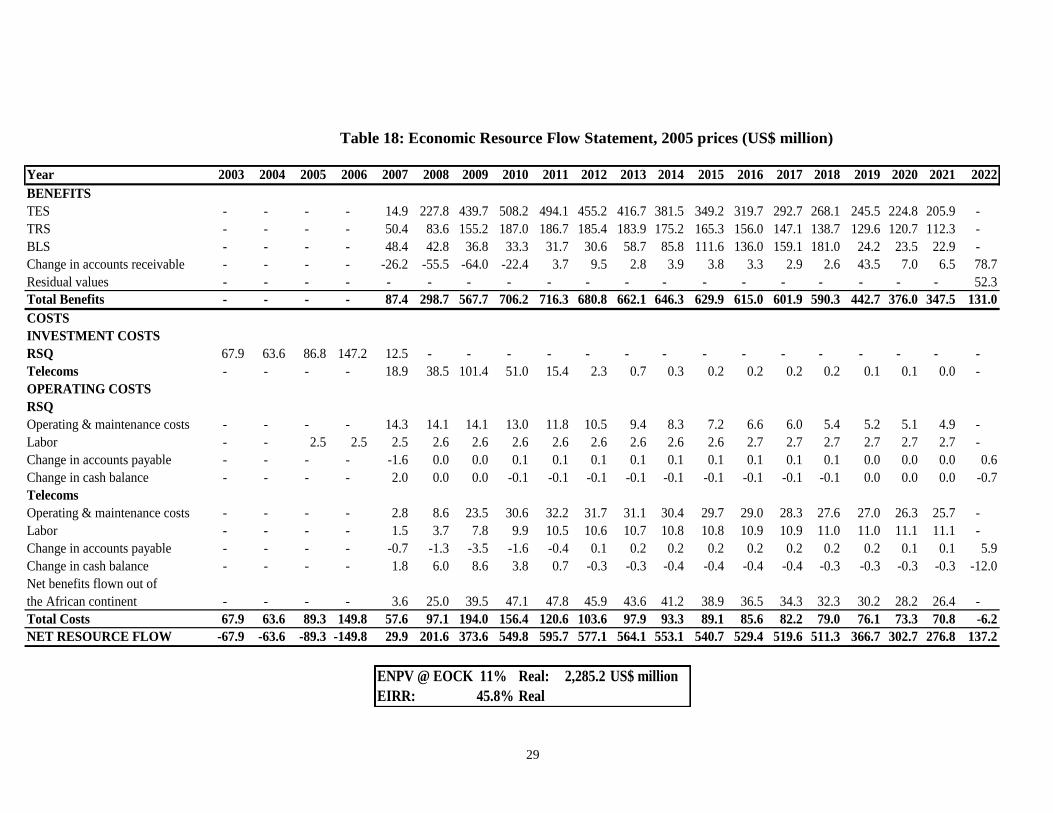
29
Table 18: Economic Resource Flow Statement, 2005 prices (US$ million)
Year 2003 2004 2005 2006 2007 2008 2009 2010 2011 2012 2013 2014 2015 2016 2017 2018 2019 2020 2021 2022
BENEFITS
TES - - - - 14.9 227.8 439.7 508.2 494.1 455.2 416.7 381.5 349.2 319.7 292.7 268.1 245.5 224.8 205.9 -
TRS - - - - 50.4 83.6 155.2 187.0 186.7 185.4 183.9 175.2 165.3 156.0 147.1 138.7 129.6 120.7 112.3 -
BLS - - - - 48.4 42.8 36.8 33.3 31.7 30.6 58.7 85.8 111.6 136.0 159.1 181.0 24.2 23.5 22.9 -
Change in accounts receivable - - - - -26.2 -55.5 -64.0 -22.4 3.7 9.5 2.8 3.9 3.8 3.3 2.9 2.6 43.5 7.0 6.5 78.7
Residual values - - - - - - - - - - - - - - - - - - - 52.3
Total Benefits - - - - 87.4 298.7 567.7 706.2 716.3 680.8 662.1 646.3 629.9 615.0 601.9 590.3 442.7 376.0 347.5 131.0
COSTS
INVESTMENT COSTS
RSQ 67.9 63.6 86.8 147.2 12.5 - - - - - - - - - - - - - - -
Telecoms - - - - 18.9 38.5 101.4 51.0 15.4 2.3 0.7 0.3 0.2 0.2 0.2 0.2 0.1 0.1 0.0 -
OPERATING COSTS
RSQ
Operating & maintenance costs - - - - 14.3 14.1 14.1 13.0 11.8 10.5 9.4 8.3 7.2 6.6 6.0 5.4 5.2 5.1 4.9 -
Labor - - 2.5 2.5 2.5 2.6 2.6 2.6 2.6 2.6 2.6 2.6 2.6 2.7 2.7 2.7 2.7 2.7 2.7 -
Change in accounts payable - - - - -1.6 0.0 0.0 0.1 0.1 0.1 0.1 0.1 0.1 0.1 0.1 0.1 0.0 0.0 0.0 0.6
Change in cash balance - - - - 2.0 0.0 0.0 -0.1 -0.1 -0.1 -0.1 -0.1 -0.1 -0.1 -0.1 -0.1 0.0 0.0 0.0 -0.7
Telecoms
Operating & maintenance costs - - - - 2.8 8.6 23.5 30.6 32.2 31.7 31.1 30.4 29.7 29.0 28.3 27.6 27.0 26.3 25.7 -
Labor - - - - 1.5 3.7 7.8 9.9 10.5 10.6 10.7 10.8 10.8 10.9 10.9 11.0 11.0 11.1 11.1 -
Change in accounts payable - - - - -0.7 -1.3 -3.5 -1.6 -0.4 0.1 0.2 0.2 0.2 0.2 0.2 0.2 0.2 0.1 0.1 5.9
Change in cash balance - - - - 1.8 6.0 8.6 3.8 0.7 -0.3 -0.3 -0.4 -0.4 -0.4 -0.4 -0.3 -0.3 -0.3 -0.3 -12.0
Net benefits flown out of
the African continent - - - - 3.6 25.0 39.5 47.1 47.8 45.9 43.6 41.2 38.9 36.5 34.3 32.3 30.2 28.2 26.4 -
Total Costs 67.9 63.6 89.3 149.8 57.6 97.1 194.0 156.4 120.6 103.6 97.9 93.3 89.1 85.6 82.2 79.0 76.1 73.3 70.8 -6.2
NET RESOURCE FLOW -67.9 -63.6 -89.3 -149.8 29.9 201.6 373.6 549.8 595.7 577.1 564.1 553.1 540.7 529.4 519.6 511.3 366.7 302.7 276.8 137.2
ENPV @ EOCK 11% Real: 2,285.2 US$ million
EIRR: 45.8% Real

30
6.5 Economic Sensitivity Analysis
Sensitivity analysis is carried out to identify the variables that are most likely to affect the
economic outcomes of the project. The results of the sensitivity analysis are presented for
selected variables.
Cost Over-runs: The project’s economic viability is sensitive to the possible escalation of the
project investment costs. Should costs for any reason rise by 5%, the economic NPV of the
project will fall from US$ 2,285.3 million to US$ 2,261.8 million. This is equivalent to a loss
of 4.4% of the investment value of the project in economic terms.25
The impact of cost over-
runs on the economic NPV of the project is presented in Table 19.
Table 19: Sensitivity Test of Cost Over-runs
Cost Over-run
Factor
ENPV
(US$ m)
-10.00% 2,331.96
-5.00% 2,308.61
0.00% 2,285.25
5.00% 2,261.79
10.00% 2,238.33
15.00% 2,214.87
20.00% 2,191.42
25.00% 2,167.96
Traffic per Terminal: The usage rate of terminals has a major impact on the economic
outcome of the project because a substantial share of the project’s economic benefits comes
from rural telephony services TES. The viability of the project depends on the volume of
traffic telecoms will receive from terminals installed in the rural areas. If the level of voice
and data traffic on rural terminals declines from the expected 70 minutes to 60 minutes per
day, the economic NPV will decrease by US$ 256.8 million which is equal to a loss of 48.0%
of the investment value of the project in economic terms.
Table 20: Sensitivity Test of Traffic per Terminal
Daily Traffic
(minutes/terminal)
ENPV
(US$ m)
50 1,771.65
60 2,028.47
70 2,285.25
80 2,542.01
7. STAKEHOLDER ANALYSIS
The stakeholder analysis identifies the winners and losers of a project and also measures the
magnitude of the gain or loss accruing to the project stakeholders. The financial and
economic analysis of the integrated project analysis can provide the basic data for estimation
of specific stakeholder impacts.
25
The economic value is equal to the present value of investment cost (initial asset values) of the project. It is
approximately US$ 534.5 million.

31
7.1 Identification of Externalities
The stakeholder analysis of the RSQ project is conducted to identify the beneficiaries of the
project. The stakeholder analysis of any project is built on the following relationship:
Pe
= Pf + (EXTi)
Where: Pe is the economic value of an input or output,
Pf is the financial values of the same item, and
(EXTi) is the sum of all the externalities that make the economic values of the item
different from its financial value.
In other words, the economic value of an item is the sum of its financial price plus the value
of externalities such as taxes, tariffs, subsidies and consumer or producer surplus. Taking the
net present value of the benefits and costs over the life of the project can yield the following
relationship:26
NPVee = NPV
fe + ∑PVe (EXTi)
Where: NPVee is the PV of the net economic benefits discounted by the economic cost of
capital,
NPVfe is the PV of the net financial cash flow discounted by the economic cost of
capital, and
∑PVe (EXTi) is the sum of the present values of all the externalities generated by
the project, also discounted by the economic cost of capital.
All projects generate two types of benefits: (a) financial benefits, which accrue directly to
those who have a financial interest in the project; and (b) distributive impact or externalities,
which are allocated to different segments of society. The stakeholder analysis requires the
following steps:
Identify the stakeholder impacts of the project item by item, by deducting the total
investment cash flow statement from the economic statement of benefits and costs,
Calculate the present value of each line item’s flow of distributive impacts, using the
economic cost of capital as the discount rate,
Allocate the present value of externalities to the relevant groups in the economy.
Table 21 presents the reconciliation between the financial, economic and externalities of the
proposed project, all discounted by economic cost of capital of 11% real. If the economic
NPV is equal to the financial NPV plus the present value of distributional impacts, using a
common discount rate, it indicates that the analysis was carried out in a consistent manner.
The economic NPV is the same as the one shown in Table 18; however the financial NPV is
not equal to the sum of the ones displayed in Tables 4 and 5 where the financial net cash
flows were discounted at the required rate of return on equity of 15% real. The financial NPV
of the satellite project is US$ 162.0 million (RSQ and telecoms combined) compared to the
economic NPV of US$ 2,285.2 million. The difference between the financial NPV and the
economic NPV, both discounted at the economic cost of capital of 11% real, is our base case
estimation of the present value of all externalities created by the project.
26
This relationship holds exactly only when the same rate of discount is applied to estimate the PV of the
benefits and costs of all stakeholders. This usually holds. It is however, a very useful check in to see if the
estimates have been made correctly.

32
Table 21: Reconciliation of Financial, Economic
And Externality Flows, 2005 prices (US$ million)
Financial Externalities Economic
CATEGORY @ EOCK @ EOCK @ EOCK
BENEFITS
TES 672.4 1,430.7 2,103.1
TRS 403.7 510.7 914.5
BLS 164.4 230.3 394.7
Change in accounts receivable -16.9 -61.1 -78.0
Residual values 9.4 -0.6 8.9
Total Benefits 1,233.1 2,110.1 3,343.1
COSTS
Investment Costs
RSQ 361.7 22.2 383.9
Telecoms 159.9 -9.3 150.6
OPERATING COSTS
RSQ
General operating costs 62.8 5.7 68.5
Labor 23.4 -1.7 21.7
Change in accounts payable -0.9 0.1 -0.8
Change in cash balance 1.1 0.0 1.1
Telecoms
General operating costs 160.8 -9.3 151.5
Labor 56.6 -2.0 54.6
Change in accounts payable -16.8 13.4 -3.5
Change in cash balance 10.9 0.0 10.9
Net benefits flown out
of the African continent 202.6 16.6 219.2
Total Costs 1,022.3 35.6 1,057.9
NET BENEFITS 210.8 2,074.4 2,285.2
7.2 Distributive Analysis
In the distributive analysis, it is important to know what is the net contribution of the project
to each of the stakeholders. While some of the stakeholders may gain due to the project’s
activities, others may incur a loss. The net impact on all the stakeholders created by the
project is a sum of negative and positive externalities imposed on all the stakeholders. On the
benefits side, for the base case scenario, the total amount of externalities is US$ 2,110.0
million. On the cost side, the amount of externalities amounts to US$ 35.6 million. These two
sums up to a net amount of US$ 2,074.4 million that accrues to all the stakeholders of the
project excluding those directly involved in the ownership of the satellite or the telecoms.
The position of these two stakeholders are examined and evaluated in the financial analysis.
It is also necessary to assess the magnitude of any burden imposed on the stakeholders. This
can be measured by the incremental net cash flows that are expected to be realized by each
group. The question then becomes whether the project addresses the needs of the right group
of stakeholders. Table 22 presents the allocation of economic externalities generated by this
project among BLS subscribers, rural users, PSTN users, and African governments
participating in the project. The figures are expressed in the present values of impacts,

33
discounted by the EOCK of 11%. The integrated appraisal framework allows the analyst to
reconcile the total externalities with the gains and losses accruing to a particular group of
stakeholders. In Table 21, the third column with externalities is the same as the net impact on
the African economy in Table 22. The resulting net impact on the whole economy is US$
2,074.4 million.
Table 22: Allocation of Externalities, 2005 prices (US$ million)
Total BLS Rural PSTN African
Externalities Subscribers Users Users Governments
BENEFITS
TES 1,388.1 1,388.1
TRS 492.2 451.6 40.6
BLS 230.3 211.3 19.0
Residual value (RSQ) -0.1 -0.1
Residual value (telecoms) -0.5 -0.5
Total Benefits 2,110.1 211.3 1,388.1 451.6 59.1
COSTS
Investoment Costs
RSQ 22.2 22.2
Telecoms -9.3 -9.3
OPERATING COSTS
RSQ
General Operating Costs 5.7 5.7
Labor -1.7 -1.7
Change in Working capital 0.1 0.1
Telecoms
General Operating Costs -9.3 -9.3
Labor -2.0 -2.0
Change in Working capital 13.4 13.4
Net benefits flown out
of the African continent 16.6 16.6
Total Costs 35.6 35.6
NET BENEFITS 2,074.4 211.3 1,388.1 451.6 23.5
The rural users, who are currently excluded from the PSTN and mobile coverage, appear to
be the main beneficiaries of this project. The amount of consumer surplus created by the
project for this stakeholder group is US$ 1,388.1 million. There are no additional costs to the
rural users apart from the fixed tariffs that they will pay for making phone calls, and their
current coping costs for communication is well above the financial price they will be required
to pay. There is no substitution effect either, as the project provides telecommunication
services to a market segment that was not being served before.
The PSTN users are largely represented by the users of the existing networks located in urban
areas and already having access to the telecommunication services. The proposed project will
deliver the same services cheaper, thus enabling this group of stakeholders to realize a
reduction in their costs, which is expected to reach US$ 451.6 million. The project will
substitute for higher cost foreign satellite providers that currently serve the telecom operators.
These benefits could well be passed forward to the end users.
The BLS subscribers are another distinct group of stakeholders, mainly represented by
internet service providers and TV broadcasters, large corporations from and outside of Africa.
The combined impact on these users is a gain of US$ 211.3 million arising from consumer
surplus generated by the project. The tariff rate charged by the RSQ for dedicated bandwidth
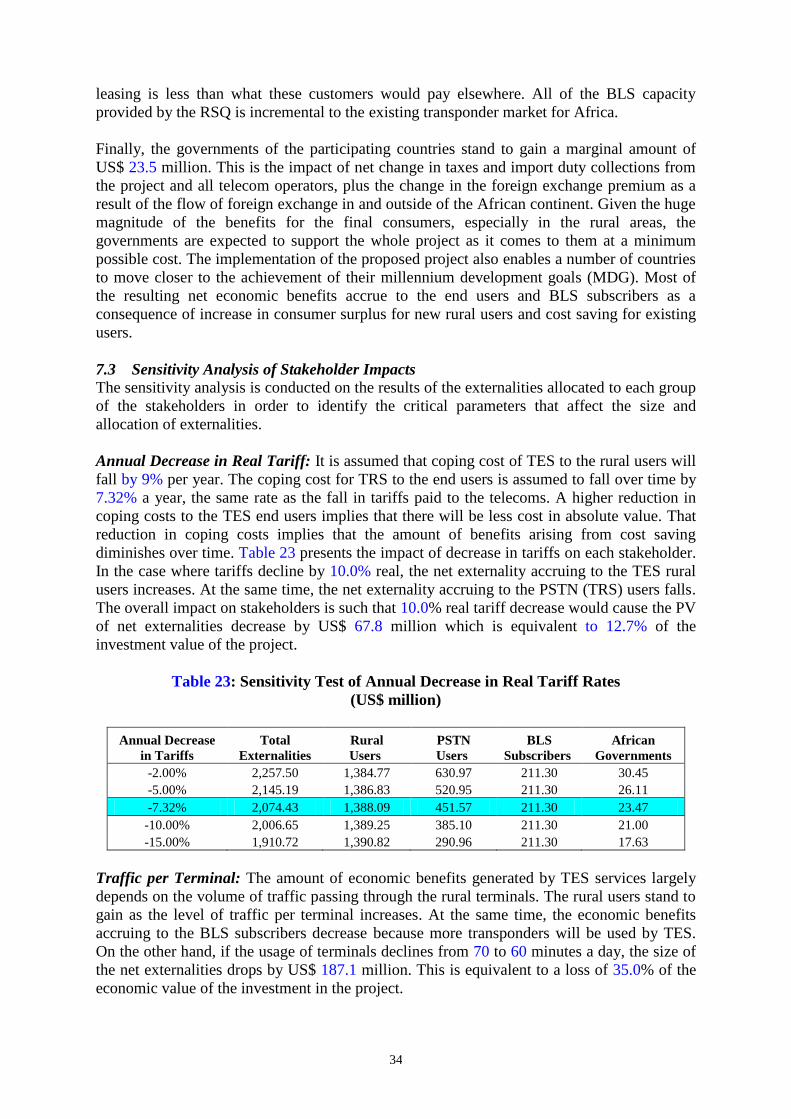
34
leasing is less than what these customers would pay elsewhere. All of the BLS capacity
provided by the RSQ is incremental to the existing transponder market for Africa.
Finally, the governments of the participating countries stand to gain a marginal amount of
US$ 23.5 million. This is the impact of net change in taxes and import duty collections from
the project and all telecom operators, plus the change in the foreign exchange premium as a
result of the flow of foreign exchange in and outside of the African continent. Given the huge
magnitude of the benefits for the final consumers, especially in the rural areas, the
governments are expected to support the whole project as it comes to them at a minimum
possible cost. The implementation of the proposed project also enables a number of countries
to move closer to the achievement of their millennium development goals (MDG). Most of
the resulting net economic benefits accrue to the end users and BLS subscribers as a
consequence of increase in consumer surplus for new rural users and cost saving for existing
users.
7.3 Sensitivity Analysis of Stakeholder Impacts
The sensitivity analysis is conducted on the results of the externalities allocated to each group
of the stakeholders in order to identify the critical parameters that affect the size and
allocation of externalities.
Annual Decrease in Real Tariff: It is assumed that coping cost of TES to the rural users will
fall by 9% per year. The coping cost for TRS to the end users is assumed to fall over time by
7.32% a year, the same rate as the fall in tariffs paid to the telecoms. A higher reduction in
coping costs to the TES end users implies that there will be less cost in absolute value. That
reduction in coping costs implies that the amount of benefits arising from cost saving
diminishes over time. Table 23 presents the impact of decrease in tariffs on each stakeholder.
In the case where tariffs decline by 10.0% real, the net externality accruing to the TES rural
users increases. At the same time, the net externality accruing to the PSTN (TRS) users falls.
The overall impact on stakeholders is such that 10.0% real tariff decrease would cause the PV
of net externalities decrease by US$ 67.8 million which is equivalent to 12.7% of the
investment value of the project.
Table 23: Sensitivity Test of Annual Decrease in Real Tariff Rates
(US$ million)
Annual Decrease
in Tariffs
Total
Externalities
Rural
Users
PSTN
Users
BLS
Subscribers
African
Governments
-2.00% 2,257.50 1,384.77 630.97 211.30 30.45
-5.00% 2,145.19 1,386.83 520.95 211.30 26.11
-7.32% 2,074.43 1,388.09 451.57 211.30 23.47
-10.00% 2,006.65 1,389.25 385.10 211.30 21.00
-15.00% 1,910.72 1,390.82 290.96 211.30 17.63
Traffic per Terminal: The amount of economic benefits generated by TES services largely
depends on the volume of traffic passing through the rural terminals. The rural users stand to
gain as the level of traffic per terminal increases. At the same time, the economic benefits
accruing to the BLS subscribers decrease because more transponders will be used by TES.
On the other hand, if the usage of terminals declines from 70 to 60 minutes a day, the size of
the net externalities drops by US$ 187.1 million. This is equivalent to a loss of 35.0% of the
economic value of the investment in the project.

35
Table 24: Sensitivity Test of Traffic per Terminal
(US$ million)
Daily Traffic
(minutes/terminal)
Total
Externalities
Rural
Users
PSTN
Users
BLS
Subscribers
African
Governments
50 1,700.19 990.65 451.11 229.41 29.02
60 1,887.31 1,189.34 451.37 220.36 26.25
70 2,074.43 1,388.09 451.57 211.30 23.47
80 2,261.54 1,586.87 451.74 202.25 20.68
8. RISK ANALYSIS
The fourth component of the integrated appraisal framework considers the nature and impact
of the risks associated with the project. The main problem of the deterministic analysis is that
it appears that the present parameters are known with 100% certainty and therefore the
estimated NPV of the project is 100% certain. Unfortunately, the cash flow projections are
uncertain over the life of the project, and thus the static model of the financial and economic
analyses do not account for the uncertainties and fluctuations of key project variables in the
real world.
In order to overcome this weakness, a risk analysis is carried out in which a number of risk
variables are identified based on the sensitivity analysis. In the analysis, the uncertainty
associated with the critical variables of a project is expressed in terms of probability
distributions. A Monte Carlo simulation, a form of risk analysis, provides one of the most
practical methods to approximate the dynamics and uncertainties of the real world. The risk
analysis repeats the simulation of the financial and economic analyses many times using
distributions for the values of the most sensitive and uncertain variables that affect the
project. This allows collecting and analyzing statistically the results of the simulations so as
to arrive at a distribution of the possible outcomes of the project and the probabilities of their
occurrence.
The simulations that are carried out as a part of the integrated appraisal approach are quite
different from the traditional sensitivity analysis. Firstly, under a sensitivity analysis only one
or two project parameters are altered at one time to test for the project outcomes. By its
nature, risk analysis allows for modeling the uncertainty of multiple parameters and for
testing their combined effect on the project returns. Secondly, the sensitivity analysis is
mainly about testing the project outcomes under the assumption that no variation in the tested
parameter is possible from one period to another. In contrast, risk analysis is flexible enough
to have annual variations in the tested parameter. Also, it is possible to model a partial lagged
response from one period to the next. Third, the impact of the correlation between the tested
parameter and other parameters is not taken into account in the sensitivity analysis, while the
risk analysis incorporates such relationships into the model. Fourth, the range of values over
which a sensitivity test is carried out does not generally represent the actual scope of possible
fluctuation of the tested parameter. Unless an additional inquiry into the nature and causes of
the tested parameter is done, the range of values of the sensitivity tests is not realistic. Fifth,
even if a range of values is chosen correctly, the sensitivity test does not assign any
probability to the likelihood of getting a particular value in the range. Often, the very extreme
points of the range have a very little probability of occurrence as compared to the values in
the middle of the range. Any risk model collects this information about the likelihood of
occurrence and builds it into the probability distribution of a risk assumption, while
sensitivity analysis ignores this important issue altogether.

36
The range and distribution of values for risk variables are determined and the correlations
between variables are specified as well. The expected values of the distributions of the risk
variables form the base values of the assumptions used in the deterministic financial analysis.
The result of the analysis is presented as a probability distribution of the key indicators of the
project outcomes.
8.1 Selection of Risk Variables and Probability Distributions
The first step in conducting a risk analysis of a project is to identify the key risk variables
using sensitivity analysis. The sensitivity analysis carried out as a part of financial and
economic assessment has already helped find the critical parameters affecting the
performance of the proposed project. The risk variables are identified based on the results of
the sensitivity analysis, and the candidates for being risk variables are both sensitive and
uncertain. The variations in the results such as in the FNPV, ENPV or standard deviation are
affected by the changes not only in one year, but also from year–to–year over the life-span of
the project. In addition, some of the parameters may be within management’s control, while
other parameters are beyond the purview of project management, but their variability affects
the financial and economic results. Table 25 provides some examples of identified risk
factors faced by the RSQ project. The risk analysis is done with the assumption that there is
no tariff floor for the RSQ’s revenue which means that the real rates of tariff could fall by
7.32% or more, annually throughout the project life.
Table 25: Characteristics of Potential Risk Variables
Potential Risk Variables Nature of Risk and Its Impact
Investment cost overruns Direct increase of investment costs. Management can control it to a large extent.
US Inflation Mainly affects the investment costs, operating costs, and loan repayment.
Beyond RSQ’s control; based on US monetary policy and economy.
Annual decrease in tariffs Direct impact on RSQ’s revenue. Depends on the trends in telecommunication
and evolution of technology.
Usage of rural terminals Direct impact on RSQ’s revenue. Is determined by demand of end users. RSQ
can influence this somehow by reducing tariffs but may not be sustainable.
Initial Tariffs Tremendous impact on revenues and profitability. RSQ can change tariffs
however, this may slow down demand.
Launch failure Direct impact on revenue and the viability of the project. A launch failure would
require building a new satellite which will delay the operation of the project by
a few years. This risk is mitigated by a launch insurance but does not eliminate
all the risk
The risk analysis will incorporate the impact of the factors identified in Table 25 on the
project’s outcomes. Some risk factors such as revenue collection and cost overruns can be
controlled by project managers to a certain extent. The RSQ management can put in place a
more efficient collection process that can minimize the loss of revenue and amount
receivables. The growth of demand for telecommunication services is a factor dependent on
the general growth of the economy, and the RSQ has no control over it. Foreign inflation is
totally an exogenous factor that the RSQ has to face.
Once the risky variables are identified, the second step is to select an appropriate probability
distribution and the likely range of values for each risk variable, based on historical
observations of this variable. The probability distributions of each risk variable and the
possible range of its values are presented in Table 26.

37
M e a n = 4 .8 1 %
.0 0 0
4 .5 2 4
9 .0 4 8
1 3 .5 7 1
1 8 .0 9 5
1 .0 0 % 4 .7 5 % 8 .5 0 % 1 2 .2 5 % 1 6 .0 0 %
US inflation
Table 26: Probability Distribution for Selected Risk Analysis Variables
Variable Distribution Type Range and Parameters
Min Max. Likelihood
-5% to 0% 0.50
Step distribution
0% To 5% 0.50
Investment Cost Mean value 0%
Over-run Factor (%) Base case 0%
Min Max. Likelihood
1% to 4% 0.54
Step distribution 4% to 7% 0.28
US Inflation (%) Mean value 4.81% 7% to 10% 0.06
Base case 2.5% 10% to 13% 0.09
13% to 16% 0.03
Mean Std.
Daily Traffic Normal Distribution 74 5.00
Rural Terminals Mean value 74
(minutes/days) Base case 74
Mearn . Std.
-7.32% 2.44%
Reduction in Normal Distribution
Tariffs (%) Mean value -7.32%
Base case -7.32%
Mean Std.
Normal Distribution 0.0 5.5
Demand Mean value 0%
for Terminals (%) Base case 0%
Most of the investment cost items including the satellite, launcher, and network stations are
turnkey fixed contracts. An agreement has also been reached with Alcatel Space in regards to
the price of rural terminals not to exceed US$ 1,100 per terminal. In addition, the amount of
US$ 3 million contingency is set aside to cover any unexpected cost over-runs. Hence the
probability distribution of (+) (-) 5% cost over-runs seems reasonable. The mean for this
distribution is 0% in the risk analysis. The mean for the base case is 0%.
In the case of US inflation rate the mean of the distribution used in the risk analysis is 4.81%
based on the US consumer price index between the periods 1975 to 2005. The base case
mean is 2.5%.
A Monte Carlo simulation generates a probability distribution of the outcome of the project
including the NPV or debt service capacity ratio based on the underlying uncertainty
surrounding each of the key risk variables specified in Table 26. During the risk simulation
for this project, the following project indicators were monitored:
(i) RSQ’s financial NPV;
(ii) RSQ’s financial IRR;
(iii) RSQ’s ADSCR in 2009/10/11/12/13/14/15;
(iv) RSQ’s DSCR in 2008/9/10;
M e a n = 0 %
.0 0 0
2 .5 0 0
5 .0 0 0
7 .5 0 0
1 0 .0 0 0
- 5 % - 3 % 0 % 3 % 5 %
Cost Over-runs
5 5 .0 6 2 .5 7 0 .0 7 7 .5 8 5 .0
Traffic per Trminal
- 2 0 .0 0 % - 1 0 .0 0 % 0 .0 0 % 1 0 .0 0 % 2 0 .0 0 %
Terminals demanded
M e a n = - 7 .3 2 %
- 1 4 .6 4 % - 1 0 .9 8 % - 7 .3 2 % - 3 .6 6 % - 0 .0 0 %
Decrease in tariff

38
(v) Telecoms’ NPV;
(vi) Economic NPV;
(vii) PV of net externalities;
(viii) PV of impact on each stakeholder.
8.2 Interpretation of Results
A Monte-Carlo risk simulation was carried out over 10,000 trials with the help of Crystal
Ball™ software. The results suggest that there is some risk of substandard financial and
economic outcome of the project.
8.2.1 Project Financial Outcomes
The results of the risk analysis in Figure 1 show that the expected value of the project’s
financial NPV is US$ 61.9 million, which is somewhat lower than the computed
deterministic value of US$ 72.6 million. Figure 5 also presents the range of possible values
that the financial NPV can take and the likelihood of occurrence of these values. The
minimum gain realized from this project is US$ 25.3 million, or 6.9% of the investment value
of the project. The maximum gain is US$ 99.4 million, which is equivalent to 27.3% of the
investment value. There is a degree of variability in the project outcomes, and the standard
deviation is US$ 13.8 million. The cumulative probability of getting a negative NPV is nil.
The probability distribution of the financial internal rate of return indicates that its expected
value is 19.8% and cumulative probability of being below the 15% discount rate is 0.0%. At
the same time, the minimum value of the FIRR recorded during the risk simulation is 17.1%.
Figure 5: Results of Risk Analysis: Financial NPV of RSQ
The risk simulation tested the ability of the RSQ to service its debt timely. The figures
presented in Table 27 reveal that the expected value of the resulting outcomes are different
from the deterministic debt service ratios, as shown in the first row of Table 27. The standard
deviation indicates the dispersion of the results around their means. The minimum and
maximum values indicate the points of the lowest and highest outcomes that might be
achieved.
Frequency Chart
Certainty is 0.00% from 25.26 to 25.26 US$
Mean = 61.92
.000
.005
.011
.016
.022
0
54
108
162
216
25.26 43.79 62.32 80.84 99.37
9,882 Trials
Forecast: Financial NPV (RSQ)

39
Table 27: Probability Distribution of Debt Service Ratios
RSQ
NPV
(US$ m)
Annual Debt Service Coverage Ratio Debt Service Capacity Ratio
2009 2010 2011 2012 2013 2014 2009 2010 2011 2012
Deterministic Value 72.60 1.78 2.28 2.47 2.55 2.60 2.66 2.76 2.98 3.16 3.37
Rsik Statistics
Mean 61.92 1.63 2.13 2.39 2.55 2.70 2.85 2.72 2.99 3.26 3.55
Standard Deviation 13.77 0.19 0.25 0.29 0.29 0.31 0.31 0.13 0.17 0.24 0.29
Range Minimum 25.26 1.11 1.47 1.53 1.67 1.79 1.91 2.34 2.50 2.59 2.72
Range Maximum 99.37 2.13 2.79 3.58 3.87 4.20 4.35 3.08 3.46 4.45 4.97
Prob. Unacceptable 0% 0% 0% 0% 0.1% 0% 0.1% 0% 0% 0% 0%
The lenders should be aware of what is the cumulative likelihood of having a sub-standard
debt service ratio, when the cash flows of the project are not large enough to meet the
scheduled debt repayments. The last row of Table 27 shows the proportion of all simulation
outcomes that have a ratio of net cash flows to debt repayment being less than one. The terms
of the loan agreements should be designed so that a shortfall the castle in 2009 does not result
in financial crises for RSQ.
The value of the debt service capacity ratios indicates that the likelihood is low of having
insufficient cash flow to cover the debt service obligations when we consider the entire
period that the loans outstanding. These values of 2 or more imply that the amount of net
castle available for debt servicing is comfortably above the total amount required.
8.2.2 Impact on Telecom Operators
The risk analysis included the telecoms’ NPV as a performance indicator, and the expected
value of the telecoms financial NPV is US$ 89.7 million, which is somewhat closer to the
US$ 89.4 million in the financial analysis. Figure 6 displays the probability distribution of the
NPV of telecom operators. There is some variation in the outcomes, as the standard deviation
is equal to US$ 16.4 million. The minimum gain that telecom operators may get is US$ 41.6
million, which is equivalent to 29.9% of the incremental investment value for the
participating telecoms. At the same time, the maximum gain is US$ 132.9 million, equivalent
to 95.6% of the incremental investment value. There is zero probability of a negative NPV of
the telecom operators. This is a project from which African telecoms stand to gain, with
virtually no likelihood of loss.
Figure 6: Results of Risk Analysis: Financial NPV of Telecoms
Frequency Chart
US$
Mean = 89.70
.000
.006
.012
.018
.024
0
59.75
119.5
179.2
239
41.56 64.40 87.24 110.08 132.92
9,895 Trials
Forecast: Financial NPV (Telecoms)

40
8.2.3 Economic Outcomes
Figure 7 presents the distribution of the economic outcomes from the risk simulation. The
expected value of the economic NPV is US$ 2,204.8 million, which is close to the
deterministic value of US$ 2,385.2 million. The standard deviation of the economic NPV is
US$ 78.2 million. The minimum possible gain that the overall African economy stands to
experience because of this project is US$ 1,986.5 million in economic terms. On the other
hand, the maximum gain of US$ 2,416.9 million. The probability of the project having a
negative economic NPV is zero.
Figure 7: Results of Risk Analysis: Economic NPV
8.2.4 Stakeholders’ Impacts The risk analysis suggests that the net impact on the end users (rural and PSTN users) and
BLS subscribers is always a positive contribution. For the governments of participating
African states, the outcome is expected to be a net gain due to additional tax collection and
savings in foreign exchange premium. The expected value of that gain is US$ 20.8 million.
Table 28 presents the distribution of stakeholder outcomes from the risk simulation.
Table 28: Results of Risk Analysis: Allocation of Stakeholder Impact.
BLS
Subscribers
Rural
Users
PSTN
Users Governments
Deterministic Value 211.3 1,388.1 451.6 23.5
Risk Statistics
Mean 209.98 1,311.58 452.09 20.76
Standard Deviation 3.03 35.31 21.81 1.52
Range Minimum 201.66 1,218.66 391.38 16.51
Range Maximum 217.86 1,408.58 512.30 24.62
Prob < 0 0.0% 0.0% 0.0% 0.0%
The BLS subscribers, represented by large phone and data service providers, corporations and
TV broadcasters, should expect a net gain with a mean of US$ 210.0 million. This is the
amount of saving accrued to these customers due to switching from other satellite providers
to the RSQ. There is a little variation in these outcomes as the standard deviation stands at
US$ 3.0 million. The existing PSTN users, mostly located in the urban areas and places
covered by the existing net networks, should expect a net gain with a mean of US$ 452.1
million. This gain is subject to little variation, as the standard deviation is only US$ 21.8
million. The rural users stand to experience a substantial gain with the expected value of US$
Frequency Chart
US$
Mean = 2,204.75
.000
.006
.012
.018
.023
0
58
116
174
232
1,986.51 2,094.10 2,201.69 2,309.29 2,416.88
9,889 Trials
Forecast: Economic NPV

41
1,311.6 million. These benefits arise due to the reduction in the coping costs delivered by the
project and passed on to the final users by telecom operators. The standard deviation is US$
35.3 million, indicating that the rural users are assured of a certain gain from the project.
9. CONCLUSION
9.1 Findings
The integrated investment appraisal methodology has been used in the evaluation of this
project. The analysis has demonstrated how the appraisal of a project aimed at expanding and
reducing the cost of telecommunication can be conducted from different perspectives. The
role of this project is to expand and partially substitute some of the existing inter-African
connections that currently pass through foreign satellites at higher costs to African telecoms.
The financial and economic analyses have confirmed that the project is a viable and
sustainable investment for the African countries due to major savings in the transit costs for
telecoms and substantial benefit attributed to the end users. The expected financial NPV of
the project is US$ 61.9 million. The revenues for the project come from three sources: TES in
rural areas accounts for 52% of the total revenues, TRS for 19% and BLS for 29%. Given the
high demand for BLS capacity, the project is designed to allow for possible shift of the
satellite transponders from TES/TRS to highly demanded BLS, when needed. In regard to the
risk results for the equity holders, the simulation outcome suggests there is only a 0% of
cumulative probability for the owners of the RSQ of falling short of the targeted return of
15% real. While the results show that the returns are never negative, the minimum financial
internal rate of return is 17.1% real.
As the financial analysis suggests African telecoms should be interested in this project as the
expected financial NPV for the African telecoms is US$ 89.7 million. While the participation
in the project requires a telecom operator to subscribe to the RSQ and to install certain
ground hardware, the financial benefits from using the proposed project instead of other
satellite providers are substantial. The participating telecoms will not only recover their
incremental investment and operating costs, but also achieve a robust return on equity. The
project is a viable alternative that telecom operators are certain to realize a gain from this
project.
The results of the economic assessment of the proposed project confirm the expectations that
many African governments have vested on the Rascom initiative. The overall economic
impact of the project on Africa is expected to be US$ 2,204.8 million using an EOCK of 11%
real, The main economic benefits of the project come in the form of the incremental
consumer surplus for rural users who never had access to the existing telecommunication
services, and in the form of cost reduction for the end users and telecoms who had to use
foreign satellites for inter-continental and international connection without the project. The
risk analysis results show that if the project is able to succeed in financial terms, there is zero
probability of it having an economic loss. The participating African countries stand to gain
significantly from the proposed project.
In terms of stakeholder impacts, the main beneficiary group is the rural users who are not
currently covered by the PSTN or mobile networks. The gain to this group amounts to US$
1,311.6 million. The second beneficiary is the existing PSTN users mainly from urban
African areas, who stand to gain US$ 452.1 million. The BLS subscribers, represented
largely by TV and corporate institutions from Africa and outside will also gain an amount of

42
US$ 210.0 million due to reduction in the cost of bandwidth leasing. The governments of the
participating countries will have a gain of US$ 20.8 million due to the net change in the taxes
and foreign exchange flows. The risk results for the stakeholder benefit allocation suggest
that there is a low variation in the expected outcomes for the project stakeholders.
9.2 Risks and Mitigating Measures
It is expected that the RSQ in collaboration with Alcatel Space can control the technical and
implementation risks of this project using their experience in satellite manufacturing and
management of procurement and construction activities. However, the performance of the
project is dependent on the satellite’s operational availability in order to generate revenue and
cover its operational expenses and debt repayment obligations. The risk of satellite failure is
addressed with the launch insurance package. Also, the insurance covers the cost of a
replacement satellite in the case of a launch failure. The financial design and economic
concept of the proposed project are subject to a risk exposure because the possibility of a
satellite launch failure may make prospective telecoms subscribers hesitated to sign up for the
services prior to its launch.
The demand risk for currently non-existing TES services is addressed through the flexible
design of the satellite transponders which allows for dynamic reallocation of spare
transponder units from TES/TRS to highly demanded BLS transponders.
Another aspect of risk facing this project is the technological risk. The technology in satellite
industry is reaching a mature stage as there are so many satellites with different technological
configurations and capacities. The project’s strength lies in the new type of technology
allowing more sophisticated integrated communication services combined in one satellite.
The design of the satellite and ground facilities is such that it allows for upgrading of
software protocols used in transmission and also for expanding the transmission capacity by
increasing the density of the beam. Market risk associated with the demand for the TES
service is a major component of the overall risk associated with this project.
The risk of competition should also be put into perspective because the telecommunication
market in Africa is growing rapidly, which may attract me-to projects. As of now, there is no
single satellite in space that has a full coverage of the African continent. In the next few years
there is no plan for immediate satellite launch over Africa that could be a competitor to the
project. It is important to mention the presence of yet-to-be launched Nigerian satellite which
has no orbital spot in space at the moment. There is a high demand for transponder space in
Africa, which neither the RSQ nor the Nigerian satellite can fully supply. The current supply
of transponders for African users is about 300 units and they are fully allocated. The
incremental supply of 24 transponders by the RSQ is expected to be demanded for such
services in all circumstances.
This analysis should make the loan approval more comfortable for the AfDB. The proposed
project has no government guarantee, as it is a commercial-oriented operation with a sizeable
risk. The proposed financing structure of the RSQ ensures that the lenders have sufficient
cash available for debt service, but there is a moderate risk for the project owners to have a
return lower than expected. At the same time, this project is going to a have huge
development impact, specifically on the poor areas of the African continent. This is a case
when a commercial project provides the opportunity to significantly enhance the economic
well-being of the participating countries and their people.

43
BIBLIOGRAPHY AND REFERENCES
Balcombe, K.C. and Smith, L.E.D., (December 1999). “Redefining the Use of Monte-Carlo
Techniques for Risk Analysis in Project Appraisal”, Journal of Development Studies,
36(2).
Brigham, “Chapter 10: Risk Analysis and the Optimal Capital Budget”, Canadian Financial
Management, 3rd ed., Holt, Rinehart and Winston, Canada.
Cambridge Resources International, Inc. (2005). Integrated Investment Appraisal: Concepts
and Practice, Prepared for Department of Finance and Economic Development, Limpopo
Provincial Government, Republic of South Africa.
Decisioneering, Inc. (2005). (Crystal Ball® 2000: User Manual). Decisioneering, Inc.,
Denver, Colorado, USA.
Econstat. US Economic Data, Six months LIBOR (www.econstats.com)
Harberger, A.C., (1977). “Chapter 9: Marginal Cost Pricing and Social Investment Criteria
for Electricity Undertakings”, Project Evaluation: Collected Papers, University of
Chicago Press, IL, USA.
Harberger, A.C. and Jenkins, G.P. (2004). Cost-Benefit Analysis for Investment Decisions,
Kingston, Ontario, Queen’s University, Canada.
Harberger, A.C., Jenkins, G.P., Kuo, C.Y. and Mphahlele, M.B. (June 2003). “The Economic
Cost of Foreign Exchange for South Africa”, South African Journal of economics, South
Africa.
International Telecommunication Union. Progress towards Bridging the Digital Divide, ITU
Press Release (2005).
Kuo, C.Y., Jenkins, G.P., and Mphahlele, M.B. (September 2003). “The Economic
Opportunity Cost of Capital for South Africa”, South African Journal of Economics,
South Africa.
Rascom (2004). Information Memorandum, RSQ’s Business Plan, Toulouse, France.
Rascom (2003). Lenders Comments and Questions to the Preliminary Report from Analysis
Consulting Limited and L.S.E, Paris, France.
Rascom (2003). “RascomStar System Phase B Contract with Alcatel Issue No. 8” Toulouse,
France.
Rascom (2003) “In-orbit Contract with Alcatel Space for the Satellite Component”,
Toulouse, France.
Savvides, S., (March 1994). “Risk Analysis in Investment Appraisal”, Project Appraisal,
Volume 9, Number 1.
The IMF (2004). International Financial Statistics Yearbook 2004, The International
Monetary Fund, Washington, DC, USA.
Analysys Consulting Limited (June 2005). “Lenders’ Model, Description of Key
Assumptions and Variables”, London UK.
Vodaphone (2003) “Review of Price Elasticities of Demand for Fixed Line and Mobile
Telecommunication Services”.
Rascom (January 2003). Rascom Executive Agreement January 2003

44
APPENDIX A
SUBSCRIPTION OF TERMINALS BY TELECOM OPERATORS

45
APPENDIX A 1: OPTIMISTIC PROJECTION OF TERMINALS BASED ON EXPECTATIONS FROM TELECOMS
Projections for all countries 2007 2008 2009 2010 2011 2012 2013 2014 2015 2016 2017 2018 2019 2020 2021
Country name Operator Wave
Algeria 2 0 0 0 0 0 0 0 0 0 0 0 0 0 0 0
Angola Angola Telecom 1 400 1,000 1,469 1,587 1,704 1,782 1,782 1,782 1,782 1,782 1,782 1,782 1,782 1,782 1,782
Benin OPT 1 400 1,000 2,500 2,875 3,250 3,500 3,500 3,500 3,500 3,500 3,500 3,500 3,500 3,500 3,500
Botswana& Equatorial Guinea France Telecom 3 400 1,000 3,430 4,038 4,645 5,050 5,050 5,050 5,050 5,050 5,050 5,050 5,050 5,050 5,050
Burkina Faso Onatel 1 400 1,000 3,007 3,509 4,011 4,345 4,345 4,345 4,345 4,345 4,345 4,345 4,345 4,345 4,345
Burundi 3 0 0 0 0 0 0 0 0 0 0 0 0 0 0 0
Cameroon 3 100 250 700 813 925 1,000 1,000 1,000 1,000 1,000 1,000 1,000 1,000 1,000 1,000
Cape Verde 3 0 0 0 0 0 0 0 0 0 0 0 0 0 0 0
Central African Republic Socatel 2 200 500 2,000 2,375 2,750 3,000 3,000 3,000 3,000 3,000 3,000 3,000 3,000 3,000 3,000
Chad Sotel Tchad 3 100 250 700 813 925 1,000 1,000 1,000 1,000 1,000 1,000 1,000 1,000 1,000 1,000
Comoros 3 0 0 0 0 0 0 0 0 0 0 0 0 0 0 0
Congo, Dem. Rep. 2 1,600 4,000 10,600 12,250 13,900 15,000 15,000 15,000 15,000 15,000 15,000 15,000 15,000 15,000 15,000
Congo, Rep. Sotelco 2 600 1,500 3,600 4,125 4,650 5,000 5,000 5,000 5,000 5,000 5,000 5,000 5,000 5,000 5,000
Cote d'Ivoire 3 100 250 700 813 925 1,000 1,000 1,000 1,000 1,000 1,000 1,000 1,000 1,000 1,000
Djibouti 3 0 0 0 0 0 0 0 0 0 0 0 0 0 0 0
Egypt, Arab Rep. 3 0 0 0 0 0 0 0 0 0 0 0 0 0 0 0
Eritrea Eritel 3 160 400 760 850 940 1,000 1,000 1,000 1,000 1,000 1,000 1,000 1,000 1,000 1,000
Ethiopia ETC 3 100 250 700 813 925 1,000 1,000 1,000 1,000 1,000 1,000 1,000 1,000 1,000 1,000
Gabon Gabon Telekom 1 200 500 908 1,010 1,112 1,180 1,180 1,180 1,180 1,180 1,180 1,180 1,180 1,180 1,180
Gambia, The Gamtel 2 100 250 400 438 475 500 500 500 500 500 500 500 500 500 500
Ghana 3 100 250 400 438 475 500 500 500 500 500 500 500 500 500 500
Guinea Sotelgui 2 100 250 700 813 925 1,000 1,000 1,000 1,000 1,000 1,000 1,000 1,000 1,000 1,000
Guinea-Bissau 3 0 0 0 0 0 0 0 0 0 0 0 0 0 0 0
Kenya Telkom Kenya 2 600 1,500 4,500 5,250 6,000 6,500 6,500 6,500 6,500 6,500 6,500 6,500 6,500 6,500 6,500
Lesotho Econet 3 100 250 700 813 925 1,000 1,000 1,000 1,000 1,000 1,000 1,000 1,000 1,000 1,000
Liberia Investcom 3 100 250 700 813 925 1,000 1,000 1,000 1,000 1,000 1,000 1,000 1,000 1,000 1,000
Libya GPTC 2 400 1,000 2,800 3,250 3,700 4,000 4,000 4,000 4,000 4,000 4,000 4,000 4,000 4,000 4,000
Madagascar France Telecom 3 0 0 0 0 0 0 0 0 0 0 0 0 0 0 0
Malawi 3 100 250 700 813 925 1,000 1,000 1,000 1,000 1,000 1,000 1,000 1,000 1,000 1,000
Mali Sotelma 1 600 1,500 6,000 7,125 8,250 9,000 9,000 9,000 9,000 9,000 9,000 9,000 9,000 9,000 9,000
Mauritania Mauritel 3 100 250 700 813 925 1,000 1,000 1,000 1,000 1,000 1,000 1,000 1,000 1,000 1,000
Mauritius 3 0 0 0 0 0 0 0 0 0 0 0 0 0 0 0
MTN Uganda 3 0 0 0 0 0 0 0 0 0 0 0 0 0 0 0

46
Nigeria 3 0 0 0 0 0 0 0 0 0 0 0 0 0 0 0
Orange 3 0 0 0 0 0 0 0 0 0 0 0 0 0 0 0
Telkom 3 0 0 0 0 0 0 0 0 0 0 0 0 0 0 0
Mayotte 3 0 0 0 0 0 0 0 0 0 0 0 0 0 0 0
Morocco Maroc Telecom 3 100 250 1,930 2,350 2,770 3,050 3,050 3,050 3,050 3,050 3,050 3,050 3,050 3,050 3,050
Mozambique TDM 3 100 250 700 813 925 1,000 1,000 1,000 1,000 1,000 1,000 1,000 1,000 1,000 1,000
Namibia 3 100 250 700 813 925 1,000 1,000 1,000 1,000 1,000 1,000 1,000 1,000 1,000 1,000
Niger 2 100 250 700 813 925 1,000 1,000 1,000 1,000 1,000 1,000 1,000 1,000 1,000 1,000
Nigeria Nitel/Globacom 3 100 250 3,160 3,888 4,615 5,100 5,100 5,100 5,100 5,100 5,100 5,100 5,100 5,100 5,100
Econet 3 0 0 0 0 0 0 0 0 0 0 0 0 0 0 0
Investcom 3 0 0 0 0 0 0 0 0 0 0 0 0 0 0 0
Sentech 3 0 0 0 0 0 0 0 0 0 0 0 0 0 0 0
Celtel 3 0 0 0 0 0 0 0 0 0 0 0 0 0 0 0
Rwanda 3 0 0 0 0 0 0 0 0 0 0 0 0 0 0 0
Sao Tome and Principe 3 0 0 0 0 0 0 0 0 0 0 0 0 0 0 0
Senegal Sonatel 1 480 1,200 2,527 2,858 3,190 3,411 3,411 3,411 3,411 3,411 3,411 3,411 3,411 3,411 3,411
Seychelles 3 0 0 0 0 0 0 0 0 0 0 0 0 0 0 0
Sierra Leone 3 0 0 0 0 0 0 0 0 0 0 0 0 0 0 0
Somalia 3 0 0 0 0 0 0 0 0 0 0 0 0 0 0 0
South Africa e-school project 3 200 500 13,520 16,775 20,030 22,200 22,200 22,200 22,200 22,200 22,200 22,200 22,200 22,200 22,200
Globecast 3
Sudan Sudatel 2 400 1,000 3,007 3,509 4,011 4,345 4,345 4,345 4,345 4,345 4,345 4,345 4,345 4,345 4,345
Swaziland 3 0 0 0 0 0 0 0 0 0 0 0 0 0 0 0
Tanzania TTCL 2 500 1,250 2,000 2,188 2,375 2,500 2,500 2,500 2,500 2,500 2,500 2,500 2,500 2,500 2,500
Togo 3 100 250 700 813 925 1,000 1,000 1,000 1,000 1,000 1,000 1,000 1,000 1,000 1,000
Tunisia 3 0 0 0 0 0 0 0 0 0 0 0 0 0 0 0
Uunet 3 0 0 0 0 0 0 0 0 0 0 0 0 0 0 0
Vodacom 3 0 0 0 0 0 0 0 0 0 0 0 0 0 0 0
Uganda Uganda Telecom 1 240 600 2,271 2,689 3,107 3,385 3,385 3,385 3,385 3,385 3,385 3,385 3,385 3,385 3,385
Zambia Zamtel 3 100 250 700 813 925 1,000 1,000 1,000 1,000 1,000 1,000 1,000 1,000 1,000 1,000
Zimbabwe Zelone 1 560 1,400 3,080 3,500 3,920 4,200 4,200 4,200 4,200 4,200 4,200 4,200 4,200 4,200 4,200
Ikatel Ikatel 3
Ground Support facility 3
e-Post project 3
Non incumbent telcos 3
Other rural licences 3
Total 10,140 25,350 83,669 98,249 112,828 122,548 122,548 122,548 122,548 122,548 122,548 122,548 122,548 122,548 122,548

47
APPENDIX A 2: PESSIMISTIC PROJECTION OF TERMINALS BASED ON EXPRESSED INTEREST FROM TELECOMS
2007 2008 2009 2010 2011 2012 2013 2014 2015 2016 2017 2018 2019 2020 2021
Country Operator Wave
Algeria 2 Y 0 0 0 0 0 0 0 0 0 0 0 0 0 0 0
Angola Angola Telecom 1 Y 560 1,400 1,869 2,104 2,174 2,182 2,182 2,182 2,182 2,182 2,182 2,182 2,182 2,182 2,182
Benin OPT 1 Y 800 2,000 3,500 4,250 4,475 4,500 4,500 4,500 4,500 4,500 4,500 4,500 4,500 4,500 4,500
Botswana& Equatorial Guinea France Telecom 3 N 400 1,000 1,100 1,150 1,165 1,167 1,167 1,167 1,167 1,167 1,167 1,167 1,167 1,167 1,167
Burkina Faso Onatel 1 Y 560 1,400 3,407 4,411 4,712 4,745 4,745 4,745 4,745 4,745 4,745 4,745 4,745 4,745 4,745
Burundi 3 Y 0 0 293 439 483 488 488 488 488 488 488 488 488 488 488
Cameroon 3 Y 0 0 1,544 2,317 2,548 2,574 2,574 2,574 2,574 2,574 2,574 2,574 2,574 2,574 2,574
Cape Verde 3 N 0 0 106 158 174 176 176 176 176 176 176 176 176 176 176
Central African Republic Socatel 2 Y 120 300 351 377 384 385 385 385 385 385 385 385 385 385 385
Chad Sotel Tchad 3 Y 100 250 624 811 867 873 873 873 873 873 873 873 873 873 873
Comoros 3 N 0 0 74 111 122 123 123 123 123 123 123 123 123 123 123
Congo, Dem. Rep. 2 Y 800 2,000 3,131 3,697 3,866 3,885 3,885 3,885 3,885 3,885 3,885 3,885 3,885 3,885 3,885
Congo, Rep. Sotelco 2 Y 480 1,200 1,290 1,335 1,349 1,350 1,350 1,350 1,350 1,350 1,350 1,350 1,350 1,350 1,350
Cote d'Ivoire 3 Y 100 250 2,222 3,207 3,503 3,536 3,536 3,536 3,536 3,536 3,536 3,536 3,536 3,536 3,536
Djibouti 3 N 0 0 9 14 15 15 15 15 15 15 15 15 15 15 15
Egypt, Arab Rep. 3 N 0 0 16,804 25,205 27,726 28,006 28,006 28,006 28,006 28,006 28,006 28,006 28,006 28,006 28,006
Eritrea Eritel 3 Y 120 300 325 338 342 342 342 342 342 342 342 342 342 342 342
Ethiopia ETC 3 Y 100 250 2,876 4,188 4,582 4,626 4,626 4,626 4,626 4,626 4,626 4,626 4,626 4,626 4,626
Gabon Gabon Telekom 1 Y 400 1,000 1,408 1,612 1,673 1,680 1,680 1,680 1,680 1,680 1,680 1,680 1,680 1,680 1,680
Gambia, The Gamtel 2 Y 120 300 310 314 316 316 316 316 316 316 316 316 316 316 316
Ghana 3 Y 100 250 1,346 1,894 2,059 2,077 2,077 2,077 2,077 2,077 2,077 2,077 2,077 2,077 2,077
Guinea Sotelgui 2 Y 540 1,350 1,375 1,388 1,392 1,392 1,392 1,392 1,392 1,392 1,392 1,392 1,392 1,392 1,392
Guinea-Bissau 3 Y 0 0 49 73 80 81 81 81 81 81 81 81 81 81 81
Kenya Telkom Kenya 2 Y 1,200 3,000 4,379 5,069 5,276 5,299 5,299 5,299 5,299 5,299 5,299 5,299 5,299 5,299 5,299
Lesotho Econet 3 N 100 250 378 442 461 463 463 463 463 463 463 463 463 463 463
Liberia Investcom 3 N 28 70 86 93 96 96 96 96 96 96 96 96 96 96 96
Libya GPTC 2 Y 60 150 181 197 201 202 202 202 202 202 202 202 202 202 202
Madagascar France Telecom 3 N 0 0 1,375 2,063 2,269 2,292 2,292 2,292 2,292 2,292 2,292 2,292 2,292 2,292 2,292
Malawi 3 Y 100 250 643 840 898 905 905 905 905 905 905 905 905 905 905
Mali Sotelma 1 Y 1,200 3,000 6,900 8,850 9,435 9,500 9,500 9,500 9,500 9,500 9,500 9,500 9,500 9,500 9,500
Mauritania Mauritel 3 Y 60 150 161 166 168 168 168 168 168 168 168 168 168 168 168
Mauritius 3 Y 0 0 460 689 758 766 766 766 766 766 766 766 766 766 766
MTN Uganda 3 Y 0 0 1,230 1,845 2,030 2,050 2,050 2,050 2,050 2,050 2,050 2,050 2,050 2,050 2,050

48
Nigeria 3 Y 100 250 700 925 993 1,000 1,000 1,000 1,000 1,000 1,000 1,000 1,000 1,000 1,000
Orange 3 Y 0 0 0 0 0 0 0 0 0 0 0 0 0 0 0
Telkom 3 Y 0 0 0 0 0 0 0 0 0 0 0 0 0 0 0
Mayotte 3 N 0 0 0 0 0 0 0 0 0 0 0 0 0 0 0
Morocco Maroc Telecom 3 Y 100 250 4,948 7,297 8,002 8,080 8,080 8,080 8,080 8,080 8,080 8,080 8,080 8,080 8,080
Mozambique TDM 3 Y 100 250 1,092 1,513 1,639 1,653 1,653 1,653 1,653 1,653 1,653 1,653 1,653 1,653 1,653
Namibia 3 Y 100 250 524 660 701 706 706 706 706 706 706 706 706 706 706
Niger 2 Y 1,120 2,800 2,698 2,647 2,632 2,630 2,630 2,630 2,630 2,630 2,630 2,630 2,630 2,630 2,630
Nigeria Nitel/Globacom 3 Y 100 250 700 925 993 1,000 1,000 1,000 1,000 1,000 1,000 1,000 1,000 1,000 1,000
Econet 3 Y 0 0 1,230 1,845 2,030 2,050 2,050 2,050 2,050 2,050 2,050 2,050 2,050 2,050 2,050
Investcom 3 Y 0 0 1,230 1,845 2,030 2,050 2,050 2,050 2,050 2,050 2,050 2,050 2,050 2,050 2,050
Sentech 3 Y 0 0 0 0 0 0 0 0 0 0 0 0 0 0 0
Celtel 3 Y 0 0 0 0 0 0 0 0 0 0 0 0 0 0 0
Rwanda 3 N 0 0 481 721 793 801 801 801 801 801 801 801 801 801 801
Sao Tome and Principe 3 N 0 0 7 10 11 11 11 11 11 11 11 11 11 11 11
Senegal Sonatel 1 Y 760 1,900 2,177 2,315 2,356 2,361 2,361 2,361 2,361 2,361 2,361 2,361 2,361 2,361 2,361
Seychelles 3 N 0 0 50 76 83 84 84 84 84 84 84 84 84 84 84
Sierra Leone 3 N 0 0 131 197 217 219 219 219 219 219 219 219 219 219 219
Somalia 3 N 0 0 0 0 0 0 0 0 0 0 0 0 0 0 0
South Africa e-school project 3 N 0 0 7,277 10,915 12,007 12,128 12,128 12,128 12,128 12,128 12,128 12,128 12,128 12,128 12,128
Globecast 3 N 0 0 0 0 0 0 0 0 0 0 0 0 0 0 0
Sudan Sudatel 2 Y 720 1,800 3,694 4,641 4,925 4,957 4,957 4,957 4,957 4,957 4,957 4,957 4,957 4,957 4,957
Swaziland 3 N 0 0 387 581 639 645 645 645 645 645 645 645 645 645 645
Tanzania TTCL 2 Y 668 1,670 2,356 2,699 2,802 2,813 2,813 2,813 2,813 2,813 2,813 2,813 2,813 2,813 2,813
Togo 3 Y 100 250 338 381 395 396 396 396 396 396 396 396 396 396 396
Tunisia 3 N 0 0 1,933 2,899 3,189 3,221 3,221 3,221 3,221 3,221 3,221 3,221 3,221 3,221 3,221
Uunet 3 N 0 0 0 0 0 0 0 0 0 0 0 0 0 0 0
Vodacom 3 N 0 0 0 0 0 0 0 0 0 0 0 0 0 0 0
Uganda Uganda Telecom 1 Y 432 1,080 1,521 1,742 1,808 1,815 1,815 1,815 1,815 1,815 1,815 1,815 1,815 1,815 1,815
Zambia Zamtel 3 Y 100 250 853 1,155 1,245 1,255 1,255 1,255 1,255 1,255 1,255 1,255 1,255 1,255 1,255
Zimbabwe Zelone 1 Y 1,120 2,800 4,480 5,320 5,572 5,600 5,600 5,600 5,600 5,600 5,600 5,600 5,600 5,600 5,600
Ikatel Ikatel 3 Y 200 500 1,400 1,850 1,985 2,000 2,000 2,000 2,000 2,000 2,000 2,000 2,000 2,000 2,000
Ground Support facility 3 N 0 0 0 0 0 0 0 0 0 0 0 0 0 0 0
e-Post project 3 N 0 0 1,230 1,845 2,030 2,050 2,050 2,050 2,050 2,050 2,050 2,050 2,050 2,050 2,050
Non incumbent telcos 3 N 0 0 0 0 0 0 0 0 0 0 0 0 0 0 0
Other rural licences 3 N 0 0 0 0 0 0 0 0 0 0 0 0 0 0 0
Total 13,768 34,420 101,239 134,649 144,671 145,785 145,785 145,785 145,785 145,785 145,785 145,785 145,785 145,785 145,785

49
APPENDIX A 3: PESSIMISTIC PROJECTION OF TERMINALS BASED ON EXPRESSED INTEREST FROM SELECTED TELECOMS
Projections for selected countries 2007 2008 2009 2010 2011 2012 2013 2014 2015 2016 2017 2018 2019 2020 2021
Country Operator
Algeria 2 Y 0 0 0 0 0 0 0 0 0 0 0 0 0 0 0
Angola Angola Telecom 1 Y 560 1,400 1,869 2,104 2,174 2,182 2,182 2,182 2,182 2,182 2,182 2,182 2,182 2,182 2,182
Benin OPT 1 Y 800 2,000 3,500 4,250 4,475 4,500 4,500 4,500 4,500 4,500 4,500 4,500 4,500 4,500 4,500
Botswana& Equatorial Guinea France Telecom 3 N 0 0 0 0 0 0 0 0 0 0 0 0 0 0 0
Burkina Faso Onatel 1 Y 560 1,400 3,407 4,411 4,712 4,745 4,745 4,745 4,745 4,745 4,745 4,745 4,745 4,745 4,745
Burundi 3 Y 0 0 293 439 483 488 488 488 488 488 488 488 488 488 488
Cameroon 3 Y 0 0 1,544 2,317 2,548 2,574 2,574 2,574 2,574 2,574 2,574 2,574 2,574 2,574 2,574
Cape Verde 3 N 0 0 0 0 0 0 0 0 0 0 0 0 0 0 0
Central African Republic Socatel 2 Y 120 300 351 377 384 385 385 385 385 385 385 385 385 385 385
Chad Sotel Tchad 3 Y 100 250 624 811 867 873 873 873 873 873 873 873 873 873 873
Comoros 3 N 0 0 0 0 0 0 0 0 0 0 0 0 0 0 0
Congo, Dem. Rep. 2 Y 800 2,000 3,131 3,697 3,866 3,885 3,885 3,885 3,885 3,885 3,885 3,885 3,885 3,885 3,885
Congo, Rep. Sotelco 2 Y 480 1,200 1,290 1,335 1,349 1,350 1,350 1,350 1,350 1,350 1,350 1,350 1,350 1,350 1,350
Cote d'Ivoire 3 Y 100 250 2,222 3,207 3,503 3,536 3,536 3,536 3,536 3,536 3,536 3,536 3,536 3,536 3,536
Djibouti 3 N 0 0 0 0 0 0 0 0 0 0 0 0 0 0 0
Egypt, Arab Rep. 3 N 0 0 0 0 0 0 0 0 0 0 0 0 0 0 0
Eritrea Eritel 3 Y 120 300 325 338 342 342 342 342 342 342 342 342 342 342 342
Ethiopia ETC 3 Y 100 250 2,876 4,188 4,582 4,626 4,626 4,626 4,626 4,626 4,626 4,626 4,626 4,626 4,626
Gabon Gabon Telekom 1 Y 400 1,000 1,408 1,612 1,673 1,680 1,680 1,680 1,680 1,680 1,680 1,680 1,680 1,680 1,680
Gambia, The Gamtel 2 Y 120 300 310 314 316 316 316 316 316 316 316 316 316 316 316
Ghana 3 Y 100 250 1,346 1,894 2,059 2,077 2,077 2,077 2,077 2,077 2,077 2,077 2,077 2,077 2,077
Guinea Sotelgui 2 Y 540 1,350 1,375 1,388 1,392 1,392 1,392 1,392 1,392 1,392 1,392 1,392 1,392 1,392 1,392
Guinea-Bissau 3 Y 0 0 49 73 80 81 81 81 81 81 81 81 81 81 81
Kenya Telkom Kenya 2 Y 1,200 3,000 4,379 5,069 5,276 5,299 5,299 5,299 5,299 5,299 5,299 5,299 5,299 5,299 5,299
Lesotho Econet 3 N 0 0 0 0 0 0 0 0 0 0 0 0 0 0 0
Liberia Investcom 3 N 0 0 0 0 0 0 0 0 0 0 0 0 0 0 0
Libya GPTC 2 Y 60 150 181 197 201 202 202 202 202 202 202 202 202 202 202
Madagascar France Telecom 3 N 0 0 0 0 0 0 0 0 0 0 0 0 0 0 0
Malawi 3 Y 100 250 643 840 898 905 905 905 905 905 905 905 905 905 905
Mali Sotelma 1 Y 1,200 3,000 6,900 8,850 9,435 9,500 9,500 9,500 9,500 9,500 9,500 9,500 9,500 9,500 9,500
Mauritania Mauritel 3 Y 60 150 161 166 168 168 168 168 168 168 168 168 168 168 168
Mauritius 3 Y 0 0 460 689 758 766 766 766 766 766 766 766 766 766 766
MTN Uganda 3 Y 0 0 1,230 1,845 2,030 2,050 2,050 2,050 2,050 2,050 2,050 2,050 2,050 2,050 2,050

50
Nigeria 3 Y 100 250 700 925 993 1,000 1,000 1,000 1,000 1,000 1,000 1,000 1,000 1,000 1,000
Orange 3 Y 0 0 0 0 0 0 0 0 0 0 0 0 0 0 0
Telkom 3 Y 0 0 0 0 0 0 0 0 0 0 0 0 0 0 0
Mayotte 3 N 0 0 0 0 0 0 0 0 0 0 0 0 0 0 0
Morocco Maroc Telecom 3 Y 100 250 4,948 7,297 8,002 8,080 8,080 8,080 8,080 8,080 8,080 8,080 8,080 8,080 8,080
Mozambique TDM 3 Y 100 250 1,092 1,513 1,639 1,653 1,653 1,653 1,653 1,653 1,653 1,653 1,653 1,653 1,653
Namibia 3 Y 100 250 524 660 701 706 706 706 706 706 706 706 706 706 706
Niger 2 Y 1,120 2,800 2,698 2,647 2,632 2,630 2,630 2,630 2,630 2,630 2,630 2,630 2,630 2,630 2,630
Nigeria Nitel/Globacom 3 Y 100 250 700 925 993 1,000 1,000 1,000 1,000 1,000 1,000 1,000 1,000 1,000 1,000
Econet 3 Y 0 0 1,230 1,845 2,030 2,050 2,050 2,050 2,050 2,050 2,050 2,050 2,050 2,050 2,050
Investcom 3 Y 0 0 1,230 1,845 2,030 2,050 2,050 2,050 2,050 2,050 2,050 2,050 2,050 2,050 2,050
Sentech 3 Y 0 0 0 0 0 0 0 0 0 0 0 0 0 0 0
Celtel 3 Y 0 0 0 0 0 0 0 0 0 0 0 0 0 0 0
Rwanda 3 N 0 0 0 0 0 0 0 0 0 0 0 0 0 0 0
Sao Tome and Principe 3 N 0 0 0 0 0 0 0 0 0 0 0 0 0 0 0
Senegal Sonatel 1 Y 760 1,900 2,177 2,315 2,356 2,361 2,361 2,361 2,361 2,361 2,361 2,361 2,361 2,361 2,361
Seychelles 3 N 0 0 0 0 0 0 0 0 0 0 0 0 0 0 0
Sierra Leone 3 N 0 0 0 0 0 0 0 0 0 0 0 0 0 0 0
Somalia 3 N 0 0 0 0 0 0 0 0 0 0 0 0 0 0 0
South Africa e-school project 3 N 0 0 0 0 0 0 0 0 0 0 0 0 0 0 0
Globecast 3 N 0 0 0 0 0 0 0 0 0 0 0 0 0 0 0
Sudan Sudatel 2 Y 720 1,800 3,694 4,641 4,925 4,957 4,957 4,957 4,957 4,957 4,957 4,957 4,957 4,957 4,957
Swaziland 3 N 0 0 0 0 0 0 0 0 0 0 0 0 0 0 0
Tanzania TTCL 2 Y 668 1,670 2,356 2,699 2,802 2,813 2,813 2,813 2,813 2,813 2,813 2,813 2,813 2,813 2,813
Togo 3 Y 100 250 338 381 395 396 396 396 396 396 396 396 396 396 396
Tunisia 3 N 0 0 0 0 0 0 0 0 0 0 0 0 0 0 0
Uunet 3 N 0 0 0 0 0 0 0 0 0 0 0 0 0 0 0
Vodacom 3 N 0 0 0 0 0 0 0 0 0 0 0 0 0 0 0
Uganda Uganda Telecom 1 Y 432 1,080 1,521 1,742 1,808 1,815 1,815 1,815 1,815 1,815 1,815 1,815 1,815 1,815 1,815
Zambia Zamtel 3 Y 100 250 853 1,155 1,245 1,255 1,255 1,255 1,255 1,255 1,255 1,255 1,255 1,255 1,255
Zimbabwe Zelone 1 Y 1,120 2,800 4,480 5,320 5,572 5,600 5,600 5,600 5,600 5,600 5,600 5,600 5,600 5,600 5,600
Ikatel Ikatel 3 Y 200 500 1,400 1,850 1,985 2,000 2,000 2,000 2,000 2,000 2,000 2,000 2,000 2,000 2,000
Ground Support facility 3 N 0 0 0 0 0 0 0 0 0 0 0 0 0 0 0
e-Post project 3 N 0 0 0 0 0 0 0 0 0 0 0 0 0 0 0
Non incumbent telcos 3 N 0 0 0 0 0 0 0 0 0 0 0 0 0 0 0
Other rural licences 3 N 0 0 0 0 0 0 0 0 0 0 0 0 0 0 0
Total 13,240 33,100 69,813 88,169 93,676 94,288 94,288 94,288 94,288 94,288 94,288 94,288 94,288 94,288 94,288