Embed Size (px)
Citation preview
8/3/2019 Integrated Approach for Predicting Final Performance by Connecting Multiple Micro-models
http://slidepdf.com/reader/full/integrated-approach-for-predicting-final-performance-by-connecting-multiple 1/10
Integrated approach for
predicting final performance by
connecting multiple micro-
models Sivanantham [email protected]
Sonata Software Limited,www.sonata-software.com1/ 4, APS Trust Building, Bull Temple Road, N.R.Colony, Bangalore - 19
Presented at 2nd InternationalColloquium on High Maturity Best
Practices (HMBP 2011)
26-Aug-2011
8/3/2019 Integrated Approach for Predicting Final Performance by Connecting Multiple Micro-models
http://slidepdf.com/reader/full/integrated-approach-for-predicting-final-performance-by-connecting-multiple 2/10
INTEGRATED APPROACH FOR PREDICTING FINAL PERFORMANCE BY
CONNECTING MULTIPLE MICRO-MODELS
2 of 10
Sonata Software Limited HMBP 2011 August 26, 2011
1. Abstract
In dedicated Offshore Development centre, the number of defects likely to be
uncovered during System Acceptance Test Phase and the amount of effort
required for fixing these defects is one of the top considerations for planning and
monitoring. The Project Manager is interested in progressively predicting these
final performance measures based on what performance is achieved after
completion of each phase so that necessary course corrections can be done to
ensure that the project is on track to meet the end objectives.
Based on the analysis of historical data, an integrated model was developed with
each micro-model predicting the outcome of one sub-process/activity which will
feed in as an input for predicting the outcome of the next sub-process/activity
and eventually predicting the final performance i.e. System Acceptance Test
Defect Density and the support effort. This helps the project manager in deciding
the number of resources and effort to be allocated for bug fixing so that rest of
resources can be used for Feature Development work.
Extensive use of these prediction models by the practitioners in delivery team has
demonstrated the predictability of project performance and met the high maturity
requirements, leading to Sonata Software achieving SEI CMMI v1.2 Level 5.
2. Problem Statement
“Prediction is very difficult, especially if it's about the future.” - Niels Bohr
The top challenge for any software project is the ability to set the right
commitments towards budget, schedule and quality and successfully meet the
same. Setting of SMART project objectives; tracking relevant metrics to see the
project’s progress; predicting overall project performance and taking corrective
actions become easier said than done. The difficulty in making the realistic
commitments during the preliminary stages of the project arises as many inputs
are not known and clear at the beginning of the project where as final
performance will depend on the decisions taken and the actual performance
observed in each of the sub-processes.
Absence of effective decision support tool which can help in adaptive decision
making based on the contextual performance observed in a particular phase of
the project could be risky. The project should be able to predict what will happen
in the next phase based on previous phase performance and decide the
appropriate corrective actions for the subsequent phase in-order to have
adequate confidence in meeting the project objectives eventually.
3. Solution Approach
Every problem has in it the seeds of its own solution. If you don't have any
problems, you don't get any seeds. - Norman Vincent Peale
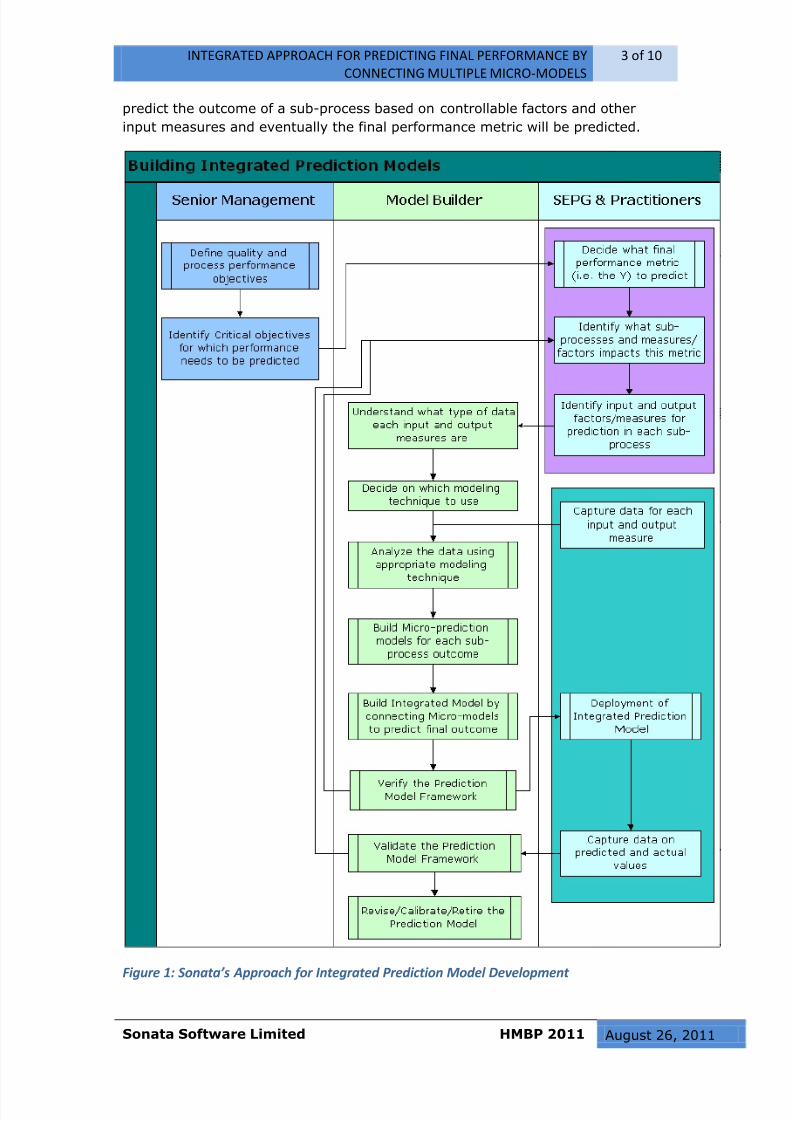
An approach was devised to build integrated prediction model by developing
connected micro models as shown in Figure 1 below. Each micro model will
8/3/2019 Integrated Approach for Predicting Final Performance by Connecting Multiple Micro-models
http://slidepdf.com/reader/full/integrated-approach-for-predicting-final-performance-by-connecting-multiple 3/10
INTEGRATED APPROACH FOR PREDICTING FINAL PERFORMANCE BY
CONNECTING MULTIPLE MICRO-MODELS
3 of 10
Sonata Software Limited HMBP 2011 August 26, 2011
predict the outcome of a sub-process based on controllable factors and other
input measures and eventually the final performance metric will be predicted.
Figure 1: Sonata’s Approach for Integrated Prediction Model Development
8/3/2019 Integrated Approach for Predicting Final Performance by Connecting Multiple Micro-models
http://slidepdf.com/reader/full/integrated-approach-for-predicting-final-performance-by-connecting-multiple 4/10
INTEGRATED APPROACH FOR PREDICTING FINAL PERFORMANCE BY
CONNECTING MULTIPLE MICRO-MODELS
4 of 10
Sonata Software Limited HMBP 2011 August 26, 2011
4. How the integrated prediction model was developed
If you find a good solution and become attached to it, the solution may become
your next problem. - Robert Anthony Based on the data type and available data from Process Performance Baseline, itwas decided to use the appropriate modelling techniques for building each Micro
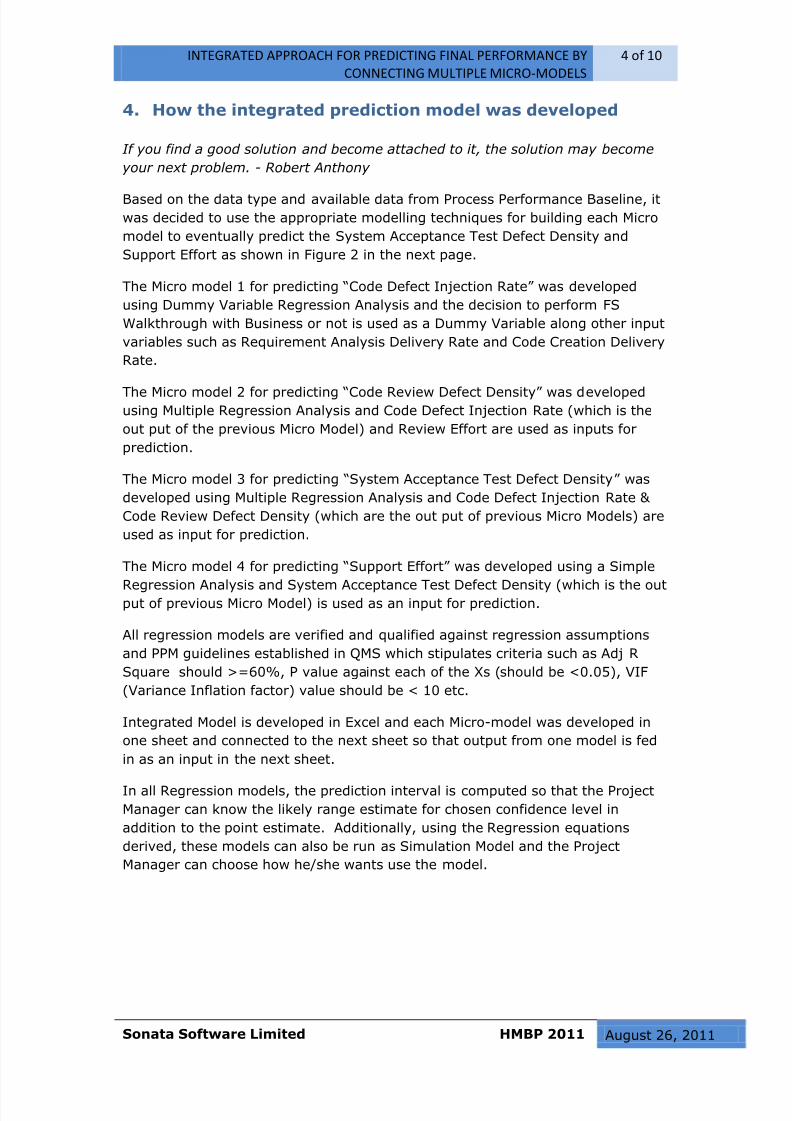
model to eventually predict the System Acceptance Test Defect Density and
Support Effort as shown in Figure 2 in the next page.
The Micro model 1 for predicting “Code Defect Injection Rate” was developed
using Dummy Variable Regression Analysis and the decision to perform FS
Walkthrough with Business or not is used as a Dummy Variable along other input
variables such as Requirement Analysis Delivery Rate and Code Creation Delivery
Rate.
The Micro model 2 for predicting “Code Review Defect Density” was developedusing Multiple Regression Analysis and Code Defect Injection Rate (which is the
out put of the previous Micro Model) and Review Effort are used as inputs for
prediction.
The Micro model 3 for predicting “System Acceptance Test Defect Density” was
developed using Multiple Regression Analysis and Code Defect Injection Rate &
Code Review Defect Density (which are the out put of previous Micro Models) are
used as input for prediction.
The Micro model 4 for predicting “Support Effort” was developed using a Simple
Regression Analysis and System Acceptance Test Defect Density (which is the output of previous Micro Model) is used as an input for prediction.
All regression models are verified and qualified against regression assumptions
and PPM guidelines established in QMS which stipulates criteria such as Adj R
Square should >=60%, P value against each of the Xs (should be <0.05), VIF
(Variance Inflation factor) value should be < 10 etc.
Integrated Model is developed in Excel and each Micro-model was developed in
one sheet and connected to the next sheet so that output from one model is fed
in as an input in the next sheet.
In all Regression models, the prediction interval is computed so that the Project
Manager can know the likely range estimate for chosen confidence level in
addition to the point estimate. Additionally, using the Regression equations
derived, these models can also be run as Simulation Model and the Project
Manager can choose how he/she wants use the model.
8/3/2019 Integrated Approach for Predicting Final Performance by Connecting Multiple Micro-models
http://slidepdf.com/reader/full/integrated-approach-for-predicting-final-performance-by-connecting-multiple 5/10
INTEGRATED APPROACH FOR PREDICTING FINAL PERFORMANCE BY
CONNECTING MULTIPLE MICRO-MODELS
5 of 10
Sonata Software Limited HMBP 2011 August 26, 2011
Figure 2: Conceptual View of Integrated Prediction Model
5. Using integrated model for prediction for feature release
Economists give their predictions to a digit after the decimal point to show that
they have a sense of humour” –Unknown
The integrated model is used in a particular enhancement release with a size of
100 FP for predicting the quality of delivery and support effort needed during
System Acceptance Testing and the same is illustrated below. Prediction was
made during planning stage.
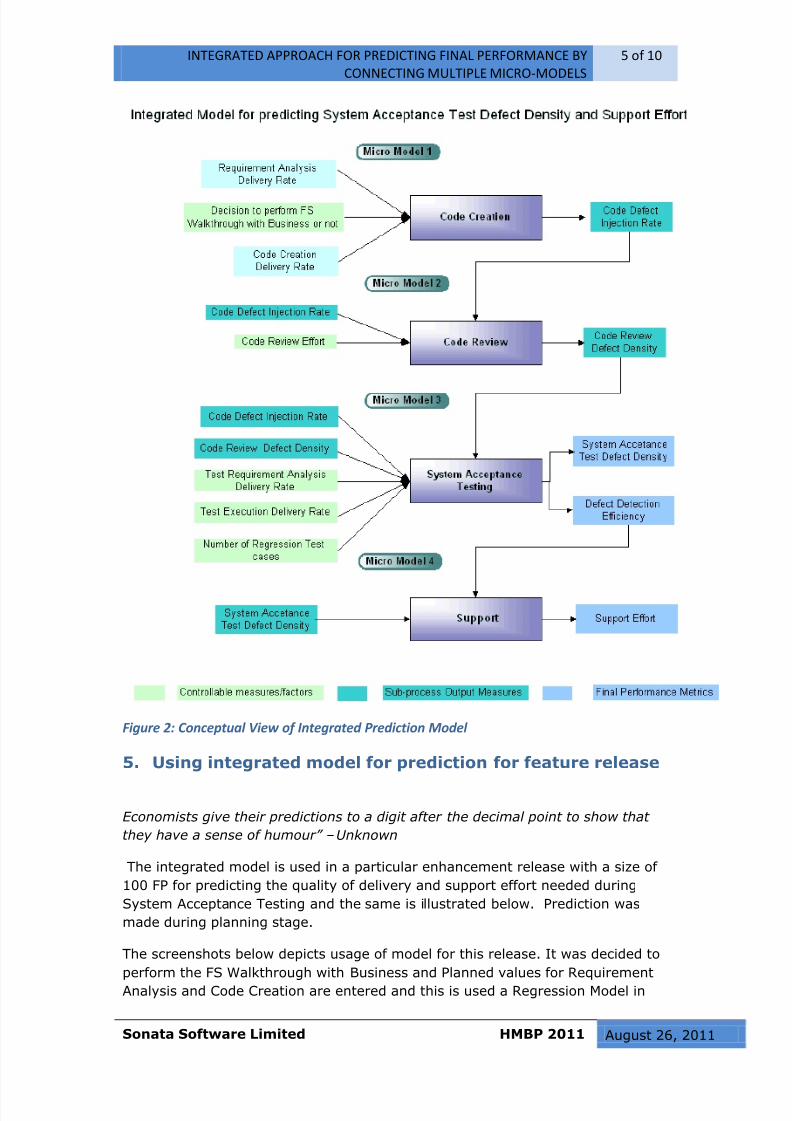
The screenshots below depicts usage of model for this release. It was decided to
perform the FS Walkthrough with Business and Planned values for Requirement
Analysis and Code Creation are entered and this is used a Regression Model in
8/3/2019 Integrated Approach for Predicting Final Performance by Connecting Multiple Micro-models
http://slidepdf.com/reader/full/integrated-approach-for-predicting-final-performance-by-connecting-multiple 6/10
INTEGRATED APPROACH FOR PREDICTING FINAL PERFORMANCE BY
CONNECTING MULTIPLE MICRO-MODELS
6 of 10
Sonata Software Limited HMBP 2011 August 26, 2011
this scenario. Alternatively, the Project Manager could use the Basis prediction as
“PPB Values” and run as a Simulation Model if required.
Inputs to the Prediction Model (Code Injection Rate & Code Review Defect
Density)
Inputs
Value Unit of Measure
Size 100 FPFunctional SpecificationWalkthrough with Business Yes Binary ValueBasis for Coding Injected DefectsPrediction
Coding Effort-Entered Value
Basis for Coding DetectedDefects Prediction
Entered Values
Requirements Analysis DeliveryRate Distribution
0
Person-day/FP
Planned or Actual Effort forRequirements Analysis 15 Person-daysCoding Delivery Rate Distribution
0.67 Person-day/FPPlanned or Actual Effort forCoding 45 Person-daysCoding Defect Injection RateDistribution
0.31
DefectsCode Review Delivery RateDistribution 0.07 Person-day/FPPlanned or Actual Effort for CodeReview 3 Person-days
Confidence Level 95 %Phase at which prediction isdone Planning
Outputs from the Prediction Model (Code Injection Rate & Code Review Defect
Density)
Output
Coding Injected Defects Coding Defect InjectionRate
Value Unit of Measure Value Unit of Measure
Predicted Value 40 Number of Defects 0.40 Defects/FPUpper PredictionLimit
56 Number of Defects 0.56 Defects/FP
Lower PredictionLimit
24 Number of Defects 0.24 Defects/FP
Coding Detected Defects Coding Defect Density
Value Unit of Measure Value Unit of Measure
Predicted Value 25 Number of Defects 0.25 Defects/FP
Upper Prediction
Limit
92 Number of Defects 0.92 Defects/FP
Lower PredictionLimit
NotApplicable
Number of Defects NotApplicable
Defects/FP
8/3/2019 Integrated Approach for Predicting Final Performance by Connecting Multiple Micro-models
http://slidepdf.com/reader/full/integrated-approach-for-predicting-final-performance-by-connecting-multiple 7/10
INTEGRATED APPROACH FOR PREDICTING FINAL PERFORMANCE BY
CONNECTING MULTIPLE MICRO-MODELS
7 of 10
Sonata Software Limited HMBP 2011 August 26, 2011
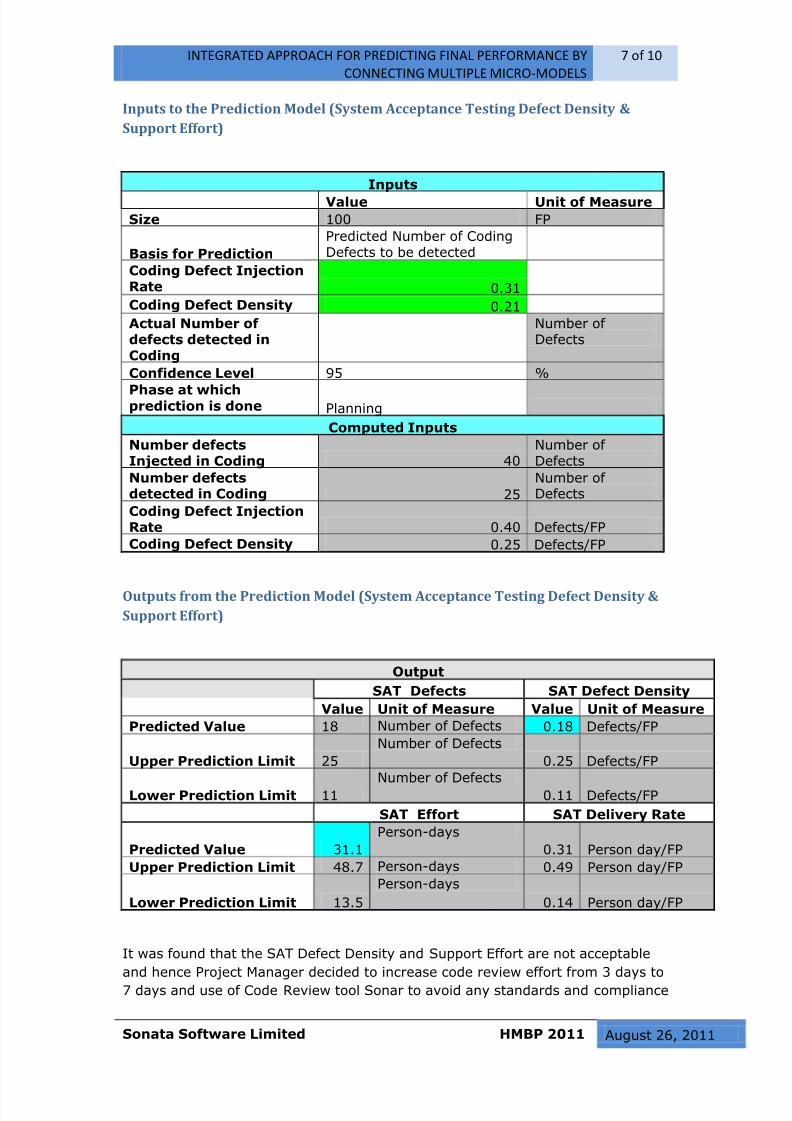
Inputs to the Prediction Model (System Acceptance Testing Defect Density &
Support Effort)
Inputs
Value Unit of Measure
Size 100 FP
Basis for Prediction
Predicted Number of CodingDefects to be detected
Coding Defect InjectionRate 0.31
Coding Defect Density 0.21
Actual Number of defects detected inCoding
Number of Defects
Confidence Level 95 %
Phase at whichprediction is done Planning
Computed Inputs
Number defectsInjected in Coding 40
Number of Defects
Number defectsdetected in Coding 25
Number of Defects
Coding Defect InjectionRate 0.40 Defects/FP
Coding Defect Density 0.25 Defects/FP
Outputs from the Prediction Model (System Acceptance Testing Defect Density &
Support Effort)
Output
SAT Defects SAT Defect Density
Value Unit of Measure Value Unit of Measure
Predicted Value 18 Number of Defects 0.18 Defects/FP
Upper Prediction Limit 25
Number of Defects
0.25 Defects/FP
Lower Prediction Limit 11
Number of Defects
0.11 Defects/FP
SAT Effort SAT Delivery Rate
Predicted Value 31.1
Person-days
0.31 Person day/FP
Upper Prediction Limit 48.7 Person-days 0.49 Person day/FP
Lower Prediction Limit 13.5
Person-days
0.14 Person day/FP
It was found that the SAT Defect Density and Support Effort are not acceptable
and hence Project Manager decided to increase code review effort from 3 days to
7 days and use of Code Review tool Sonar to avoid any standards and compliance
8/3/2019 Integrated Approach for Predicting Final Performance by Connecting Multiple Micro-models
http://slidepdf.com/reader/full/integrated-approach-for-predicting-final-performance-by-connecting-multiple 8/10
INTEGRATED APPROACH FOR PREDICTING FINAL PERFORMANCE BY
CONNECTING MULTIPLE MICRO-MODELS
8 of 10
Sonata Software Limited HMBP 2011 August 26, 2011
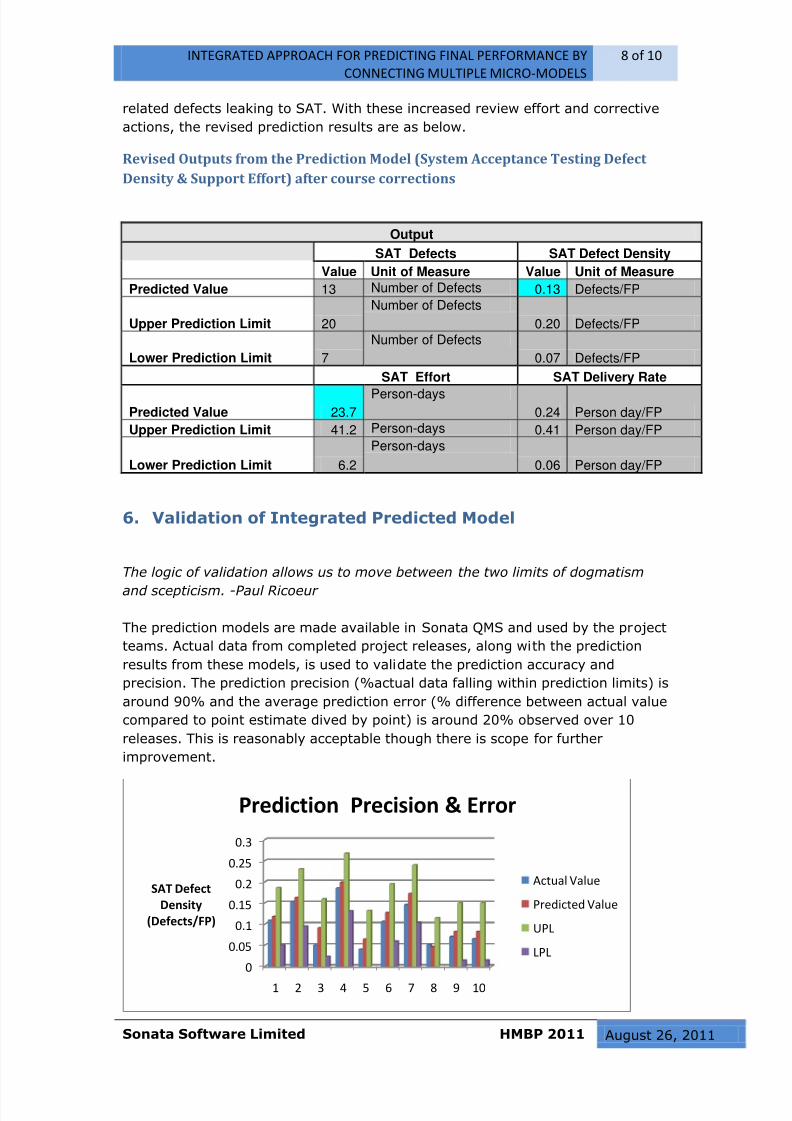
related defects leaking to SAT. With these increased review effort and corrective
actions, the revised prediction results are as below.
Revised Outputs from the Prediction Model (System Acceptance Testing Defect
Density & Support Effort) after course corrections
Output
SAT Defects SAT Defect Density
Value Unit of Measure Value Unit of Measure
Predicted Value 13 Number of Defects 0.13 Defects/FP
Upper Prediction Limit 20
Number of Defects
0.20 Defects/FP
Lower Prediction Limit 7
Number of Defects
0.07 Defects/FP
SAT Effort SAT Delivery Rate
Predicted Value 23.7Person-days
0.24 Person day/FP
Upper Prediction Limit 41.2 Person-days 0.41 Person day/FP
Lower Prediction Limit 6.2
Person-days
0.06 Person day/FP
6. Validation of Integrated Predicted Model
The logic of validation allows us to move between the two limits of dogmatism
and scepticism. -Paul Ricoeur
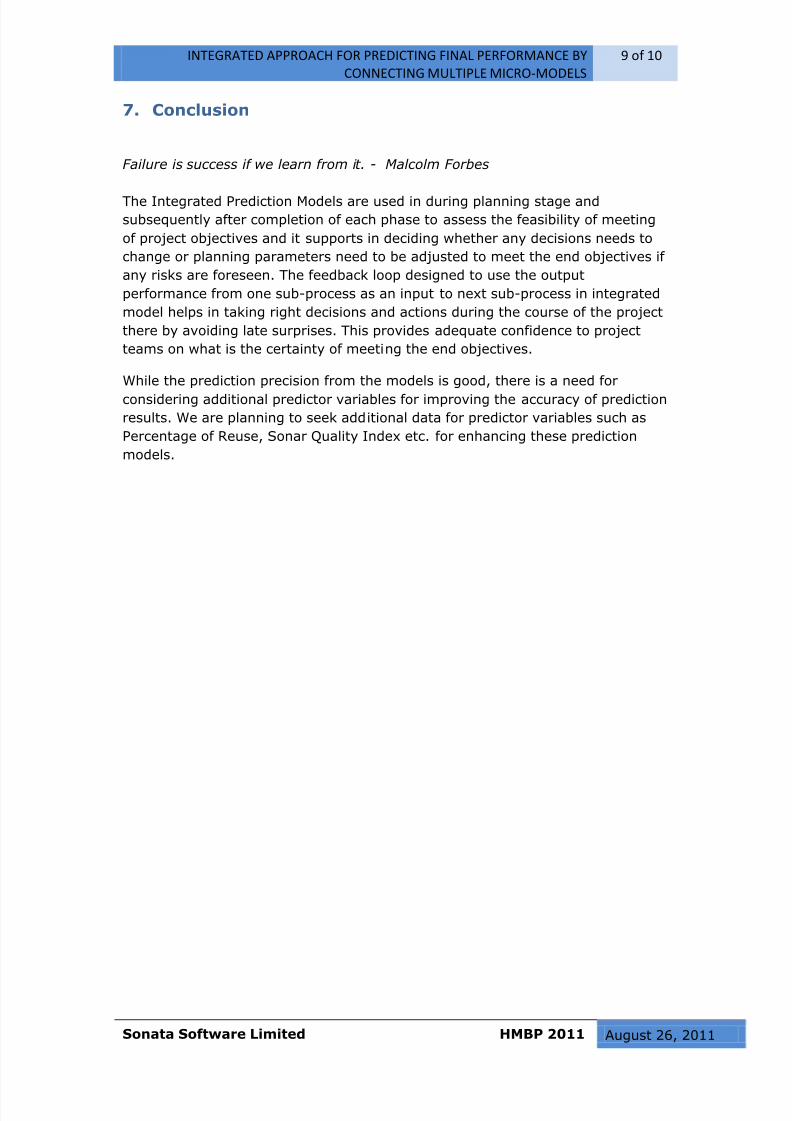
The prediction models are made available in Sonata QMS and used by the project
teams. Actual data from completed project releases, along with the prediction
results from these models, is used to validate the prediction accuracy and
precision. The prediction precision (%actual data falling within prediction limits) is
around 90% and the average prediction error (% difference between actual value
compared to point estimate dived by point) is around 20% observed over 10
releases. This is reasonably acceptable though there is scope for further
improvement.
0
0.05
0.1
0.15
0.2
0.25
0.3
1 2 3 4 5 6 7 8 9 10
SAT Defect
Density
(Defects/FP)
Prediction Precision & Error
Actual Value
Predicted Value
UPL
LPL
8/3/2019 Integrated Approach for Predicting Final Performance by Connecting Multiple Micro-models
http://slidepdf.com/reader/full/integrated-approach-for-predicting-final-performance-by-connecting-multiple 9/10
INTEGRATED APPROACH FOR PREDICTING FINAL PERFORMANCE BY
CONNECTING MULTIPLE MICRO-MODELS
9 of 10
Sonata Software Limited HMBP 2011 August 26, 2011
7. Conclusion
Failure is success if we learn from it. - Malcolm Forbes
The Integrated Prediction Models are used in during planning stage and
subsequently after completion of each phase to assess the feasibility of meeting
of project objectives and it supports in deciding whether any decisions needs to
change or planning parameters need to be adjusted to meet the end objectives if
any risks are foreseen. The feedback loop designed to use the output
performance from one sub-process as an input to next sub-process in integrated
model helps in taking right decisions and actions during the course of the project
there by avoiding late surprises. This provides adequate confidence to project
teams on what is the certainty of meeting the end objectives.
While the prediction precision from the models is good, there is a need for
considering additional predictor variables for improving the accuracy of prediction
results. We are planning to seek additional data for predictor variables such as
Percentage of Reuse, Sonar Quality Index etc. for enhancing these prediction
models.
8/3/2019 Integrated Approach for Predicting Final Performance by Connecting Multiple Micro-models
http://slidepdf.com/reader/full/integrated-approach-for-predicting-final-performance-by-connecting-multiple 10/10
INTEGRATED APPROACH FOR PREDICTING FINAL PERFORMANCE BY
CONNECTING MULTIPLE MICRO-MODELS
10 of 10
Sonata Software Limited HMBP 2011 August 26, 2011
References
“A Tutorial for Building CMMI Process Performance Models” by Robert Stoddard
and Dave Zubrow, April 26, 2010,
Approaches to Process Performance Modelling: A Summary from the SEI Series of
Workshops on CMMI High Maturity Measurement and Analysis, Robert W.
Stoddard, II and Dennis R. Goldenson, January 2010 - TECHNICAL REPORT
CMU/SEI-2009-TR-021
Use and Organizational Impact of Process Performance Modelling in CMMI High
Maturity Organizations, Dennis R. Goldenson James McCurley and Robert W.
Stoddard, II
“A Practitioner View of CMMI Process Performance Models” by Robert Stoddard
and Rusty Young, March 20, 2008
Guideline for Process Performance Models, Sonata QMS
Author’s Biography
Sivanantham M works as a Senior Manager- Quality at Sonata Software Ltd and
leads the delivery excellence program for Microsoft Delivery Unit. In Sonata’s
journey towards CMMI v1.2 Level 5, he played a key role in establishing high
maturity foundation for the company and making the practitioners understand the
nuances involved in implementing Sub-process Control, Prediction Models and
Innovation Initiatives through mentoring and internal assessments. He has more
than 15 years of experience covering various areas such as Establishing
Management Systems, Process Engineering, Quality consulting & training, Process
automation, Metrics based improvements, Audits and Assessments, Project
Management and Business Development. He holds an M.Tech. in Quality,
Reliability and Operations Research from Indian Statistical Institute, Kolkata and
Bachelors degree in Mechanical Engineering from Madurai Kamaraj University.
Acronyms and abbreviations
CMMI – Capability Maturity Model Integration
FS – Functional Specification
SAT – System Acceptance Test
LPL – Lower Prediction Limit
UPL – Upper Prediction Limit