Embed Size (px)
Citation preview
Indian Journal of Geo Marine Sciences
Vol. 49 (4), April 2020, pp. 678-685
Integrated approach for reservoir characterization and field development of Meyal
area, Upper Indus basin, Pakistan
M Abida,b, M Riaz*,c,d,e, T Zafare,f, M A Khanb & U Shakirb
aSchool of Ocean and Earth Science, Tongji University, Shanghai – 200 092, China bDepartment of Earth and Environmental Sciences, Bahria University, Islamabad, Pakistan
cState Key Laboratory of Oil and Gas Reservoir Geology and Exploitation, Chengdu University of Technology, Chengdu-610 059, China dCollege of Energy Resources, Chengdu University of Technology, Chengdu – 610 059, China
eInstitute of Geology, University of the Punjab, Lahore – 545 90, Pakistan fInstitute of Geochemistry, Chinese Academy of Sciences, Guiyang – 550 081, China
*[Email: [email protected]]
Received 01 October 2018; revised 01 December 2018
Seismic data commonly provides insight into subsurface reservoirs. However, only seismic is not capable to completely
evaluate reservoir pore fluid heterogeneities. Therefore, an integrated approach of seismic interpretation, petrophysical
analysis and Gassmann fluid substitution is used in Meyal area, for its reservoir depiction and field development. The results
of seismic analysis reveal that the study area is in compressional regime and thrust bounded pop-up structure makes it
appropriate for hydrocarbon accumulation. A new lead is identified that could be probable hydrocarbon potential zone.
Petrophysical investigation depicts that the zone is saturated with hydrocarbon and hold suitable effective porosity. In
addition, fluid substitution in desired zone reflects variations in elastic properties (P, S-wave velocity and density) when
substituted with brine. The maximum variations are perceived at maximum saturation of brine. This approach can be
confidently applied to quantify reservoir potential in any sedimentary basin of the world.
[Keywords: Fluid substitution, Petrophysics, Reservoir characterization, Seismic interpretation]
Introduction
Reservoir characterization is a multidisciplinary
process and needs different types of data, which
provides direct or indirect information about
subsurface1. In reservoir characterization, various
reservoir properties are deliberated using an integrated
set of presented data2. Most of the reservoirs consists of
two (gas–water or oil–water) or three (gas, oil and
water) different phases of liquid required to be
characterized3,4. Most significant task in reservoir
characterization is its economic value estimation and
future performance prediction, so it requires accurate
methods utilization to obtain error free results3. Seismic
interpretation assists to delineate hydrocarbon
accumulating subsurface structure by time and depth
contour maps5-8. Furthermore, petrophysical analysis
supports to quantify diverse physical characteristics
including volume of shale, porosity, water and
hydrocarbons saturation3. In addition, fluid substitution
provides away for identification and quantification of
fluid in reservoir. Principal cause in failure of
development well is rising of water saturation6. It is
very intricate to evaluate water saturation information
from seismic data unless we include rock physics
modeling. Rock physics will facilitate to delineate fluid
depletion impact on different seismic elastic properties
such as P- and S-wave velocity as well as density9,10.
Meyal area is a foremost oil and gas producing
field in the Potwar Basin7,8,11. In the Meyal field
(1968), Pakistan Oil-fields Limited (POL) revealed
the petroleum system and at present, 16 exploratory
wells are inspected. Most of the wells in the Meyal
area are drilled on the basis of conventional structural
interpretation, seismic amplitude anomalies related to
the pore fluid are ignored. In the current study, prime
objective is to present an integrated analysis of
seismic interpretation, petrophysics response and fluid
substitution for reservoir characterization and field
development of Meyal area, upper Indus
basin, Pakistan.
Materials and Methods
Geological setting
Geologically, Meyal field lies in Potwar sub-
basin7,8,11 (Fig. 1). This sub basin was generated
owing to the tectonic activities in Post-Eocene time
ABID et al.: RESERVOIR CHARACTERIZATION AND FIELD DEVELOPMENT OF MEYAL AREA
679
hence it is extremely affected by the transpressional
forces12,13. These transpressional forces developed
pop-up structures and faults termination from
basement depicting thick-skinned tectonics7,14. The
main boundary thrust (MBT), Salt Range Thrust
(SRT), Kurram and Khair-i-Murat thrust faults,
Jhelum and Kalabagh faults are the foremost geologic
structures of the Potwar area15-17. Fold structures in
this area are normally oriented in a sublatitudional
fashion and these structural complexities are
increased toward northward. Most of the wells in
Potwar sub-basin are drilled on the basis of structural
interpretation15.The Potwar area is divided into two
broad zones by Soan syncline, the North Potwar
Deformed Zone (NPDZ) and South Potwar Platform
Zone (SPPZ)7,8,18. It is approximately extended 130
kms from MBT in north to SRT in south, and Jhelum
strike slip fault is on the eastern boundary while Indus
river and Kalabagh strike slip marks the western
periphery19,20. Study area is situated at the northern
flank of the Soan syncline7,8,11,21. The whole region is
linked with Neogene buckling and outcrops as well as
faults commonly reveal ENE-SSW trend at number of
places. The subsurface structure of the Meyal
area does not lie directly underneath the
surface structure22.
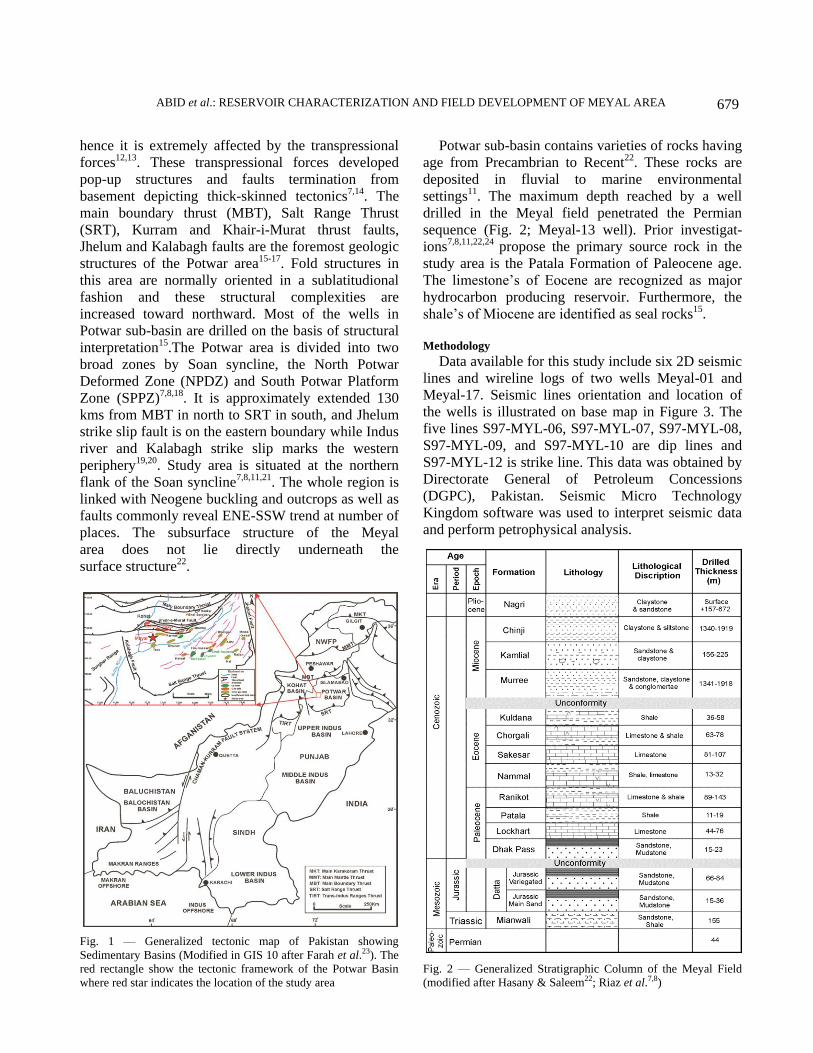
Potwar sub-basin contains varieties of rocks having
age from Precambrian to Recent22. These rocks are
deposited in fluvial to marine environmental
settings11. The maximum depth reached by a well
drilled in the Meyal field penetrated the Permian
sequence (Fig. 2; Meyal-13 well). Prior investigat-
ions7,8,11,22,24 propose the primary source rock in the
study area is the Patala Formation of Paleocene age.
The limestone’s of Eocene are recognized as major
hydrocarbon producing reservoir. Furthermore, the
shale’s of Miocene are identified as seal rocks15.
Methodology
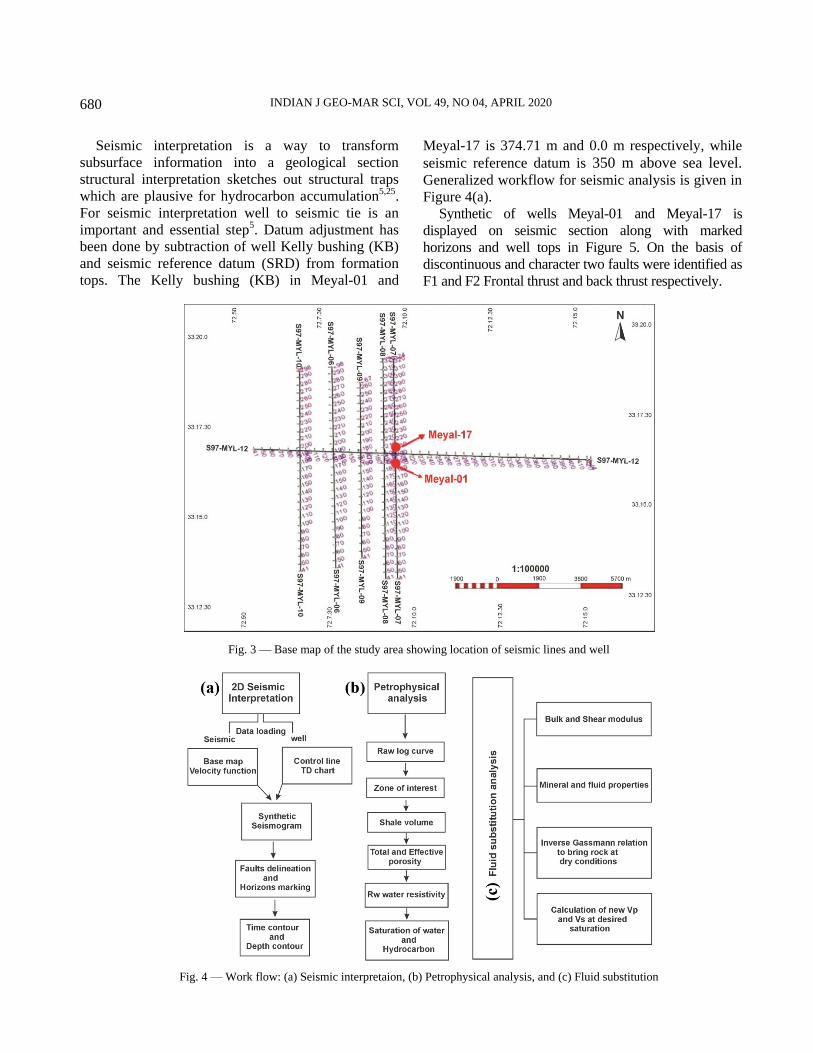
Data available for this study include six 2D seismic
lines and wireline logs of two wells Meyal-01 and
Meyal-17. Seismic lines orientation and location of
the wells is illustrated on base map in Figure 3. The
five lines S97-MYL-06, S97-MYL-07, S97-MYL-08,
S97-MYL-09, and S97-MYL-10 are dip lines and
S97-MYL-12 is strike line. This data was obtained by
Directorate General of Petroleum Concessions
(DGPC), Pakistan. Seismic Micro Technology
Kingdom software was used to interpret seismic data
and perform petrophysical analysis.
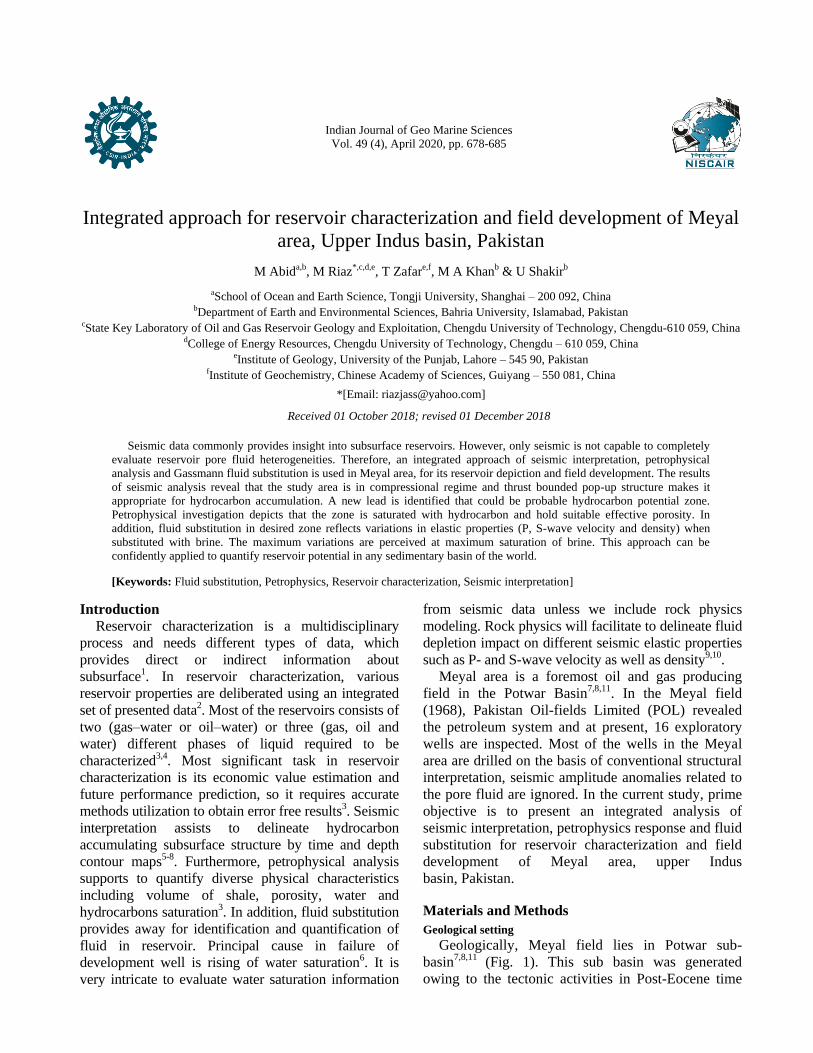
Fig. 1 — Generalized tectonic map of Pakistan showing
Sedimentary Basins (Modified in GIS 10 after Farah et al.23). The
red rectangle show the tectonic framework of the Potwar Basin
where red star indicates the location of the study area
Fig. 2 — Generalized Stratigraphic Column of the Meyal Field
(modified after Hasany & Saleem22; Riaz et al.7,8)
INDIAN J GEO-MAR SCI, VOL 49, NO 04, APRIL 2020
680
Seismic interpretation is a way to transform
subsurface information into a geological section
structural interpretation sketches out structural traps
which are plausive for hydrocarbon accumulation5,25.
For seismic interpretation well to seismic tie is an
important and essential step5. Datum adjustment has
been done by subtraction of well Kelly bushing (KB)
and seismic reference datum (SRD) from formation
tops. The Kelly bushing (KB) in Meyal-01 and
Meyal-17 is 374.71 m and 0.0 m respectively, while
seismic reference datum is 350 m above sea level. Generalized workflow for seismic analysis is given in
Figure 4(a).
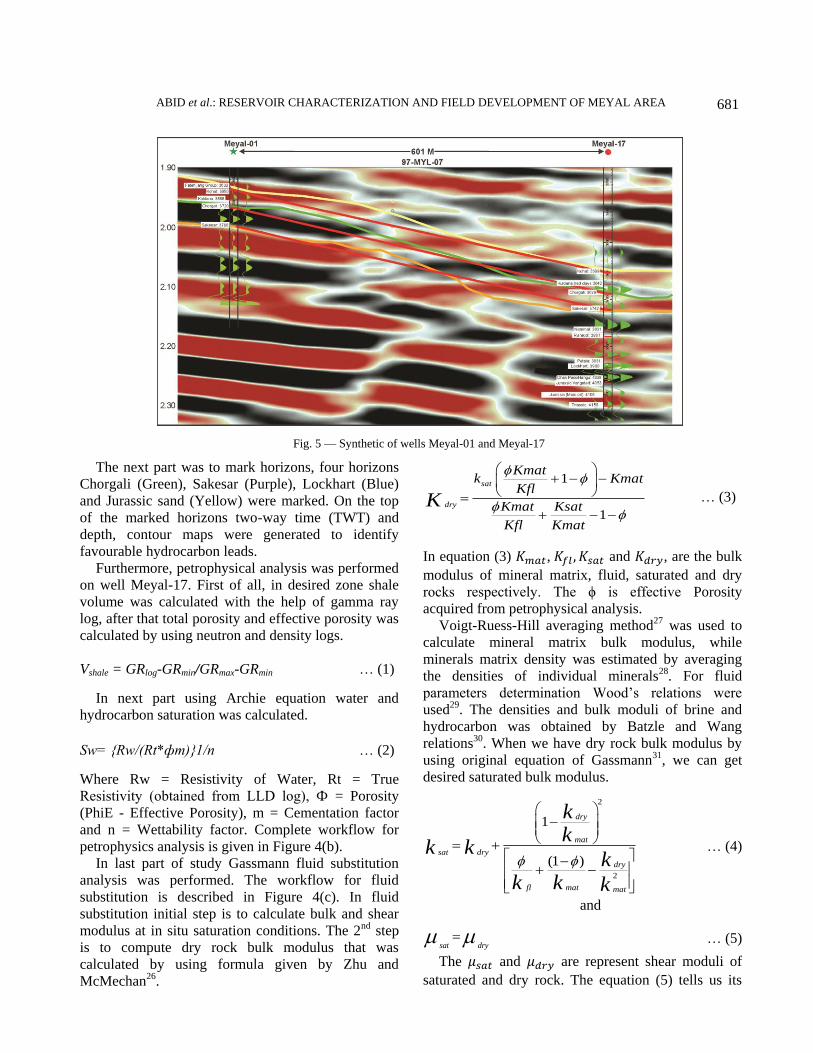
Synthetic of wells Meyal-01 and Meyal-17 is
displayed on seismic section along with marked
horizons and well tops in Figure 5. On the basis of
discontinuous and character two faults were identified as
F1 and F2 Frontal thrust and back thrust respectively.
Fig. 3 — Base map of the study area showing location of seismic lines and well
Fig. 4 — Work flow: (a) Seismic interpretaion, (b) Petrophysical analysis, and (c) Fluid substitution
ABID et al.: RESERVOIR CHARACTERIZATION AND FIELD DEVELOPMENT OF MEYAL AREA
681
The next part was to mark horizons, four horizons
Chorgali (Green), Sakesar (Purple), Lockhart (Blue)
and Jurassic sand (Yellow) were marked. On the top
of the marked horizons two-way time (TWT) and
depth, contour maps were generated to identify
favourable hydrocarbon leads.
Furthermore, petrophysical analysis was performed
on well Meyal-17. First of all, in desired zone shale
volume was calculated with the help of gamma ray
log, after that total porosity and effective porosity was
calculated by using neutron and density logs.
Vshale = GRlog-GRmin/GRmax-GRmin … (1)
In next part using Archie equation water and
hydrocarbon saturation was calculated.
Sw= {Rw/(Rt*фm)}1/n … (2)
Where Rw = Resistivity of Water, Rt = True
Resistivity (obtained from LLD log), Ф = Porosity
(PhiE - Effective Porosity), m = Cementation factor
and n = Wettability factor. Complete workflow for
petrophysics analysis is given in Figure 4(b).
In last part of study Gassmann fluid substitution
analysis was performed. The workflow for fluid
substitution is described in Figure 4(c). In fluid
substitution initial step is to calculate bulk and shear
modulus at in situ saturation conditions. The 2nd
step
is to compute dry rock bulk modulus that was
calculated by using formula given by Zhu and
McMechan26.
1
1
sat
dry
Kmatk Kmat
Kfl
Kmat Ksat
Kfl Kmat
K
… (3)
In equation (3) , and , are the bulk
modulus of mineral matrix, fluid, saturated and dry
rocks respectively. The ϕ is effective Porosity
acquired from petrophysical analysis.
Voigt-Ruess-Hill averaging method27 was used to
calculate mineral matrix bulk modulus, while
minerals matrix density was estimated by averaging
the densities of individual minerals28. For fluid
parameters determination Wood’s relations were
used29. The densities and bulk moduli of brine and
hydrocarbon was obtained by Batzle and Wang
relations30. When we have dry rock bulk modulus by
using original equation of Gassmann31, we can get
desired saturated bulk modulus.
2
2
1
(1 )
dry
mat
sat dry
dry
fl mat mat
kk
k kk
k k k
… (4)
and
sat dry … (5)
The and are represent shear moduli of
saturated and dry rock. The equation (5) tells us its
Fig. 5 — Synthetic of wells Meyal-01 and Meyal-17
INDIAN J GEO-MAR SCI, VOL 49, NO 04, APRIL 2020
682
independency from presence of fluid. Saturated
density was calculated by relations of Kumar28.
(1 )sat fl mat
… (6)
In equation 6 sat
is saturated density, represents
porosity, fl
is fluid density and mat
is matrix
density.
For saturated P and S-wave velocity equation (7)
and (8) were used.
4 / 3kVp
… (7)
and
/Vs … (8)
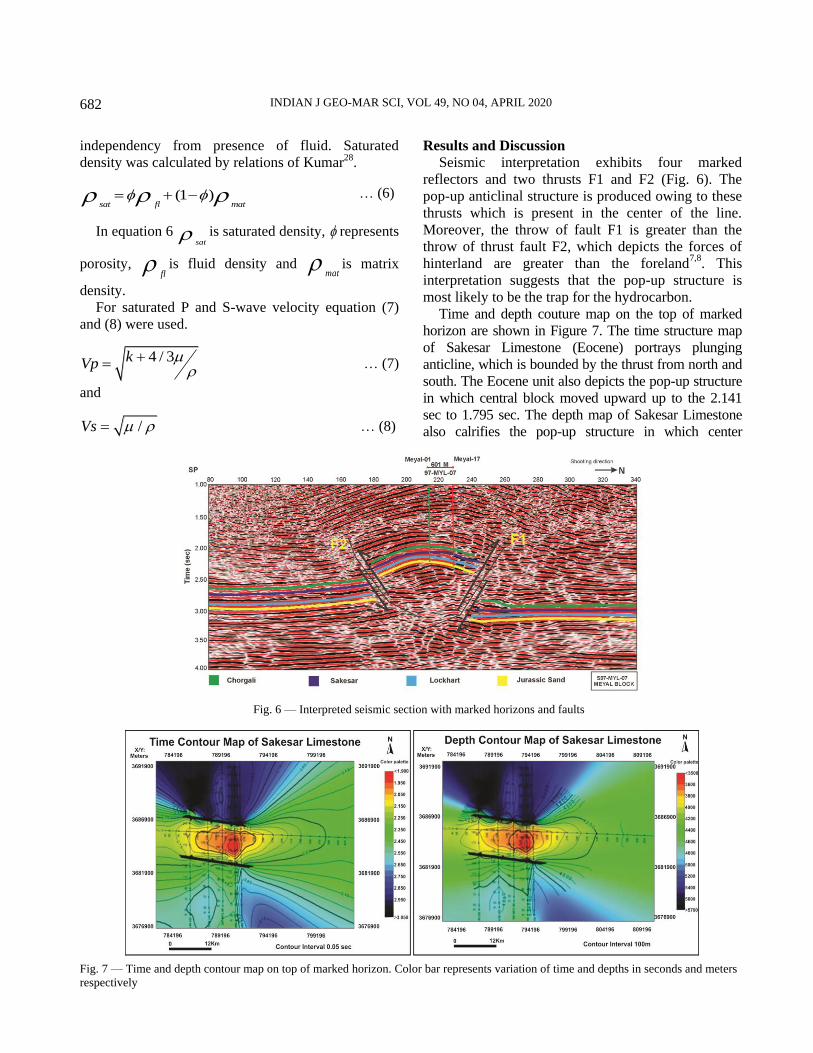
Results and Discussion
Seismic interpretation exhibits four marked
reflectors and two thrusts F1 and F2 (Fig. 6). The
pop-up anticlinal structure is produced owing to these
thrusts which is present in the center of the line.
Moreover, the throw of fault F1 is greater than the
throw of thrust fault F2, which depicts the forces of
hinterland are greater than the foreland7,8
. This
interpretation suggests that the pop-up structure is
most likely to be the trap for the hydrocarbon.
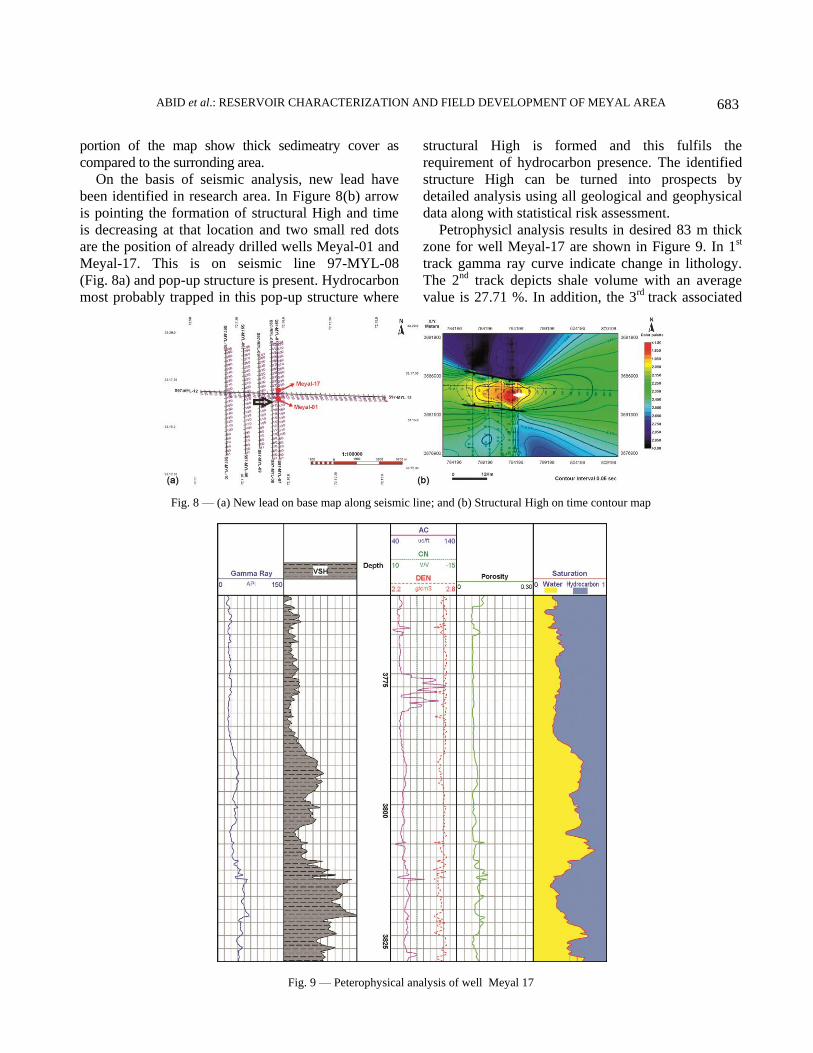
Time and depth couture map on the top of marked
horizon are shown in Figure 7. The time structure map
of Sakesar Limestone (Eocene) portrays plunging
anticline, which is bounded by the thrust from north and
south. The Eocene unit also depicts the pop-up structure
in which central block moved upward up to the 2.141
sec to 1.795 sec. The depth map of Sakesar Limestone
also calrifies the pop-up structure in which center
Fig. 6 — Interpreted seismic section with marked horizons and faults
Fig. 7 — Time and depth contour map on top of marked horizon. Color bar represents variation of time and depths in seconds and meters
respectively
ABID et al.: RESERVOIR CHARACTERIZATION AND FIELD DEVELOPMENT OF MEYAL AREA
683
portion of the map show thick sedimeatry cover as
compared to the surronding area.
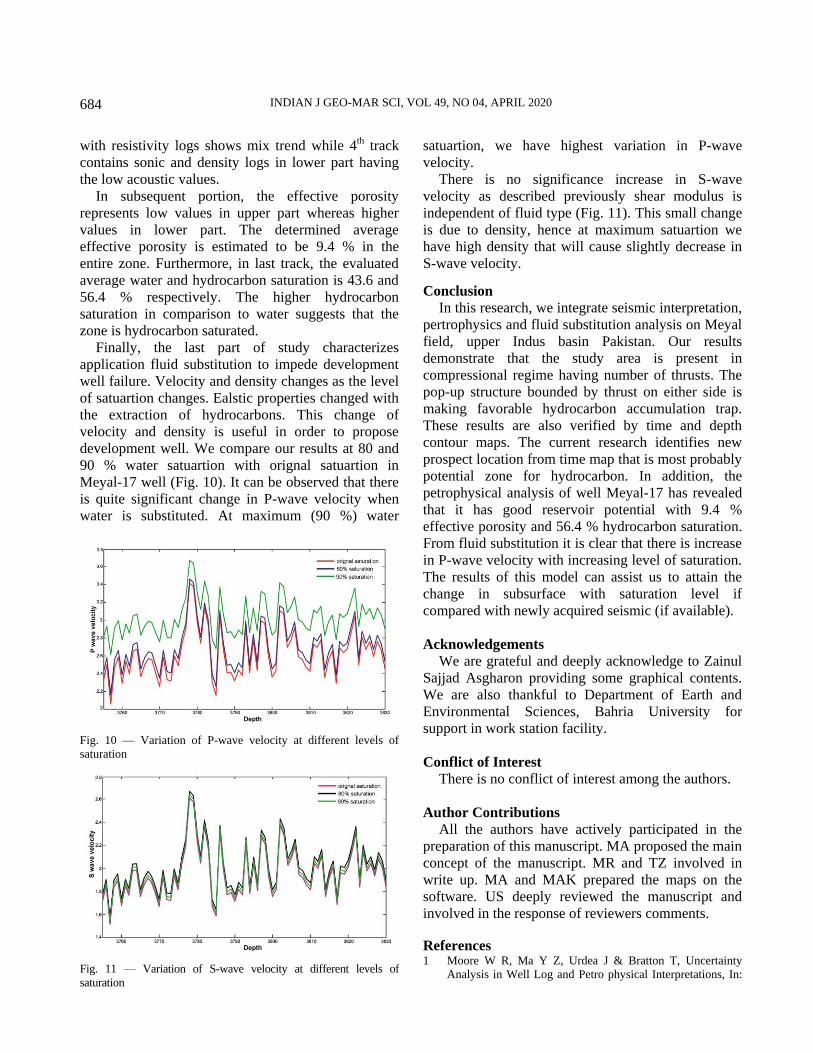
On the basis of seismic analysis, new lead have
been identified in research area. In Figure 8(b) arrow
is pointing the formation of structural High and time
is decreasing at that location and two small red dots
are the position of already drilled wells Meyal-01 and
Meyal-17. This is on seismic line 97-MYL-08
(Fig. 8a) and pop-up structure is present. Hydrocarbon
most probably trapped in this pop-up structure where
structural High is formed and this fulfils the
requirement of hydrocarbon presence. The identified
structure High can be turned into prospects by
detailed analysis using all geological and geophysical
data along with statistical risk assessment.
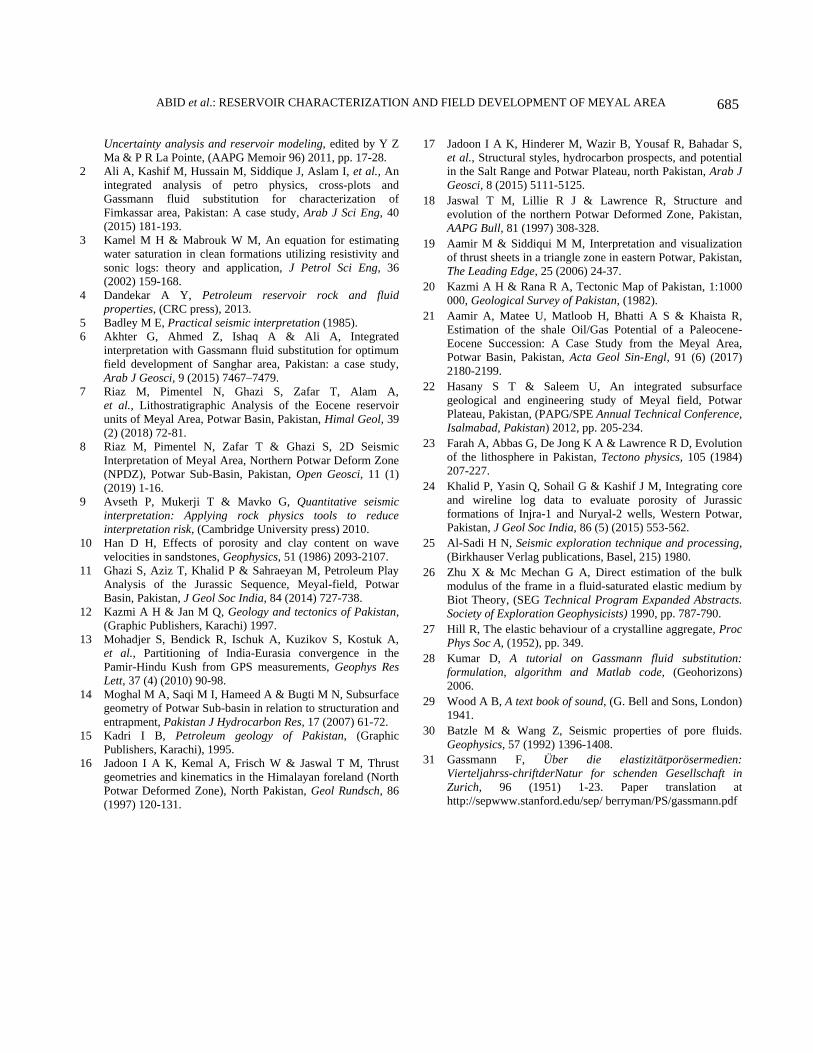
Petrophysicl analysis results in desired 83 m thick
zone for well Meyal-17 are shown in Figure 9. In 1st
track gamma ray curve indicate change in lithology.
The 2nd track depicts shale volume with an average
value is 27.71 %. In addition, the 3rd track associated
Fig. 8 — (a) New lead on base map along seismic line; and (b) Structural High on time contour map
Fig. 9 — Peterophysical analysis of well Meyal 17
INDIAN J GEO-MAR SCI, VOL 49, NO 04, APRIL 2020
684
with resistivity logs shows mix trend while 4th track
contains sonic and density logs in lower part having
the low acoustic values.
In subsequent portion, the effective porosity
represents low values in upper part whereas higher
values in lower part. The determined average
effective porosity is estimated to be 9.4 % in the
entire zone. Furthermore, in last track, the evaluated
average water and hydrocarbon saturation is 43.6 and
56.4 % respectively. The higher hydrocarbon
saturation in comparison to water suggests that the
zone is hydrocarbon saturated.
Finally, the last part of study characterizes
application fluid substitution to impede development
well failure. Velocity and density changes as the level
of satuartion changes. Ealstic properties changed with
the extraction of hydrocarbons. This change of
velocity and density is useful in order to propose
development well. We compare our results at 80 and
90 % water satuartion with orignal satuartion in
Meyal-17 well (Fig. 10). It can be observed that there
is quite significant change in P-wave velocity when
water is substituted. At maximum (90 %) water
satuartion, we have highest variation in P-wave
velocity.
There is no significance increase in S-wave
velocity as described previously shear modulus is
independent of fluid type (Fig. 11). This small change
is due to density, hence at maximum satuartion we
have high density that will cause slightly decrease in
S-wave velocity.
Conclusion
In this research, we integrate seismic interpretation,
pertrophysics and fluid substitution analysis on Meyal
field, upper Indus basin Pakistan. Our results
demonstrate that the study area is present in
compressional regime having number of thrusts. The
pop-up structure bounded by thrust on either side is
making favorable hydrocarbon accumulation trap.
These results are also verified by time and depth
contour maps. The current research identifies new
prospect location from time map that is most probably
potential zone for hydrocarbon. In addition, the
petrophysical analysis of well Meyal-17 has revealed
that it has good reservoir potential with 9.4 %
effective porosity and 56.4 % hydrocarbon saturation.
From fluid substitution it is clear that there is increase
in P-wave velocity with increasing level of saturation.
The results of this model can assist us to attain the
change in subsurface with saturation level if
compared with newly acquired seismic (if available).
Acknowledgements
We are grateful and deeply acknowledge to Zainul
Sajjad Asgharon providing some graphical contents.
We are also thankful to Department of Earth and
Environmental Sciences, Bahria University for
support in work station facility.
Conflict of Interest
There is no conflict of interest among the authors.
Author Contributions
All the authors have actively participated in the
preparation of this manuscript. MA proposed the main
concept of the manuscript. MR and TZ involved in
write up. MA and MAK prepared the maps on the
software. US deeply reviewed the manuscript and
involved in the response of reviewers comments.
References 1 Moore W R, Ma Y Z, Urdea J & Bratton T, Uncertainty
Analysis in Well Log and Petro physical Interpretations, In:
Fig. 10 — Variation of P-wave velocity at different levels of
saturation
Fig. 11 — Variation of S-wave velocity at different levels of
saturation
ABID et al.: RESERVOIR CHARACTERIZATION AND FIELD DEVELOPMENT OF MEYAL AREA
685
Uncertainty analysis and reservoir modeling, edited by Y Z
Ma & P R La Pointe, (AAPG Memoir 96) 2011, pp. 17-28.
2 Ali A, Kashif M, Hussain M, Siddique J, Aslam I, et al., An
integrated analysis of petro physics, cross-plots and
Gassmann fluid substitution for characterization of
Fimkassar area, Pakistan: A case study, Arab J Sci Eng, 40
(2015) 181-193.
3 Kamel M H & Mabrouk W M, An equation for estimating
water saturation in clean formations utilizing resistivity and
sonic logs: theory and application, J Petrol Sci Eng, 36
(2002) 159-168.
4 Dandekar A Y, Petroleum reservoir rock and fluid
properties, (CRC press), 2013.
5 Badley M E, Practical seismic interpretation (1985).
6 Akhter G, Ahmed Z, Ishaq A & Ali A, Integrated
interpretation with Gassmann fluid substitution for optimum
field development of Sanghar area, Pakistan: a case study,
Arab J Geosci, 9 (2015) 7467–7479.
7 Riaz M, Pimentel N, Ghazi S, Zafar T, Alam A,
et al., Lithostratigraphic Analysis of the Eocene reservoir
units of Meyal Area, Potwar Basin, Pakistan, Himal Geol, 39
(2) (2018) 72-81.
8 Riaz M, Pimentel N, Zafar T & Ghazi S, 2D Seismic
Interpretation of Meyal Area, Northern Potwar Deform Zone
(NPDZ), Potwar Sub-Basin, Pakistan, Open Geosci, 11 (1)
(2019) 1-16.
9 Avseth P, Mukerji T & Mavko G, Quantitative seismic
interpretation: Applying rock physics tools to reduce
interpretation risk, (Cambridge University press) 2010.
10 Han D H, Effects of porosity and clay content on wave
velocities in sandstones, Geophysics, 51 (1986) 2093-2107.
11 Ghazi S, Aziz T, Khalid P & Sahraeyan M, Petroleum Play
Analysis of the Jurassic Sequence, Meyal-field, Potwar
Basin, Pakistan, J Geol Soc India, 84 (2014) 727-738.
12 Kazmi A H & Jan M Q, Geology and tectonics of Pakistan,
(Graphic Publishers, Karachi) 1997.
13 Mohadjer S, Bendick R, Ischuk A, Kuzikov S, Kostuk A,
et al., Partitioning of India-Eurasia convergence in the
Pamir-Hindu Kush from GPS measurements, Geophys Res
Lett, 37 (4) (2010) 90-98.
14 Moghal M A, Saqi M I, Hameed A & Bugti M N, Subsurface
geometry of Potwar Sub-basin in relation to structuration and
entrapment, Pakistan J Hydrocarbon Res, 17 (2007) 61-72.
15 Kadri I B, Petroleum geology of Pakistan, (Graphic
Publishers, Karachi), 1995.
16 Jadoon I A K, Kemal A, Frisch W & Jaswal T M, Thrust
geometries and kinematics in the Himalayan foreland (North
Potwar Deformed Zone), North Pakistan, Geol Rundsch, 86
(1997) 120-131.
17 Jadoon I A K, Hinderer M, Wazir B, Yousaf R, Bahadar S,
et al., Structural styles, hydrocarbon prospects, and potential
in the Salt Range and Potwar Plateau, north Pakistan, Arab J
Geosci, 8 (2015) 5111-5125.
18 Jaswal T M, Lillie R J & Lawrence R, Structure and
evolution of the northern Potwar Deformed Zone, Pakistan,
AAPG Bull, 81 (1997) 308-328.
19 Aamir M & Siddiqui M M, Interpretation and visualization
of thrust sheets in a triangle zone in eastern Potwar, Pakistan,
The Leading Edge, 25 (2006) 24-37.
20 Kazmi A H & Rana R A, Tectonic Map of Pakistan, 1:1000
000, Geological Survey of Pakistan, (1982).
21 Aamir A, Matee U, Matloob H, Bhatti A S & Khaista R,
Estimation of the shale Oil/Gas Potential of a Paleocene-
Eocene Succession: A Case Study from the Meyal Area,
Potwar Basin, Pakistan, Acta Geol Sin-Engl, 91 (6) (2017)
2180-2199.
22 Hasany S T & Saleem U, An integrated subsurface
geological and engineering study of Meyal field, Potwar
Plateau, Pakistan, (PAPG/SPE Annual Technical Conference,
Isalmabad, Pakistan) 2012, pp. 205-234.
23 Farah A, Abbas G, De Jong K A & Lawrence R D, Evolution
of the lithosphere in Pakistan, Tectono physics, 105 (1984)
207-227.
24 Khalid P, Yasin Q, Sohail G & Kashif J M, Integrating core
and wireline log data to evaluate porosity of Jurassic
formations of Injra-1 and Nuryal-2 wells, Western Potwar,
Pakistan, J Geol Soc India, 86 (5) (2015) 553-562.
25 Al-Sadi H N, Seismic exploration technique and processing,
(Birkhauser Verlag publications, Basel, 215) 1980.
26 Zhu X & Mc Mechan G A, Direct estimation of the bulk
modulus of the frame in a fluid-saturated elastic medium by
Biot Theory, (SEG Technical Program Expanded Abstracts.
Society of Exploration Geophysicists) 1990, pp. 787-790.
27 Hill R, The elastic behaviour of a crystalline aggregate, Proc
Phys Soc A, (1952), pp. 349.
28 Kumar D, A tutorial on Gassmann fluid substitution:
formulation, algorithm and Matlab code, (Geohorizons)
2006.
29 Wood A B, A text book of sound, (G. Bell and Sons, London)
1941.
30 Batzle M & Wang Z, Seismic properties of pore fluids.
Geophysics, 57 (1992) 1396-1408.
31 Gassmann F, Über die elastizitätporösermedien:
Vierteljahrss-chriftderNatur for schenden Gesellschaft in
Zurich, 96 (1951) 1-23. Paper translation at
http://sepwww.stanford.edu/sep/ berryman/PS/gassmann.pdf