Embed Size (px)
Citation preview
1
Abstract: In today’s highly competitive markets high quality is critical for sustaining competitive advantage. Continuous quality improvement is a key factor in the strategy for competitiveness. Cost of Quality is one tool that can help in continuous quality improvement. To improve quality, an organization take into account the costs associated with achieving quality. It is often claimed by various researchers that the cost of quality stands for 10 to 40 percent of the company´s turnover, which is why it is important to measure and monitor COQ.
This paper discusses recall of vehicles in India because of faulty design leading to heavy loss for the companies, accounting this cost of recall as quality cost. Automotive sector and the companies need to rethink and spend more time at the design and development phase where the problems could be envisaged in advance to avoid the quality cost. By implementing Six Sigma philosophy into manufacturing process, and or products, lower the quality cost and therefore overall cost. In the manufacturing process, six sigma capability and SPC tools helps to stop defects before they are created and helps to reduce the cost of poor quality.
Key words: Cost of Quality, Cost of Quality Models, Automobile Recalls, Six Sigma.
I. INTRODUCTION
Globalization leads to greater competition among the manufacturers. To survive in globalize market high quality is essential. Quality costs can help to quantify specific quality levels and ultimately improve productivity. In today’s competitive market customer satisfaction plays a vital role to increase organization profit and its survival. Customers take into account service and product quality as one of the most important factors to choose a service or product. To improve quality, an organization must take into account the costs associated with achieving quality since the objective of continuous improvement programs is not only to meet customer requirements, but also to do it at the lowest, possible, cost. This can only obtained by reducing the costs needed to achieve quality, and the reduction of these costs is only possible if they are identified and measured. In organization measuring and reporting the cost of quality (COQ) should be considered an important issue, for achieving quality excellence. Since the early 1950s, COQ philosophy has been applied to manufacturing and is widely attributed to the work of Joseph Juran and A.V. Feigenbaum. The cost of quality can be defined as the total of all resources spent by any organization to assure that quality standards are met on a consistent basis (Bohan and Horney, 1991).
COQ is the sum of conformance plus non-conformance costs, where cost of conformance is the price paid for prevention of poor quality and cost of non-conformance is the cost of poor quality caused by product and service failure.
According to study of various researchers on COQ shows opinions ranges from 10% to 40% of annual sales of the company. The average is around 20% for industry of sales. For six sigma organizations with a range of 1% of sales whereas for three sigma organization with a range of up to 40%, meaning for the average company there is large potential for improvement. The average factory can reduce the cost of poor quality and increase their bottom line profits, by using the basic six sigma tools of Statistical Process Control (SPC) and Capability Processes. Cost of Good Quality
These are the cost associated with improving the quality of product. Prevention Cost
These are costs incurred to keep failure and appraisal costs to a minimum with preventing defects and imperfections. Examples: A new product review, quality planning, supplier capability surveys, process capability evaluations, quality improvement team meetings, quality improvement projects, quality education and training.
Appraisal Costs
These costs are direct costs of measuring quality. These are the costs incurred to determine the degree of conformance to quality requirements. In this case, quality is defined as the conformance to customer expectations. Examples: Incoming inspection and test, in process inspection and test, document review, product quality audit, maintain the accuracy of test equipment, inspection and test materials and services.
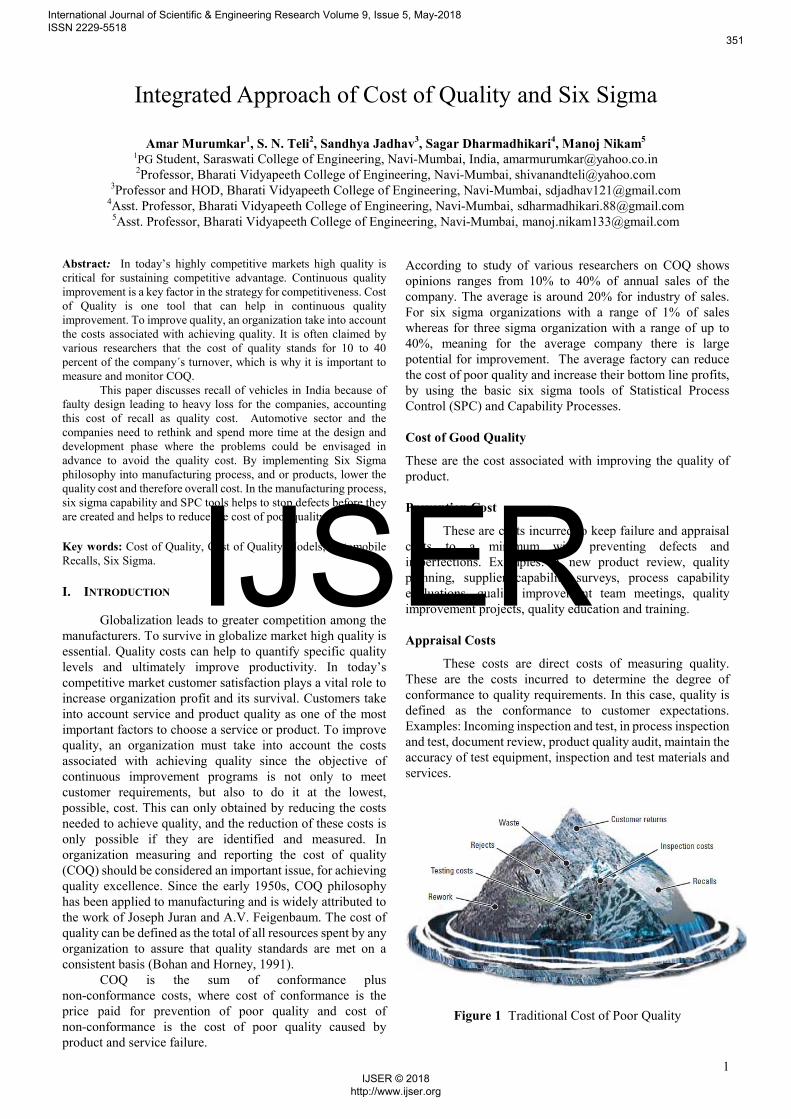
Figure 1 Traditional Cost of Poor Quality
Integrated Approach of Cost of Quality and Six Sigma
Amar Murumkar1, S. N. Teli2, Sandhya Jadhav3, Sagar Dharmadhikari4, Manoj Nikam5 1PG Student, Saraswati College of Engineering, Navi-Mumbai, India, [email protected] 2Professor, Bharati Vidyapeeth College of Engineering, Navi-Mumbai, [email protected]
3Professor and HOD, Bharati Vidyapeeth College of Engineering, Navi-Mumbai, [email protected] 4Asst. Professor, Bharati Vidyapeeth College of Engineering, Navi-Mumbai, [email protected]
5Asst. Professor, Bharati Vidyapeeth College of Engineering, Navi-Mumbai, [email protected]
International Journal of Scientific & Engineering Research Volume 9, Issue 5, May-2018 ISSN 2229-5518
351
IJSER © 2018 http://www.ijser.org
IJSER
2
Cost of Poor Quality
These include all the failure cost associated with a product. Figure 1 shows the Cost of poor quality (DeFeo, 2001). Internal Failure Costs
These are costs of deficiencies discovered before delivery which are associated with the failure (nonconformities). These are costs that would disappear if no deficiencies existed. Examples: scraping of obsolete product, rework, re-inspection, re-testing, material review, changing process, downgrading. External Failure Costs
These are costs associated with deficiencies that are found after product is received by the customer. These costs also would disappear if there were no deficiencies. Examples: complaint adjustments, customer return materials, warranty charges, product recalls.
Table 1 illustrates, recent Automobile Recall in India (Source:www.siam.in/siam-voluntary-recall).
Table 1 Automobile Recall in India
Company Name
Voluntary Recall Date
Model
Total no. of Recall
Vehicles
Description of
Potential Defect
Honda Cars India Ltd
31.01.17
City Civic Jazz
Accord
32456 1200 7265 659
Airbag problem
Honda Cars India Ltd
10.12.15 Mobilo Diesel
25782 Fuel leakage
Hyundai Motor India
26.09.16 EON (HA)
(Petrol)
7657 Clutch cable fouling with battery cable.
Toyota Kirloskar Motor Pvt Ltd
30.03.17 Corolla Petrol & Diesel
20734 Risk of abnormal Deployment Airbag
Ford India Pvt Ltd
30.05.16 Eco Sport 1.5L
Diesel
48463 Fuel lines do not meet Ford's ESD ground path requirement
Ford India Pvt Ltd
22.04.16 Figo and Figo
Aspire
72823 Restraint control module software error
General Motors India Pvt Ltd
15.12.15 Chevrolet
Beat Diesel
101597 Clutch pedal lever are susceptible to cracking.
General Motors Ind. Pvt Ltd
13.07.15 Beat, Spark, Enjoy
155000 Safety issue of remote keyless entry
Maruti Suzuki India Ltd
27.05.16 Baleno Diesel
15995 A process variation in child part of fuel filter was observed.
Maruti Suzuki India Ltd
27.05.16 Baleno Petrol & Diesel
Variants
75419 Possible malfunction in airbag controller due to software loss
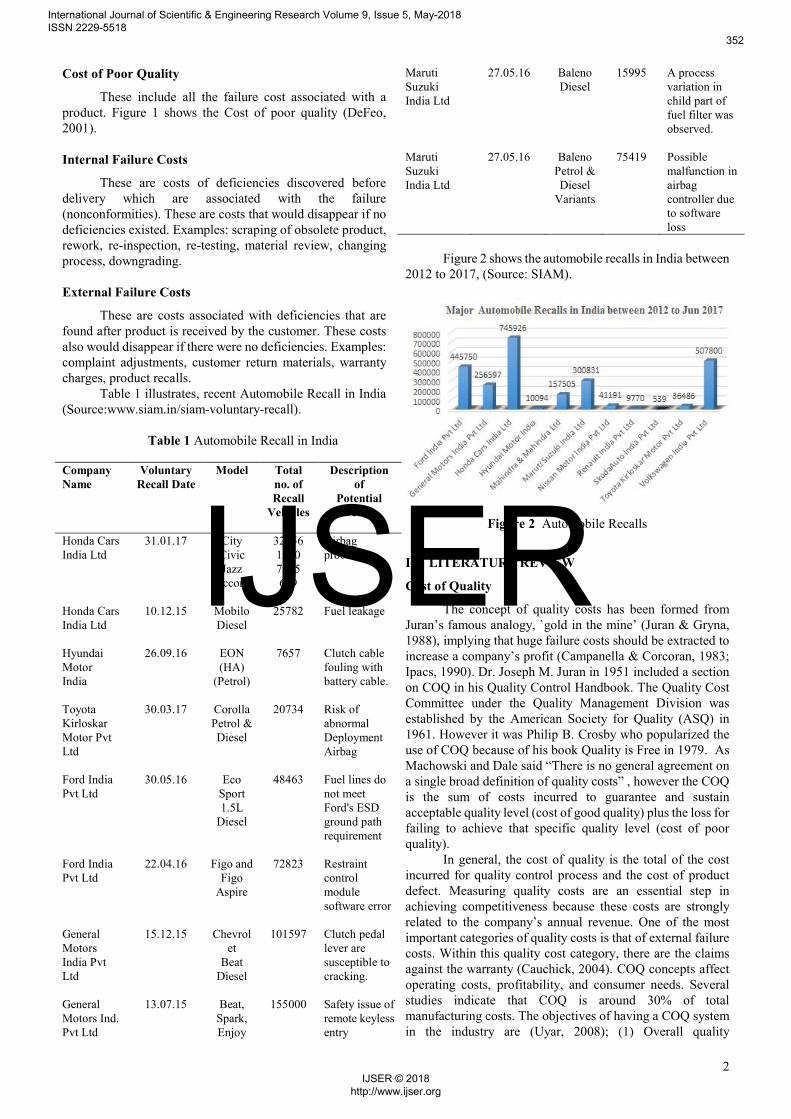
Figure 2 shows the automobile recalls in India between
2012 to 2017, (Source: SIAM).
Figure 2 Automobile Recalls
II. LITERATURE REVIEW
Cost of Quality
The concept of quality costs has been formed from Juran’s famous analogy, `gold in the mine’ (Juran & Gryna, 1988), implying that huge failure costs should be extracted to increase a company’s profit (Campanella & Corcoran, 1983; Ipacs, 1990). Dr. Joseph M. Juran in 1951 included a section on COQ in his Quality Control Handbook. The Quality Cost Committee under the Quality Management Division was established by the American Society for Quality (ASQ) in 1961. However it was Philip B. Crosby who popularized the use of COQ because of his book Quality is Free in 1979. As Machowski and Dale said “There is no general agreement on a single broad definition of quality costs” , however the COQ is the sum of costs incurred to guarantee and sustain acceptable quality level (cost of good quality) plus the loss for failing to achieve that specific quality level (cost of poor quality).
In general, the cost of quality is the total of the cost incurred for quality control process and the cost of product defect. Measuring quality costs are an essential step in achieving competitiveness because these costs are strongly related to the company’s annual revenue. One of the most important categories of quality costs is that of external failure costs. Within this quality cost category, there are the claims against the warranty (Cauchick, 2004). COQ concepts affect operating costs, profitability, and consumer needs. Several studies indicate that COQ is around 30% of total manufacturing costs. The objectives of having a COQ system in the industry are (Uyar, 2008); (1) Overall quality
International Journal of Scientific & Engineering Research Volume 9, Issue 5, May-2018 ISSN 2229-5518
352
IJSER © 2018 http://www.ijser.org
IJSER
3
improvement; (2) To set cost reduction targets and measure progress; (3) To have better control of quality activities; (4) To have better strategic plans; (5) To evaluate the effectiveness of the quality system.
(Burns, 1976) measured the COQ in a machine-tool company and these costs were the equivalent of 5% of the sales turnover. In a study of a steel foundry, (Moyers and Gilmore, 1979) reported the quality costs at 38% of sales. The quality costs were allocated as prevention costs 6%, appraisal costs 14% and failure cost 80%. Generally, quality costs are reported to be between 5% to 30% of sales. Organizations should consider COQ as an integrated approach and long-term process, and focus on the cost factors to improve customer satisfaction. The COQ had a direct impact on financial goal of a company; even a small reduction in COQ may boost the profitability of a company by a significant amount.
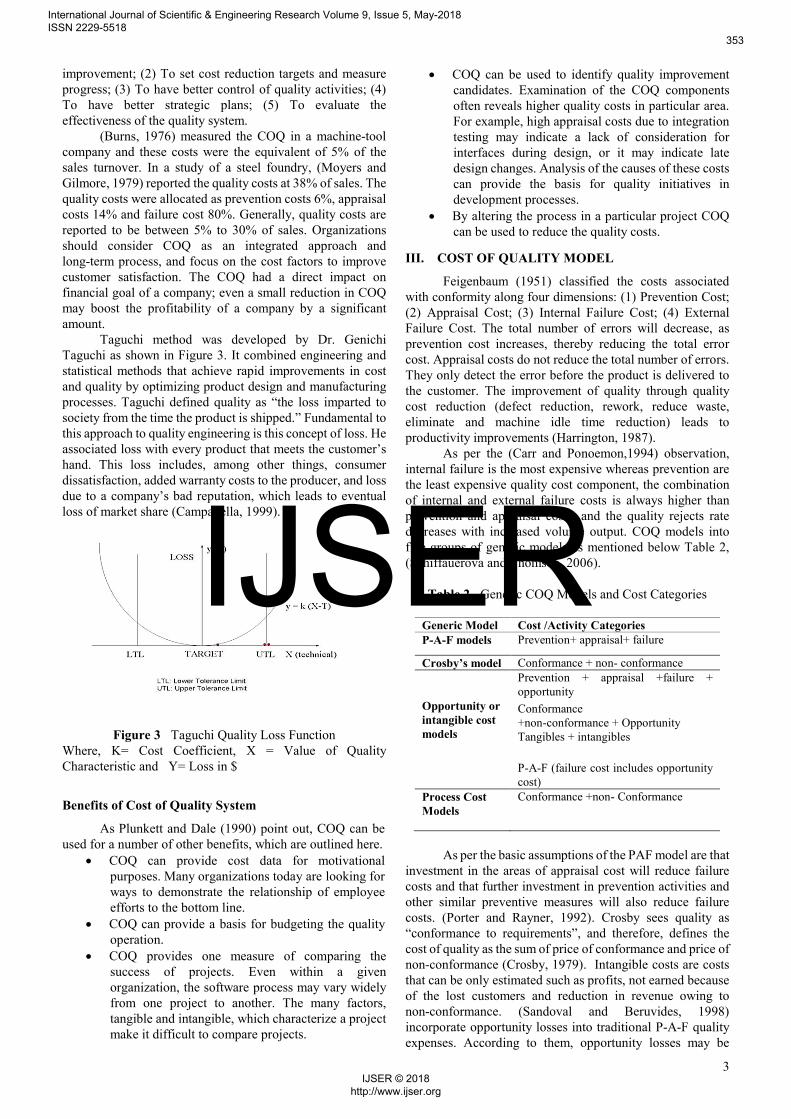
Taguchi method was developed by Dr. Genichi Taguchi as shown in Figure 3. It combined engineering and statistical methods that achieve rapid improvements in cost and quality by optimizing product design and manufacturing processes. Taguchi defined quality as “the loss imparted to society from the time the product is shipped.” Fundamental to this approach to quality engineering is this concept of loss. He associated loss with every product that meets the customer’s hand. This loss includes, among other things, consumer dissatisfaction, added warranty costs to the producer, and loss due to a company’s bad reputation, which leads to eventual loss of market share (Campanella, 1999).
Figure 3 Taguchi Quality Loss Function
Where, K= Cost Coefficient, X = Value of Quality Characteristic and Y= Loss in $
Benefits of Cost of Quality System
As Plunkett and Dale (1990) point out, COQ can be used for a number of other benefits, which are outlined here.
COQ can provide cost data for motivational purposes. Many organizations today are looking for ways to demonstrate the relationship of employee efforts to the bottom line.
COQ can provide a basis for budgeting the quality operation.
COQ provides one measure of comparing the success of projects. Even within a given organization, the software process may vary widely from one project to another. The many factors, tangible and intangible, which characterize a project make it difficult to compare projects.
COQ can be used to identify quality improvement candidates. Examination of the COQ components often reveals higher quality costs in particular area. For example, high appraisal costs due to integration testing may indicate a lack of consideration for interfaces during design, or it may indicate late design changes. Analysis of the causes of these costs can provide the basis for quality initiatives in development processes.
By altering the process in a particular project COQ can be used to reduce the quality costs.
III. COST OF QUALITY MODEL
Feigenbaum (1951) classified the costs associated with conformity along four dimensions: (1) Prevention Cost; (2) Appraisal Cost; (3) Internal Failure Cost; (4) External Failure Cost. The total number of errors will decrease, as prevention cost increases, thereby reducing the total error cost. Appraisal costs do not reduce the total number of errors. They only detect the error before the product is delivered to the customer. The improvement of quality through quality cost reduction (defect reduction, rework, reduce waste, eliminate and machine idle time reduction) leads to productivity improvements (Harrington, 1987). As per the (Carr and Ponoemon,1994) observation, internal failure is the most expensive whereas prevention are the least expensive quality cost component, the combination of internal and external failure costs is always higher than prevention and appraisal costs, and the quality rejects rate decreases with increased volume output. COQ models into five groups of generic models as mentioned below Table 2, (Schiffauerova and Thomson, 2006).
Table 2 Generic COQ Models and Cost Categories
Generic Model Cost /Activity Categories P-A-F models Prevention+ appraisal+ failure
Crosby’s model Conformance + non- conformance
Opportunity or intangible cost models
Prevention + appraisal +failure + opportunity
Conformance +non-conformance + Opportunity Tangibles + intangibles
P-A-F (failure cost includes opportunity cost)
Process Cost Models
Conformance +non- Conformance
As per the basic assumptions of the PAF model are that
investment in the areas of appraisal cost will reduce failure costs and that further investment in prevention activities and other similar preventive measures will also reduce failure costs. (Porter and Rayner, 1992). Crosby sees quality as “conformance to requirements”, and therefore, defines the cost of quality as the sum of price of conformance and price of non-conformance (Crosby, 1979). Intangible costs are costs that can be only estimated such as profits, not earned because of the lost customers and reduction in revenue owing to non-conformance. (Sandoval and Beruvides, 1998) incorporate opportunity losses into traditional P-A-F quality expenses. According to them, opportunity losses may be
International Journal of Scientific & Engineering Research Volume 9, Issue 5, May-2018 ISSN 2229-5518
353
IJSER © 2018 http://www.ijser.org
IJSER
4
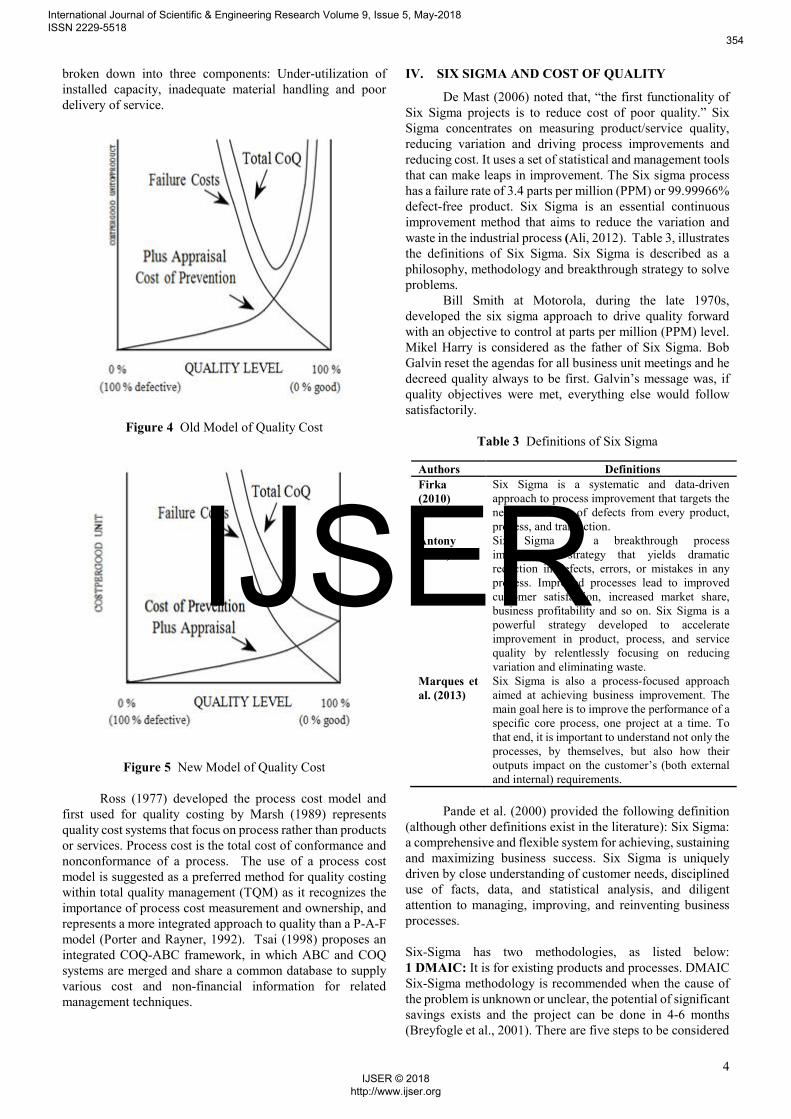
broken down into three components: Under-utilization of installed capacity, inadequate material handling and poor delivery of service.
Figure 4 Old Model of Quality Cost
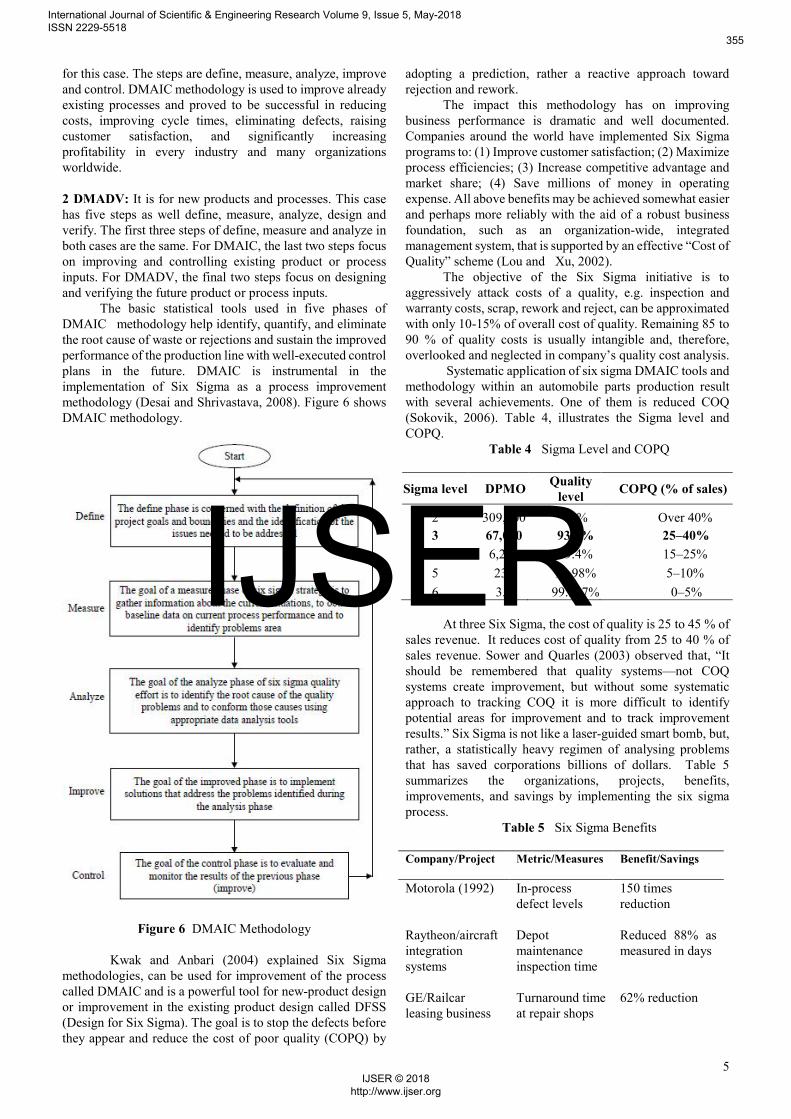
Figure 5 New Model of Quality Cost Ross (1977) developed the process cost model and
first used for quality costing by Marsh (1989) represents quality cost systems that focus on process rather than products or services. Process cost is the total cost of conformance and nonconformance of a process. The use of a process cost model is suggested as a preferred method for quality costing within total quality management (TQM) as it recognizes the importance of process cost measurement and ownership, and represents a more integrated approach to quality than a P-A-F model (Porter and Rayner, 1992). Tsai (1998) proposes an integrated COQ-ABC framework, in which ABC and COQ systems are merged and share a common database to supply various cost and non-financial information for related management techniques.
IV. SIX SIGMA AND COST OF QUALITY
De Mast (2006) noted that, “the first functionality of Six Sigma projects is to reduce cost of poor quality.” Six Sigma concentrates on measuring product/service quality, reducing variation and driving process improvements and reducing cost. It uses a set of statistical and management tools that can make leaps in improvement. The Six sigma process has a failure rate of 3.4 parts per million (PPM) or 99.99966% defect-free product. Six Sigma is an essential continuous improvement method that aims to reduce the variation and waste in the industrial process (Ali, 2012). Table 3, illustrates the definitions of Six Sigma. Six Sigma is described as a philosophy, methodology and breakthrough strategy to solve problems.
Bill Smith at Motorola, during the late 1970s, developed the six sigma approach to drive quality forward with an objective to control at parts per million (PPM) level. Mikel Harry is considered as the father of Six Sigma. Bob Galvin reset the agendas for all business unit meetings and he decreed quality always to be first. Galvin’s message was, if quality objectives were met, everything else would follow satisfactorily.
Table 3 Definitions of Six Sigma
Pande et al. (2000) provided the following definition
(although other definitions exist in the literature): Six Sigma: a comprehensive and flexible system for achieving, sustaining and maximizing business success. Six Sigma is uniquely driven by close understanding of customer needs, disciplined use of facts, data, and statistical analysis, and diligent attention to managing, improving, and reinventing business processes. Six-Sigma has two methodologies, as listed below: 1 DMAIC: It is for existing products and processes. DMAIC Six-Sigma methodology is recommended when the cause of the problem is unknown or unclear, the potential of significant savings exists and the project can be done in 4-6 months (Breyfogle et al., 2001). There are five steps to be considered
Authors Definitions
Firka (2010)
Six Sigma is a systematic and data-driven approach to process improvement that targets the near-elimination of defects from every product, process, and transaction.
Antony (2002)
Six Sigma is a breakthrough process improvement strategy that yields dramatic reduction in defects, errors, or mistakes in any process. Improved processes lead to improved customer satisfaction, increased market share, business profitability and so on. Six Sigma is a powerful strategy developed to accelerate improvement in product, process, and service quality by relentlessly focusing on reducing variation and eliminating waste.
Marques et al. (2013)
Six Sigma is also a process-focused approach aimed at achieving business improvement. The main goal here is to improve the performance of a specific core process, one project at a time. To that end, it is important to understand not only the processes, by themselves, but also how their outputs impact on the customer’s (both external and internal) requirements.
International Journal of Scientific & Engineering Research Volume 9, Issue 5, May-2018 ISSN 2229-5518
354
IJSER © 2018 http://www.ijser.org
IJSER
5
for this case. The steps are define, measure, analyze, improve and control. DMAIC methodology is used to improve already existing processes and proved to be successful in reducing costs, improving cycle times, eliminating defects, raising customer satisfaction, and significantly increasing profitability in every industry and many organizations worldwide. 2 DMADV: It is for new products and processes. This case has five steps as well define, measure, analyze, design and verify. The first three steps of define, measure and analyze in both cases are the same. For DMAIC, the last two steps focus on improving and controlling existing product or process inputs. For DMADV, the final two steps focus on designing and verifying the future product or process inputs.
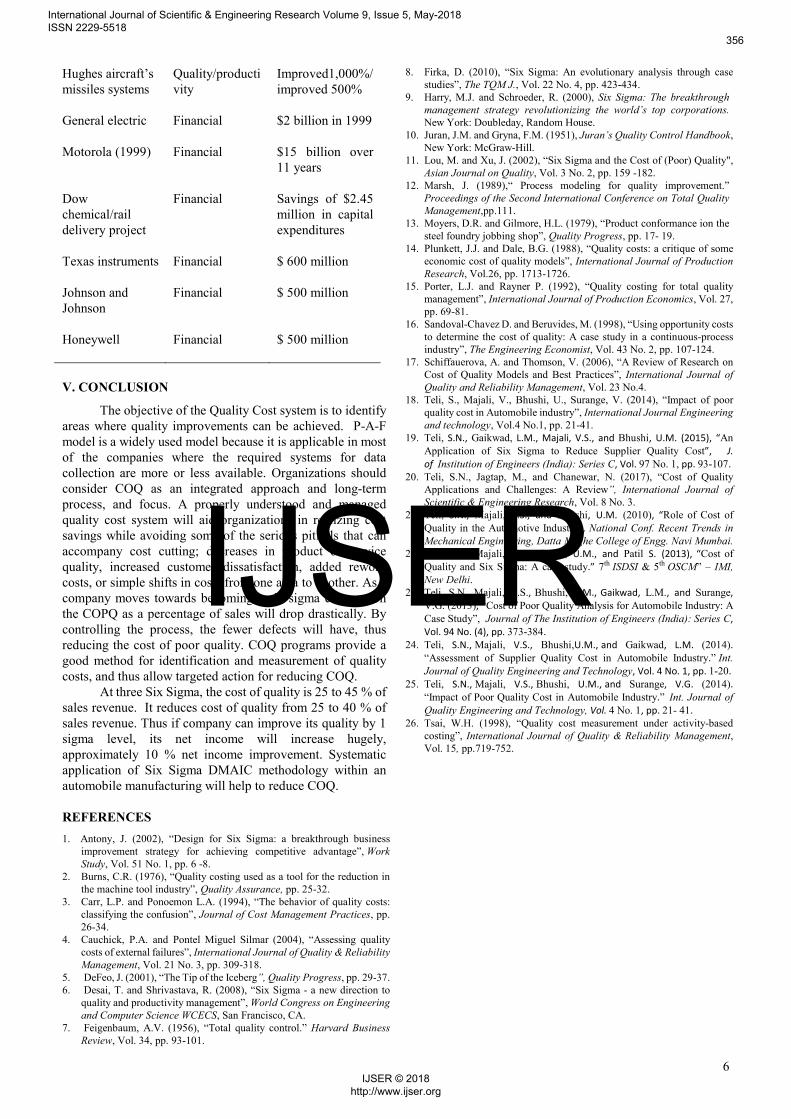
The basic statistical tools used in five phases of DMAIC methodology help identify, quantify, and eliminate the root cause of waste or rejections and sustain the improved performance of the production line with well-executed control plans in the future. DMAIC is instrumental in the implementation of Six Sigma as a process improvement methodology (Desai and Shrivastava, 2008). Figure 6 shows DMAIC methodology.
Figure 6 DMAIC Methodology Kwak and Anbari (2004) explained Six Sigma methodologies, can be used for improvement of the process called DMAIC and is a powerful tool for new-product design or improvement in the existing product design called DFSS (Design for Six Sigma). The goal is to stop the defects before they appear and reduce the cost of poor quality (COPQ) by
adopting a prediction, rather a reactive approach toward rejection and rework.
The impact this methodology has on improving business performance is dramatic and well documented. Companies around the world have implemented Six Sigma programs to: (1) Improve customer satisfaction; (2) Maximize process efficiencies; (3) Increase competitive advantage and market share; (4) Save millions of money in operating expense. All above benefits may be achieved somewhat easier and perhaps more reliably with the aid of a robust business foundation, such as an organization-wide, integrated management system, that is supported by an effective “Cost of Quality” scheme (Lou and Xu, 2002).
The objective of the Six Sigma initiative is to aggressively attack costs of a quality, e.g. inspection and warranty costs, scrap, rework and reject, can be approximated with only 10-15% of overall cost of quality. Remaining 85 to 90 % of quality costs is usually intangible and, therefore, overlooked and neglected in company’s quality cost analysis. Systematic application of six sigma DMAIC tools and methodology within an automobile parts production result with several achievements. One of them is reduced COQ (Sokovik, 2006). Table 4, illustrates the Sigma level and COPQ.
Table 4 Sigma Level and COPQ
Sigma level DPMO Quality
level COPQ (% of sales)
2 309,000 69% Over 40%
3 67,000 93.3% 25–40%
4 6,200 99.4% 15–25%
5 230 99.98% 5–10%
6 3.4 99.997% 0–5%
At three Six Sigma, the cost of quality is 25 to 45 % of sales revenue. It reduces cost of quality from 25 to 40 % of sales revenue. Sower and Quarles (2003) observed that, “It should be remembered that quality systems—not COQ systems create improvement, but without some systematic approach to tracking COQ it is more difficult to identify potential areas for improvement and to track improvement results.” Six Sigma is not like a laser-guided smart bomb, but, rather, a statistically heavy regimen of analysing problems that has saved corporations billions of dollars. Table 5 summarizes the organizations, projects, benefits, improvements, and savings by implementing the six sigma process.
Table 5 Six Sigma Benefits Company/Project Metric/Measures Benefit/Savings
Motorola (1992) In-process defect levels
150 times reduction
Raytheon/aircraft integration systems
Depot maintenance inspection time
Reduced 88% as measured in days
GE/Railcar leasing business
Turnaround time at repair shops
62% reduction
International Journal of Scientific & Engineering Research Volume 9, Issue 5, May-2018 ISSN 2229-5518
355
IJSER © 2018 http://www.ijser.org
IJSER
6
Hughes aircraft’s missiles systems
Quality/productivity
Improved1,000%/improved 500%
General electric Financial
$2 billion in 1999
Motorola (1999) Financial $15 billion over 11 years
Dow chemical/rail delivery project
Financial Savings of $2.45 million in capital expenditures
Texas instruments
Financial $ 600 million
Johnson and Johnson
Financial $ 500 million
Honeywell Financial $ 500 million
V. CONCLUSION
The objective of the Quality Cost system is to identify areas where quality improvements can be achieved. P-A-F model is a widely used model because it is applicable in most of the companies where the required systems for data collection are more or less available. Organizations should consider COQ as an integrated approach and long-term process, and focus. A properly understood and managed quality cost system will aid organizations in realizing cost savings while avoiding some of the serious pitfalls that can accompany cost cutting; decreases in product or service quality, increased customer dissatisfaction, added rework costs, or simple shifts in costs from one area to another. As a company moves towards becoming a six sigma corporation the COPQ as a percentage of sales will drop drastically. By controlling the process, the fewer defects will have, thus reducing the cost of poor quality. COQ programs provide a good method for identification and measurement of quality costs, and thus allow targeted action for reducing COQ.
At three Six Sigma, the cost of quality is 25 to 45 % of sales revenue. It reduces cost of quality from 25 to 40 % of sales revenue. Thus if company can improve its quality by 1 sigma level, its net income will increase hugely, approximately 10 % net income improvement. Systematic application of Six Sigma DMAIC methodology within an automobile manufacturing will help to reduce COQ. REFERENCES
1. Antony, J. (2002), “Design for Six Sigma: a breakthrough business improvement strategy for achieving competitive advantage”, Work Study, Vol. 51 No. 1, pp. 6 -8.
2. Burns, C.R. (1976), “Quality costing used as a tool for the reduction in the machine tool industry”, Quality Assurance, pp. 25-32.
3. Carr, L.P. and Ponoemon L.A. (1994), “The behavior of quality costs: classifying the confusion”, Journal of Cost Management Practices, pp. 26-34.
4. Cauchick, P.A. and Pontel Miguel Silmar (2004), “Assessing quality costs of external failures”, International Journal of Quality & Reliability Management, Vol. 21 No. 3, pp. 309-318.
5. DeFeo, J. (2001), “The Tip of the Iceberg”, Quality Progress, pp. 29-37. 6. Desai, T. and Shrivastava, R. (2008), “Six Sigma - a new direction to
quality and productivity management”, World Congress on Engineering and Computer Science WCECS, San Francisco, CA.
7. Feigenbaum, A.V. (1956), “Total quality control.” Harvard Business Review, Vol. 34, pp. 93-101.
8. Firka, D. (2010), “Six Sigma: An evolutionary analysis through case studies”, The TQM J., Vol. 22 No. 4, pp. 423-434.
9. Harry, M.J. and Schroeder, R. (2000), Six Sigma: The breakthrough management strategy revolutionizing the world’s top corporations. New York: Doubleday, Random House.
10. Juran, J.M. and Gryna, F.M. (1951), Juran’s Quality Control Handbook, New York: McGraw-Hill.
11. Lou, M. and Xu, J. (2002), “Six Sigma and the Cost of (Poor) Quality", Asian Journal on Quality, Vol. 3 No. 2, pp. 159 -182.
12. Marsh, J. (1989),“ Process modeling for quality improvement.” Proceedings of the Second International Conference on Total Quality Management,pp.111.
13. Moyers, D.R. and Gilmore, H.L. (1979), “Product conformance ion the steel foundry jobbing shop”, Quality Progress, pp. 17- 19.
14. Plunkett, J.J. and Dale, B.G. (1988), “Quality costs: a critique of some economic cost of quality models”, International Journal of Production Research, Vol.26, pp. 1713-1726.
15. Porter, L.J. and Rayner P. (1992), “Quality costing for total quality management”, International Journal of Production Economics, Vol. 27, pp. 69-81.
16. Sandoval-Chavez D. and Beruvides, M. (1998), “Using opportunity costs to determine the cost of quality: A case study in a continuous-process industry”, The Engineering Economist, Vol. 43 No. 2, pp. 107-124.
17. Schiffauerova, A. and Thomson, V. (2006), “A Review of Research on Cost of Quality Models and Best Practices”, International Journal of Quality and Reliability Management, Vol. 23 No.4.
18. Teli, S., Majali, V., Bhushi, U., Surange, V. (2014), “Impact of poor quality cost in Automobile industry”, International Journal Engineering and technology, Vol.4 No.1, pp. 21-41.
19. Teli, S.N., Gaikwad, L.M., Majali, V.S., and Bhushi, U.M. (2015), “An Application of Six Sigma to Reduce Supplier Quality Cost”, J. of Institution of Engineers (India): Series C, Vol. 97 No. 1, pp. 93-107.
20. Teli, S.N., Jagtap, M., and Chanewar, N. (2017), “Cost of Quality Applications and Challenges: A Review”, International Journal of Scientific & Engineering Research, Vol. 8 No. 3.
21. Teli, S.N., Majali, V.S., and Bhushi, U.M. (2010), “Role of Cost of Quality in the Automotive Industry”, National Conf. Recent Trends in Mechanical Engineering, Datta Meghe College of Engg. Navi Mumbai.
22. Teli, S.N., Majali, V.S., Bhushi, U.M., and Patil S. (2013), “Cost of Quality and Six Sigma: A case study.” 7th ISDSI & 5th OSCM” – IMI, New Delhi.
23. Teli, S.N., Majali, V.S., Bhushi, U.M., Gaikwad, L.M., and Surange, V.G. (2013), “Cost of Poor Quality Analysis for Automobile Industry: A Case Study”, Journal of The Institution of Engineers (India): Series C, Vol. 94 No. (4), pp. 373-384.
24. Teli, S.N., Majali, V.S., Bhushi,U.M., and Gaikwad, L.M. (2014). “Assessment of Supplier Quality Cost in Automobile Industry.” Int. Journal of Quality Engineering and Technology, Vol. 4 No. 1, pp. 1-20.
25. Teli, S.N., Majali, V.S., Bhushi, U.M., and Surange, V.G. (2014). “Impact of Poor Quality Cost in Automobile Industry.” Int. Journal of Quality Engineering and Technology, Vol. 4 No. 1, pp. 21- 41.
26. Tsai, W.H. (1998), “Quality cost measurement under activity-based costing”, International Journal of Quality & Reliability Management, Vol. 15, pp.719-752.
International Journal of Scientific & Engineering Research Volume 9, Issue 5, May-2018 ISSN 2229-5518
356
IJSER © 2018 http://www.ijser.org
IJSER