Embed Size (px)
Citation preview
IAEA-TECDOC-1509
Integrated approach to optimizeoperation and maintenance costs
for operating nuclear power plants
June 2006
IAEA-TECDOC-1509
Integrated approach to optimizeoperation and maintenance costs
for operating nuclear power plants
June 2006
The originating Section of this publication in the IAEA was:
Nuclear Power Engineering Section International Atomic Energy Agency
Wagramer Strasse 5 P.O. Box 100
A-1400 Vienna, Austria
INTEGRATED APPROACH TO OPTIMIZE OPERATION AND MAINTENANCE COSTS FOR OPERATING NUCLEAR POWER PLANTS
IAEA, VIENNA, 2006 IAEA-TECDOC-1509 ISBN 92–0–108006–9
ISSN 1011–4289 © IAEA, 2006
Printed by the IAEA in Austria June 2006
FOREWORD
In the context of increasingly open electricity markets and the ‘unbundling’ of generating companies from former utility monopolies, an area of major concern is the economic performance of the existing fleet of nuclear power plants. Nuclear power, inevitably, must compete directly with other electricity generation sources. Coping with this competitive pressure is a challenge that the nuclear industry should meet if the nuclear option is to remain a viable one.
This competitive environment has significant implications for nuclear plant operations, including, among others, the need for the more cost effective management of plant activities, and the greater use of analytical tools to balance the costs and benefits of proposed activities, in order to optimize operation and maintenance costs, and thus insure the economic competitiveness of existing nuclear power plants.
In the framework of the activities on Nuclear Economic Performance Information System (NEPIS), the IAEA embarked in developing guidance on optimization of operation and maintenance costs for nuclear power plants. The report was prepared building on the fundamental that optimization of operation and maintenance costs of a nuclear power plant is a key component of a broader integrated business strategic planning process, having as overall result achievement of organization’s business objectives. It provides advice on optimization of O&M costs in the framework of strategic business planning, with additional details on operational planning and controlling. This TECDOC was elaborated in 2004–2005 in the framework of the IAEA’s programme on Nuclear Power Plant Operating Performance and Life Cycle Management, with the support of two consultants meetings and one technical meeting and based on contributions provided by participants. It can serve as a useful reference for the management and operation staff within utilities, nuclear power plant operators and regulators and other organizations involved in operation of nuclear power plants.
The IAEA wishes to express its gratitude to all experts who provided contributions and to all those participating in the drafting and reviewing of this publication. The IAEA appreciates the support received from the US based Electric Utility Cost Group (EUCG) for the preparation of this TECDOC. The IAEA is particularly grateful to J. De Mella (USA) for his collaboration, assistance and his role as chairman of all the meetings held on the subject. The IAEA officer responsible for this publication is M. Condu of the Division of Nuclear Power.

EDITORIAL NOTE
The use of particular designations of countries or territories does not imply any judgement by the publisher, the IAEA, as to the legal status of such countries or territories, of their authorities and institutions or of the delimitation of their boundaries.
The mention of names of specific companies or products (whether or not indicated as registered) does not imply any intention to infringe proprietary rights, nor should it be construed as an endorsement or recommendation on the part of the IAEA.
CONTENTS
1. INTRODUCTION ............................................................................................................ 1
1.1. Background......................................................................................................... 1 1.2. Objective, scope and structure............................................................................ 2
1.2.1. Objective................................................................................................. 2 1.2.2. Scope....................................................................................................... 2 1.2.3. Structure.................................................................................................. 3
2. O&M COST OPTIMIZATION AS PART OF INTEGRATED BUSINESS STRATEGIC PLANNING............................................................................................... 3
2.1. General................................................................................................................ 3 2.2. Integrated business strategic planning cycle ...................................................... 4 2.3. Elements of integrated business strategic planning............................................ 4
3. STRATEGIC PLANNING............................................................................................... 5
3.1. Suggestions, tools and examples for strategic planning ..................................... 5
4. OPERATIONAL PLANNING ......................................................................................... 8
4.1. Define success and measures (performance indicators) ..................................... 9 4.2. Projects & prioritization (Capital/O&M) ......................................................... 10 4.3. Process improvements ...................................................................................... 10 4.4. Routine O&M activities.................................................................................... 12 4.5. Outage planning................................................................................................ 12 4.6. Develop programmes and budgets ................................................................... 12 4.7. Communications and information .................................................................... 14 4.8. Operational plan (example) .............................................................................. 14
5. RESULTS MANAGEMENT ......................................................................................... 14
5.1. Operation and measurement of results ............................................................. 14 5.2. Reporting and analysis...................................................................................... 15 5.3. Consideration for O&M costs optimization ..................................................... 15
5.3.1. Expenses computation .......................................................................... 16 5.4. Control system.................................................................................................. 16
5.4.1. Yearly planned O&M costs [$/MW·h] ................................................. 17 5.4.2. Determine actual monthly O&M costs and actual cumulated
O&M costs ............................................................................................ 18 5.4.3. Analysis of the actual O&M cost against planned................................ 19 5.4.4. Managing by forecast............................................................................ 21
5.5. Results .............................................................................................................. 22 5.6. Employee and corporate motivation for success (reward system) ................... 25
5.6.1. Linking to performance pay.................................................................. 25 5.6.2. Types of rewards................................................................................... 26 5.6.3. Non-monetary compensation................................................................ 26 5.6.4. Corporate versus plant versus department goals................................... 27 5.6.5. Setting performance targets .................................................................. 27 5.6.6. Criteria for reward ................................................................................ 28
5.7. Taking corrective actions.................................................................................. 29
402402
5.7.1. Warehouse stock ................................................................................... 30 5.7.2. Other information from O&M cost structure........................................ 31
5.8. Specific cases for companies with NPP fleets.................................................. 32
6. CONCLUSIONS ............................................................................................................ 33
REFERENCES......................................................................................................................... 35
GLOSSARY............................................................................................................................. 37
CONTRIBUTORS TO DRAFTING AND REVIEW ............................................................. 39
CONTENTS OF THE ATTACHED CD-ROM
ANNEX 1: STRATEGIC BUSINESS PLAN: 1996–2000 — EXAMPLE
ANNEX 2: YEARLY BUDGET — EXAMPLE
ANNEX 3: NUCLEAR DIVISION FISCAL YEAR 2006 OPERATIONAL PLAN — EXAMPLE
ANNEX 4: APPLICATION OF PERFORMANCE CONTROL SYSTEM BASED ON COST CENTERS OPERATION — EXAMPLE
ANNEX 5: ASSESSING THE EXTENT OF ACHIEVING ORGANIZATION/TEAM/EMPLOYEE OBJECTIVES— EXAMPLE
ANNEX 6: SETTING KEY PERFORMANCE INDICATORS MEASURING THE TARGETS
ANNEX 7: BUDGET EXECUTION/REVISION — EXAMPLE
ANNEX 8: RESULTS MANAGEMENT FOR A SINGLE UNIT STATION WITH A PHWR REACTOR — EXAMPLE
1. INTRODUCTION
1.1. Background
Some years ago most of the power markets were regulated and dominated by some vertically integrated electric utilities, having exclusive licensed franchises. Typically, in such markets, the economic regulator sets the business and pricing practices. Electricity price is usually set by the power company and includes all the costs incurred plus a profit margin for the utility and is subject to approval by an economic regulator. In this environment the best solution for any particular problem is characterized by its technical superiority or its effectiveness in solving that problem. Compliance with other environmental, social and safety regulations has often focused on optimizing technical performance on a cost-plus rather than cost effective basis. Since costs can be passed on to the customers, there is a reduced incentive to manage costs, however solutions with non-monetary benefits, i.e. environmental, are often implemented in this context.
From the perspective of nuclear power plant management, profit or return on investment was either not of particular concern or it was simply expected and to some degree assured through the various regulatory processes governing electric rate design. Clearly, the key financial measures and metrics of supply, demand and profitability were viewed at the regulatory and utility corporate level but infrequently integrated within the management decision processes at the operating nuclear plant level. Plant safety and reliability were most often the sole determinants of management decision-making and consequently the focus of key performance measures of success [1].
In today’s competitive markets prices are generally set by market condition. In the context of the deregulation1, of increasingly open electricity markets and the “unbundling” of generating companies from former utility monopolies, power generators have to compete with each other to generate electricity and auction it on the market. Coping with this competitive pressure is a challenge that the nuclear industry should meet if the nuclear option is to remain a viable one. This competitive environment has significant implications for plant operations, including, among others, focusing the management objectives on efficient operation as the key to profitability. The best solution in this competitive framework is characterized by its economic superiority or its cost effectiveness.
The business and financial success of operating nuclear plants must be considered to a much greater extent along with the successful achievement of safety and reliability objectives. In developing strategic and operational goals, nuclear plant managers will be required to embrace and articulate clear and measurable business objectives and goals which not only assure the achievement of safety and reliability but also eliminate unnecessary costs and identify investment opportunities. These goals must, in addition, balance operating and safety risk while maximizing plant revenues, earnings and ultimately insure the profitability of electric generating facilities [1].
1 Deregulation is defined in Ref. [2] as “a restructuring of the rules and economic incentives that governments set up to control and drive the electric power industry”.
1
To be profitable in a competitive market, adequately reimburse the investors and satisfy neighbouring communities or municipalities in the plants vicinity, nuclear power plants might consider addressing the following parameters, intrinsic to the corporate targets and goals:
— Maximize/optimize (as applicable) number of megawatt hours (MW·h) delivered during the year. High availability has always been recognized as being a key to nuclear competitiveness, as it allows fixed costs to be spread more thinly. It is to be noted that, high availability is not sufficient by itself to guarantee competitiveness.
— Maximize revenues received through the selling of generated electricity (e.g. by planning outages to occur in periods when electricity price is low).
— Optimize2 the operating and maintenance (O&M) costs3 per produced energy unit (MW·h) without jeopardizing nuclear safety and technical performance. The situation is different for every plant. In some cases, availability can be maintained at the existing level with lower overall O&M spending by targeting expenditures more appropriately. Increased O&M spending would be justified if cost effective extra output were produced.
1.2. Objective, scope and structure
1.2.1. Objective
The optimization of O&M costs of nuclear power plants (NPPs) is a key component of a broader integrated business planning process having as result achievement of organization’s business objectives.
In this context, the objective of this report is to provide guidance and methodology for the NPP management (and/or to production/operation departments for the case of big utilities) on planning, developing and implementing a process for O&M cost optimization, integrated with organization’s business process to help ensuring the economic competitiveness of operating plants and achievement of organization’s overall objectives.
1.2.2. Scope
The main scope of this publication considers the optimization of plant non-fuel O&M costs. However there are some considerations on several interrelations (integration) of certain capital expenditures with O&M costs. 2 Generic, the goal of the optimization of a process is to determine the necessary input values to obtain a desired output. 3 O&M costs are defined as those costs needed to operate and maintain a facility [3]. For the purpose of this publication O&M [cost/MWh] is defined as total O&M cost divided by or net generation. It is generally accepted to divide the total O&M cost in three components: • Non-fuel and non-capital costs or briefly O&M costs, • Fuel costs, and • Capital costs or capital additions (costs that have to be depreciated or are eligible for depreciation). As part of the development of Nuclear Economic Performance System (NEPIS) the IAEA, in cooperation with the US based Electric Utility Cost Group (EUCG), developed a standardized breakdown O&M cost structure including definitions [3]. These cost definitions are used by re than 90 NPPs providing O&M cost data to IAEA’s NEPIS and EUCG’s Nuclear Integrated Information Database (NIID) and for this reason it was decided to use the same definitions throughout IAEA publications.
2
The IAEA has published a number of reports on cost effective maintenance, outage optimization, and other similar topics [4–12] and this TECDOC is intended to supplement and build on them.
1.2.3. Structure
This TECDOC consists of six chapters, one appendix and eight annexes. The detailed list of annexes is given in the appendix and their full texts are on the CD ROM attached to the back cover of the TECDOC.
2. O&M COST OPTIMIZATION AS PART OF INTEGRATED BUSINESS STRATEGIC PLANNING
2.1. General
Integrated business strategic planning is a management tool used to help an organization to focus its energy, to ensure that members of the organization are working toward the same goals, to assess and adjust the organization's direction in response to a changing environment4. In other words, integrated business strategic planning is a systematic process through which an organization agrees on and builds commitment among key stakeholders to priorities, which are essential to its mission and responsive to the operating environment
Within the context of this report, the use of the word integrated, as applied to integrated strategic business planning is intentionally chosen and used throughout the report to embody several, essential aspects of the business planning process as it relates to the management and business cycle of nuclear power plants.
First and foremost, integrated implies that the processes discussed throughout the report include, in addition to the strategic elements of a traditional business plan, the more detailed aspects of an organizations operational planning and budgeting processes. Furthermore, the use of the word ‘integrated’ is intended to suggest that the operational plans and budgets are substantially and uniquely aligned with the organizations strategic directions and goals.
Consequently, it follows that the optimization of a nuclear plant’s O&M costs can only be achieved if strategic goals are well established, clearly defined and successfully institutionalized throughout the plant and corporate organizations and the detailed action plans and budgets of the plant’s organization are consistent with and clearly aligned with plant and corporate strategic directions.
Further, a second key implication intended by the use of the word integrated, which also leads to the optimization of nuclear plant O&M cost, deals with the extent that the nuclear organization participates in and takes ownership of the integrated planning process. The nuclear plant’s strategic plan should not be prepared by a small business or strategic planning group and simply published for all to read, but rather it should be a process that all key 4 Additional details on strategic/operational business planning could be found in a wide number of books such as [13]) and Internet web sites such as [14]. For convenience, definitions of most used terms were gathered in the attached glossary.
3
decision makers and organizational leaders actively participate in. The ultimate and lasting value of integrated strategic business planning comes from having participated in the process as opposed to having just published a planning document. The business plan, its strategic elements as well as its tactical details, the operational plans and budgets, must be embraced and accepted throughout the nuclear plant’s organization. The communication of the plan to the entire nuclear organization is essential if “day to day” activities and action plans are to be aligned consistently with the organization’s strategic goals. The ownership of a nuclear plants business plan must be embodied throughout the organization, from working to executive levels through frequent communication, not only for the development of goals and action plans but also for their accomplishment.
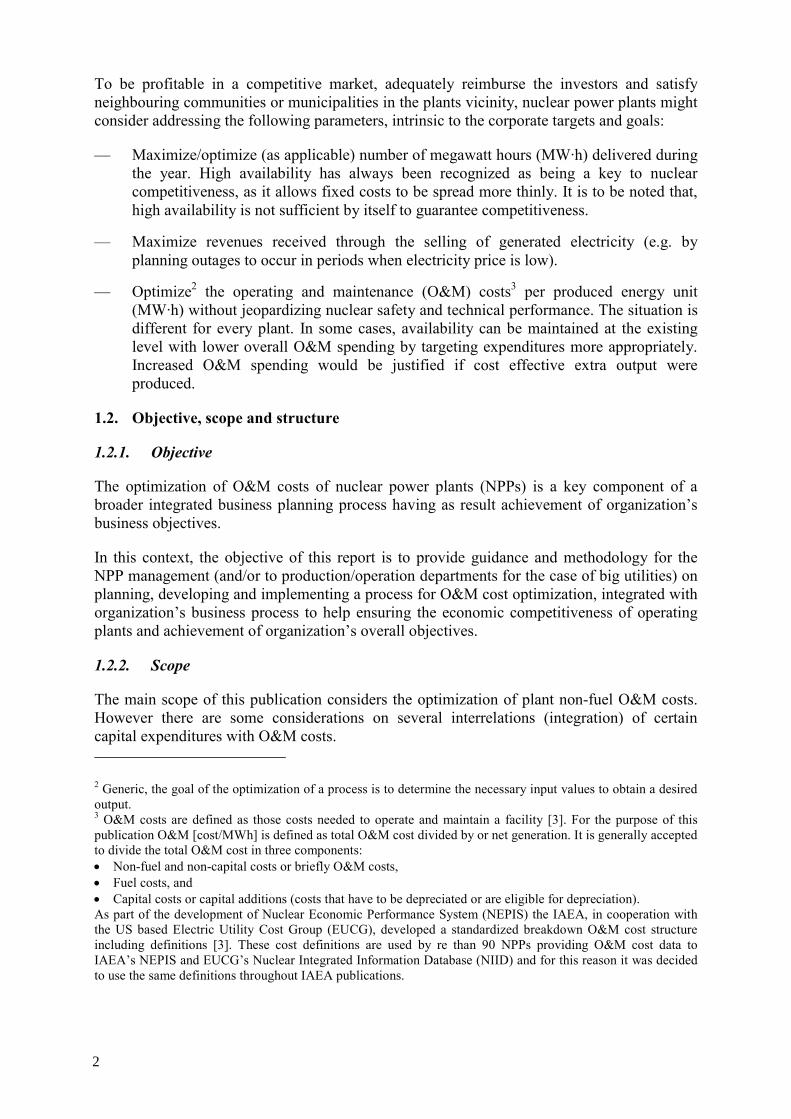
2.2. Integrated business strategic planning cycle
FIG. 1. Integrated business strategic planning cycle.
As described above an integrated business strategic planning process links strategic targets with tactical and operational planning on all hierarchy levels of the organization. All downstream plans get specific business targets, in order to ensure the adherence of strategic targets. Strategic planning is a living process integrated in the organization [15].
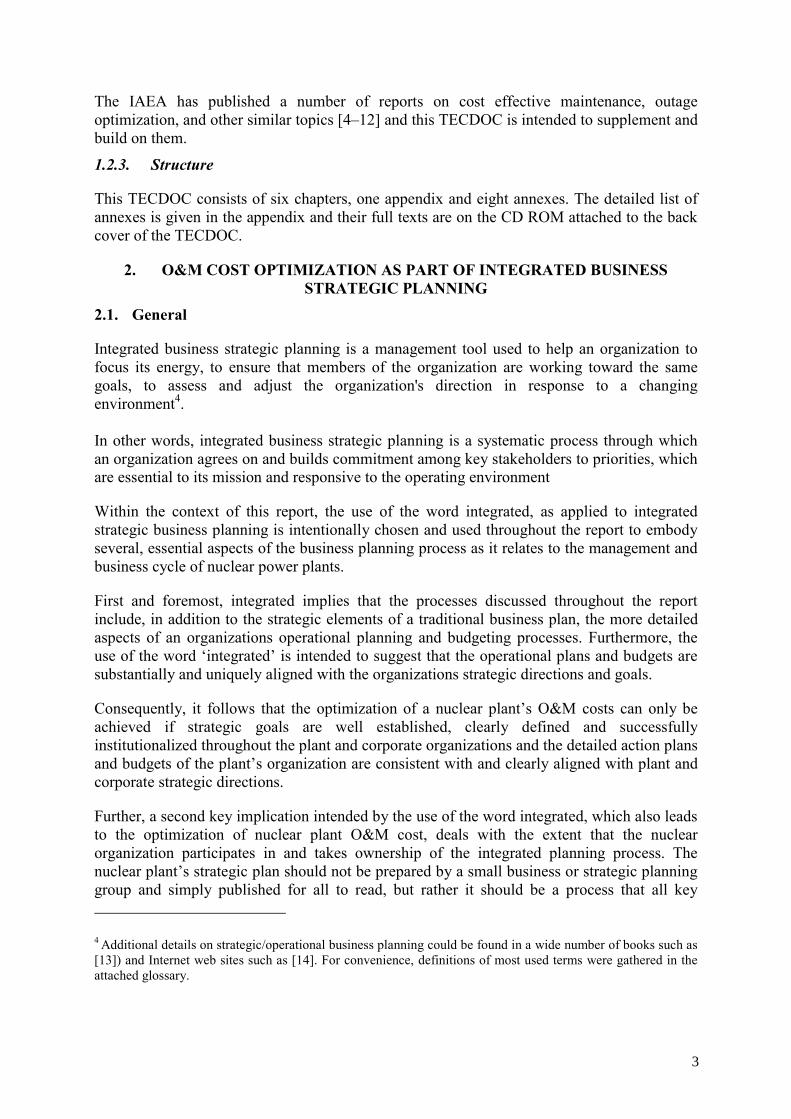
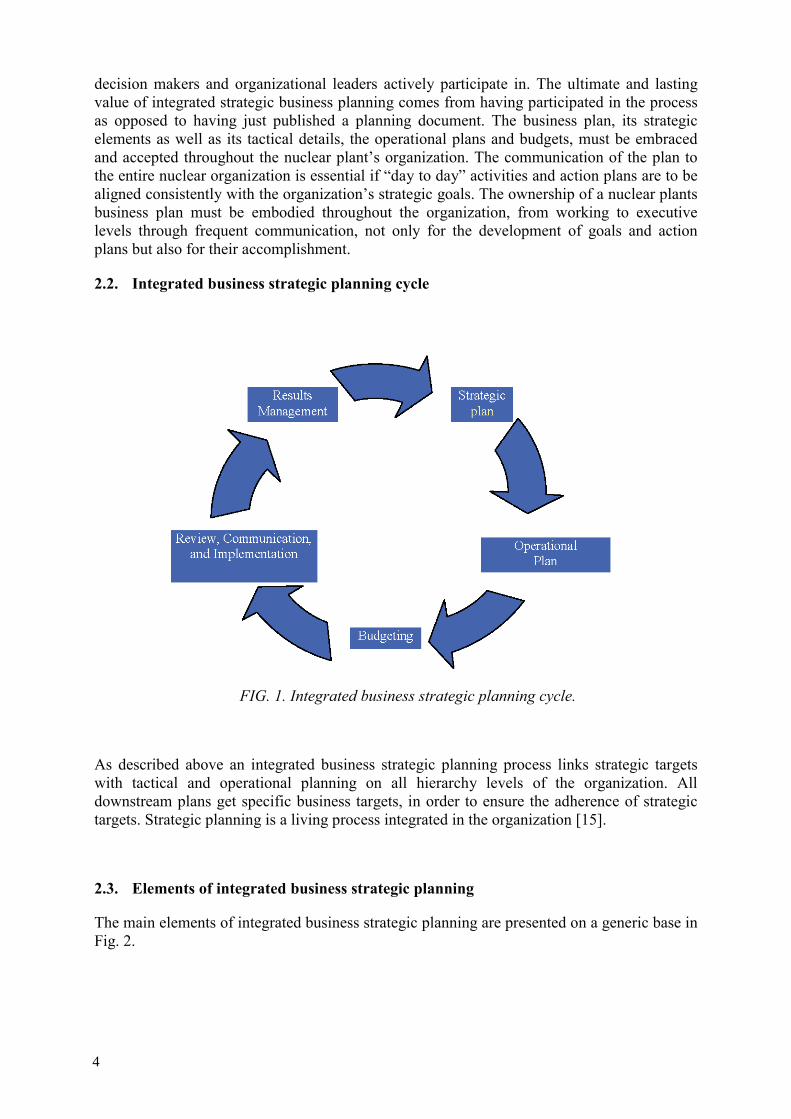
2.3. Elements of integrated business strategic planning
The main elements of integrated business strategic planning are presented on a generic base in Fig. 2.
4
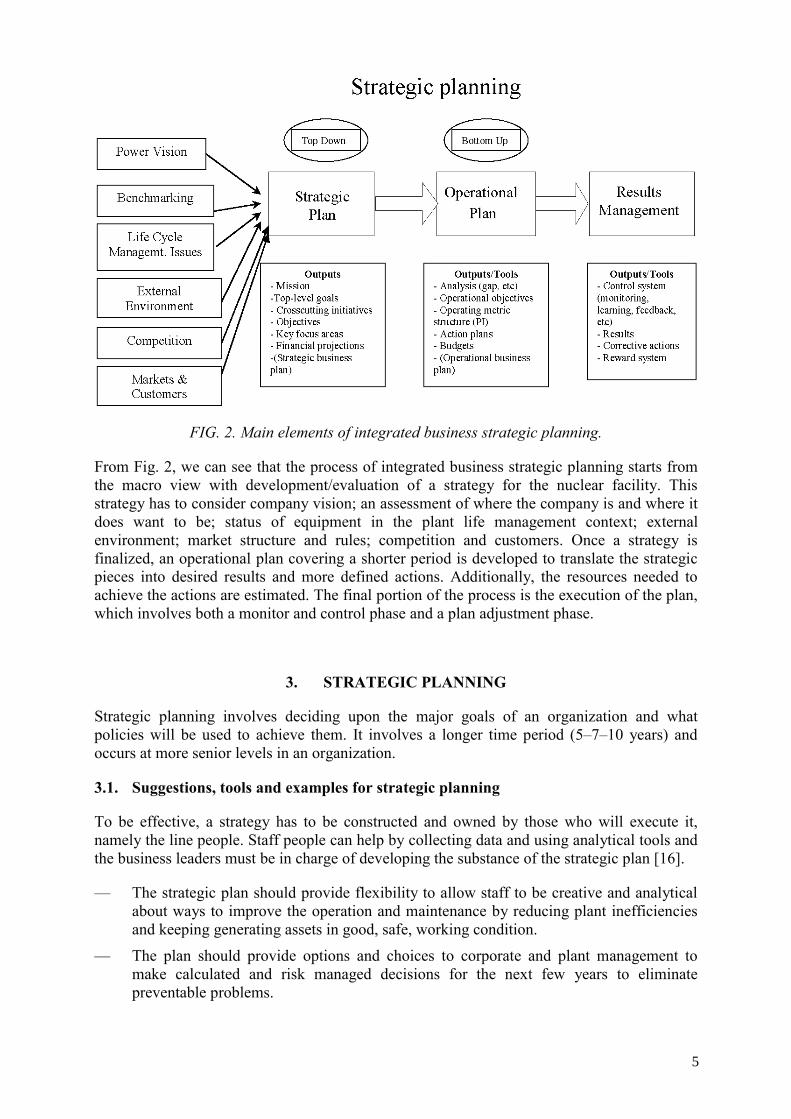
FIG. 2. Main elements of integrated business strategic planning.
From Fig. 2, we can see that the process of integrated business strategic planning starts from the macro view with development/evaluation of a strategy for the nuclear facility. This strategy has to consider company vision; an assessment of where the company is and where it does want to be; status of equipment in the plant life management context; external environment; market structure and rules; competition and customers. Once a strategy is finalized, an operational plan covering a shorter period is developed to translate the strategic pieces into desired results and more defined actions. Additionally, the resources needed to achieve the actions are estimated. The final portion of the process is the execution of the plan, which involves both a monitor and control phase and a plan adjustment phase.
3. STRATEGIC PLANNING
Strategic planning involves deciding upon the major goals of an organization and what policies will be used to achieve them. It involves a longer time period (5–7–10 years) and occurs at more senior levels in an organization.
3.1. Suggestions, tools and examples for strategic planning
To be effective, a strategy has to be constructed and owned by those who will execute it, namely the line people. Staff people can help by collecting data and using analytical tools and the business leaders must be in charge of developing the substance of the strategic plan [16].
— The strategic plan should provide flexibility to allow staff to be creative and analytical about ways to improve the operation and maintenance by reducing plant inefficiencies and keeping generating assets in good, safe, working condition.
— The plan should provide options and choices to corporate and plant management to make calculated and risk managed decisions for the next few years to eliminate preventable problems.
5
— It should consider a careful assessment of external and internal environments (market, competition, regulation, corporate vision, technical status of the plant, etc.).
— Always have a backup plan prepared in case the main one looks less probable to succeed during the implementation phase.
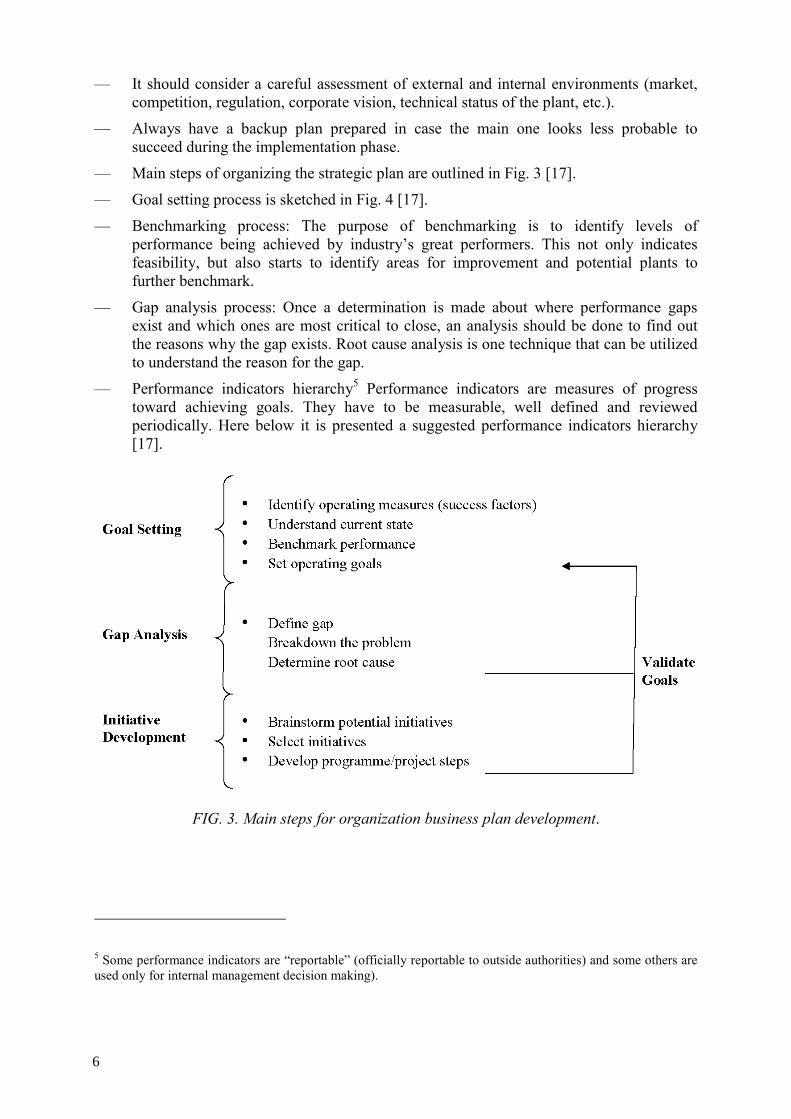
— Main steps of organizing the strategic plan are outlined in Fig. 3 [17].
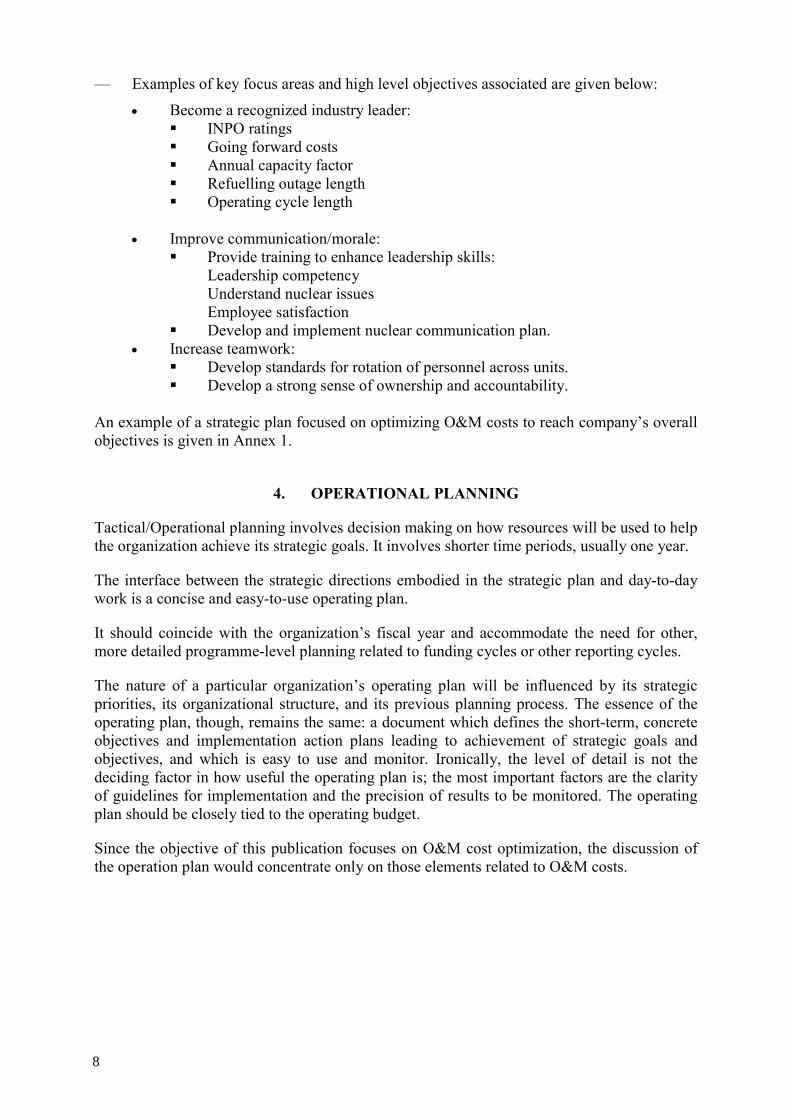
— Goal setting process is sketched in Fig. 4 [17].
— Benchmarking process: The purpose of benchmarking is to identify levels of performance being achieved by industry’s great performers. This not only indicates feasibility, but also starts to identify areas for improvement and potential plants to further benchmark.
— Gap analysis process: Once a determination is made about where performance gaps exist and which ones are most critical to close, an analysis should be done to find out the reasons why the gap exists. Root cause analysis is one technique that can be utilized to understand the reason for the gap.
— Performance indicators hierarchy5 Performance indicators are measures of progress toward achieving goals. They have to be measurable, well defined and reviewed periodically. Here below it is presented a suggested performance indicators hierarchy [17].
FIG. 3. Main steps for organization business plan development.
5 Some performance indicators are “reportable” (officially reportable to outside authorities) and some others are used only for internal management decision making).
6
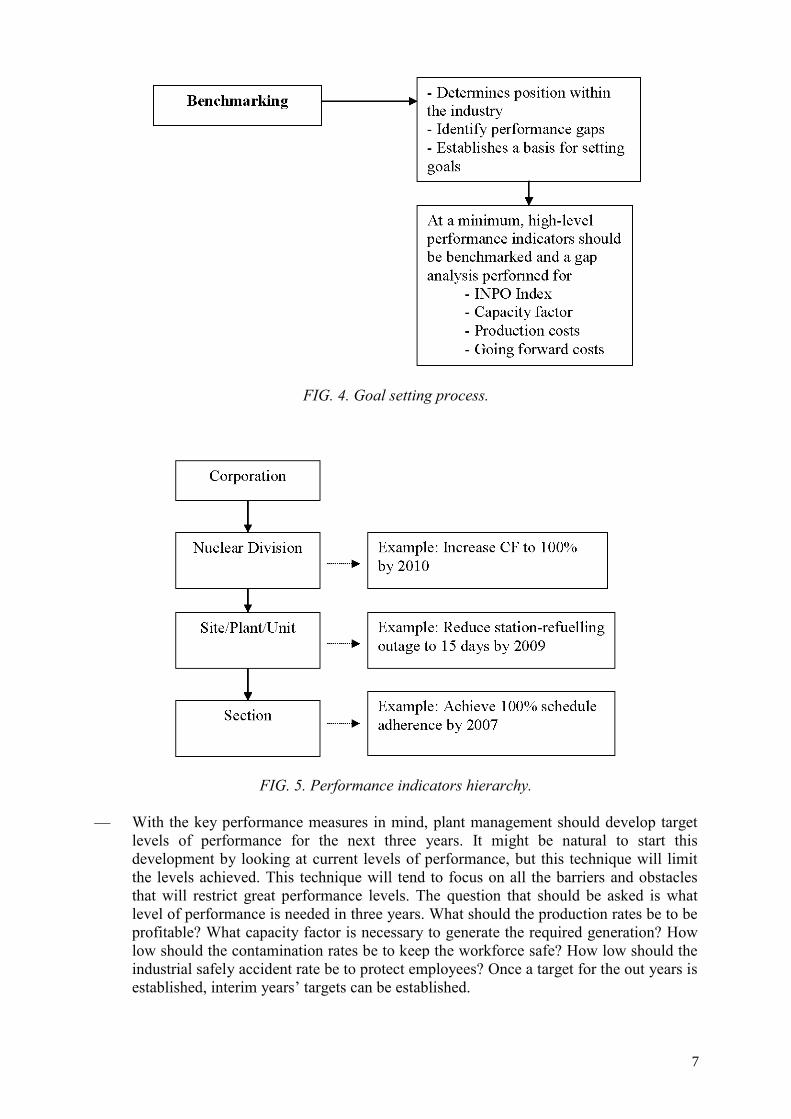
FIG. 4. Goal setting process.
FIG. 5. Performance indicators hierarchy.
— With the key performance measures in mind, plant management should develop target levels of performance for the next three years. It might be natural to start this development by looking at current levels of performance, but this technique will limit the levels achieved. This technique will tend to focus on all the barriers and obstacles that will restrict great performance levels. The question that should be asked is what level of performance is needed in three years. What should the production rates be to be profitable? What capacity factor is necessary to generate the required generation? How low should the contamination rates be to keep the workforce safe? How low should the industrial safely accident rate be to protect employees? Once a target for the out years is established, interim years’ targets can be established.
7
— Examples of key focus areas and high level objectives associated are given below:
• Become a recognized industry leader: INPO ratings Going forward costs Annual capacity factor Refuelling outage length Operating cycle length
• Improve communication/morale:
Provide training to enhance leadership skills: Leadership competency Understand nuclear issues Employee satisfaction
Develop and implement nuclear communication plan. • Increase teamwork:
Develop standards for rotation of personnel across units. Develop a strong sense of ownership and accountability.
An example of a strategic plan focused on optimizing O&M costs to reach company’s overall objectives is given in Annex 1.
4. OPERATIONAL PLANNING
Tactical/Operational planning involves decision making on how resources will be used to help the organization achieve its strategic goals. It involves shorter time periods, usually one year.
The interface between the strategic directions embodied in the strategic plan and day-to-day work is a concise and easy-to-use operating plan.
It should coincide with the organization’s fiscal year and accommodate the need for other, more detailed programme-level planning related to funding cycles or other reporting cycles.
The nature of a particular organization’s operating plan will be influenced by its strategic priorities, its organizational structure, and its previous planning process. The essence of the operating plan, though, remains the same: a document which defines the short-term, concrete objectives and implementation action plans leading to achievement of strategic goals and objectives, and which is easy to use and monitor. Ironically, the level of detail is not the deciding factor in how useful the operating plan is; the most important factors are the clarity of guidelines for implementation and the precision of results to be monitored. The operating plan should be closely tied to the operating budget.
Since the objective of this publication focuses on O&M cost optimization, the discussion of the operation plan would concentrate only on those elements related to O&M costs.
8
.
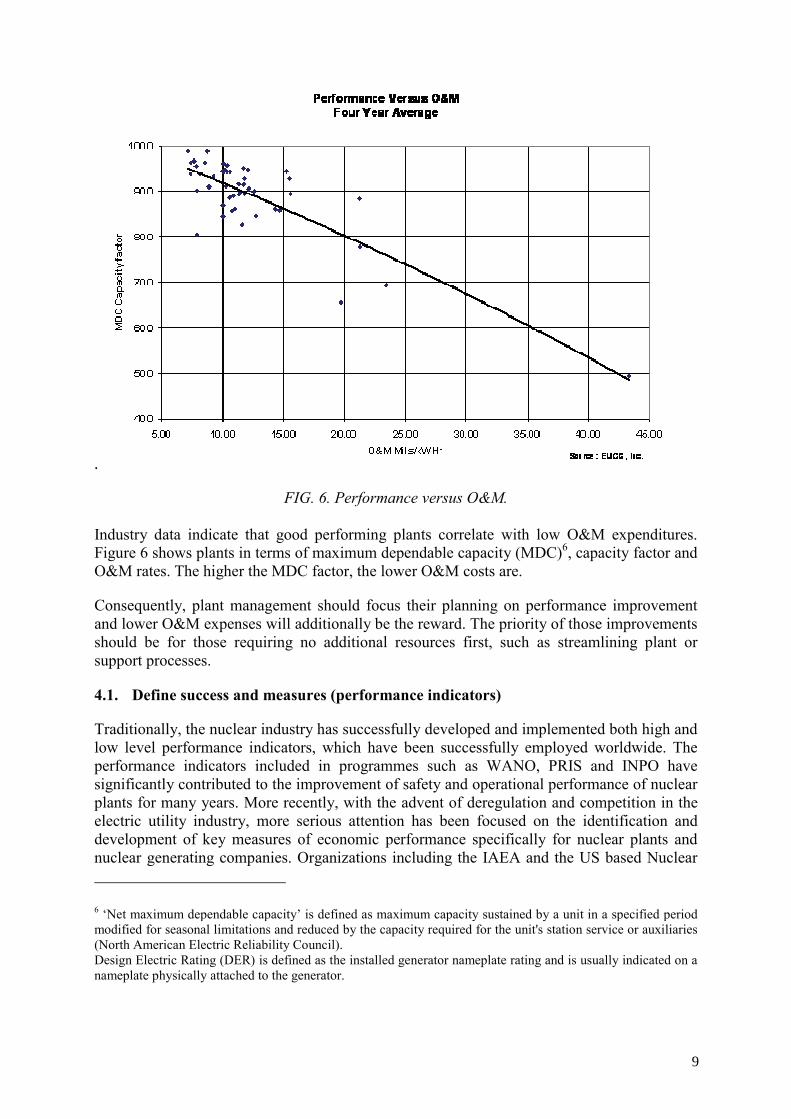
FIG. 6. Performance versus O&M.
Industry data indicate that good performing plants correlate with low O&M expenditures. Figure 6 shows plants in terms of maximum dependable capacity (MDC)6, capacity factor and O&M rates. The higher the MDC factor, the lower O&M costs are.
Consequently, plant management should focus their planning on performance improvement and lower O&M expenses will additionally be the reward. The priority of those improvements should be for those requiring no additional resources first, such as streamlining plant or support processes.
4.1. Define success and measures (performance indicators)
Traditionally, the nuclear industry has successfully developed and implemented both high and low level performance indicators, which have been successfully employed worldwide. The performance indicators included in programmes such as WANO, PRIS and INPO have significantly contributed to the improvement of safety and operational performance of nuclear plants for many years. More recently, with the advent of deregulation and competition in the electric utility industry, more serious attention has been focused on the identification and development of key measures of economic performance specifically for nuclear plants and nuclear generating companies. Organizations including the IAEA and the US based Nuclear 6 ‘Net maximum dependable capacity’ is defined as maximum capacity sustained by a unit in a specified period modified for seasonal limitations and reduced by the capacity required for the unit's station service or auxiliaries (North American Electric Reliability Council). Design Electric Rating (DER) is defined as the installed generator nameplate rating and is usually indicated on a nameplate physically attached to the generator.
9
Energy Institute (NEI) recently evaluated a number of economic performance indicators which may have application and promise as key measures of economic success at nuclear facilities. In defining the measures of success for nuclear strategic and operational plans, all of the traditional (safety and operational) as well as the economic performance indicators discussed above are candidates for key measures of success at nuclear plants. The IAEA recently published Economic Performance Indicators for Nuclear Power Plants [10], which includes specific examples including detailed definitions of these measures.
4.2. Projects & prioritization (Capital/O&M)
A priority system should be developed and utilized by management to assist in the selection and approval of capital and O&M projects.
Generally, more projects will be proposed than available resources will allow. A system of priorities can assist plant management to choose the most beneficial projects, which significantly contribute to the achievement of plant goals and objectives.
The development of priorities for the selection of capital and O&M projects must be aligned to the strategic objectives prescribed in the integrated business plan. Ideally, the system should encourage the selection of projects whose value contribution to the achievement of strategic goals is high and necessary. Conversely, it should discourage the selection of projects, which add little value to achieving plant goals.
Although many projects may be proposed which have the potential to contribute value towards the achievement of strategic goal, the priority system should not encourage selection of projects if the goal is substantially achieved.
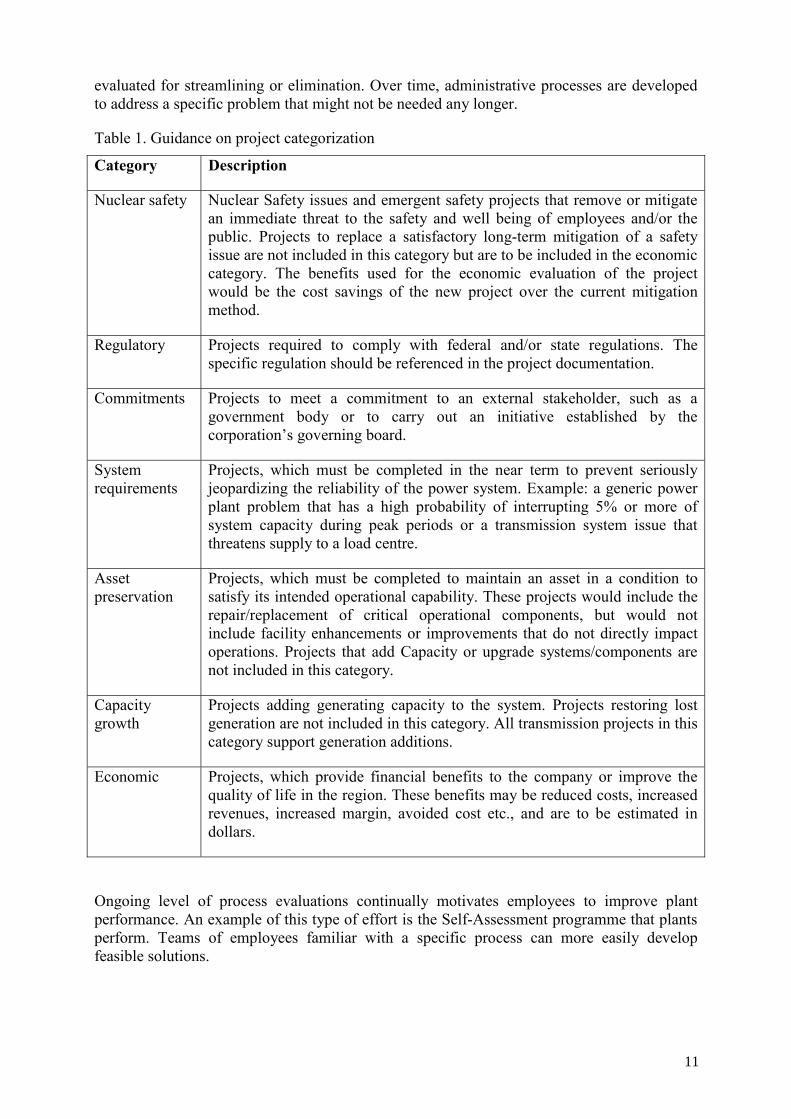
Projects should be categorized based on their reason(s) for selection. As an example, Table 1 could be used as a guide to assist plant management in the development of a project priority system. The categories and descriptions identified below should be adjusted to suit specific company and plant conditions.
Within these categories, projects should be ranked by an economic factor, such as internal rate of return. As one could see, the categories listed are a priority and funding should be focused on the more critical needs of the corporation or plant. When it’s necessary to eliminate projects based on resource limitations, the cut off line can be drawn within each area.
Since cash borrowed for capital adds future expenses to the corporation management should refrain from encouraging accounting classifications from O&M to Capital for the intension of reducing current year’s production cost. A better practice is to let the accountants make those determinations, since they are more acquainted with the accounting rules of the local authorities. Plant management and technical staffs’ critical job is to evaluate and prioritize all work and perform that work that is necessary for safely operating the plant or has longer term benefit to plant assets.
4.3. Process improvements
Through the year and particularly during planning cycles, key plant processes should be benchmarked with high performing plants to identify opportunities for improvement. Process improvements should be planned to address vital plant processes. Those solutions should be focused on low or no cost solutions first. Processes not vital to plant operations should be
10
evaluated for streamlining or elimination. Over time, administrative processes are developed to address a specific problem that might not be needed any longer.
Table 1. Guidance on project categorization
Category Description
Nuclear safety Nuclear Safety issues and emergent safety projects that remove or mitigate an immediate threat to the safety and well being of employees and/or the public. Projects to replace a satisfactory long-term mitigation of a safety issue are not included in this category but are to be included in the economic category. The benefits used for the economic evaluation of the project would be the cost savings of the new project over the current mitigation method.
Regulatory Projects required to comply with federal and/or state regulations. The specific regulation should be referenced in the project documentation.
Commitments Projects to meet a commitment to an external stakeholder, such as a government body or to carry out an initiative established by the corporation’s governing board.
System requirements
Projects, which must be completed in the near term to prevent seriously jeopardizing the reliability of the power system. Example: a generic power plant problem that has a high probability of interrupting 5% or more of system capacity during peak periods or a transmission system issue that threatens supply to a load centre.
Asset preservation
Projects, which must be completed to maintain an asset in a condition to satisfy its intended operational capability. These projects would include the repair/replacement of critical operational components, but would not include facility enhancements or improvements that do not directly impact operations. Projects that add Capacity or upgrade systems/components are not included in this category.
Capacity growth
Projects adding generating capacity to the system. Projects restoring lost generation are not included in this category. All transmission projects in this category support generation additions.
Economic Projects, which provide financial benefits to the company or improve the quality of life in the region. These benefits may be reduced costs, increased revenues, increased margin, avoided cost etc., and are to be estimated in dollars.
Ongoing level of process evaluations continually motivates employees to improve plant performance. An example of this type of effort is the Self-Assessment programme that plants perform. Teams of employees familiar with a specific process can more easily develop feasible solutions.
11
4.4. Routine O&M activities
Routine O&M should be constant from year to year with consideration only made for future escalation and process improvements results. These activities are easily estimated using current actual expenses, staffing and work activities. Plant management should insist that all impacts on routine O&M as a result of capital improvements or process improvements be acknowledged and included, when the plan for routine O&M is developed.
4.5. Outage planning
Outages are typically a combination of base outage work and projects that require outages to be implemented. For this category of work, evaluation of overtime to achieve shorter durations should be analysed relative to the cost of purchased replacement power, given that planned outages are conducted during lower demand times of the year. It has been discovered that it can sometimes be less expensive to forgo the additional labour cost and delay the return to service date a few days rather than pay inflated overtime-labour rates. Additionally, cost effectiveness can be obtained through shifting some work activities to pre-outage time periods. Mock-ups, simulation and training also help to reduce outage time. Please refer to Good Practices for Outage Management in Nuclear Power Plants [11] and Nuclear Power Plant Outage Optimization Strategies [12] for additional information about managing outages.
4.6. Develop programmes and budgets
At the end of the current fiscal year (generally in the months of October and November) each organization has to prepare the business operational plan for the next year, to implement corporate and plant strategies developed as part of the integrated strategic business planning process.
The operational plan consists of a series of programmes covering the main following areas:
(1) Production programme including yearly planned outage: This programme clearly presents the amount of power to be delivered to clients, duration of planned and estimation of unplanned outages in days, goods and services needed to produce the planned amount of power in a safe manner and to maintain the plant in good physical condition.
(2) Plant technical programme: It establishes actions and measures for solving technical issues in the area of equipment reliability, configuration control, performance monitoring, etc., as well as identifying the resources to be used.
(3) Capital investment programme: It addresses all improvements, modifications and new items to be purchased and implemented in order to maintain the plant as per licensing requirements and to follow the corporate development strategy.
(4) Human resources, training and licensing programme.
(5) Health and industrial safety programme.
(6) Environmental programme.
(7) Communication, public relations and image programme.
12
In the budgeting process, the plans are translated into monetary terms by responsibility centres7. The process of developing a budget is one in which the managers of responsibility centres negotiate for resources required to achieve their objectives.
The final budget is a statement of resources needed to achieve operational objectives at responsibility centres and full organization levels.
Expense centres may be categorized according to the nature of the expenditures incurred in the centre. Following the organization’s structure and hierarchy, a NPP might have, for example, the following categories of expense centres: operation, maintenance, fuel handling, chemistry, technical, radiation protection, material control, finance and accounting, training, etc.
It is a good practice to prepare and analyse budgets at a summary level rather than at very detailed expenses’ level (An example is budgeting labour: normal and overtime estimation, including benefits would be more convenient to work with than adding more details such as premium pay, shift differential, etc.). During budget review/approval process, support documentation with detailed expenses breakdown can supplement the funding request when needed. However, it is strongly advised to identify those controllable costs, such as contractor staffing, overtime and consumables, to facilitate monitoring and quick corrective action if and when it is needed.
A good practice is to begin budgeting expenses at the plant level using the previous years experience following the proposed structure:
(A) Salary expenses (B) Travel expenses (C) Training expenses (D) Capital investments (E) Inventory assets (F) Consumables expenses (not including nuclear fuel) (G) Spare parts expenses (H) Contracted services, taxes (I) Miscellaneous expenses, other obligations. A further breakdown of these elements can be carried out to further facilitate estimation process.
Material expenses estimated in the budget (inventory assets, consumables and spare parts) have to cover both what is physically used in the plant (usually determined on monthly basis through a data collection procedure) and that needed to renew warehouse stocks.
To draft the expenses budget, at plant level, one must consider financial expenses and amortization. This would facilitate further assessing the equilibrium between estimated operating revenues and expenses and also forecasting the profit.
7 In order to enhance control performance system, a good practice is to structure an organization in profit/cost responsibility centres7, which imply developing, budgets using the same approach – see Section 3.4.
13
In the process of drafting the operational budget, every department/responsibility centre in the plant fills in standardized forms estimating the expenses necessary to cover all activities and commitments to be carried out in order to achieve objectives. Then, Finance Department sums all proposals and check totals against estimated resources. Usually, a number of iterations are necessary in the process of management review.
After the management approves the budget this one is distributed into the organization for execution.
An example of a yearly budget structure is given in Annex 2. 4.7. Communications and information
Good communication with all employees and organizations involved is essential for the successful implementation of an operating plan. Management should conduct regular meetings with stakeholders to discuss achievements and upcoming challenges.
Regular communication with employees through face-to-face meetings, newsletters or small roundtable meetings helps reinforce the expectations throughout the year and allows management to acknowledge good results, as they are achieved. Additionally, employees can use this as an opportunity to ask questions about priorities or make suggestions that management can consider. Additionally, this activity is an employee motivator, because employees feel they are part of the plant team.
Steps related to operating and measuring, and reporting and analysing are developed in the next chapter.
4.8. Operational plan (example)
An example of an operational plan is given in Annex 3.
5. RESULTS MANAGEMENT
As part of the integrated strategic business planning process, results management provides the management team with an ongoing mechanism (process) for monitoring implementation of strategic and operational plans and controlling results. In other words, actual performance is compared against the planned one. Additionally, it provides a mechanism to adjust plans to take into considerations changing conditions, if any.
5.1. Operation and measurement of results
Resources actually consumed (expenses) and revenue earned during operation are recorded. These records are structured using financial accounting (cost by elements). The results are used as the basis for future estimation. Data might also be categorized by responsibility centres. In this case the results are used to measure the performance of responsibility centre management. Results are illustrated in different ways: tables, graphs, etc., showing the trends. There are different techniques, but the recommended one is the trend approach, allowing an easy visualisation of the tendency.
14
5.2. Reporting and analysis
Control reports are coming from an analysis that compares actual performance with budgeted (planned) performance and attempts to explain the difference (variance). It is the plant management’s responsibility to assign to dedicated groups in the plant the task of preparation of analysis reports. These reports are typically issued on a monthly basis for results achieved during the previous months. Management could also decide how often to request analysis reports for a specific period of operation, for example during the outage, daily, weekly, etc.
Based on these formal reports, in conjunction with personal observations and other informally communicated information, the management decides what action, if any, should be taken. For example, the management might decide to revise the budget within approved limits and adjusting accordingly some programmes, etc.
Sometimes this is done at the plant level and sometimes at a higher level (such as head office), as some independence is needed making these decisions.
The preparation of management reports is delegated by the plant management to a dedicated group. It is a good practice to do monthly reporting except for some specific cases (such as selected data during an outage) where daily reporting is recommended.
5.3. Consideration for O&M costs optimization
Basically the process of optimising O&M costs consists of comparing planned costs against actual costs at different moments during a time frame of consideration.
Usually three types of accounting information are used in any business:
(i) Operation information, which has to do with the details of operation,
(ii) Financial accounting information, which is used both by management and by external accounting parties and
(iii) Management accounting information, sometimes called cost management information, which is used internally for control, coordination and planning.
A considerable amount of information produced in the day-to-day operations. Operation information provides the raw material from which financial and management accounting are constructed. Most of the time NPP management deals mainly with management accounting information.
Both financial and management accounting use an additional categorization of costs usually known as categorization by cost elements. For a NPP, O&M cost elements are usually: materials (except nuclear fuel), labour services and taxes8.
8 Due to the specific conditions for nuclear fuel purchase for different electric utilities, it has been decided to exclude nuclear fuel from materials expenses. However, elements like salaries and services expenses will include fuel handling and maintenance of refuelling facilities. Also, it should be mentioned that O&M expenditures do include both unplanned and planned outage expenses.
15
In order to monitor and control O&M expenditures and ultimately all costs, NPP management has to put in place a mechanism to:
— Estimate all O&M expenses in absolute values for the coming year (this activity is part of the budget preparation);
— Collect all O&M expenses on a monthly basis, for the current year;
— Determine monthly actual O&M costs and compare them with the estimated ones.
5.3.1. Expenses computation
Plant management has to make sure that a reporting method has been defined in the plant for the monthly expenses for all activities performed in the plant, also during planned and unplanned outages in order to determine the O&M cost of electricity.
The procedure defining this method is continuously used by the plant departments that are consuming materials, resources and services during the production process, mainly the Operations, Maintenance, Chemical, Health Physics, Fuel Handling and Material Control Departments.
Usually, expenditures recorded per the above-mentioned procedure are collected on a monthly basis, hence O&M costs are also calculated on a monthly basis. On management request, reports could be issued more often than monthly.
5.4. Control system
Electricity and heat production is quite a specific process, at least for two reasons:
— The product cannot be stored and must be immediately utilized;
— Production volume is limited by the technical capacity of power generators in the plant and environmental conditions.
In this context it is relatively easy to estimate the amount of energy to be delivered yearly (especially for base load conditions) and necessary expenses.
Basically, any organization’s target is to produce as much energy as possible. The most important means of doing so are:
— Maintain the plant available for service within design values;
— Maintain internal electrical and thermal consumption within design values;
— Maintain a high gross capacity factor by reducing the duration of planned outages and eliminating unplanned ones.
Good practices for reducing planned outages and achieving an optimum cost effective maintenance can be found in other IAEA publications [4], [7] and [8].
16
5.4.1. Yearly planned O&M costs [$/MW·h]
The approved budget is distributed within the organization before the new fiscal year starts. Each plant department is thus aware of how much resources are available to it and in what categories of expenses the resources are supposed to cover.
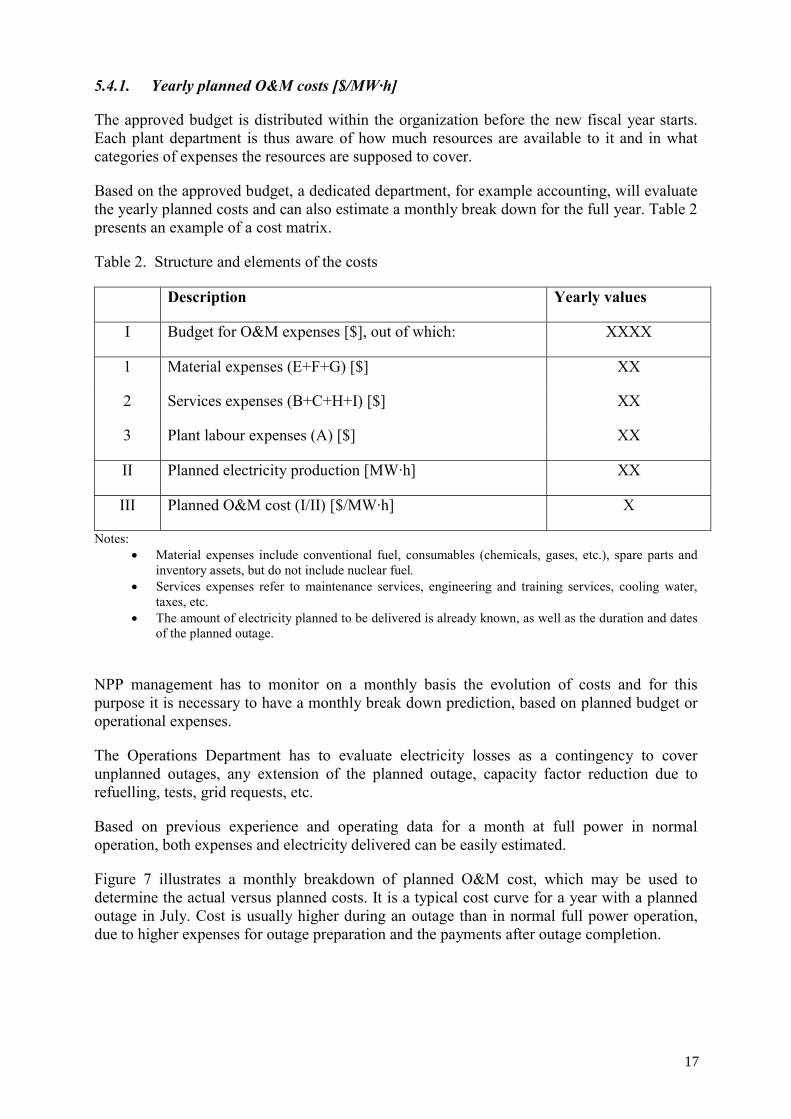
Based on the approved budget, a dedicated department, for example accounting, will evaluate the yearly planned costs and can also estimate a monthly break down for the full year. Table 2 presents an example of a cost matrix.
Table 2. Structure and elements of the costs
Description Yearly values
I Budget for O&M expenses [$], out of which: XXXX
1 Material expenses (E+F+G) [$] XX
2 Services expenses (B+C+H+I) [$] XX
3 Plant labour expenses (A) [$] XX
II Planned electricity production [MW·h] XX
III Planned O&M cost (I/II) [$/MW·h] X
Notes: • Material expenses include conventional fuel, consumables (chemicals, gases, etc.), spare parts and
inventory assets, but do not include nuclear fuel. • Services expenses refer to maintenance services, engineering and training services, cooling water,
taxes, etc. • The amount of electricity planned to be delivered is already known, as well as the duration and dates
of the planned outage.
NPP management has to monitor on a monthly basis the evolution of costs and for this purpose it is necessary to have a monthly break down prediction, based on planned budget or operational expenses.
The Operations Department has to evaluate electricity losses as a contingency to cover unplanned outages, any extension of the planned outage, capacity factor reduction due to refuelling, tests, grid requests, etc.
Based on previous experience and operating data for a month at full power in normal operation, both expenses and electricity delivered can be easily estimated.
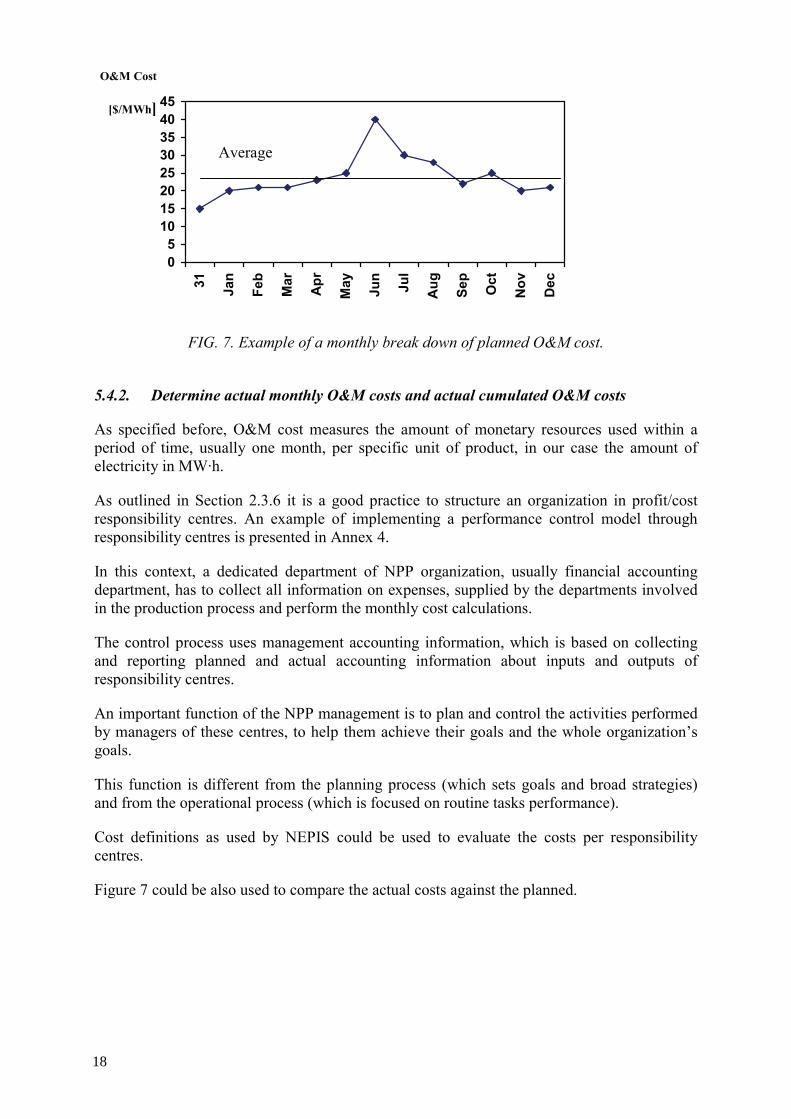
Figure 7 illustrates a monthly breakdown of planned O&M cost, which may be used to determine the actual versus planned costs. It is a typical cost curve for a year with a planned outage in July. Cost is usually higher during an outage than in normal full power operation, due to higher expenses for outage preparation and the payments after outage completion.
17
05
1015202530354045
31 Jan
Feb
Mar
Apr
May Jun
Jul
Aug Se
p
Oct
Nov Dec
FIG. 7. Example of a monthly break down of planned O&M cost.
5.4.2. Determine actual monthly O&M costs and actual cumulated O&M costs
As specified before, O&M cost measures the amount of monetary resources used within a period of time, usually one month, per specific unit of product, in our case the amount of electricity in MW·h.
As outlined in Section 2.3.6 it is a good practice to structure an organization in profit/cost responsibility centres. An example of implementing a performance control model through responsibility centres is presented in Annex 4.
In this context, a dedicated department of NPP organization, usually financial accounting department, has to collect all information on expenses, supplied by the departments involved in the production process and perform the monthly cost calculations.
The control process uses management accounting information, which is based on collecting and reporting planned and actual accounting information about inputs and outputs of responsibility centres.
An important function of the NPP management is to plan and control the activities performed by managers of these centres, to help them achieve their goals and the whole organization’s goals.
This function is different from the planning process (which sets goals and broad strategies) and from the operational process (which is focused on routine tasks performance).
Cost definitions as used by NEPIS could be used to evaluate the costs per responsibility centres.
Figure 7 could be also used to compare the actual costs against the planned.
O&M Cost
[$/MWh]
Average
18
05
101520253035404550
Jan Feb Mar Apr May Jun Jul Aug Sep Oct Nov Dec
Budget -monthlyActual - monthly
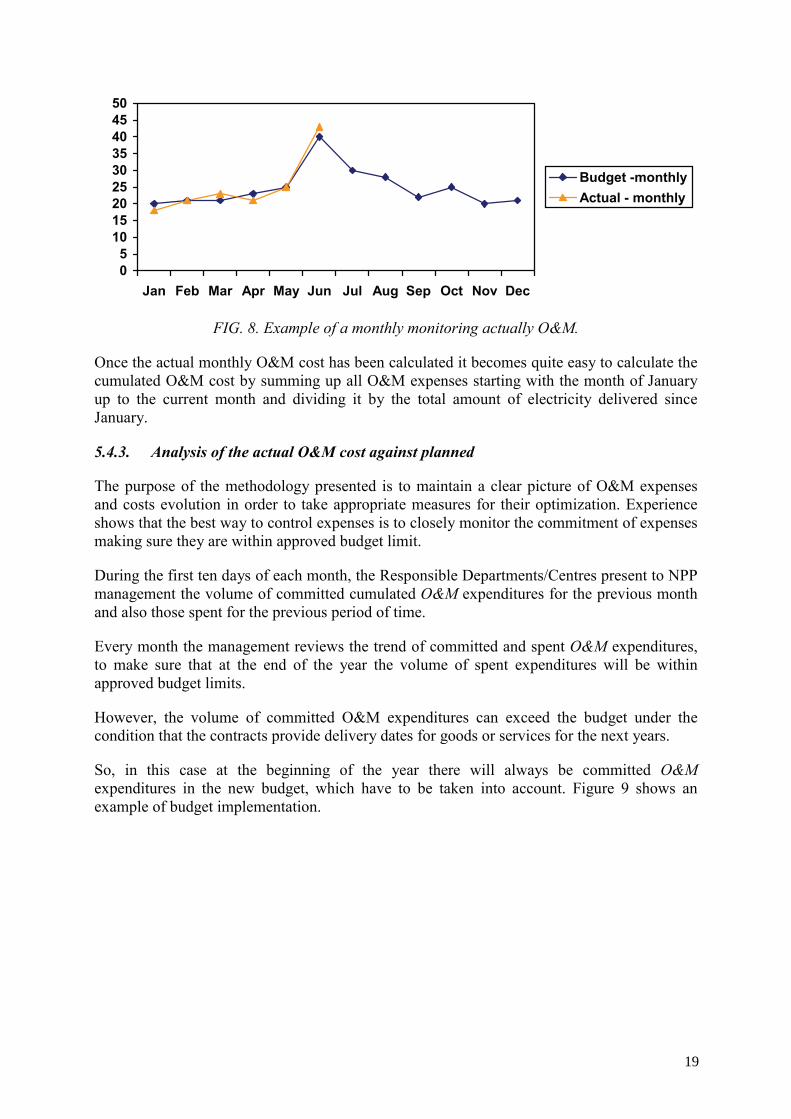
FIG. 8. Example of a monthly monitoring actually O&M.
Once the actual monthly O&M cost has been calculated it becomes quite easy to calculate the cumulated O&M cost by summing up all O&M expenses starting with the month of January up to the current month and dividing it by the total amount of electricity delivered since January.
5.4.3. Analysis of the actual O&M cost against planned
The purpose of the methodology presented is to maintain a clear picture of O&M expenses and costs evolution in order to take appropriate measures for their optimization. Experience shows that the best way to control expenses is to closely monitor the commitment of expenses making sure they are within approved budget limit.
During the first ten days of each month, the Responsible Departments/Centres present to NPP management the volume of committed cumulated O&M expenditures for the previous month and also those spent for the previous period of time.
Every month the management reviews the trend of committed and spent O&M expenditures, to make sure that at the end of the year the volume of spent expenditures will be within approved budget limits.
However, the volume of committed O&M expenditures can exceed the budget under the condition that the contracts provide delivery dates for goods or services for the next years.
So, in this case at the beginning of the year there will always be committed O&M expenditures in the new budget, which have to be taken into account. Figure 9 shows an example of budget implementation.
19
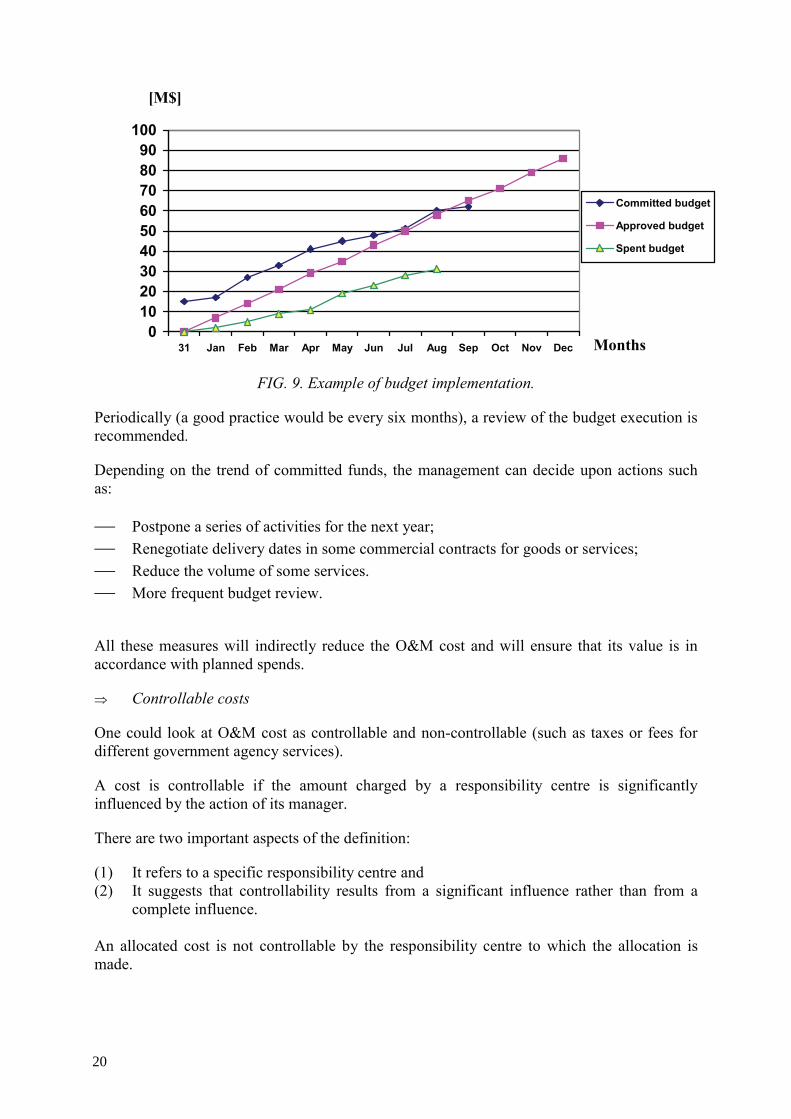
FIG. 9. Example of budget implementation.
Periodically (a good practice would be every six months), a review of the budget execution is recommended.
Depending on the trend of committed funds, the management can decide upon actions such as:
⎯ Postpone a series of activities for the next year; ⎯ Renegotiate delivery dates in some commercial contracts for goods or services; ⎯ Reduce the volume of some services. ⎯ More frequent budget review.
All these measures will indirectly reduce the O&M cost and will ensure that its value is in accordance with planned spends.
⇒ Controllable costs
One could look at O&M cost as controllable and non-controllable (such as taxes or fees for different government agency services).
A cost is controllable if the amount charged by a responsibility centre is significantly influenced by the action of its manager.
There are two important aspects of the definition:
(1) It refers to a specific responsibility centre and (2) It suggests that controllability results from a significant influence rather than from a
complete influence. An allocated cost is not controllable by the responsibility centre to which the allocation is made.
0102030405060708090
100
31 Jan Feb Mar Apr May Jun Jul Aug Sep Oct Nov Dec
Committed budget
Approved budget
Spent budget
[M$]
Months
20
At the NPP level the most important thing is to convert uncontrollable costs into controllable costs.
There are two methods for doing this:
(1) Changing the basis of cost assignment, or (2) Decentralization.
If the plant has a good system for performance control, top management can delegate responsibility for taking decisions from the top to the lower level managers, as they are more familiar with their specific work conditions.
Optimization of controllable elements of the O&M expenses can be achieved either by optimising the volume of goods, services and man-hours or through a procurement policy controlling prices and tariffs.
The procurement policy uses national legislation and corporate procedures as reference, but in essence promotes competition between potential suppliers as well as negotiation.
There are different ways to contract goods or services, depending on the type of activities or goods and the nuclear utility organization. The following examples could be named:
⎯ Firm price contracts ⎯ Fixed price contracts; ⎯ Reimbursable or cost plus contracts; ⎯ Bulk purchase agreements (a combined order integrating common goods/services for
multiple units/sites/companies); ⎯ Long-term purchase agreements or strategic partnerships.
A good indicator might be the monthly savings as a result of applying plant procurement policy. Annual average savings might represent a few percent of the contracted value.
5.4.4. Managing by forecast
Although the establishment of a formal budget is important to establish an organizational contract, conditions change throughout the year. For that reason, a process of forecasting expenses is essential. Forecasting expenses allows plant management to adjust resources and efforts based on emerging situations. Forecasts should reflect real estimation of likely outcomes for the year based on the actual experience, known future events and trended remaining activities. Allowing this truthful estimation provides management with visibility of upcoming problems and opportunities to adjust the plan based on priorities to achieve a result close to the official plant budget value. In some corporations forecasting, along with budget control, has become a valuable approach for managing the yearly resources.
Care should be exercised, when departments identify forecasted savings. Although the tendency of management would be to take these savings, as part of a management contingency, future identification of savings will be absent, should this take place. Departments will not report their savings, but will hold them for their own use. A better technique is to allow savings to remain in the open until a need is identified in that department or another. The plant management team should discuss those savings and the appropriate uses
21
for the benefit for the priorities of the plant in total. This trust factor takes time to develop and it should not anticipate open disclosure initially.
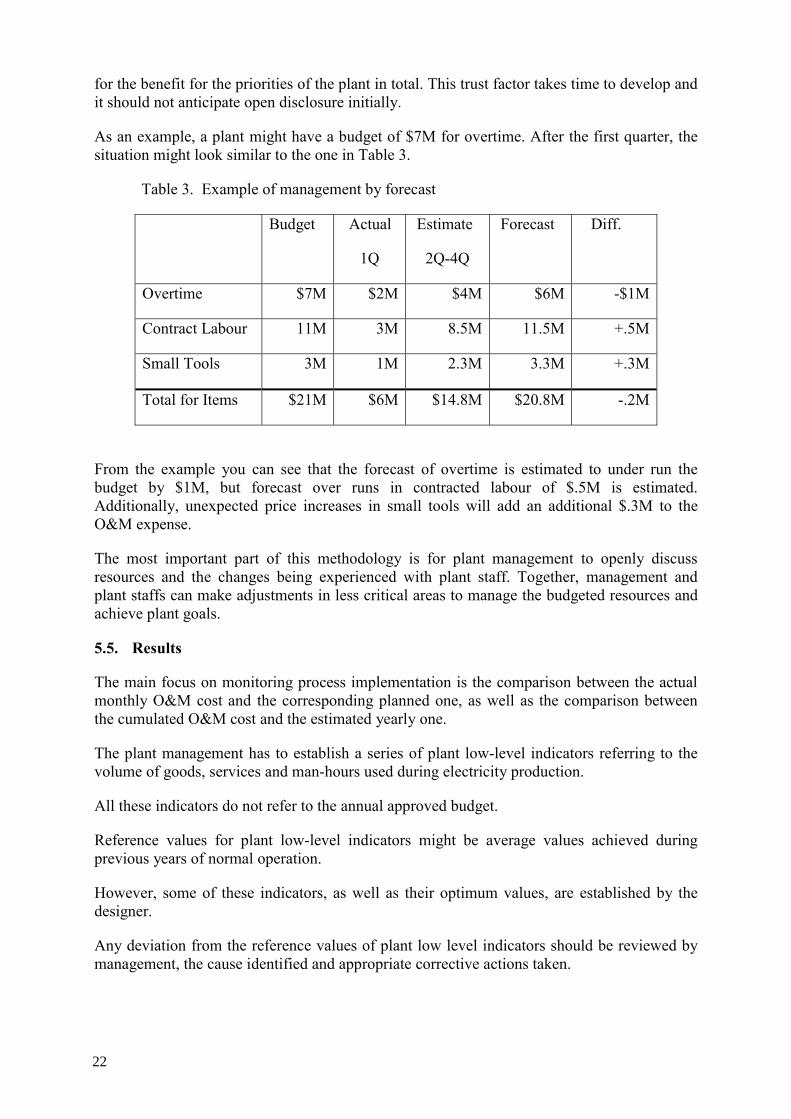
As an example, a plant might have a budget of $7M for overtime. After the first quarter, the situation might look similar to the one in Table 3.
Table 3. Example of management by forecast
Budget Actual
1Q
Estimate
2Q-4Q
Forecast Diff.
Overtime $7M $2M $4M $6M -$1M
Contract Labour 11M 3M 8.5M 11.5M +.5M
Small Tools 3M 1M 2.3M 3.3M +.3M
Total for Items $21M $6M $14.8M $20.8M -.2M
From the example you can see that the forecast of overtime is estimated to under run the budget by $1M, but forecast over runs in contracted labour of $.5M is estimated. Additionally, unexpected price increases in small tools will add an additional $.3M to the O&M expense.
The most important part of this methodology is for plant management to openly discuss resources and the changes being experienced with plant staff. Together, management and plant staffs can make adjustments in less critical areas to manage the budgeted resources and achieve plant goals.
5.5. Results
The main focus on monitoring process implementation is the comparison between the actual monthly O&M cost and the corresponding planned one, as well as the comparison between the cumulated O&M cost and the estimated yearly one.
The plant management has to establish a series of plant low-level indicators referring to the volume of goods, services and man-hours used during electricity production.
All these indicators do not refer to the annual approved budget.
Reference values for plant low-level indicators might be average values achieved during previous years of normal operation.
However, some of these indicators, as well as their optimum values, are established by the designer.
Any deviation from the reference values of plant low level indicators should be reviewed by management, the cause identified and appropriate corrective actions taken.
22
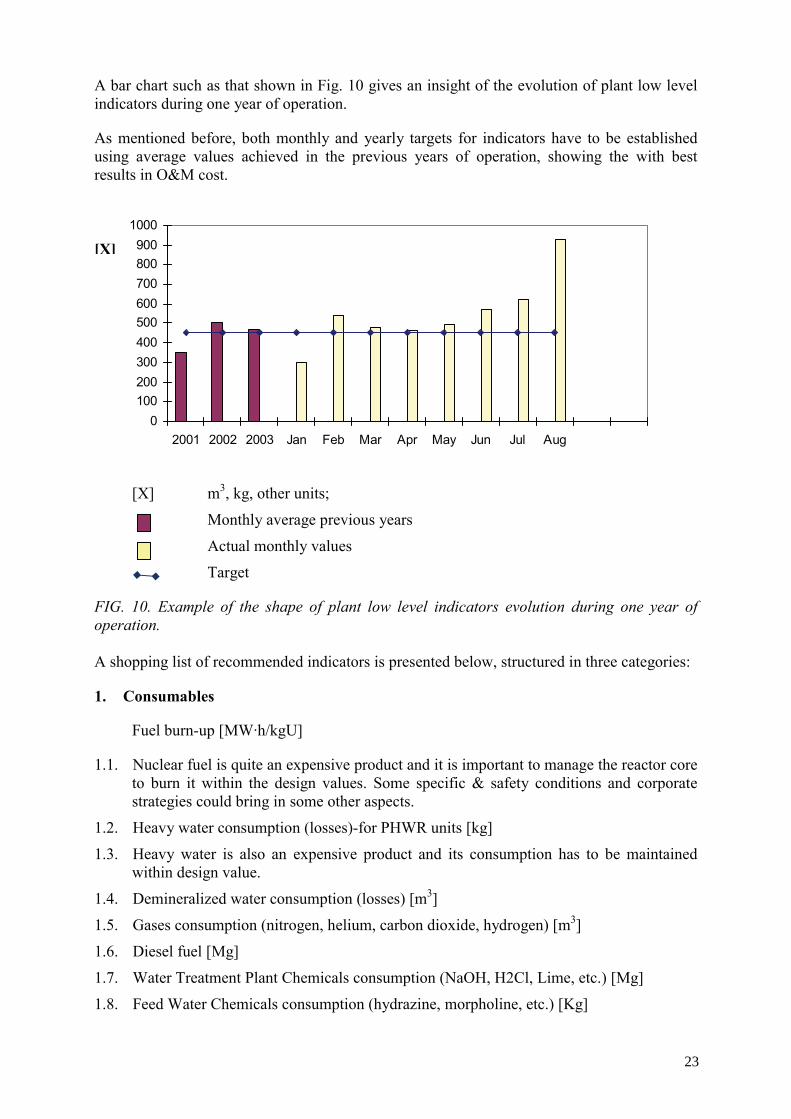
A bar chart such as that shown in Fig. 10 gives an insight of the evolution of plant low level indicators during one year of operation.
As mentioned before, both monthly and yearly targets for indicators have to be established using average values achieved in the previous years of operation, showing the with best results in O&M cost.
0100200300400500600700800900
1000
2001 2002 2003 Jan Feb Mar Apr May Jun Jul Aug
[X] m3, kg, other units;
Monthly average previous years
Actual monthly values
Target
FIG. 10. Example of the shape of plant low level indicators evolution during one year of operation.
A shopping list of recommended indicators is presented below, structured in three categories:
1. Consumables
Fuel burn-up [MW·h/kgU]
1.1. Nuclear fuel is quite an expensive product and it is important to manage the reactor core to burn it within the design values. Some specific & safety conditions and corporate strategies could bring in some other aspects.
1.2. Heavy water consumption (losses)-for PHWR units [kg]
1.3. Heavy water is also an expensive product and its consumption has to be maintained within design value.
1.4. Demineralized water consumption (losses) [m3]
1.5. Gases consumption (nitrogen, helium, carbon dioxide, hydrogen) [m3]
1.6. Diesel fuel [Mg]
1.7. Water Treatment Plant Chemicals consumption (NaOH, H2Cl, Lime, etc.) [Mg]
1.8. Feed Water Chemicals consumption (hydrazine, morpholine, etc.) [Kg]
[X]
23
1.9. Ion Resins consumption [m3]
1.10. Desiccant [Kg]
1.11. Poisons [Kg]
2. Labour
2.1. Overtime [h]
2.2. Employees availability defined as: (number of employees x number of working days – number of vacation days – number of sickness/recovery days) divided by (number of employees x number of working days)
2.3. Number of man-hours of contracted maintenance staff
2.4. Number of man-hours of contracted auxiliary staff
2.5. Number of man-Sievert (the actual versus maximum allowed for atomic radiation workers)
3. Miscellaneous expenses
3.1. Number of copies done on copying machines
Copying services, including consumables, are expensive and is necessary to be monitored. Management should allocate periodically to departments a limited number of copies to be done on copying machines under their responsibility9.
3.2. Number of minutes on mobile phones versus the allocated ones
3.3. Domestic water consumption [m3]
3.4. Number of kilometres versus the allocated ones on vehicles serving the plant
3.5. Electricity consumption in accommodation spaces of the plant [MW·h]
3.6. Travel expenses [$]
A good practice is to monitor the above-mentioned indicators on a monthly basis. These indicators could be generically used in all types of NPPs, providing there are selected most appropriate ones.
Below are some proven good practices to optimize some of the items falling in the miscellaneous expenses category:
Electronic transfer of funds for paying staff & supplies E-procurement: electronic bidding process Use of company vehicle vs. rental Taxi slips, meal coupons, etc. Network printers versus individual printers Bulk office services (Internet, software, car rental, cell phones, etc.) for both office and staff personnel use
9 Management may want consider implementation of online work methods discouraging printing & copying.
24
Blackberry to facilitate off-site work.
The above proposed list is not exhaustive. There could be also other methods, which could improve efficiency of the business depending on the plant organization and distribution of responsibilities.
5.6. Employee and corporate motivation for success (reward system)
In order to be successful, a corporation should basically make sure that it has the adequate people and it motivates them toward performance. In this respect this section looks at reward systems, where rewards are either part of a wider employment package or just aimed to stimulate performance.
In the management control process, behavioural considerations are as important as the economic ones. The motivational impact of various practices needs to be considered. A reward system should be structured to encourage goal congruence (where goals of participants are consistent with goals of the plant as a whole). The motivation to engage a given behaviour is determined by a person’s expectancies and by desire the person attaches to it, in order to satisfy his/her own needs. This is a difficult matter, as individuals have different needs, which depend on the type of the job (manager vs. non-manager), by background and by culture. A given person’s needs change over time. The motivation is weakest when a person perceives a goal as being unattainable or too easy attainable. The motivation is strongest when there is around 50–50 chance of achieving a goal. Individuals tend to be more motivated by the potential to earn rewards than by the fear of punishment. Beyond a certain point, additional incentives (resulting in additional pressure) for performance improvement, accomplishes nothing.
Motivation of employees should be directed to key focus areas. For this reason, plant management needs to correlate the number of indicators that are chosen for this programme with those of key focus areas and care should be exercised that the right indicators are chosen.
Type of rewards and monetary compensations might depend very much on local environment (economic, legal, ownership, labour culture, company policy etc.). This is an important parameter to be optimised and attention should be paid to the possibility of “importing” external practices, models, etc.
An example of an approach on assessing the extent of achieving organization/team/employee objectives is given in Annex 5.
5.6.1. Linking to performance pay
Ultimately, plant management alone cannot achieve excellent performance results. All employees are needed to achieve the ever-increasing demands for results. One technique that has been used successfully in many countries is the motivation of the workforce toward achieving plant success through a tie between the achievement of certain key performance indicators and performance bonus compensation. These measures are to be balanced to cover all aspects of the company, such as operations, financial and workforce. It can be referred to as a balanced scorecard.
The benefit of using this process is the establishment of priorities by identifying the things that must be done well for the company to succeed, measuring and reporting of these key focus areas, and demonstrating a line of sight for all employees for their work activities to the
25
plant/corporate objectives. It has been proven that, when properly executed, it demonstrates the relationship of individual incentives to the success of the company.
Care should be given to choosing the correct indicators, because incorrect behaviour can be generated by employees trying to increase an amount of bonus pay without a true benefit to the company. Measures should be studied to predict which ones would generate the greatest positive behaviours to achieve the results desired.
5.6.2. Types of rewards
Corporations and plants have utilized a variety of rewards and incentives to motivate employees to improve performance and keep promoting progress toward key objectives. In a number of plants, employees receive bonus pay based on the achievement of performance above the approved plan. This tends to encourage the extra effort to achieve results greater than the expected based performance.
In some situations employees cannot receive extra monetary compensation, but other methods of motivation can be utilized.
5.6.3. Non-monetary compensation
Non-monetary10 compensation can also prove important. Individuals are influenced both by positive and negative incentives. People should receive feedback about their performance to obtain a feeling of achievement or self-realization. Thus, the subordinates receive praise or criticism from their superiors on a regular basis.
Most electricity generating companies use non-monetary compensation as an important tool to motivate the workforce toward achieving plant success. There are many options for non-financial benefits that employers can offer their employees to motivate them. Here are a few examples:
⎯ Formal recognition of employees’ achievements in newsletters, magazines, newspapers, publications, media, etc.
⎯ Provide different benefits such as healthcare, dental, etc. ⎯ Sponsor social events like: outage celebrations, Christmas parties, trips, etc. ⎯ Provide spaces and facilities for health and fitness; ⎯ Send the best employees to conferences, seminars or training courses organized by
different foreign organizations; ⎯ Sale or raffle off old equipment, computers, etc. ⎯ Provide free accommodation in company’s houses and facilities as heating, power,
water, etc. ⎯ Provide free transportation to and from the plant. ⎯ Assignment to special projects ⎯ Paid training for career development ⎯ Vacation bonus
10 For the purpose of this section non monetary compensation means a non-cash benefit for the employee.
26
⎯ Use of company cell phones for personal utilization using flat fee service. Depending on plant location, surrounding environment and people’s specific culture, companies can decide to provide other bonuses or compensations to maintain and stabilize employees at working places.
One thing to keep in mind, what motivates older employees might not have the same affect on younger employees. For that reason, a variety of rewards might be necessary to accommodate various employee groups. As an example, you might consider having an individual choose among a few different rewards being offered. Rewards can also increase with seniority, performance or promotion.
It is an important function of any manager to adapt the incentive system (where there is such a system and the employee is eligible) to the personalities and attitudes of the individuals whom he/she supervises.
5.6.4. Corporate versus plant versus department goals
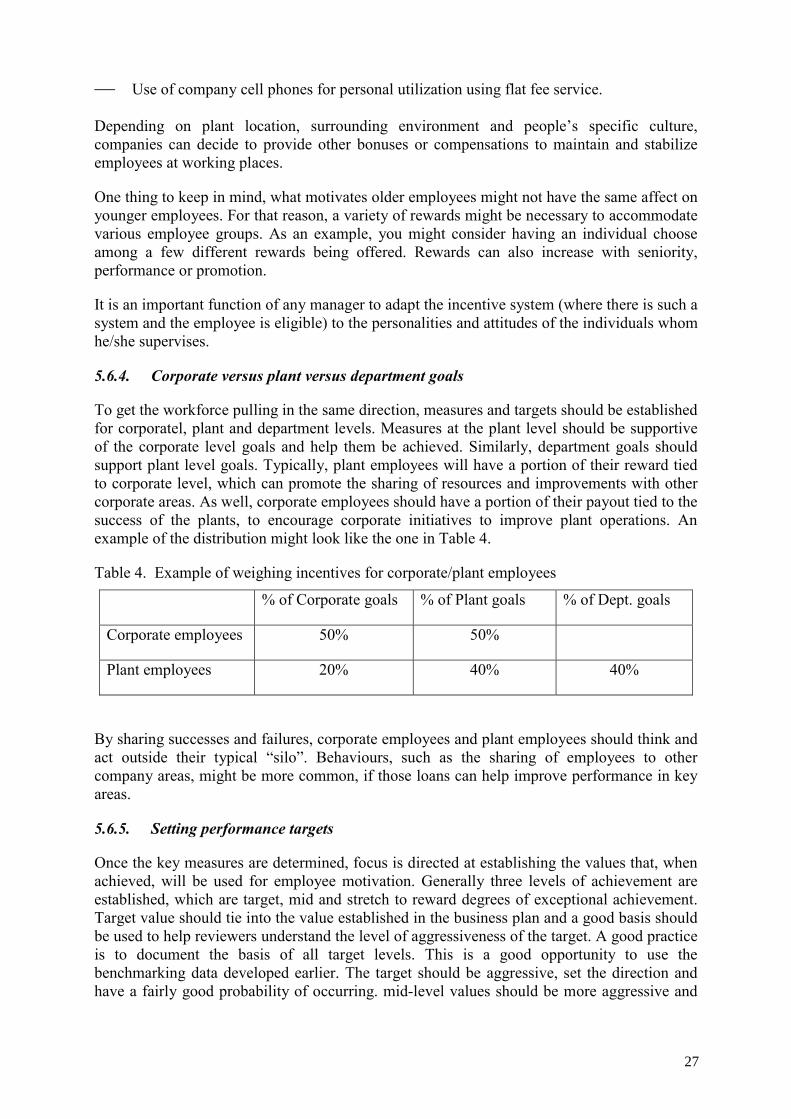
To get the workforce pulling in the same direction, measures and targets should be established for corporatel, plant and department levels. Measures at the plant level should be supportive of the corporate level goals and help them be achieved. Similarly, department goals should support plant level goals. Typically, plant employees will have a portion of their reward tied to corporate level, which can promote the sharing of resources and improvements with other corporate areas. As well, corporate employees should have a portion of their payout tied to the success of the plants, to encourage corporate initiatives to improve plant operations. An example of the distribution might look like the one in Table 4.
Table 4. Example of weighing incentives for corporate/plant employees
% of Corporate goals % of Plant goals % of Dept. goals
Corporate employees 50% 50%
Plant employees 20% 40% 40%
By sharing successes and failures, corporate employees and plant employees should think and act outside their typical “silo”. Behaviours, such as the sharing of employees to other company areas, might be more common, if those loans can help improve performance in key areas.
5.6.5. Setting performance targets
Once the key measures are determined, focus is directed at establishing the values that, when achieved, will be used for employee motivation. Generally three levels of achievement are established, which are target, mid and stretch to reward degrees of exceptional achievement. Target value should tie into the value established in the business plan and a good basis should be used to help reviewers understand the level of aggressiveness of the target. A good practice is to document the basis of all target levels. This is a good opportunity to use the benchmarking data developed earlier. The target should be aggressive, set the direction and have a fairly good probability of occurring. mid-level values should be more aggressive and
27
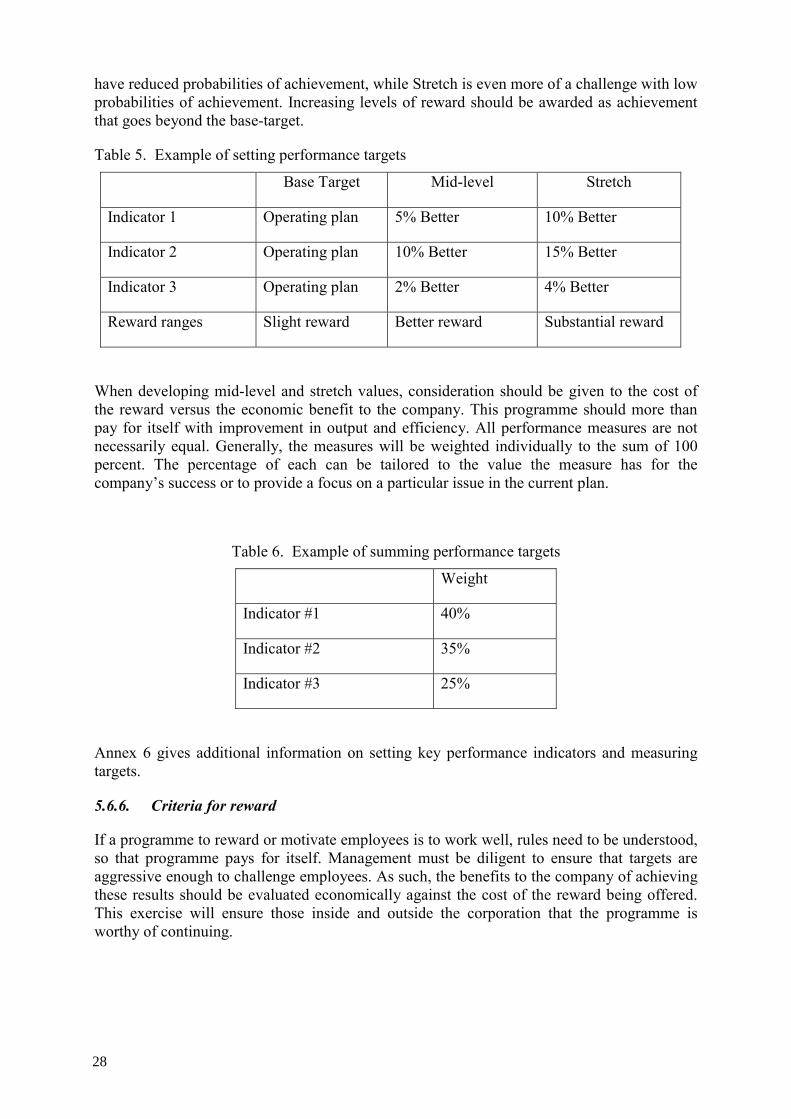
have reduced probabilities of achievement, while Stretch is even more of a challenge with low probabilities of achievement. Increasing levels of reward should be awarded as achievement that goes beyond the base-target.
Table 5. Example of setting performance targets
Base Target Mid-level Stretch
Indicator 1 Operating plan 5% Better 10% Better
Indicator 2 Operating plan 10% Better 15% Better
Indicator 3 Operating plan 2% Better 4% Better
Reward ranges Slight reward Better reward Substantial reward
When developing mid-level and stretch values, consideration should be given to the cost of the reward versus the economic benefit to the company. This programme should more than pay for itself with improvement in output and efficiency. All performance measures are not necessarily equal. Generally, the measures will be weighted individually to the sum of 100 percent. The percentage of each can be tailored to the value the measure has for the company’s success or to provide a focus on a particular issue in the current plan.
Table 6. Example of summing performance targets
Weight
Indicator #1 40%
Indicator #2 35%
Indicator #3 25%
Annex 6 gives additional information on setting key performance indicators and measuring targets.
5.6.6. Criteria for reward
If a programme to reward or motivate employees is to work well, rules need to be understood, so that programme pays for itself. Management must be diligent to ensure that targets are aggressive enough to challenge employees. As such, the benefits to the company of achieving these results should be evaluated economically against the cost of the reward being offered. This exercise will ensure those inside and outside the corporation that the programme is worthy of continuing.
28
5.7. Taking corrective actions
Usually three types of reports are prepared for the use of managers: information reports, economic performance reports, and personnel performance reports. Economic performance reports focus on an analysis of the responsibility centre as an economic entity. The performance can be measured in terms of effectiveness and efficiency. Effectiveness means the responsibility centre does its job and is related to plant’s objectives.
An efficient operation is one that produces a given result with an optimum consumption of resources.
The broad panel of information referring to O&M expenses/costs as well as plant low-level indicators has to be reviewed by NPP management and the conclusions discussed with appropriate responsible department/centre superintendents.
Whenever an indicator deviates from target, there is a need to identify causes and take appropriate corrective measures and actions in order to bring the value back within the target range.
Usually, plant low-level indicators are not mutually exclusive. No indicator can be analysed in isolation, without taking into consideration its interaction with other indicators and impact on other measures. All in all NPP management is responsible to ensure its safe, reliable and economic operation
Here are a few examples of corrective actions that might be taken to optimise O&M costs:
⎯ Improvement of moderator quality (isotopic), poison addition policy, optimise number of poison out-states.
⎯ Optimization of reactor core management through the refuelling policy. ⎯ Improvement of material condition policy in order to reduce any fluid leaks (water,
gases, oil, etc.). ⎯ Optimization of back-up power supply systems periodic testing programmes. ⎯ Review of preventive maintenance programmes for plant’s major equipment. ⎯ Review of chemical regime of condensate and feed water in order to optimise different
chemical consumptions. ⎯ Issuing of written dispositions in the plant assigning norms for different miscellaneous
services such as: mobile telephone calls, travel hours, number of copies, etc. An important element, which will influence O&M cost, is the way the capital investment is dealt with. Any capital addition having the objective to increase the availability and reliability of structure systems and components should lead to a reduction in electricity generation costs11.
11 For the purpose of this publication “electricity generation costs” is the total cost [Monetary unit/MW·h] of generating electricity and consists of O&M, fuel and capital costs (as depreciation).
29
Whenever needed, good communication with employees through the supervisory level is the best way to pass onto the organization all messages from management referring to different administrative measures to reduce O&M expenses.
If there is a deviation between actual and planned budget management may decide to implement corrective steps.
Usually during the fourth quarter of the year it is necessary to perform a budget revision. The main purpose of this revision is to adjust positions where committed values exceed the estimated ones, by deducting from other positions where committed values are under the ones estimated. The budget works by respecting the balance principle, any growth or additional requirement may be carried out only by reducing other budget allowances by the respective amount. Redistribution needs not affect the total value of the approved budget.
Appendix 7 presents a form of budget execution/revision.
5.7.1. Warehouse stock
Although inventory value is not an O&M cost it has an impact and can influence the electricity generation cost. Therefore, optimization of O&M costs has to include also the evolution of stock in plant’s warehouse.
Usually an operator has to keep an adequate stock of consumables and spare parts in the warehouse to efficiently operate the plant. As an example, for a single unit in operation on a site, the value of warehouse inventory could be in the range of 2535 M$. However these figures might be very different depending on local conditions and context, such as local available industrial support, participation in an inventory pool, etc.
Inventory excess might result in increased carrying cost, and for this reason management has to closely monitor the stock evolution, trying to keep it into established limits.
For large electric utilities or even for different utilities but with similar NPPs in operation, shared inventories might be a very efficient solution in maintaining an optimum inventory of spare parts or consumables while minimizing the cost of doing so.
Figure 11 illustrates the evolution of the total value of inventory for an example case and could be easily used for analysis.
Another problem that has to be addressed is short-life and sensitive items (rubber gaskets, etc.) that could deteriorate, undergo premature aging on the shelves or exceed their guaranteed life (or most of it) while in warehouse. To avoid such a situation, a min-max approach has to be implemented for these parts. Use of metallic components vs. elastomers can be one solution, i.e. metallic valve seats or Flexitallic gaskets.
30
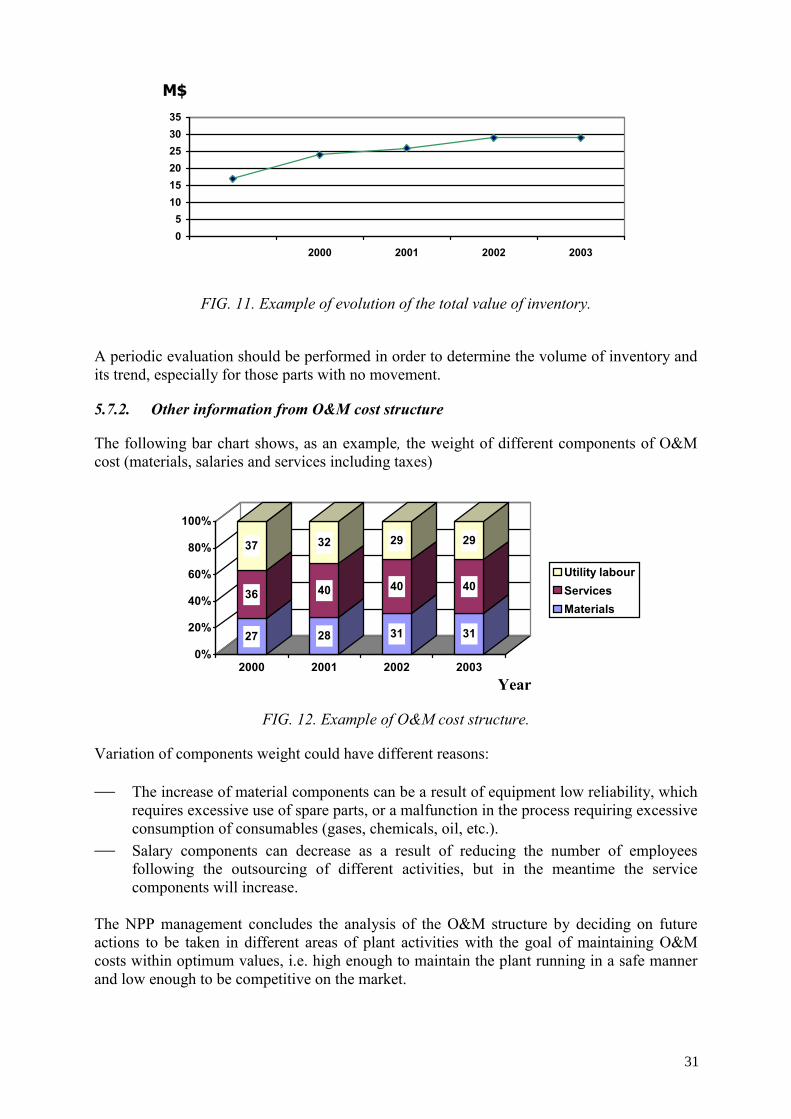
05
101520253035
2000 2001 2002 2003
FIG. 11. Example of evolution of the total value of inventory.
A periodic evaluation should be performed in order to determine the volume of inventory and its trend, especially for those parts with no movement.
5.7.2. Other information from O&M cost structure
The following bar chart shows, as an example, the weight of different components of O&M cost (materials, salaries and services including taxes)
27
36
37
28
40
32
31
40
29
31
40
29
0%
20%
40%
60%
80%
100%
2000 2001 2002 2003
Utility labourServicesMaterials
FIG. 12. Example of O&M cost structure.
Variation of components weight could have different reasons:
⎯ The increase of material components can be a result of equipment low reliability, which requires excessive use of spare parts, or a malfunction in the process requiring excessive consumption of consumables (gases, chemicals, oil, etc.).
⎯ Salary components can decrease as a result of reducing the number of employees following the outsourcing of different activities, but in the meantime the service components will increase.
The NPP management concludes the analysis of the O&M structure by deciding on future actions to be taken in different areas of plant activities with the goal of maintaining O&M costs within optimum values, i.e. high enough to maintain the plant running in a safe manner and low enough to be competitive on the market.
Year
M$
31
Appendix 8 provides an example on results management for a single unit station with a PHWR reactor.
5.8. Specific cases for companies with NPP fleets
All the remarks and recommendations made above in order to reduce operating and maintenance costs are of course also applicable for companies with an important fleet of NPP. However those companies have the advantage of lumping resources for all NPPs and engineering services and do enhanced optimization of the O&M costs. Moreover if the fleet is standardized, all the feedback and good practices observed in one NPP can be shared with the entire fleet.
For example, the maintenance strategy is articulated around the reduction of the volume in NPP by adapting this maintenance to the various components, by taking into account experiences, feedback and using modern approaches (predictive and preventive mathematical models). This strategy applies as well for unplanned outages or for refuelling and planned maintenance. Taking into account the standardization of the fleet, it is easy to compare the best practices for each activity and to share them via data bases and meetings animated by the engineers of the different engineering centres, which analyse these good practices. It should be noted that the availability and unavailability indicators (LF, EAF, EUF, FLR) can be calculated every month and compared between all the NPP and correlated with all the costs.
The optimization of the purchases of materials, consumable and spare parts, is of course a great advantage for a company which manage a big fleet. All the negotiations realized for example with the support of the technical specialists (a purchaser, a technician specialist in the product) make it possible to carry out very large economies with the Company. This way, many world companies can be put in competition and the volume of the purchases makes it possible to have better price conditions. The follow-up of the quality of the purchases is also reinforced. In certain very particular cases (local provisions of services, constraints, catering, etc.), regional or national contracts can be signed with specific companies to help them develop their activities as part of a sustainable partnership).
When adopting a shared purchase policy, it is very important to set up a policy for improvement of stocks. This work must be completed in accordance with the direction of the purchases by using for example the same IT system in order to avoid the redundancy of spare parts on the various power stations. Economy of taxes can be also made.
In the case of fleet companies, the training of personnel and the exchange of rare competences between all NPPs can be optimised and reinforced by the creation of internal competence centres and the formation of specialized maintenance divisions.
Finally a centralized controlling department working in close cooperation with all NPPs’ controlling units is able to collect and aggregate all the data and information in order to establish the cycling calendar of management actions using all the financial indicators, accountings and hypothesis. Of course comparisons and best practices can be made in order to improve all results for whole company’s fleet.
32
6. CONCLUSIONS
In the actual context of the deregulation and competitive markets, business and financial success of operating nuclear plants must be considered to a much greater extent along with the successful achievement of safety and reliability objectives and optimization of O&M costs of nuclear power plants (NPPs) is an important contributor but obviously not the only one. The key factor to succeed in this environment is to develop a management/business process able to integrate all elements contributing to overall success of the organization.
The model recommended in this publication is integrated strategic business planning which embodies several, essential aspects of the business planning process as it relates to the management and business cycle of nuclear power plants.
To successfully optimize O&M cost through application of this model:
⎯ Strategic goals have to be well established, clearly defined and successfully institutionalized throughout the plant and corporate organizations and the detailed action plans and budgets of the plant’s organization are consistent with and clearly aligned with plant and corporate strategic directions.
⎯ Nuclear organization participates in and takes ownership of the integrated planning process. The strategic plan should not be prepared by a small business or strategic planning group and simply published for all to read, but rather it should be a process that all key decision makers and organizational leaders actively participate in.
⎯ The business plan, its strategic elements as well as its tactical details, the operational plans and budgets, must be embraced and accepted throughout the nuclear plant’s organization.
⎯ The ownership of a business plan must be embodied throughout the organization, from working to executive levels through frequent communication, not only for the development of goals and action plans but also for their accomplishment.
⎯ Optimization of O&M costs starts with planning at strategic level and development of a strategic plan, which constitutes the basis for subsequent operational plans, providing necessary resources to deliver performance as planned.
⎯ When doing strategic planning aspects such as external (market, competition, customers, regulator) and internal (life management, etc) environment should be taken into account.
⎯ Throughout this report we used costs expressed in monetary units/unit of electricity produced to underline that we could spend more if we increase performance.
⎯ Actual monthly and cumulated O&M costs have to be compared with the reference values on monthly basis, any deviation analysed and appropriate measures have to be taken.
⎯ It is important to distinguish between variances, which are controllable by a manager, and those, which are not.
⎯ O&M cost could be controlled indirectly, by controlling the commitment of expenses, which are components of O&M cost.
⎯ Volume of goods and services, whose value directly influence the O&M cost, could be controlled by setting-up low level indicators and a process to monitor and optimize their values.
33
⎯ Procurement policy and procedures play an important role and determine the amount of O&M expenses. Considerable savings can be achieved by applying appropriate procurement procedures.
⎯ An optimum volume of consumables and spare parts should be maintained in warehouse stocks, as a balance between time and availability of these goods and efficient use of funds.
⎯ O&M structure by main elements (labour, materials and services) allows to the NPP Management to draw valuable other conclusions about plant business process and management policies.
⎯ Motivational impact of various practices needs to be considered.
34
REFERENCES
[1] DEMELLA. J., SPIEGELBERG-PLANER, R., CONDU, M., Improving Economic Performance of Nuclear Power Plants, Nuclear Plant Journal, No. 1 (2005).
[2] PHILIPSON, L., WILLIS, H.L., Understanding Electric Utilities and Deregulation, Dekker, M., New York (1999).
[3] INTERNATIONAL ATOMIC ENERGY AGENCY, Developing an Economic Performance System to Enhance Nuclear Power Plant Competitiveness, Technical Reports Series No. 406, IAEA, Vienna (2002).
[4] INTERNATIONAL ATOMIC ENERGY AGENCY, Good Practices for Cost Effective Maintenance of Nuclear Power Plants, IAEA-TECDOC-928, IAEA, Vienna (1997).
[5] INTERNATIONAL ATOMIC ENERGY AGENCY, Risk Management: A Tool for Improving Nuclear Power Plant Performance, IAEA-TECDOC-1209, IAEA, Vienna (2001).
[6] INTERNATIONAL ATOMIC ENERGY AGENCY, Strategies for Competitive Nuclear Power Plants, IAEA-TECDOC-1123, IAEA, Vienna (1999).
[7] INTERNATIONAL ATOMIC ENERGY AGENCY, Nuclear Power Plant Outage Optimization Strategy, IAEA-TECDOC-1315, IAEA, Vienna (2002).
[8] INTERNATIONAL ATOMIC ENERGY AGENCY, Guidance for Optimising Nuclear Power Plant Maintenance Programmes, IAEA-TECDOC-1383, IAEA, Vienna (2004).
[10] INTERNATIONAL ATOMIC ENERGY AGENCY, Economic Performance Indicators for Nuclear Power Plants, Technical Reports Series No. 437, IAEA, Vienna (2006).
[11] INTERNATIONAL ATOMIC ENERGY AGENCY, Good Practices for Outage Management in Nuclear Power Plants, IAEA-TECDOC-621, IAEA, Vienna (1991).
[12] INTERNATIONAL ATOMIC ENERGY AGENCY, Nuclear Power Plant Outage Optimization Strategies, IAEA-TECDOC-1315, IAEA, Vienna (2002).
[13] APPLEBY, R.C., Modern Business Administration, Pitman Publishing, London (1994). [14] ALLISON, M., KAYE. J., All Strategic Planning FAQs from Strategic Planning for
Non-profit Organizations, John Wiley & Sons, New York, USA (1997) (www.search.genie.org).
[15] DEMELLA, J., Integrated Strategic/Business Planning Process; Aligning Operational Performance to Business Needs, International Symposium on Nuclear Power Plant Life Management, 4–8 November, 2002, Budapest, Hungary.
[16] BOSSIDY, J., CHARAN, R., Execution, The discipline of getting things done, Crown Business, New York, USA, 2002.
[17] SPICER, L., PSEG Nuclear, LLC, Business Planning Process, presented at EUCG Fall Conference, New York, USA, 2004.
35

GLOSSARY
To facilitate the understanding of this guide, a common meaning of some terms requires explanation:
Accounting: The process of identifying, measuring and communicating economic information to permit informed judgements and decisions by users of information. The point of view is that of the user and, particularly, the management user.
Budget: A budget is a plan expressed in monetary terms that covers a specific period of time, usually one year.
Controllable cost: The cost that can be controlled by management.
Forecast: An estimate of the expenditures at completion. The forecast includes a consideration of actual expenditures to date, trends experienced, new scope estimated and probable impacts. Predict or estimate a future event or trend.
Management accounting: A major branch of accounting primarily concerned with providing financial and other information to parties internal to an entity for planning, control, and decision-making purposes.
Mission: A formal statement by an organization describing basic philosophies, products or services and intentions.
Net electricity (MW·h) NEPIS: Electricity delivered to the client within a certain period of time.
Non-controllable cost: The cost that cannot be controlled by plant management by any means (taxes, fees, cooling water, thermal pollution, etc.)
Objectives: Those targets or results that must be achieved in order to carry out a mission.
O&M expenses ($): The sum of expenses related to materials (consumables, spare parts, inventory assets), salaries, travel and training expenses, contracted services, taxes, etc., used to produce the power within a defined period of time (usually on a monthly or yearly basis).
Note: Consumables do not include Nuclear Fuel.
Plans: The way to carry out strategies. The plans could be programmes (cover a larger set of activities), projects (cover a smaller range of activities), budgets, etc.
Policy: A policy is a guide to the action or decision of people. Policies are expressions of a company’s official attitude towards types of behaviour within which it will permit, or desire, employees to act.
Responsibility centre: Any organisation unit, headed by a responsible manager. The nuclear power plant usually has a responsibility centre such as: operation, maintenance, fuel handling, chemistry, training, etc.
Routine O&M: Sequences of O&M operations regularly followed.
37

Strategy: A comprehensive and integrated framework that determines the nature, choices and direction of a programme’s activities toward objective achievement. The logical linkage of reasoning underlying the programme element design giving evidence of how that programme element will achieve its end.
Vision: A statement describing what an organization seeks to become in the future. A description of a preferred future.
38
CONTRIBUTORS TO DRAFTING AND REVIEW
Bucur, I. Societatea Nationala Nuclearelectrica, Romania
Condu, M. International Atomic Energy Agency
DeMella, J. Consultant, USA
Duggal, A Atomic Energy of Canada Ltd, Canada
Horie, T. Tokyo Electric Power Company, Japan
Lehougre, J.F. Electricité de France, France
Negulici, E. Societatea Nationala Nuclearelectrica, Romania
Russ Fernandes, S. Electronuclear-Eletrobras Termonuclear S.A., Brazil
Saunders, S.J. Tennessee Valley Authority, USA
Subramanian, S. Nuclear Power Corporation of India Ltd, India
Takahashi, T. Tokyo Electric Power Company, Japan
Wolf, G. Paks Nuclear Power Plant, Hungary
Consultants Meeting
Vienna, Austria: 10–13 May 2004, 23–25 May 2005
Technical Meeting
Vienna, Austria: 1–3 December 2004
39