Embed Size (px)
Citation preview

Integrated Boiler Management Through Advanced Condition Monitoring and Component AssessmentDE-FE0031683

2
Project Objectives• Develop, demonstrate, and support technology transfer of an integrated boiler
management system to track accumulation of creep and fatigue damage• Includes development of high-temperature fiber-optic distributed sensing• Near real-time damage assessment
• Improved boiler operation in concert with existing plant data and processes
Current Status• Development of integrated boiler management system complete• Fiber-optic distributed sensing development continues• Host-site demonstration of integrated boiler management system planned for
4Q 2020• Demonstration of fiber-optic distributed sensors delayed until 2021
Project Objectives and Status

3
Project Partners and Responsibilities• Project prime (EPRI)
• Overall project management• Coordination of partner activities• Coordination with host site for demonstration
• High-temperature, distributedfiber-optic sensors (Sentek Instrument LLC)
• Creep-Fatigue Management System(Structural Integrity Associates)
• Fiber-optic sensor output• Existing plant instrumentation
• Host-site demonstration (AEP)
Project Partners

4
Creep-Fatigue Management SystemStructural Integrity Associates

5
Fossil plants are increasingly required to operate in more flexible operating modes:
• More startups & shutdowns• More partial load operation
Expected to cause accelerated fatigue- and creep-related damage
Increases significance of tracking equipment condition for:
• Minimizing failures• Optimizing replacement schedules• Optimizing inspection timing
Temperature Variability During Flex Ops
6
Most relevant and up-to-date information can help reduce analysis uncertainty:
• Material properties• Stress state• Operating data/environment
Integrated approach• Determination of material ‘condition’
• Stress, strain, temperature, etc. (innovative sensor technologies)• Track damage accumulation in key components
• Life assessment tools needed - Advanced Condition Monitoring
Role of Integrated Life Management
7
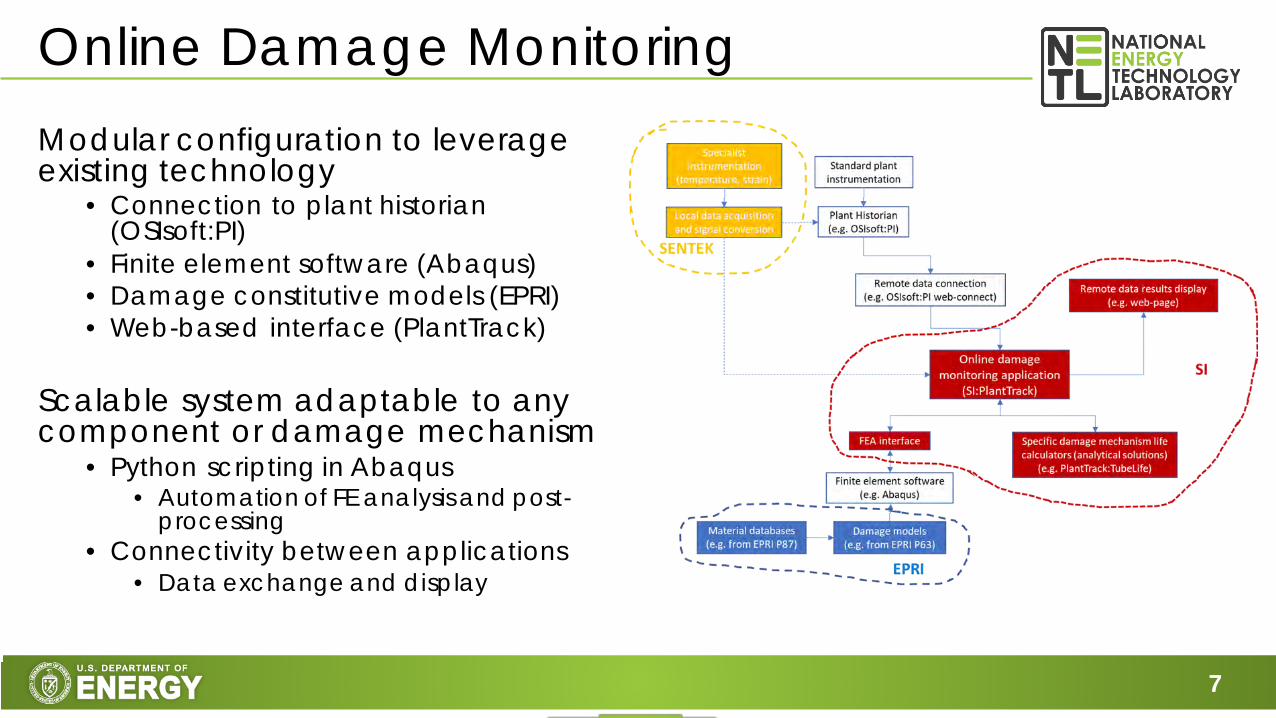
Modular configuration to leverage existing technology
• Connection to plant historian (OSIsoft:PI)
• Finite element software (Abaqus)• Damage constitutive models (EPRI)• Web-based interface (PlantTrack)
Scalable system adaptable to any component or damage mechanism
• Python scripting in Abaqus• Automation of FE analysis and post-
processing• Connectivity between applications
• Data exchange and display
Online Damage Monitoring

8
Overall view of the front secondary superheat outlet header (SSOH) and a cross-section through an assembly with a steam cooled spacer tube (SCST)
• 73 tube assemblies across the length of each header (two SSOH’s).• Each assembly has 10 tube penetrations.• Three steam cooled spacer tubes (SCST) along the front header
length and 1 SCST on the rear SSOH.
Demonstration site: AEP Amos Plant, Unit 3 (1973)Secondary Superheat Outlet Headers
9
SCST
A
BC
DEF
H
I
J0.90”
0.78”
1.34”
0.74”G 0.60”
0.66”0.59”
0.45”
0.63”
0.30”
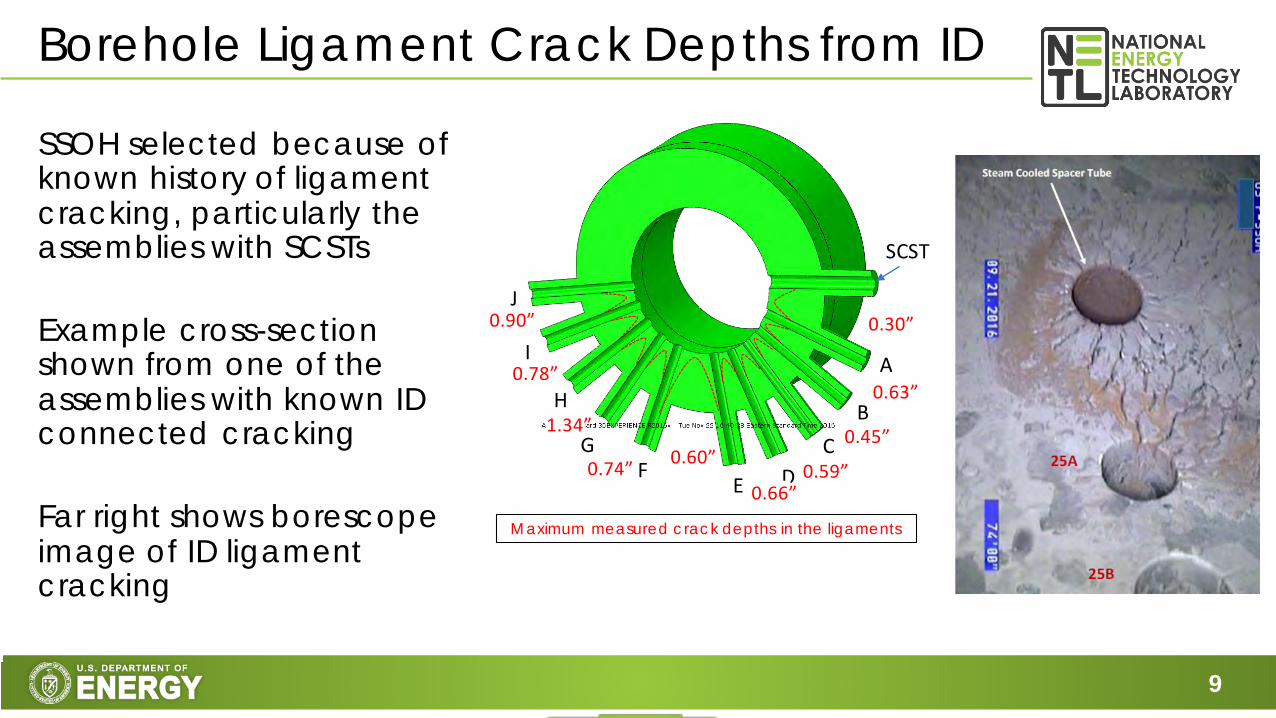
SSOH selected because of known history of ligament cracking, particularly the assemblies with SCSTs
Example cross-section shown from one of the assemblies with known ID connected cracking
Far right shows borescope image of ID ligament cracking
Borehole Ligament Crack Depths from ID
Maximum measured crack depths in the ligaments

10
Axial stress during cold start-upAxial stress during forced cooldown
Stress contour plots generated from initial fitness-for-service (FFS) assessmentID tube borehole edges experience high tensile and compressive stresses during cycling which leads to thermal fatigue damage and ligament cracking
• Caused by top-to-bottom temperature differentials which in turn causes constrained thermal stresses at tube borehole edges
3D Finite Element Analysis

11
Mechanism of damage and cracking shown to be thermal fatigue based on the pattern, location, and supporting FE analysis.
• Most significant cracking observed adjacent to SCST• Typical start-up/shutdown cycles experienced by the header do not explain the
damage.• Condensate entering from the SCST offered one plausible explanation as to why the
damage would be localized to the SCST assemblies
Not sufficient local thermocouple data to assess the temperature response that may be leading to the damage
• Local temperature sensor thermocouples (TC’s) mounted on the steam cooled spacer tubes (SCST’s) to quantify frequency and magnitude of local transients
• Critical for tuning the FEA model to simulate operating (thermal) data
Conclusions of Initial FFS Assessment

12
AEP installed new temperature sensors across the header concentrated around the SCST’s
New Temperature Instrumentation

13
Snippet of temperature data from the thermocouples during unit startups
SCST much cooler temperature than the adjacent tubes
At approximately 9:30, the tubes experience a significant downshock to SCST Temp
Example Thermal Shock During Startup
SCST
Local Tubes Near SCST
14
Thermocouples provide frequency and magnitude of local transients, however additional FE analyses required quantify the stresses, strains, and damage from each
No way to quantify the relative significance that partial improvements have on damage accumulation rates
Opportunity to leverage existing FE model and configure a near real-time damage tracking solution that accounts for most recent operating data
• Tracking locations with known damage• Tracking damage development in locations where wear-out failures are expected• Especially relevant given the age of the fleet and the increasing demand toward flex-ops.
Increased accuracy possible through local strain gauges • Allow material properties to be fine-tuned
Opportunity for Integrated Boiler Management System
15
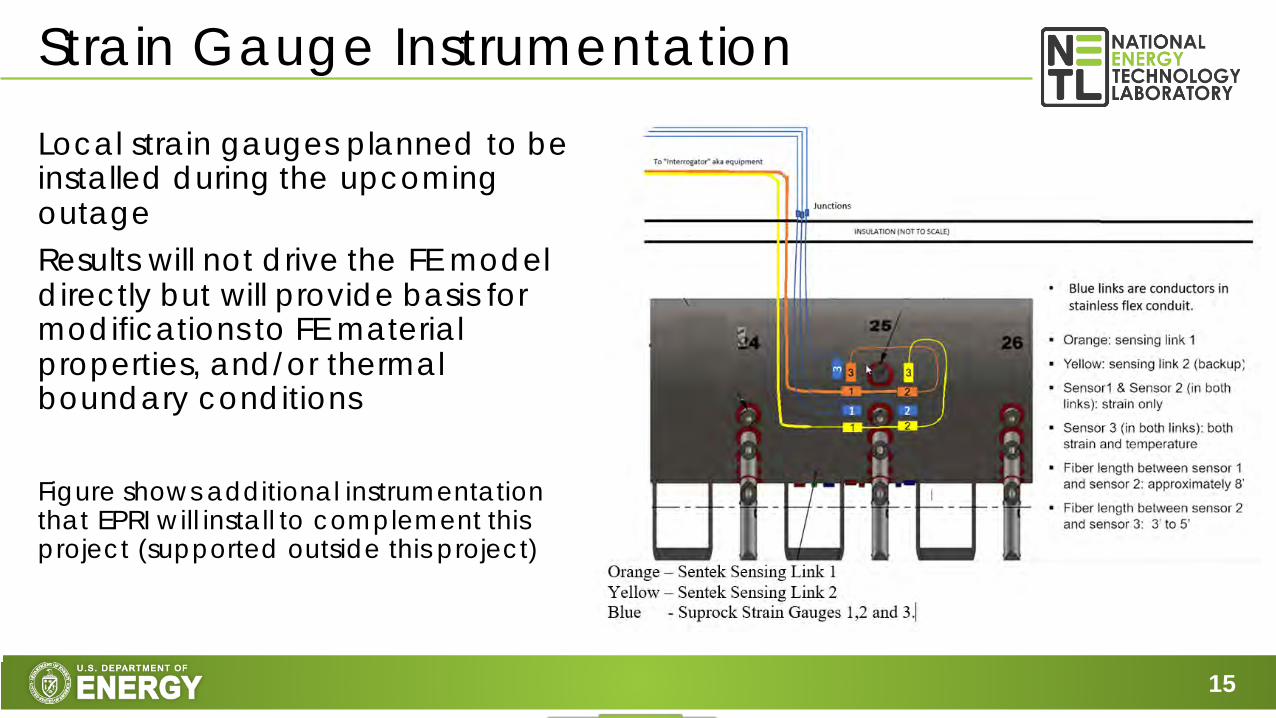
Local strain gauges planned to be installed during the upcoming outageResults will not drive the FE model directly but will provide basis for modifications to FE material properties, and/or thermal boundary conditions
Figure shows additional instrumentation that EPRI will install to complement this project (supported outside this project)
Strain Gauge Instrumentation
16
Condition Monitoring Software Architecture

17
Analytics Library
Analytics Engine[Scheduled Task]
Connection Info
Intermediate Process
Information
OSIsoft PI Asset/Process Info
Configuration Files
EtaPRO
Event Hub
Data Sources
Task/Jobs Info
PlantTrack
CSV Files
CSV Files
Emerson EDS
LabView
Other
Destination
Connector Connector
Analytics Framework

18
Connectors: Standard data connectors that can used to pull data from data historians. We continue adding to this as required for other data historians.
Analytics Library: We build the analytics in a way that they can be used from the analytics engine or web/desktop UI.
Analytics Engine: This engine is used to orchestrate getting the data from the source, executing the analytic and pushing the results to PlantTrack.
Key components of the Analytics
19
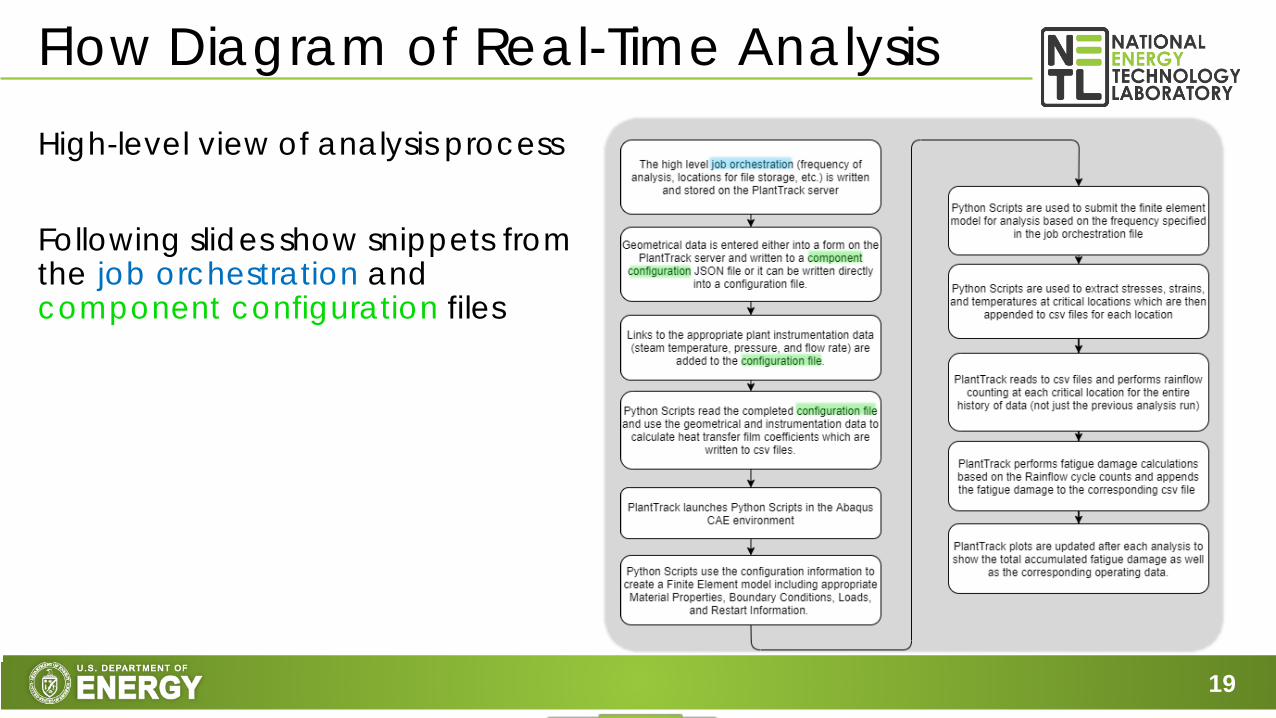
High-level view of analysis process
Following slides show snippets from the job orchestration and component configuration files
Flow Diagram of Real-Time Analysis

20
Job Orchestration

21
Component Configuration
22
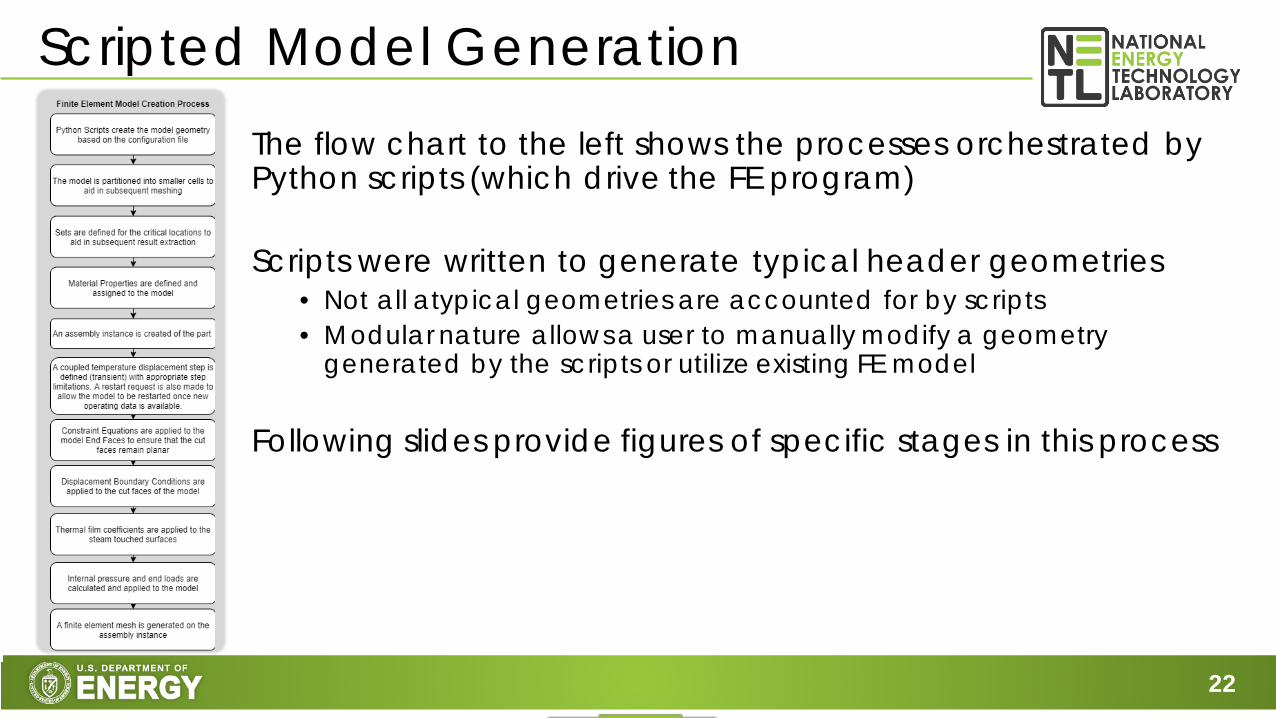
The flow chart to the left shows the processes orchestrated by Python scripts (which drive the FE program)
Scripts were written to generate typical header geometries• Not all atypical geometries are accounted for by scripts• Modular nature allows a user to manually modify a geometry
generated by the scripts or utilize existing FE model
Following slides provide figures of specific stages in this process
Scripted Model Generation

23
FE Model Monitoring Locations
Tube 0
Tube 1
For monitoring damage and crack development on the axial and circumferential ligaments, stresses are extracted at three locations around each tube borehole (Left, Middle, Right)
Left
MiddleRight

24
Fixed Axial Displacements
Constrained to Remain
Planar in tube axial direction
Constrained to Remain Planar in header axial
direction
Fixed Circumferential Displacements
FE Model Displacement Boundary Conditions

25
Surface film boundary conditions are applied to the ID surfaces for thermal transientsSurface film boundary conditions require:
• Sink temperature• Measured steam temperature or a local tube
temperature (with adjustments)
• Heat Transfer Film Coefficient• Calculated based on the provided steam
temperature, pressure, and steam flow rate.• Dependent on the size of the flow path and
flow
FE Model Thermal Boundary Conditions

26
Internal pressure loading applied to the ID surfaces
End loads are also applied to the cut faces that don’t have displacement boundary constraints to balance the internal pressure
FE Model Pressure Loading
Internal Pressure
Blowoff (End Load)
on Tube End Faces
Blowoff (End Load)
on Header End Face that was
coupled to remain planar

27
Multiple options in configuration for desired mesh refinementCoarse mesh typically used for initial validationFine mesh is typically used for final analysis and continual results trendingMeshed with quadratic reduced integration brick elements
FE Model Mesh

28
Temperature (°C) vs Time
Axial Stress (MPa) at
Highlighted ID Edges vs Time
Stress Distribution at
time of Peak Stress (Mpa)
Screenshot of example analysis

29
Crack Modeling

30
Possibility of using extended finite elements (XFEM) was investigatedAllows cracks to be modeled without requiring a specific crack tip mesh
• Doesn’t require remeshing with crack growth• Allows more natural crack shapes
Only mechanism for growth in current implementation is fatigue, does not support creep crack tip parameter measurement, Ct
Crack Modeling – XFEM Method
Cracked body
Crack surfaceAssembled cracked
body and crack surfaceMeshed Model with Crack showing that the Crack doesn’t
have to conform to mesh boundaries (i.e. Mesh Independent)
31
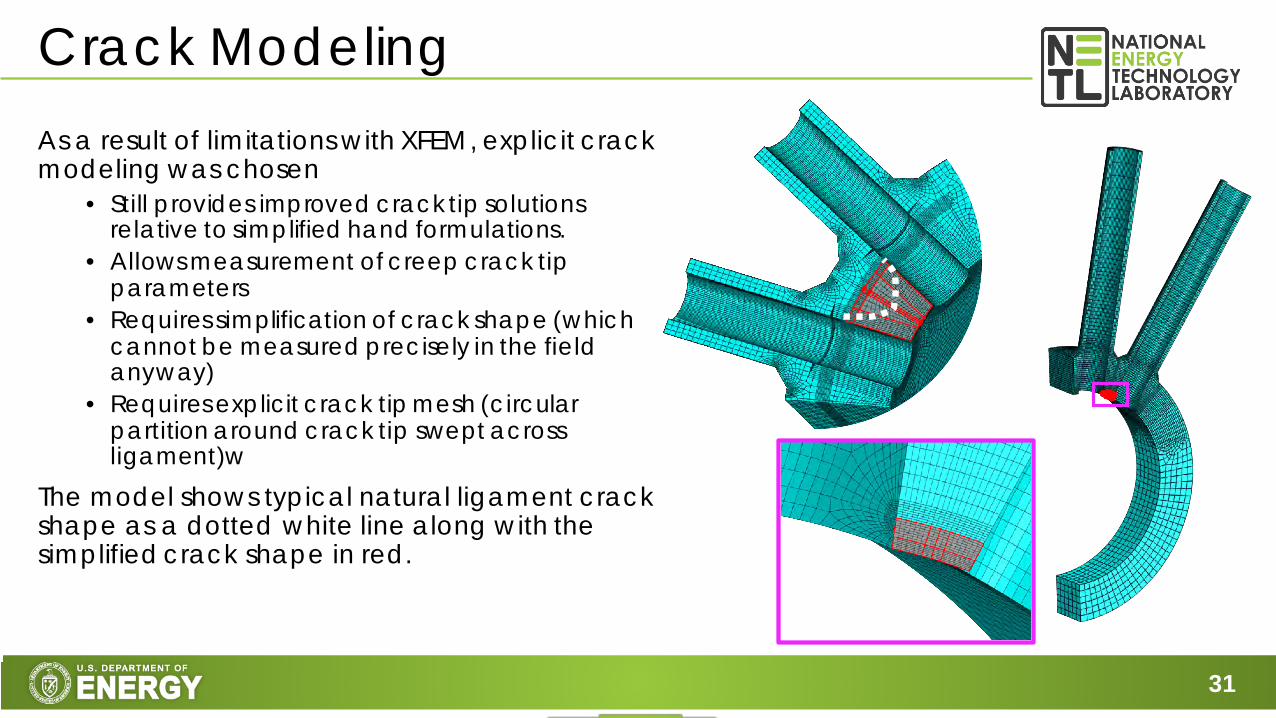
As a result of limitations with XFEM, explicit crack modeling was chosen
• Still provides improved crack tip solutions relative to simplified hand formulations.
• Allows measurement of creep crack tip parameters
• Requires simplification of crack shape (which cannot be measured precisely in the field anyway)
• Requires explicit crack tip mesh (circular partition around crack tip swept across ligament)w
The model shows typical natural ligament crack shape as a dotted white line along with the simplified crack shape in red.
Crack Modeling

32
PlantTrack Screenshots

33
Existing web-based data management system which provides a graphical user interface for:
• location specific design data • historical inspection results• maintenance and repairs actions • engineering data on either uploaded copies of
design drawings or on 3D models
Used to perform subsequent engineering analyses/calculations to help:
• prioritize locations for future inspections • aid in assessments of relevant damage mechanisms • overall life management
The following slides provide screenshots from configuration of this project
PlantTrack

34
The screenshot to the right shows the main PlantTrack screen
• On the left side of the screen as well along the top, there is a file path or tree which shows which components have been configured or can be viewed.
• File structure was built to allow monitoring multiple locations across a plant or utility
• Clicking higher up in the tree would allow the most critical locations from the further down the tree to be summarized and compared so that multiple headers could be prioritized
Main Screen

35
Option to upload drawings of each component in order to show the locations being monitored or to use for tracking historic inspection dataThe figures on this slide show the overall header geometry, tubes in an assembly, installed instrumentation
• Option to configure more locations as needed (e.g. hangers, socket welds, seam welds, etc.)
Drawings
Overall header geometry
Tubes in Assembly
Installed Instruments

36
As discussed in earlier sections, as part of this project an initial header geometry creation page was also configured
Once a user fills in the fields and clicks the “Create Geometry” option:
• Scripts launch Abaqus CAE• Generate the model • Attached PNG picture files
here for verification
Geometry Creation

37
Clicking asset details for a unit, plant, header, or assembly shows a list of monitored locationsThe screenshot to the right shows that the Amos SSOH header was configured for:
• creep damage on each tube • fatigue damage (which is currently summarizing
the results of all the tubes though each tube’s results can be seen by drilling down into this option)
• as well as strain gauge calculations and field measurements
In the future, screen will also show “predicted” crack size once explicit crack modeling has been finalized
• For each location, with and without cracks, there is also the option to upload ultrasonic inspection records showing the as-found crack sizes
Asset Details

38
For each monitored location, there is an option to drill further down into the details of the calculations by clicking the details optionPlot both the operating data used for monitoring as well as calculated creep or fatigue life at a particular locationIn the top left, there is an option to change the plot time range to drill down to specific startups/shutdowns/and or monthsAlso option to switch from the chart to tabular results
Chart Output

39
The screenshot to the right shows the tabular results mentioned on the last slide for creep damage
• Export results option which provides the user with an excel file of all the analytic results to interrogate further
Creep Damage
40
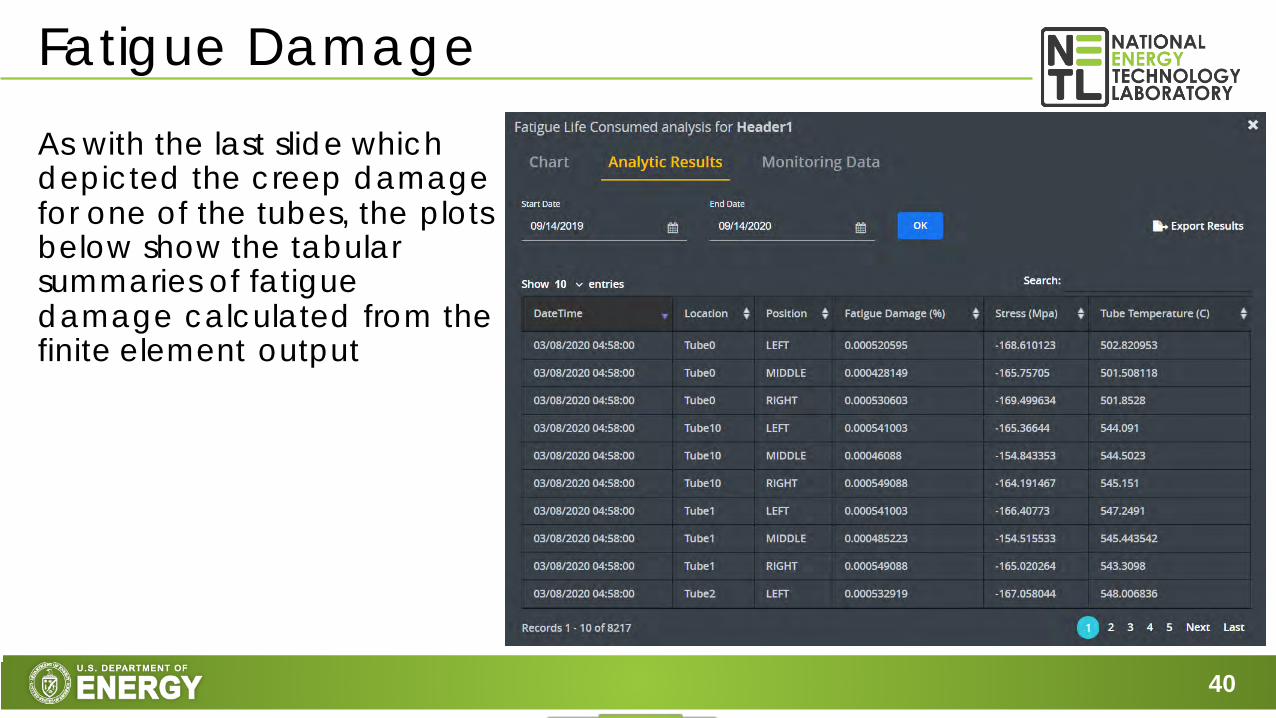
As with the last slide which depicted the creep damage for one of the tubes, the plots below show the tabular summaries of fatigue damage calculated from the finite element output
Fatigue Damage

41
Lastly, the screenshots to the right show a breakdown of the instrumentation on the headerThe intentions for the strain gauge measurements are to:
• Show the locations of gauges on the overall header on a drawing
• Show the calculated strain output from the Finite Elementmodel
• Show the measured strain output from the installed gauges (available after the gauges are installed)
• Plot the comparison
Strain Gauge Measurement

42
Phase III - 2021

43
Process real-time operating data from AEP and include strain data in PlantTrack as it becomes available
• Once the strain gauges are installed during the November outage at Amos, real data can be included in PlantTrack to compare against the calculated
Trend damage development and compare the results against the actual strain measurements from Amos and, where necessary make adjustments/refinements to the FE model and scriptsContinue to develop crack growth algorithms
• Primary task is finalizing automated crack tip meshing in the ligaments to support crack size monitoring for Amos
Phase III Tasks – Based on current status

44
Description of online damage/life monitoring system outlining the software components, architecture, and system integration
• This document will not provide the source or compiled code, but rather will outline in further detail that others can understand how the system functions and could conceivably implement a version of it
• Document specific challengers and limitations that were incurred and how these problems were solved or worked around
Description of configuration for Amos host plant, including: • definition of geometry• monitoring locations • specific set-up / assumptions made • IT architecture
Description of results of operation of the online monitoring software for a period of approximately one-year
• Documentation of boiler transients experienced and estimated damage, with appropriate off-line calculations to provide verification / validation
• Document the practicality of the approach and any lessons learned during the project• Document any steps that would be required for future commercialization
Planned Final Deliverables
SLIDE

45
Installation Plan/Plant StatusEPRI/AEP

46
Strain sensors will be installed on the Secondary Superheater Outlet Header (SSOH) Front or near tube row 25 from the left-hand side wall
• Multiple existing header thermocouples will be used• Repair/replace if necessary
Penetrations to be made through boiler casingA termination cabinet will be installed on or near the West Side of 307’ 6” elevation
• Conduits from boiler casing penetrations to cabinet• Data conversion/communication devices to be installed during
outage
Data acquisition/data processing equipment will be located inside the DCS room located on the Turbine Floor of Unit 3
• Optical fiber communication cable from cabinet to DCS room
Revised Installation PlanPenthouse Casing
Termination Cabinet Location (Approx.)
DCS Room

47
Amos Unit 3

48
Secondary Superheat Outlet Header FrontAmos Unit 3
Installation Region(‘You Are Here’)

49
Orange- Sentek Sensing Link 1Yellow - Sentek Sensing Link 2Blue - Suprock Strain Gauges
Not Shown:• Existing plant thermocouples• SI strain gauges to be installed as
needed in vicinity of Suprock gauges
Note: Installation of Sentek gauges postponed
Installation Near Tube Row #25

50
Day 1 Unit removed from service
Day 2 Plant begins cooling penthouse, as soon as practical (placeholder - plant is responsible for schedule)
Day 9 Project parties arrive on site for safety training listed in Section 6.0 of Installation Plan
Day 10*
Access to penthouse granted (tentative)Insulation removed for access to SSOH in vicinity of tube row 25Additional cooling installed at SSOH in vicinity of tube row 25Project parties (or contractor) identify location on penthouse casing for cable penetrations
Day 11 Cable penetrations performedSI begins prep of header for sensor installation
Day 12 SI and Suprock begin sensor installation
Day 13 Cables routed through penthouse casing penetration and penetration sealed
Day 14 Punchlist items and installation of sensors completedExternal wiring commences
Day 15 Complete installation of data acquisition systems in DCS room on Turbine FloorEquipment final check-out
* Access to SSOH is dependent on entry date to penthouse and sufficient cooling of SSOH
Outage Installation Schedule

51
Amos Unit 3 is Currently in an outageContractors are scheduled for installation activitiesPlant has requested project parties to be on site on or around 11/16/20 to perform installation start. (equivalent to Day 9 of Outage Installation Schedule)
Current Status

52
Advanced Fiber-Optic Design, Packaging and Attachment MethodsSentek Instrument LLC

53
Distributed temperature sensor (DTS / Sentek LGI-100)• Fiber Bragg grating (FBG)• Optical time-domain reflectometry (OTDR)
Distributed acoustic sensor (DAS / Sentek DASnova)• Fiber-optic interferometry (FOI)• Optical time-domain reflectometry (OTDR)
Quasi-distributed strain sensor • FBG + FOI• Spectral-domain, continuous detection
Sensor Systems Overview

54
Fiber Bragg grating (FBG)• Periodic structure inside the fiber• Reflects a specific wavelength• Wavelength shifts w/ temperature
Distributed temperature sensor (DTS)• Pulsed light separates sensor in time• Interrogates the reflected wavelength• High capacity, high spatial resolution and high
sensitivity
FBG & Sentek DTS Principles
Pulsed Light
FBG1FBG2 FBGn

55
Fiber-optic interferometer (FOI)• A pair of reflections• Reflected intensity oscillates w/ wavelength• Period varies with vibration-induced strain
Sentek distributed acoustic sensor (DAS)• Pulsed light for sensor separation• Fringe monitoring for acoustic vibration• Ultra-high strain sensitivity
FOI and Sentek DAS Principles
Cavity Length
Broadband Input
Interference Output
Fiber-optic Interferometer

56
FBG + FOI• Fiber-optic interferometer• Fiber Bragg grating (FBG)
Sensor Response• FOI: sensitive to temperature & strain• Thermal strain vs. Mechanical strain• FBG: temperature only (for temperature compensation)
Sentek Strain Sensor Principles

57
Status of Sensor System Development
Sensor Validation Fabrication Packaging Software
DTS In-progress
DAS In-progress
Strain Sensor In-progress In-progress

58
DTS Summary
Fabrication Sensing Fibers LGI-100 (patented)

59
DAS Summary
Fabrication DASnova Interrogator(patent pending)
Sensor Signal Map

60
Temperature/acoustic • Easy penetration into sensor
Mechanical strain affected by• Attachment method• Housing design• Materials• Learn in practice
Strain vs. Temperature / Acoustic
AcousticHeat
Part Under Test
Sensor
Strain
Housing
Attachment

61
Strain Sensor Development Review
1st test @ EPRI Dec 2019
2nd test @ EPRI Jul 2020
New design @ SentekAug/Sept 2020
Next-gen @ SentekSept/Oct 2020
– Robust attachment– Robust sensor – Limited strain response
– In-house materials– Strain transfer enhanced– Repeatability issue
– Custom design– Enhanced rigidity– Enhanced strain transfer– Parts soon to arrive
– Valid optical design– Weak attachment/welding

62
Inconel base and wingsStainless steel tubingMetallic adhesive for >1000⁰CWelded metal components
1st Test at EPRI – Sensor Design
Lead-in Housing
Wings

63
1st Test at EPRI – Sensor Installation
Load
Interrogator
SensorSensor
Lead-in
Housing
Wings

64
Strain on T-bar vs. on sensor• Not the same in practice• Calibration needed (scaling or
transfer factor)• Ideal scaling factor = 1
Scaling factor affected by• Size & geometry (thickness) • Material (Inconel)• Method of attachment (welding)
2nd Test at EPRI – Sensor Installation
Sensor 1Sensor 2
Welding spots
Sensor housing
Sensors
To interrogator
Dial gauge
T-bar

65
0.0
100.0
200.0
300.0
400.0
500.0
600.0
700.0
0 100 200 300 400 500 600 700 800 900 1000
Tem
pera
ture
(C)
Total Runtime (Hours)
Temperature (Celsius)
Ramp-up
Sentek 1 FBG
EPRITemperature (Channel 1 FBG)
• Functional• Slight discrepancy may indicate need
for annealing
Strain (Channels 1&2 FOI)• Ramp-up indicates sensors functional
(thermal strain)• Thermal + mechanical strain
Sensor Performance
0.0%
0.2%
0.4%
0.6%
0.8%
1.0%
1.2%
0 100 200 300 400 500 600 700 800 900 1000
Perc
ent C
reep
[%]
Total Runtime (Hours)
Strain * 100%
Thermal strain
Sentek 2
Sentek 1
Str
ain

66
Remove ramp-up (thermal strain)Channel 1: reduced response
• Small scaling factor• Large packaging thickness
Channel 2: minimal response• Minimal scaling factor
Fiber Sensor vs. Dial GaugeMechanical Strain
-0.20%0.00%0.20%0.40%0.60%0.80%1.00%1.20%1.40%1.60%
0 100 200 300 400 500 600 700 800 900 1000
Perc
ent C
reep
[%]
Runtime from 600C (Hours)
Strain * 100%
EPRI
Sentek 2 Sentek 1

67
Sensors alive and functional • Temperature sensing validated• Robustness confirmed
Need to maximize strain transfer• New design• Minimize cross-section thickness• Minimize housing width• Maximize force transfer• Use in-house materials for quick results
2nd Test Conclusions
Baseplate (125µm)
Width
Thickness

68
Large strain responseRepeatability issue (reduced rigidity in handling and installation)Next-generation design
• Custom parts• Increase rigidity and maintain large strain transfer
New Design – Testing
Sensor Assembly Strain Testing
Signal MonitoringStep strain response

69
Custom parts to maximize design flexibilityEnhanced sensor rigidity and repeatabilityEnhanced strain transfer factor
Next-generation Design

70
Status of Sensor System Development
Sensor Validation Fabrication Packaging Software
DTS In-progress
DAS In-progress
Strain Sensor In-progress In-progress

71
Instrumentation Data Access PlanEPRI/AEP

72
Robust data to be generated during monitoring phase• Multiple instruments, frequent data recording• Daily output for monitoring• Plant PI data historian
• Existing plant instrumentation• Plant operating data
Extensive cyber security discussions held with AEP• Team access to AEP network not practical• Structural Integrity Associates has approved limited AEP network access through other
work• Leverage access for DOE project

73
Approach• Single laptop to have limited network
access• SI computer already has approved access
to AEP network from prior activities• Shared folder to be created on SI laptop• Other participants will write instrumentation
data to shared folder on SI laptop• Laptops connected via plant LAN• No external network and/or internet access
• AEP will configure laptops when on site at start of demonstration
Proposed Instrumentation Network Configuration

74
AEP will remotely access SI laptop at determined frequency (e.g., daily)
• Retrieve instrumentation data files from shared folder
• Place on external ftp site
AEP will also place plant operating data on ftp siteAll project participants will have access to ftp site
Data Management During Demonstration

75
Project plan is to monitor operation for one yearWhat if issues arise?
• Laptop operation• Plant LAN• Unanticipated outage
AEP will have administrative access to all laptops to address IT issues, as warrantedPlant visits, if necessarySuccess of integrated boiler management system can be demonstrated with nominal period of operation (varying operating profiles)Tracking accumulation of creep/fatigue damage can continue beyond project timeline
Data Monitoring

76
Closing Remarks

77
Integrated boiler management system and additional instrumentation ready for deployment at AEP Amos U3 during 4Q 2020 outageMobilization in progress at Amos U3 to host project activitiesProposed IT configuration approach developed and agreed by all parties. Implementation ready to commence during outage.Installation of Sentek gauges delayed until future outage
Closing Remarks