Embed Size (px)
Citation preview
Integrated design of castings: effect of porosity on mechanical performance
This article has been downloaded from IOPscience. Please scroll down to see the full text article.
2012 IOP Conf. Ser.: Mater. Sci. Eng. 33 012069
(http://iopscience.iop.org/1757-899X/33/1/012069)
Download details:
IP Address: 128.255.19.162
The article was downloaded on 11/07/2012 at 16:53
Please note that terms and conditions apply.
View the table of contents for this issue, or go to the journal homepage for more
Home Search Collections Journals About Contact us My IOPscience
Integrated design of castings: effect of porosity on mechanical performance
R A Hardin and C Beckermann Department of Mechanical and Industrial Engineering, University of Iowa, Iowa City, IA 52242, USA
E-mail: [email protected]
Abstract. Porosity can significantly reduce the strength and durability of castings in service. An integrated design approach has been developed where casting simulation is combined with mechanical performance simulations. Predictions of the porosity distribution from the casting process simulation are transferred to and used in stress and fatigue life simulations. Thus, the effect of casting quality on service performance can be evaluated. Results of a study are presented where the measured porosity distribution in cast steel specimens is transferred to an elasto-plastic finite-element stress analysis model. Methods are developed to locally reduce the mechanical properties according to the porosity present, without having to resolve individual pores. Plastic deformation is modeled using porous metal plasticity theory. The predictions are compared to tensile measurements performed on the specimens. The complex deformations and the reductions in the ductility of the specimens due to porosity are predicted well. The predicted stresses are transferred to a fatigue analysis code that takes the porosity distribution into account as well. The measured and predicted fatigue lives are also in good agreement. Finally, the results of a case study are presented that illustrate the utility of the present integrated approach in optimizing the design of a steel casting.
1. Introduction Discontinuities in castings, like porosity, create uncertainty in a casting design’s robustness. There are no standard methodologies to account for its presence in the design. Consequently, designers employ overly large safety factors to entire cast parts to ensure reliability. Contributing to the issue, the processes of designing and producing castings are usually uncoupled, except for the specification of non-destructive evaluation (NDE) requirements. Unless design engineers have test data or experience for a part, they request NDE requirements without knowing how the NDE relates to part performance. If porosity could be accurately predicted from casting simulation, and its effects on the part performance realistically modeled, engineers could develop robust designs that are tolerant of the porosity and reliable. Also, NDE could be intelligently specified to assure component performance.
In this work, porosity is measured using radiography, engineering approaches are applied to simulate the effect of porosity on stiffness, deformation, damage, fracture, and fatigue life of cast steels, and the simulation results are compared to measurements. The steels studied here (ASTM A216 Grade WCB and AISI 8630) have a combination of good ductility and strength. For example WCB steel has 248 MPa yield strength, 485 MPa tensile strength, and 22% elongation at failure as minimum tensile requirements. Failure of such ductile metals occurs on the microscale by mechanisms of void nucleation, growth and coalescence [1]. Voids can preexist as microporosity and nucleate from
MCWASP XIII IOP PublishingIOP Conf. Series: Materials Science and Engineering 33 (2012) 012069 doi:10.1088/1757-899X/33/1/012069
Published under licence by IOP Publishing Ltd 1
imperfections like second phase particles. Voids grow from increasing local stress and plastic straining. As voids nucleate and grow, the void volume fraction increases. The voids begin to interact, and the void volume fraction where interaction between voids begins is termed the critical void volume fraction fc. As plastic strain continues increasing, local necking and coalescence occurs between voids until a connected chain of voids forms and failure occurs. The void fraction at which fracture occurs is the failure void volume fraction fF.
Porosity has detrimental effects on the structural performance of steel castings. Literature in the areas of stiffness, strength, fatigue and component performance in the presence of porosity has been reviewed [2,3]. It is found that microporosity does not result in a measurable loss of stiffness, large stress concentrations, or stress redistribution, but it greatly affects fatigue resistance [4,5]. Microporosity reduces the ductility of metals since microvoids pre-exist before any stress is applied; the nucleation stage is bypassed. Macroporosity in metals causes gross section loss, and locally reduces the effective stiffness [6-8]. Macroporosity is not uniformly distributed throughout the entire cast part, and the casting material properties are inhomogeneous. Stress redistribution occurs in a cast part due to macropores and holes, and stress concentrations occur near them, which lead to localized plastic deformation and the development of micro-cracks causing failure. The elastic-plastic behavior of the porous materials in the 10% to 70% porosity range has a non-linear dependence on the amount of porosity [2,6-9]. Materials having porosity less than approximately 10% exhibit mechanical properties having a linear dependence on porosity amount assuming that voids do not interact [10] and by considering isolated pores [11], or a uniform distribution of pores [12]. Applying the micromechanical mechanisms of ductile failure described previously, numerous micromechanics-based models of ductile failure have been developed over the past two decades [13]. Porous metal plasticity is an often used micromechanical model of ductile failure, and it has been implemented in the commercial finite element analysis (FEA) software ABAQUS [14-15]. In this model, the volume fraction of porosity is a primary state variable, and the inelastic flow of the material is modeled as voids nucleate, grow and coalesce at higher strains until failure occurs.
Here steel castings with porosity were produced, made into specimens and radiographed. The porosity was quantitatively determined from the radiographs. The castings underwent fatigue and tensile testing. Using porosity data from the radiographs, finite element models of the test specimens with porosity were created and the testing simulated using elastic properties that are locally dependent on porosity and using porous metal plasticity to predict plasticity and ductile failure behavior of steel with porosity. A multi-axial strain-life model is used to predict fatigue life. Results from the simulated material behavior are compared with measurements.
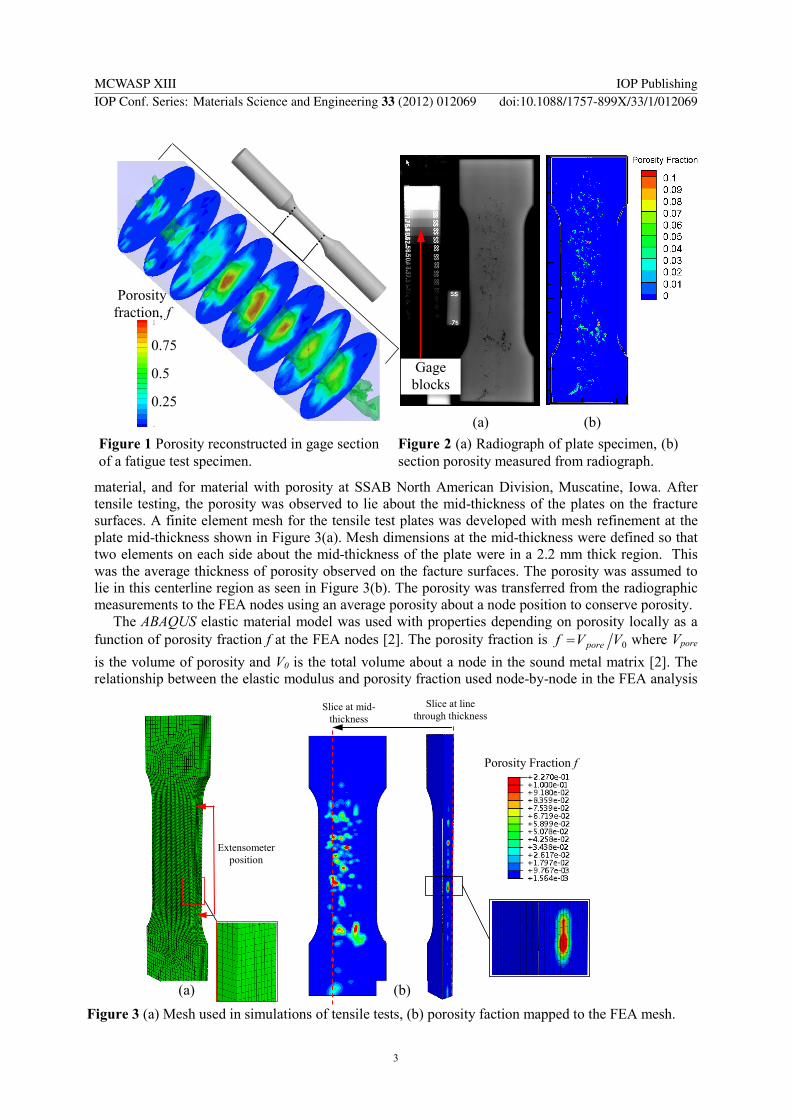
2. Procedures The effect of porosity on the elastic properties of steel was studied using cylindrical test specimens having 5 mm diameter gage section made from 8630 quenched and tempered steel. The as-cast specimen was designed to position porosity in the machined specimen gage section (details in [2]). Elastic properties were measured from stable cycle hysteresis loops during fatigue testing. The measurements were compared to simulations to determine the dependence of elastic properties on porosity that gave the best agreement. Radiographs of the cylindrical/elastic property specimens were taken from orthogonal directions to reconstruct their porosity fields for simulations [2] as shown in Figure 1. For the plasticity and ductile failure studies, WCB steel specimens were produced from 2.5 mm thick x 12.7 cm wide vertically cast, top-risered, plates of two lengths (38.1 cm and 45.7 cm). Nine plates were produced and tested. The cast plates were normalized and tempered, and machined into 1.91 cm thick tensile test coupons having a gage section width of 8.64 cm. Other dimensions were determined by the ASTM E8 tensile test standard. Radiographs were taken of the plate specimens (shown in Figure 2(a)) in which stepped gage blocks were placed. A calibration curve for radiographic grey level versus plate thickness was determined. Filtering and background corrections were performed and indications were identified and analyzed to measure the through section porosity seen in Figure 2(b). Tensile testing was performed at the University of Iowa for the sound porosity-free
MCWASP XIII IOP PublishingIOP Conf. Series: Materials Science and Engineering 33 (2012) 012069 doi:10.1088/1757-899X/33/1/012069
2
Porosity Fraction f
Slice at mid-thickness
Slice at line through thickness
Extensometer position
Figure 3 (a) Mesh used in simulations of tensile tests, (b) porosity faction mapped to the FEA mesh.
(a) (b)
material, and for material with porosity at SSAB North American Division, Muscatine, Iowa. After tensile testing, the porosity was observed to lie about the mid-thickness of the plates on the fracture surfaces. A finite element mesh for the tensile test plates was developed with mesh refinement at the plate mid-thickness shown in Figure 3(a). Mesh dimensions at the mid-thickness were defined so that two elements on each side about the mid-thickness of the plate were in a 2.2 mm thick region. This was the average thickness of porosity observed on the facture surfaces. The porosity was assumed to lie in this centerline region as seen in Figure 3(b). The porosity was transferred from the radiographic measurements to the FEA nodes using an average porosity about a node position to conserve porosity.
The ABAQUS elastic material model was used with properties depending on porosity locally as a function of porosity fraction f at the FEA nodes [2]. The porosity fraction is 0VVf pore= where Vpore is the volume of porosity and V0 is the total volume about a node in the sound metal matrix [2]. The relationship between the elastic modulus and porosity fraction used node-by-node in the FEA analysis
Figure 1 Porosity reconstructed in gage section of a fatigue test specimen.
Porosity fraction, f
0.75
0.5
0.25
Gage blocks
(a) (b) Figure 2 (a) Radiograph of plate specimen, (b) section porosity measured from radiograph.
MCWASP XIII IOP PublishingIOP Conf. Series: Materials Science and Engineering 33 (2012) 012069 doi:10.1088/1757-899X/33/1/012069
3
∂∂
+∂∂
−=∂∂
= SIσ qqp
pl φφλφλε23
31
( ) 0123cosh2 2
32
1
2
=+−
−+
= fq
pqfqq
yy σσφ
was ( ) 5.20 5.01 fEE(f) −= where E0 was 198 GPa for WCB steel and 207 GPa for 8630 steel. The
Poisson ratioν was dependent on f using ( )SS ff(f) νννν −+= ∞∞ )( with ∞ν = 0.14, ∞f = 0.472 and the Possion ratio for the sound steels was Sν = 0.3.
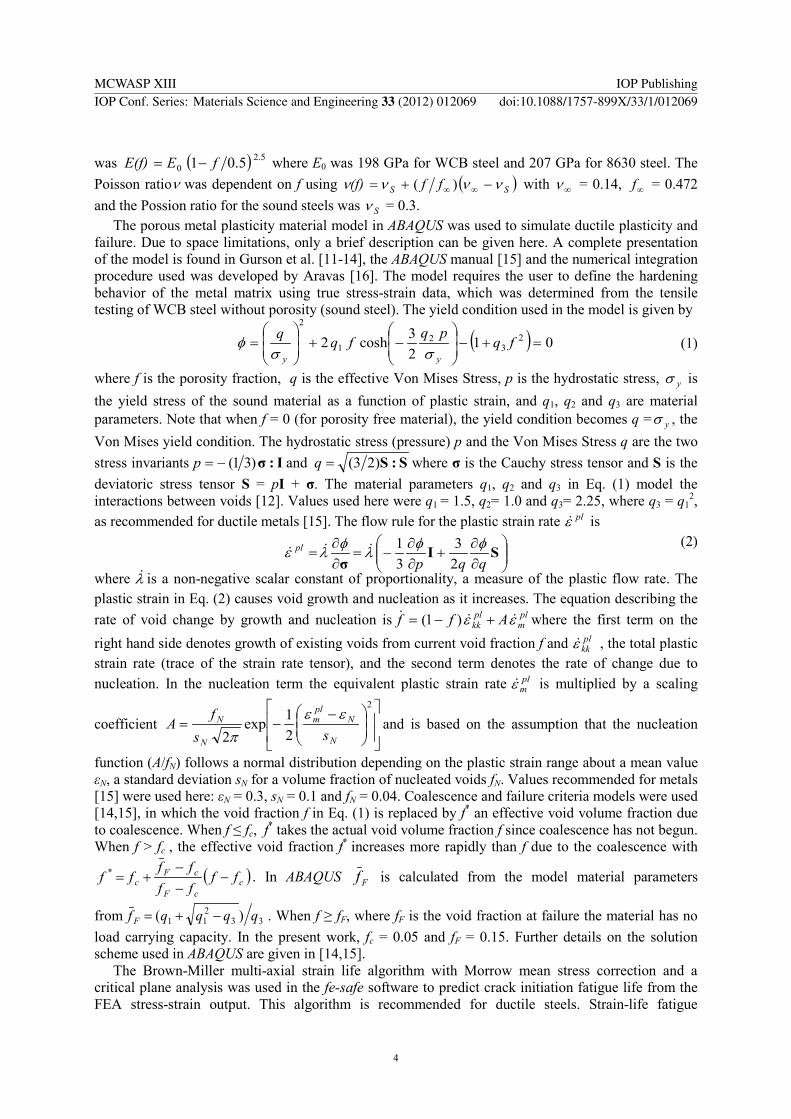
The porous metal plasticity material model in ABAQUS was used to simulate ductile plasticity and failure. Due to space limitations, only a brief description can be given here. A complete presentation of the model is found in Gurson et al. [11-14], the ABAQUS manual [15] and the numerical integration procedure used was developed by Aravas [16]. The model requires the user to define the hardening behavior of the metal matrix using true stress-strain data, which was determined from the tensile testing of WCB steel without porosity (sound steel). The yield condition used in the model is given by
(1)
where f is the porosity fraction, q is the effective Von Mises Stress, p is the hydrostatic stress, yσ is the yield stress of the sound material as a function of plastic strain, and q1, q2 and q3 are material parameters. Note that when f = 0 (for porosity free material), the yield condition becomes q = yσ , the Von Mises yield condition. The hydrostatic stress (pressure) p and the Von Mises Stress q are the two stress invariants I:σ)31(−=p and S:S)23(=q where σ is the Cauchy stress tensor and S is the deviatoric stress tensor S = pI + σ. The material parameters q1, q2 and q3 in Eq. (1) model the interactions between voids [12]. Values used here were q1 = 1.5, q2= 1.0 and q3= 2.25, where q3 = q1
2, as recommended for ductile metals [15]. The flow rule for the plastic strain rate plε is
(2)
where λ is a non-negative scalar constant of proportionality, a measure of the plastic flow rate. The plastic strain in Eq. (2) causes void growth and nucleation as it increases. The equation describing the rate of void change by growth and nucleation is pl
mplkk Aff εε
+−= )1( where the first term on the right hand side denotes growth of existing voids from current void fraction f and pl
kkε , the total plastic strain rate (trace of the strain rate tensor), and the second term denotes the rate of change due to nucleation. In the nucleation term the equivalent plastic strain rate pl
mε is multiplied by a scaling
coefficient
−−=
2
21exp
2 N
Nplm
N
N
ssf
Aεε
πand is based on the assumption that the nucleation
function (A/fN) follows a normal distribution depending on the plastic strain range about a mean value εN, a standard deviation sN for a volume fraction of nucleated voids fN. Values recommended for metals [15] were used here: εN = 0.3, sN = 0.1 and fN = 0.04. Coalescence and failure criteria models were used [14,15], in which the void fraction f in Eq. (1) is replaced by f* an effective void volume fraction due to coalescence. When f ≤ fc, f* takes the actual void volume fraction f since coalescence has not begun. When f > fc , the effective void fraction f* increases more rapidly than f due to the coalescence with
( )ccF
cFc ff
ffff
ff −−−
+=* . In ABAQUS Ff is calculated from the model material parameters
from 33211 )( qqqqf F −+= . When f ≥ fF, where fF is the void fraction at failure the material has no
load carrying capacity. In the present work, fc = 0.05 and fF = 0.15. Further details on the solution scheme used in ABAQUS are given in [14,15].
The Brown-Miller multi-axial strain life algorithm with Morrow mean stress correction and a critical plane analysis was used in the fe-safe software to predict crack initiation fatigue life from the FEA stress-strain output. This algorithm is recommended for ductile steels. Strain-life fatigue
MCWASP XIII IOP PublishingIOP Conf. Series: Materials Science and Engineering 33 (2012) 012069 doi:10.1088/1757-899X/33/1/012069
4
properties for the sound material were used; the fatigue strength coefficient σf′, the fatigue strength exponent b, the fatigue ductility coefficient εf′, and the fatigue ductility exponent c. These are measured for the material without discontinuities. Because porosity results in stress redistribution, and pores acting locally as notches and stress concentration sites, it was important to consider the size and geometry of the pores, and these variables relative the size of the computational grid. Therefore an adaptive subgrid technique was employed to improve the model’s ability to predict the detrimental effects of porosity that a coarse computational grid cannot resolve [3]. The steps required to compute the fatigue notch factor and fatigue properties [3] can be summarized as: 1) a pore size model was used to define the maximum pore radius as function of porosity fraction f, 2) a local sub-grid model, using spherical stress concentration factors Kt, was used to correct the FEA stresses to account for un- or under-resolved local stresses at pores, and 3) a local fatigue notch factor Kf was calculated as a function of Kt, maximum pore radius and material notch sensitivity (Neuber/Peterson). The entire process was incorporated within the constraints of the commercial software fe-safe, and software has been developed to facilitate this process from casting simulation to performance prediction. Due to space limitations here, the reader should consult [3] for details.
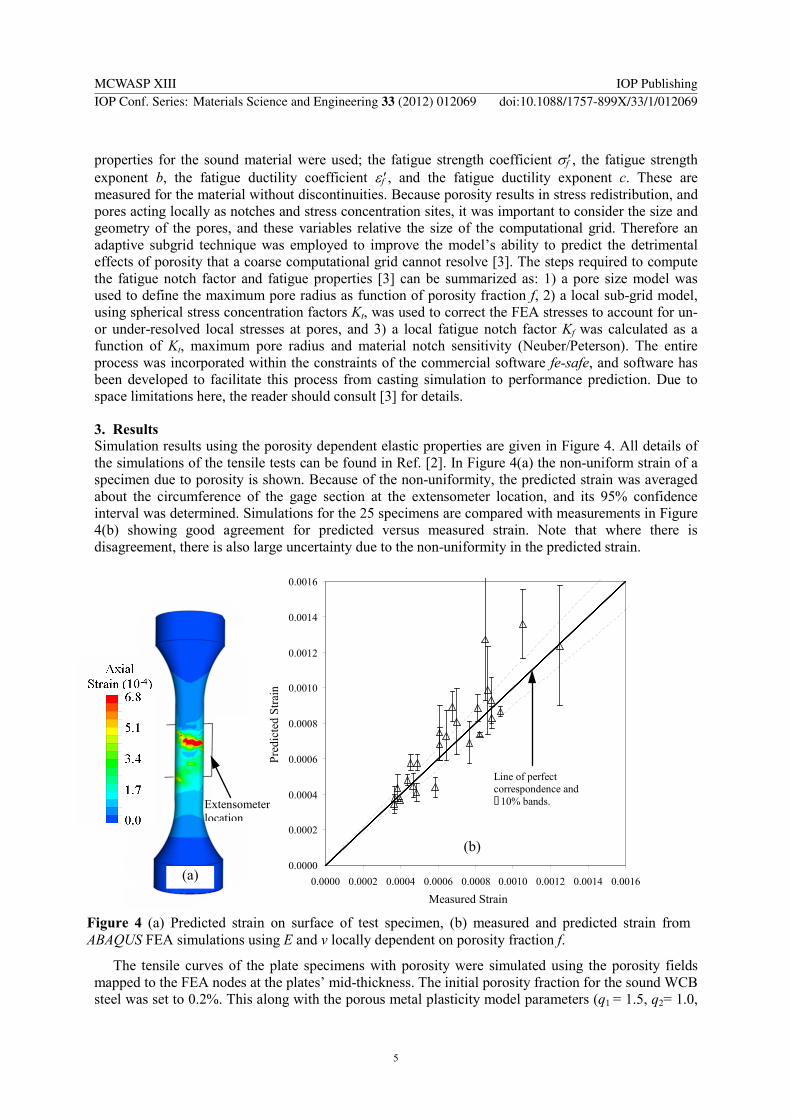
3. Results Simulation results using the porosity dependent elastic properties are given in Figure 4. All details of the simulations of the tensile tests can be found in Ref. [2]. In Figure 4(a) the non-uniform strain of a specimen due to porosity is shown. Because of the non-uniformity, the predicted strain was averaged about the circumference of the gage section at the extensometer location, and its 95% confidence interval was determined. Simulations for the 25 specimens are compared with measurements in Figure 4(b) showing good agreement for predicted versus measured strain. Note that where there is disagreement, there is also large uncertainty due to the non-uniformity in the predicted strain.
The tensile curves of the plate specimens with porosity were simulated using the porosity fields mapped to the FEA nodes at the plates’ mid-thickness. The initial porosity fraction for the sound WCB steel was set to 0.2%. This along with the porous metal plasticity model parameters (q1 = 1.5, q2= 1.0,
Figure 4 (a) Predicted strain on surface of test specimen, (b) measured and predicted strain from ABAQUS FEA simulations using E and ν locally dependent on porosity fraction f.
0.0000
0.0002
0.0004
0.0006
0.0008
0.0010
0.0012
0.0014
0.0016
0.0000 0.0002 0.0004 0.0006 0.0008 0.0010 0.0012 0.0014 0.0016Measured Strain
Pred
icte
d St
rain
Line of perfect correspondence and �10% bands.
Measured Strain
Pred
icte
d St
rain
(b)
Extensometer location
(a)
MCWASP XIII IOP PublishingIOP Conf. Series: Materials Science and Engineering 33 (2012) 012069 doi:10.1088/1757-899X/33/1/012069
5
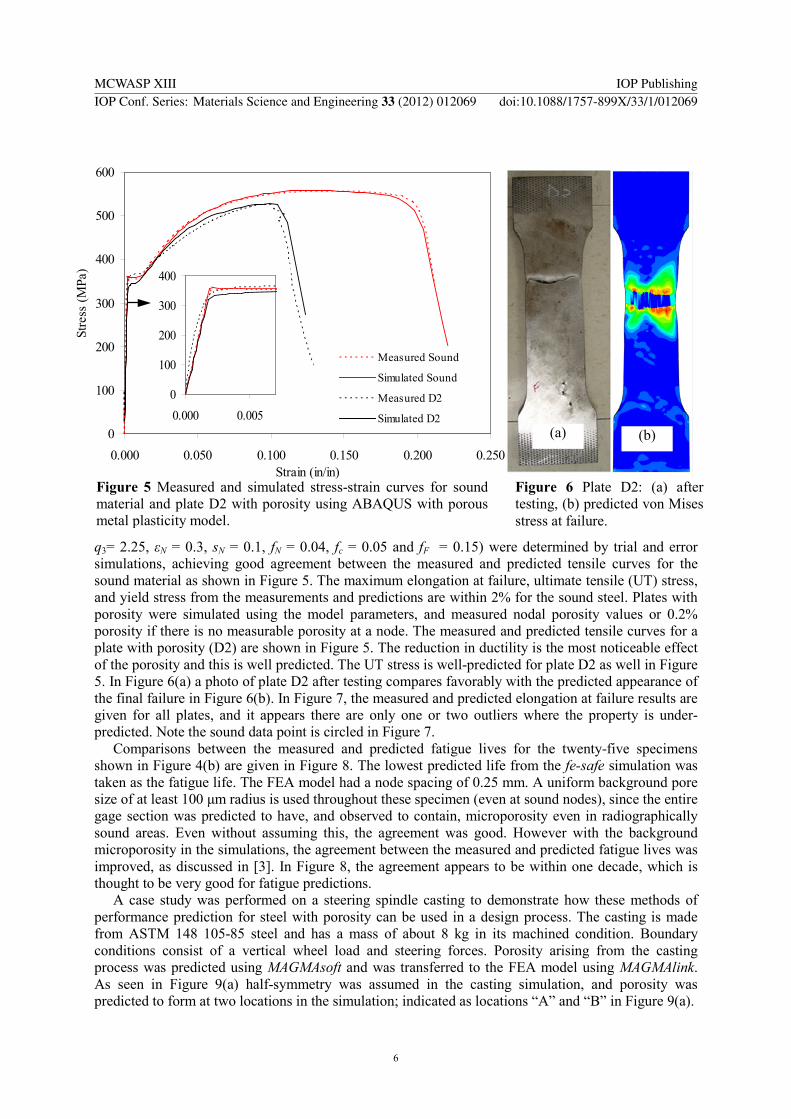
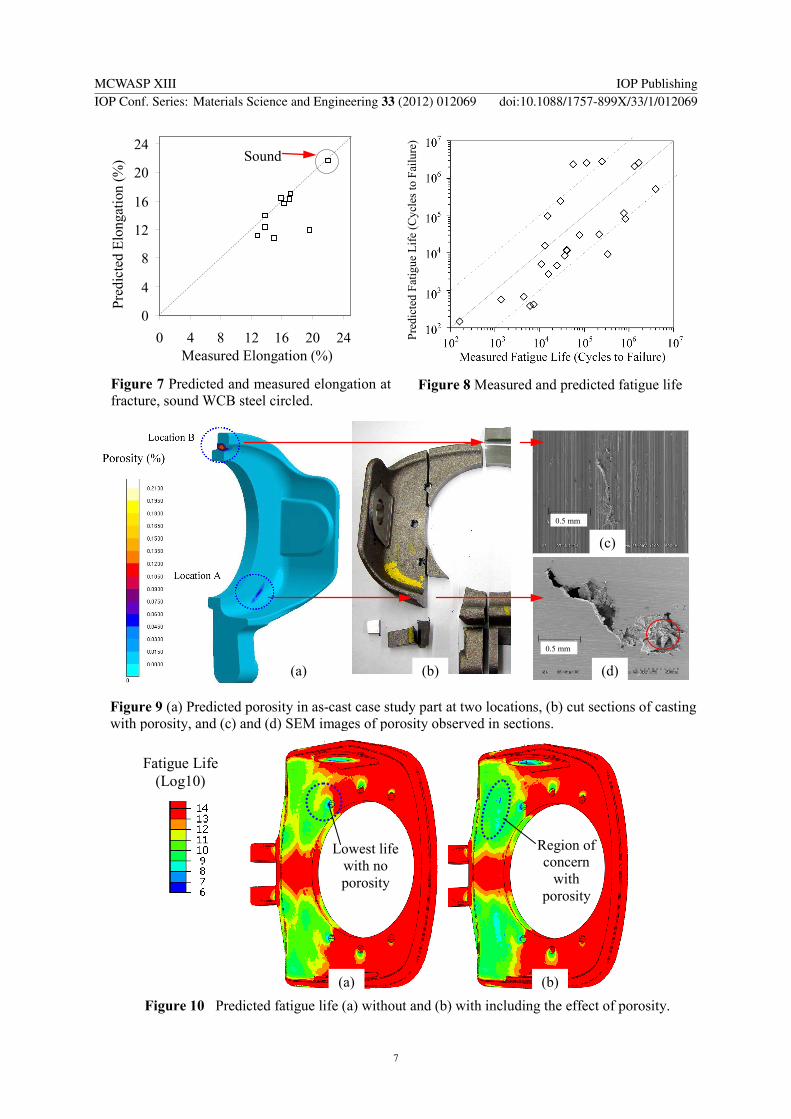
q3= 2.25, εN = 0.3, sN = 0.1, fN = 0.04, fc = 0.05 and fF = 0.15) were determined by trial and error simulations, achieving good agreement between the measured and predicted tensile curves for the sound material as shown in Figure 5. The maximum elongation at failure, ultimate tensile (UT) stress, and yield stress from the measurements and predictions are within 2% for the sound steel. Plates with porosity were simulated using the model parameters, and measured nodal porosity values or 0.2% porosity if there is no measurable porosity at a node. The measured and predicted tensile curves for a plate with porosity (D2) are shown in Figure 5. The reduction in ductility is the most noticeable effect of the porosity and this is well predicted. The UT stress is well-predicted for plate D2 as well in Figure 5. In Figure 6(a) a photo of plate D2 after testing compares favorably with the predicted appearance of the final failure in Figure 6(b). In Figure 7, the measured and predicted elongation at failure results are given for all plates, and it appears there are only one or two outliers where the property is under-predicted. Note the sound data point is circled in Figure 7.
Comparisons between the measured and predicted fatigue lives for the twenty-five specimens shown in Figure 4(b) are given in Figure 8. The lowest predicted life from the fe-safe simulation was taken as the fatigue life. The FEA model had a node spacing of 0.25 mm. A uniform background pore size of at least 100 μm radius is used throughout these specimen (even at sound nodes), since the entire gage section was predicted to have, and observed to contain, microporosity even in radiographically sound areas. Even without assuming this, the agreement was good. However with the background microporosity in the simulations, the agreement between the measured and predicted fatigue lives was improved, as discussed in [3]. In Figure 8, the agreement appears to be within one decade, which is thought to be very good for fatigue predictions.
A case study was performed on a steering spindle casting to demonstrate how these methods of performance prediction for steel with porosity can be used in a design process. The casting is made from ASTM 148 105-85 steel and has a mass of about 8 kg in its machined condition. Boundary conditions consist of a vertical wheel load and steering forces. Porosity arising from the casting process was predicted using MAGMAsoft and was transferred to the FEA model using MAGMAlink. As seen in Figure 9(a) half-symmetry was assumed in the casting simulation, and porosity was predicted to form at two locations in the simulation; indicated as locations “A” and “B” in Figure 9(a).
(a) (b) 0
100
200
300
400
500
600
0.000 0.050 0.100 0.150 0.200 0.250Strain (in/in)
Stre
ss (M
Pa)
Measured Sound
Simulated Sound
Measured D2
Simulated D2
0
100
200
300
400
0.000 0.005
Figure 5 Measured and simulated stress-strain curves for sound material and plate D2 with porosity using ABAQUS with porous metal plasticity model.
Figure 6 Plate D2: (a) after testing, (b) predicted von Mises stress at failure.
MCWASP XIII IOP PublishingIOP Conf. Series: Materials Science and Engineering 33 (2012) 012069 doi:10.1088/1757-899X/33/1/012069
6
0.5 mm
0.5 mm
Figure 10 Predicted fatigue life (a) without and (b) with including the effect of porosity.
Region of concern
with porosity
Fatigue Life (Log10)
Lowest life with no porosity
Figure 7 Predicted and measured elongation at fracture, sound WCB steel circled.
0
4
8
12
16
20
24
0 4 8 12 16 20 24Measured Elongation (%)
Pred
icte
d El
onga
tion
(%)
Pred
icte
d El
onga
tion
(%)
Measured Elongation (%)
Figure 8 Measured and predicted fatigue life
Figure 9 (a) Predicted porosity in as-cast case study part at two locations, (b) cut sections of casting with porosity, and (c) and (d) SEM images of porosity observed in sections.
(a) (b)
(c)
(d)
(a) (b)
Sound
Pred
icte
d Fa
tigue
Life
(Cyc
les t
o Fa
ilure
)
MCWASP XIII IOP PublishingIOP Conf. Series: Materials Science and Engineering 33 (2012) 012069 doi:10.1088/1757-899X/33/1/012069
7
Parts were cast, machined and radiographed, which detected porosity at location “A”. As shown in Figure 9(b), the casting was cut up in the areas of the porosity predictions, and visible porosity was found at both locations (see Figures 9(c) and (d)). The porosity field from MAGMAsoft was used in the FEA stress analysis using the methods of elastic-plastic analyses described earlier. The FEA results were then used in fe-safe to predict fatigue life for two cases: assuming no porosity and using the predicted porosity. These fatigue life predictions are given in Figures 10(a) and 10(b), respectively. Without porosity the life is predicted to be greater than 107 (runout condition) cycles except near a bolt hole, where the applied boundary condition is believed to cause an unrealistic stress concentration. In Figure 10(b) including the MAGMAsoft porosity predictions, the life is markedly lower at location “A” where porosity is predicted. This area of concern is indicated in the figure, and it was recommended that the porosity at position “A” be eliminated by modifying the casting rigging. Location “B” has a very low stresses and porosity there has no effect on fatigue life.
4. Conclusions This work demonstrates how the mechanical and fatigue behavior of cast steel with porosity can be predicted. Radiography is used to measure the porosity so it can be included in simulations. The porous metal plasticity material model in the FEA software ABAQUS gave promising predictions of the effects of porosity on plasticity and ductile failure. The model requires nine parameters which were determined for WCB steel. Using these model parameters and porosity fields mapped from the radiographs, the entire tensile test curves for castings with centerline porosity were simulated. Predicted and measured tensile curves and properties were compared, and in most cases comparisons between the ultimate stress and elongation were good. Reduction in ductility in castings is perhaps the most noticeable effect of porosity and the model predicted it well. The clearest factors contributing to any disagreement in the prediction are the limitations in the porous metal plasticity model, and the assumptions and deficiencies in determining how the porosity was distributed through the thickness of the tensile plate specimens. The authors anticipate improving this work by investigating in more detail how the porosity is distributed through the plate thickness in future work. Use of the computational tools to predict discontinuities and their effects on part performance will give engineers more confidence in their casting designs and provide a path to design optimization. Also, designers can specify non-destructive testing that is more relevant to part performance. Combining casting process modeling, stress and fatigue analysis in a comprehensive and integrated approach to the design, production and non-destructive testing of castings will advance our ability to provide reliable and high performance cast components.
References [1] Anderson T L 2005 Fracture Mechanics: Fundamentals and Apps. (Taylor & Francis) 219-231 [2] Hardin R and Beckermann C 2007 Metall. Mater. Trans. A 38A 2992-3006 [3] Hardin R A and Beckermann C 2009 Metall. Mater. Trans. A 40A 581-597 [4] Heuler p et al 1992 Fatigue & Fracture of Eng. Mat. & Structures 16 115-136 [5] Sigl K M et al 2004 Int. J. of Cast Metals Research 17 130-146 [6] Herakovich C T and Baxter S C 1999 J. of Materials Science 34 1595-1609 [7] Roberts A P and Garboczi E J 2000 J. Am. Ceram. Soc. 83 3041-3048 [8] Ramakrishnan N and Arunachalam V S 1993 J. Am. Ceram. Soc. 76 2745–2752 [9] Zhang E and Wang B 2005 Int. J. of Mech. Sci. 47 744-756 [10] Dewey J M 1947 Journal of Applied Physics 18 578-581 [11] Gurson A L 1977 J. of Eng. Mat. and Tech. 99 2–15 [12] Tvergaard V 1981 Int. J. of Fracture Mechanics 17 389–407 [13] Besson J 2010 Int. J. of Damage Mech. 19 3-52 [14] Needleman A and Tvergaard V 1984 J. Mech. Phys. Solids 32 461–490 [15] Dassault Systèmes 2010 ABAQUS Theory Manual V. 6.10, sec. 4.3.6 Porous Metal Plasticity [16] Aravas N 1987 Int. J. for Num. Methods in Eng. 24 1395–1416
MCWASP XIII IOP PublishingIOP Conf. Series: Materials Science and Engineering 33 (2012) 012069 doi:10.1088/1757-899X/33/1/012069
8