Embed Size (px)
Citation preview

0

Integrated Development Plan 2017-2022
1
Table of Contents
FOREWORD BY THE EXECUTIVE MAYOR ............................................................. 2
ACKNOWLEDGEMENT FROM THE MUNICIPAL MANAGER ...................................... 3
EXECUTIVE SUMMARY ..................................................................................... 4
1 Municipal Powers and Functions .................................... 5 2. District Municipal Area at a Glance ................................. 5 3. Geographical Context ..................................................... 6 4 Economic Profile ............................................................ 10 5. IDP Development Strategy ............................................ 12 6. Municipal Strengths, Weaknesses, Opportunities and
Threats (SWOT) .............................................................. 13 7. Municipal Comparative Synopsis ................................... 14 8. Financial Summary ......................................................... 15
CHAPTER 1: IDP PROCESS .............................................................................. 20
1.1 IDP Process .................................................................... 20 1.2 Roles and Responsibilities ............................................. 21 1.3 Public Participation ........................................................ 22 1.4 Five Year Cycle of the IDP .............................................. 22 1.5 Annual Review of the IDP .............................................. 23 1.6 Mechanisms for Alignment ........................................... 24
CHAPTER 2: LEGAL REQUIREMENTS ................................................................. 29
CHAPTER 3: SITUATIONAL ANALYSIS ................................................................ 31
3.1 Spatial Analysis ............................................................... 31 3.2 Geographical Context .................................................... 32 3.3 Environmental Context ................................................. 33 3.4 Biophysical Context ...................................................... 33 3.5 Infrastructural Context ................................................. 34 3.6 Social Context ............................................................... 35 3.7 Economical Context ...................................................... 39 3.8 Strategic Context ........................................................... 41 3.9 The Organisation ........................................................... 43 3.10 Sectoral Plans ................................................................ 48
CHAPTER 4: DEVELOPMENT STRATEGIES .......................................................... 61
4.1 Strategic Vision of the Municipality ............................... 61 4.2 National, Provincial and Municipality’s Strategic
Alignment ...................................................................... 62 4.3 Municipal Development Strategy per Function ........... 63
CHAPTER 5: 5 YEAR CORPORATE SCORECARD: DEVELOPMENT AND SERVICE DELIVERY
PRIORITIES ................................................................................................... 74
CHAPTER 6: SECTORAL CONTRIBUTIONS .......................................................... 85
6.1 National Sector Projects ............................................... 85 6.2 Provincial Sector Projects ............................................. 86
CHAPTER 7: FINANCIAL PLAN .......................................................................... 91
7.1 Capital Budget ................................................................ 91 7.2 Grants ............................................................................. 91 7.3 Financial Framework ..................................................... 92 7.4 Unfunded Projects ........................................................ 94
CHAPTER 8: PERFORMANCE MANAGEMENT ..................................................... 96
8.1 Performance Management System .............................. 96 8.2 Organisational Performance Management Linked to
Individual Performance Management .......................... 97 8.3 Corporate Performance ................................................ 98 8.4 Individual Performance: Senior Managers ................... 98 8.5 Performance Reporting ................................................ 99
LIST OF TABLES ............................................................................................ 101
LIST OF MAPS .............................................................................................. 101
LIST OF GRAPHS ........................................................................................... 101
Annexure A: Executive Summary of Climate Change Plan
Annexure B: Executive Summary of Rural Development Plan

Integrated Development Plan 2017-2022
2
F O R E W O R D B Y T H E E X E C U T I V E M A Y O R
The Integrated Development Plan of the Pixley ka Seme District
Municipality covers the five year period 2017 – 2022. We are on the fourth
generation of the democratic elected councilors since the first local
government election in December 2000. We were mandated by our
respective constituencies to ensure a better life for all. A mandate we gladly
accept and commit ourselves to throughout our term of office. This five
year IDP has presented us with an opportunity to set out objectives and
development strategies to be achieved in a five year period.
This five year IDP is premised on stakeholder engagement with the communities, business, government, NGO’s, political
parties and etc. all the above stakeholders were involved during the drafting of this IDP through internal and external
processes. The fourth generation IDP will offer and present a real partnership in action through the implementation of the
District Growth and Development Strategy and the Spatial Development Framework.
Both unemployment and inequality remains a challenge within our region, our programmes and commitment will promote
local economic empowerment and development through working with communities, private sector and labour. Job creation
and sustainable livelihoods will be the centre of district programmes as a whole. We present this Plan as a clear strategy based
on local needs. It is very essential to mention that the implementation of this plan requires an accelerated pace of
intergovernmental action and alignment to ensures that all developmental players play their part.
On behalf of the Council, I would like to take this opportunity to thank all the role players who have contributed in various
ways to this five year IDP (2017/2022). I have no doubt that through this five year IDP, we will improve Pixley ka Seme District
Municipality administratively and financially.
Allow me therefore to enter into this five year journey with these two words: “though our beginning is small, yet our latter end
will increase abundantly”- Job 8:7 and “In all our ways let us acknowledge Him, and He shall direct our paths”- Proverbs 3:6.
I thank you, Enkosi, Baie Dankie
CLL M. KIBI
EXECUTIVE MAYOR

Integrated Development Plan 2017-2022
3
A C K N O W L E D G E M E N T F R O M T H E M U N I C I P A L M A N A G E R
In terms of Section 34 of the Local Government: Municipal Systems Act,
2000 (Act 32 of 2000) each municipality is required to develop a five year
Integrated Development Plan (IDP) and review it annually to assess its
performance against measurable targets and respond to the demands of
the changing circumstances.
Through our public participation programmes, the communities of Pixley ka
Seme District Municipality have reaffirmed their needs, which include but
not limited to the following: water, employment, health and educational
facilities, SMME empowerment and support, sports and recreational facilities and etc. Some of the identified needs do not
fall within the functions of the District Municipality, but the communities tend not to differentiate between Local, District,
Provincial and National Government functions. To ensure that needs of local communities are met, this therefore demands
that the District Municipality planning are better coordinated/ integrated with Local, Provincial and National Government. The
IDP should be seen as a central tool for three spheres of Government in achieving the aim of accelerated service delivery to
our communities. This IDP is aligned with the National Development Plan 2030 vision, and it is therefore a stepping stone
towards advancing the goals of the National Development Plan.
When Council adopts the final IDP in May 2017, the council together with management will translate it into effective service
delivery for all. This five year IDP will be a plan that guides the actions and allocations of resources within the District
Municipality.
Once again, I would like to acknowledge all the officials, communities and Councillors involved in preparation this five year
IDP. A special word of acknowledgement goes to the Executive Mayor, Executive Mayoral Committee and Council for the
commitment to the IDP process.
Thank You
MR RE PIETERSE
MUNICIPALITY MANAGER

Integrated Development Plan 2017-2022
4
E X E C U T I V E S U M M A R Y
Pixley ka Seme District Municipality’s Integrated Development Plan (IDP) provides the framework to guide the Municipality’s
planning and budgeting over the course of a set legislative time frame. It is an instrument for making the Municipality more
strategic, inclusive, responsive and performance driven. The IDP is therefore the main strategic planning instrument which
guides and informs all planning, budgeting and development undertaken by the Municipality in its municipal area.
The Integrated Development Plan (IDP) is guided by the vision of the Municipality:
“Developed and Sustainable District for Future Generations”
To achieve the vision, the Municipality has committed to the mission statement:
Mission
Supporting our local municipalities to create a home for all in our towns, settlements and rural areas to render dedicated
services;
Providing political and administrative leadership and direction in the development planning process;
Promoting economic growth that is shared across and within communities;
Promoting and enhancing integrated development planning in the operations of our municipalities; and
Aligning development initiatives in the district to the National Development Plan.
Our Strategic objectives to address the vision will be:
Strategic Objectives
Compliance with the tenets of good governance as prescribed by legislation and best practice.
To provide an independent and objective internal audit assurance and consulting service to add value and to improve the
administrative operations of all the municipalities in the district through an approach that is systematic and disciplined.
Promote economic growth in the district.
To provide a professional, people centered human resources and administrative service to citizens, staff and Council.
Administer finances in a sustainable manner and strive to comply with legislative requirements to achieve a favourable
audit outcome.
To provide disaster management services to the citizens.
To provide municipal health services to improve the quality of life of the citizens.
Guide local municipalities in the development of their IDP’s and in spatial development.
Monitor and support local municipalities to enhance service delivery.

Integrated Development Plan 2017-2022
5
1 M u n i c i p a l P o w e r s a n d F u n c t i o n s
The table below indicates the functions which the Municipality is responsible. It also gives an indication if the Municipality has
sufficient capacity to fulfil these functions:
Function
Responsible for Function
Yes/No
Sufficient Capacity in terms of resources
Yes/No
Air Pollution Yes No
Building Regulations Yes Yes
Disaster Management Yes No
Local Tourism Yes No
Municipal Health Services Yes No
Control of Public Nuisances Yes No
Municipal Powers and Functions
2 . D i s t r i c t M u n i c i p a l A r e a a t a G l a n c e
Total municipal area 103 410 km² Demographics (Census 2011)
Population 186 352 Households 49 193
Selected statistics
Population growth rate (%) (2001 – 2011)
1,12% (2001–2011) Population
density(persons/km²) 1,8
Matric pass rate 2016 82.2% (Northern Cape) Proportion of households
earning less than R4800 per annum in 2011
14%
Access to basic services, 2016 – minimum service level
Water 45.1% Sanitation 72.6% Electricity 89.8% Refuse removal 74.2%
Education
Matric (Aged 20 +) 24.0% Higher education 5.4%
Economy Labour Market in 2011
GDPR Northern Cape in 2011 2.2% Unemployment rate 28.3%
GDPR South Africa in 2011 3.5% Youth unemployment rate
(ages 15 to 34) 35.4%
Largest sectors (using the relative size of the provincial economy by industry)
Finance and business services Mining Government services Wholesale, retail and motor
trade; catering and accommodation
11.6% 26.7% 12.8% 9.9%
Health in the Northern Cape (2006 data)
Health care facilities (hospitals/clinics /hospice)
Immunisation rate% HIV prevalence rate Teenage pregnancies – delivery
rate to women U/18%
42 4,8% 9,6% 22% (Northern Cape)
Serious crimes
Serious crimes Driving under the
influence of alcohol or drugs
Drug-related crime Residential burglaries
Murders Sexual offences
8888 117 860 12 107 356
District Municipal Area at a Glance

Integrated Development Plan 2017-2022
6
3 . G e o g r a p h i c a l C o n t e x t
3.1 Spatial Location
The jurisdiction of the Pixley ka Seme District Municipality (as a category C Municipality) covers an area of 103 410km², which
is also 27,7% of the total area that constitutes the Northern Cape province.
This district municipal area is the eastern-most district Municipality within the Northern Cape, and borders on the Western
Cape, Eastern Cape and Free State provinces. The map below indicates the location of the Municipality in the province:
M ap 1 . : Lo c a t i o n in t h e P r o v i n c e
There are 8 category B municipalities within the municipal are, viz. Emthanjeni, Kareeberg, Renosterberg, Siyancuma,
Siyathemba, Thembelihle, Ubuntu and Umsobomvu. The following main towns in these category B municipalities represent
an even spread throughout the district as central places and agricultural service centers: Douglas, Prieska, Carnarvon, Victoria
West, Colesberg, Hopetown and De Aar. De Aar is the ‘largest’ of these towns. The closest major city to these towns is
Bloemfontein in the Free State province.
Emthanjeni Municipality: comprising of the three towns De Aar, Britstown and Hanover. De Aar is the second most important
railway junction in the country. When the railway line was built from Cape Town to Kimberley, the administration bought a
large portion of the farm, De Aar, meaning coincidentally “artery‟, after underground water supply, envisaged as large life-
giving veins of water.

Integrated Development Plan 2017-2022
7
Kareeberg Municipality: This Municipality comprises of three towns, that is, Carnarvon, Van Wyksvlei and Vosburg. The
municipal area is the heart of the Karoo and the predominant economic activity is livestock farming. The possibilities of having
Kilometre Array Telescope befit the landscape of the Municipality that is characterised by clear skies and less pollution. This
Municipality is an entry point to the Western Cape Province from the Northern parts of the country.
Renosterberg Municipality: The Municipality is located on the banks of the Orange River. The Municipality was formed through
the amalgamation of three towns, that is, Petrusville, Vanderkloof and Phillipstown.
The Municipality covers approximately 553 000 ha of land and forms about 5% of the total area of the district.
Siyancuma Municipality: This Municipality hosts the confluence of the Vaal and the Orange River. It comprises in the main of
three towns, that is, Campbell, Douglas and Griekwastad and has densely populated rural settlement called Smitchdrift. The
municipal area is richly endowed with precious and semi-precious stones, that is, diamonds and tiger’s eye. Beneficiation of
tiger’s eye is on the high impact project identified in the District Growth and Development Strategy. The Municipality has a
great tourism potential.
Siyathemba Municipality: This Municipality is located on the banks of the Orange River and boosts with massive and high scale
irrigation farming, the river not only adds agricultural value to the Municipality but also boosts massive tourism and economic
potential. The Municipality comprises of three towns, that is, Marydale, Prieska and Niekerkshoop. The Municipality has
massive potential for mining activities of both precious and semi-precious stones. The Municipality also has the Alkantpan
testing area where international and national ammunition testing is done.
Thembelihle Municipality: This Municipality is also located on the banks of the Orange River. The Municipality was formed
through the amalgamation of three towns, that is, Hopetown, Strydenburg and Orania. The outcome of the dispute regarding
Orania has not yet been decided upon and the uncertainty still exists as to where Orania is demarcated. N12 cuts through this
municipal area and is a major boost to the economies of Hopetown and Strydenburg.
Ubuntu Municipality: The Municipality comprises of three towns that is Victoria West, Loxton and Richmond. The N12 and N1
pass through this Municipality and have a great tourism potential. The preliminary study in the district’s Mining Strategy
highlights that the Municipality is endowed with uranium deposits.
Umsobomvu Municipality: This Municipality comprises of three towns, that is, Colesberg, Norvalspond and Noupoort. N1 and
N9 traverse trough the Municipality. It shares borders with other municipalities in the Eastern Cape and Free State Provinces.
In the district this Municipality is among the municipalities that hold massive tourism potential.
Two of the abovementioned towns, viz. Prieska and Carnarvon have in recent years changed character from small rural towns
to potentially regional hubs as a result of investments in renewable energy generation and the Square Kilometre Array radio
telescope project, respectively. The maps below indicates the municipal area divided into local municipalities with their
regional location and main towns:

Integrated Development Plan 2017-2022
8
M ap 2 . : D i st r i c t M u n ic i pa l A r e a D iv i de d i n t o Lo c a l M u n ic i pa l i t ie s
M ap 3 . : M u n ic ip a l A r e a ( R e g io n a l L o c at i o n a n d M a in T o w n s )

Integrated Development Plan 2017-2022
9
3.2 Demographic Profile
The table below indicates both an increase in the population size and the number of households between 2001 and 2011, but
a decrease in the average household size over the same period. The increase in the population size from 2001 to 2011 was
preceded by a period with a negative growth rate, i.e. fewer persons in the municipal area in 2001 than in 1996 — hence, the
negative growth rate. Note that, together, the Black-African and Coloured groupings constitute more than 90% of the total
population.
Indicator 2001 2011
Population 166 547 186 351
Population growth rate -1,27% (1996-2001) 1,12% (2001–2011)
Households 41 707 49 193
People per household 3,9 3,8
Gender breakdown Males 79 927 (48.6%) 92 068 (49,4%)
Females 84 687 (51.4%) 92 284 (50,6%)
Age breakdown
0 - 14 32,6% 31,6%
15 - 64 61,5% 62,4%
65+ 5,9% 6,1%
Race Composition
Black-African 27,2% 31,5%
Coloured 62,2% 59,2%
White 10,4% 8,1%
Asian 0,1% 0,6%
Demographic Profile
3.3 Municipal Area
As mentioned above, the Pixley ka Seme District Municipality area consists of 8 local municipalities, where Ubuntu
Municipality being the largest area and Emthanjeni Municipality having the highest population. The table below provides the
km² area and total population per local Municipality:
Local Municipality Area (km²) Population Households
Emthanjeni 13 472 42 356 10 457
Kareeberg 17 702 11 673 3 222
Renosterberg 5 527 10 978 2 995
Siyancuma 16 753 37 076 9 578
Siyathemba 14 725 21 591 5 831
Thembelihle 8 023 15 701 4 140
Ubuntu 20 389 18 601 5 129
Umsobomvu 6 819 28 376 7 841
Total 103 410 186 352 49 193
Source: Statistics SA 2011 Census
Total Area and Population per Local Municipality

Integrated Development Plan 2017-2022
10
4 E c o n o m i c P r o f i l e
The economy in the Pixley ka Seme municipal area is characterised by the following:
High levels of poverty and low levels of education;
It is a small to medium-town sub-region with a low level of development despite the strategic location in terms of the
national transport corridors;
Sparsely populated towns with a number of larger towns serving as “agricultural service centres”; spread evenly
throughout the district as central places;
High rate of unemployment, poverty and social grant dependence;
Prone to significant environmental changes owing to long-term structural changes (such as climate change, energy crises
and other shifts);
Geographic similarity in economic sectors, growth factors and settlement patterns;
Economies of scale not easily achieved owing to the relatively small size of towns;
A diverse road network with national, trunk, main and divisional roads of varying quality;
Potential and impact of renewable energy resource generation; and
Potential and impact of radio telescope initiatives, e.g. Square Kilometre Array radio telescope project.
4.1 Employment Status
The employment status of the available workforce/economically active group in the Pixley ka Seme municipal area is listed in
the table below. It indicates that the overall results with regard to the employment status of the workforce / potential
economically active group in the municipal area have improved from the 2001 figure of 63,1% employed and 36,9% unemployed.
In 2011, the number of unemployed individuals was almost 8% below what it was in 2001. However, any unemployment rate,
irrespective of how large, has serious repercussions for the ability of the residents to pay for their daily needs and for municipal
services. Owing to the high numbers of unemployed persons, other main sources of income are pension/welfare payments:
Employment status 2001 % 2001 2011 % 2011
Employed 36 921 63,1% 43 664 71,7%
Unemployed 21 632 36,9% 17 203 28,3%
Not economically active 101 886 42,5% 116 201 47,6%
Source: Statistics SA 2001 and 2011 Census
Employment Status
4.2 Economic Sector Contributor
The economic activities in the Northern Cape Province are dominated by mining, agriculture, manufacturing and construction,
contributing to the provincial GDP, i.e. 22%, 7%, 3% and 2% respectively. Note that the Northern Cape only contributed about a
share of 2% to the national GDP in 2014 and which contribution fluctuated around that mark since 2004. Between 2011 and
2014, the annual growth in the agriculture and mining sectors was about 4,2% and 5,2%, respectively.
The economic activities in the Pixley ka Seme municipal area are dominated by agriculture, social and personal services,
financial services, tourism and transport and lately, retail and construction activities emanating from the establishment of the
Square Kilometre Array project.

Integrated Development Plan 2017-2022
11
The table below includes four economic sectors in the province (seen from a municipal perspective) that have comparative
advantages in relation to the South African economy (in descending order):
Description Targeted performance within Pixley ka Seme District
Municipality
Mining High priority
Agriculture High priority
Manufacturing High priority
Wholesale, retail and motor trade; catering and accommodation High priority
Economic Growth Targets
In this context, it is important to note the impact the establishment of the Square Kilometre Array project in the western
segment of the municipal area, already had and will continue to have on the economic and socio-economic elements of the
area and its population.
4.3 Household Income
The monthly household income of all the households residing in the Pixley ka Seme municipal area is listed in the table below.
Almost 11 % of all households within the municipal area have no income, whilst another 3,4% of households earn between R0
and R4800 per annum. In the context of housing delivery, these people as well as another 50% of all households will be
beneficiaries of the ‘give-away’ housing programmes, i.e. the RDP and BNG programmes with ownership as the tenure type,
and the CRU programme with rental as tenure type. In total, almost 61% of all households in the municipal area will qualify for
these housing options owing to a monthly household income of less than R3500. Another segment of the population, viz.
24,8% earns below ‘R15 000’ per month, and for this group it would not possible to qualify for a (commercial) home loan.
These people would then rely of housing subsidies (to gain ownership of a house) or social housing (to rent a dwelling).
It is accepted that‚ on average‚ South African households have an annual income of R138 168, viz. a monthly income of R11 514.
Hence, more than 90% of the households living in the Pixley ka Seme municipal area have a monthly income below the average
for a South African household.
4.4 Investment Typology
In a 2011 research study called “Development Potential of Urban Settlements in the Northern Cape” by Van der Merwe, I.J.,
and Zietsman, H.L. regarding the (public) investment potential of municipalities and settlements in the Northern Cape, a set
of indicators was developed and used to determine the development/growth potential and human needs at two functional
levels, i.e. municipal and town/settlement.
By combining the findings on the development/growth potential and human needs, the preferred type of (public) investment
was identified to stimulate economic growth and social advancement. In this regard, the classification of the appropriate
investment category for the category B municipalities within the Pixley ka Seme district was as follows: low to medium
development potential and low to high human need. This implies an investment strategy to stimulate infrastructure and social
and human capital as best return on investment in these three forms of ‘development capital’.

Integrated Development Plan 2017-2022
12
5 . I D P D e v e l o p m e n t S t r a t e g y
The IDP is the overarching strategic tool that guides and informs the planning and development, and decisions taken regarding
planning, management and development within the Municipality. It is the primary strategic plan that documents the critical
development needs of the municipal area (external) and organisation (internal). The IDP process can be summarized as
follows:
5.1 The IDP/Budget Process Plan
Section 28 of the Municipal Systems Act (MSA), 2000 (Act 32 of 2000), requires that each Municipal Council adopts a process
plan that would guide the planning, drafting, adoption and review of the IDP. The process plan should have clear and
established mechanisms, procedures and process to ensure proper consultation with the communities. It should indicate
clearly how the IDP process will work, who will be responsible for what, time frames and milestones will be set and a budget
will be aligned to the programme.
The 2017-2022 IDP Process Plan was adopted by Council on 29 September 2016. This process plan include the following:
• Programme specifying the timeframes for the different planning steps;
• Structures that will manage the process; and
• Mechanisms, processes and procedures for consultation and participation of local communities, organs of state and
other role players in the IDP review and budget formulation processes.
5.2 Public Participation
In order to achieve effective inclusion within the process of developing the IDP and budget, the Municipality utilises the
following mechanisms as required in terms of Chapter 4 of the MSA:
• Roadshows
• Advertisements
• Newsletters
Integrated Development Plan 2017-2022
13
A meeting was held on 13 March in Petrusville. The Municipality could therefore capture the challenges faced by the
community to have a better understanding of the realities associated with each area (socio-economically and geographically).
The table below indicates the detail of inputs that were given by the community:
Description
Shortage of housing
Shortage of water
Lack of job creation
Lack of sustainable jobs
Poverty alleviation plan
High crime rate
Absence of public transport
Road maintenance
SASSA hampers – Criteria to assess those who qualify
Sports facilities
Details of Roadshows Held
5.3 Intergovernmental Alignment
The fourth generation IDP 2017-2022 was developed as part of the continuous cycle of planning, implementation and
monitoring.
In essence, the process consists out of a situational analysis whereby existing data and annual reports were used as a base to
understand the current status of both the Municipality and the environment in which it functions. Based on the analysis of
the current situation, the vision was translated into appropriate Strategic Objectives and Key Performance Indicators within
the ambit of functions of the Municipality and the available funding to achieve the objectives.
The Strategic Objectives identified have also been aligned with the framework of national and provincial plans, with particular
consideration being given as detailed in Chapter 1 (paragraph 1.6).
Programmes and projects of national and provincial sectoral departments have been included in Chapter 6.
6 . M u n i c i p a l S t r e n g t h s , W e a k n e s s e s , O p p o r t u n i t i e s a n d T h r e a t s ( S W O T )
Council and the senior managers held a strategic planning session on 27 and 28 September 2016. The table below provides
detail on the broad SWOT identified:
Strengths Weaknesses
Competent and qualified staff Not being able to get back money from local municipalities for
Shared Services rendered
Manage to operate within a small budget Grant dependent institution
Stability – Political and Administration interface Limited technical skills
Infrastructure to render an effective shared service % Representation of salaries to the budget
Commitment of officials Retention of qualified and specialized skills
Ability to give support to local municipalities Limited funding

Integrated Development Plan 2017-2022
14
Opportunities Threats
Solar and wind farms Future role of district municipalities
Additional functions Limited funding
Project management unit SKA – Land expropriation
Eco Tourism Grant dependent institution
Private funding Climate changes
Revitalisation of railways Unemployment & poverty
Position of being strategically situated (National Roads) Limited economic drivers
SWOT Analysis
7 . M u n i c i p a l C o m p a r a t i v e S y n o p s i s
The table below provides a comparison on the status of the Municipality in 2015/16 compare to 2016/17:
Function Issue Status - 2015/16 Status - 2016/17
Executive and council
Council composition 11 representative councillors
and 7 proportional representation (PR) councillors
11 representative councilors and 8 proportional
representation (PR) councillors
Number of meetings held 6 4 (as at 31 March 2017)
MM appointed Yes Yes
CFO appointed Yes Yes
Finance and administration - Human Resources
Staff establishment 101 113
Vacancy rate organisational structure (incl. frozen)
21.8% 22.12%
Critical vacancies on senior management level
3 0
Filled positions 79 84
Salary % of total budget 55.63% 56.55%
Salary % of operating budget 55.63%% 56.55%
Skills Development Plan Yes Yes
Employment Equity Plan Yes Yes
Occupational Health and Safety Plan
Yes Yes
Approved organogram Yes Yes
Finance and administration - Finance
Total outstanding debtors 1 807 911 1 735 504 (as at 31 March 2017)
Outstanding debtors older than 90 days
1 251 250 1 391 125 (as at 31 March 2017)
Source of finance % -own 10.2% 21.7%
Source of finance% -grants 89.8% 78.3%
Source of finance% -other 0% 0%
Annual financial statements Yes Will be completed at 31 August
2017
GRAP compliant statements Yes Yes
Audit opinion Unqualified with matters of
emphasis Will only receive in December
2017
Long Term Financial Plan/Strategy
Yes Yes

Integrated Development Plan 2017-2022
15
Function Issue Status - 2015/16 Status - 2016/17
% of OPEX spend on infrastructure maintenance
0.005% 0.003%
% of capital budget compared to the total budget
2.02% 1.36%
% of capital budget spend on new infrastructure
100% 100%
Finance and administration - Administration
By-laws None None
Delegations Yes Yes
Communication Strategy Yes Yes
Service delivery standards/ Customer Care Strategy
No No
Annual report tabled and adopted
Yes Has to be tabled only in
January 2018
Planning and development
Approved SDF Yes Yes
Approved Performance Management Framework
Yes Yes
Approved Local Economic Development Strategy
Yes Yes
Housing Approved Human Settlement
Plan/ Strategy Yes Yes
Environmental Protection Approved Environmental
Management Plan No No
Public Safety Approved Disaster Management Plan
Yes Yes
Internal Audit Status Yes Yes
Audit committees Yes Yes
Municipal Comparative Synopsis
8 . F i n a n c i a l S u m m a r y
8.1 Level of Reliance on Grants
The table below indicates that the Municipality is mostly reliant on grants as a district municipality, the main one being the
Equitable Share allocation from the National Government. Very limited revenue raising capacity exists, which is mainly the
contributions made by local municipalities for Shared Services rendered by the Municipality:
Details Actual 2015/16
R
Budget 2016/17
R
Budget 2017/18
R
Budget 2018/19
R
Budget 2019/20
R
Government grants and subsidies recognised 45 519 539 41 397 000 47 800 000 52 892 000 54 855 000
Total revenue 50 663 291 52 878 322 52 305 010 57 458 253 59 589 158
Ratio 89.8% 78.3% 91.4% 92.1% 92.1%
Level of Reliance on Grants

Integrated Development Plan 2017-2022
16
Graph 1.: Level of Reliance on Grants
8.2 Employee Related Costs
The percentage personnel expenditure is essential in the budgeting process as it reflects on current and future efficiency. The
table below indicates the total expenditure attributable to personnel costs and that the Municipality is currently above the
national norm of between 35 to 40% and it will increase to almost 70% over the next 3 years which is concerning:
Details
Actual
2015/16
R
Budget
2016/17
R
Budget
2017/18
R
Budget
2018/19
R
Budget
2019/20
R
Employee related cost
28 315 405 28 259 000 29 210 483 30 671 009 32 204 558
Total expenditure 50 069 493 51 274 000 51 826 711 50 637 897 53 012 318
Ratio 56.6% 55.1% 56.4% 60.6% 60.7%
Norm 35% to 40%
Employee Related Costs
Graph 2.: Employee Related Costs

Integrated Development Plan 2017-2022
17
8.3 Finance Charges to Total Operating Expenditure
Finance charges is any fee representing the cost of credit or the cost of borrowing. The table below indicates that the
Municipality does not have notable outstanding long term debt and is way below the national norm of 5%:
Details Actual 2015/16
R
Budget 2016/17
R
Budget 2017/18
R
Budget 2018/19
R
Budget 2019/20
R
Capital charges 1 031 280 100 000 120 000 126 000 132 300
Total expenditure 50 069 493 51 274 000 51 826 711 50 637 897 53 012 318
Ratio 2.1% 0.2% 0.2% 0.2% 0.2%
Norm 5%
Finance Charges to Total Operating Expenditure
Graph 3.: Finance Charges to Total Operating Expenditure
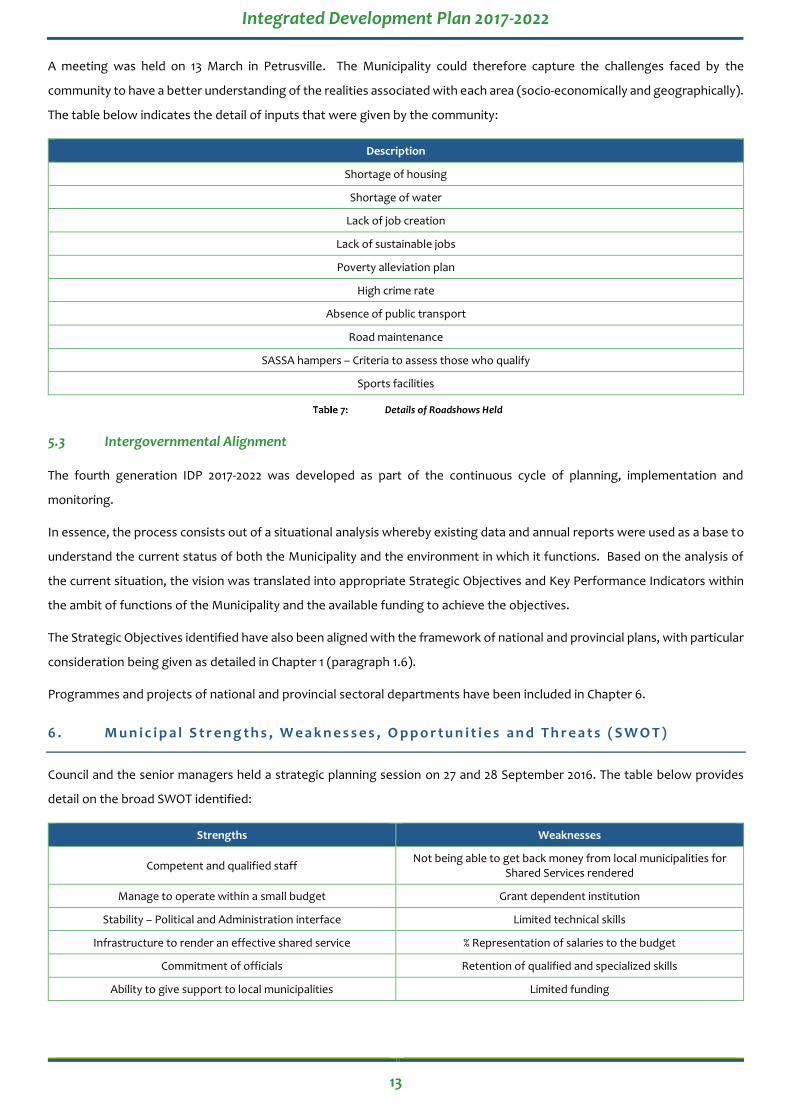
8.4 Repairs and Maintenance
The Municipality is not responsible for the delivery of basic municipal services and therefore the table below indicates the
total expenditure that is attributable to repairs and maintenance:
Details Actual 2015/16
R
Budget 2016/17
R
Budget 2017/18
R
Budget 2018/19
R
Budget 2019/20
R
Repairs and maintenance
241 067 155 000 1 853 000 853 650 896 333
Total expenditure 50 069 493 51 274 000 51 826 711 50 637 897 53 012 318
Ratio 0.5% 0.3% 3.6% 1.7% 1.7%
Norm 10%
Repairs and Maintenance
Integrated Development Plan 2017-2022
18
Graph 4.: Repairs and Maintenance
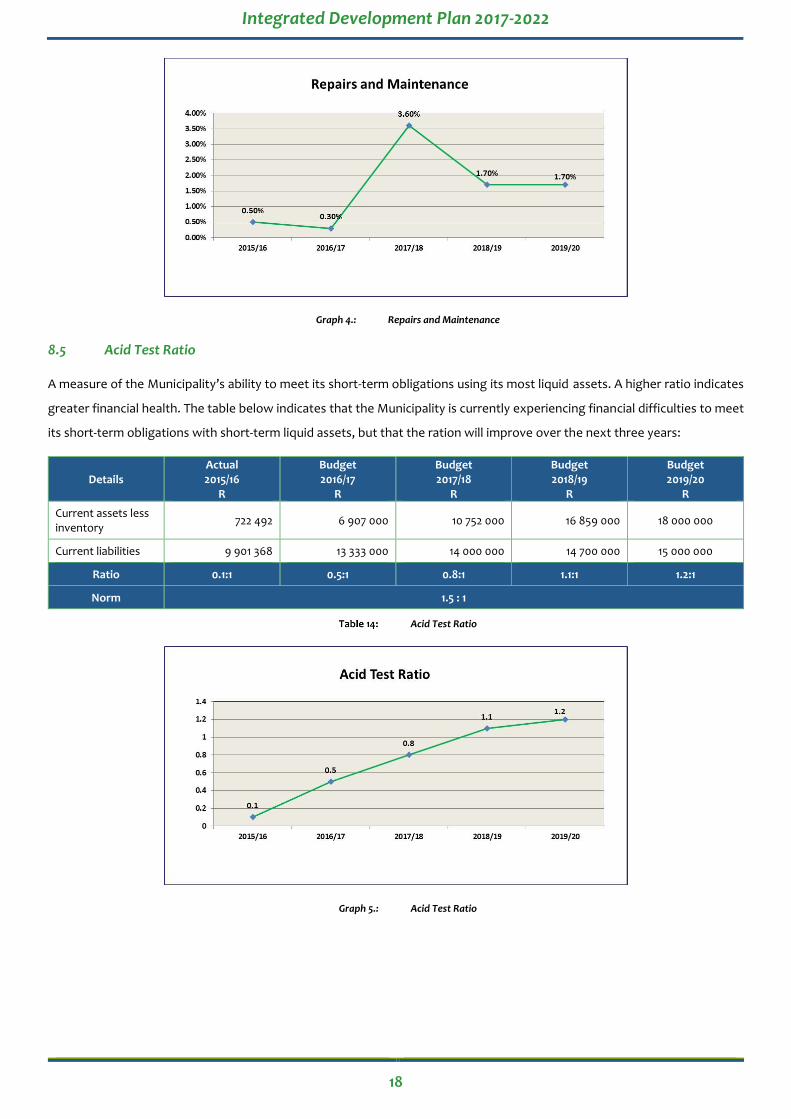
8.5 Acid Test Ratio
A measure of the Municipality’s ability to meet its short-term obligations using its most liquid assets. A higher ratio indicates
greater financial health. The table below indicates that the Municipality is currently experiencing financial difficulties to meet
its short-term obligations with short-term liquid assets, but that the ration will improve over the next three years:
Details Actual 2015/16
R
Budget 2016/17
R
Budget 2017/18
R
Budget 2018/19
R
Budget 2019/20
R
Current assets less inventory
722 492 6 907 000 10 752 000 16 859 000 18 000 000
Current liabilities 9 901 368 13 333 000 14 000 000 14 700 000 15 000 000
Ratio 0.1:1 0.5:1 0.8:1 1.1:1 1.2:1
Norm 1.5 : 1
Acid Test Ratio
Graph 5.: Acid Test Ratio

Integrated Development Plan 2017-2022
19
8.6 Long-Term Debt to Annual Income
The table below indicates the Municipality’s long term debt as a % of annual income and that it is still within the national norm
of 30%:
Details Actual 2015/16
R
Budget 2016/17
R
Budget 2017/18
R
Budget 2018/19
R
Budget 2019/20
R
Long-term liabilities 861 949 13 249 000 13 655 000 14 507 000 15 200 000
Revenue 50 663 291 46 864 000 46 035 150 50 033 000 51 000 000
Ratio 1.70% 28.27% 29.66% 28.99% 29.80%
Norm 30%
Long-Term Debt to Annual Income
Graph 6.: Long-Term Debt to Annual Income
As mentioned above, the Municipality is mostly dependent on grants and is currently experiencing financial difficulties to
sufficiently fund all their activities. Grants are diminishing and only the Equitable Share grant from the National Government
is certain. Shared Services are rendered to local municipalities to share capacity within the district, but the financial
contribution for these services remains a challenge. To remain financially sustainable, the Municipality will focus in the next 5
year mainly on core functions as allocated in terms of the Constitution and the core roles as indicated in various pieces of
legislation.

Integrated Development Plan 2017-2022
20
C H A P T E R 1 : I D P P R O C E S S
1 . 1 I D P P r o c e s s
The table below indicates the various phases in the development, monitoring and reporting of the IDP:
IDP Planning Process Jul Aug Sep Oct Nov Dec Jan Feb Mar Apr May Jun
Preparation Phase (Analysis)
Assessment of the implementation of the 2016-2017 IDP Projects
Identify the limitation and shortcomings of the 2016-2017 IDP
Undertake an assessment of the implementation of all Sector Plans and Integrated Programs
Submit the District IDP Process plan to Council for adoption
Prepare and present for discussion a draft IDP Process Plan to the District IDP Steering Committee
Identify all updated and available information from statistics SA and other stakeholders
Identify and discuss all analysis completed (Engagement Session)
Consultation Phase (Strategy)
Identify all sector plans and Integrated Programmes to be reviewed
Facilitate and organise local municipalities IDP Rep Forum workshop to discuss priority issues
Undertake strategic planning workshop for the Municipality
Consultation Process (Projects)
Undertake consultation with Sector Departments
Formulate IDP Projects for 2017-2022 financial years
Convene District IDP Steering Committee meeting to discuss potential funded IDP projects for 2017-2022 financial years
Convene District IDP Rep Forum meeting to discuss potential funded IDP projects for 2017-2022 financial years
Integration Phase
Prepare and finalise draft IDP
Present the draft District IDP to the IDP Steering Committee
Present the draft District IDP to the IDP Rep Forum Committee
Approval Phase
Present draft IDP to Council for adoption
Submit the draft IDP to the MEC for CoGHSTA for assessment
Advertise draft IDP in the Local newspaper for scrutiny and comments
Incorporate all the comments received
Integrated Development Plan 2017-2022
21
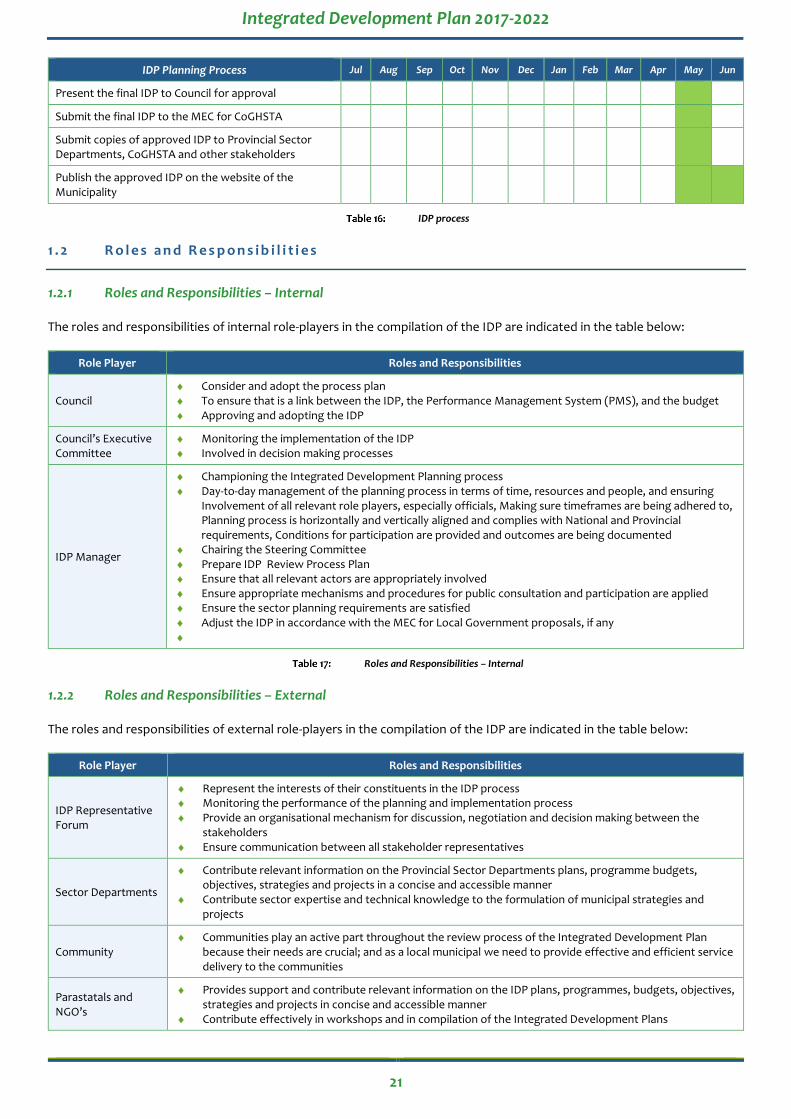
IDP Planning Process Jul Aug Sep Oct Nov Dec Jan Feb Mar Apr May Jun
Present the final IDP to Council for approval
Submit the final IDP to the MEC for CoGHSTA
Submit copies of approved IDP to Provincial Sector Departments, CoGHSTA and other stakeholders
Publish the approved IDP on the website of the Municipality
IDP process
1 . 2 R o l e s a n d R e s p o n s i b i l i t i e s
1.2.1 Roles and Responsibilities – Internal
The roles and responsibilities of internal role-players in the compilation of the IDP are indicated in the table below:
Role Player Roles and Responsibilities
Council Consider and adopt the process plan To ensure that is a link between the IDP, the Performance Management System (PMS), and the budget Approving and adopting the IDP
Council’s Executive Committee
Monitoring the implementation of the IDP Involved in decision making processes
IDP Manager
Championing the Integrated Development Planning process Day-to-day management of the planning process in terms of time, resources and people, and ensuring
Involvement of all relevant role players, especially officials, Making sure timeframes are being adhered to, Planning process is horizontally and vertically aligned and complies with National and Provincial requirements, Conditions for participation are provided and outcomes are being documented
Chairing the Steering Committee Prepare IDP Review Process Plan Ensure that all relevant actors are appropriately involved Ensure appropriate mechanisms and procedures for public consultation and participation are applied Ensure the sector planning requirements are satisfied Adjust the IDP in accordance with the MEC for Local Government proposals, if any
Roles and Responsibilities – Internal
1.2.2 Roles and Responsibilities – External
The roles and responsibilities of external role-players in the compilation of the IDP are indicated in the table below:
Role Player Roles and Responsibilities
IDP Representative Forum
Represent the interests of their constituents in the IDP process Monitoring the performance of the planning and implementation process Provide an organisational mechanism for discussion, negotiation and decision making between the
stakeholders Ensure communication between all stakeholder representatives
Sector Departments
Contribute relevant information on the Provincial Sector Departments plans, programme budgets, objectives, strategies and projects in a concise and accessible manner
Contribute sector expertise and technical knowledge to the formulation of municipal strategies and projects
Community Communities play an active part throughout the review process of the Integrated Development Plan
because their needs are crucial; and as a local municipal we need to provide effective and efficient service delivery to the communities
Parastatals and NGO’s
Provides support and contribute relevant information on the IDP plans, programmes, budgets, objectives, strategies and projects in concise and accessible manner
Contribute effectively in workshops and in compilation of the Integrated Development Plans

Integrated Development Plan 2017-2022
22
Role Player Roles and Responsibilities
Department of Co-operative Governance & Traditional Affairs
Provides co-ordination for Municipalities Ensure vertical alignment between the District and local planning Facilitation of vertical alignment of IDP’s with other sphere if government and sector departments Ensure horizontal alignment of the IDP’s of the municipalities in the District Municipal area To co-ordinate events for joint workshops with Local Municipalities, Provincial and National role-players
and other relevant specialists To evaluate the overall process
Roles and Responsibilities – External
1 . 3 P u b l i c P a r t i c i p a t i o n
1.3.1 Legislative Requirements
In giving effect to Section 16 of the MSA, the municipal manager must ensure that for this purpose –
The Municipality encourages and creates conditions for the local community to participate in the affairs of the Municipality,
including in –
The preparation, implementation and review of its integrated development plan;
The establishment, implementation and review of its performance management plan;
Consideration of draft by-laws;
The monitoring and review of its performance, including the outcome and impact of such performance;
The preparation of its budget; and
Strategic decisions relating to the provisioning of municipal services.
The Municipality employs sufficient staff members, other than councillors, who may help in informing and educating the local
community about the affairs of the Municipality, particularly in the areas referred to in Section 16(1)(a), taking into account
special needs, as defined in Section 17(2) of the Systems Act.
That all staff members, including councillors, are trained in the basic knowledge of the areas referred to in Section 16 of the
MSA.
The municipal manager may establish a working group consisting of councillors and previously trained staff members to
administer the training of new staff and councillors under Section 16 of the MSA.
1.3.2 Public Participation Process
The IDP Public Participation process is championed by the Office of the Executive Mayor and presentations was made on 13
March 2017 in Petrusville. Posters, flyers and loud speakers were used to mobilise the community. The presentations focused
on successes and challenges and afforded the community an opportunity to provide input, comment and ask questions.
1 . 4 F i v e Y e a r C y c l e o f t h e I D P
The first generation IDP’s dealt with the period 2002-2007, the second generation IDP’s with the period 2007-2012, the third
generation IDP’s with the period 2012-2017 and municipalities entered the fourth five year IDP cycle with the municipal
elections in August 2016. The new council that was constituted after the elections immediately started preparing a new five
year IDP. This fourth generation IDP will be effective from 1 July 2017 up to 30 June 2022.

Integrated Development Plan 2017-2022
23
Municipalities are encouraged and supported by both national and provincial government to develop realistic and credible
IDP’s that not only comply with relevant legislation but also -
are owned by local leadership, municipal management and community as the single strategic plan to direct resources
within the Municipality;
are driven by the management team and systems within the Municipality with implementation regularly monitored
during the year through the performance management system;
contain a long term development strategy that can guide investment across the municipal area;
provide an investment plan for national, provincial and local government and non-governmental stakeholders to enhance
and enable joint planning and resource alignment to improve service delivery to all stakeholders; and
include local area plans to localise the strategy and implementation of the IDP.
1 . 5 A n n u a l R e v i e w o f t h e I D P
In terms of the MSA, Section 34, a Municipality is required to review its IDP annually. Annual reviews allow the Municipality
to expand upon or refine plans and strategies, to include additional issues and to ensure that these plans and strategies inform
institutional and financial planning.
The IDP has to be reviewed annually. The review process serves as an institutional learning process where stakeholders can
meet to discuss the successes and frustrations of the past year. It is not designed to interfere with the long-term strategic
orientation of the Municipality to accommodate new whims and additional demands. It remains a strategic process of
ensuring the institution remains in touch with their intentions and the environment within which it functions.
Although the implementation of the IDP is monitored through the performance management system, an annual process is
required to check the relevance of the strategic plan within a dynamic environment.
The IDP has to be reviewed annually in order to -
ensure its relevance as the Municipality’s strategic plan;
inform other components of the Municipal business process including institutional and financial planning and budgeting;
and
inform the inter-governmental planning and budget cycle.
The purpose of a review is to -
reflect and report on progress made with respect to the five year strategy (and key outcomes) in the IDP;
make adjustments to the strategy in the 5 year IDP because of changing internal and external circumstances
that impact on the appropriateness of the IDP;
determine annual targets and activities for the next financial year in line with the five year strategy; and
inform the Municipality’s financial and institutional planning and most importantly, the drafting of the annual budget.
Integrated Development Plan 2017-2022
24
1 . 6 M e c h a n i s m s f o r A l i g n m e n t
1.6.1 National Linkages
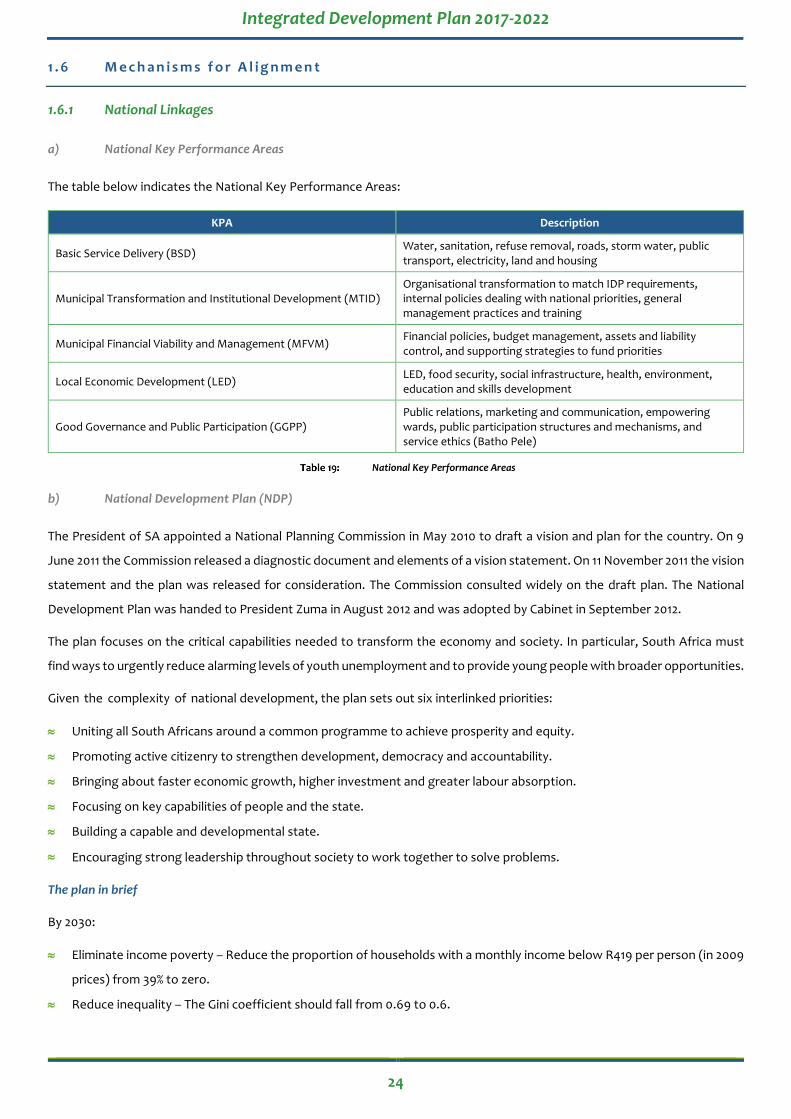
a) National Key Performance Areas
The table below indicates the National Key Performance Areas:
KPA Description
Basic Service Delivery (BSD) Water, sanitation, refuse removal, roads, storm water, public transport, electricity, land and housing
Municipal Transformation and Institutional Development (MTID) Organisational transformation to match IDP requirements, internal policies dealing with national priorities, general management practices and training
Municipal Financial Viability and Management (MFVM) Financial policies, budget management, assets and liability control, and supporting strategies to fund priorities
Local Economic Development (LED) LED, food security, social infrastructure, health, environment, education and skills development
Good Governance and Public Participation (GGPP) Public relations, marketing and communication, empowering wards, public participation structures and mechanisms, and service ethics (Batho Pele)
National Key Performance Areas
b) National Development Plan (NDP)
The President of SA appointed a National Planning Commission in May 2010 to draft a vision and plan for the country. On 9
June 2011 the Commission released a diagnostic document and elements of a vision statement. On 11 November 2011 the vision
statement and the plan was released for consideration. The Commission consulted widely on the draft plan. The National
Development Plan was handed to President Zuma in August 2012 and was adopted by Cabinet in September 2012.
The plan focuses on the critical capabilities needed to transform the economy and society. In particular, South Africa must
find ways to urgently reduce alarming levels of youth unemployment and to provide young people with broader opportunities.
Given the complexity of national development, the plan sets out six interlinked priorities:
Uniting all South Africans around a common programme to achieve prosperity and equity.
Promoting active citizenry to strengthen development, democracy and accountability.
Bringing about faster economic growth, higher investment and greater labour absorption.
Focusing on key capabilities of people and the state.
Building a capable and developmental state.
Encouraging strong leadership throughout society to work together to solve problems.
The plan in brief
By 2030:
Eliminate income poverty – Reduce the proportion of households with a monthly income below R419 per person (in 2009
prices) from 39% to zero.
Reduce inequality – The Gini coefficient should fall from 0.69 to 0.6.

Integrated Development Plan 2017-2022
25
Enabling milestones
Increase employment from 13 million in 2010 to 24 million in 2030.
Raise per capita income from R50 000 in 2010 to R120 000 by 2030.▪ Increase the share of national income of the bottom
40% from 6% to 10%.
Establish a competitive base of infrastructure, human resources and regulatory frameworks.
Ensure that skilled, technical, professional and managerial posts better reflect the country's racial, gender and disability
makeup.
Broaden ownership of assets to historically disadvantaged groups.
Increase the quality of education so that all children have at least two years of preschool education and all children in
grade 3 can read and write.
Provide affordable access to quality health care while promoting health and wellbeing.
Establish effective, safe and affordable public transport.
Produce sufficient energy to support industry at competitive prices, ensuring access for poor households, while reducing
carbon emissions per unit of power by about one-third.
Ensure that all South Africans have access to clean running water in their homes.
Make high-speed broadband internet universally available at competitive prices.
Realise a food trade surplus, with one-third produced by small-scale farmers or households.
Ensure household food and nutrition security.
Entrench a social security system covering all working people, with social protection for the poor and other groups in
need, such as children and people with disabilities.
Realise a developmental, capable and ethical state that treats citizens with dignity.
Ensure that all people live safely, with an independent and fair criminal justice system.
Broaden social cohesion and unity while redressing the inequities of the past.
Play a leading role in continental development, economic integration and human rights.
Critical actions
A social compact to reduce poverty and inequality, and raise employment and investment.
A strategy to address poverty and its impacts by broadening access to employment, strengthening the social wage,
improving public transport and raising rural incomes.
Steps by the state to professionalise the public service, strengthen accountability, improve coordination and prosecute
corruption.
Boost private investment in labour-intensive areas, competitiveness and exports, with adjustments to lower the risk of
hiring younger workers.
An education accountability chain, with lines of responsibility from state to classroom.
Phase in national health insurance, with a focus on upgrading public health facilities, producing more health professionals
and reducing the relative cost of private health care.
Public infrastructure investment at 10% of gross domestic product (GDP), financed through tariffs, public-private
partnerships, taxes and loans and focused on transport, energy and water.
Interventions to ensure environmental sustainability and resilience to future shocks.
Integrated Development Plan 2017-2022
26
New spatial norms and standards – densifying cities, improving transport, locating jobs where people live, upgrading
informal settlements and fixing housing market gaps.
Reduce crime by strengthening criminal justice and improving community environments.
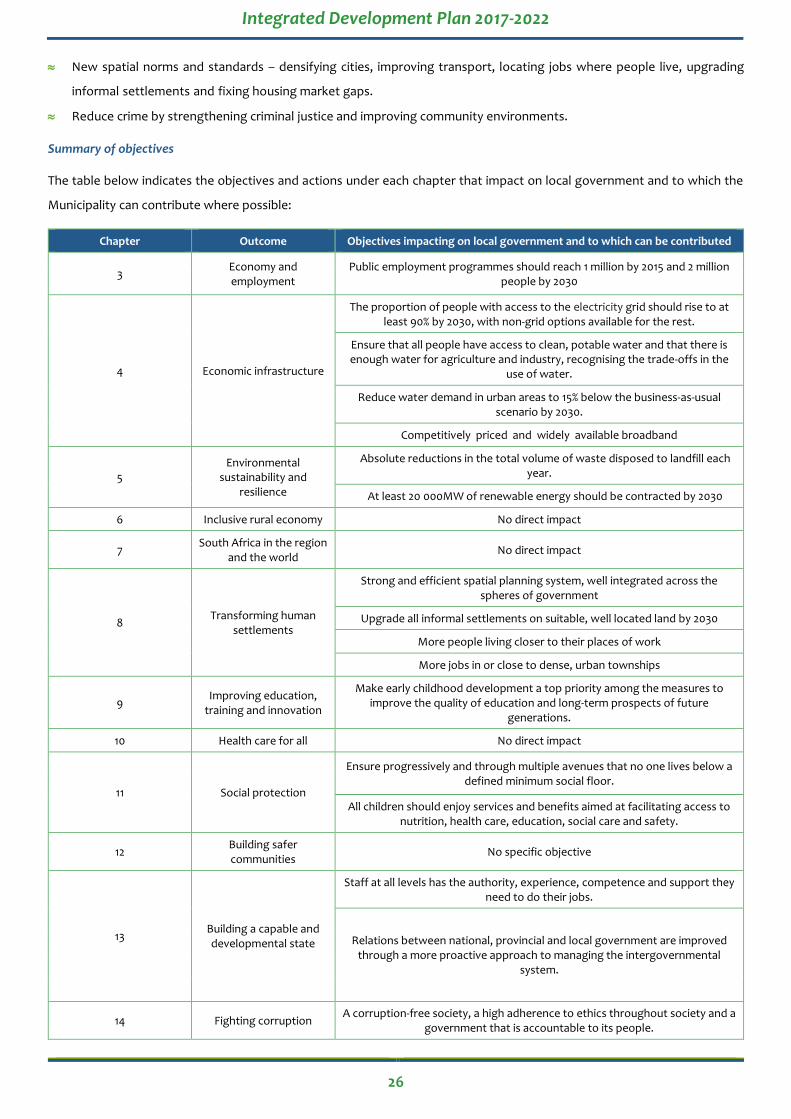
Summary of objectives
The table below indicates the objectives and actions under each chapter that impact on local government and to which the
Municipality can contribute where possible:
Chapter Outcome Objectives impacting on local government and to which can be contributed
3 Economy and employment
Public employment programmes should reach 1 million by 2015 and 2 million people by 2030
4 Economic infrastructure
The proportion of people with access to the electricity grid should rise to at least 90% by 2030, with non-grid options available for the rest.
Ensure that all people have access to clean, potable water and that there is enough water for agriculture and industry, recognising the trade-offs in the
use of water.
Reduce water demand in urban areas to 15% below the business-as-usual scenario by 2030.
Competitively priced and widely available broadband
5 Environmental
sustainability and resilience
Absolute reductions in the total volume of waste disposed to landfill each year.
At least 20 000MW of renewable energy should be contracted by 2030
6 Inclusive rural economy No direct impact
7 South Africa in the region
and the world No direct impact
8 Transforming human
settlements
Strong and efficient spatial planning system, well integrated across the spheres of government
Upgrade all informal settlements on suitable, well located land by 2030
More people living closer to their places of work
More jobs in or close to dense, urban townships
9 Improving education,
training and innovation
Make early childhood development a top priority among the measures to improve the quality of education and long-term prospects of future
generations.
10 Health care for all No direct impact
11 Social protection
Ensure progressively and through multiple avenues that no one lives below a defined minimum social floor.
All children should enjoy services and benefits aimed at facilitating access to nutrition, health care, education, social care and safety.
12 Building safer communities
No specific objective
13 Building a capable and developmental state
Staff at all levels has the authority, experience, competence and support they need to do their jobs.
Relations between national, provincial and local government are improved through a more proactive approach to managing the intergovernmental
system.
14 Fighting corruption A corruption-free society, a high adherence to ethics throughout society and a
government that is accountable to its people.
Integrated Development Plan 2017-2022
27
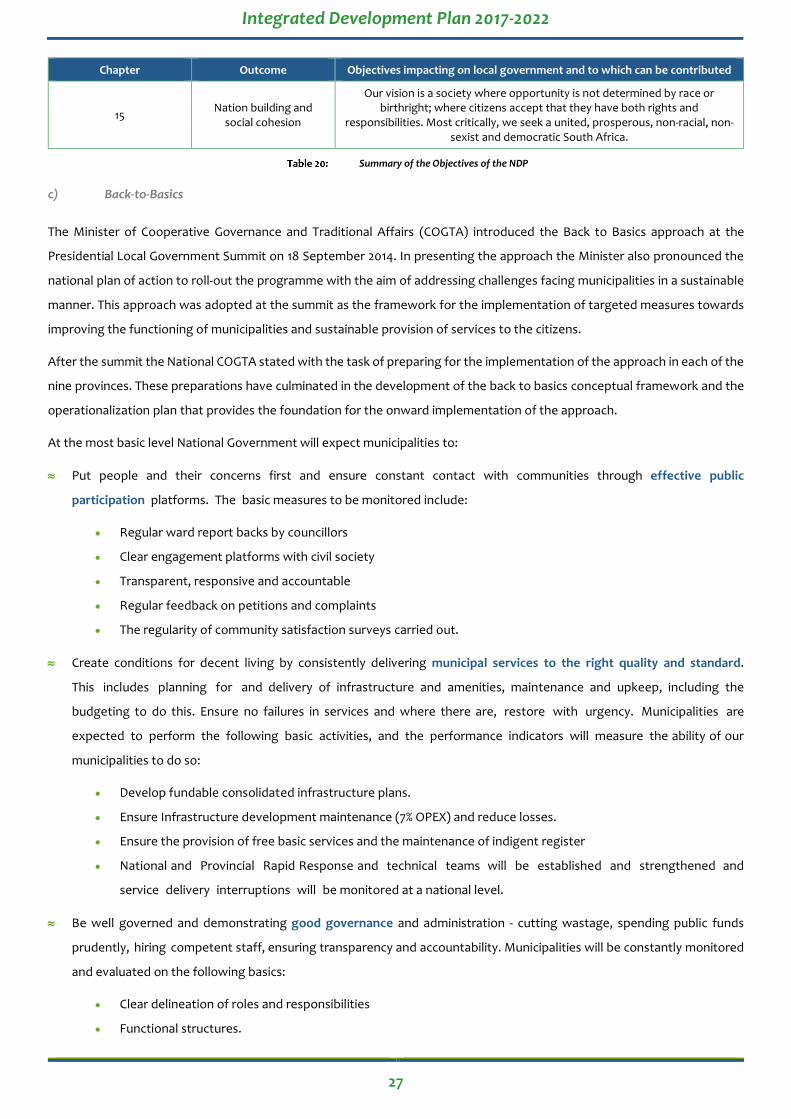
Chapter Outcome Objectives impacting on local government and to which can be contributed
15 Nation building and
social cohesion
Our vision is a society where opportunity is not determined by race or birthright; where citizens accept that they have both rights and
responsibilities. Most critically, we seek a united, prosperous, non-racial, non-sexist and democratic South Africa.
Summary of the Objectives of the NDP
c) Back-to-Basics
The Minister of Cooperative Governance and Traditional Affairs (COGTA) introduced the Back to Basics approach at the
Presidential Local Government Summit on 18 September 2014. In presenting the approach the Minister also pronounced the
national plan of action to roll-out the programme with the aim of addressing challenges facing municipalities in a sustainable
manner. This approach was adopted at the summit as the framework for the implementation of targeted measures towards
improving the functioning of municipalities and sustainable provision of services to the citizens.
After the summit the National COGTA stated with the task of preparing for the implementation of the approach in each of the
nine provinces. These preparations have culminated in the development of the back to basics conceptual framework and the
operationalization plan that provides the foundation for the onward implementation of the approach.
At the most basic level National Government will expect municipalities to:
Put people and their concerns first and ensure constant contact with communities through effective public
participation platforms. The basic measures to be monitored include:
• Regular ward report backs by councillors
• Clear engagement platforms with civil society
• Transparent, responsive and accountable
• Regular feedback on petitions and complaints
• The regularity of community satisfaction surveys carried out.
Create conditions for decent living by consistently delivering municipal services to the right quality and standard.
This includes planning for and delivery of infrastructure and amenities, maintenance and upkeep, including the
budgeting to do this. Ensure no failures in services and where there are, restore with urgency. Municipalities are
expected to perform the following basic activities, and the performance indicators will measure the ability of our
municipalities to do so:
• Develop fundable consolidated infrastructure plans.
• Ensure Infrastructure development maintenance (7% OPEX) and reduce losses.
• Ensure the provision of free basic services and the maintenance of indigent register
• National and Provincial Rapid Response and technical teams will be established and strengthened and
service delivery interruptions will be monitored at a national level.
Be well governed and demonstrating good governance and administration - cutting wastage, spending public funds
prudently, hiring competent staff, ensuring transparency and accountability. Municipalities will be constantly monitored
and evaluated on the following basics:
• Clear delineation of roles and responsibilities
• Functional structures.
Integrated Development Plan 2017-2022
28
• Transparency, accountability and community engagement
• Proper system of delegation to ensure functional administration
• The existence and efficiency of anti-corruption measures.
• The extent to which there is compliance with legislation and the enforcement of by laws.
• The rate of service delivery protests and approaches to address them.
Ensure sound financial management and accounting, and prudently manage resources so as to sustainably deliver
services and bring development to communities. Performance against the following basic indicators will be constantly
assessed:
• Proper record keeping and production of annual financial statements.
• Credit control, internal controls and increased revenue base
• Wasteful expenditure including monitoring overtime kept to a minimum.
• Functional Supply Chain Management structures with appropriate oversight
• The number disclaimers in the last three – five years.
• Whether the budgets are cash backed.
Build and maintain sound institutional and administrative capabilities, administered and managed by dedicated and
skilled personnel at all levels. The basic requirements to be monitored include:
• Competent and capable people and performance management.
• Functional delegations.
• Regular interactions between management and organised labour.
• Shared scarce skills services at district level.
• Realistic organograms aligned to municipal development strategy.
• Implementable human resources development and management programmes.

Integrated Development Plan 2017-2022
29
C H A P T E R 2 : L E G A L R E Q U I R E M E N T S
Municipalities function within an extensive legislative and policy framework that provides prescripts and guidelines for
municipal actions according to constitutional obligations. In this regard, all municipalities must align their budget and
programmes with national developmental and institutional policy directives that are mainly being guided by the constitution.
The Constitution of the Republic of South Africa outlines the type of local government needed. Sections 152 and 153 of the
Constitution describe the following objectives of local government:
To ensure the sustainable provision of services;
To provide democratic and accountable government for all communities;
To promote social and economic development;
To promote a safe and healthy environment;
To give priority to the basic needs of communities, and
To encourage involvement of communities and community organisations in matters of local government.
The Constitution supersedes all legislative frameworks and the following legislation has been developed to guide
municipalities as to its mandate, function and mechanisms to implement its constitutional mandate:
a) The MSA requires municipalities to develop Integrated Development Plans that will guide the direction and content of
potential development within the relevant council‘s area of jurisdiction, and must be reviewed annually. In addition the
Act also stipulates the IDP process and the components of the IDP.
b) The Local Government: Municipal Planning and Performance Management Regulations (2001) sets out the minimum
requirements for an Integrated Development Plan. Regulation 2(1) states that the Municipality‘s IDP must at least
identify:
The institutional framework, which must include an organogram required for the implementation of the Integrated
Development Plan;
Any investment initiatives in the Municipality;
Any development initiatives in the Municipality, including infrastructure, physical, social and institutional development;
All known projects, plans and programmes to be implemented within the Municipality by any organ of the state, and
The key performance indicators set by the Municipality.
Regulation 2(3) Local Government: Municipal Planning and Performance Management Regulations (2001) sets out
matters/issues that must be reflected in the financial plan that must form part of the integrated development plan.
Section 21(2) of the Municipal Finance Management Act (Act 56 of 2003) (MFMA) states that, when preparing the annual
budget, the Mayor of a Municipality must:
Take into account the Municipality‘s Integrated Development Plan.
Take all reasonable steps to ensure that the Municipality revises the integrated development plan in terms of section 34
of the MSA, taking into account realistic revenue and expenditure projections for future years.
Take into account the national budget, the relevant provincial budget, the national government‘s fiscal and
macroeconomic policy, the annual Division of Revenue Act and any agreements reached in the Budget Forum.
Consult with the relevant authorities.

Integrated Development Plan 2017-2022
30
The drafting, implementation and review of the IDP on an annual basis is mandatory for all municipalities in terms of the
relevant legislation, and it is therefore important to briefly outline this legal framework.
The Integrated Development Plan, adopted by the Council of the Municipality, is the key strategic planning tool for the
Municipality. It is described in the Municipal Systems Act (MSA) as:
35(1) (a)”…the principal strategic planning instrument which guides and informs all planning, development and all
decisions with regard to planning, management and development in the Municipality”;
(b) “binds the Municipality in the executive authority…”

Integrated Development Plan 2017-2022
31
C H A P T E R 3 : S I T U A T I O N A L A N A L Y S I S
This chapter includes details of the current status of the Pixley ka Seme District Municipality in order to identify the current
position and what needs to be addressed to turn the existing position around.
3 . 1 S p a t i a l A n a l y s i s
The Pixley ka Seme District Municipality does have an (outdated) Spatial Development Framework (SDF). Note that this SDF
was prepared in 2007, and hence, does not include the bioregional planning approach, recent private project investments,
recent changes to the municipal boundaries within the district, and/or any reference to the Spatial Planning and Land Use
Management Act, 2013 (Act 16 of 2013). In this regard, we refer only to the following vision as advocated in the district Spatial
Development Framework: “We, Pixley ka Seme District Municipality, commit ourselves to be a developmental Municipality
where the quality of life of all people in the district will be improved.”
Specific reference is made to the requirement in terms of Section 20(2) of the Spatial Planning and Land Use Management
Act, 2013 (Act 16 of 2013) (SPLUMA) that an SDF must be prepared and approved as part of the Municipality’s Integrated
Development Plan (IDP) and in accordance with the Local Government Municipal Systems Act, 2000 (Act 32 of 2000) (MSA).
The contents of an SDF are listed in Sections 20 and 21 of SPLUMA,1 whereas the procedural and content requirements
regarding the drafting, amendment and adoption of the IDP, are specified in the MSA. In this regard, the new set of planning
legislation does confirm this process as the same process to be used for the drafting, amendment and adoption of the SDF.
This also means that the specifications in Section 34 regarding the annual review by a Municipality of its Integrated
Development Plan, apply to the municipal spatial development framework. When considering this specification, it is important
to note the different timelines in the respective planning and implementation horizons, i.e. 5 years for the IDP and up to 20
years in the SDF.
It must be noted that there was a Spatial Development Framework prepared for the jurisdiction area of the provincial
government. In the interests of brevity, the following section includes only a summary of key spatial elements of the Northern
Cape SDF – elements that have relevance to urban and rural development in the Pixley ka Seme District Municipality.
The provincial SDF (2012), as a spatial land-use directive, provides the preferred approach to spatial planning and the use and
development of land throughout the Northern Cape. This approach is based on bioregional planning and management
principles, which basically considers the cultural, social and economic functions as uniquely interdependent within a
developmental state agenda. In this regard, a matrix of sustainable land-use zones is provided in an effort to ensure close
relationships between these functions. Furthermore, the SDF put forward the following vision as first presented in the
provincial Growth and Development Strategy: building a prosperous, sustainable growing provincial economy to eradicate
poverty and improve social development.
1 Also see the SDF Guidelines, September 2014, as commissioned by the national Department of Rural Development and Land Reform.
Integrated Development Plan 2017-2022
32
It is stated in the provincial SDF that it serves as an integrated spatial and policy framework within which the imperatives of
institutional integration, integrated development planning and cooperative governance can be achieved. What does this
mean with regard to the use and development of land? Basically, it means the introduction of specific ways to consider and
measure the use and development of land by all stakeholders. For example, spatial planning categories are introduced as well
as ‘Areas of Co-operation’ according to bioregional borders which are not necessarily aligned with administrative boundaries.
In this regard, the southern-most areas of the Ubuntu and Umsobomvu municipalities fall within such an area of co-operation.
3 . 2 G e o g r a p h i c a l C o n t e x t
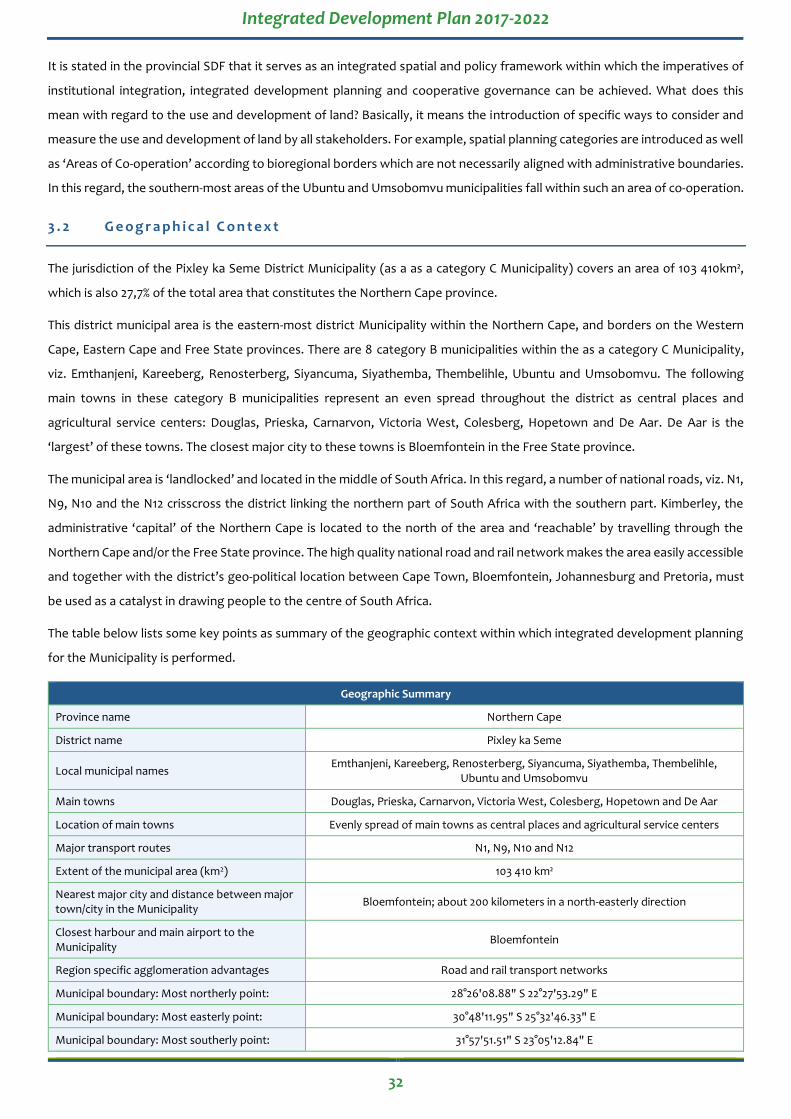
The jurisdiction of the Pixley ka Seme District Municipality (as a as a category C Municipality) covers an area of 103 410km²,
which is also 27,7% of the total area that constitutes the Northern Cape province.
This district municipal area is the eastern-most district Municipality within the Northern Cape, and borders on the Western
Cape, Eastern Cape and Free State provinces. There are 8 category B municipalities within the as a category C Municipality,
viz. Emthanjeni, Kareeberg, Renosterberg, Siyancuma, Siyathemba, Thembelihle, Ubuntu and Umsobomvu. The following
main towns in these category B municipalities represent an even spread throughout the district as central places and
agricultural service centers: Douglas, Prieska, Carnarvon, Victoria West, Colesberg, Hopetown and De Aar. De Aar is the
‘largest’ of these towns. The closest major city to these towns is Bloemfontein in the Free State province.
The municipal area is ‘landlocked’ and located in the middle of South Africa. In this regard, a number of national roads, viz. N1,
N9, N10 and the N12 crisscross the district linking the northern part of South Africa with the southern part. Kimberley, the
administrative ‘capital’ of the Northern Cape is located to the north of the area and ‘reachable’ by travelling through the
Northern Cape and/or the Free State province. The high quality national road and rail network makes the area easily accessible
and together with the district’s geo-political location between Cape Town, Bloemfontein, Johannesburg and Pretoria, must
be used as a catalyst in drawing people to the centre of South Africa.
The table below lists some key points as summary of the geographic context within which integrated development planning
for the Municipality is performed.
Geographic Summary
Province name Northern Cape
District name Pixley ka Seme
Local municipal names Emthanjeni, Kareeberg, Renosterberg, Siyancuma, Siyathemba, Thembelihle,
Ubuntu and Umsobomvu
Main towns Douglas, Prieska, Carnarvon, Victoria West, Colesberg, Hopetown and De Aar
Location of main towns Evenly spread of main towns as central places and agricultural service centers
Major transport routes N1, N9, N10 and N12
Extent of the municipal area (km2) 103 410 km²
Nearest major city and distance between major town/city in the Municipality
Bloemfontein; about 200 kilometers in a north-easterly direction
Closest harbour and main airport to the Municipality
Bloemfontein
Region specific agglomeration advantages Road and rail transport networks
Municipal boundary: Most northerly point: 28°26'08.88" S 22°27'53.29" E
Municipal boundary: Most easterly point: 30°48'11.95" S 25°32'46.33" E
Municipal boundary: Most southerly point: 31°57'51.51" S 23°05'12.84" E
Integrated Development Plan 2017-2022
33
Geographic Summary
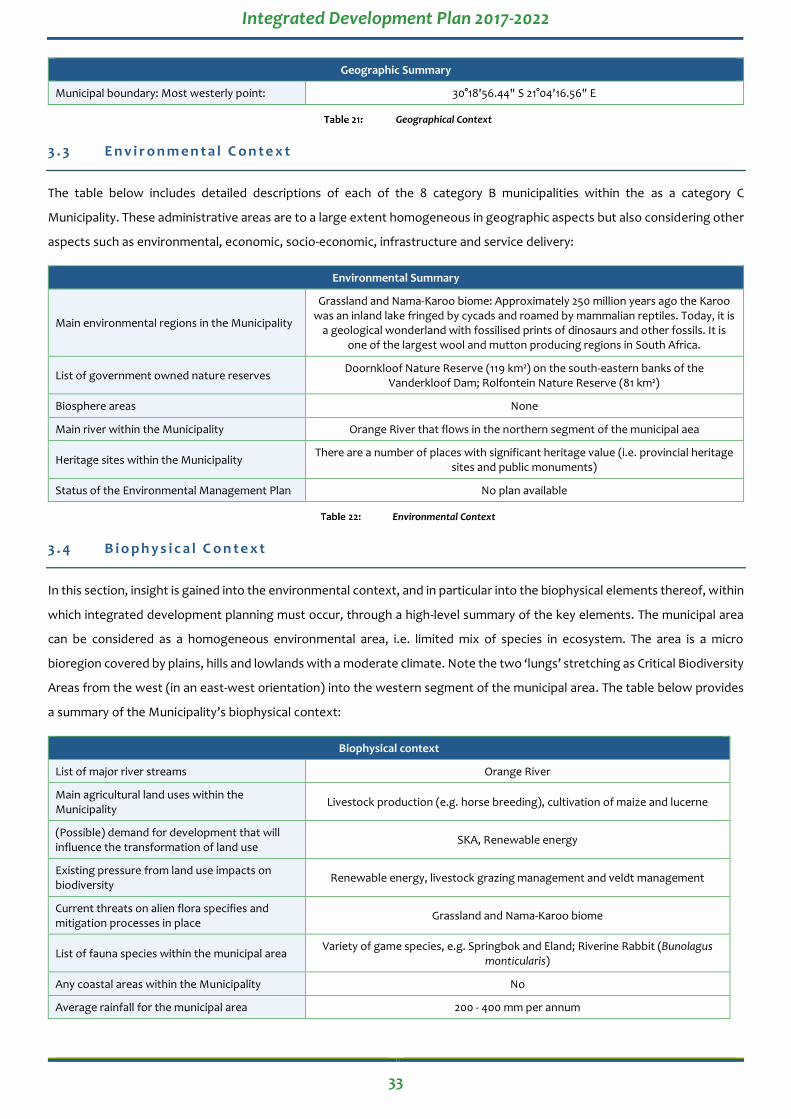
Municipal boundary: Most westerly point: 30°18'56.44" S 21°04'16.56" E
Geographical Context
3 . 3 E n v i r o n m e n t a l C o n t e x t
The table below includes detailed descriptions of each of the 8 category B municipalities within the as a category C
Municipality. These administrative areas are to a large extent homogeneous in geographic aspects but also considering other
aspects such as environmental, economic, socio-economic, infrastructure and service delivery:
Environmental Summary
Main environmental regions in the Municipality
Grassland and Nama-Karoo biome: Approximately 250 million years ago the Karoo was an inland lake fringed by cycads and roamed by mammalian reptiles. Today, it is
a geological wonderland with fossilised prints of dinosaurs and other fossils. It is one of the largest wool and mutton producing regions in South Africa.
List of government owned nature reserves Doornkloof Nature Reserve (119 km²) on the south-eastern banks of the
Vanderkloof Dam; Rolfontein Nature Reserve (81 km²)
Biosphere areas None
Main river within the Municipality Orange River that flows in the northern segment of the municipal aea
Heritage sites within the Municipality There are a number of places with significant heritage value (i.e. provincial heritage
sites and public monuments)
Status of the Environmental Management Plan No plan available
Environmental Context
3 . 4 B i o p h y s i c a l C o n t e x t
In this section, insight is gained into the environmental context, and in particular into the biophysical elements thereof, within
which integrated development planning must occur, through a high-level summary of the key elements. The municipal area
can be considered as a homogeneous environmental area, i.e. limited mix of species in ecosystem. The area is a micro
bioregion covered by plains, hills and lowlands with a moderate climate. Note the two ‘lungs’ stretching as Critical Biodiversity
Areas from the west (in an east-west orientation) into the western segment of the municipal area. The table below provides
a summary of the Municipality’s biophysical context:
Biophysical context
List of major river streams Orange River
Main agricultural land uses within the Municipality
Livestock production (e.g. horse breeding), cultivation of maize and lucerne
(Possible) demand for development that will influence the transformation of land use
SKA, Renewable energy
Existing pressure from land use impacts on biodiversity
Renewable energy, livestock grazing management and veldt management
Current threats on alien flora specifies and mitigation processes in place
Grassland and Nama-Karoo biome
List of fauna species within the municipal area Variety of game species, e.g. Springbok and Eland; Riverine Rabbit (Bunolagus
monticularis)
Any coastal areas within the Municipality No
Average rainfall for the municipal area 200 - 400 mm per annum

Integrated Development Plan 2017-2022
34
Biophysical context
Minimum and maximum average temperature for both winter and summer months in the Municipality
Summer average - 24° and Winter average - 14°
Biophysical Context
3 . 5 I n f r a s t r u c t u r a l C o n t e x t
3.5.1 Infrastructural Summary
In this section, insight is gained into the infrastructural context within which integrated development planning must occur,
through a high-level summary of the respective infrastructure components that ‘serve’ the communities. All the municipalities
in the district face a significant human settlement challenge. In this regard, the effective and sustainable use and development
of land is subject to the availability, standard and quality of the service infrastructure. For example, houses cannot be built
where water, electricity, sewerage and other municipal services are not available. Also, perpetuating the structure of the
Apartheid town by building free or subsidized housing on relatively cheap peripherally located land, will reduce the capital
cost per opportunity for government in the short term, but in the longer term, external costs to the beneficiaries, especially
travelling costs and time, would reduce this benefit and place an extra burden on the beneficiaries’ income streams and
lifestyle. The table below provides a summary of the Municipality’s infrastructure:
Infrastructural summary
Major service backlog areas within the municipal area
Electricity, sanitation and water services; housing
Service areas where there are a lack of maintenance according to the priority needs
Sanitation and water infrastructure
Status of Master Plans See paragraph 3.11
Current condition of roads within the Municipality
Tarred roads – good; gravel roads - poor
Current public transport services provided in the Municipality according to modes used often
Minibus/taxi, bus and train
Current status of the airport Carnarvon airport being upgraded
Areas threatened by poor storm water management (areas prone to flooding according to priority)
All urban areas
Major development projects of significance in the Municipality that have an effect on the existing service delivery situation
Housing delivery
Major developments restricted due to a lack of bulk services in the Municipality
Housing delivery
Condition of electrical service provision (reliability, major substations and internal infrastructure)
Good
Infrastructure Summary

Integrated Development Plan 2017-2022
35
3.5.2 Services and Backlogs
The table above reflects a challenge to provide the basic services to all households residing within the municipal area:
Local municipality
Services (and remaining backlogs)
Electricity (for lighting)
Water (Piped (tap) water inside
dwelling/institution)
Sewerage (Flush toilet (connected to
sewerage system)) Roads
Housing (Formal housing
(brick/concrete block structure)
Emthanjeni 92,6% (7,4%) 59,8% (40,2%) 79,6% (20,4%)
Tarred roads:
good
Gravel roads:
poor
95,4% (4,6%
Kareeberg 73,6% (26,4%) 41,5% (58,5%) 55,6% (44,4%) 89,6% (10,4%)
Renosterberg 88,1% (11,9%) 53,4% (46,6%) 71,7% (28,3%) 94,7% (5,3%)
Siyancuma 82,2% (17,8%) 41,4% (58,6%) 53,4% (46,6%) 73,0% (27%)
Siyathemba 86,2% (13,8%) 43,1% (56,9%) 64,9% (35,1%) 88,6% (11,4%)
Thembelihle 75,2% (24,8%) 33,5% (66,5%) 60,0% (40,0%) 77,5% (22,5%)
Ubuntu 84,8% (15,2%) 49,2% (50,8%) 64,3% (35,7%) 87,6% (12.4%)
Umsobomvu 86,7% (13,3%) 45,1% (54,9%) 68,7% (31,3%) 82,3% (17,7%)
Total 85,1% 47,0% 65,7% n/a 86,3%
Services and Backlogs
3 . 6 S o c i a l C o n t e x t
In this section, insight is gained into the social context within which integrated development planning must occur, through a
high-level summary of the key socio-economic and demographic aspects of the communities.
3.6.1 Social Summary
It is evident from the information in the table below that the mobility of individuals is restricted by the absence of a public
transport system and long distances between towns. This situation is a huge stumbling block in the development of human
and social capital owing to limited access to information and opportunities:
Social context
Population size of the Municipality 186 352
Education levels (% of community that has passed Grade 12)
82,2% (Northern Cape – 2016)
Number of primary schools in the municipal area 74
Secondary schools within the municipal area 17
Tertiary institutions within the municipal area -
Employment rates within the municipal area 71,7%
Unemployment rates within the municipal area 28,3%
Income levels (typical income within the municipal area)
90% of households below average of a South African household
% of people living in poverty (2011) 44.7%
HIV and Aids (population segment that is HIV positive - %, average annual growth in HIV
9,6%
Major travelling modes for the municipal community (by priority usage)
Foot, Car as a passenger, Car as a driver, Minibus/taxi, Bus, Bicycle, Train
Transportation needs to serve the public transport sector
Reliable and cheap short and long distance travel modes
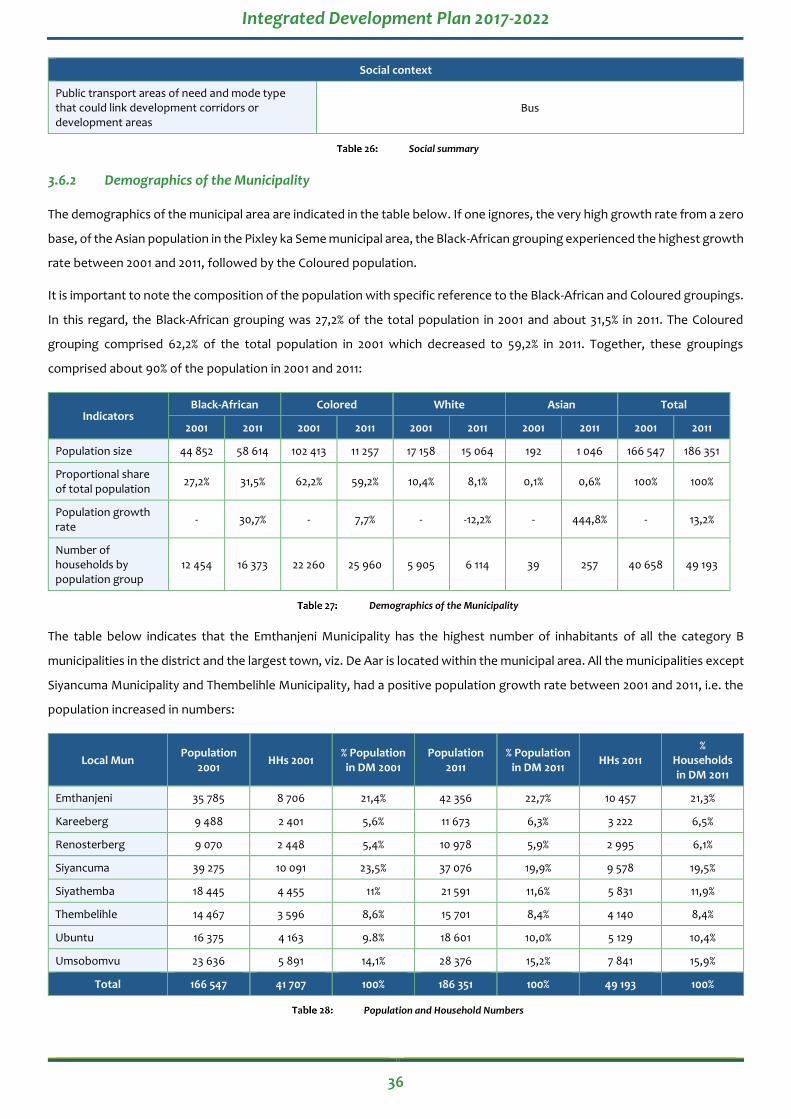
Integrated Development Plan 2017-2022
36
Social context
Public transport areas of need and mode type that could link development corridors or development areas
Bus
Social summary
3.6.2 Demographics of the Municipality
The demographics of the municipal area are indicated in the table below. If one ignores, the very high growth rate from a zero
base, of the Asian population in the Pixley ka Seme municipal area, the Black-African grouping experienced the highest growth
rate between 2001 and 2011, followed by the Coloured population.
It is important to note the composition of the population with specific reference to the Black-African and Coloured groupings.
In this regard, the Black-African grouping was 27,2% of the total population in 2001 and about 31,5% in 2011. The Coloured
grouping comprised 62,2% of the total population in 2001 which decreased to 59,2% in 2011. Together, these groupings
comprised about 90% of the population in 2001 and 2011:
Indicators Black-African Colored White Asian Total
2001 2011 2001 2011 2001 2011 2001 2011 2001 2011
Population size 44 852 58 614 102 413 11 257 17 158 15 064 192 1 046 166 547 186 351
Proportional share of total population
27,2% 31,5% 62,2% 59,2% 10,4% 8,1% 0,1% 0,6% 100% 100%
Population growth rate
- 30,7% - 7,7% - -12,2% - 444,8% - 13,2%
Number of households by population group
12 454 16 373 22 260 25 960 5 905 6 114 39 257 40 658 49 193
Demographics of the Municipality
The table below indicates that the Emthanjeni Municipality has the highest number of inhabitants of all the category B
municipalities in the district and the largest town, viz. De Aar is located within the municipal area. All the municipalities except
Siyancuma Municipality and Thembelihle Municipality, had a positive population growth rate between 2001 and 2011, i.e. the
population increased in numbers:
Local Mun Population
2001 HHs 2001
% Population in DM 2001
Population 2011
% Population in DM 2011
HHs 2011 %
Households in DM 2011
Emthanjeni 35 785 8 706 21,4% 42 356 22,7% 10 457 21,3%
Kareeberg 9 488 2 401 5,6% 11 673 6,3% 3 222 6,5%
Renosterberg 9 070 2 448 5,4% 10 978 5,9% 2 995 6,1%
Siyancuma 39 275 10 091 23,5% 37 076 19,9% 9 578 19,5%
Siyathemba 18 445 4 455 11% 21 591 11,6% 5 831 11,9%
Thembelihle 14 467 3 596 8,6% 15 701 8,4% 4 140 8,4%
Ubuntu 16 375 4 163 9.8% 18 601 10,0% 5 129 10,4%
Umsobomvu 23 636 5 891 14,1% 28 376 15,2% 7 841 15,9%
Total 166 547 41 707 100% 186 351 100% 49 193 100%
Population and Household Numbers

Integrated Development Plan 2017-2022
37
The growth rate of the population in the municipal area depends largely on the availability of economic opportunities to
especially young adults. A stagnating economy will result in the outflow of work seekers with a resulting impact on the
households and society at large.
Category 2001-2006 2001 -2011
Rate Rate
Percentage growth per annum -1,27 1,12
Total Population Projection: Growth Rate
It is argued that the population growth rate will not be higher than 2% over the next 5-year period, viz. till 2021. It is believed
that some of the residents will actually seek employment opportunities in the Carnarvon area, as a result of the Square
Kilometer Array telescope development project in the western segment of the district and that if appointed, their income and
spending patterns will be very different to what they are now.
3.6.3 Education Levels
The table below indicates that there is a vast improvement in the number of pupils in the municipal area, or conversely, there
is a significant decrease in the number of persons with no schooling. The biggest change in the education levels occurred with
the increase in the number of pupils with Grade 12 qualification compared to the number in 2001:
Persons 2001 2011 % change
No schooling 32 537 18 065 -44,5%
Some primary school 52 701 54 518 3,4%
Complete primary 11 822 11 997 1,5%
Secondary 32 616 47 992 47,1%
Grade 12 12 557 23 603 88,0%
Higher 5 239 6 562 25,3%
Education Levels
3.6.4 Service Delivery Levels
Regarding service provision in the Pixley ka Seme District Municipality, there has been an improvement in the provision of
electricity for lighting from 2001 to 2011 (75,1% of households in 2001 vs 85,1% in 2011). The proportion of households with flush
toilets connected to the sewerage system has also greatly improved from 45,4% in 2001 to 65,7% in 2011. The provision of piped
water inside dwellings has also increased from 32,8% in 2001 to 47% in 2011, as well as the provision of refuse removal to
households. The service delivery levels in the municipal area are indicated in the table below:
Service (% share of households)
2001 2011 % change
Electricity 75,1% 85,1% 10,0%
Flush toilets 45,4% 65,7% 20,3%
Water (piped water) 32,8% 47,0% 14,2%
Refuse removal (at least once a week)
67,8% 72,6% 4,8%
Service Delivery Levels
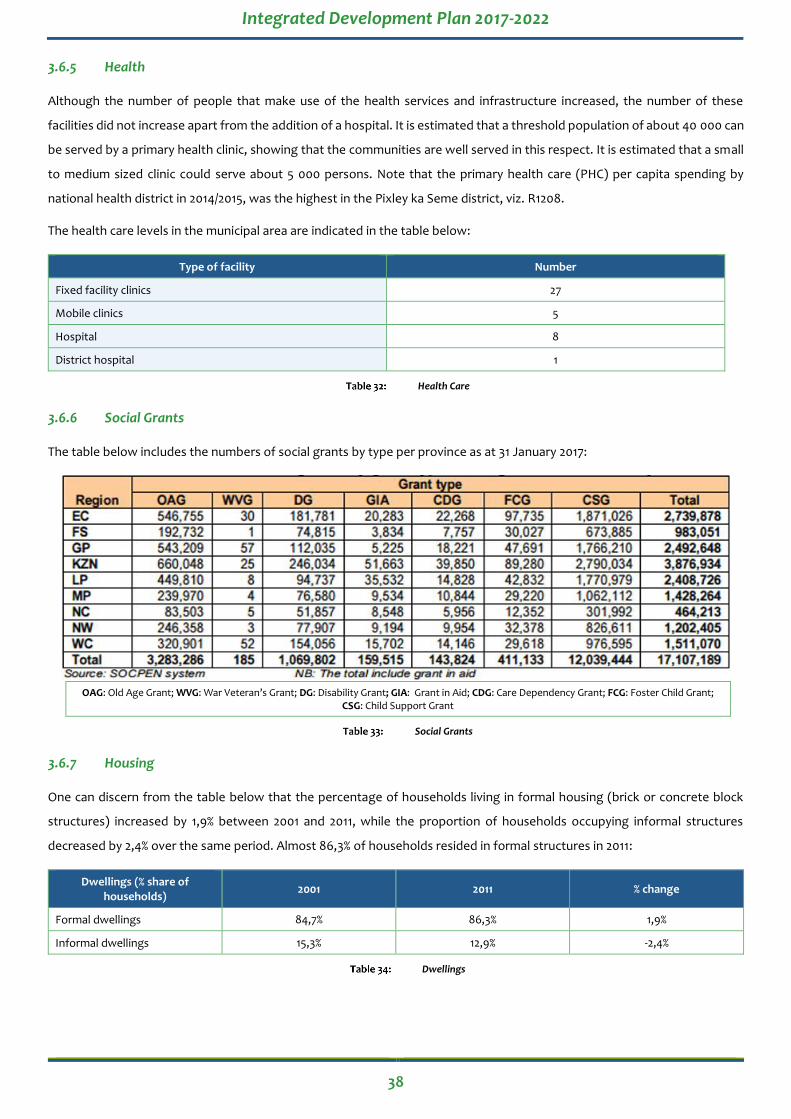
Integrated Development Plan 2017-2022
38
3.6.5 Health
Although the number of people that make use of the health services and infrastructure increased, the number of these
facilities did not increase apart from the addition of a hospital. It is estimated that a threshold population of about 40 000 can
be served by a primary health clinic, showing that the communities are well served in this respect. It is estimated that a small
to medium sized clinic could serve about 5 000 persons. Note that the primary health care (PHC) per capita spending by
national health district in 2014/2015, was the highest in the Pixley ka Seme district, viz. R1208.
The health care levels in the municipal area are indicated in the table below:
Type of facility Number
Fixed facility clinics 27
Mobile clinics 5
Hospital 8
District hospital 1
Health Care
3.6.6 Social Grants
The table below includes the numbers of social grants by type per province as at 31 January 2017:
OAG: Old Age Grant; WVG: War Veteran’s Grant; DG: Disability Grant; GIA: Grant in Aid; CDG: Care Dependency Grant; FCG: Foster Child Grant;
CSG: Child Support Grant
Social Grants
3.6.7 Housing
One can discern from the table below that the percentage of households living in formal housing (brick or concrete block
structures) increased by 1,9% between 2001 and 2011, while the proportion of households occupying informal structures
decreased by 2,4% over the same period. Almost 86,3% of households resided in formal structures in 2011:
Dwellings (% share of households)
2001 2011 % change
Formal dwellings 84,7% 86,3% 1,9%
Informal dwellings 15,3% 12,9% -2,4%
Dwellings
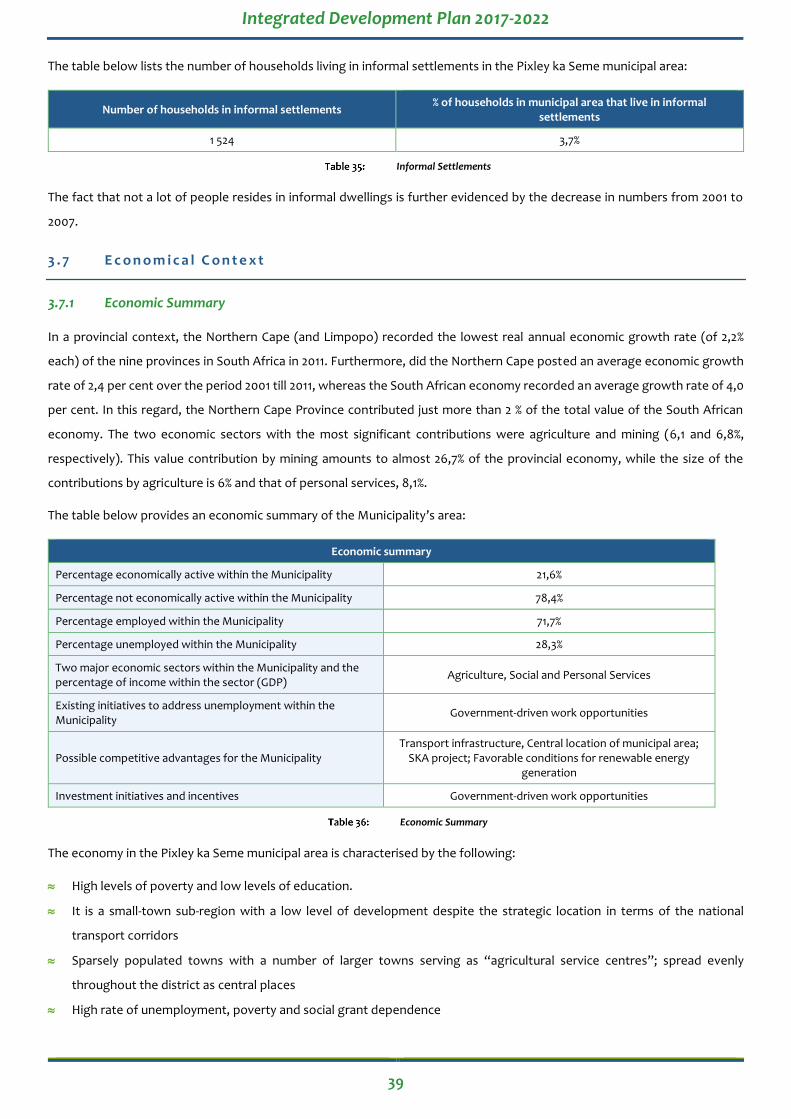
Integrated Development Plan 2017-2022
39
The table below lists the number of households living in informal settlements in the Pixley ka Seme municipal area:
Number of households in informal settlements % of households in municipal area that live in informal
settlements
1 524 3,7%
Informal Settlements
The fact that not a lot of people resides in informal dwellings is further evidenced by the decrease in numbers from 2001 to
2007.
3 . 7 E c o n o m i c a l C o n t e x t
3.7.1 Economic Summary
In a provincial context, the Northern Cape (and Limpopo) recorded the lowest real annual economic growth rate (of 2,2%
each) of the nine provinces in South Africa in 2011. Furthermore, did the Northern Cape posted an average economic growth
rate of 2,4 per cent over the period 2001 till 2011, whereas the South African economy recorded an average growth rate of 4,0
per cent. In this regard, the Northern Cape Province contributed just more than 2 % of the total value of the South African
economy. The two economic sectors with the most significant contributions were agriculture and mining (6,1 and 6,8%,
respectively). This value contribution by mining amounts to almost 26,7% of the provincial economy, while the size of the
contributions by agriculture is 6% and that of personal services, 8,1%.
The table below provides an economic summary of the Municipality’s area:
Economic summary
Percentage economically active within the Municipality 21,6%
Percentage not economically active within the Municipality 78,4%
Percentage employed within the Municipality 71,7%
Percentage unemployed within the Municipality 28,3%
Two major economic sectors within the Municipality and the percentage of income within the sector (GDP)
Agriculture, Social and Personal Services
Existing initiatives to address unemployment within the Municipality
Government-driven work opportunities
Possible competitive advantages for the Municipality Transport infrastructure, Central location of municipal area;
SKA project; Favorable conditions for renewable energy generation
Investment initiatives and incentives Government-driven work opportunities
Economic Summary
The economy in the Pixley ka Seme municipal area is characterised by the following:
High levels of poverty and low levels of education.
It is a small-town sub-region with a low level of development despite the strategic location in terms of the national
transport corridors
Sparsely populated towns with a number of larger towns serving as “agricultural service centres”; spread evenly
throughout the district as central places
High rate of unemployment, poverty and social grant dependence

Integrated Development Plan 2017-2022
40
Prone to significant environmental changes owing to long-term structural changes (such as climate change, energy crises
and other shifts)
Geographic similarity in economic sectors, growth factors and settlement patterns
Economies of scale not easily achieved owing to the relatively small size of towns
A diverse road network with national, trunk, main and divisional roads of varying quality, and
Potential and impact of in renewable energy resource generation.
The establishment of the Square Kilometre Array project in the western segment of the municipal area is the most significant
investment of any kind in recent years. In this regard, it is important for all stakeholders to ensure that the ‘other’ sources of
local or regional livelihoods, e.g. agriculture, are not undermined. However, since the introduction of the project the following
elements of the local economy has benefited significantly: road infrastructure, local job opportunities created (mainly Black
Economic Empowerment driven), purchasing of local supplies and services, e.g. in the hospitality industry and the property
market through higher demand and the construction of new houses. Another key aspect of beneficiation is the introduction
of improved high speed broadband connection for previously unconnected communities.
It is important to note that Carnarvon in the Kareeberg municipal area is seen as the main geographic hub of investment in
terms of the SKA project. In this regard, and seen in the broader regional context, it is an imperative for all three tiers of
government to become involved in the monitoring and evaluating of change in, inter alia, the socio-economic status of the
directly and indirectly affected communities. For example, to monitor the implementation and results of the human capital
development programmes.
The challenge is also to optimise, share and sustain these collateral benefits to the local and regional economy and by
implication, to the local communities. For example, the financial sustainability of mainly the Kareeberg Municipality will impact
on the standard and availability of certain services and infrastructure and proper land use management will result in a socio-
political approach to sharing the tourism-related opportunities.
3.7.2 GDP of the Municipality
The Pixley ka Seme District Municipality is a relatively small economy, making up about 10% of Gross Domestic Product in the
Northern Cape Province. GDP growth rates average at below 3% per annum. The economy is predominantly primary sector
focused with manufacturing and tourism also contributing to the district economy. In the coming years, the sector
contributions will fluctuate with the contributions by the social and personal services sector (including tourism) and the
agriculture sector expected to increase and decrease respectively. This is owing to a very low growth rate in certain sectors
but a sharp increase in the others, mainly as a result of, as mentioned, the investment in renewable energy generation and
the SKA project.
3.7.3 Investment Typology
In a 2011 research study called “Development Potential of Urban Settlements in the Northern Cape” by Van der Merwe, I.J.,
and Zietsman, H.L. regarding the investment potential of municipalities and settlements in the Northern Cape, a set of
indicators was developed and used to determine the development/growth potential and human needs at two functional
levels, i.e. municipal and settlement. In the following section we only refer to the respective municipalities as functional level.
The indicators were grouped as follows with the components of each grouping in brackets:
Resource index (natural and human resources),
Infrastructure index (transportation, communication and institutional services), and
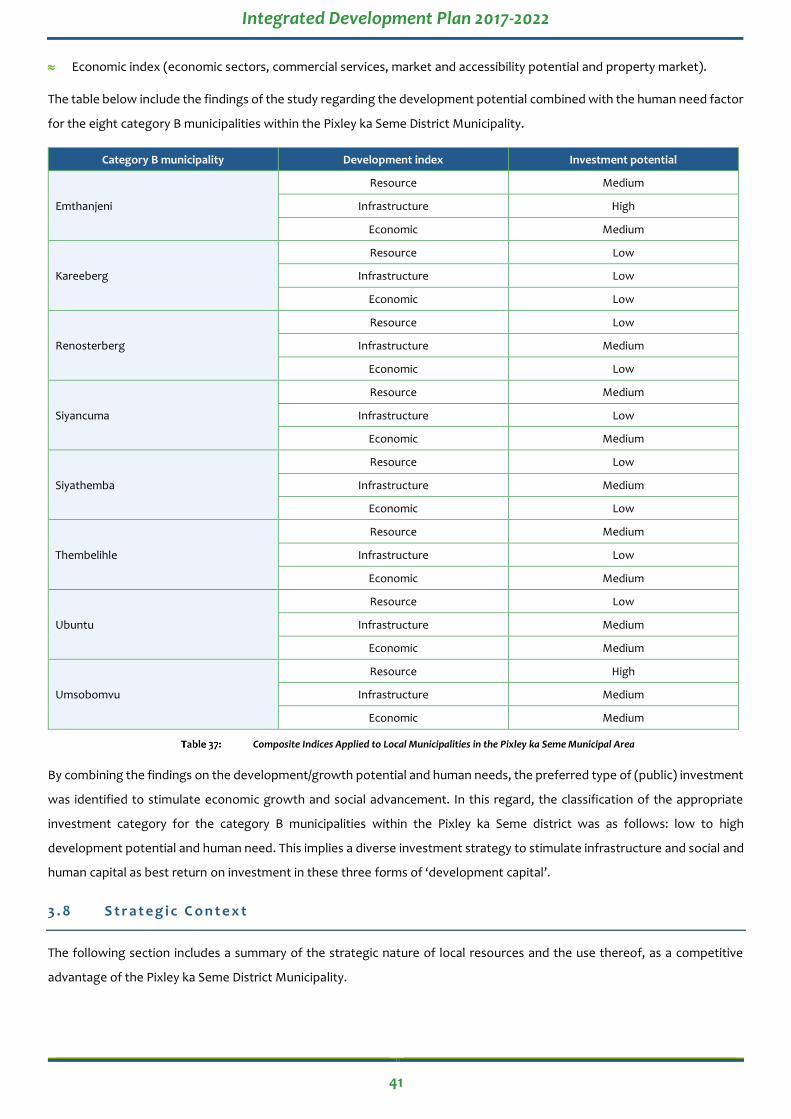
Integrated Development Plan 2017-2022
41
Economic index (economic sectors, commercial services, market and accessibility potential and property market).
The table below include the findings of the study regarding the development potential combined with the human need factor
for the eight category B municipalities within the Pixley ka Seme District Municipality.
Category B municipality Development index Investment potential
Emthanjeni
Resource Medium
Infrastructure High
Economic Medium
Kareeberg
Resource Low
Infrastructure Low
Economic Low
Renosterberg
Resource Low
Infrastructure Medium
Economic Low
Siyancuma
Resource Medium
Infrastructure Low
Economic Medium
Siyathemba
Resource Low
Infrastructure Medium
Economic Low
Thembelihle
Resource Medium
Infrastructure Low
Economic Medium
Ubuntu
Resource Low
Infrastructure Medium
Economic Medium
Umsobomvu
Resource High
Infrastructure Medium
Economic Medium
Composite Indices Applied to Local Municipalities in the Pixley ka Seme Municipal Area
By combining the findings on the development/growth potential and human needs, the preferred type of (public) investment
was identified to stimulate economic growth and social advancement. In this regard, the classification of the appropriate
investment category for the category B municipalities within the Pixley ka Seme district was as follows: low to high
development potential and human need. This implies a diverse investment strategy to stimulate infrastructure and social and
human capital as best return on investment in these three forms of ‘development capital’.
3 . 8 S t r a t e g i c C o n t e x t
The following section includes a summary of the strategic nature of local resources and the use thereof, as a competitive
advantage of the Pixley ka Seme District Municipality.

Integrated Development Plan 2017-2022
42
3.8.1 Strategic Summary
In the table above, the strategic nature of the local resources is described as beneficial to serve as the catalyst for investment:
Strategic summary
Location in terms of major transport nodes (nationally and district wide)
Excellent, for example, Colesberg is a convergence point of three national roads and De Aar the second biggest convergence point
of rail in South Africa
Major tourism and development corridors within the municipality and how these corridors are being explored for further development
Of a number of potential corridors in the Northern Cape, only two of these corridors, viz. the solar and the N1 corridors, have been
identified to stretch into the municipal area
Existing contribution to the GDP of the Province About 10%
What has been done to create an enabling environment for investors within the Municipality
An approach to the use and development of land and infrastructure that supports development initiatives
What is being done to utilize the existing natural resources within the Municipality to attract investment
Nature conservation as an off-set for the loss of agricultural land and farming activities in the western segment of the district
Strategic Summary
3.8.2 Possible Opportunities
The following possible opportunities could be utilised:
Corridor/niche/action Economic sector Area
Optimising the strategic location regarding the national transport corridors
Transport Municipal area
Expanding the ‘reach’ of the SKA project (Cross-cutting) Municipal area
Understanding the impact of significant environmental changes owing to long-term structural changes (such as climate change, energy crises and other shifts)
(Cross-cutting) Municipal area
Expanding the economy of scale of larger towns (Cross-cutting) Prieska, Carnarvon, Colesberg
and De Aar
Keeping the diverse road network in a good condition Transport Municipal area
Allowing investment in renewable energy resource generation Construction; Electricity Municipal area
Possible Opportunities
3.8.3 Developmental Direction for Urban Areas
All the towns within the district is typical Karoo towns which consists of a (in some cases, small) middle class (including black
and/or coloured government officials) and a few emerging entrepreneurs, with the majority of the remaining population
depending on government grants. The towns are further characterised by the following:
Spatial fragmentation and racial segregation,
Weak property markets owing to low demand (note the change in demand for specifically houses and land in Carnarvon),
Low urban dwelling densities but high population densities in certain urban areas,
Forming of higher activity nodes next to development corridors,
Environmental degradation,
Inadequate public transport leading to high pedestrian volumes,
Weak local economic multipliers and high levels of “leakage” for services to other towns/cities (however, a noticeable
“inter-leakage” from other towns in the district to Carnarvon), and
Skilled workers relocating to towns with development potential.

Integrated Development Plan 2017-2022
43
The table below lists the investment opportunities and possible disenfranchisement in the district.
Category B municipality Investment opportunity(ies) Disenfranchisement
Kareeberg
Transportation (e.g. airport at Carnarvon); nature conservation and eco-tourism; retail; property market; broadband connection; business services; construction
Commercial agriculture; seasonal work opportunities; social capital (of farmers)
Ubuntu
Transportation (e.g. airport at Carnarvon); nature conservation and eco-tourism; retail; property market; broadband connection; business services; construction
Commercial agriculture; seasonal work opportunities; social capital (of farmers)
Siyathemba Renewable energy
Investment opportunities and disenfranchisement
3 . 9 T h e O r g a n i s a t i o n
3.9.1 Council
The Council of Pixley ka Seme District Municipality comprises of 19 elected councillors, made up from 11 representative
councillors and 8 proportional representatives (PR) councillors elected based on the proportionality of votes cast for the
respective parties. The table below categorises the councillors within their specific political parties:
Name of Councillor Capacity Political Party Representing or Proportional
MT Kibi Executive Mayor ANC Proportional
NL Hermans Speaker ANC Proportional
UR Itumeleng Member Mayoral Committee ANC Proportional
AT Sintu Member Mayoral Committee ANC Proportional
GL Nkumbi Member Mayoral Committee ANC Proportional
J Grobbelaar Chairperson MPAC DA Proportional
H Marais Councillor DA Proportional
MA Matebus Councillor EFF Proportional
L Billie Councillor ANC Representative
J Hoffman Councillor DA Representative
JEJ Hoorn Councillor ANC Representative
ME Bitterbos Councillor ANC Representative
JH George Councillor ANC Representative
LC van Niekerk Councillor DA Representative
JT Yawa Councillor ANC Representative
S Swartling Councillor ANC Representative
JH Vorster Councillor DA Representative
E Humphries Councillor ANC Representative
NJ Batties Councillor DA Representative
Composition of Council

Integrated Development Plan 2017-2022
44
3.9.2 The Executive Mayoral Committee
The Council has and Executive Mayor and Executive Councillors consisting of the Deputy Executive Mayor, the Speaker and
three full-time Councillors who each hold a direct portfolio as assigned by the Executive Mayor. The portfolios assigned to the
members of the Executive Mayoral Committee are as follows:
Name of Member Capacity
UR Itumeleng Chairperson Corporate Services Committee
AT Sintu Chairperson Infrastructure, Development, Housing and Planning
GL Nkumbi Chairperson Finance Committee
Executive Mayoral Committee
The portfolio committees’ primary responsibility is to exercise oversight over the executive arm of the Municipality’s
governance structure. These committees monitor the delivery and outputs of the executive and may request directorates to
account for the outputs of their functions. Executive Councillors account for executive decisions and operations performed
within the general policy framework agreed to by Council and although the portfolio committees play an oversight role, they
have limited decision-making powers. The committees are responsible for submitting their reports to the Mayoral Committee.
3.9.3 Executive management structure
The administration arm of Pixley ka Seme District Municipality is headed by the Municipal Manager, who has three Section 57
managers reporting directly to him. The Municipal Manager, as head of the administration, is responsible and accountable for
tasks and functions as provided for in Section 55 of the MSA, other functions/tasks as provided for in legislation as well as
functions delegated to him by the Executive Mayor and Council.
3.9.4 Departmental structure
Pixley ka Seme District Municipality has four departments and the functions of each can be summarised as follows:
Departmental Functions
Department Core Functions
Office of the Executive Mayor Communication Community Liaison Special Programmes
Corporate Services
Municipal Health Services Support Services Human Resources Performance Management Services Disaster Management Legal Services & Labour Division
Infrastructure, Housing, Planning and Development
Infrastructure Development LED Housing Spatial Planning
Finance
Finance Budget Control Salaries Asset Management Supply Chain Management
Internal Audit Internal Audit Internal Audit Shared Services
Departmental functions
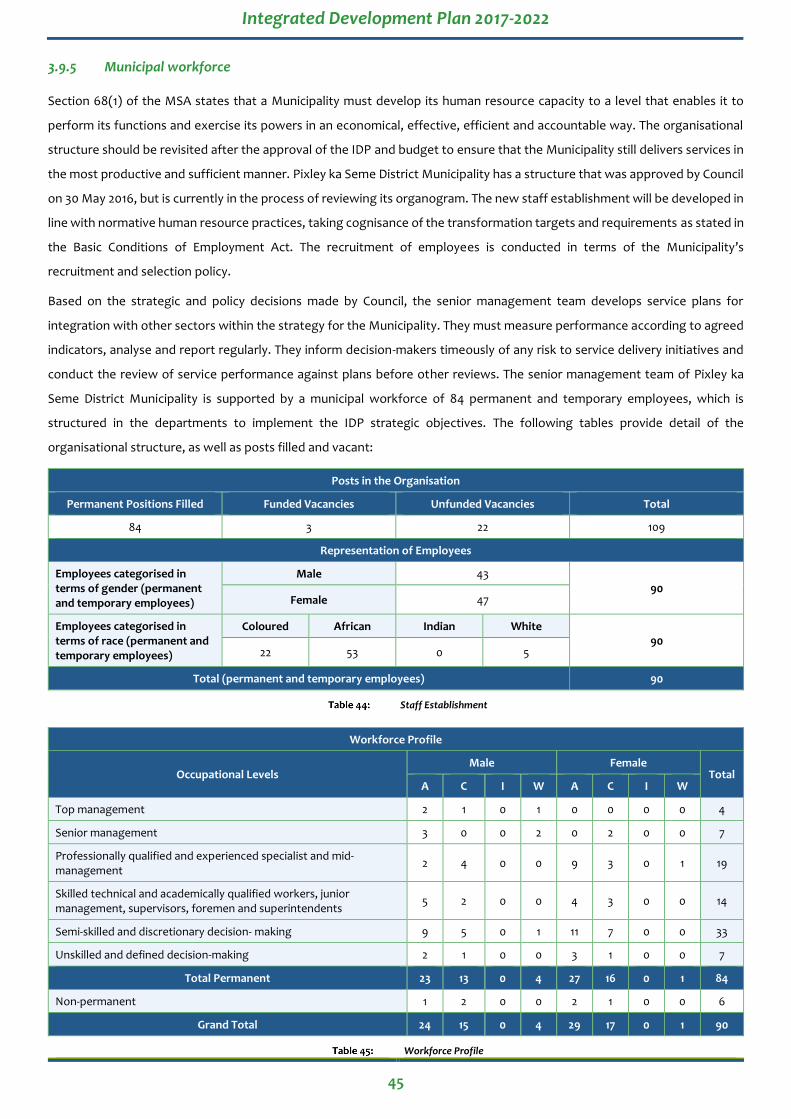
Integrated Development Plan 2017-2022
45
3.9.5 Municipal workforce
Section 68(1) of the MSA states that a Municipality must develop its human resource capacity to a level that enables it to
perform its functions and exercise its powers in an economical, effective, efficient and accountable way. The organisational
structure should be revisited after the approval of the IDP and budget to ensure that the Municipality still delivers services in
the most productive and sufficient manner. Pixley ka Seme District Municipality has a structure that was approved by Council
on 30 May 2016, but is currently in the process of reviewing its organogram. The new staff establishment will be developed in
line with normative human resource practices, taking cognisance of the transformation targets and requirements as stated in
the Basic Conditions of Employment Act. The recruitment of employees is conducted in terms of the Municipality’s
recruitment and selection policy.
Based on the strategic and policy decisions made by Council, the senior management team develops service plans for
integration with other sectors within the strategy for the Municipality. They must measure performance according to agreed
indicators, analyse and report regularly. They inform decision-makers timeously of any risk to service delivery initiatives and
conduct the review of service performance against plans before other reviews. The senior management team of Pixley ka
Seme District Municipality is supported by a municipal workforce of 84 permanent and temporary employees, which is
structured in the departments to implement the IDP strategic objectives. The following tables provide detail of the
organisational structure, as well as posts filled and vacant:
Posts in the Organisation
Permanent Positions Filled Funded Vacancies Unfunded Vacancies Total
84 3 22 109
Representation of Employees
Employees categorised in terms of gender (permanent and temporary employees)
Male 43 90
Female 47
Employees categorised in terms of race (permanent and temporary employees)
Coloured African Indian White 90
22 53 0 5
Total (permanent and temporary employees) 90
Staff Establishment
Workforce Profile
Occupational Levels Male Female
Total A C I W A C I W
Top management 2 1 0 1 0 0 0 0 4
Senior management 3 0 0 2 0 2 0 0 7
Professionally qualified and experienced specialist and mid-management
2 4 0 0 9 3 0 1 19
Skilled technical and academically qualified workers, junior management, supervisors, foremen and superintendents
5 2 0 0 4 3 0 0 14
Semi-skilled and discretionary decision- making 9 5 0 1 11 7 0 0 33
Unskilled and defined decision-making 2 1 0 0 3 1 0 0 7
Total Permanent 23 13 0 4 27 16 0 1 84
Non-permanent 1 2 0 0 2 1 0 0 6
Grand Total 24 15 0 4 29 17 0 1 90
Workforce Profile

Integrated Development Plan 2017-2022
46
Per Occupational Level
Post level Filled Vacant
Top management 4 1
Senior management 7 1
Professionally qualified and experienced specialists and mid- management
19 4
Skilled technical and academically qualified workers, junior management, supervisors, foremen and superintendents
14 8
Semi-skilled and discretionary decision making
33 7
Unskilled and defined decision making 7 1
Total 84 22
Per functional level
Functional area Filled Vacant
Municipal Manager 1 0
Strategic Support Services 1 0
Financial Services 1 0
Community Services 0 1
Technical Services 1 0
Total 4 1
Vacancy Rate per Post (salary) and Functional Level
3.9.6 Municipal administrative and institutional capacity
The Municipality has the following policies to support the workforce in delivering on the strategic objectives:
Approved Policies
Name of Policy Responsible Department Date Approved
Recruitment and Selection Policy Corporate Services 27 May 2016
Skills Development Policy Corporate Services 27 May 2016
Career Pathing Policy Corporate Services 27 May 2016
Study Assistance Policy Corporate Services 27 May 2016
Staff Induction Policy Corporate Services 27 May 2016
Bereavement Policy Corporate Services 27 May 2016
Code of Conduct for Municipal Officials Corporate Services Local Government: Municipal Systems Act
Dress Code Policy Corporate Services 27 May 2016
Employee Health and Wellness Policy Corporate Services 27 May 2016
Employment Equity Plan Corporate Services 27 May 2016
HIV/Aids Policy Corporate Services 27 May 2016
Human Resources Strategy Corporate Services 27 May 2016
Placement Policy Corporate Services 8 July 2002
Performance Management Framework Corporate Services 27 May 2016
Promotion and Succession Planning Policy Corporate Services 27 May 2016
Remuneration Policy Corporate Services 27 May 2016

Integrated Development Plan 2017-2022
47
Approved Policies
Name of Policy Responsible Department Date Approved
Rental Allowance Scheme Policy Corporate Services 27 May 2016
Substance Abuse Policy Corporate Services 27 May 2016
Organisational Structure Corporate Services 27 May 2016
Task Job Evaluation Policy Corporate Services 9 December 2016
Approved Policies
3.9.7 Skills development
The Workplace Skills Plan, which is submitted annually on the last day of April, reflects all the training done within the specified
period, as well as all the staff trained within the specified year. This plan also sets out the prioritised training for the following
financial year. Training is linked to the job description of each employee, which ensures that employees are registered for
training which has a direct impact on the performance of their duties. Training is governed by the Skills Development Act,
which is very prescriptive in the manner in which training must take place and the targets that must be adhered to, as well as
the employment equity targets which should be reached.
During 2015/16 the Municipality spent 0.90% of the operating budget on training.
3.9.8 Institutional performance
An institutional performance review provides critical information pertaining to the current status and critical service needs,
highlights and challenges. The information can provide value insight for the management team and guidance to engage in a
meaningful planning process to improve service delivery within the municipal area. The main highlights and challenges of the
past IDP period are summarised in the tables below:
Highlights
2nd year of unqualified audit opinion with emphasis of matter Decrease in the number of matters emphasized in the audit report Stable administration, despite financial challenges Prudent financial management No litigation against the institution Productive relationship with the local municipalities and sector departments Active participation in district and provincial forums Acquisition of additional fleet Renovation of main-office building Healthy relationship between Council and Senior Management Rendering of shared services despite financial challenges and non-payment by certain local municipalities MPAC seen as best practice in NC Independent operations of the Audit Committee and Internal Audit Maintenance of good labour relations Prioritization of staff-empowerment and training Application for financial assistance by Provincial Treasury in advanced stage Decreased consulting fees in terms of AFS presentation Timeous honoring of debt No withholding of grants due to non-compliance
Main Highlights of the Past IDP period
Challenges
Grant dependency and related financial constraints Reduction of functions of the district Resignation of technically-qualified staff Struggle to honor identified training-needs of staff Failure to pay some service providers within 30 days
Integrated Development Plan 2017-2022
48
Challenges
Spatial Development Framework (SDF) of the district Municipality needs to be reviewed – all SPLUMA applications needs to be aligned with the SDF
Shared services payments IT infrastructure: Technology and software Lack of Municipal Health Services By-Laws Shortage of funding and staff to deliver core functions effectively Directive from the National Health Department to move Municipal Health Services to Department of Health due to poor delivery
of services Absenteeism Limited resources in internal audit to meet the needs of the local municipalities Assessing, improving and monitoring the quality of the work performed by the IA function
Main Challenges of the Past IDP period
3 . 1 0 S e c t o r a l P l a n s
Apart from the legislative requirement to compile IDPs, there are national requirements that compel municipalities to
formulate sector plans, which should form part of the IDPs. All these legislative requirements applicable to sector plans are
aimed at ensuring that clear, workable and integrated plans are in place. The sole purpose is to achieve meaningful
development and improvement of the living conditions of citizens. The municipality currently have the sector plans as listed
below, but unfortunately some of them are outdated and were not reviewed in terms of new legislation and/or current
realities. There are currently contextual gaps and inconsistencies between the Municipality’s sector plans and present-day
national and provincial directives (e.g. the National Development Plan and SPLUMA), owing to the respective timelines of
drafting. The growth and development context in the district has also changed radically since 2013 (after it had been stagnant
for decades) owing mainly to private and public investments in the area as a hub for renewable energy generation and
astronomy, respectively. The outdated sector plans are not summarized in this IDP and the municipality will make provision
to review and/or compile these sector plans in the next 5 years. Although some of these plans have been reviewed, most of
the projects/actions as envisaged in these plans are unfunded and can only be implemented if external funding is received
from other spheres of Government of the private Sector.
Disaster Management Plan: Approved in 2008 – Outdated
District Growth and Development Strategy: Approved in 2006 – Outdated
Local Economic Development Strategy: Approved in 2008 – Outdated
Spatial Development Framework (SDF): Approved in 2013 – outdated, but see paragraph 3.10.1 for an executive summary
Integrated Waste Management Plan (IWMP) –- See paragraph 3.10.2 for an executive summary
Integrated Environmental Management Plan –- See paragraph 3.10.3 for an executive summary
Human Settlement Plan: Approved March 2017 – See paragraph 3.10.4 for an executive summary
Climate Change Vulnerability Assessment and Response Plan: November 2016: Still in draft – See Annexure A for an
executive summary
Rural Development Plan: Approved March 2017 – See Annexure B for an executive summary
3.10.1 Spatial Development Framework
Municipalities are required to compile Spatial Development Frameworks (SDFs) as core components of their IDPs as
prescribed by the Local Government: Municipal Systems Act, 2000 (Act 32 of 2000). Each district municipality and the local
municipalities within the area of the district municipality must align their SDFs in accordance with the framework of integrated
development planning referred to in Section 27 of the Municipal Systems Act.

Integrated Development Plan 2017-2022
49
The Role and Purpose of a District SDF
The regulations (White Paper on Spatial Planning and Land Use Management, Draft Land Use Management Bill and Municipal
Planning and Performance Management Regulations, 2001) do not distinguish between local and district municipalities’ SDFs
and we can assume, therefore, that to avoid duplication the district municipality should focus on the broader spatial patterns
and will contain the detail of the local municipalities. It will, however, contain a detail Land Use Management System (LUMS)
for the district and furthermore aim to align the Spatial Development
Frameworks of the different municipalities and give strategic direction in terms of investment in the region.
The role of SDF is to:
guide spatial planning and land development in the Pixley ka Seme district area;
guide spatial planning and land development in the local municipalities of the district; and
guide spatial planning, land development and land use management in the Pixley ka Seme District within the framework
of National and Provincial Spatial plans.
The purpose of the document is:
To translate the SDF into a more detailed and geographically specific land use management tool.
To consolidate, update and review existing spatial planning and development management mechanisms.
To guide the preparation of more detailed local area plans, precinct plans and land use schemes.
To provide a more concrete spatial and land use guideline policy for use by municipal and other infrastructure service
providers in planning and delivering their services.
To provide direction and guidance to private sector and community investors with respect to the levels, locations, types
and forms of investment that need to be made, and that will be supported by the District Municipality.
The critical elements of the SDF is to:
Give effect to the principles contained in the National Spatial Planning and Land Use Management Act of 2013 (Act 16 of
2013) or SPLUMA;
Preferential and focus areas for certain types of land uses.
The location of projects identified as part of the integrated development planning process.
Reflect the spatial objectives and strategies contained in the IDP.
Indicate the desired direction of urban expansion and the most appropriate use of vacant land where appropriate and
desirable.
A business plan for implementation of the spatial development framework.
In a rural context the documents also deals specifically with:
Natural resource management issues,
Land rights and tenure arrangements,
Land capability,
Subdivision and consolidation of farms, and
The protection of prime agricultural land.
Following the district overview, the document also looked in more detail the spatial issues on local municipal level. For each
local municipality, standards, norms and values for management of the environmental resources and features were listed and
displayed on maps of the area. Areas of high-risk for development activities were also indicated on the maps, therefore

Integrated Development Plan 2017-2022
50
providing a guideline for development within the local municipal areas. The main spatial and land issues of each town were
then indicated on a spatial development guideline map.
Finally the Spatial Development Framework of the district aim to focus on potential areas where development is most likely
to occur. It therefore identifies development nodes and corridors which need to receive priority for future development as
shown below. The Pixley ka Seme SDF will serve as a point of departure to inform the local SDFs.
3.10.2 Integrated Waste Management Plan (IWMP)
The district municipality compiled its Integrated Waste Management Plan for waste management in the various local
municipalities under its jurisdiction.
The compilation of the plan was done in terms of the national waste management strategy, the IDP process and the draft
charter document for integrated waste management planning in South Africa. The draft process of compiling the plan
consisted of two phases. The Status Quo for Phase 1 consisted of an assessment of the current status of waste collection
systems and existing disposal sites, service delivery capacity and a needs analysis for each of these aspects.
The second phase comprised of the compilation of the IWMP’s. The objectives and goals identified was included in this phase,
with alternatives for obtaining these being considered and evaluated on a high level thereafter. Based on the preferred
options selected for implementation, a programme was developed and cost estimates compiled.
The waste management related issues that were addressed in the plan are:
Disposal Infrastructure
Waste Collection Infrastructure
Institutional Capacity and Human Resources
Financial Resources
Dissemination of Information / Communication
Management of Illegal Activities
Waste Minimisation
3.10.3 Integrated Environmental Management Plan
The Integrated Environmental Management Programme was compiled by the district municipality to ensure that land use
decision making must be taken with adequate environmental resource information is available in other to ensure sustainable
and appropriate environmental management to the benefit of its residents.
The set goals of the plan include the following:
Ensure all environmental issues are appropriately addressed.
Minimize potential negative impact of all envisaged projects.
Ensure the integrated development planning process complies with environmental legislation.
Provide guidelines to investors in terms of environmental considerations.
Demonstrate municipalities commitment to the promotion of local biodiversity.
Identify development opportunities and threats to the environment.
Provide a framework for sustainable development.
Integrated Development Plan 2017-2022
51
Environmental Management
The goal of realizing integrated development is underpinned by development and resourcing strategies and ensuring
environmental sustainability in development programmes. The programme will play a significant role in preservation of
natural resources through the following intensions:
Clean and Greening Initiatives: In response to the poor state of rivers and wetlands in the area, the clean green initiative
will seek to upgrade and clean water streams, rivers and the Wetlands Park. This is aimed at improving public health and
safety and provide jobs, skills development and enhance tourism opportunities;
Rivers and water source management: Such interventions will seek to coordinate the fight against invasive alien flora.
The intervention mainstreams HIV/AIDS, gender and youth empowerment. This encourages partnership with local
communities, to whom it provides jobs, and government departments, state owned enterprises, conservation and
environment advocacy groups, research foundations and private companies.
Fire prevention and management intervention: NC is viewed as a fire-prone ecosystem. The intervention focuses on fire
prevention and management. The programme’s underlying motivation is poverty relief and skills development which are
designed to build self-esteem and help beneficiaries to fulfil their true potential.
Community-based forest management
The intervention aims to promote the sustainable use of woodlands and their products for the benefit of both wildfire and
people. Its objectives are to promote the use of locally produced woodland products, support development of sustainable
wood based businesses and educate for sustainable use of woodlands.
Land care:
The land care initiative will lay the foundation of community involvement and wider participation in conservation of natural
resources (soil, water and vegetation). It will further provide basis for developing links with civil society representatives,
uneverities, etc. it is a community-based programme supported by both the public and private sector through series of
partnerships.
The programme’s value-add would focus on:
Environmental impact assessment towards infrastructure development in the area.
Development of Environmental Management Plans.
Implementation of environmental conservation programmes.
Social Infrastructure Development
The concept realizes the centrality of infrastructure in supporting socio-economic development and its contribution as a
vehicle for poverty eradication. The programme will facilitate and support the provisioning of both public-mandated and
community-mandated social infrastructure. This comprises social infrastructure delivered with additional social outcomes,
for line departments at the request of the Executive Authority and where the client is the community/CBOs with strategic
partners. The value adds from the programme encompasses the following:
Programme planning, management and implementation.
Coordination of integrated development initiatives.

Integrated Development Plan 2017-2022
52
Local Government & Community Development Facilitation
Service delivery is the cornerstone for the human settlement and community development. Institutional capacity building,
stakeholder mobilization and coordination form the most critical part towards municipal service delivery. In partnership with
municipalities, the programme will yield synergies in the following areas:
Local government institutional capacity building.
Development planning.
Programme management.
The programme will implement the Local Area Planning (LAP) as a participatory planning approach that empowers the
community to participate meaningfully in development. Local community plans reflect local assets, resources and priority
needs. The plans serves as a tool for resource and stakeholder mobilization, and create conductive environment for
integration of various government programmes and assisting municipalities and communities to access the available
programmes and funding. In order to achieve this, the programme will bring the following competencies:
Community mobilization and empowerment to take ownership of local and sustainable development.
Community conflict resolution.
Meaningful community participation in local development strategies.
Key Issues and Threats
Land degradation
Land use in the Pixley ka Seme currently consists of sheep farming, some ostrich farming, game farming (that is currently on
the increase), as well as crops farming that include Lucerne, onions, garlic etc. Mining and development activities are likely to
expand in the future.
One of the major threats to biodiversity in the Pixley ka Seme is the long-term overgrazing by small livestock. This vast and
open, seme arid rangeland covers a large part of South Africa and is impressively adapted to its climatic extremes. Evidence
of degradation in these parts of the Pixley ka Seme is clearly visible, mainly as a result of environmental (low and erratic
rainfall) and anthropogenic factors (poor management practices).
The degradation is characterized by large bare and denuded areas and it seems these areas will not recover by natural
succession processes alone. Some sort of active intervention has therefore inevitably become necessary in order to avoid
aridification and possibly also desertification.
Only 5% terrestrial ecosystems in South Africa are critically endangered, while 44% of river ecosystems are critically
endangered. These river courses together with the riparian zones have an important biodiversity function as well as an
economic value in the Pixley ka Seme region. These denser structures of vegetation are high in productivity and are extremely
important refuges for many animal species. The riparian zones are also very important to stock farmers as it provides grazing,
especially during dryer seasons.
The flagship species for this habitat is the Riverine Rabbit (Bunolagus monticularis), which is Critically Endangered. Today the
population size is estimated to be just a view hundred animals. At present, none of the Riverine Rabbit habitat is protected
within a provincial nature reserve or national park and the species only occurs on private farmland. In response to the rapidly
declining populations, landowners in the Pixley ka Seme region have established Riverin Rabbit conservancies covering an
area of approximately 350 000 ha of private farmland.

Integrated Development Plan 2017-2022
53
Unrehabilitated Asbestos Mines
In the Northern Cape asbestos is still perceived as an important issue because of the many unrehabilitated mine dumps that
still have the potential to pollute the environment, and therefore cause asbestosis or mesothelioma. The public still has access
to some of these dumps, and some individuals recover the asbestos for resale as there is apparently still a market for it. In
Prieska about 5 new cases (out of a population of about 15 000) of mesothelioma are diagnosed annually although the mines
in the area have been closed since 1979.
Need for Urban Renewal of Apartheid-Era Townships
National Routes (or the main route through a town) was used in the previous regime to severe the townships from the white
suburbs. There is a great lack of integration still today in many of the Pixley ka Seme towns. Additional to this, some areas
still have bucket system toilets or French drains, which prove a risk for the ground water source of the towns. Refuse and
Landfill sites close to these areas also prove a human health risk. Lack of storm water systems means the occasional rain
storms causes heavy erosion and flash floods. Most of these areas also do not have trees and open space and therefore the
quality of life is perceived as low.
Key Solutions
Funding
Although some funding such as MIG is available to the municipalities and departments, it is crucial to source more funding to
speed up the progress of sustainable development for human settlements in the district. Training is also required to improve
the business plans which are being put forward to large funding agencies. Identification of specific projects are crucial.
Participation and Communication
In an area with little resources and people, co-operative governance and community participation in projects are crucial. As
local municipalities does not have much capacity, they are largely dependent upon the district municipality and State
departments. These relationships must be built and strengthened.
Training and Education
Municipal and government officials can benefit enormously from training in their respective fields, and specifically regarding
the environment. Environmental Awareness Training to land owners (farmers) and communities also become crucial for the
sustainable management of the land.
Strategies / Initiatives / Projects
Environmental Education of Farmers and Communities
Compliance and Enforcement of Illegal Water Uses
Conservation Mapping and Initiatives
Environmentally Responsible Development
Urban Renewal Programmes
3.10.4 Human Settlement Plan
Background:
According to Section 9(1) of the National Housing Act (No. 107 of 1997), it is stipulated that each municipality has to, as part
of the municipality’s procedure of Integrated Development Planning (IDP) put in place all reasonable and required steps in

Integrated Development Plan 2017-2022
54
ensuring that the residents within its area of jurisdiction have access to adequate housing on a progressive basis. This can be
attained by:
Setting housing delivery goals
Identifying suitable land for housing development and planning; and
Facilitating, initiating and co- coordinating housing development in its area of jurisdiction.
This all-inclusive Municipal Human Settlement Sector Plan (MHSP) for Pixley ka Seme is founded on the contents of
Sustainable Human Settlement Resource Book 2008, Northern Cape Strategy and Programme for the Upgrading of Informal
Settlements and the National Housing Code of 2009. The contents, though, have been modified as to make provision for the
local conditions prevailing within the Northern Cape Province, Pixley ka Seme District Municipality and its constituent local
municipalities.
The comprehensive MHSP is divided into the following phases:
Phase 1: Policy, Legislation, Functions, Roles and Developmental Considerations
Phase 2 Data Analysis
Phase 3 Housing Strategy Formulation
Phase 4: Housing Implementation Plan
Phase 5: IDP Integration
Phase 6: Formulation of Performance Indicators
Phase 7: Human Settlements Sector Plan Approval
The IDP integration of the MSHP is enclosed in a shortened Housing chapter for every constituent local municipality’s MHSP
and the Pixley ka Seme District Municipality. The Pixley ka Seme District Municipality MHSP comprises of an all-inclusive report
for district and local municipality’s.
Capacity building at the Local Municipalities is a big challenge, with the main social problems that include poverty, illiteracy
and unemployment the Local Municipalities. This all means that the District Municipality has to do a lot of work on their behalf.
The distances between settlements make it difficult for the District Municipality to be effective and efficient.
The District has been accredited at level 1 and 2 according to the National Accreditation Framework and does housing
functions for Local Municipalities at this level.
In reviewing the Municipal Human Settlements Sector Plan for the District Municipality, the current requirements of Municipal
Human Settlements Plan Guidelines of the National Department has been followed and aligned with:
The provisions of the National Housing code, 2009 Part 3 Volume 3: Integrated Development Plans.
Section 25 & 26 of the Municipal systems Act 2000 (Act No. 32 of 2000), whereby all Municipalities are required to compile
Integrated Development Plans (IDPs).
The Housing Act, 1997 (Act No. 107 if 1997) (“the Housing Act”) states in Section 9 (1) (f) that “Every Municipality must,
as part of the Municipality’s process of integrated development planning, take all reasonable and necessary steps within
the framework of National and Provincial housing legislation and policy to initiate, plan, co-ordinate, facilitate, promote
and enable appropriate housing development in its area of jurisdiction”.
Integrated Development Plan 2017-2022
55
Objectives of the plan:
The objectives of the District MHSP are aligned with the District SDF and the SDFs of the Local Municipalities and include the
following:
To ensure that human settlements planning reflects a broad range of community level needs and concerns and is based
on as credible data as possible;
To fast track availability and affordability of appropriately situated land for housing development
To remove administrative blockages that prevent speedy housing development
To ensure consumer education/understanding in all housing developments
Utilizing housing as an instrument for the development of suitable settlements, in support of social structuring
To improve financial capacity to undertake housing development projects/programmes
To enhance coherency in development and planning
To align the municipality’s plans with national and provincial human settlements plans and priorities and to inform
provincial multi-year and annual performance plans and budgets;
To undertake human settlements planning as part of a broader, integrated and proactive urban management strategy of
the municipality;
To provide detailed human settlements project plans within a clear implementation and funding strategy;
To analyze an institutional structure and unpack clear roles and responsibilities of relevant stakeholders critical to
achieving integrated human settlements planning;
Integrating social, economic, institutional and physical aspects of land development;
Integrating land development in rural and urban areas;
Promoting availability of residential and employment opportunities in close proximity to each other;
Optimising the use of existing resources
To provide a clear monitoring and evaluation framework for the human settlements function;
To assess risk pertaining to housing delivery; and
To investigate the Municipality’s plans for infrastructure services that will compliment housing development
To analyse Municipal communication plan in relation to housing delivery
Structure of the MHSP:
The MHSP is organized into the following main sections:
A: The first section: is contextual and it unpacks the legislative and policy context for human settlements. It also deals with
the particular planning parameters of the municipality and how alignment of planning occurs. This section assesses the
housing demand for the local Municipalities within PkS district. It contextualizes Human Settlements Delivery within the
District. This Section has included a brief description of alignment with various levels of government planning processes,
consultation process followed and assessment of Housing Demand.
B: The second section: Deals with the strategic response of the Municipality to the context in the first section. It outlines the
municipality’s vision and objectives for Human Settlement delivery and the strategies for achievement of such. This includes
the District Municipal vision, objectives, strategies, informal settlements & backyarders plan, housing subsidy instruments to
be accessed, projects & available funds.
Integrated Development Plan 2017-2022
56
C: The third section: This section as required by Municipal Human Settlements Sector Plan guidelines is only applicable to
municipalities that have received Level 1 or 2 Accreditation in order to ensure compliance with Section 9 of the National
Housing Act, whereby the MEC is required to approve projects in an instance where the municipality acts as the developer.
D: The fourth section: provides detailed project plans from Local Municipalities and addresses operational governance and
financial management issues. It detailed project planning and therefore includes projects plans, access to land, procurement
process, risk assessment, communication plan, performance monitoring, budget allocations and costing and their cash flow.
Section 1: Contextualizing Human Settlements Delivery within the Municipality:
Legislative and Policy Environment
The National Government has provided enabling policies and legislation through which municipalities at different levels should
ensure equitable access to various types of housing in varying and peculiar environment. It is important therefore for PKSDM
to translate this into tangible results on the ground, taking into account the realities as they exist within this District
Municipality. The Municipality will therefore have to contextualize the delivery of housing as it pertains to PKS area of
jurisdiction
This section comprises of legal context for housing provision in South Africa. The section considers relevant legislation and
policy from the national, provincial and local contexts and how they guide housing delivery and are applicable in Pixley ka
Seme District Municipality.
In developing this MHSP the District is informed by and aligned to the relevant legislative and policy imperatives, namely:
Accessing housing demand
The following sub-section of the integrated MHSP describes and quantifies the demand for housing under each local
municipality. The quantity of housing demand takes into consideration the housing backlog figures and population growth.
The demand for housing is classified under different categories. The following tables indicate these categories and the
backlogs in each local municipality:
Municipality Town Houses
Emthanjeni
De Aar 1 582
Hanover 682
Britstown 253
Total 2 517
Kareeberg
Carnarvon 350
Van Wyksvlei 90
Vosburg 65
Total 505
Thembelihle Hopetown 1 202
Strydenburg 351
Total 1 553
Siyathemba
Marydale 607
Prieska 1 524
Niekerkshoop 401
Total 2 532
Renosterberg Petrusville 182

Integrated Development Plan 2017-2022
57
Municipality Town Houses
Phillipstown 105
Vanderkloof 50
Total 337
Ubuntu
Victoria - West 182
Richmond 468
Loxton 181
Total 831
Siyancuma
Campbel 448
Douglas 2 578
Griekwastad 457
Total 3 483
Umsobomvu
Colesberg 1 946
Norvalspont 125
Noupoort 251
Total 2 322
District Total 14 080
Housing Backlogs/Needs as at March 2015 per Local Municipality
The total housing backlog for the District, excluding Emthanjeni is 11 563.
All local municipalities are composed of various residential components varying from formal housing units to informal dwelling
units as indicated in the table above. Within the District, 82, 8% of households live in formal housing, 10,8% in informal housing
and only 2% in traditional houses. Households in the whole PKSDM is about 49 193 in respect to the Census 2011, where the
average household size is about 3.70, female headed households is about 36.90%, formal dwellings at 86.30% and the housing
owned is at 52.00% according to the IDP of 2016.
The programmes mentioned in the tables in this section are founded on the nature and focus of each programme. Its
application within the study area depends on negotiation and choice of all stakeholders involved in housing development.
The same applies to the selection of the quantum of subsidies to be allocated to each of the listed settlements.
The backlog or housing need would be at 14 262 in 2020 if no housing opportunities are given to Pixley Ka Seme DM. This
figure excludes Emthanjeni LM’s housing need. Pixley Ka Seme DM must commission a feasibility study to have a more
scientific research done on the different housing typologies needed per town and/or per ward.
Municipality Housing backlog
Total ISUP/IRPD FLISP CRU
Kareeberg 385 40 80 505
Thembelihle 1 443 90 20 1 553
Siyathemba 2 380 120 32 2 532
Siyancuma 3 233 210 40 3 483
Ubuntu 1 345 40 10 1 395
Renosterberg 297 30 10 337
Umsobomvu 2 143 150 30 2 323
Total 12 128
Various Typologies in Housing Backlog per Municipality

Integrated Development Plan 2017-2022
58
Informal Settlements and Backyarders’ Plan:
The Northern Cape Strategy and Programme for the Upgrading of Informal Settlements of July 2014 states:
“The Northern Cape Department of Human Settlements embarked on a process to develop a Strategy and Programme for the
Upgrading of Informal Settlements in the Northern Cape.
This Strategy must:
GUIDE the upgrading of informal settlements in the Province.
ENHANCE Housing Sector Planning Processes and promote sector alignment.
AVAIL a Plan of Action to Human Settlement Practitioners to be implemented together with Municipalities and Sector
Partners.
PROMOTE participatory planning during the entire project lifecycle process of developing sustainable livelihoods.”
Graph 7.: Number of Households Living in Informal Structures
Source: NC Strategy and Programme for the Upgrading of Informal Settlements – 2014
Current running Human Settlements Projects in the District
Municipality Town Progress Challenges
Umsobomvu
Colesberg Ouboks ±-2 220 houses 1 126 complete
Contractor has abandoned the site Houses build, but not completed 17 of the 1 026 were vandalized and were not
handed over
Noupoort Noupoort 100 49 rectification
Project is on standstill as contractor is experiencing financial challenges
Renosterberg
Philipstown Building 341 houses 98 completed and occupied
-
Keurtjieskloof 50 house build, completed
and occupied -
Siyathemba
Prieska Building 365 houses 100% completed
-
Niekerkshoop 54 houses -
Marydale 55 houses -
Kareeberg
Carnarvon 81 Houses 81 completed and occupied
-
Vanwyksvlei 130 (50) houses 80 houses complete and
occupied
-
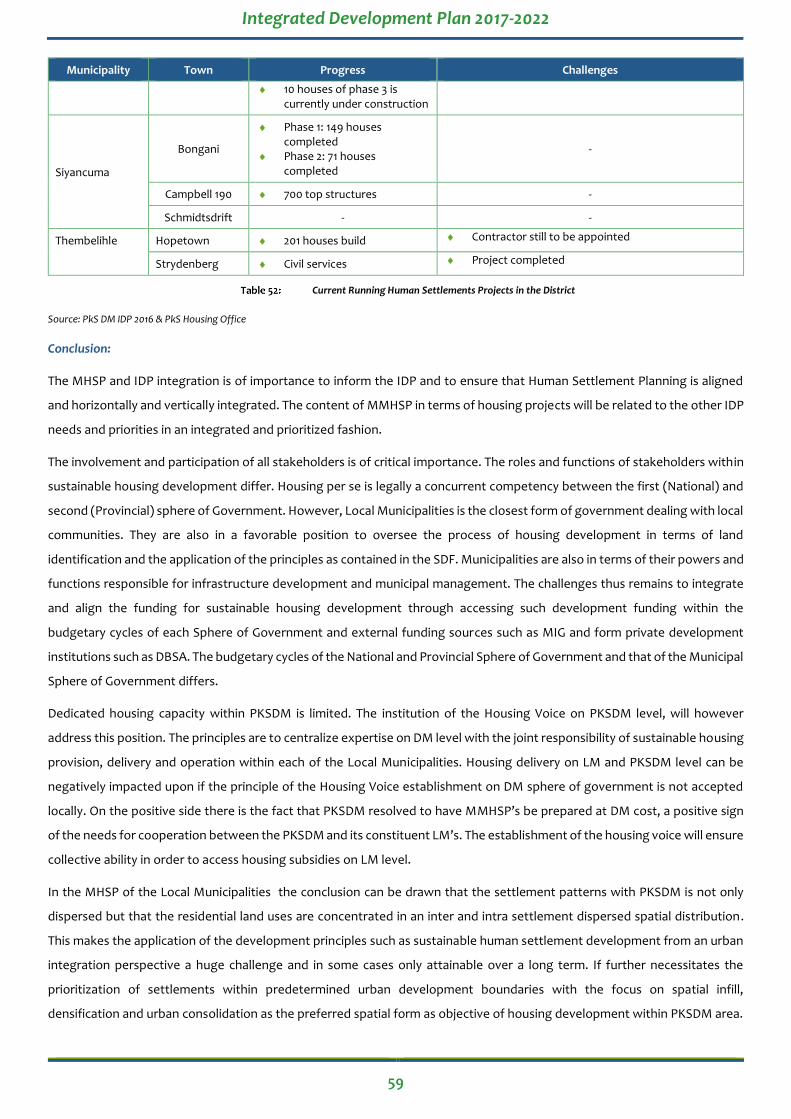
Integrated Development Plan 2017-2022
59
Municipality Town Progress Challenges
10 houses of phase 3 is currently under construction
Siyancuma
Bongani
Phase 1: 149 houses completed
Phase 2: 71 houses completed
-
Campbell 190 700 top structures -
Schmidtsdrift - -
Thembelihle Hopetown 201 houses build Contractor still to be appointed
Strydenberg Civil services Project completed
Current Running Human Settlements Projects in the District
Source: PkS DM IDP 2016 & PkS Housing Office
Conclusion:
The MHSP and IDP integration is of importance to inform the IDP and to ensure that Human Settlement Planning is aligned
and horizontally and vertically integrated. The content of MMHSP in terms of housing projects will be related to the other IDP
needs and priorities in an integrated and prioritized fashion.
The involvement and participation of all stakeholders is of critical importance. The roles and functions of stakeholders within
sustainable housing development differ. Housing per se is legally a concurrent competency between the first (National) and
second (Provincial) sphere of Government. However, Local Municipalities is the closest form of government dealing with local
communities. They are also in a favorable position to oversee the process of housing development in terms of land
identification and the application of the principles as contained in the SDF. Municipalities are also in terms of their powers and
functions responsible for infrastructure development and municipal management. The challenges thus remains to integrate
and align the funding for sustainable housing development through accessing such development funding within the
budgetary cycles of each Sphere of Government and external funding sources such as MIG and form private development
institutions such as DBSA. The budgetary cycles of the National and Provincial Sphere of Government and that of the Municipal
Sphere of Government differs.
Dedicated housing capacity within PKSDM is limited. The institution of the Housing Voice on PKSDM level, will however
address this position. The principles are to centralize expertise on DM level with the joint responsibility of sustainable housing
provision, delivery and operation within each of the Local Municipalities. Housing delivery on LM and PKSDM level can be
negatively impacted upon if the principle of the Housing Voice establishment on DM sphere of government is not accepted
locally. On the positive side there is the fact that PKSDM resolved to have MMHSP’s be prepared at DM cost, a positive sign
of the needs for cooperation between the PKSDM and its constituent LM’s. The establishment of the housing voice will ensure
collective ability in order to access housing subsidies on LM level.
In the MHSP of the Local Municipalities the conclusion can be drawn that the settlement patterns with PKSDM is not only
dispersed but that the residential land uses are concentrated in an inter and intra settlement dispersed spatial distribution.
This makes the application of the development principles such as sustainable human settlement development from an urban
integration perspective a huge challenge and in some cases only attainable over a long term. If further necessitates the
prioritization of settlements within predetermined urban development boundaries with the focus on spatial infill,
densification and urban consolidation as the preferred spatial form as objective of housing development within PKSDM area.
Integrated Development Plan 2017-2022
60
Therefore it is necessary for Municipalities to take the leading role on negotiating the location of housing supply to facilitate
concentrated spatial restructuring and development. Furthermore, they must also facilitate an improved match between the
demand and supply of different state-assisted national housing programmes. This approach envisages that municipalities will
play a significantly and increased role in the housing process. This will assist to build linkages between housing delivery, spatial
planning, socio-economic development, basic infrastructure provision and improved transportation system. It will thus
support the integration of housing into the IDP’s, ensuring more effective management, budgetary and delivery coherence.

Integrated Development Plan 2017-2022
61
C H A P T E R 4 : D E V E L O P M E N T S T R A T E G I E S
4 . 1 S t r a t e g i c V i s i o n o f t h e M u n i c i p a l i t y
The strategic vision of the Municipality is built around the strategic objectives. A clear linkage between these objectives, the
IDP, the budget, all budgetary documentation, as well as performance tools are maintained throughout:
Strategic objective Goal Outcome Municipal Division mSCOA Function
Compliance with the tenets of good governance as prescribed by legislation and best practice
Good clean governance Good clean governance
Community Liaison Communication Special
Programmes Municipal Manager Support Services
Executive and Council
Compliant support services
Compliant support services
Support Services Performance
management
Finance and Administration
Administer finances in a sustainable manner and strive to comply with legislative requirements to achieve a favorable audit outcome
Viable and compliant financial management
Clean Audit
Viable and compliant financial management
Clean Audit
Finance Budget Control Supply Chain
Management Asset
Management Salaries
Finance and Administration
Monitor and support local municipalities to enhance service delivery
Compliant support services
Compliant support services
Support Services Finance and
Administration
Enhanced support to local municipalities
Enhanced support to local municipalities
Infrastructure Development
Housing
Planning and Development
Promote economic growth in the district
Enhanced economic growth
Enhanced economic growth
LED Planning and Development
Guide local municipalities in the development of their IDP’s and in spatial development
Improved integrated development planning
Improved integrated development planning
Spatial Planning Planning and Development
To provide a professional, people-centered human resources and administrative service to citizens, staff and Council
Compliant HR Services Compliant HR Services Human Resources Legal Services &
Labour Division
Finance and Administration
To provide an independent and objective internal audit assurance and consulting service to add value and to improve the administrative operations of all the municipalities in the district through an approach that is systematic and disciplined
Clean audit Clean audit Internal Audit Internal Audit

Integrated Development Plan 2017-2022
62
Strategic objective Goal Outcome Municipal Division mSCOA Function
To provide disaster management services to the citizens
Disaster readiness Disaster readiness Disaster Management Community and Social
Services
To provide municipal health services to improve the quality of life of the citizens
Healthy environment Healthy environment Municipal Health
Services Health
Strategic Vision of the Municipality
4 . 2 N a t i o n a l , P r o v i n c i a l a n d M u n i c i p a l i t y ’ s S t r a t e g i c A l i g n m e n t
The table below indicates the Municipality’s alignment with national government:
National KPA National Development Plan
Outcomes Municipality Strategic Objectives
Good Governance and Public Participation
Chapter 13: Building a capable and developmental state
Compliance with the tenets of good governance as prescribed by legislation and best
To provide an independent and objective internal audit assurance and consulting service to add value and to improve the administrative operations of all the municipalities in the district through an approach that is systematic and disciplined
Administer finances in a sustainable manner and strive to comply with legislative requirements to achieve a favorable audit outcome
To provide a professional, people-centered human resources and administrative service to citizens, staff and Council
Local Economic Development
Chapter 4: Economic infrastructure
Promote economic growth in the district Monitor and support local municipalities to enhance service delivery
Chapter 5: Environmental sustainability and resilience
To provide municipal health services to improve the quality of life of the citizens
Local Economic Development
Chapter 3: Economy and employment
Promote economic growth in the district
Chapter 6: Inclusive rural economy
Chapter 9: Improving education, training and innovation
Promote economic growth in the district
Local Economic Development
Chapter 8: Transforming human settlements
Monitor and support local municipalities to enhance service delivery
Basic Service Delivery
Chapter 9: Improving education, training and innovation
Promote economic growth in the district
Chapter 10: Health care for all n/a
Chapter 11: Social protection Promote economic growth in the district Compliance with the tenets of good governance as prescribed by legislation
and best
Municipal Transformation and Institutional Development
Chapter 14: Fighting corruption
Compliance with the tenets of good governance as prescribed by legislation and best
Chapter 15: Nation building and social cohesion
Promote economic growth in the district Compliance with the tenets of good governance as prescribed by legislation
and best
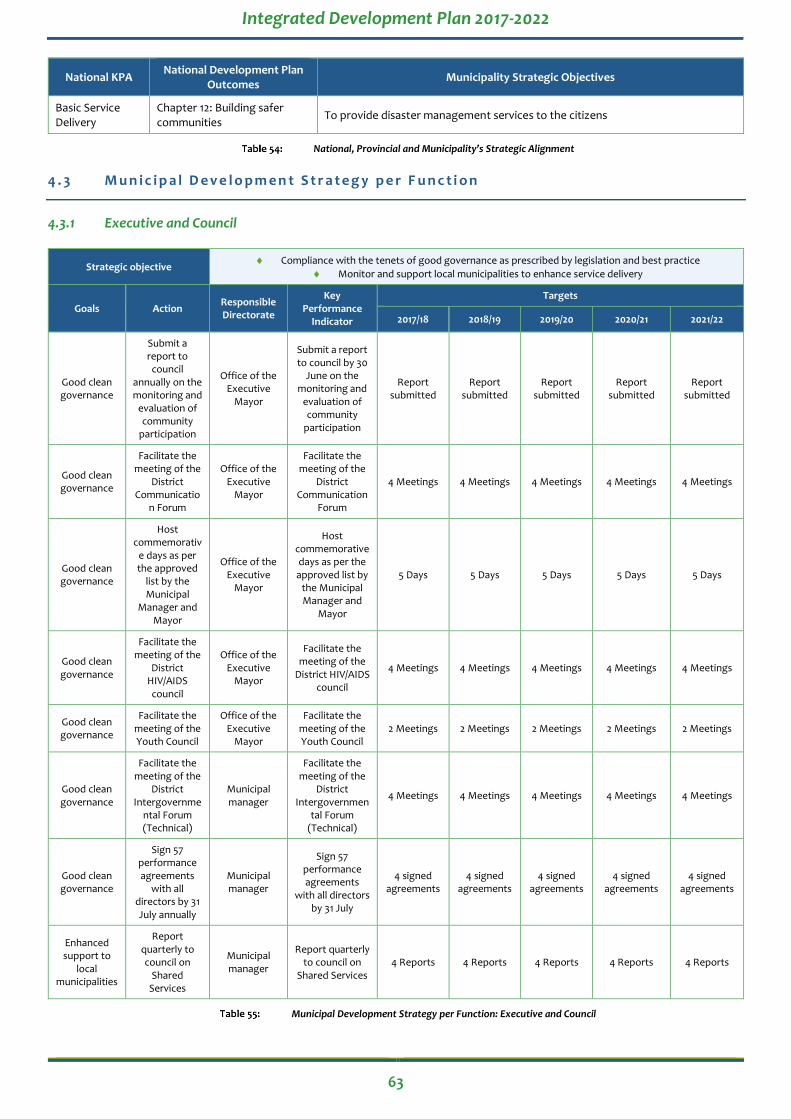
Integrated Development Plan 2017-2022
63
National KPA National Development Plan
Outcomes Municipality Strategic Objectives
Basic Service Delivery
Chapter 12: Building safer communities
To provide disaster management services to the citizens
National, Provincial and Municipality’s Strategic Alignment
4 . 3 M u n i c i p a l D e v e l o p m e n t S t r a t e g y p e r F u n c t i o n
4.3.1 Executive and Council
Strategic objective Compliance with the tenets of good governance as prescribed by legislation and best practice
Monitor and support local municipalities to enhance service delivery
Goals Action Responsible Directorate
Key Performance
Indicator
Targets
2017/18 2018/19 2019/20 2020/21 2021/22
Good clean governance
Submit a report to council
annually on the monitoring and
evaluation of community
participation
Office of the Executive
Mayor
Submit a report to council by 30
June on the monitoring and
evaluation of community
participation
Report submitted
Report submitted
Report submitted
Report submitted
Report submitted
Good clean governance
Facilitate the meeting of the
District Communicatio
n Forum
Office of the Executive
Mayor
Facilitate the meeting of the
District Communication
Forum
4 Meetings 4 Meetings 4 Meetings 4 Meetings 4 Meetings
Good clean governance
Host commemorativ
e days as per the approved
list by the Municipal
Manager and Mayor
Office of the Executive
Mayor
Host commemorative days as per the approved list by
the Municipal Manager and
Mayor
5 Days 5 Days 5 Days 5 Days 5 Days
Good clean governance
Facilitate the meeting of the
District HIV/AIDS council
Office of the Executive
Mayor
Facilitate the meeting of the
District HIV/AIDS council
4 Meetings 4 Meetings 4 Meetings 4 Meetings 4 Meetings
Good clean governance
Facilitate the meeting of the Youth Council
Office of the Executive
Mayor
Facilitate the meeting of the Youth Council
2 Meetings 2 Meetings 2 Meetings 2 Meetings 2 Meetings
Good clean governance
Facilitate the meeting of the
District Intergovernme
ntal Forum (Technical)
Municipal manager
Facilitate the meeting of the
District Intergovernmen
tal Forum (Technical)
4 Meetings 4 Meetings 4 Meetings 4 Meetings 4 Meetings
Good clean governance
Sign 57 performance agreements
with all directors by 31 July annually
Municipal manager
Sign 57 performance agreements
with all directors by 31 July
4 signed agreements
4 signed agreements
4 signed agreements
4 signed agreements
4 signed agreements
Enhanced support to
local municipalities
Report quarterly to council on
Shared Services
Municipal manager
Report quarterly to council on
Shared Services 4 Reports 4 Reports 4 Reports 4 Reports 4 Reports
Municipal Development Strategy per Function: Executive and Council

Integrated Development Plan 2017-2022
64
4.3.2 Finance and Administration
Strategic objective
To provide a professional, people-centered human resources and administrative service to citizens, staff and Council
Compliance with the tenets of good governance as prescribed by legislation and best practice
Monitor and support local municipalities to enhance service delivery
Administer finances in a sustainable manner and strive to comply with legislative requirements to achieve a favorable audit outcome
Goals Action Responsible Directorate
Key Performance
Indicator
Targets
2017/18 2018/19 2019/20 2020/21 2021/22
Compliant HR Services
Review the Study Bursary
policy to include
unemployed people of the district to get
the critical skills
Corporate Services
Review the Study Bursary
policy to include unemployed people of the district to get
the critical skills and submit to Council by 30
June 2019
n/a
Reviewed Bursary policy
submitted to Council
n/a n/a n/a
Compliant HR Services
Spent 1% of personnel budget on
training
Corporate Services
Spent 1% of personnel budget on
training by 30 June (Actual total training expenditure
divided by total personnel budget)
1% of personnel budget on
training
1% of personnel budget on
training
1% of personnel budget on
training
1% of personnel budget on
training
1% of personnel budget on
training
Compliant HR Services
Submit a business
proposal to LGSETA for
discretionary grant to avail funds to train
employees and unemployed
Corporate Services
Submit a business
proposal to LGSETA for
discretionary grant to avail funds to train
employees and unemployed by 31 March 2018
Business proposal
submitted to LGSETA
n/a n/a n/a n/a
Compliant HR Services
Implement the WPSP to train
officials
Corporate Services
Implement the WPSP to train officials (Total
number of officials that
received training as was identified
in the WPSP/total number of
officials that were identified for training in
the WPSP)
90% of Officials as
identified in WPSP
received training
90% of Officials as
identified in WPSP
received training
90% of Officials as
identified in WPSP
received training
90% of Officials as
identified in WPSP
received training
90% of Officials as
identified in WPSP
received training
Compliant HR Services
Develop a policy to
implement a system of
understudy within the
Municipality
Corporate Services
Develop a policy to implement a
system of understudy within the
Municipality by 31 December
2019
n/a n/a 1 n/a n/a
Compliant HR Services
Review the organizational
structure of the district
Municipality
Corporate Services
Review the organizational
structure of the district
Municipality and submit to
n/a n/a n/a 1 n/a
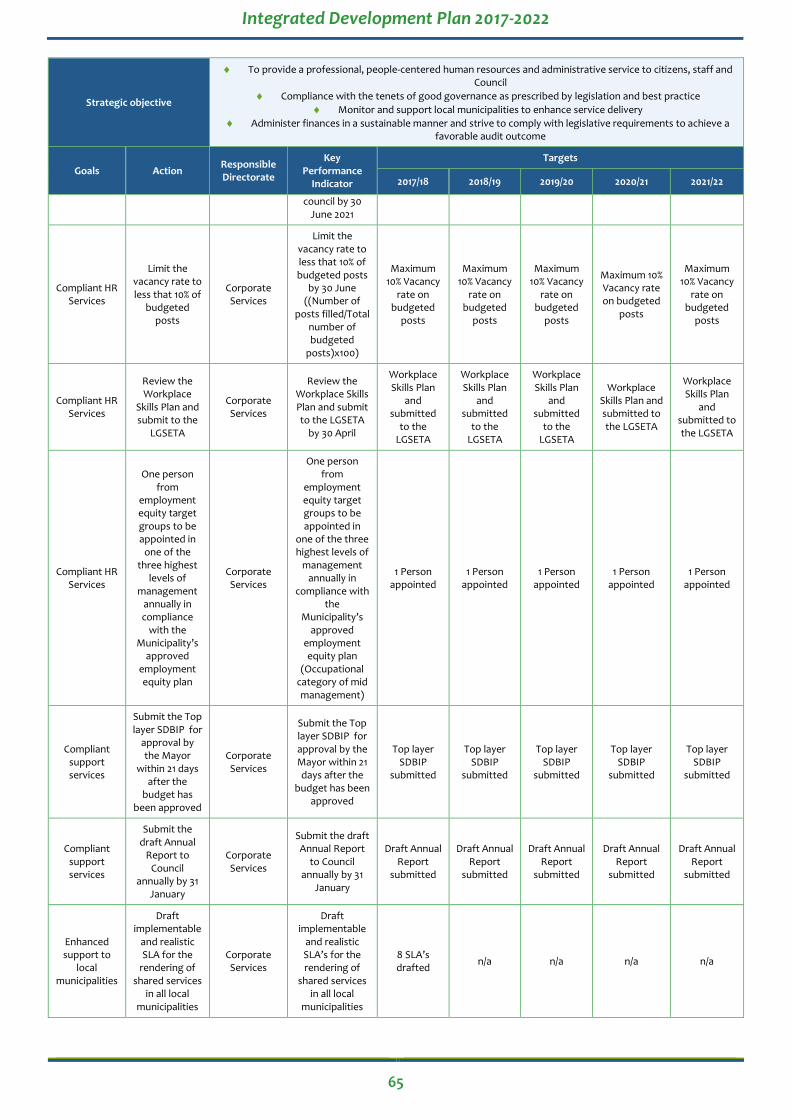
Integrated Development Plan 2017-2022
65
Strategic objective
To provide a professional, people-centered human resources and administrative service to citizens, staff and Council
Compliance with the tenets of good governance as prescribed by legislation and best practice
Monitor and support local municipalities to enhance service delivery
Administer finances in a sustainable manner and strive to comply with legislative requirements to achieve a favorable audit outcome
Goals Action Responsible Directorate
Key Performance
Indicator
Targets
2017/18 2018/19 2019/20 2020/21 2021/22
council by 30 June 2021
Compliant HR Services
Limit the vacancy rate to less that 10% of
budgeted posts
Corporate Services
Limit the vacancy rate to less that 10% of budgeted posts
by 30 June ((Number of
posts filled/Total number of budgeted
posts)x100)
Maximum 10% Vacancy
rate on budgeted
posts
Maximum 10% Vacancy
rate on budgeted
posts
Maximum 10% Vacancy
rate on budgeted
posts
Maximum 10% Vacancy rate on budgeted
posts
Maximum 10% Vacancy
rate on budgeted
posts
Compliant HR Services
Review the Workplace
Skills Plan and submit to the
LGSETA
Corporate Services
Review the Workplace Skills Plan and submit to the LGSETA
by 30 April
Workplace Skills Plan
and submitted
to the LGSETA
Workplace Skills Plan
and submitted
to the LGSETA
Workplace Skills Plan
and submitted
to the LGSETA
Workplace Skills Plan and submitted to the LGSETA
Workplace Skills Plan
and submitted to the LGSETA
Compliant HR Services
One person from
employment equity target groups to be appointed in
one of the three highest
levels of management
annually in compliance
with the Municipality’s
approved employment equity plan
Corporate Services
One person from
employment equity target groups to be appointed in
one of the three highest levels of
management annually in
compliance with the
Municipality’s approved
employment equity plan
(Occupational category of mid management)
1 Person appointed
1 Person appointed
1 Person appointed
1 Person appointed
1 Person appointed
Compliant support services
Submit the Top layer SDBIP for
approval by the Mayor
within 21 days after the
budget has been approved
Corporate Services
Submit the Top layer SDBIP for approval by the Mayor within 21 days after the
budget has been approved
Top layer SDBIP
submitted
Top layer SDBIP
submitted
Top layer SDBIP
submitted
Top layer SDBIP
submitted
Top layer SDBIP
submitted
Compliant support services
Submit the draft Annual
Report to Council
annually by 31 January
Corporate Services
Submit the draft Annual Report
to Council annually by 31
January
Draft Annual Report
submitted
Draft Annual Report
submitted
Draft Annual Report
submitted
Draft Annual Report
submitted
Draft Annual Report
submitted
Enhanced support to
local municipalities
Draft implementable
and realistic SLA for the
rendering of shared services
in all local municipalities
Corporate Services
Draft implementable
and realistic SLA’s for the rendering of
shared services in all local
municipalities
8 SLA’s drafted
n/a n/a n/a n/a

Integrated Development Plan 2017-2022
66
Strategic objective
To provide a professional, people-centered human resources and administrative service to citizens, staff and Council
Compliance with the tenets of good governance as prescribed by legislation and best practice
Monitor and support local municipalities to enhance service delivery
Administer finances in a sustainable manner and strive to comply with legislative requirements to achieve a favorable audit outcome
Goals Action Responsible Directorate
Key Performance
Indicator
Targets
2017/18 2018/19 2019/20 2020/21 2021/22
Clean Audit
Compile and approve an
Audit Action Plan annually
to address the issues raised by
the AG
Finance
Compile and approve an
Audit Action Plan annually by
31 January to address the
issues raised by the AG
Approved Audit Action
Plan
Approved Audit Action
Plan
Approved Audit Action
Plan
Approved Audit Action
Plan
Approved Audit Action
Plan
Viable and compliant financial
management
Report quarterly to council on
meetings with and
correspond-dence to
defaulting municipalities
on debt relating to
services rendered
Finance
Report quarterly to council on
meetings with and
correspondence to defaulting municipalities
on debt relating to services rendered
4 Reports 4 Reports 4 Reports 4 Reports 4 Reports
Viable and compliant financial
management
Prepare and submit the
draft budget to Council by 31
March annually
Finance
Prepare and submit the draft
budget to Council by 31
March annually
Draft Budget
submitted
Draft Budget
submitted
Draft Budget
submitted
Draft Budget submitted
Draft Budget submitted
Viable and compliant financial
management
Prepare and submit the
final budget to Council by 31 May annually
Finance
Prepare and submit the final
budget to Council by 31 May annually
Final Budget submitted
Final Budget submitted
Final Budget submitted
Final Budget submitted
Final Budget submitted
Viable and compliant financial
management
Prepare and submit the
adjustments budget to
Council by the 28 February
annually
Finance
Prepare and submit the
adjustments budget to
Council by the 28 February
annually
Adjustments Budget
submitted
Adjustments Budget
submitted
Adjustments Budget
submitted
Adjustments Budget
submitted
Adjustments Budget
submitted
Viable and compliant financial
management
Submit the annual
financial statements to the Auditor-
General by 31 August
annually
Finance
Submit the annual financial statements to the Auditor-
General by 31 August annually
Annual Financial
Statements submitted
Annual Financial
Statements submitted
Annual Financial
Statements submitted
Annual Financial
Statements submitted
Annual Financial
Statements submitted
Viable and compliant financial
management
Co-ordinate the District
MM/CFO forums
Finance Co-ordinate the District MM/CFO
forums 2 Meetings 2 Meetings 2 Meetings 2 Meetings 2 Meetings
Viable and compliant financial
management
Financial viability
measured in terms of the
Municipality's ability to meet
it's service debt
obligations
Finance
Financial viability
measured in terms of the
Municipality's ability to meet
it's service debt obligations by
30 June ((Short Term Borrowing
+ Bank
45% Debt coverage
45% Debt coverage
45% Debt coverage
45% Debt coverage
45% Debt coverage

Integrated Development Plan 2017-2022
67
Strategic objective
To provide a professional, people-centered human resources and administrative service to citizens, staff and Council
Compliance with the tenets of good governance as prescribed by legislation and best practice
Monitor and support local municipalities to enhance service delivery
Administer finances in a sustainable manner and strive to comply with legislative requirements to achieve a favorable audit outcome
Goals Action Responsible Directorate
Key Performance
Indicator
Targets
2017/18 2018/19 2019/20 2020/21 2021/22
Overdraft + Short Term
Lease + Long Term Borrowing
+ Long Term Lease) / Total
Operating Revenue - Operating
Conditional Grant)
Viable and compliant financial
management
Financial viability
measured in terms of the
available cash to cover fixed
operating expenditure
Finance
Financial viability
measured in terms of the
available cash to cover fixed operating
expenditure by 30 June ((Cash
and Cash Equivalents -
Unspent Conditional
Grants - Overdraft) + Short Term
Investment) / Monthly Fixed
Operational Expenditure
excluding (Depreciation, Amortisation, and Provision for Bad Debts,
Impairment and Loss on Disposal
of Assets))
1 Month to cover fix
operating expenditure
with available
cash
1 Month to cover fix
operating expenditure
with available
cash
1 Month to cover fix
operating expenditure
with available
cash
1 Month to cover fix
operating expenditure
with available cash
1 Month to cover fix
operating expenditure
with available
cash
Municipal Development Strategy per Function: Finance and Administration
4.3.3 Internal Audit
Strategic objective To provide an independent and objective internal audit assurance and consulting service to add value and to
improve the administrative operations of all the municipalities in the district through an approach that is systematic and disciplined
Goals Action Responsible Directorate
Key Performance
Indicator
Targets
2017/18 2018/19 2019/20 2020/21 2021/22
Clean audit
Submit a Quality
Assurance Plan to the Audit Committee
Internal Audit
Submit a Quality Assurance Plan
to the Audit Committee by 30 November
Plan submitted
Plan submitted
Plan submitted
Plan submitted
Plan submitted
Clean audit
Submit quarterly
internal audit reports to the
local municipalities in terms of the
Internal Audit
Submit quarterly internal audit reports to the
local municipalities in
terms of the
12 Reports submitted
12 Reports submitted
12 Reports submitted
12 Reports submitted
12 Reports submitted

Integrated Development Plan 2017-2022
68
Strategic objective To provide an independent and objective internal audit assurance and consulting service to add value and to
improve the administrative operations of all the municipalities in the district through an approach that is systematic and disciplined
Goals Action Responsible Directorate
Key Performance
Indicator
Targets
2017/18 2018/19 2019/20 2020/21 2021/22
Service Level Agreements
Service Level Agreements
Clean audit
Compile the Risk based audit plan
(RBAP) and submit to the
Audit Committee for consideration
Internal Audit
Compile the Risk based audit plan
(RBAP) and submit to the
Audit Committee for
consideration by 30 November
RBAP submitted
RBAP submitted
RBAP submitted
RBAP submitted
RBAP submitted
Clean audit
Compile the Risk based audit plans
(RBAP) for the local
municipalities in terms of the Service Level Agreements
and submit to the local
municipalities
Internal Audit
Compile the Risk based audit
plans (RBAP) for the local
municipalities in terms of the Service Level
Agreements and submit to the
local municipalities by
30 June
3 RBAP’s submitted
3 RBAP’s submitted
3 RBAP’s submitted
3 RBAP’s submitted
3 RBAP’s submitted
Clean audit
Review the 3 year Strategic Audit Plans of
applicable local municipalities and submit to
the Audit Committee
Internal Audit
Review the 3 year Strategic Audit Plans of
applicable local municipalities and submit to
the Audit Committee by
30 June
3 Strategic Audit Plans submitted1
3 Strategic Audit Plans submitted1
3 Strategic Audit Plans submitted1
3 Strategic Audit Plans submitted1
3 Strategic Audit Plans submitted1
Clean audit
Review the 3 year Strategic Audit Plan and submit to the
Audit Committee
Internal Audit
Review the 3 year Strategic Audit Plan and submit to the
Audit Committee by 30 November
Strategic Audit Plan submitted1
Strategic Audit Plan submitted1
Strategic Audit Plan submitted1
Strategic Audit Plan submitted1
Strategic Audit Plan submitted1
Municipal Development Strategy per Function: Internal Audit
4.3.4 Community and Social Services
Strategic objective To provide disaster management services to the citizens
Goals Action Responsible Directorate
Key Performance
Indicator
Targets
2017/18 2018/19 2019/20 2020/21 2021/22
Disaster readiness
Complete institutional
assessment to determine extend of
underfunding for disaster
Management function
Corporate Services
Complete institutional
assessment to determine extend of
underfunding for disaster
Management function and
submit report to council by 30
December 2018
Report submitted
n/a n/a n/a n/a
Disaster readiness
Submit application for
increased funding for
Corporate Services
Submit application for
increased funding for
Application submitted
n/a n/a n/a n/a

Integrated Development Plan 2017-2022
69
Strategic objective To provide disaster management services to the citizens
Goals Action Responsible Directorate
Key Performance
Indicator
Targets
2017/18 2018/19 2019/20 2020/21 2021/22
disaster management to COGHSTA
disaster management to COGHSTA by 31
March 2018
Disaster readiness
Train volunteers ito
Disaster Management
Corporate Services
Train volunteers ito Disaster
Management
1 Training session
1 Training session
1 Training session
1 Training session
1 Training session
Disaster readiness
Conduct a risk analysis on
disaster threats in the
district
Corporate Services
Conduct a risk analysis on
disaster threats in the district and submit report on analysis to
council by 30 June
Report submitted
Report submitted
Report submitted
Report submitted
Report submitted
Disaster readiness
Review the Disaster
Management Plan annually
Corporate Services
Review the Disaster
Management Plan annually and submit to Council by 30
June
Plan reviewed
and submitted
Plan reviewed
and submitted
Plan reviewed
and submitted
Plan reviewed and
submitted
Plan reviewed
and submitted
Municipal Development Strategy per Function: Community and social services
4.3.5 Health
Strategic objective To provide municipal health services to improve the quality of life of the citizens
Goals Action Responsible Directorate
Key Performance
Indicator
Targets
2017/18 2018/19 2019/20 2020/21 2021/22
Healthy environment
Investigate the possibility of
introducing an electronic reporting
system for municipal
health
Corporate Services
Investigate the possibility of
introducing an electronic reporting
system for municipal health
services and submit report
with recommendations to council by
30 June 2018
Report submitted
n/a n/a n/a n/a
Healthy environment
Compile monthly water quality analysis report to local municipalities in terms of the Water quality
monitoring programme
Corporate Services
Compile monthly water quality analysis report to local
municipalities in terms of the
Water quality monitoring programme
96 Reports submitted
96 Reports submitted
96 Reports submitted
96 Reports submitted
96 Reports submitted
Healthy environment
Develop a Municipal
Health Services By-Law
Corporate Services
Develop a Municipal
Health Services By-Law by 30
June 2019
n/a By-Law
published n/a n/a n/a
Healthy environment
Submit quarterly reports to council on
Corporate Services
Submit quarterly reports to council on
municipal health
4 Reports 4 Reports 4 Reports 4 Reports 4 Reports
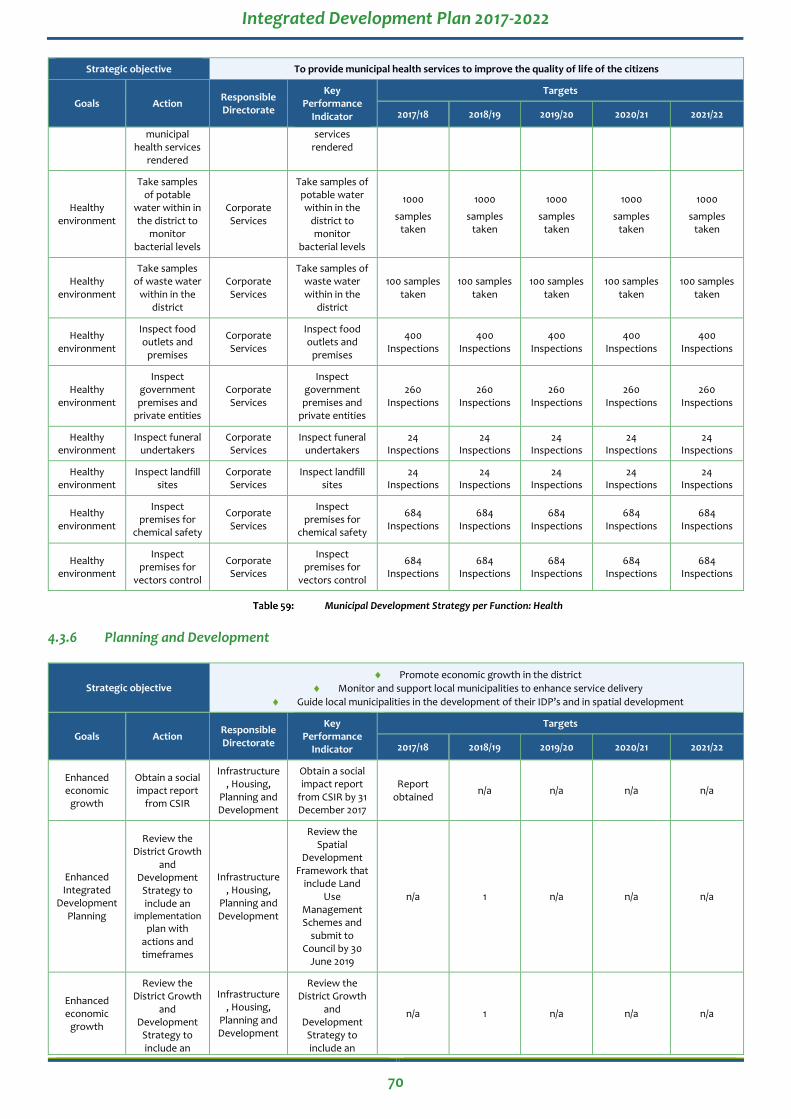
Integrated Development Plan 2017-2022
70
Strategic objective To provide municipal health services to improve the quality of life of the citizens
Goals Action Responsible Directorate
Key Performance
Indicator
Targets
2017/18 2018/19 2019/20 2020/21 2021/22
municipal health services
rendered
services rendered
Healthy environment
Take samples of potable
water within in the district to
monitor bacterial levels
Corporate Services
Take samples of potable water within in the
district to monitor
bacterial levels
1000
samples taken
1000
samples taken
1000
samples taken
1000
samples taken
1000
samples taken
Healthy environment
Take samples of waste water
within in the district
Corporate Services
Take samples of waste water within in the
district
100 samples taken
100 samples taken
100 samples taken
100 samples taken
100 samples taken
Healthy environment
Inspect food outlets and
premises
Corporate Services
Inspect food outlets and
premises
400 Inspections
400 Inspections
400 Inspections
400 Inspections
400 Inspections
Healthy environment
Inspect government premises and
private entities
Corporate Services
Inspect government premises and
private entities
260 Inspections
260 Inspections
260 Inspections
260 Inspections
260 Inspections
Healthy environment
Inspect funeral undertakers
Corporate Services
Inspect funeral undertakers
24 Inspections
24 Inspections
24 Inspections
24 Inspections
24 Inspections
Healthy environment
Inspect landfill sites
Corporate Services
Inspect landfill sites
24 Inspections
24 Inspections
24 Inspections
24 Inspections
24 Inspections
Healthy environment
Inspect premises for
chemical safety
Corporate Services
Inspect premises for
chemical safety
684 Inspections
684 Inspections
684 Inspections
684 Inspections
684 Inspections
Healthy environment
Inspect premises for
vectors control
Corporate Services
Inspect premises for
vectors control
684 Inspections
684 Inspections
684 Inspections
684 Inspections
684 Inspections
Municipal Development Strategy per Function: Health
4.3.6 Planning and Development
Strategic objective Promote economic growth in the district
Monitor and support local municipalities to enhance service delivery
Guide local municipalities in the development of their IDP’s and in spatial development
Goals Action Responsible Directorate
Key Performance
Indicator
Targets
2017/18 2018/19 2019/20 2020/21 2021/22
Enhanced economic
growth
Obtain a social impact report
from CSIR
Infrastructure, Housing,
Planning and Development
Obtain a social impact report
from CSIR by 31 December 2017
Report obtained
n/a n/a n/a n/a
Enhanced Integrated
Development Planning
Review the District Growth
and Development
Strategy to include an
implementation plan with
actions and timeframes
Infrastructure, Housing,
Planning and Development
Review the Spatial
Development Framework that
include Land Use
Management Schemes and
submit to Council by 30
June 2019
n/a 1 n/a n/a n/a
Enhanced economic
growth
Review the District Growth
and Development
Strategy to include an
Infrastructure, Housing,
Planning and Development
Review the District Growth
and Development
Strategy to include an
n/a 1 n/a n/a n/a

Integrated Development Plan 2017-2022
71
Strategic objective Promote economic growth in the district
Monitor and support local municipalities to enhance service delivery
Guide local municipalities in the development of their IDP’s and in spatial development
Goals Action Responsible Directorate
Key Performance
Indicator
Targets
2017/18 2018/19 2019/20 2020/21 2021/22
implementation plan with
actions and timeframes
implementation plan with
actions and timeframes and
submit to Council by 30
June 2019
Enhanced economic
growth
Review the LED strategy to
include an implementation
plan with actions and timeframes
Infrastructure, Housing,
Planning and Development
Review the LED strategy to include an
implementation plan with
actions and timeframes and
submit to Council by 30
June 2018
1 n/a n/a n/a n/a
Enhanced economic
growth
Review the District Growth
and Development
Strategy implementation plan annually
Infrastructure, Housing,
Planning and Development
Review the DGDS
implementation plan annually and submit to council by 30
June
n//a n/a 1 1 1
Enhanced economic
growth
Review the LED
implementation plan annually
Infrastructure, Housing,
Planning and Development
Review the LED implementation
plan annually and submit to council by 30
June
n/a 1 1 1 1
Improved integrated
development planning
Annually compile an IDP framework by 31 December to guide local municipalities
Infrastructure, Housing,
Planning and Development
Annually compile an IDP
framework by 31 December to
guide local municipalities
IDP framework compiled
IDP framework compiled
IDP framework compiled
IDP framework compiled
IDP framework compiled
Improved integrated
development planning
Annually review the IDP
Infrastructure, Housing,
Planning and Development
Annually review the IDP and
submit draft to council by 31
March
Draft IDP submitted
Draft IDP submitted
Draft IDP submitted
Draft IDP submitted
Draft IDP submitted
Enhanced economic
growth
Arrange quarterly LED
forum meeting
Infrastructure, Housing,
Planning and Development
Arrange quarterly LED
forum meeting 4 Meetings 4 Meetings 4 Meetings 4 Meetings 4 Meetings
Enhanced economic
growth
Create job opportunities through the Expanded
Public Works Programme
(EPWP)
Infrastructure, Housing,
Planning and Development
Create job opportunities through the
Expanded Public Works
Programme (EPWP)
55 Opportunities
created
55 Opportunities
created
55 Opportunities
created
55 Opportunities
created
55 Opportunities
created
Enhanced support to
local municipalities
Arrange and convene quarterly
Infrastructure Forum
meetings
Infrastructure, Housing,
Planning and Development
Arrange and convene quarterly
Infrastructure Forum meetings
4 Meetings 4 Meetings 4 Meetings 4 Meetings 4 Meetings
Enhanced support to
local municipalities
Submit quarterly progress
reports that include
Infrastructure, Housing,
Planning and Development
Submit quarterly progress reports
that include expenditure on all MIG projects
4 Reports submitted
4 Reports submitted
4 Reports submitted
4 Reports submitted
4 Reports submitted
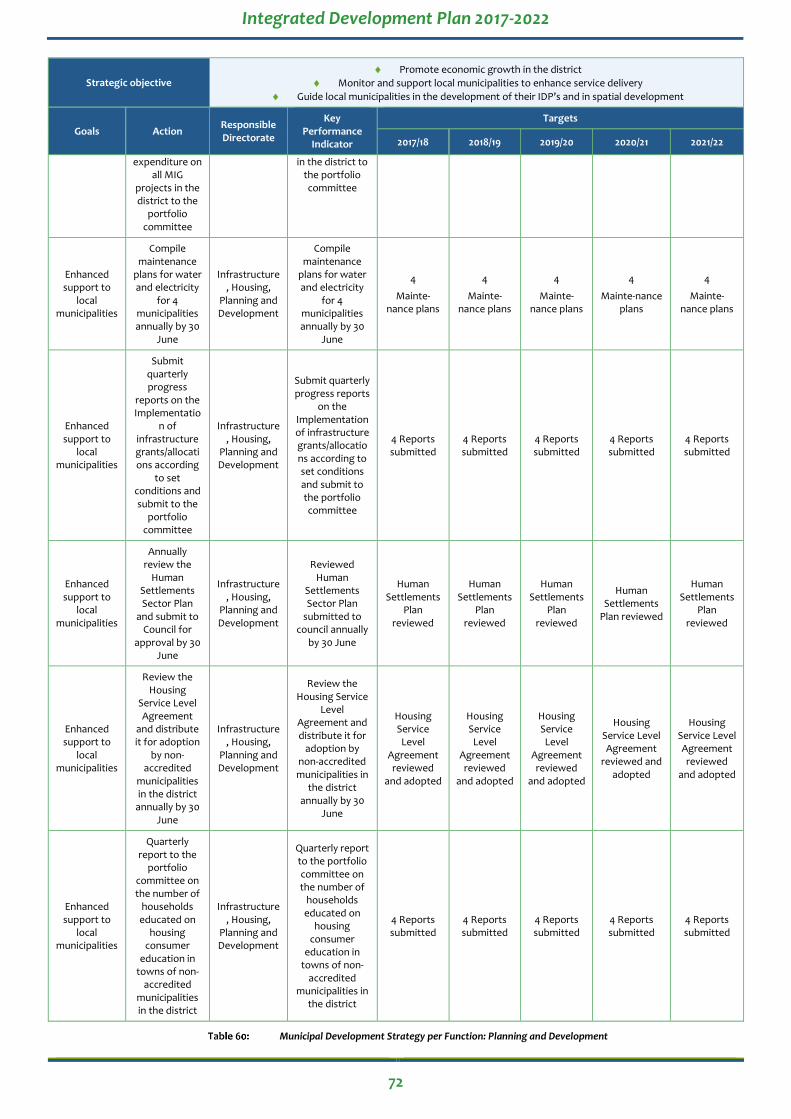
Integrated Development Plan 2017-2022
72
Strategic objective Promote economic growth in the district
Monitor and support local municipalities to enhance service delivery
Guide local municipalities in the development of their IDP’s and in spatial development
Goals Action Responsible Directorate
Key Performance
Indicator
Targets
2017/18 2018/19 2019/20 2020/21 2021/22
expenditure on all MIG
projects in the district to the
portfolio committee
in the district to the portfolio committee
Enhanced support to
local municipalities
Compile maintenance
plans for water and electricity
for 4 municipalities annually by 30
June
Infrastructure, Housing,
Planning and Development
Compile maintenance
plans for water and electricity
for 4 municipalities annually by 30
June
4
Mainte-nance plans
4
Mainte-nance plans
4
Mainte-nance plans
4
Mainte-nance plans
4
Mainte-nance plans
Enhanced support to
local municipalities
Submit quarterly progress
reports on the Implementatio
n of infrastructure grants/allocations according
to set conditions and submit to the
portfolio committee
Infrastructure, Housing,
Planning and Development
Submit quarterly progress reports
on the Implementation of infrastructure grants/allocations according to set conditions and submit to the portfolio committee
4 Reports submitted
4 Reports submitted
4 Reports submitted
4 Reports submitted
4 Reports submitted
Enhanced support to
local municipalities
Annually review the
Human Settlements Sector Plan
and submit to Council for
approval by 30 June
Infrastructure, Housing,
Planning and Development
Reviewed Human
Settlements Sector Plan
submitted to council annually
by 30 June
Human Settlements
Plan reviewed
Human Settlements
Plan reviewed
Human Settlements
Plan reviewed
Human Settlements
Plan reviewed
Human Settlements
Plan reviewed
Enhanced support to
local municipalities
Review the Housing
Service Level Agreement
and distribute it for adoption
by non-accredited
municipalities in the district
annually by 30 June
Infrastructure, Housing,
Planning and Development
Review the Housing Service
Level Agreement and distribute it for
adoption by non-accredited municipalities in
the district annually by 30
June
Housing Service Level
Agreement reviewed
and adopted
Housing Service Level
Agreement reviewed
and adopted
Housing Service Level
Agreement reviewed
and adopted
Housing Service Level Agreement
reviewed and adopted
Housing Service Level Agreement reviewed
and adopted
Enhanced support to
local municipalities
Quarterly report to the
portfolio committee on the number of
households educated on
housing consumer
education in towns of non-
accredited municipalities in the district
Infrastructure, Housing,
Planning and Development
Quarterly report to the portfolio committee on the number of
households educated on
housing consumer
education in towns of non-
accredited municipalities in
the district
4 Reports submitted
4 Reports submitted
4 Reports submitted
4 Reports submitted
4 Reports submitted
Municipal Development Strategy per Function: Planning and Development

Integrated Development Plan 2017-2022
73
4.3.7 Other
Strategic objective Promote economic growth in the district
Goals Action Responsible Directorate
Key Performance
Indicator
Targets
2017/18 2018/19 2019/20 2020/21 2021/22
Enhanced economic
growth
Research the options to
improve the tourism
function and role of the
district
Infrastructure, Housing,
Planning and Development
Research the options to
improve the tourism function and role of the
district and submit a report
with the findings and
recommenda-tions to council by 31 December
2017
1 n/a n/a n/a n/a
Municipal Development Strategy per Function: Other
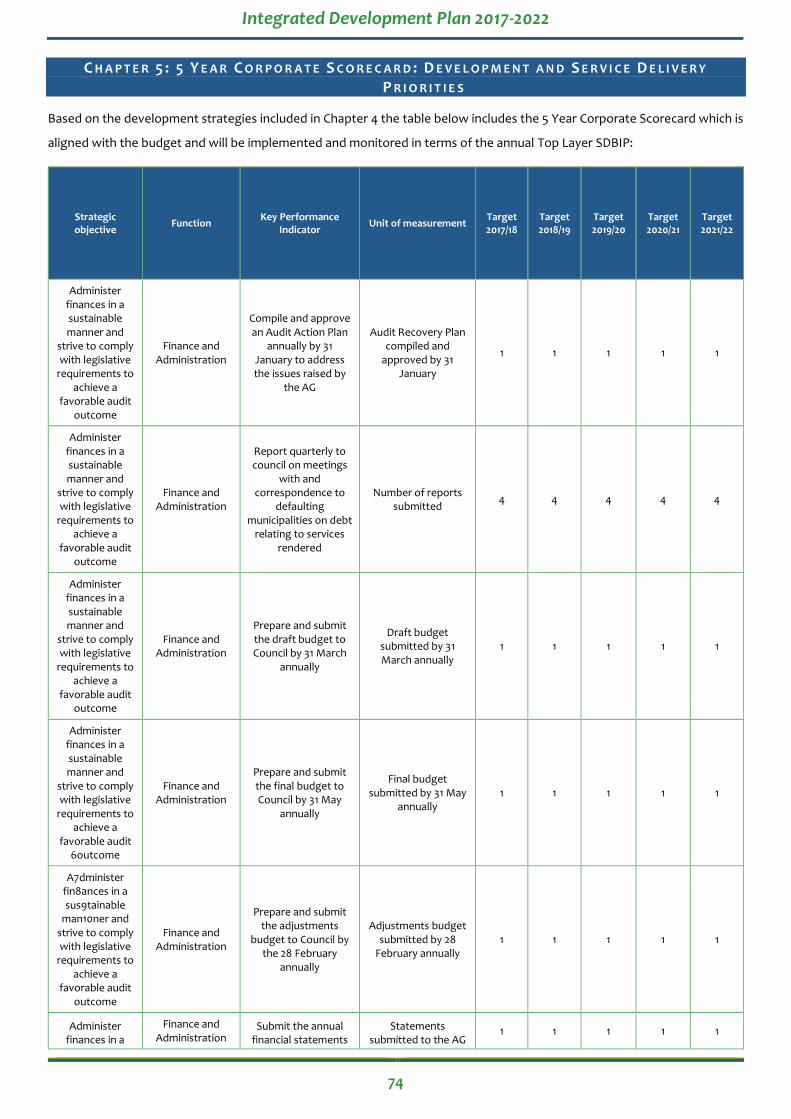
Integrated Development Plan 2017-2022
74
C H A P T E R 5 : 5 Y E A R C O R P O R A T E S C O R E C A R D : D E V E L O P M E N T A N D S E R V I C E D E L I V E R Y
P R I O R I T I E S
Based on the development strategies included in Chapter 4 the table below includes the 5 Year Corporate Scorecard which is
aligned with the budget and will be implemented and monitored in terms of the annual Top Layer SDBIP:
Strategic objective
Function Key Performance
Indicator Unit of measurement
Target 2017/18
Target 2018/19
Target 2019/20
Target 2020/21
Target 2021/22
Administer finances in a sustainable manner and
strive to comply with legislative
requirements to achieve a
favorable audit outcome
Finance and Administration
Compile and approve an Audit Action Plan
annually by 31 January to address the issues raised by
the AG
Audit Recovery Plan compiled and
approved by 31 January
1 1 1 1 1
Administer finances in a sustainable manner and
strive to comply with legislative
requirements to achieve a
favorable audit outcome
Finance and Administration
Report quarterly to council on meetings
with and correspondence to
defaulting municipalities on debt
relating to services rendered
Number of reports submitted
4 4 4 4 4
Administer finances in a sustainable manner and
strive to comply with legislative
requirements to achieve a
favorable audit outcome
Finance and Administration
Prepare and submit the draft budget to Council by 31 March
annually
Draft budget submitted by 31 March annually
1 1 1 1 1
Administer finances in a sustainable manner and
strive to comply with legislative
requirements to achieve a
favorable audit 6outcome
Finance and Administration
Prepare and submit the final budget to Council by 31 May
annually
Final budget submitted by 31 May
annually 1 1 1 1 1
A7dminister fin8ances in a sus9tainable
man10ner and strive to comply with legislative
requirements to achieve a
favorable audit outcome
Finance and Administration
Prepare and submit the adjustments
budget to Council by the 28 February
annually
Adjustments budget submitted by 28
February annually 1 1 1 1 1
Administer finances in a
Finance and Administration
Submit the annual financial statements
Statements submitted to the AG
1 1 1 1 1

Integrated Development Plan 2017-2022
75
Strategic objective
Function Key Performance
Indicator Unit of measurement
Target 2017/18
Target 2018/19
Target 2019/20
Target 2020/21
Target 2021/22
sustainable manner and
strive to comply with legislative
requirements to achieve a
favorable audit outcome
to the Auditor-General by 31 August
annually
by 31 August annually
Administer finances in a sustainable manner and
strive to comply with legislative
requirements to achieve a
favorable audit outcome
Finance and Administration
Co-ordinate the District MM/CFO
forums
Number of meetings held
2 2 2 2 2
Administer finances in a sustainable manner and
strive to comply with legislative
requirements to achieve a
favorable audit outcome
Finance and Administration
Financial viability measured in terms of
the Municipality's ability to meet it's
service debt obligations by 30
June ((Short Term Borrowing + Bank Overdraft + Short
Term Lease + Long Term Borrowing + Long Term Lease) /
Total Operating Revenue - Operating
Conditional Grant)
% debt coverage 45% 45% 45% 45% 45%
Administer finances in a sustainable manner and
strive to comply with legislative
requirements to achieve a
favorable audit outcome
Finance and Administration
Financial viability measured in terms of the available cash to
cover fixed operating expenditure by 30
June ((Cash and Cash Equivalents - Unspent
Conditional Grants - Overdraft) + Short Term Investment) /
Monthly Fixed Operational Expenditure
excluding (Depreciation,
Amortisation, and Provision for Bad
Debts, Impairment and Loss on Disposal
of Assets))
Number of months it takes to cover fix
operating expenditure with
available cash
1 1 1 1 1
Compliance with the tenets of
good governance as prescribed by legislation and best practice
Executive and Council
Submit a report to council annually by 30
June on the monitoring and
evaluation of community
participation
Report submitted to council by 30 June
annually 1 1 1 1 1

Integrated Development Plan 2017-2022
76
Strategic objective
Function Key Performance
Indicator Unit of measurement
Target 2017/18
Target 2018/19
Target 2019/20
Target 2020/21
Target 2021/22
Compliance with the tenets of
good governance as prescribed by legislation and best practice
Executive and Council
Facilitate the meeting of the District
Communication Forum
Number of meetings held
4 4 4 4 4
Compliance with the tenets of
good governance as prescribed by legislation and best practice
Executive and Council
Host commemorative days as per the
approved list by the Municipal Manager
and Mayor
Number of commemorative
days hosted 5 5 5 5 5
Compliance with the tenets of
good governance as prescribed by legislation and best practice
Executive and Council
Facilitate the meeting of the District
HIV/AIDS council
Number of meetings held
4 4 4 4 4
Compliance with the tenets of
good governance as prescribed by legislation and best practice
Executive and Council
Facilitate the meeting of the Youth Council
Number of meetings held
2 2 2 2 2
Compliance with the tenets of
good governance as prescribed by legislation and best practice
Executive and Council
Facilitate the meeting of the District
Intergovernmental Forum (Technical)
Number of meetings held
4 4 4 4 4
Compliance with the tenets of
good governance as prescribed by legislation and best practice
Executive and Council
Sign 57 performance agreements with all directors by 31 July
Number of performance
agreements signed 4 4 4 4 4
Monitor and support local
municipalities to enhance service
delivery
Executive and Council
Report quarterly to council on Shared
Services
Number of reports submitted
4 4 4 4 4
Compliance with the tenets of
good governance as prescribed by legislation and best practice
Finance and Administration
Submit the Top layer SDBIP for approval by the Mayor within
21 days after the budget has been
approved
Top Layer SDBIP submitted annually to Mayor within 21
days after the budget has been
approved
1 1 1 1 1
Compliance with the tenets of
good governance as
Finance and Administration
Submit the draft Annual Report to
Council annually by 31 January
Draft annual report submitted annually
to council by 31 January
1 1 1 1 1

Integrated Development Plan 2017-2022
77
Strategic objective
Function Key Performance
Indicator Unit of measurement
Target 2017/18
Target 2018/19
Target 2019/20
Target 2020/21
Target 2021/22
prescribed by legislation and best practice
Monitor and support local
municipalities to enhance service
delivery
Finance and Administration
Draft implementable and realistic SLA’s for
the rendering of shared services in all local municipalities
Number of SLA's drafted
8 n/a n/a n/a n/a
Monitor and support local
municipalities to enhance service
delivery
Planning and Development
Arrange and convene quarterly
Infrastructure Forum meetings
Number of meetings 4 4 4 4 4
Monitor and support local
municipalities to enhance service
delivery
Planning and Development
Submit quarterly progress reports that include expenditure
on all MIG projects in the district to the
portfolio committee
Number of reports submitted
4 4 4 4 4
Monitor and support local
municipalities to enhance service
delivery
Planning and Development
Compile maintenance plans for water and
electricity for 4 municipalities
annually by 30 June
Number of maintenance plans
compiled annually by 30 June
4 4 4 4 4
Monitor and support local
municipalities to enhance service
delivery
Planning and Development
Submit quarterly progress reports on the Implementation
of infrastructure grants/allocations according to set conditions and submit to the
portfolio committee
Number of reports submitted
4 4 4 4 4
Monitor and support local
municipalities to enhance service
delivery
Planning and Development
Annually review the Human Settlements
Sector Plan and submit to Council for approval by 30 June
Reviewed Human Settlements Sector Plan submitted to
council annually by 30 June
1 1 1 1 1
Monitor and support local
municipalities to enhance service
delivery
Planning and Development
Review the Housing Service Level
Agreement and distribute it for
adoption by non-accredited
municipalities in the district annually by 30
June
Reviewed, adopted and signed Housing
SLA by 30 June annually
1 1 1 1 1
Monitor and support local
municipalities to enhance service
delivery
Planning and Development
Quarterly report to the portfolio
committee on the number of
households educated on housing consumer education in towns of
non-accredited municipalities in the
district
Number of reports submitted
4 4 4 4 4
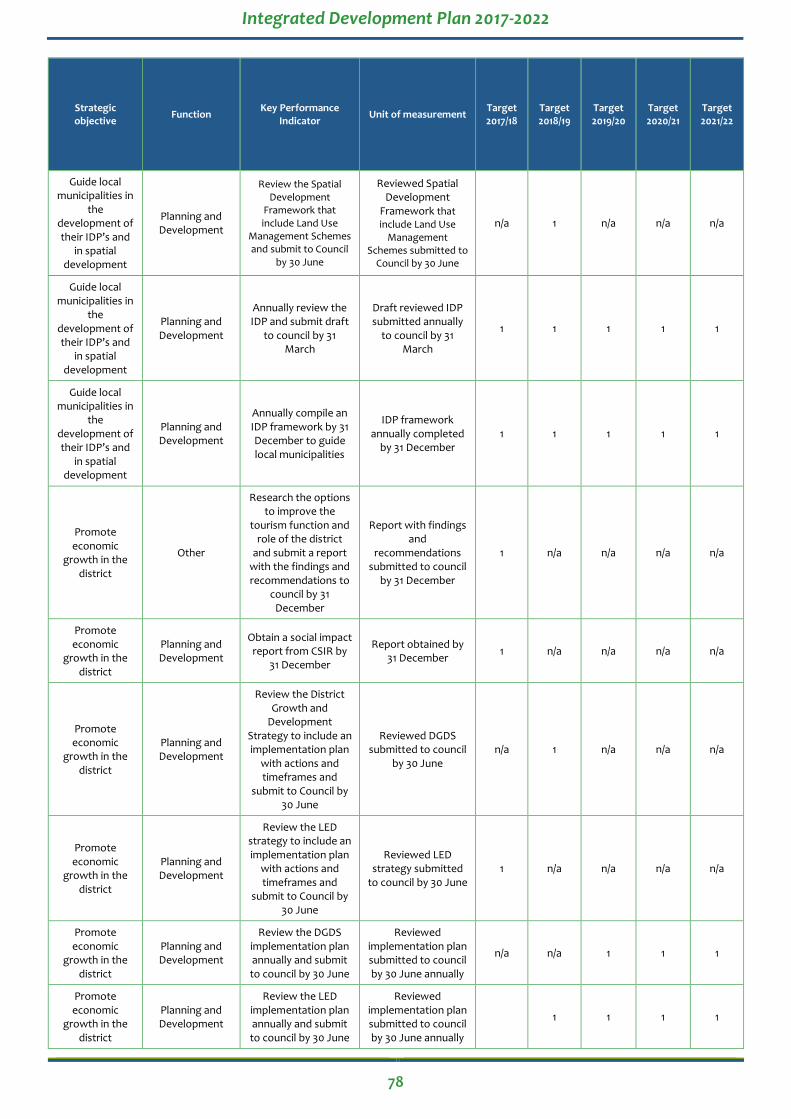
Integrated Development Plan 2017-2022
78
Strategic objective
Function Key Performance
Indicator Unit of measurement
Target 2017/18
Target 2018/19
Target 2019/20
Target 2020/21
Target 2021/22
Guide local municipalities in
the development of their IDP’s and
in spatial development
Planning and Development
Review the Spatial Development
Framework that include Land Use
Management Schemes and submit to Council
by 30 June
Reviewed Spatial Development
Framework that include Land Use
Management Schemes submitted to
Council by 30 June
n/a 1 n/a n/a n/a
Guide local municipalities in
the development of their IDP’s and
in spatial development
Planning and Development
Annually review the IDP and submit draft
to council by 31 March
Draft reviewed IDP submitted annually
to council by 31 March
1 1 1 1 1
Guide local municipalities in
the development of their IDP’s and
in spatial development
Planning and Development
Annually compile an IDP framework by 31 December to guide local municipalities
IDP framework annually completed
by 31 December 1 1 1 1 1
Promote economic
growth in the district
Other
Research the options to improve the
tourism function and role of the district
and submit a report with the findings and recommendations to
council by 31 December
Report with findings and
recommendations submitted to council
by 31 December
1 n/a n/a n/a n/a
Promote economic
growth in the district
Planning and Development
Obtain a social impact report from CSIR by
31 December
Report obtained by 31 December
1 n/a n/a n/a n/a
Promote economic
growth in the district
Planning and Development
Review the District Growth and
Development Strategy to include an implementation plan
with actions and timeframes and
submit to Council by 30 June
Reviewed DGDS submitted to council
by 30 June n/a 1 n/a n/a n/a
Promote economic
growth in the district
Planning and Development
Review the LED strategy to include an implementation plan
with actions and timeframes and
submit to Council by 30 June
Reviewed LED strategy submitted
to council by 30 June 1 n/a n/a n/a n/a
Promote economic
growth in the district
Planning and Development
Review the DGDS implementation plan annually and submit to council by 30 June
Reviewed implementation plan submitted to council by 30 June annually
n/a n/a 1 1 1
Promote economic
growth in the district
Planning and Development
Review the LED implementation plan annually and submit to council by 30 June
Reviewed implementation plan submitted to council by 30 June annually
1 1 1 1

Integrated Development Plan 2017-2022
79
Strategic objective
Function Key Performance
Indicator Unit of measurement
Target 2017/18
Target 2018/19
Target 2019/20
Target 2020/21
Target 2021/22
Promote economic
growth in the district
Planning and Development
Arrange quarterly LED forum meeting
Number of meetings held
4 4 4 4 4
Promote economic
growth in the district
Planning and Development
Create job opportunities through the
Expanded Public Works Programme
(EPWP)
Number of opportunities
created 55 55 55 55 55
To provide a professional,
people-centered human
resources and administrative
service to citizens, staff and Council
Finance and Administration
Review the Study Bursary policy to
include unemployed people of the district
to get the critical skills and submit to council by 30 June
Reviewed Study Bursary policy
submitted to council by 30 June
n/a 1 n/a n/a n/a
To provide a professional,
people-centered human
resources and administrative
service to citizens, staff and Council
Finance and Administration
Spent 1% of personnel budget on training by 30 June (Actual total training expenditure
divided by total personnel budget)
% of the personnel budget spent
1% 1% 1% 1% 1%
To provide a professional,
people-centered human
resources and administrative
service to citizens, staff and Council
Finance and Administration
Submit a business proposal to LGSETA
for discretionary grant to avail funds to train employees and
unemployed by 31 March
Proposal submitted by 31 March
1 n/a n/a n/a n/a
To provide a professional,
people-centered human
resources and administrative
service to citizens, staff and Council
Finance and Administration
Implement the WPSP to train officials (Total
number of officials that received training
as was identified in the WPSP/total
number of officials that were identified
for training in the WPSP)
% of identified employees that
completes training as identified in WPSP
90% 90% 90% 90% 90%
To provide a professional,
people-centered human
resources and administrative
service to citizens, staff and Council
Finance and Administration
Develop a policy to implement a system of understudy within the Municipality by 31
December
System developed by 31 December
n/a 1 n/a n/a n/a
To provide a professional,
people-centered
Finance and Administration
Review the organizational
structure of the
Reviewed Organizational
n/a n/a n/a 1 n/a
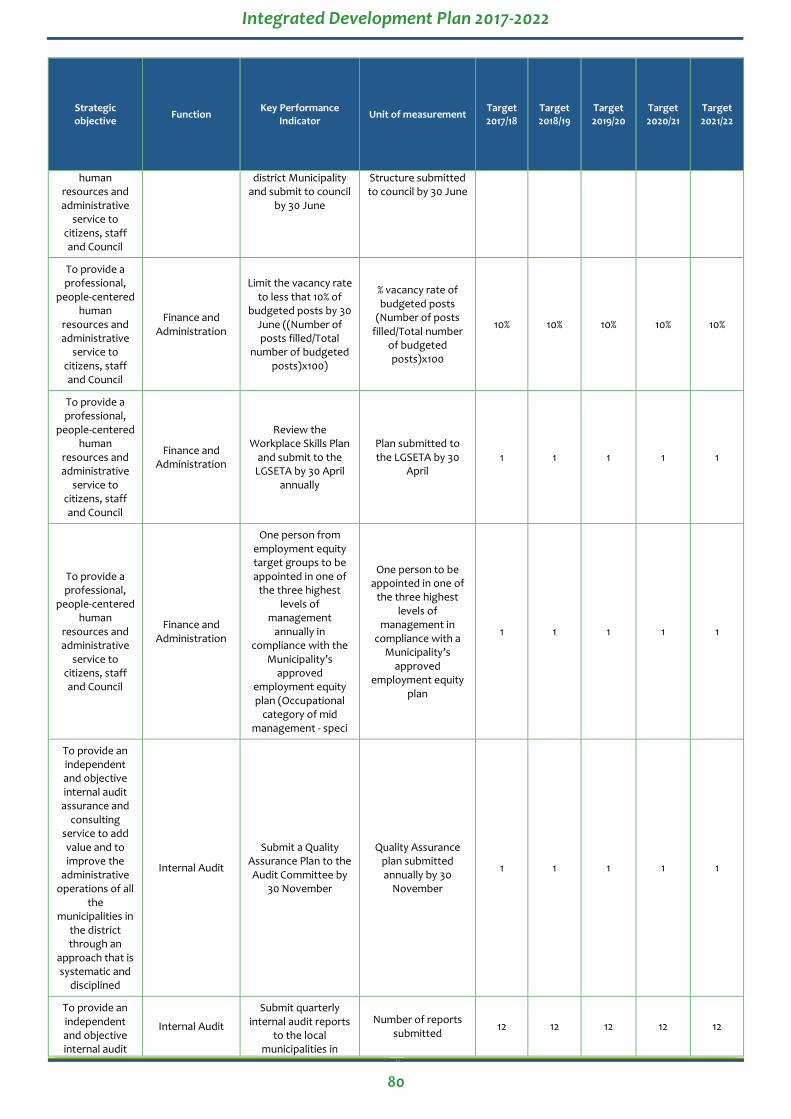
Integrated Development Plan 2017-2022
80
Strategic objective
Function Key Performance
Indicator Unit of measurement
Target 2017/18
Target 2018/19
Target 2019/20
Target 2020/21
Target 2021/22
human resources and administrative
service to citizens, staff and Council
district Municipality and submit to council
by 30 June
Structure submitted to council by 30 June
To provide a professional,
people-centered human
resources and administrative
service to citizens, staff and Council
Finance and Administration
Limit the vacancy rate to less that 10% of
budgeted posts by 30 June ((Number of posts filled/Total
number of budgeted posts)x100)
% vacancy rate of budgeted posts
(Number of posts filled/Total number
of budgeted posts)x100
10% 10% 10% 10% 10%
To provide a professional,
people-centered human
resources and administrative
service to citizens, staff and Council
Finance and Administration
Review the Workplace Skills Plan
and submit to the LGSETA by 30 April
annually
Plan submitted to the LGSETA by 30
April 1 1 1 1 1
To provide a professional,
people-centered human
resources and administrative
service to citizens, staff and Council
Finance and Administration
One person from employment equity target groups to be appointed in one of
the three highest levels of
management annually in
compliance with the Municipality’s
approved employment equity plan (Occupational
category of mid management - speci
One person to be appointed in one of
the three highest levels of
management in compliance with a
Municipality’s approved
employment equity plan
1 1 1 1 1
To provide an independent and objective internal audit assurance and
consulting service to add value and to improve the
administrative operations of all
the municipalities in
the district through an
approach that is systematic and
disciplined
Internal Audit
Submit a Quality Assurance Plan to the Audit Committee by
30 November
Quality Assurance plan submitted annually by 30
November
1 1 1 1 1
To provide an independent and objective internal audit
Internal Audit
Submit quarterly internal audit reports
to the local municipalities in
Number of reports submitted
12 12 12 12 12

Integrated Development Plan 2017-2022
81
Strategic objective
Function Key Performance
Indicator Unit of measurement
Target 2017/18
Target 2018/19
Target 2019/20
Target 2020/21
Target 2021/22
assurance and consulting
service to add value and to improve the
administrative operations of all
the municipalities in
the district through an
approach that is systematic and
disciplined
terms of the Service Level Agreements
To provide an independent and objective internal audit assurance and
consulting service to add value and to improve the
administrative operations of all
the municipalities in
the district through an
approach that is systematic and
disciplined
Internal Audit
Compile the Risk based audit plan
(RBAP) and submit to the Audit Committee for consideration by
30 November
RBAP submitted by 30 November
1 1 1 1 1
To provide an independent and objective internal audit assurance and
consulting service to add value and to improve the
administrative operations of all
the municipalities in
the district through an
approach that is systematic and
disciplined
Internal Audit
Compile the Risk based audit plans
(RBAP) for the local municipalities in
terms of the Service Level Agreements and submit to the
local municipalities by 30 June
Number of plans submitted
3 3 3 3 3
To provide an independent and objective internal audit assurance and
consulting service to add value and to improve the
administrative operations of all
the
Internal Audit
Review the 3 year Strategic Audit Plans
of applicable local municipalities and
submit to the Audit Committee by 30
June
Reviewed 3 year Strategic Audit plans submitted to the AC by 30 June annually
3 3 3 3 3

Integrated Development Plan 2017-2022
82
Strategic objective
Function Key Performance
Indicator Unit of measurement
Target 2017/18
Target 2018/19
Target 2019/20
Target 2020/21
Target 2021/22
municipalities in the district through an
approach that is systematic and
disciplined
To provide an independent and objective internal audit assurance and
consulting service to add value and to improve the
administrative operations of all
the municipalities in
the district through an
approach that is systematic and
disciplined
Internal Audit
Review the 3 year Strategic Audit Plan and submit to the
Audit Committee by 30 November
Reviewed 3 year Strategic Audit plan submitted to the AC
by 30 November annually
1 1 1 1 1
To provide disaster
management services to the
citizens
Community and Social Services
Complete institutional
assessment to determine extend of
underfunding for disaster Management function and submit report to council by 30 December 2018
Assessment submitted to council by 31 December 2018
n/a 1 n/a n/a n/a
To provide disaster
management services to the
citizens
Community and Social Services
Submit application for increased funding
for disaster management to COGHSTA by 31
March
Application submitted by 31
March 1 n/a n/a n/a n/a
To provide disaster
management services to the
citizens
Community and Social Services
Host training session by 30 June to train
volunteers ito Disaster Management
Training sessions hosted by 30 June
1 1 1 1 1
To provide disaster
management services to the
citizens
Community and Social Services
Conduct a risk analysis on disaster
threats in the district and submit report on analysis to council by
30 June
Annually by 30 June n/a 1 n/a n/a n/a
To provide disaster
management services to the
citizens
Community and Social Services
Review the Disaster Management Plan
annually and submit to Council by 30 June
Reviewed plan annually submitted
to council by 30 June 1 1 1 1 1
To provide municipal health
services to improve the
Health
Investigate the possibility of
introducing an electronic reporting
Report submitted to council by 30 June
1 n/a n/a n/a n/a
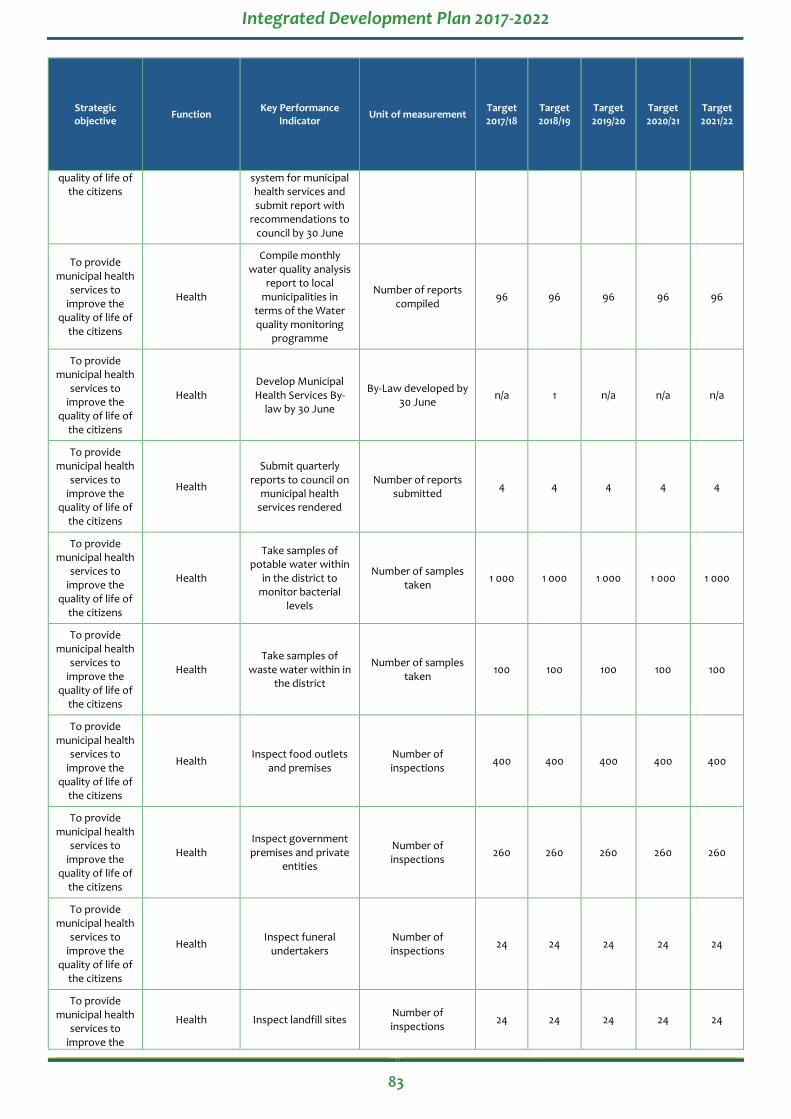
Integrated Development Plan 2017-2022
83
Strategic objective
Function Key Performance
Indicator Unit of measurement
Target 2017/18
Target 2018/19
Target 2019/20
Target 2020/21
Target 2021/22
quality of life of the citizens
system for municipal health services and submit report with
recommendations to council by 30 June
To provide municipal health
services to improve the
quality of life of the citizens
Health
Compile monthly water quality analysis
report to local municipalities in
terms of the Water quality monitoring
programme
Number of reports compiled
96 96 96 96 96
To provide municipal health
services to improve the
quality of life of the citizens
Health Develop Municipal Health Services By-
law by 30 June
By-Law developed by 30 June
n/a 1 n/a n/a n/a
To provide municipal health
services to improve the
quality of life of the citizens
Health
Submit quarterly reports to council on
municipal health services rendered
Number of reports submitted
4 4 4 4 4
To provide municipal health
services to improve the
quality of life of the citizens
Health
Take samples of potable water within
in the district to monitor bacterial
levels
Number of samples taken
1 000 1 000 1 000 1 000 1 000
To provide municipal health
services to improve the
quality of life of the citizens
Health Take samples of
waste water within in the district
Number of samples taken
100 100 100 100 100
To provide municipal health
services to improve the
quality of life of the citizens
Health Inspect food outlets
and premises Number of inspections
400 400 400 400 400
To provide municipal health
services to improve the
quality of life of the citizens
Health Inspect government premises and private
entities
Number of inspections
260 260 260 260 260
To provide municipal health
services to improve the
quality of life of the citizens
Health Inspect funeral
undertakers Number of inspections
24 24 24 24 24
To provide municipal health
services to improve the
Health Inspect landfill sites Number of inspections
24 24 24 24 24

Integrated Development Plan 2017-2022
84
Strategic objective
Function Key Performance
Indicator Unit of measurement
Target 2017/18
Target 2018/19
Target 2019/20
Target 2020/21
Target 2021/22
quality of life of the citizens
To provide municipal health
services to improve the
quality of life of the citizens
Health Inspect premises for
chemical safety Number of inspections
684 684 684 684 684
To provide municipal health
services to improve the
quality of life of the citizens
Health Inspect premises for
vectors control Number of inspections
684 684 684 684 684
5 Year Corporate Scorecard: Development and Service Delivery Priorities

Integrated Development Plan 2017-2022
85
C H A P T E R 6 : S E C T O R A L C O N T R I B U T I O N S
Chapter 5 of the Municipal Systems Act (Act 32 of 2000) in particular provides instruction on cooperative governance,
encouraging municipalities to develop their strategies in line with other organs of state so as to give effect to the five-year
strategic plan. It goes further to inform that the IDP must link, integrate and coordinate development plans for the
Municipality. Resources and capacity must align with the implementation of the plan, forming the foundation on which the
annual budget is based. The plan must also be compatible with national development plans and planning requirements
binding on the Municipality in terms of legislation. The IDP should therefore serve as a guideline for where sector departments
allocate their resources at local government level. The Municipality should however also take into consideration the sector
departments’ policies and programmes when developing its own policies and strategies. For this reason is it in the interest of
the sector departments to participate in municipal IDP planning processes to ensure alignment between programmes.
The following projects are planned by the various national and provincial sector departments:
The tables below indicates projects that are planned by the various national and provincial sector departments. Unfortunately
not all the applicable sector departments submitted information:
6 . 1 N a t i o n a l S e c t o r P r o j e c t s
a) Department of Water and Sanitation
Town/Area Name of Local municipality
Project description Purpose Budget allocation (R’000)
2017/18 2018/19 2019/20
Douglas Siyancuma Douglas Water Treatment
Works Bulk water upgrade 5 150 21 237 15 000
Van Wyksvlei Kareeberg Van WyksVlei Groundwater Bulk water upgrade 30 000 46 824 0
De Aar Emthanjeni De Aar Borehole
Development Bulk water upgrade 0 20 000 6 796
Marydale Siyathemba Marydale Bulk Water
Scheme Bulk water upgrade 7 621 0 0
Britstown Emthanjeni Britstown Oxidation Ponds Bulk sewer upgrade 0 30 000 4 757
Campbell Siyancuma Campbell bulk Augmentation
Bulk water upgrade 10 000 0 0
Hopetown / Strydenburg
Thembelihle Easiflush toilets Installation
in Hopetown and Strydenburg
Eradication of Sanitation backlogs
4 000 0 0
Vanderkloof Renosterberg Upgrading of Vanderkloof
WWTW Bulk sewer upgrade 10 000 0 0
Colesberg Umsobomvu Colesberg Bulk pipe
refurbishment Refurbishment of bulk
water pipeline 4 000 0 0
Victoria West Ubuntu Victoria West Borehole
development Bulk water Augmentation/
source development 4 000 0 0
De Aar / Britstown Emthanjeni De Aar Borehole
refurbishment / Britstown Sanitation reticulation
Refurbishment / Sewer reticulation extension
14 000 0 0
Prieska Siyathemba ACWS: Water Backlog for Siyathemba Municipality
(Prieska WTW) Water backlog 7 000 0 0
Breipaal Siyancuma New pumpstation Eradication of sanitation
backlogs 4 400 0 0
Sectoral Contributions: Department of Water and Sanitation
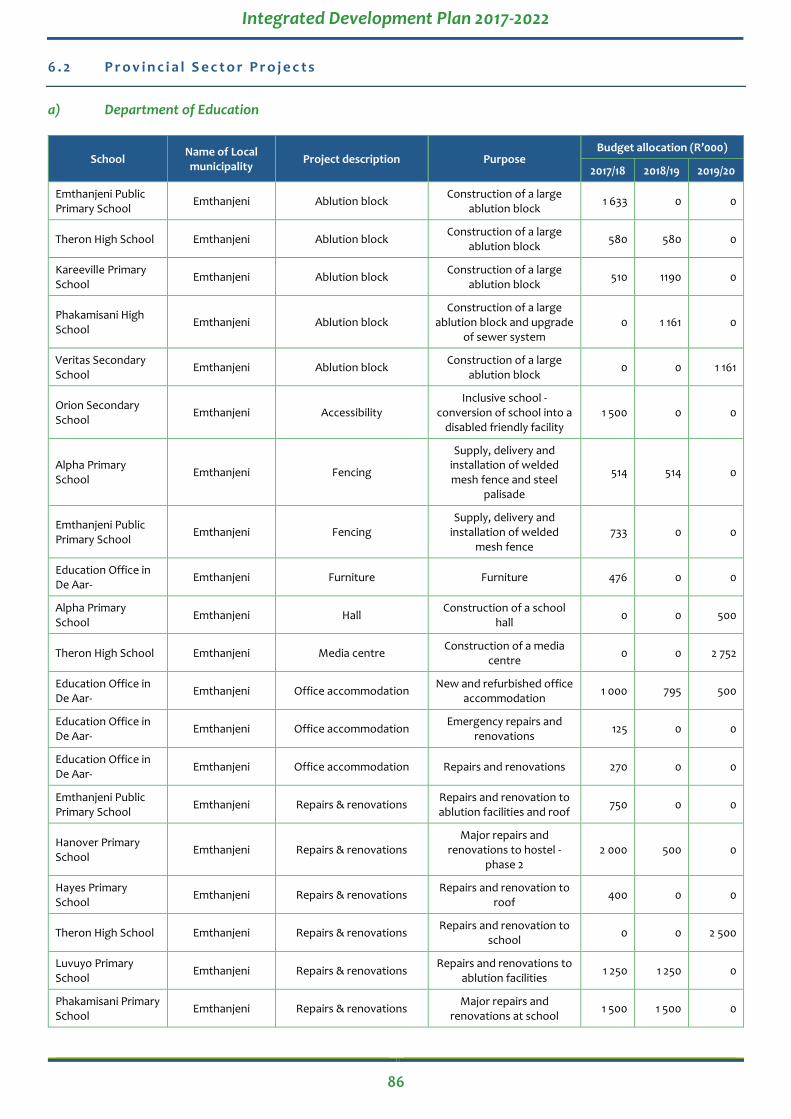
Integrated Development Plan 2017-2022
86
6 . 2 P r o v i n c i a l S e c t o r P r o j e c t s
a) Department of Education
School Name of Local municipality
Project description Purpose Budget allocation (R’000)
2017/18 2018/19 2019/20
Emthanjeni Public Primary School
Emthanjeni Ablution block Construction of a large
ablution block 1 633 0 0
Theron High School Emthanjeni Ablution block Construction of a large
ablution block 580 580 0
Kareeville Primary School
Emthanjeni Ablution block Construction of a large
ablution block 510 1190 0
Phakamisani High School
Emthanjeni Ablution block Construction of a large
ablution block and upgrade of sewer system
0 1 161 0
Veritas Secondary School
Emthanjeni Ablution block Construction of a large
ablution block 0 0 1 161
Orion Secondary School
Emthanjeni Accessibility Inclusive school -
conversion of school into a disabled friendly facility
1 500 0 0
Alpha Primary School
Emthanjeni Fencing
Supply, delivery and installation of welded mesh fence and steel
palisade
514 514 0
Emthanjeni Public Primary School
Emthanjeni Fencing Supply, delivery and
installation of welded mesh fence
733 0 0
Education Office in De Aar-
Emthanjeni Furniture Furniture 476 0 0
Alpha Primary School
Emthanjeni Hall Construction of a school
hall 0 0 500
Theron High School Emthanjeni Media centre Construction of a media
centre 0 0 2 752
Education Office in De Aar-
Emthanjeni Office accommodation New and refurbished office
accommodation 1 000 795 500
Education Office in De Aar-
Emthanjeni Office accommodation Emergency repairs and
renovations 125 0 0
Education Office in De Aar-
Emthanjeni Office accommodation Repairs and renovations 270 0 0
Emthanjeni Public Primary School
Emthanjeni Repairs & renovations Repairs and renovation to ablution facilities and roof
750 0 0
Hanover Primary School
Emthanjeni Repairs & renovations Major repairs and
renovations to hostel - phase 2
2 000 500 0
Hayes Primary School
Emthanjeni Repairs & renovations Repairs and renovation to
roof 400 0 0
Theron High School Emthanjeni Repairs & renovations Repairs and renovation to
school 0 0 2 500
Luvuyo Primary School
Emthanjeni Repairs & renovations Repairs and renovations to
ablution facilities 1 250 1 250 0
Phakamisani Primary School
Emthanjeni Repairs & renovations Major repairs and
renovations at school 1 500 1 500 0

Integrated Development Plan 2017-2022
87
School Name of Local municipality
Project description Purpose Budget allocation (R’000)
2017/18 2018/19 2019/20
Veritas Secondary School hostel
Emthanjeni Repairs & renovations Major rehabilitation and
renovation hostel 416 0 0
Veritas Secondary School
Emthanjeni Repairs & renovations Major repairs and
renovations at hostel and school
750 750 0
Willie Theron Primary School
Emthanjeni Repairs & renovations Major repairs and
renovation to structure, ablution and roof
500 500 0
Zingisani Primary School
Emthanjeni Repairs & renovations Repairs and renovation to
ablution facilities 500 0 0
Phakamisani High School
Emthanjeni Sanitation Emergency repairs to
sanitation 440 0 0
Luvuyo Primary School
Emthanjeni Water Drilling & equipping of a
borehole 479 0 0
Veritas Secondary School
Emthanjeni Water Drilling & equipping of a
borehole 36 0 0
Carnarvon Primary School (Carel van Zyl Primary School)
Kareeberg Ablution block Construction of a large
ablution block 1 166 0 0
Van Wyksvlei Intermediate School
Kareeberg Ablution block Construction of a small
ablution block 0 900 0
Carnarvon Secondary School
Kareeberg Repairs & renovations Major repairs and
renovations to hostel - phase 2
2 000 500 0
Carnarvon Secondary School
Kareeberg Repairs & renovations Major repairs and
renovations at school 1 500 1 500 0
Carnarvon Secondary School
Kareeberg Repairs & renovations Repairs & renovations 20 0 0
Delta Primary School
Kareeberg Repairs & renovations Repairs and renovation to
the hostel and ablution facilities
0 500 0
Van Wyksvlei Intermediate School
Kareeberg Repairs & renovations Major repairs and
renovations at school 2 000 0 0
Keurtjieskloof Primary School
Renosterberg Ablution block Extension from the learner ablution to accommodate
the educators ablutions 100 0 0
Petrusville High School
Renosterberg Administration block Construction of a large
administration block 0 0 3 181
Petrusville High School
Renosterberg Fencing Supply, delivery and installation of steel
palisade fence 2 0 0
Visisani Primary School
Renosterberg Repairs & renovations Repairs and renovation to
ablution facilities and electricity
0 500 0
Replacement school - Phillipsvale Primary School
Renosterberg Replacement school Planning and construction
on a full service school - replacement
5 843 0 0
Bongani Primary School
Siyancuma Ablution block Construction of a large
ablution block 510 119 0
Olierivier Marianette Primary School
Siyancuma Ablution block Construction of a small
ablution block 0 0 900
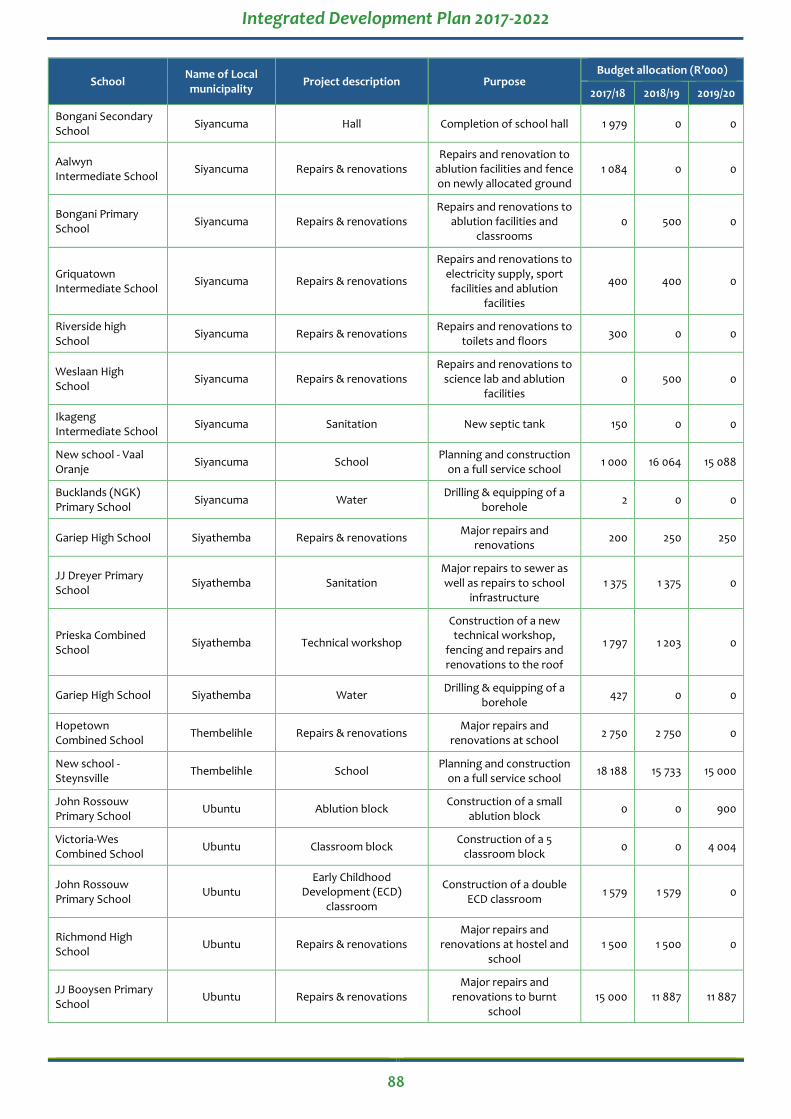
Integrated Development Plan 2017-2022
88
School Name of Local municipality
Project description Purpose Budget allocation (R’000)
2017/18 2018/19 2019/20
Bongani Secondary School
Siyancuma Hall Completion of school hall 1 979 0 0
Aalwyn Intermediate School
Siyancuma Repairs & renovations Repairs and renovation to
ablution facilities and fence on newly allocated ground
1 084 0 0
Bongani Primary School
Siyancuma Repairs & renovations Repairs and renovations to
ablution facilities and classrooms
0 500 0
Griquatown Intermediate School
Siyancuma Repairs & renovations
Repairs and renovations to electricity supply, sport
facilities and ablution facilities
400 400 0
Riverside high School
Siyancuma Repairs & renovations Repairs and renovations to
toilets and floors 300 0 0
Weslaan High School
Siyancuma Repairs & renovations Repairs and renovations to
science lab and ablution facilities
0 500 0
Ikageng Intermediate School
Siyancuma Sanitation New septic tank 150 0 0
New school - Vaal Oranje
Siyancuma School Planning and construction
on a full service school 1 000 16 064 15 088
Bucklands (NGK) Primary School
Siyancuma Water Drilling & equipping of a
borehole 2 0 0
Gariep High School Siyathemba Repairs & renovations Major repairs and
renovations 200 250 250
JJ Dreyer Primary School
Siyathemba Sanitation Major repairs to sewer as well as repairs to school
infrastructure 1 375 1 375 0
Prieska Combined School
Siyathemba Technical workshop
Construction of a new technical workshop,
fencing and repairs and renovations to the roof
1 797 1 203 0
Gariep High School Siyathemba Water Drilling & equipping of a
borehole 427 0 0
Hopetown Combined School
Thembelihle Repairs & renovations Major repairs and
renovations at school 2 750 2 750 0
New school - Steynsville
Thembelihle School Planning and construction
on a full service school 18 188 15 733 15 000
John Rossouw Primary School
Ubuntu Ablution block Construction of a small
ablution block 0 0 900
Victoria-Wes Combined School
Ubuntu Classroom block Construction of a 5
classroom block 0 0 4 004
John Rossouw Primary School
Ubuntu Early Childhood
Development (ECD) classroom
Construction of a double ECD classroom
1 579 1 579 0
Richmond High School
Ubuntu Repairs & renovations Major repairs and
renovations at hostel and school
1 500 1 500 0
JJ Booysen Primary School
Ubuntu Repairs & renovations Major repairs and
renovations to burnt school
15 000 11 887 11 887

Integrated Development Plan 2017-2022
89
School Name of Local municipality
Project description Purpose Budget allocation (R’000)
2017/18 2018/19 2019/20
JJ Booysen Primary School
Ubuntu Repairs & renovations Repairs and renovations to
hostel 500 0 0
Richmond High School hostel
Ubuntu Repairs & renovations Major repairs and
renovations to hostel - phase 2
2 000 500 0
Richmond High School hostel
Ubuntu Repairs & renovations Major rehabilitation and
renovation hostel 79 0 0
Victoria-Wes Intermediate School
Ubuntu Repairs & renovations Repairs and renovation to
the school and hostel 0 0 2 500
John Rossouw Primary School
Ubuntu Sanitation Upgrade sewer system 1 375 1 375 0
John Rossouw Primary School
Ubuntu Sanitation Major repairs to sewer as well as repairs to school
infrastructure 1 375 1 375 0
Hutchinson Primary School
Ubuntu Water Drilling and equipping of a
borehole 0 0 450
Enoch Mthetho Secondary School
Umsombomvu Ablution block Construction of a small
ablution block and upgrade of sewer system
954 0 0
Lowryville Intermediate School
Umsombomvu Ablution block Construction of a small
ablution block 0 900 0
Ikhwezi Lokusa Primary School
Umsombomvu Early Childhood
Development (ECD) classroom
Construction of a double ECD classroom
1 315 0 0
Eureka Intermediate School
Umsombomvu Fencing Supply, delivery and
installation of welded mesh fence
350 0 0
Norvalspont Intermediate School
Umsombomvu Fencing Erection of high security
fence 670 0 0
Colesberg Combined School
Umsombomvu Repairs & renovations Repairs and renovation to roof and ablution facilities
750 0 0
Eureka Intermediate School
Umsombomvu Repairs & renovations Major repairs and
renovations and upgrading of sanitation
200 0 0
Ikhwezi Lokusa Primary School
Umsombomvu Repairs & renovations Major repairs and
renovations and upgrading of sanitation
135 0 0
Norvalspont Intermediate School
Umsombomvu Repairs & renovations Major repairs and
renovations 0 0 2 500
SS Madikane Primary School
Umsombomvu Repairs & renovations Repairs and renovations to
ablution facilities 750 750 0
Umso High School Umsombomvu Repairs & renovations Repairs and renovations to
ablution facilities 500 0 0
Enoch Mthetho Secondary School
Umsombomvu Water Drilling and equipping of a
borehole 450 0 0
Ikhwezi Lokusa Primary School
Umsombomvu Water Drilling and equipping of a
borehole 450 0 0
Melton World Primary School
Umsombomvu Water Repairs and renovations 35 0 0
Sectoral Contributions: Department of Education
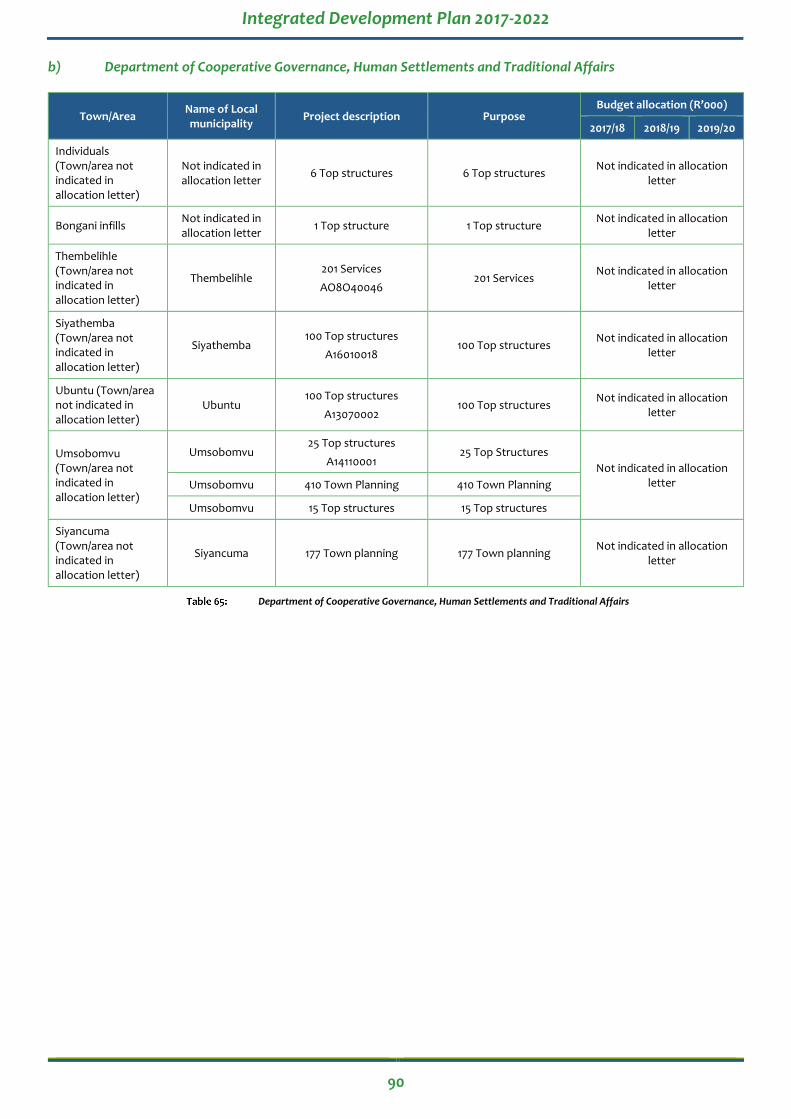
Integrated Development Plan 2017-2022
90
b) Department of Cooperative Governance, Human Settlements and Traditional Affairs
Town/Area Name of Local municipality
Project description Purpose Budget allocation (R’000)
2017/18 2018/19 2019/20
Individuals (Town/area not indicated in allocation letter)
Not indicated in allocation letter
6 Top structures 6 Top structures Not indicated in allocation
letter
Bongani infills Not indicated in allocation letter
1 Top structure 1 Top structure Not indicated in allocation
letter
Thembelihle (Town/area not indicated in allocation letter)
Thembelihle 201 Services
AO8O40046 201 Services
Not indicated in allocation letter
Siyathemba (Town/area not indicated in allocation letter)
Siyathemba 100 Top structures
A16010018 100 Top structures
Not indicated in allocation letter
Ubuntu (Town/area not indicated in allocation letter)
Ubuntu 100 Top structures
A13070002 100 Top structures
Not indicated in allocation letter
Umsobomvu (Town/area not indicated in allocation letter)
Umsobomvu 25 Top structures
A14110001 25 Top Structures
Not indicated in allocation letter Umsobomvu 410 Town Planning 410 Town Planning
Umsobomvu 15 Top structures 15 Top structures
Siyancuma (Town/area not indicated in allocation letter)
Siyancuma 177 Town planning 177 Town planning Not indicated in allocation
letter
Department of Cooperative Governance, Human Settlements and Traditional Affairs

Integrated Development Plan 2017-2022
91
C H A P T E R 7 : F I N A N C I A L P L A N
7 . 1 C a p i t a l B u d g e t
The municipality did not budget for any capital projects for the next three years.
7 . 2 G r a n t s
7.2.1 Allocations in terms of the Division of Revenue Bill (DORA)
Grant 2017/18
R
2018/19
R
2019/20
R Purpose
FMG 1 250 000 1 505 000 1 765 000 Improve financial
systems
Levy replacement 21 043 000 27 616 000 28 428 000 Financing of
administration
Councilor Remuneration 3 160 000 3 347 000 3 534 000 Financing of Councilor
allowances
Equitable Share 15 659 000 16 733 000 17 383 000 Financing of
administration
EPWP 1 050 000 0 0 Job creation
DPSA 1 615 000 150 000 0 Systems upgrading
RAMS 3 203 150 3 331 650 3 523 800 Upgrading and
maintenance of rural roads
Total 46 980 150 52 682 650 54 633 800
Allocations in terms of the Division of Revenue Bill (DORA)
7.2.2 Allocations in terms of the Provincial Gazette
Grant 2017/18 2018/19 2019/20 Purpose
NEAR System 350 000 368 000 389 000 Maintenance of NEAR
Systems
Housing Accreditation 720 000 0 0 Housing Delivery Administration
Total 1 070 000 368 000 389 000
Allocations in terms of Provincial Gazette

Integrated Development Plan 2017-2022
92
7 . 3 F i n a n c i a l F r a m e w o r k
7.3.1 Operating Budget: Revenue and Expenditure
The table below indicates the revenue budget by source and the expenditure budget per function:
Description
Budget
R
2017/18 2018/19 2019/20
Revenue by Source
Interest earned - external investments 250 000 262 500 274 000
Agency services 200 150 158 650 167 800
Own/Other Income 4 054 860 4 145 103 4 292 358
Transfers recognised - operational 47 800 000 52 892 000 54 855 000
Total Revenue 52 305 010 57 458 253 59 589 158
Operating Budget: Expenditure
Executive and Council 9 654 062 9 821 765 10 312 853
Finance and Administration 19 453 584 20 281 365 21 295 459
Internal Audit 4 491 792 4 716 382 4 952 202
Community and Social Services 2 386 756 2 485 094 2 609 348
Housing 2 919 274 2 309 237 2 424 698
Health 3 887 405 4 081 776 4 285 864
Planning and Development 9 033 838 6 942 280 7 131 894
Total Expenditure 51 826 711 50 637 899 53 012 318
Surplus/deficit for the Year 478 299 6 820 356 6 576 840
Operating Budget: Revenue and Expenditure
Graph 8.: Expenditure per Function

Integrated Development Plan 2017-2022
93
7.3.2 Operating Budget: Revenue by Department and Division
Department Division
Budget
R
2017/18 % 2018/19 % 2019/20 %
Compliance with the tenets of good governance as prescribed by legislation and best practice
Council Expenses Council 3 160 000 6.04 3 347 000 5.83 3 534 000 5.93
To provide a professional, people centered human resources and administrative service to citizens, staff and Council
Corporate Services Administration 70 000 0.13 73 500 0.13 77 175 0.13
Administer finances in a sustainable manner and strive to comply with legislative requirements to achieve a favourable audit outcome
Finance Budget and Treasury Office 42 387 010 81.01 50 346 753 87.62 52 232 983 87.66
To provide disaster management services to the citizens
Corporate Services Emergency and Disaster
Management/ Rental Income 350 000 0.67 368 000 0.64 389 000 0.65
Monitor and support local municipalities to enhance service delivery
Infrastructure, Housing, Planning and Development
Housing 720 000 1.38 0 0 0 0
Promote economic growth in the district Guide local municipalities in the development of their IDP’s and in spatial development
Infrastructure, Housing, Planning and Development
IDP & Development and Infrastructure
5 618 000 10.74 3 323 000 5.78 3 356 000 5.63
Total Revenue 52 305 010 100 57 458 253 100 59 589 158 100
Operating Budget: Revenue by Department and Division
7.3.3 Operating Budget: Expenditure by Department and Division
Department Division
Budget
R
2017/18 % 2018/19 % 2019/20 %
(A) Compliance with the tenets of good governance as prescribed by legislation and best practice
Council Expenses Council 8 081 944 15.59 8 171 041 16.14 8 579 593 16.18
Office of the Municipal Manager
Office of the Municipal Manager
1 572 118 3.03 1 650 724 3.26 1 733 260 3.27
(B) To provide an independent and objective internal audit assurance and consulting service to add value and to improve the administrative operations of all the municipalities in the district through an approach that is systematic and disciplined
Internal Audit Internal Audit 449 1792 8.67 4 716 382 9.31 4 952 202 9.34
(C) To provide a professional, people centered human resources and administrative service to citizens, staff and Council
Corporate Services Administration 7 127 190 13.75 7 338 650 14.49 7 705 582 14.54
(D) Administer finances in a sustainable manner and strive to comply with legislative requirements to achieve a favourable audit outcome
Finance Budget and Treasury Office 12 326 394 23.78 12 942 715 25.56 13 589 877 25.64
(E) To provide disaster management services to the citizens
Corporate Services Emergency and Disaster
Management 2 386 756 4.6 2 485 094 4.91 2 609 348 4.92
(F) Guide local municipalities in the development of their IDP’s and in spatial development
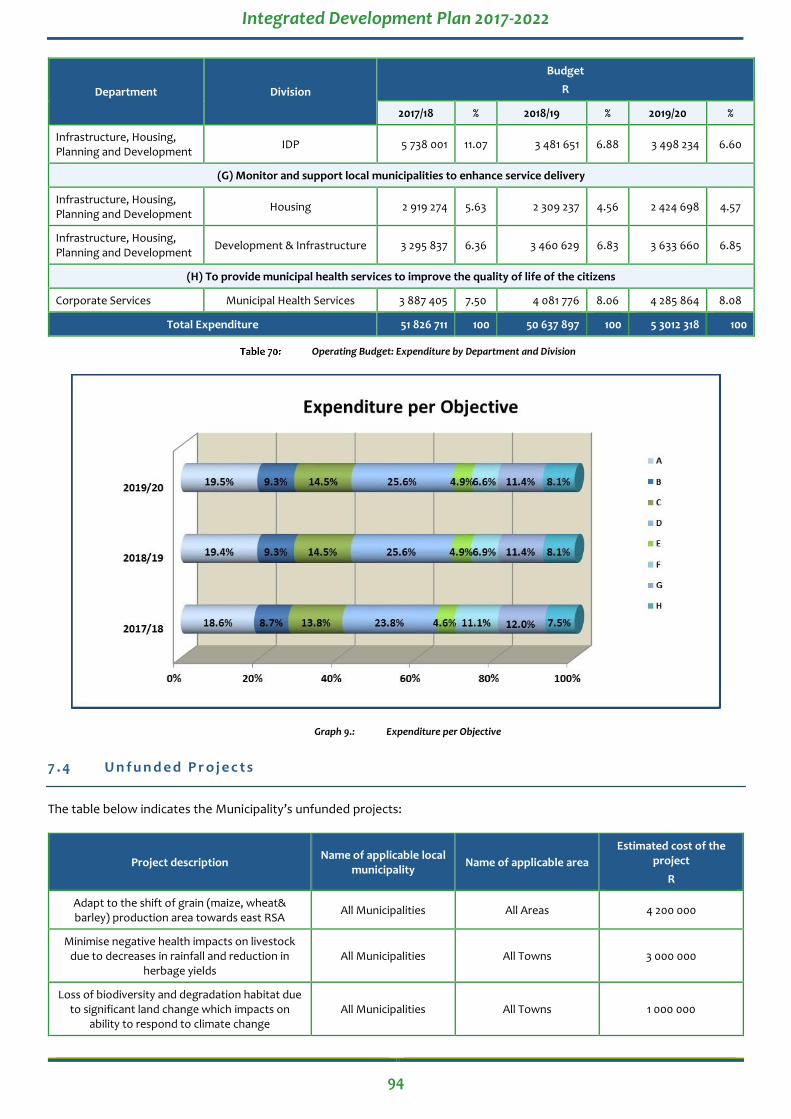
Integrated Development Plan 2017-2022
94
Department Division
Budget
R
2017/18 % 2018/19 % 2019/20 %
Infrastructure, Housing, Planning and Development
IDP 5 738 001 11.07 3 481 651 6.88 3 498 234 6.60
(G) Monitor and support local municipalities to enhance service delivery
Infrastructure, Housing, Planning and Development
Housing 2 919 274 5.63 2 309 237 4.56 2 424 698 4.57
Infrastructure, Housing, Planning and Development
Development & Infrastructure 3 295 837 6.36 3 460 629 6.83 3 633 660 6.85
(H) To provide municipal health services to improve the quality of life of the citizens
Corporate Services Municipal Health Services 3 887 405 7.50 4 081 776 8.06 4 285 864 8.08
Total Expenditure 51 826 711 100 50 637 897 100 5 3012 318 100
Operating Budget: Expenditure by Department and Division
Graph 9.: Expenditure per Objective
7 . 4 U n f u n d e d P r o j e c t s
The table below indicates the Municipality’s unfunded projects:
Project description Name of applicable local
municipality Name of applicable area
Estimated cost of the project
R
Adapt to the shift of grain (maize, wheat& barley) production area towards east RSA
All Municipalities All Areas 4 200 000
Minimise negative health impacts on livestock due to decreases in rainfall and reduction in
herbage yields All Municipalities All Towns 3 000 000
Loss of biodiversity and degradation habitat due to significant land change which impacts on
ability to respond to climate change All Municipalities All Towns 1 000 000

Integrated Development Plan 2017-2022
95
Project description Name of applicable local
municipality Name of applicable area
Estimated cost of the project
R
Changes in rainfall and temperature are likely to impact on wetlands and the ecosystem services
they provide All Municipalities All Towns Still to be determined
Manage and minimise the impacts of increased storms events such as drowning, injuries and
population displacement All Municipalities All Towns 2 000 000
Contain the spread of vector borne diseases from mosquitoes, ticks, sandflies into regions
bordering existing malaria areas that are currently too cold for transmission
All Municipalities All Towns Still to be determined
Manage the increasing water borne and communicable diseases(typhoid fever, cholera &
hepatitis) All Municipalities All Towns Still to be determined
Manage the increasing occupation health problems
All Municipalities All Towns Still to be determined
Minimise potential increased impacts on strategic infrastructure
All Municipalities All Towns Still to be determined
Manage potential decreased income from tourism
All Municipalities All Towns 1 000 000
Manage decreased quality of drinking water All Municipalities All Towns 3 300 000
Manage the quality of water available for irrigation and drinking
All Municipalities All Towns 1 100 000
Coordinate climate change response in the Municipality so that climate change is integrated
across all departments & is prioritised All Municipalities All Towns Still to be determined
To ingrate climate change adaption into municipal strategies & plans like the IDP & SDF so
that it is prioritised across different sectors All Municipalities All Towns Still to be determined
Secure financial resources to respond to climate change
All Municipalities All Towns Still to be determined
Build human capacity to respond to climate change
All Municipalities All Towns Still to be determined
To ensure that information & build awareness on climate change
All Municipalities All Towns Still to be determined
Unfunded Projects

Integrated Development Plan 2017-2022
96
C H A P T E R 8 : P E R F O R M A N C E M A N A G E M E N T
Performance management is a strategic approach to management, which is aimed at equipping leaders, managers,
workers and stakeholders at different levels with a set of tools and techniques to regularly plan, continuously monitor,
periodically measure and review performance of the organization in terms of indicators and targets for efficiency,
effectiveness and impact. It is a requirement for local government in terms of the MSA which requires all municipalities to:
Develop a performance management system;
Set targets, monitor and review performance based indicators linked to their IDP;
Publish an annual report on performance for the councilors, staff, the public and other spheres of government;
Incorporate and report on a set of general indicators prescribed nationally by the minister responsible for local
government;
Conduct an internal audit on performance before tabling the report;
Have their annual performance report audited by the Auditor-General; and,
Involve the community in setting indicators and targets and in reviewing municipal performance.
8 . 1 P e r f o r m a n c e M a n a g e m e n t S y s t e m
Performance information indicates how well a Municipality is meeting its aims and objectives, and which policies and
processes are working. Making the best use of available data and knowledge is crucial for improving the execution of its
mandate. Performance information is key for effective management, including planning, budgeting, and implementation,
monitoring and reporting. Performance information also facilitates effective accountability, enabling councillors, members of
the public to track progress, identify the scope for improvement and better understand the issues involved.
The Municipality delivers services essential to the well-being and development of the communities. To ensure that service
delivery is as efficient and economical as possible; municipalities are required to formulate strategic plans, allocate resources
to the implementation of those plans, and monitor and report the results. Performance information is essential to focus the
attention of the public and oversight bodies on whether municipalities are delivering value for money, by comparing their
performance against their budgets and service delivery plans, and to alert managers to areas where corrective action is
required.
8.1.1 Legislative requirements
Outlined in Section 40 of the MSA, municipalities must establish mechanisms to monitor and review its performance
management system (PMS) to measure, monitor, review, evaluate and improve performance at organisational, departmental
and employee levels. Section 34 of the MSA furthermore points out that the IDP has to be reviewed on an annual basis, and
that during the IDP review process the Key Performance Areas, Key Performance Indicators and Performance Targets be
reviewed and this review will form the basis for the review of the organisational performance management and performance
contracts of Section 57 managers.
The Municipal Planning and Performance Management Regulations (2001) stipulates that a “Municipality’s performance
management system entails a framework that describes and represents how the Municipality’s cycle and processes of
performance planning, monitoring, measurement, review, reporting and improvement will be conducted, organised and
managed, including determining the roles of the different role-players”.
The Municipality have a Performance Management Framework that was approved by Council on 12 December 2008.

Integrated Development Plan 2017-2022
97
8.1.2 Performance Management Framework
The Performance Management Framework of the Municipality is reflected in the diagram below:
8 . 2 O r g a n i s a t i o n a l P e r f o r m a n c e M a n a g e m e n t L i n k e d t o I n d i v i d u a l P e r f o r m a n c e
M a n a g e m e n t
The MSA requires the Municipality to establish a PMS that is commensurate with its resources; best suited to its circumstances
and in line with the IDP. It is required to create a culture of performance throughout the Municipality.
The PMS should obtain the following core elements:
Setting of appropriate performance indicators;
Setting of measurable performance targets;
Agree on performance measurement;
Performance monitoring, reviewing and evaluation;
Continuous performance improvement;
Regular performance reporting; and
Intervention where required.

Integrated Development Plan 2017-2022
98
8 . 3 C o r p o r a t e P e r f o r m a n c e
The performance of the Municipality is evaluated by means of a municipal scorecard (Top Layer SDBIP) at organisational level
and through the service delivery budget implementation plan (SDBIP) at directorate and departmental levels. The Top Layer
SDBIP set our consolidated service delivery targets and provides and overall picture of performance for the Municipality as a
whole, reflecting performance on its strategic priorities.
The departmental SDBIP captures the performance of each defined department which reflects on the strategic priorities of
the Municipality. The SDBIP provides the detail of each outcome for which the senior management is responsible for, in other
words, a comprehensive picture of the performance of each directorate/sub-directorate.
8 . 4 I n d i v i d u a l P e r f o r m a n c e : S e n i o r M a n a g e r s
Performance agreements are concluded with the Municipal Manager and the Section 57 managers annually and includes the
following:
Key performance indicators of the approved Top Layer SDBIP to ensure seamless integration with the IDP, budget and
SDBIP; and
Core Competencies in terms of Regulation 21 of 17 January 2014.
In terms of the legislative requirements:
Performance evaluations are conducted quarterly, with the first and third quarter only verbal. The second and fourth
quarter is formal evaluations
The formal assessments are conducted by a panel
Record must be kept of formal evaluations
The overall evaluation report and results must be submitted to Council
Copies of any formal evaluation of the MM is sent to the MEC for Local Government

Integrated Development Plan 2017-2022
99
8 . 5 P e r f o r m a n c e R e p o r t i n g
Performance is reported on a regular basis and it includes the evaluation of performance, the identification of poor
performance and corrective actions to improve performance.
Quarterly Reports
Reports on the performance in terms of the Top Level SDBIP are compiled and submitted to Council. This report is published
on the municipal website on a quarterly basis.
Mid-Year Assessment
The performance of the first six months of the financial year should be assessed and reported on in terms of Section 72 of the
MFMA. This assessment must include the measurement of performance, the identification of corrective actions and
recommendations for the adjustment of KPI’s, if necessary.
This report is submitted to the Mayor for approval before 25 January of each year and the Mayor submit the report to Council
by 31 January of each year. The report is furthermore published on the municipal website.
Annual Assessment
The performance of the financial year should be assessed at year-end in terms of Section 46 of the MSA. The performance in
terms of the annual targets set will be documented in the Annual Performance Report and the report will be finalized and
submitted to the Office of the Auditor-General by 30 August annually. This report will be included in the Annual Report of the
Municipality. The Annual Report is submitted to Council for approval before 25 January of each year and published for
comment on the municipal website.

Integrated Development Plan 2017-2022
100
LIST OF ABBREVIATIONS
AG Auditor-General
AFS Annual Financial Statements
CAPEX Capital Expenditure
CFO Chief Financial Officer
COGHSTA Department of Cooperative Governance, Human settlements and Traditional Affairs
DWA Department of Water Affairs
EE Employment Equity
EPWP Extended Public Works Programme
DGDS District Growth and Development Strategy
HR Human Resources
IDP Integrated Development Plan
KPI Key Performance Indicator
LED Local Economic Development
LGSETA Local Government Sector Education Training Authority
MFMA Municipal Finance Management Act (Act No. 56 of 2003)
MIG Municipal Infrastructure Grant
MM Municipal Manager
MSA Municipal Systems Act No. 32 of 2000
NGO Non-governmental organisation
NT National Treasury
OPEX Operating expenditure
PMS Performance Management System
PT Provincial Treasury
SALGA South African Local Government Association
SCM Supply Chain Management
SDBIP Service Delivery and Budget Implementation Plan
SDF Spatial Development Framework
WPSP Workplace Skills Plan

Integrated Development Plan 2017-2022
101
L I S T O F T A B L E S
MUNICIPAL POWERS AND FUNCTIONS ......................................5 DISTRICT MUNICIPAL AREA AT A GLANCE ..................................5 DEMOGRAPHIC PROFILE .........................................................9 TOTAL AREA AND POPULATION PER LOCAL MUNICIPALITY ............9 EMPLOYMENT STATUS .........................................................10 ECONOMIC GROWTH TARGETS ..............................................11 DETAILS OF ROADSHOWS HELD .............................................13 SWOT ANALYSIS ................................................................14 MUNICIPAL COMPARATIVE SYNOPSIS .....................................15 LEVEL OF RELIANCE ON GRANTS ............................................15 EMPLOYEE RELATED COSTS ...................................................16 FINANCE CHARGES TO TOTAL OPERATING EXPENDITURE ............17 REPAIRS AND MAINTENANCE ................................................17 ACID TEST RATIO ................................................................18 LONG-TERM DEBT TO ANNUAL INCOME ..................................19 IDP PROCESS .....................................................................21 ROLES AND RESPONSIBILITIES – INTERNAL ...............................21 ROLES AND RESPONSIBILITIES – EXTERNAL ...............................22 NATIONAL KEY PERFORMANCE AREAS ....................................24 SUMMARY OF THE OBJECTIVES OF THE NDP ............................27 GEOGRAPHICAL CONTEXT .....................................................33 ENVIRONMENTAL CONTEXT ..................................................33 BIOPHYSICAL CONTEXT ........................................................34 INFRASTRUCTURE SUMMARY.................................................34 SERVICES AND BACKLOGS .....................................................35 SOCIAL SUMMARY ...............................................................36 DEMOGRAPHICS OF THE MUNICIPALITY ...................................36 POPULATION AND HOUSEHOLD NUMBERS ...............................36 TOTAL POPULATION PROJECTION: GROWTH RATE ....................37 EDUCATION LEVELS .............................................................37 SERVICE DELIVERY LEVELS .....................................................37 HEALTH CARE ....................................................................38 SOCIAL GRANTS ..................................................................38 DWELLINGS .......................................................................38 INFORMAL SETTLEMENTS .....................................................39 ECONOMIC SUMMARY .........................................................39 COMPOSITE INDICES APPLIED TO LOCAL MUNICIPALITIES IN THE
PIXLEY KA SEME MUNICIPAL AREA .........................................41 STRATEGIC SUMMARY .........................................................42 POSSIBLE OPPORTUNITIES ....................................................42 INVESTMENT OPPORTUNITIES AND DISENFRANCHISEMENT ..........43 COMPOSITION OF COUNCIL ..................................................43 EXECUTIVE MAYORAL COMMITTEE .........................................44 DEPARTMENTAL FUNCTIONS .................................................44 STAFF ESTABLISHMENT ........................................................45 WORKFORCE PROFILE ..........................................................45 VACANCY RATE PER POST (SALARY) AND FUNCTIONAL LEVEL .......46 APPROVED POLICIES ............................................................47 MAIN HIGHLIGHTS OF THE PAST IDP PERIOD............................47 MAIN CHALLENGES OF THE PAST IDP PERIOD ...........................48 HOUSING BACKLOGS/NEEDS AS AT MARCH 2015 PER LOCAL
MUNICIPALITY ....................................................................57
VARIOUS TYPOLOGIES IN HOUSING BACKLOG PER MUNICIPALITY 57 CURRENT RUNNING HUMAN SETTLEMENTS PROJECTS IN THE
DISTRICT .......................................................................... 59 STRATEGIC VISION OF THE MUNICIPALITY ............................... 62 NATIONAL, PROVINCIAL AND MUNICIPALITY’S STRATEGIC
ALIGNMENT ...................................................................... 63 MUNICIPAL DEVELOPMENT STRATEGY PER FUNCTION: EXECUTIVE
AND COUNCIL ................................................................... 63 MUNICIPAL DEVELOPMENT STRATEGY PER FUNCTION: FINANCE AND
ADMINISTRATION .............................................................. 67 MUNICIPAL DEVELOPMENT STRATEGY PER FUNCTION: INTERNAL
AUDIT.............................................................................. 68 MUNICIPAL DEVELOPMENT STRATEGY PER FUNCTION: COMMUNITY
AND SOCIAL SERVICES.......................................................... 69 MUNICIPAL DEVELOPMENT STRATEGY PER FUNCTION: HEALTH .. 70 MUNICIPAL DEVELOPMENT STRATEGY PER FUNCTION: PLANNING
AND DEVELOPMENT ........................................................... 72 MUNICIPAL DEVELOPMENT STRATEGY PER FUNCTION: OTHER.... 73 5 YEAR CORPORATE SCORECARD: DEVELOPMENT AND SERVICE
DELIVERY PRIORITIES .......................................................... 84 SECTORAL CONTRIBUTIONS: DEPARTMENT OF WATER AND
SANITATION ...................................................................... 85 SECTORAL CONTRIBUTIONS: DEPARTMENT OF EDUCATION ........ 89 DEPARTMENT OF COOPERATIVE GOVERNANCE, HUMAN
SETTLEMENTS AND TRADITIONAL AFFAIRS .............................. 90 ALLOCATIONS IN TERMS OF THE DIVISION OF REVENUE BILL (DORA)
...................................................................................... 91 ALLOCATIONS IN TERMS OF PROVINCIAL GAZETTE .................... 91 OPERATING BUDGET: REVENUE AND EXPENDITURE .................. 92 OPERATING BUDGET: REVENUE BY DEPARTMENT AND DIVISION . 93 OPERATING BUDGET: EXPENDITURE BY DEPARTMENT AND DIVISION
...................................................................................... 94 UNFUNDED PROJECTS ......................................................... 95
L I S T O F M A P S
MAP 1.: LOCATION IN THE PROVINCE .................................................. 6 MAP 2.: DISTRICT MUNICIPAL AREA DIVIDED INTO LOCAL MUNICIPALITIES . 8 MAP 3.: MUNICIPAL AREA (REGIONAL LOCATION AND MAIN TOWNS)....... 8
L I S T O F G R A P H S
GRAPH 1.: LEVEL OF RELIANCE ON GRANTS............................................ 16 GRAPH 2.: EMPLOYEE RELATED COSTS .................................................. 16 GRAPH 3.: FINANCE CHARGES TO TOTAL OPERATING EXPENDITURE ........... 17 GRAPH 4.: REPAIRS AND MAINTENANCE ............................................... 18 GRAPH 5.: ACID TEST RATIO ............................................................... 18 GRAPH 6.: LONG-TERM DEBT TO ANNUAL INCOME ................................. 19 GRAPH 7.: NUMBER OF HOUSEHOLDS LIVING IN INFORMAL STRUCTURES .... 58 GRAPH 8.: EXPENDITURE PER FUNCTION ............................................... 92 GRAPH 9.: EXPENDITURE PER OBJECTIVE ............................................... 94

ANNEXURE A

Pixley Ka Seme Climate Change Plan
Local Government Climate
Change Support Program
2016Pixley Ka Seme DM Climate Change Response Plan
Pixley Ka Seme Climate Change Plan
Presentation Contents
1. Climate Change Plan Development
2. Activities to date
3. Climate Change Vulnerability Assessment Results
4. Draft Climate Change Response Actions

Pixley Ka Seme Climate Change Plan
Climate Change Plan Development
Developed through the Local Government Climate Change Support Program
(LGCCS)
1. First Step - Conducting a climate change vulnerability assessment
2. Second Step - Developing climate change responses
3. Draft plan in place for review
http://www.letsrespondtoolkit.org/
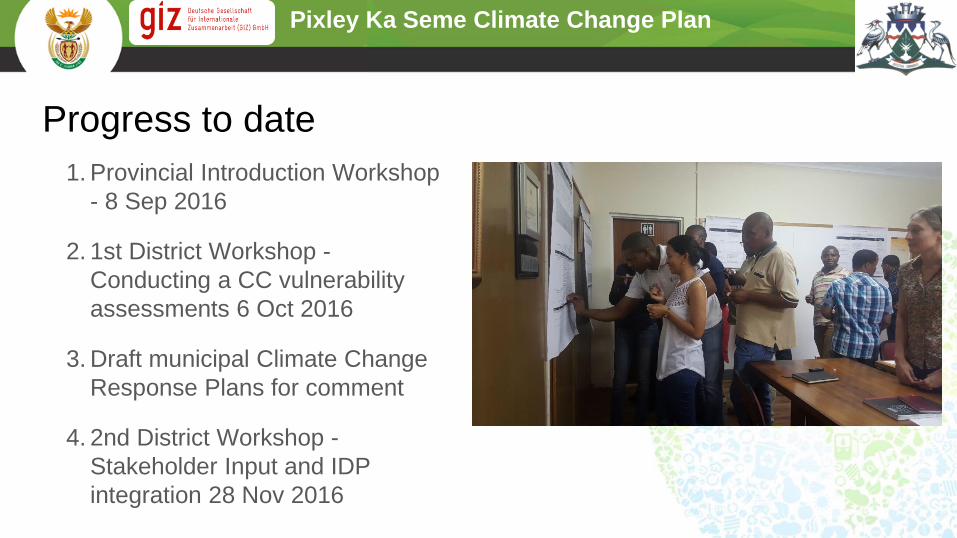
Pixley Ka Seme Climate Change Plan
Progress to date
1. Provincial Introduction Workshop
- 8 Sep 2016
2. 1st District Workshop -
Conducting a CC vulnerability
assessments 6 Oct 2016
3. Draft municipal Climate Change
Response Plans for comment
4. 2nd District Workshop -
Stakeholder Input and IDP
integration 28 Nov 2016

Pixley Ka Seme Climate Change Plan
Agriculture

Pixley Ka Seme Climate Change Plan
Priority Indicators: Agriculture
Theme Indicator Title
Agriculture Change in grain (maize, wheat & barley) production
Agriculture Increased risks to livestock

Pixley Ka Seme Climate Change Plan
% of Households involved in agricultural activities

Pixley Ka Seme Climate Change Plan
Responses: Agriculture
Project: Manage the change in grain production
1. Conduct research into understanding the impacts of climate change on grain
production and possible alternative crops
2. Conduct research on climate resilient cultivars
3. Promote knowledge generation, knowledge sharing, stakeholder participation and
awareness-raising in grain production.
4. Implement evidence based monitoring initiatives that feed into management
systems.
5. Identify climate resilient land-uses that will support the agricultural industry’s
efforts to exploit new agricultural opportunities, new areas and new crops thus
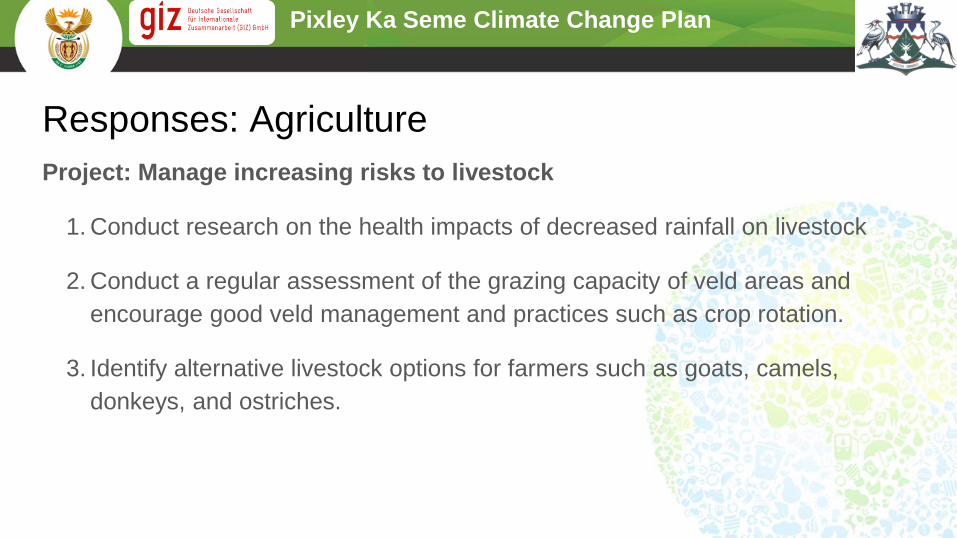
Pixley Ka Seme Climate Change Plan
Responses: Agriculture
Project: Manage increasing risks to livestock
1. Conduct research on the health impacts of decreased rainfall on livestock
2. Conduct a regular assessment of the grazing capacity of veld areas and
encourage good veld management and practices such as crop rotation.
3. Identify alternative livestock options for farmers such as goats, camels,
donkeys, and ostriches.

Pixley Ka Seme Climate Change Plan
Biodiversity and Environment

Pixley Ka Seme Climate Change Plan
Priority Indicators: Biodiversity and Environment
Theme Indicator Title
Biodiversity and
Environment
Increased impacts on environment due to land-use
change
Biodiversity and
Environment
Loss of Priority Wetlands and River ecosystems

Pixley Ka Seme Climate Change Plan
Responses: Biodiversity and Environment
Project: Manage Increased impacts on environment due to land-use change
1. Commission research on hydrological fracking for all critical ecosystems
2. Commission research on the social impact of the Square Kilometre Array
3. Conduct research and identify sectors with employment growth as climate
changes
4. Identify alternative employment opportunities for individuals that will be
affected by implementation of the SKA project.
5. Increased awareness for developers, and development of stricter by-laws
promoting green developments.
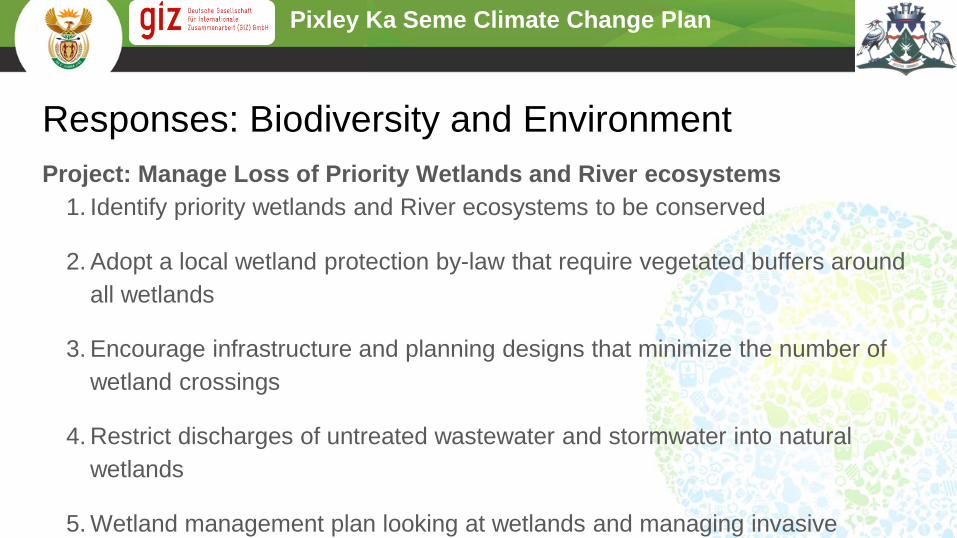
Pixley Ka Seme Climate Change Plan
Responses: Biodiversity and Environment
Project: Manage Loss of Priority Wetlands and River ecosystems
1. Identify priority wetlands and River ecosystems to be conserved
2. Adopt a local wetland protection by-law that require vegetated buffers around
all wetlands
3. Encourage infrastructure and planning designs that minimize the number of
wetland crossings
4. Restrict discharges of untreated wastewater and stormwater into natural
wetlands
5. Wetland management plan looking at wetlands and managing invasive
wetland plants

Pixley Ka Seme Climate Change Plan
Human Health

Pixley Ka Seme Climate Change Plan
Priority Indicators: Human Health
Theme Indicator Title
Human Health Health impacts from increased storm events
Human Health Increased vector borne diseases from spread of mosquitoes,
ticks, sandflies, and blackflies
Human Health Increased water borne and communicable diseases (e.g typhoid
fever, cholera & hepatitis)
Human Health Increased Occupational health problems

Pixley Ka Seme Climate Change Plan
Responses: Human Health
Project: Manage health impacts from increased storm events
1. Develop early warning strategies that create awareness around flooding
events. These strategies should incorporate the use of alerts.
2. Increase the storage capacity for clean water to lessen the impact from
increased storm events on infrastructure such as wastewater treatment
plants.
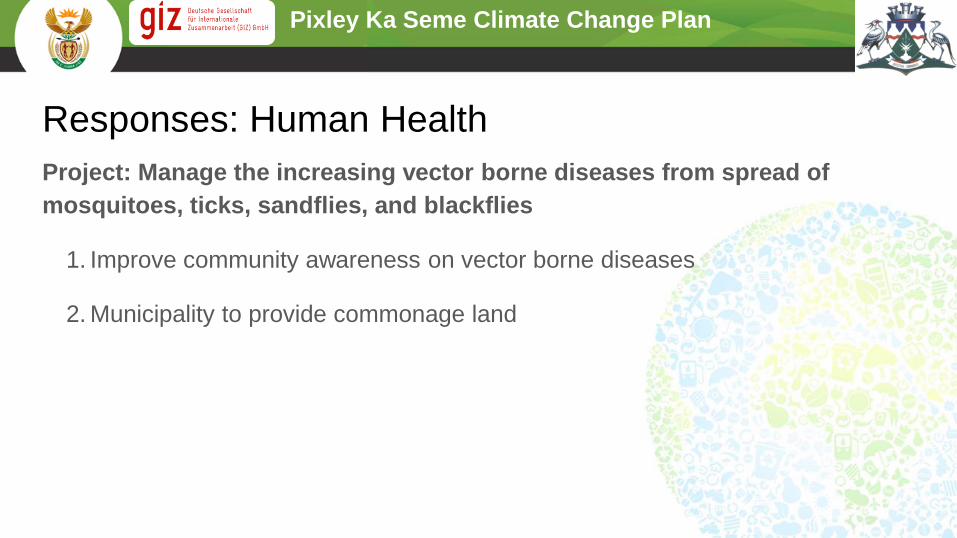
Pixley Ka Seme Climate Change Plan
Responses: Human Health
Project: Manage the increasing vector borne diseases from spread of
mosquitoes, ticks, sandflies, and blackflies
1. Improve community awareness on vector borne diseases
2. Municipality to provide commonage land
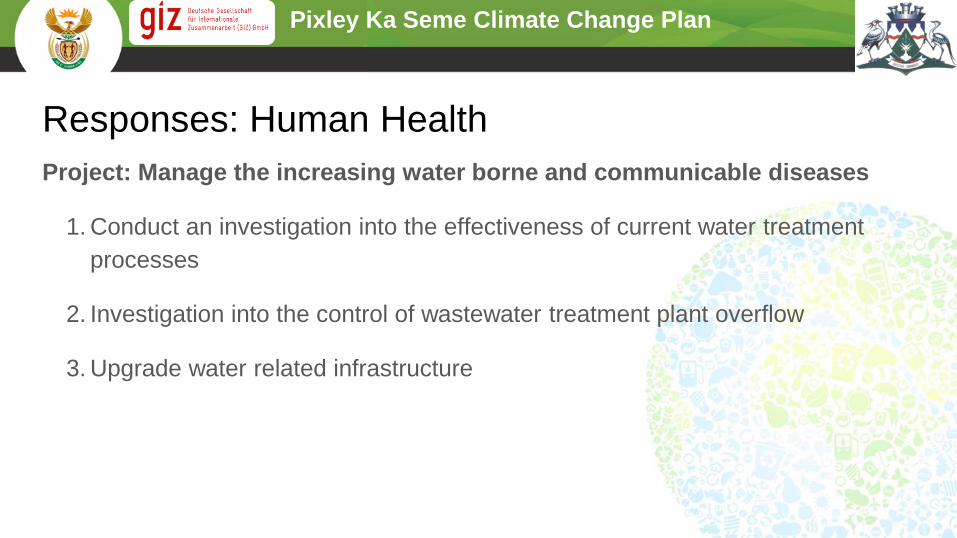
Pixley Ka Seme Climate Change Plan
Responses: Human Health
Project: Manage the increasing water borne and communicable diseases
1. Conduct an investigation into the effectiveness of current water treatment
processes
2. Investigation into the control of wastewater treatment plant overflow
3. Upgrade water related infrastructure
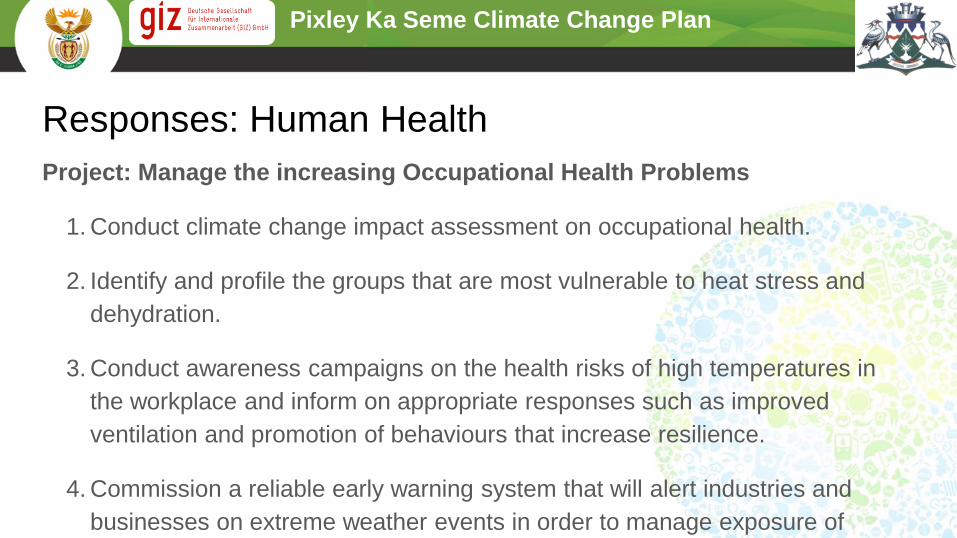
Pixley Ka Seme Climate Change Plan
Responses: Human Health
Project: Manage the increasing Occupational Health Problems
1. Conduct climate change impact assessment on occupational health.
2. Identify and profile the groups that are most vulnerable to heat stress and
dehydration.
3. Conduct awareness campaigns on the health risks of high temperatures in
the workplace and inform on appropriate responses such as improved
ventilation and promotion of behaviours that increase resilience.
4. Commission a reliable early warning system that will alert industries and
businesses on extreme weather events in order to manage exposure of
employees.

Pixley Ka Seme Climate Change Plan
Human Settlements

Pixley Ka Seme Climate Change Plan
Priority Indicators: Human Settlements
Theme Indicator Title
Human Settlements Increased impacts on strategic infrastructure
Human Settlements Decreased income from tourism

Pixley Ka Seme Climate Change Plan
Responses: Human Settlements
Project: Manage potential increased impacts on strategic infrastructure
1. Conduct a review of the disaster management plan to incorporate climate
change impacts on infrastructure (Including tourism infrastructure)
2. Prioritise funding for the implementation of a new disaster management plan
and the appointment of Disaster Management staff.
3. Provide capacity building initiatives for staff in the disaster management unit
to enable better response to climate change impacts on strategic
infrastructure.
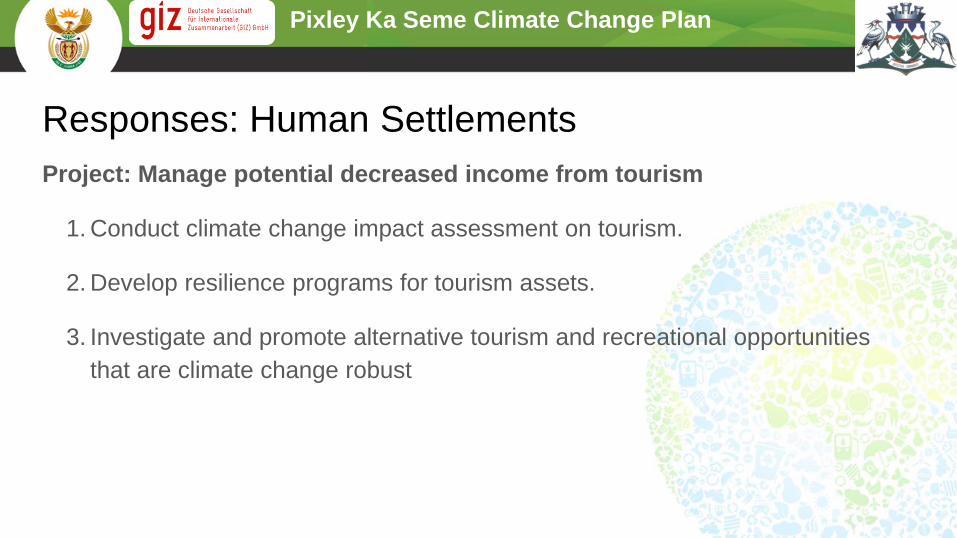
Pixley Ka Seme Climate Change Plan
Responses: Human Settlements
Project: Manage potential decreased income from tourism
1. Conduct climate change impact assessment on tourism.
2. Develop resilience programs for tourism assets.
3. Investigate and promote alternative tourism and recreational opportunities
that are climate change robust

Pixley Ka Seme Climate Change Plan
Cross Cutting

Pixley Ka Seme Climate Change Plan
Responses: Cross Cutting
Project: Coordinate climate change response in the municipality
1. Select an appropriate institutional structure within the Municipality to
coordinate climate change response.
2. Establish platforms for council and mayors to engage with climate change
adaptation initiatives.
3. Select a climate change champion for the District Municipality.
4. Select a climate change champion for each Local Municipality.
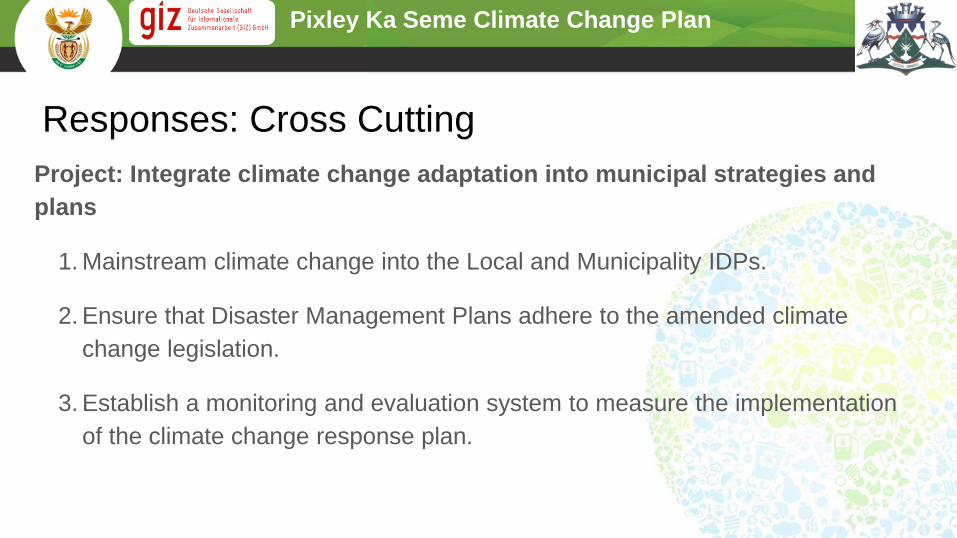
Pixley Ka Seme Climate Change Plan
Responses: Cross Cutting
Project: Integrate climate change adaptation into municipal strategies and
plans
1. Mainstream climate change into the Local and Municipality IDPs.
2. Ensure that Disaster Management Plans adhere to the amended climate
change legislation.
3. Establish a monitoring and evaluation system to measure the implementation
of the climate change response plan.
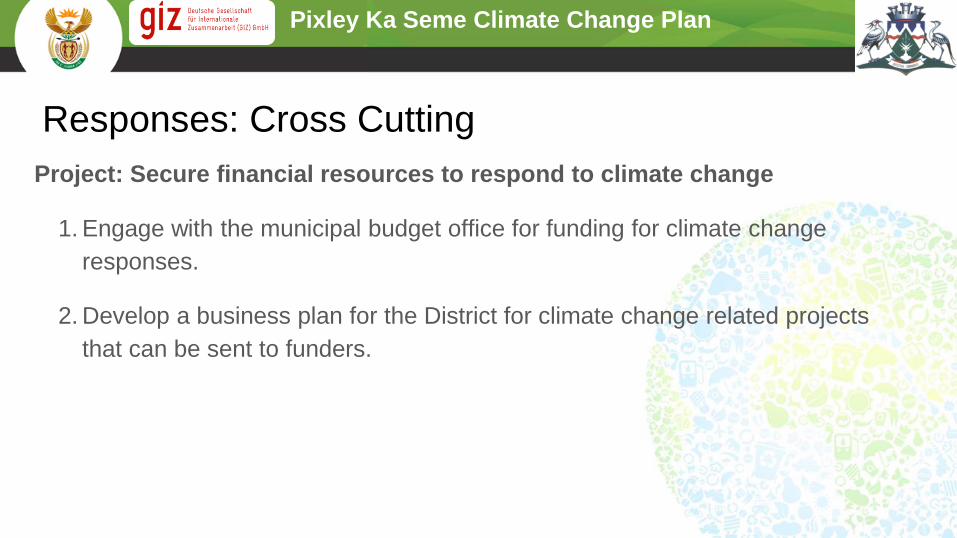
Pixley Ka Seme Climate Change Plan
Responses: Cross Cutting
Project: Secure financial resources to respond to climate change
1. Engage with the municipal budget office for funding for climate change
responses.
2. Develop a business plan for the District for climate change related projects
that can be sent to funders.

Pixley Ka Seme Climate Change Plan
Responses: Cross Cutting
Project: Build human capacity to respond to climate change
1. Build capacity of municipal staff engaging with climate change in project
management, drafting business plans and human resources management.
2. Regularly engage communities regarding climate change adaptation,
response and capacity building initiatives through existing structures and
committees.

Pixley Ka Seme Climate Change Plan
Local Government Climate
Change Support Program
2016Pixley Ka Seme DM Climate Change Response Plan

ANNEXURE B

MARCH 2017
RURAL DEVELOPMENT PLAN
PIXLEY KA SEME DISTRICT MUNICIPALITY

P a g e | 2
PIXLEY KA SEME RURAL DEVELOPMENT PLAN – EXECUTIVE SUMMARY
PIXLEY KA SEME DISTRICT
RURAL DEVELOPMENT PLAN
Northern Cape Province
RURAL DEVELOPMENT PLAN
MASWANA JV
OMNI Building (Ground Floor), 73 Aliwal Street, Bloemfontein, 9300 &
186 Du Toitspan Road, Kimberley, 8301
PO Box 43585, Heuwelsig, 9332 or PO Box 580, Kimberley, 8301
Tel: (051) 430 9139 or Tel: (053) 831 1889
Fax: 086 694 6771
Email: [email protected] or [email protected]
15 MARCH 2017

P a g e | 3
PIXLEY KA SEME RURAL DEVELOPMENT PLAN – EXECUTIVE SUMMARY
EXECUTIVE SUMMARY

P a g e | 1
RURAL DEVELOPMENT PLAN FOR THE PIXLEY KA SEME DISTRICT MUNICIPALITY
EXECUTIVE SUMMARY
The final Pixley ka Seme District Rural Development Plan has been
completed by the National Department of Rural Development and Land
Reform for the 2016/17 financial year and is to be included as an
annexure to the Integrated Development Plan (IDP) review 2017/18
report. The formulation and adoption of the Rural Development Plan is
not a legal requirement. However through the Spatial Development
Framework review or preparation cognisance of the rural development
policies and plans proposed should form part of the SDF review process as
per Section 12(1)(c) of the Spatial Planning and Land Use Management Act
(SPLUMA , Act 16 of 2013) :
Section 12(1): The national and provincial spheres of government and
each municipality must prepare spatial development frameworks that:
a) Interpret and represent the spatial development vision of the responsible sphere of government and competent authority;
b) Are informed by a long-term spatial development vision statement and plan;
c) Represent the integration and trade-off of all relevant sector policies and plans;
The Spatial Planning and Land Use Management Act (SPLUMA) aims to
provide for a uniform system of regulating land development and spatial
planning throughout the country. Given the objects of the SPLUMA, the
implementation of the rural development plan’s activities that seek to
transform rural areas should be guided by the provisions of the Act. As
such, the implementation of the rural development plan should give effect
to the SPLUMA development principles namely; spatial justice, spatial
sustainability, spatial resilience and good administration.
The Spatial Development Framework (SDF) is a legal requirement, and as
such fulfils the requirements as set out within the Municipal Systems Act
(MSA), No. 32 of 2000. The SDF is an integral component of the Integrated
Development Plan (IDP); it translates the IDP spatially and shows how the
implementation of the IDP should occur in space. It also guides the overall
spatial distribution of current and desirable land uses within a
Municipality in order to give effect to the vision, goals and objectives of
the District.
The National Development Plan (NDP) as well as the New Growth Path
(NGP) acknowledges that rural development remains a critical aspect for
employment and food security in rural areas. The NDP states that a rural
development plan needs to ensure greater economic and potential
opportunities to overcome poverty and inequality in rural areas. To
achieve this, the NDP emphases the need to fast-track the land reform
programme as well as job- creation strategies that will guarantee that the
rural community have access to sustainable livelihoods. Furthermore, the
NDP contends that a rural development plan must serve to ensure basic
services, health care, education and food security. It also argues that a
rural development plan must make sure that strategies for rural towns are
tailor-made according to the varying opportunities in each area. An
emphasis is also made for intergovernmental relations to improve rural
governance and encourage multi-stakeholder participation in the
development process.
The Comprehensive Rural Development Programme (CRDP) advocates for
the creation vibrant, equitable and sustainable rural communities with
emphasis on the redistribution of 30% of the country’s agricultural land;
improving food security of the rural poor; creation of business
opportunities, de-congesting and rehabilitation of over-crowded former
homeland areas; and expanding opportunities for women, youth, people
with disabilities and older persons who stay in rural areas. To attain this

P a g e | 2
RURAL DEVELOPMENT PLAN FOR THE PIXLEY KA SEME DISTRICT MUNICIPALITY
goal, the CRDP proposes a three-pronged strategy based on a coordinated
and integrated broad-based agrarian transformation; strategically
increasing rural development; and an improved land reform programme.
The Agriculture Policy Action Plan (APAP) seeks to assist in the
achievement of Outcome 4 (Decent Employment through Inclusive
Growth), Outcome 7 (Comprehensive Rural Development and Food
Security) and Outcome 10 (environmental assets and natural resources
that are well protected and continually enhanced) of the Medium Term
Strategic Framework (MTSF) (2014-2019) and aligns itself to the NGP and
NDP.
The Northern Cape Provincial Growth and Development Strategy
(NCPGDS) connect policy, high level strategies, departmental strategic
plans and budgets for the development of the entire Province. The
NCPGDS states that the vision of the Province is to focused on “building a
prosperous, sustainable growing provincial economy to reduce poverty
and improve social development”. It further proposes a set of guiding
principles to inform development planning activities in order to realise
this vision.
The Provincial Spatial Development Framework (NCPSDF) is a policy
document that promotes a ‘developmental state’ in accordance with
national and provincial legislation and directives. The NCPSDF provides an
appropriate spatial and strategic context for future land- uses throughout
the Province. It is thus an expression of the mental image, vision and
aspirations which the people of the Northern Cape have for their
province.
To boost rural economies, government has initiated the establishment of
Agri-Parks throughout the country. The Agri-Park initiatives are being
developed in each of the identified districts to aid in the reduction of
extreme poverty and underdevelopment. The Agri-Park concept refers to
a combination of a working farm and a municipal park that is located at
the urban edge. It serves as a transition or buffer zone between urban and
agricultural uses.
It is within the above context that rural development is regarded as a
strategic intervention in the Pixley ka Seme District. Together with other
municipals’ development programmes implemented through the IDP, this
RDP in the Pixley ka Seme District seeks to promote sustainable
livelihoods, facilitate the co-coordinated implementation of sector policies
and strategies and the socio-economic development of its local
municipalities. In so doing, the RDP aims to transform the Pixley ka Seme
District into vibrant, equitable and sustainable rural communities with
emphasis on employment creation and food security for all.
It also intends to focus on establishing rural business initiatives, agro-
industries, cooperatives, cultural initiatives, rural settings; empowering
rural people and communities (especially women and youth); and
revitalising old and upgrading economic, social, information and
communications infrastructure, public amenities and facilities in villages
and small rural towns.
BACKGROUND OF THE DISTRICT
The Pixley ka Seme district lies in the south-east of the Northern Cape
province and shares its borders with three other provinces, namely, the
Free State province to the east, the Eastern Cape to the south-east and
the Western Cape to the south-west. It is one of five district municipalities
in the province and is the second largest covering a total surface area of
102 727 km². It consists of 8 category “B” Municipalities, namely :
Emthanjeni, Kareeberg, Renosterberg, Siyancuma, Siyathemba,

P a g e | 3
RURAL DEVELOPMENT PLAN FOR THE PIXLEY KA SEME DISTRICT MUNICIPALITY
Thembelihle, Ubuntu and Umsobomvu. Emthanjeni is the largest and
Renosterberg the smallest of these municipalities.
The District municipal area is ideally located at some key major routes
such as the N1 from the Limpopo Province, Pretoria and Johannesburg to
Cape Town. The N9 route from Colesberg joining the N10 to Port Elizabeth
and the rest of the Eastern Cape, the N12 route form Johannesburg via
Kimberley to Cape Town, the N10 from Namibia via Upington linking
Namibia to the Eastern Cape go through the region. The railway network
around De Aar is one of the largest in South Africa. In addition to this
there is the mighty Orange River which flows through the heart of the
District Municipal area. Three major dams are within the municipal area,
namely: Gariep Dam, Vanderkloof Dam and Boegoeberg Dam. Because of
the Orange River and the Vaal River flowing through the area there is a lot
of intensive crop farming activities on the banks of these rivers.
MAIN ECONOMIC SECTORS
a) AGRICULTURE
Wheat maize and lucerne are very important crops but the possibility
exists that there can be a shift to alternative high value crops. Small stock
farming is one of the attributes of the region and therefore the region has
a strong history of wool farming and this can benefit farm diversification
into the more lucrative ventures, like cashmere production.
b) STOCK FARMING
Stock farming takes place throughout the whole region and is mainly
focussed on small stock, consisting of sheep and goats. The sheep farming
produces mutton and wool. There are several abattoirs in the region with
the largest located in the Emthanjeni Municipal Area with a capacity of
2000 sheep slaughtered per day. At present up to 1000 sheep are
slaughtered daily in Umsobomvu Municipal Area. The huge potential for
the region lies in adding value to the products within the area. At present
products are leaving the areas in unprocessed form. The area also
produces large quantities of wool that are processed in the Eastern Cape.
The area is surely the largest wool-producing region in South Africa and
again offers the potential of beneficiation within the region.
Irrigation The Orange River and the Vaal River run through the region and
irrigation farming is confined to the areas where irrigation farming is
practised along these rivers. Irrigation farming forms a large part of the
agricultural activities in the region and numerous products are cultivated
along the rivers. The products include maize, peanuts, lucerne, grapes, dry
beans, soya beans, potatoes, olives, pop corn, pecan nuts, pistachio nuts
and cotton. These products also leave the area in the raw and there is
potential for beneficia tion within the Pixley Region. Products produced
under the climatic conditions in the region are considered as some of the
healthiest available.
c) TOURISM
Tourism in the district is strengthened by several government owned
projects, such as the Rolfontein outdoor Wilderness school, and the re-
development of several resorts and facilities (the Wildebeeest Kuilrock Art
centre, the Douglas holiday resort and Die bos resort in Prieska. A
Sanparks reserve is also situated in the District (Mokala National Park).
d) GAME FARMING
The region has a long history of game farming. Game farming industry
provides possibilities of a reasonable income. The Orange and Vaal rivers

P a g e | 4
RURAL DEVELOPMENT PLAN FOR THE PIXLEY KA SEME DISTRICT MUNICIPALITY
are major tourist attraction and the district also boosts two game
reserves.
e) INDUSTRY
Industries in the area are mostly confined to light industries. The rivers
provide a constant supply of water in certain parts of the region, which at
least offer the potential of using the products produced in the area as a
basis for beneficiation. The N1 and N12 routes that link the two main
economic centres in South Africa, i.e, Gauteng and the Western Cape
carry thousands of tons of valuable goods and material every day to all
parts of the country. No fewer than 30 trains pass through the railway
network around De Aar and Noupoort daily in both directions, to and from
these main economic centres.
The N9 and N10 routes link Namibia and Gauteng with the coastline of
Port Elizabeth, which is also the nearest export harbour for the Pixley
region. On average 9 freight trains between Gauteng and the Western
Cape pass through the station at De Aar every day, 4 to Port Elizabeth, 2
to Namibia and 10 from De Aar to Kimberley. The station at De Aar has
direct or indirect links to virtually every corner of South Africa. An average
of 1 000 000 tons are conveyed through this station every month and the
capacity exists to increase this tonnage with ease. Eskom, the country’s
largest supplier of electricity, has a major presence in the Pixley as a
regional Office of Eskom is situated in Colesberg and Eskom is represented
in nearly every town in the district. One of Eskom's largest sub-stations –
Hydra – is located near De Aar, supplying high voltage power especially to
the Western Cape and the rural areas.
f) ELECTRICITY
This electricity is mainly generated in the Northern Areas of the country
and distributed to the surrounding smaller towns of the southern regions
via the central corridor. Spoornet's power lines also originate at Hydra.
The station is staffed by 23 trained personnel. The Vanderkloof Dam is
used by Eskom to generate peak demand electricity. The 112m high dam
wall houses two 120-megawatt generators, which supply peak demand.
Power is generated by turbine engines with an outflow of 150 cubic
metres of water per second, into the second largest dam in South Africa.
g) MINERAL RESOURCE
Pixley ka seme district has a few modest mineral wealth. The most
important mines which made a significant contribution to the economy
were copper, asbestos and diamond (Glen Ellen and Keoghs for asbestos,
copper ton for copper and Franshek for diamond). Recent information
indicates that uranium and gas deposits are also found in the region. The
copper mine was closed down because of its uneconomical use, asbestos
mine closed because of its harmful disease to human kind and the
diamond mine is about to close because of the small deposits it produces
as required by the Department of Mining. There are some other semi
precious stones found in some municipal areas like the tiger’s eye and
chalcedonies for jewelry production. In addition there are also a few scale
low yielding diamonds site at Schmidsdrift in Siyancuma municipal area
which could make marginal contribution to the economy and export
earnings. Latest information with regard to this mineral indicates that the
mining company that was operating stopped because it was operating
illegally. According to the District Growth and Development Strategy
(DGDS) the district and local municipalities together with relevant
provincial and national departments plan to emphasize the need to
intensify mineral exploration and to update knowledge on the district’s
mineral resources.
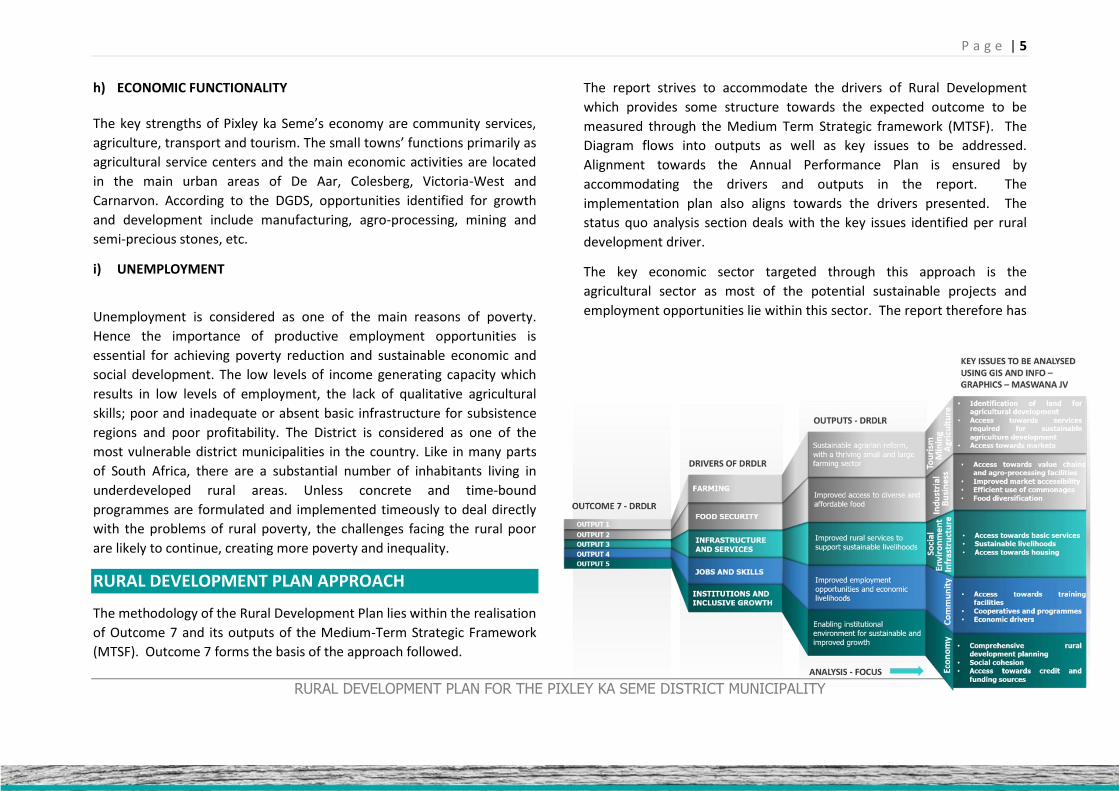
P a g e | 5
RURAL DEVELOPMENT PLAN FOR THE PIXLEY KA SEME DISTRICT MUNICIPALITY
h) ECONOMIC FUNCTIONALITY
The key strengths of Pixley ka Seme’s economy are community services,
agriculture, transport and tourism. The small towns’ functions primarily as
agricultural service centers and the main economic activities are located
in the main urban areas of De Aar, Colesberg, Victoria-West and
Carnarvon. According to the DGDS, opportunities identified for growth
and development include manufacturing, agro-processing, mining and
semi-precious stones, etc.
i) UNEMPLOYMENT
Unemployment is considered as one of the main reasons of poverty.
Hence the importance of productive employment opportunities is
essential for achieving poverty reduction and sustainable economic and
social development. The low levels of income generating capacity which
results in low levels of employment, the lack of qualitative agricultural
skills; poor and inadequate or absent basic infrastructure for subsistence
regions and poor profitability. The District is considered as one of the
most vulnerable district municipalities in the country. Like in many parts
of South Africa, there are a substantial number of inhabitants living in
underdeveloped rural areas. Unless concrete and time-bound
programmes are formulated and implemented timeously to deal directly
with the problems of rural poverty, the challenges facing the rural poor
are likely to continue, creating more poverty and inequality.
RURAL DEVELOPMENT PLAN APPROACH
The methodology of the Rural Development Plan lies within the realisation
of Outcome 7 and its outputs of the Medium-Term Strategic Framework
(MTSF). Outcome 7 forms the basis of the approach followed.
The report strives to accommodate the drivers of Rural Development
which provides some structure towards the expected outcome to be
measured through the Medium Term Strategic framework (MTSF). The
Diagram flows into outputs as well as key issues to be addressed.
Alignment towards the Annual Performance Plan is ensured by
accommodating the drivers and outputs in the report. The
implementation plan also aligns towards the drivers presented. The
status quo analysis section deals with the key issues identified per rural
development driver.
The key economic sector targeted through this approach is the
agricultural sector as most of the potential sustainable projects and
employment opportunities lie within this sector. The report therefore has
P a g e | 6
RURAL DEVELOPMENT PLAN FOR THE PIXLEY KA SEME DISTRICT MUNICIPALITY
a strong focus on agricultural development.
KEY FOCUS
Six (6) critical focus areas have been identified in an attempt to unlock the
rural status quo:
FOCUS AREA 1 : FOOD SECURITY
Food security is a much debated and sensitive topic in South Africa and
needs to be prioritized. In essence, the formulation of the rural
development plan arises from the unsatisfactory performance of the
agricultural sector, the economic base of the rural areas. The performance
of most food crops has remained poor, mainly due to extreme rainfall
patterns and low technology used. As a result the food security situation
has remained one of the major problems in the rural areas. There is need
to increase agricultural productivity by improving markets, private sector
investment, physical infrastructure, human capital, and demand–driven
research and extension services. Although there have been various efforts
to promote appropriate technology, the use of science and technology in
agriculture is still very limited;
A Food basket approach was followed to determine the basic food
demands per food group of rural communities, especially addressing the
poorest of the poor. Existing studies on food basket requirements and
demands where used with a scenario laid out to utilize the food basket
requirements multiplied with the number of poor households (The poor
household threshhold is discussed in the report). The calculation provides
some quantitative food basket needs for households on a monthly basis.
The Rural Development focus is therefore to utilize or target existing land
reform and agricultural projects towards a unique ring fenced market
through proper transportation routes, fresh produce markets, collection
and distribution routes and agricultural related cooperatives to benefit
the emerging farming market.
Project prioritization was based on the food basket approach to
specifically target the cereal (bread, flower), Beef (mutton, beef, and
poultry), Fruit and Vegetables (Apples, Tomatoes, and Soya etc.) and Dairy
food groups. Beef, Poultry and Bread are amongst the highest
contributions towards the food basket and cost savings especially through
improved transportation and local produce would decrease the value of
these items, thus improving the lives of the poorest of the poor. A strong
“produce local” campaign is driving the projects proposed in this plan.

P a g e | 7
RURAL DEVELOPMENT PLAN FOR THE PIXLEY KA SEME DISTRICT MUNICIPALITY
FOCUS AREA 2 : AGRI-PARK ALIGNMENT
The Agri-park concept is critical towards the successful implementation of
the plan and where as far possible assessments where done to prioritize
Farming Production Supporting Units (FPSU’s) and projects per FPSU. As
funds are limited, not all projects could be implemented with immediate
effect. This necessitated the prioritization of primary production prior to
processing facilities. Many of the processing facilities proposed can’t be
viable without optimizing the primary production first.
Alignment towards the Agri-park concept is of utmost importance which
required all projects, ideas and concepts to align to this concept,
this ensures that projects can be funded and support as part of this
national initiative.
FOCUS AREA 3 : AGRICULTURAL VALUE CHAINS
All possible value chain opportunities is discussed in the report with
certain value chains posing to most opportunities for processing
and beneficiation towards the local communities being mutton,
wool, grain and vegetable value chains. Goats also present many
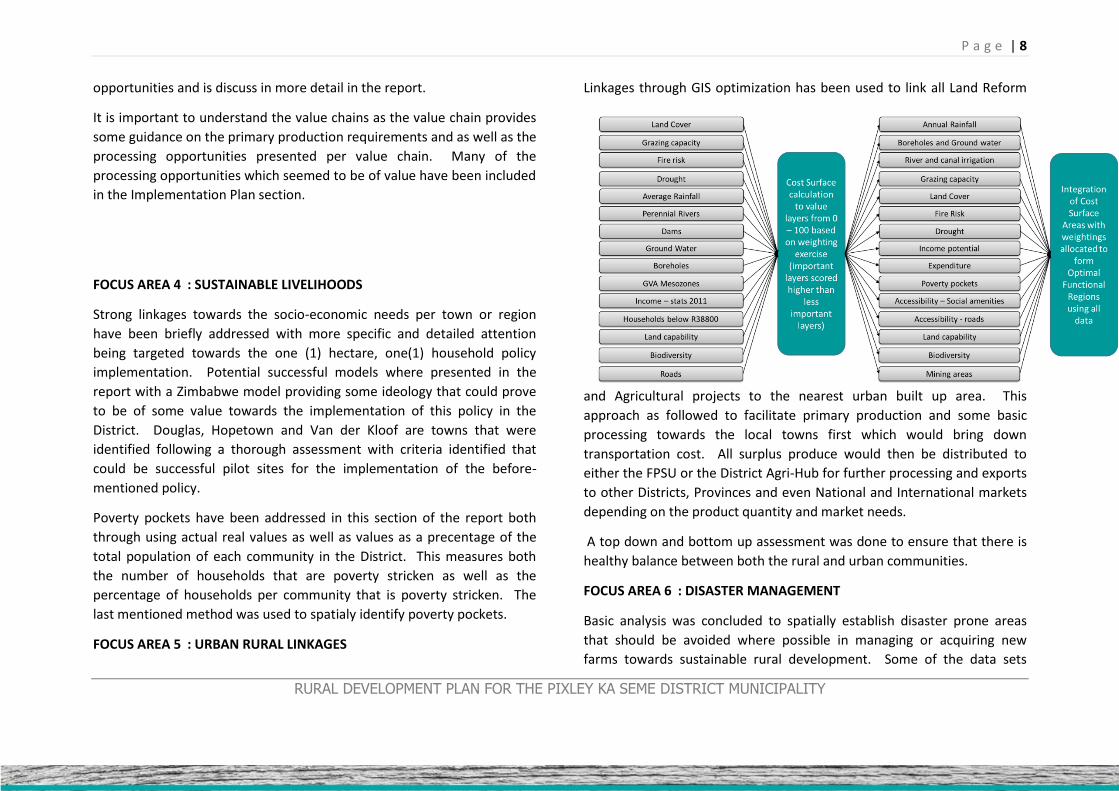
P a g e | 8
RURAL DEVELOPMENT PLAN FOR THE PIXLEY KA SEME DISTRICT MUNICIPALITY
opportunities and is discuss in more detail in the report.
It is important to understand the value chains as the value chain provides
some guidance on the primary production requirements and as well as the
processing opportunities presented per value chain. Many of the
processing opportunities which seemed to be of value have been included
in the Implementation Plan section.
FOCUS AREA 4 : SUSTAINABLE LIVELIHOODS
Strong linkages towards the socio-economic needs per town or region
have been briefly addressed with more specific and detailed attention
being targeted towards the one (1) hectare, one(1) household policy
implementation. Potential successful models where presented in the
report with a Zimbabwe model providing some ideology that could prove
to be of some value towards the implementation of this policy in the
District. Douglas, Hopetown and Van der Kloof are towns that were
identified following a thorough assessment with criteria identified that
could be successful pilot sites for the implementation of the before-
mentioned policy.
Poverty pockets have been addressed in this section of the report both
through using actual real values as well as values as a precentage of the
total population of each community in the District. This measures both
the number of households that are poverty stricken as well as the
percentage of households per community that is poverty stricken. The
last mentioned method was used to spatialy identify poverty pockets.
FOCUS AREA 5 : URBAN RURAL LINKAGES
Linkages through GIS optimization has been used to link all Land Reform
and Agricultural projects to the nearest urban built up area. This
approach as followed to facilitate primary production and some basic
processing towards the local towns first which would bring down
transportation cost. All surplus produce would then be distributed to
either the FPSU or the District Agri-Hub for further processing and exports
to other Districts, Provinces and even National and International markets
depending on the product quantity and market needs.
A top down and bottom up assessment was done to ensure that there is
healthy balance between both the rural and urban communities.
FOCUS AREA 6 : DISASTER MANAGEMENT
Basic analysis was concluded to spatially establish disaster prone areas
that should be avoided where possible in managing or acquiring new
farms towards sustainable rural development. Some of the data sets
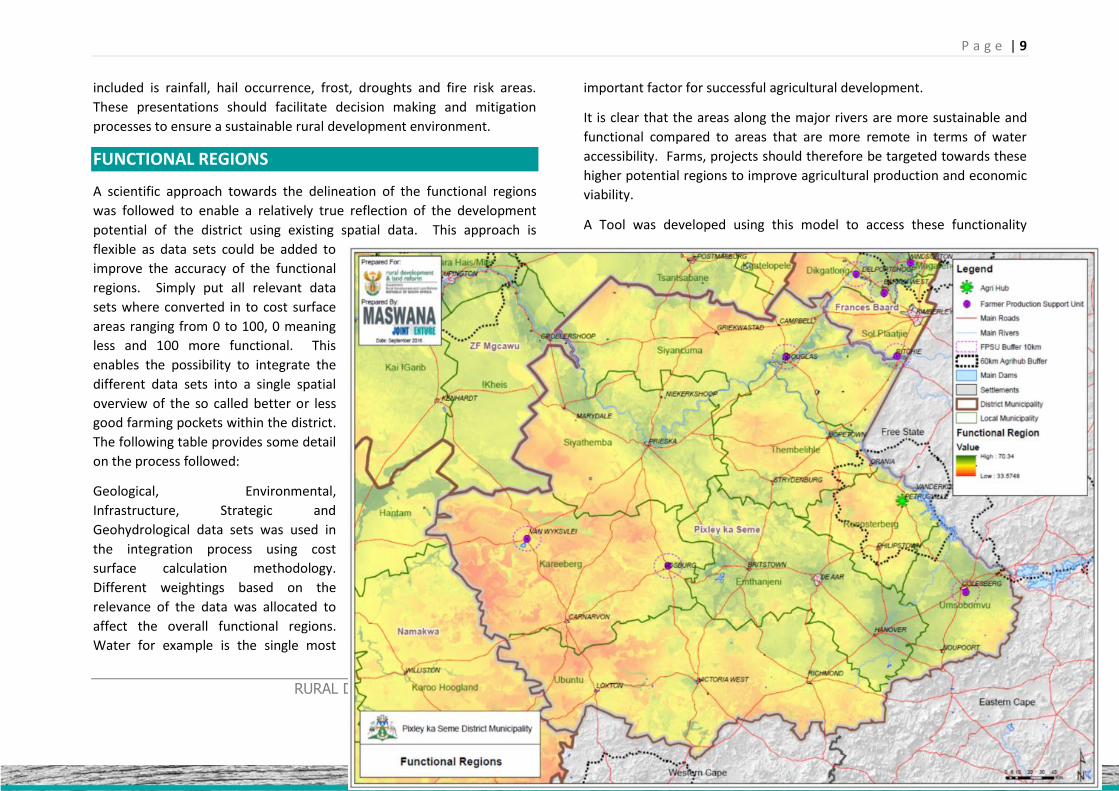
P a g e | 9
RURAL DEVELOPMENT PLAN FOR THE PIXLEY KA SEME DISTRICT MUNICIPALITY
included is rainfall, hail occurrence, frost, droughts and fire risk areas.
These presentations should facilitate decision making and mitigation
processes to ensure a sustainable rural development environment.
FUNCTIONAL REGIONS
A scientific approach towards the delineation of the functional regions
was followed to enable a relatively true reflection of the development
potential of the district using existing spatial data. This approach is
flexible as data sets could be added to
improve the accuracy of the functional
regions. Simply put all relevant data
sets where converted in to cost surface
areas ranging from 0 to 100, 0 meaning
less and 100 more functional. This
enables the possibility to integrate the
different data sets into a single spatial
overview of the so called better or less
good farming pockets within the district.
The following table provides some detail
on the process followed:
Geological, Environmental,
Infrastructure, Strategic and
Geohydrological data sets was used in
the integration process using cost
surface calculation methodology.
Different weightings based on the
relevance of the data was allocated to
affect the overall functional regions.
Water for example is the single most
important factor for successful agricultural development.
It is clear that the areas along the major rivers are more sustainable and
functional compared to areas that are more remote in terms of water
accessibility. Farms, projects should therefore be targeted towards these
higher potential regions to improve agricultural production and economic
viability.
A Tool was developed using this model to access these functionality

P a g e | 10
RURAL DEVELOPMENT PLAN FOR THE PIXLEY KA SEME DISTRICT MUNICIPALITY
scores per farm portion which generates a report to guide the land
acquisition or project prioritization process. The link to the tool as
obtainable by using the spisys.co.za website developed for the
department. Just follow the RDP link, register and access.
COMMODITY REGIONS
Following the Food Basket approach an
analysis of potential areas for the
respective food basket items were also
delineated using the land cover data set
where certain layers where linked to the
respective food groups. Food groups
consist of the following regions:
Protein Region (Suitable for cattle, extensive stock farming, game)
Sub-Protein Region (Less suitable for stock farming and has less carrying capacity which is less extensive)
Poultry Region (Regions where the production for animal feeds are suitable and within close proximity to bring down transportation cost)
Fruit and Vegetable Region (mostly identified where irrigation projects are visible and or along major rivers and irrigation schemes).
Spatial representation of these regions gives guidance towards the
acquisition of land future planning of projects per food basket group. If
for example more vegetables is required this spatial overview is to be
used as an overlay with farm portions when identifying farms for specific
agricultural needs. The system also generates a report per farm portion
with functionality scores per region.

P a g e | 11
RURAL DEVELOPMENT PLAN FOR THE PIXLEY KA SEME DISTRICT MUNICIPALITY
IMPLEMENTATION
For long time, rural development in South Africa has focused merely on
agricultural growth. The rationale behind this was that the benefits of
growth would trickle down to the poorer communities. In other words,
the growth in agricultural production would itself take care of the
distributional aspect. However, the “trickling down” did not actually take
place. Considering the above, the justification for the formulation of this
Rural Development Plan (RDP) includes some of the following points:
The past government policies and strategies failed to build up the necessary capacity that was needed to bring about sustainable development in rural areas. The implementation of the various rural development interventions depended almost solely on the government;
The formulation of the rural development plan relates to the fundamental structural reforms that have taken place in past few years or so. The broad objective of these reforms has been to ensure macroeconomic stability and improve market efficiency.
For macroeconomic achievements to have significant impact on rural development, fundamental strategic changes are needed in the rural economy;
Specific Focus regions within the region was identified that reflects unique characteristics in terms of the implementation proposals. Projects per focus region are identified in the implementation matrix, refer to the implementation plan.
Primary production is prioritised in the implementation matrix with capacity building and skills development gaining preference above processing interventions. This process ensures that communities are capacitated before accessing the rural markets, ensuring economic viability towards the value chains proposed.

P a g e | 12
RURAL DEVELOPMENT PLAN FOR THE PIXLEY KA SEME DISTRICT MUNICIPALITY
P a g e | 13
RURAL DEVELOPMENT PLAN FOR THE PIXLEY KA SEME DISTRICT MUNICIPALITY
CONCLUDING REMARKS
The formulation of the rural development plan will further encourage
sustainable land development, environmental management and fast track
the land reform process. As a result the major issues facing the Pixley ka
Seme District such as land degradation, overgrazing, poverty and the lack
of water resources etc. will be addressed accordingly;
There is a need to strengthen the linkages between various separate
sectorial strategies that address rural development issues, improve
coordination, and set implementation priorities;
There is a need to emphasise economic diversification in the rural areas.
Even though agriculture is the backbone of the rural economy,
diversification of opportunities for earning income in the rural areas is
crucial for rural development. This is particularly important for addressing
the issue of youth unemployment in the rural areas and for reducing
household vulnerability to risk associated with climatic and environmental
change and fluctuating market prices of agricultural products;
There is a need to recognise the inter-relationships between the rural
economy and the urban markets. The RDP needs to develop stronger
linkages with the urban economy. One key area of focus is improved
access to urban markets and forging stronger networks to facilitate access
to financing and skilled workforce. In addition, the RDP must ensure that
the rural economy is linked to the new engines of economic growth,
particularly tourism and cultural activities; and
There is a need to promote the use of technologies, modern approaches
and indigenous knowledge as a means to strengthen the rural livelihoods
for a vibrant economic development, as well as the empowerment of
women and youth to take charge in the economy and be more self-reliant.