Embed Size (px)
Citation preview

Proceedings of DET2011
7th International Conference on Digital Enterprise Technology
Athens, Greece
28-30 September 2011
INTEGRATED DIMENSIONAL VARIATION MANAGEMENT IN THE DIGITALFACTORY
Jody Muelaner Prof Paul G Maropoulos The University of Bath The University of Bath [email protected] [email protected]
ABSTRACT
This paper describes how dimensional variation management could be integrated throughout design,
manufacture and verification, to improve quality while reducing cycle times and manufacturing cost
in the Digital Factory environment. Initially variation analysis is used to optimize tolerances during
product and tooling design and also results in the creation of a simplified representation of product
key characteristics. This simplified representation can then be used to carry out measurability
analysis and process simulation. The link established between the variation analysis model and
measurement processes can subsequently be used throughout the production process to
automatically update the variation analysis model in real time with measurement data. This ‘live’
simulation of variation during manufacture will allow early detection of quality issues and facilitate
autonomous measurement assisted processes such as predictive shimming.
A study is described showing how these principles can be demonstrated using commercially
available software combined with a number of prototype applications operating as discrete modules.
The commercially available modules include Catia/Delmia for product and process design, 3DCS
for variation analysis and Spatial Analyzer for measurement simulation. Prototype modules are used
to carry out measurability analysis and instrument selection. Realizing the full potential of
Metrology in the Digital Factory will require that these modules are integrated and software
architecture to facilitate this is described. Crucially this integration must facilitate the use of real-
time metrology data describing the emerging assembly to update the digital model.
KEYWORDS
Variation analysis, digital factory, measurability
1. INTRODUCTION process modelling has been shown to contribute
significantly to process planning (Maropoulos, Yao In its initial form the Digital Factory may be seen as
et al. 2000; Maropoulos et al, 2003). Previous work the simulation of every detail of the manufacturing
has laid out a generic framework for measurement process before it happens allowing better planning
planning (Cai et al, 2008) and presented prototype (Dwyer 1999). At a more advanced stage the
instrument selection and measurability analysis simulation can be used, not only during the planning
software (Muelaner et al, 2010). phase, but also to enhance the control of processes
on the production floor (Kuhn 2006).. This paper extends this work to show how
The importance of design for manufacture has simulations of product variation created during the
been well established (Womack et al, 1990; product design phase can be integrated with
Fabricius 1994; Maropoulos et al, 2000) it has also measurement simulation. This will initially give an
been suggested that design for measurability should enhanced understanding of product variation and
verification. be a part of this (Muelaner et al, 2009). Additionally
39

At later stages in the product life cycle the use of
metrology to control processes, enable flexible
processes and manage component interfaces, will be
enhanced through the use of these integrated
simulations of product variation and measurement
uncertainty.
The manufacture of high quality products
requires close tolerances to be achieved. This is a
particular issue for large composite structures such
as the next generation of passenger aircraft and off-
shore wind turbines. The conventional methods for
maintaining close tolerances over large structures
involve the use of jigs to control the external form
of the structure combined with manual shimming
and fettling processes to maintain the interface
tolerances between components. These methods are
time consuming and dependent on highly skilled
manual operations. The conventional methods, in
their current form, are also not able to improve on
current external form tolerances due to the
limitations of environmental factors such as the
thermal expansion of jigs. This means that
improvements in aerodynamic profiles required for
increased efficiencies can not be realized.
As an example of a conventional assembly process
components are loaded into a precisely aligned
assembly jig, gaps between the components are then
carefully mapped using slip gauges and shims are
produced to these measurements. The components
are removed from the jig, reassembled with the
shims in place and the measurement of gaps using
slip gauges is repeated. It may be necessary to
repeat the shimming process due to the inaccuracy
inherent in such a manual process. Once the gaps
have been filled to within the required tolerances the
components are drilled through and then again
removed from the jig so that sealant can be applied.
They are then finally assembled. This process is
illustrated in
Figure 1.
40

Figure 1: Conventional Aerospace Assembly Process
The conventional approach described above is not
suitable to achieving the cost and process time
reductions required for the increased rates of
production forecast for products such as off-shore
wind turbines and next generation single aisle
passenger aircraft.
Alternative methods of maintaining tolerances are
in development. These generally also rely on jigs to
control the external form of structures with
alternative processes used to maintain the interface
tolerances between components. These approaches
have been generically described as Measurement
Assisted Assembly (MAA) (Kayani and Jamshidi
2007). MAA includes processes such as predictive
shimming (Kayani and Gray 2009) and fettling
where interface components are first measured and
this measurement data is then used to produce shim
or fettle interfacing components.
Although these approaches reduce the level of
manual rework required at the assembly stage they
still generally require measurements to be taken in
41

the assembly jig since they are not associated with
models able to predict the form of components
within the jig. They also do nothing to address the
limitations inherent in using large assembly jigs,
which are subject to thermal expansion, to control
aerodynamic form.
Determinate Assembly (DA) has been
demonstrated as a solution to reliance on jigs (Stone
2004) although in many applications it is not
possible to achieve the required component
tolerances. Measurement Assisted Determinate
Assembly (MADA) has therefore been suggested as
a way to implement DA for large assemblies with
tight tolerances (Muelaner and Maropoulos 2010).
An integrated approach to the design of products
and planning, monitoring, and control of processes
is required to design products; which minimise the
need for dimensional control during manufacture
while maximising the achievable aerodynamic
profile accuracy and other key characteristics.
This approach must consider the propagation of
variation through the product assembly during the
early stages of design ensuring that tolerance
requirements do not put unnecessary demands on
products and that the key characteristics of the
assembly can be practically measured.
The design of processes must take into account
the variability in outputs from forming, assembly
and measurement processes. It is therefore necessary
to have models of machine tools, robots and
measurement instruments which include the
variability and uncertainty of these operations.
2. VARIATION MODELLING USING SIMPLIFIED REPRESENTATIONS OF KEY CHARACTERISTICS
Geometric Dimensioning and Tolerancing (GD&T),
the standard for Geometrical Product Specification
(GPS) provides a continuous definition that ALL
points on a surface are within a specified zone; of
course this can never be fully verified. In reality
representative discrete coordinate measurements are
typically taken to verify that a surface is within
tolerance. In a similar way a point based model can
be used to represent continuous geometry for the
purpose of simulating product variability.
It is logical that the points defined for simulation
purposes should also be used for measurement. It is
important that random measurement locations are
also used however. This is because if consistent
points are used for measurement then a process may
become optimized for these points meaning that
they are no longer representative of the variability of
a surface as a whole.
Rules are required to streamline the process of
deciding how many control points are required to
verify given features. Such features should include
surfaces, holes, pins etc. It will then be possible for
the designer to work in a system where he specifies
the intent of his design and this is coded as both
GD&T for a standards based approach as well as
being discretised to a point based model for
variation analysis, measurement planning etc.
Use of a point based model has the advantage of
facilitating relatively simple calculation of the
propagation of variability within an assembly. It
also gives greatly reduced data file sizes. For
example a complex aircraft component such as a
composite wing cover could have a data size of 100
Mb when stored as a CATIA file. If this component
were characterized quite rigorously with a point
placed every 10 mm the total data required would
still be reduced to less than 5 MB. More detail on
this calculation is given in Table 1. It is therefore
clear that even where large profile tolerances are
represented using reasonably detailed point based
representations considerable reductions in data file
sizes are possible.
Table 1: Data required for Point based Model
Total surface area for controlled
surfaces 60 m
2
Grid spacing 10 mm
Total control points 600,000
Measurement Resolution 1 µm
Max Scale for Measurements 100 m
Data required per point
measurement 4 Bytes
Data required including data
label 8 Bytes
Total data required to describe
component 4.58 MB
2.1. DEFINING COMPONENT INTERFACES
Points representing two components can be used to
simulate the interface between those components.
Further inputs will however be required from the
designer in determining exactly how components
will interface with each other. This can be
understood by considering a component with two
pins, one of which has a shoulder, and a plate with
one hole and a slot, as shown in Figure 2. The
assembly condition can be simulated by calculating
the distances between points and applying
translations and rotations to bring the movable plate
part into its assembled condition with the target pin
part.
Different assumptions can be made regarding the
details of how the pins and shoulders will constrain
the movement of the plate. For example if it is
assumed that the pin in a hole is relatively tight, and
will therefore control rotation about the x and z
42

axes, then a simple ‘3-2-1’ fit can be used. In this
case three points on each of the target and the
movable parts are used to simulate the assembly
interface conditions and the following
transformations are carried out:-
• Translate component to make C1 coincident with T1. The distances in x, y and z between
points C1 and T1 are calculated. These distances
are then simply subtracted from all of the points
defining the component geometry.
• Rotate component about x and y (with origin at T1) so that C2 lies on the line through T1 and T2. These rotations can be carried out one
at a time. The angles between the lines C1-C2
and T1-T2 are first calculated in the x-y and y-z
planes and the corresponding rotations then
carried out by applying a rotation matrix.
• Rotate component about z (with origin at T1) so
that C3 lies on the plane through T1, T2 and T3.
Figure 2: Pin – Shoulder – Slot Location Example
It should be pointed out that this type of 3-2-1 fit is
called a ‘Three-Point Move’ in 3DCS while the term
‘3-2-1 Move’ is used to describe a different type of
move using 6 points on each component!
It should be noted that different assumptions
about how the assembly will locate will lead to
different methods of fitting the points. For example
if it is assumed that the pin in a hole is relatively
loose but that the plate is clamped down onto the
shoulder so that it is the shoulder that controls
rotation about x and z then a more complex form of
‘3-2-1’ is required, sometimes referred to as a ‘step-
plane move’ which involves the following steps:-
• The part is located onto the shoulder controlling
translation in y and rotation about both x and z.
Points C1, C2 and C3 are moved into contact
with a plane through T1, T2 and T3.
• C1 translated to T1
• Rotate about x and z
• The part is then located onto the pin in one
translation
Other methods of fitting are also possible, for
example a least-squares best fit could be used
although it is this unlikely to accurately simulate
real world conditions.
Figure 3: Shoulder – Pin – Slot Location Example
If it is not known whether the pin or the shoulder
will control rotation about x and z then it is possible
to apply a number of different fitting algorithms
with the transformation of the movable component
taking place in small iterations. It is then possible to
apply some test condition such as measuring the
distance between points to check which contact
condition will come into play first and then allow
this to position the component. By applying this
type of test it is possible to run a simulation in
which, due to component variability, the contact
conditions between components vary from assembly
to assembly.
The requirement for a rules based translation of
GD&T into a point based model of component
geometry was described above. Ultimately the CAD
system should also read the component interfaces
from the CAD assembly model and automatically
convert these into coordinate transformations with
iterative solutions to correctly simulate interface
conditions. Initially it is unlikely that such an
approach could be applied to the full range of
interfaces seen in complex aerospace assemblies.
The simulation of standard connections such as the
examples shown with pins and holes should
however be automated.
2.2. RUNNING MONTE CARLO SIMULATION OF THE SIMPLIFIED GEOMETRY
Once a simplified, point based, representation of
parts has been created and the interface conditions
between the parts in an assembly has been defined,
it is then possible to simulate variability in the
assembly using the Monte Carlo method. Based on
the GD&T definitions or Statistical Process Control
(SPC) data, randomly generated errors are added to
each point, simulating component variability.
43

Additional randomly generated errors may also be
added to some of the points in order to simulate the
assembly variability due to ‘float’ between, for
example, an oversized hole or slot and an undersized
pin. The complete simulation process for the Pin-
Shoulder-Slot example is shown in Figure 4.
Figure 4: Simulation of Pin-Shoulder-Slot Assembly using 3-2-1 Fit
3. INTEGRATION OF DIMENSIONAL VARIATION MANAGEMENT ACROSS THE DIGITAL FACTORY
The variation models described above can be used
to simulate product variability in order to optimize
tolerances during product and tooling design. The
simplified, point based, representation of product
key characteristics which was created for the
variation model can then be used to carry out
measurability analysis and process simulation. For
example measurement simulation (Calkins 2002;
New River Kinematics 2007; Muelaner, Cai et al.
2010) can be used to establish the uncertainty of
measurement for each of the points representing the
product geometry. Simulation of component
forming operations may also be carried out at this
stage to obtain improved estimates of actual
component variability.
Improved estimates of component variability and
measurement uncertainty can then be fed back into
the variation model to obtain improved simulation
results. The simulation of product variation is
therefore an iterative process with the results refined
a number of times as the product and process is
developed.
Since the measurement process planning has been
based on the point based model originally created
for variation simulation, it is also possible to feed
‘live’ measurement results back into the simulation.
This allows the actual as-built condition of an
emerging assembly to be simulated. It is never
possible to know exactly what the as-built condition
is since there is always a degree of uncertainty of
measurement. The uncertainty of measurement
therefore replaces component variability in the
model to allow improved estimates of the final build
to be generated as the build process progresses.
This ‘live’ simulation of variation during
manufacture will allow early detection of quality
issues and corrective actions to be taken. It will also
facilitate measurement assisted processes such as
predictive shimming and MADA, discussed above.
This integration of dimensional variation
management can be demonstrated using
commercially available software combined with a
number of prototype applications operating as
discrete modules. The commercially available
modules might include Catia/Delmia for product
and process design, 3DCS for variation analysis and
Spatial Analyzer for measurement simulation.
Prototype modules are used to carry out
measurability analysis and instrument selection.
The complete integrated dimensional variation
management process is summarized in Figure 5.
44
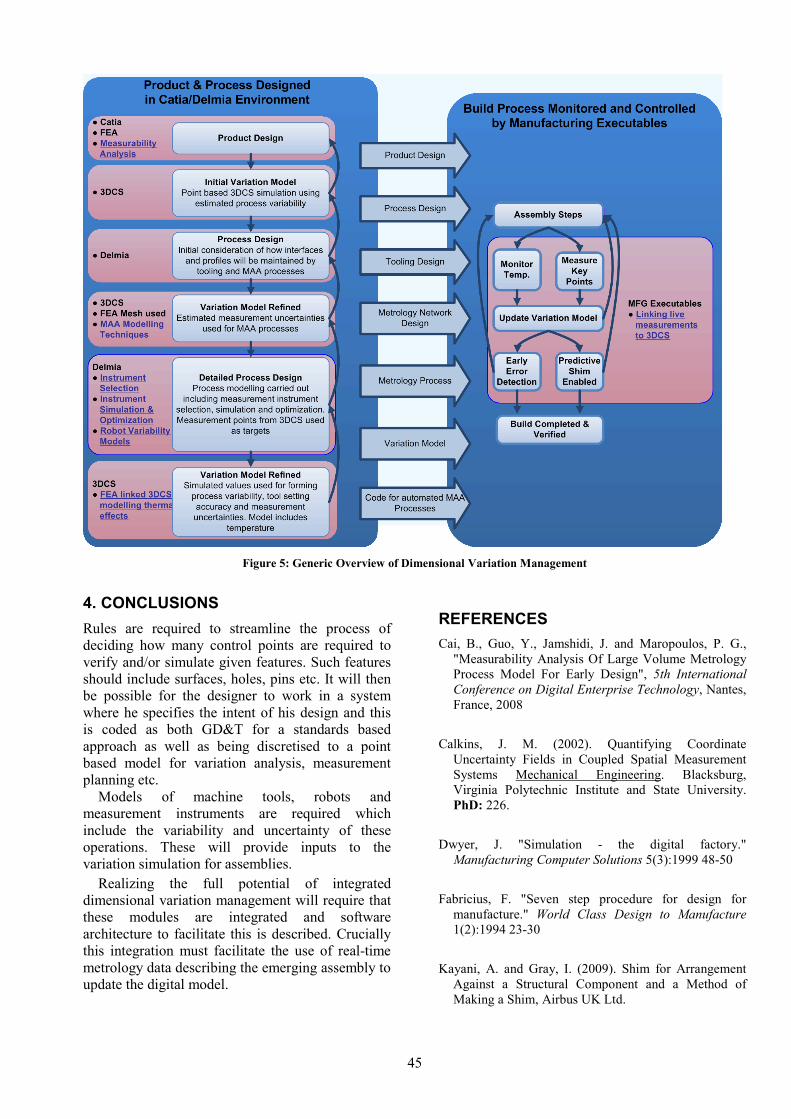
Figure 5: Generic Overview of Dimensional Variation Management
4. CONCLUSIONS
Rules are required to streamline the process of
deciding how many control points are required to
verify and/or simulate given features. Such features
should include surfaces, holes, pins etc. It will then
be possible for the designer to work in a system
where he specifies the intent of his design and this
is coded as both GD&T for a standards based
approach as well as being discretised to a point
based model for variation analysis, measurement
planning etc.
Models of machine tools, robots and
measurement instruments are required which
include the variability and uncertainty of these
operations. These will provide inputs to the
variation simulation for assemblies.
Realizing the full potential of integrated
dimensional variation management will require that
these modules are integrated and software
architecture to facilitate this is described. Crucially
this integration must facilitate the use of real-time
metrology data describing the emerging assembly to
update the digital model.
REFERENCES
Cai, B., Guo, Y., Jamshidi, J. and Maropoulos, P. G.,
"Measurability Analysis Of Large Volume Metrology
Process Model For Early Design", 5th International Conference on Digital Enterprise Technology, Nantes,
France, 2008
Calkins, J. M. (2002). Quantifying Coordinate
Uncertainty Fields in Coupled Spatial Measurement
Systems Mechanical Engineering. Blacksburg,
Virginia Polytechnic Institute and State University.
PhD: 226.
Dwyer, J. "Simulation - the digital factory."
Manufacturing Computer Solutions 5(3):1999 48-50
Fabricius, F. "Seven step procedure for design for
manufacture." World Class Design to Manufacture 1(2):1994 23-30
Kayani, A. and Gray, I. (2009). Shim for Arrangement
Against a Structural Component and a Method of
Making a Shim, Airbus UK Ltd.
45

Kayani, A. and Jamshidi, J., "Measurement Assisted
Assembly For Large Volume Aircraft Wing
Structures", 4th International Conference on Digital Enterprise Technology, Bath, United Kingdom, 2007
Kuhn, W. "Digital factory - Simulation enhancing the
product and production engineering process",
Monterey, CA, United states, 2006,
Maropoulos, P. G., Bramall, D. G. and McKay, K. R.
"Assessing the manufacturability of early product
designs using aggregate process models." Proceedings of the Institution of Mechanical Engineers, Part B: Journal of Engineering Manufacture 217(9):2003
1203-1214
Maropoulos, P. G., Yao, Z., Bradley, H. D. and Paramor,
K. Y. G. "Integrated design and planning environment
for welding Part 1: product modelling." Journal of Materials Processing Technology 107(1-3):2000 3-8
Muelaner, J. E., Cai, B. and Maropoulos, P. G., "Large
Volume Metrology Instrument Selection And
Measurability Analysis", 6th International Conference on Digital Enterprise Technology, Hong Kong, 2009
Muelaner, J. E., Cai, B. and Maropoulos, P. G. "Large
Volume Metrology Instrument Selection and
Measurability Analysis." IMechE, Part B: J. Engineering Manufacture 224:2010 853-868
Muelaner, J. E. and Maropoulos, P. G., "Design for
Measurement Assisted Determinate Assembly
(MADA) of Large Composite Structures", CMSC,
Reno, Nevada, 2010
New River Kinematics (2007). SpatialAnalyzer.
Stone, P. R. "Reconfigurable Fixturing". Aerospace Manufacturing and Automated Fastening Conference and Exhibition, St. Louis, MS, USA, 2004,
Womack, J. P., Jones, D. T. and Roos, D. "The Machine
that Changed the World"Rawson Associates New
York1990,
46