Embed Size (px)
Citation preview
1
INTEGRATED FOOD SECURITY PHASE CLASSIFICATION THE REPUBLIC OF SOUTH SUDAN
KEY IPC FINDINGS : JANUARY-JULY 2018
January 2018 IPC Classification
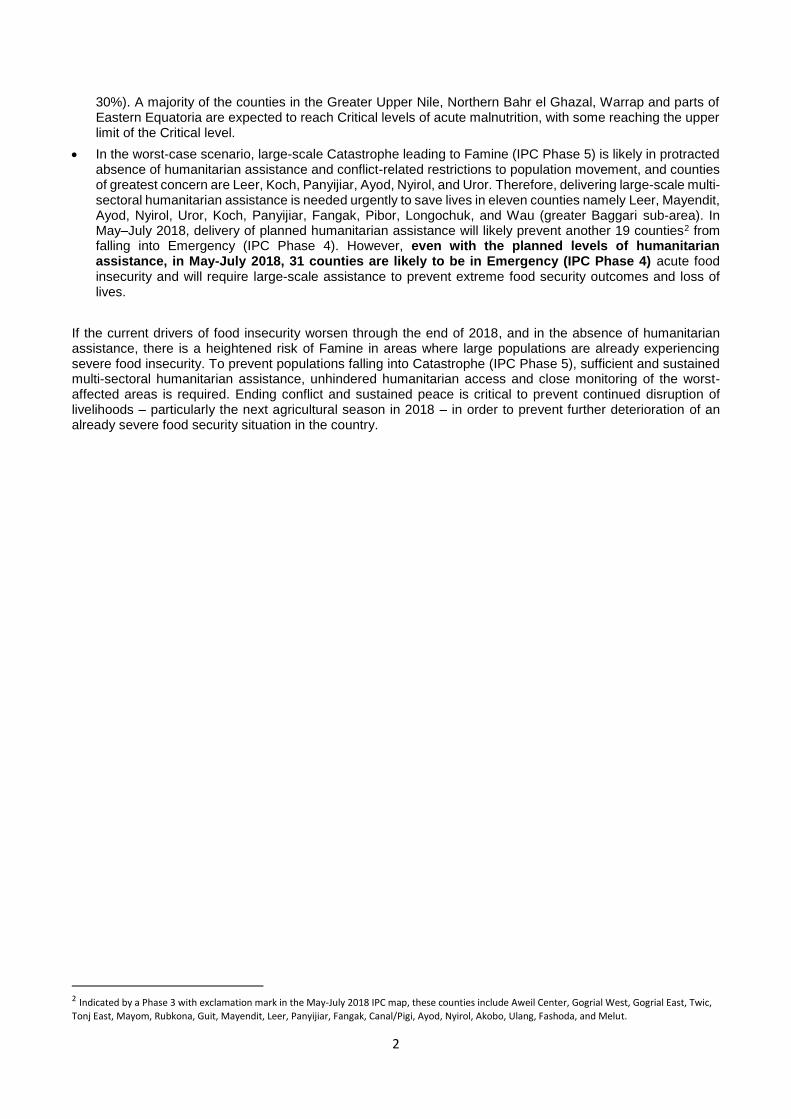
In January 2018, 5.3 million people (48% of the population) are estimated to be facing Crisis and Emergency (IPC Phases 3 and 4) acute food insecurity, out of which 1 million people are facing Emergency (IPC Phase 4) acute food insecurity. Compared with the same time last year, this reflects a 40% increase in the population facing severe food insecurity in the post-harvest season.
Worsening food insecurity is primarily driven by protracted conflict and displacements, which have contributed to insufficient crop production (only 61% of the 2018 national cereal needs are met by the harvest), disruptions to livelihoods and persistent macroeconomic deterioration. Livelihoods have been further eroded by climatic shocks, such as prolonged dry spells and flooding, and pest infestations (e.g. Fall Armyworm).
Food security has slightly improved since September 2017 as a result of a combination of large-scale humanitarian assistance, harvests, seasonal availability of fish and livestock products. As of January 2018 there are no longer populations in Catastrophe (IPC Phase 5) in Ayod and the Elevated Risk of Famine in greater Baggari sub-area of Western Bahr el Ghazal has been prevented. In particular, humanitarian assistance has prevented a worsening food security situation in 17 counties1.
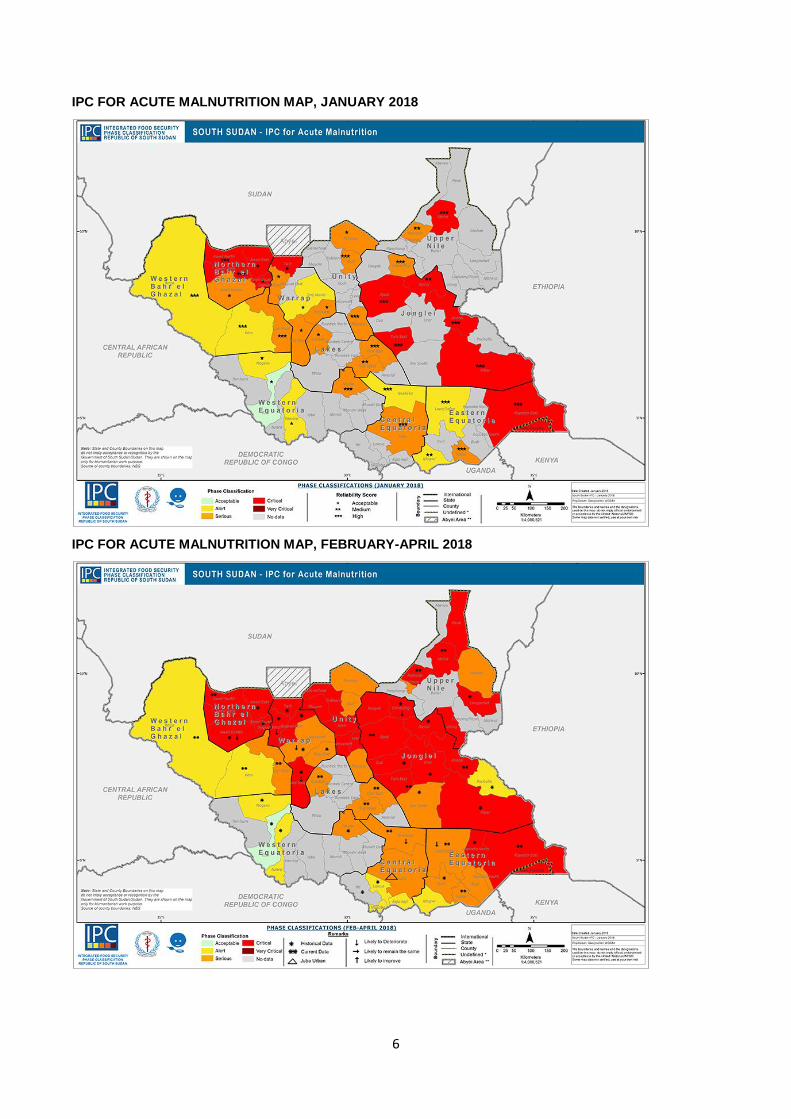
The January 2018 nutrition situation reflects a typical post-harvest seasonal improvements, with expectedly lower GAM rates that are attributed to humanitarian assistance, food stocks from harvests, improved access to nutrition and health services, reduction in morbidity and disease outbreaks during the dry season. Of the 22 SMART surveys conducted between September 2017 and January 2018, eight of them showed GAM rates above the 15% WHO emergency threshold. However, five counties in Jonglei (Ayod, Pibor, Akobo, Nyirol and Twic East), all counties in Northern Bahr el Ghazal (except Aweil Centre), Kapoeta East in Eastern Equatoria and Melut in Upper Nile state show Critical levels of Global Acute Malnutrition (GAM 15.0%-29.9%).
IPC Classification Projections (February–April 2018; May–July 2018)
To inform decision-making, the South Sudan IPC Technical Working Group has provided population estimates in the absence of all forms of humanitarian assistance for the two projection periods (February-April and May-July 2018), while the maps factor in the planned, funded and likely humanitarian assistance for the projected period.
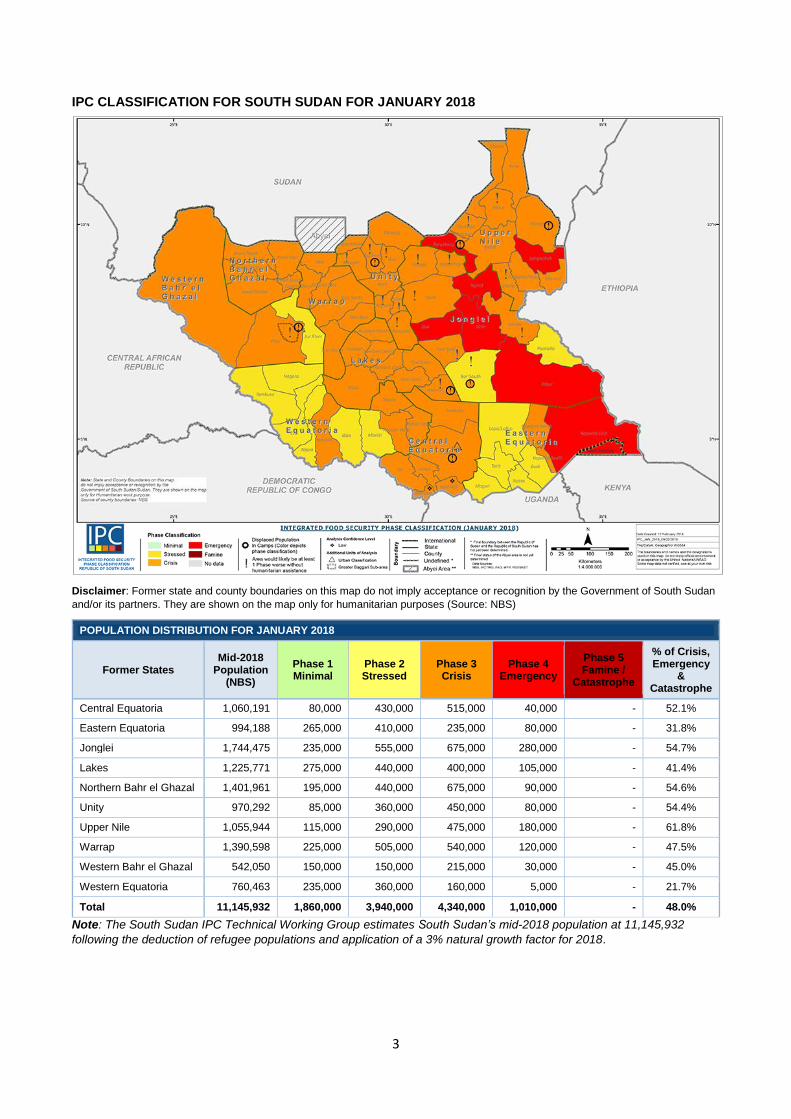
In February-April 2018, with humanitarian assistance planned, funded and likely there are 53 counties in Crisis (IPC Phase 3), 17 counties in Emergency (IPC Phase 4) and none in Famine (IPC Phase 5). However, in the absence of all forms of humanitarian assistance, in February–April 2018, an estimated 6.3 million (57% of the population) would be in Crisis (IPC Phase 3) or worse acute food insecurity, of which 50,000 are estimated to be in Catastrophe (IPC Phase 5).
In May-July 2018, with humanitarian assistance planned, funded and likely there are 40 counties in Crisis (IPC Phase 3), 31 counties in Emergency (IPC Phase 4) and none in Famine (IPC Phase 5). However, in the continued absence of all forms of humanitarian assistance, in May–July 2018, an estimated 7.1 million people (63% of the population) would face Crisis (IPC Phase 3) or worse acute food insecurity, of which 155,000 are estimated to be in Catastrophe (IPC Phase 5) and 2.3 million are estimated to be in Emergency (IPC Phase 4) – at this time, rising excess mortality and acute malnutrition would be expected.
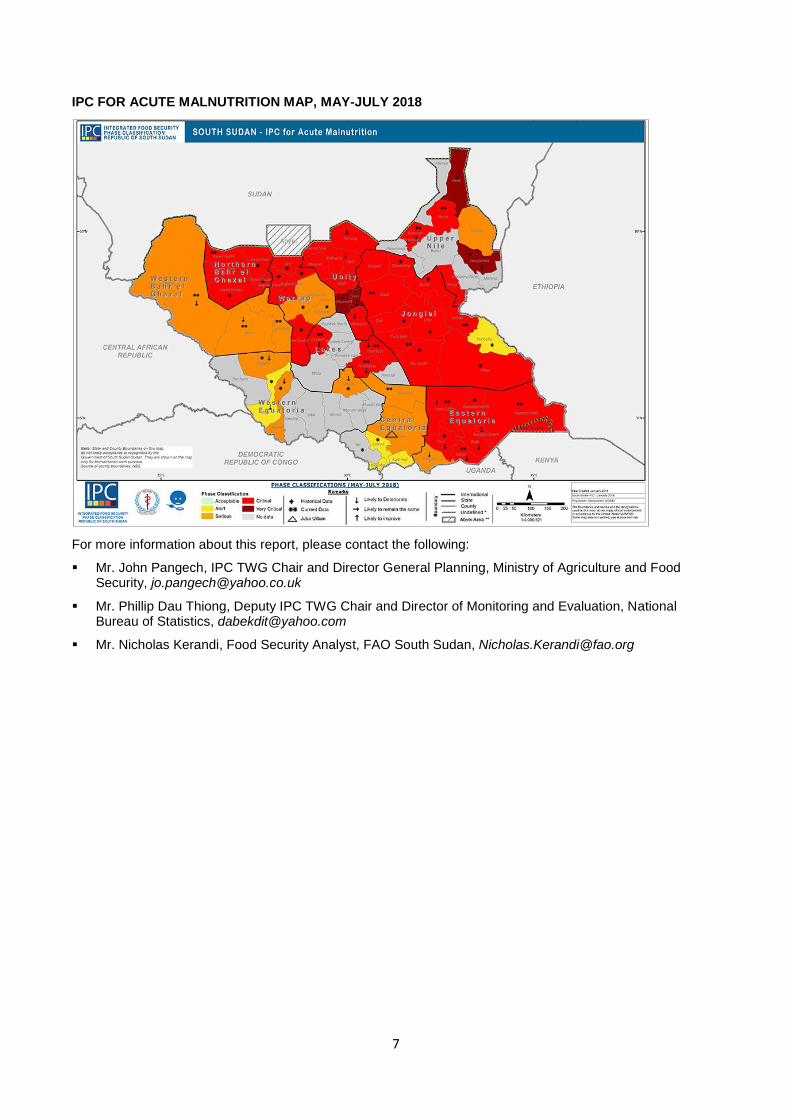
Despite the depletion of food stocks in some counties and the early onset of the lean season, the nutrition situation is expected to remain the same from February to April 2018. However, in the lead-up to the lean season of May–July 2018, the nutrition situation is expected to deteriorate significantly as a result of unprecedented levels of food insecurity, high morbidity, outbreaks of diarrhea and other illness, poor infant and young feeding practices as well as limited access to services due to the heavy rains. During this period, the counties of Leer and Mayendit in Unity and Longochuk and Renk of Upper Nile are expected to reach Extreme Critical levels (IPC Phase 5) as per the IPC for Acute Malnutrition Classification (GAM ≥
1 Counties and sub-areas include Greater Baggari sub-area, Mayom, Rubkona, Guit, Mayendit, Leer, Panyijiar, Ayod, Fangak, Canal/Pigi, Fashoda,
Melut, Ulang, Akobo, Twic East, Bor South and Awerial.
2
30%). A majority of the counties in the Greater Upper Nile, Northern Bahr el Ghazal, Warrap and parts of Eastern Equatoria are expected to reach Critical levels of acute malnutrition, with some reaching the upper limit of the Critical level.
In the worst-case scenario, large-scale Catastrophe leading to Famine (IPC Phase 5) is likely in protracted absence of humanitarian assistance and conflict-related restrictions to population movement, and counties of greatest concern are Leer, Koch, Panyijiar, Ayod, Nyirol, and Uror. Therefore, delivering large-scale multi-sectoral humanitarian assistance is needed urgently to save lives in eleven counties namely Leer, Mayendit, Ayod, Nyirol, Uror, Koch, Panyijiar, Fangak, Pibor, Longochuk, and Wau (greater Baggari sub-area). In May–July 2018, delivery of planned humanitarian assistance will likely prevent another 19 counties2 from falling into Emergency (IPC Phase 4). However, even with the planned levels of humanitarian assistance, in May-July 2018, 31 counties are likely to be in Emergency (IPC Phase 4) acute food insecurity and will require large-scale assistance to prevent extreme food security outcomes and loss of lives.
If the current drivers of food insecurity worsen through the end of 2018, and in the absence of humanitarian assistance, there is a heightened risk of Famine in areas where large populations are already experiencing severe food insecurity. To prevent populations falling into Catastrophe (IPC Phase 5), sufficient and sustained multi-sectoral humanitarian assistance, unhindered humanitarian access and close monitoring of the worst-affected areas is required. Ending conflict and sustained peace is critical to prevent continued disruption of livelihoods – particularly the next agricultural season in 2018 – in order to prevent further deterioration of an already severe food security situation in the country.
2 Indicated by a Phase 3 with exclamation mark in the May-July 2018 IPC map, these counties include Aweil Center, Gogrial West, Gogrial East, Twic,
Tonj East, Mayom, Rubkona, Guit, Mayendit, Leer, Panyijiar, Fangak, Canal/Pigi, Ayod, Nyirol, Akobo, Ulang, Fashoda, and Melut.
3
IPC CLASSIFICATION FOR SOUTH SUDAN FOR JANUARY 2018
Disclaimer: Former state and county boundaries on this map do not imply acceptance or recognition by the Government of South Sudan
and/or its partners. They are shown on the map only for humanitarian purposes (Source: NBS)
POPULATION DISTRIBUTION FOR JANUARY 2018
Former States Mid-2018
Population (NBS)
Phase 1 Minimal
Phase 2 Stressed
Phase 3 Crisis
Phase 4 Emergency
Phase 5 Famine /
Catastrophe
% of Crisis, Emergency
& Catastrophe
Central Equatoria 1,060,191 80,000 430,000 515,000 40,000 - 52.1%
Eastern Equatoria 994,188 265,000 410,000 235,000 80,000 - 31.8%
Jonglei 1,744,475 235,000 555,000 675,000 280,000 - 54.7%
Lakes 1,225,771 275,000 440,000 400,000 105,000 - 41.4%
Northern Bahr el Ghazal 1,401,961 195,000 440,000 675,000 90,000 - 54.6%
Unity 970,292 85,000 360,000 450,000 80,000 - 54.4%
Upper Nile 1,055,944 115,000 290,000 475,000 180,000 - 61.8%
Warrap 1,390,598 225,000 505,000 540,000 120,000 - 47.5%
Western Bahr el Ghazal 542,050 150,000 150,000 215,000 30,000 - 45.0%
Western Equatoria 760,463 235,000 360,000 160,000 5,000 - 21.7%
Total 11,145,932 1,860,000 3,940,000 4,340,000 1,010,000 - 48.0%
Note: The South Sudan IPC Technical Working Group estimates South Sudan’s mid-2018 population at 11,145,932
following the deduction of refugee populations and application of a 3% natural growth factor for 2018.
4
IPC CLASSIFICATION FOR SOUTH SUDAN FOR FEBRUARY-APRIL 2018
Disclaimer: Former state and county boundaries on this map do not imply acceptance or recognition by the Government of South Sudan
and/or its partners. They are shown on the map only for humanitarian purposes (Source: NBS)
POPULATION DISTRIBUTION FOR FEBRUARY-APRIL 2018
Former States Mid-2018
Population (NBS)
Phase 1 Minimal
Phase 2 Stressed
Phase 3 Crisis
Phase 4 Emergency
Phase 5 Famine /
Catastrophe
% of Crisis, Emergency & Catastrophe
Central Equatoria 1,060,191 60,000 365,000 545,000 90,000 - 59.9%
Eastern Equatoria 994,188 205,000 415,000 260,000 115,000 - 37.7%
Jonglei 1,744,475 155,000 395,000 690,000 475,000 25,000 68.4%
Lakes 1,225,771 235,000 420,000 425,000 145,000 - 46.5%
Northern Bahr el Ghazal 1,401,961 125,000 375,000 705,000 200,000 - 64.4%
Unity 970,292 45,000 230,000 465,000 205,000 25,000 71.6%
Upper Nile 1,055,944 90,000 290,000 475,000 200,000 - 64.0%
Warrap 1,390,598 200,000 450,000 535,000 210,000 - 53.4%
Western Bahr el Ghazal 542,050 110,000 150,000 235,000 50,000 - 52.3%
Western Equatoria 760,463 175,000 330,000 195,000 60,000 - 33.6%
Total 11,145,932 1,400,000 3,420,000 4,530,000 1,750,000 50,000 56.8%
Note: The South Sudan IPC Technical Working Group estimates South Sudan’s mid-2018 population at 11,145,932 following the deduction of refugee populations and application of a 3% natural growth factor for 2018. The populations facing severe food insecurity have been calculated both in the presence and absence of humanitarian assistance.
5
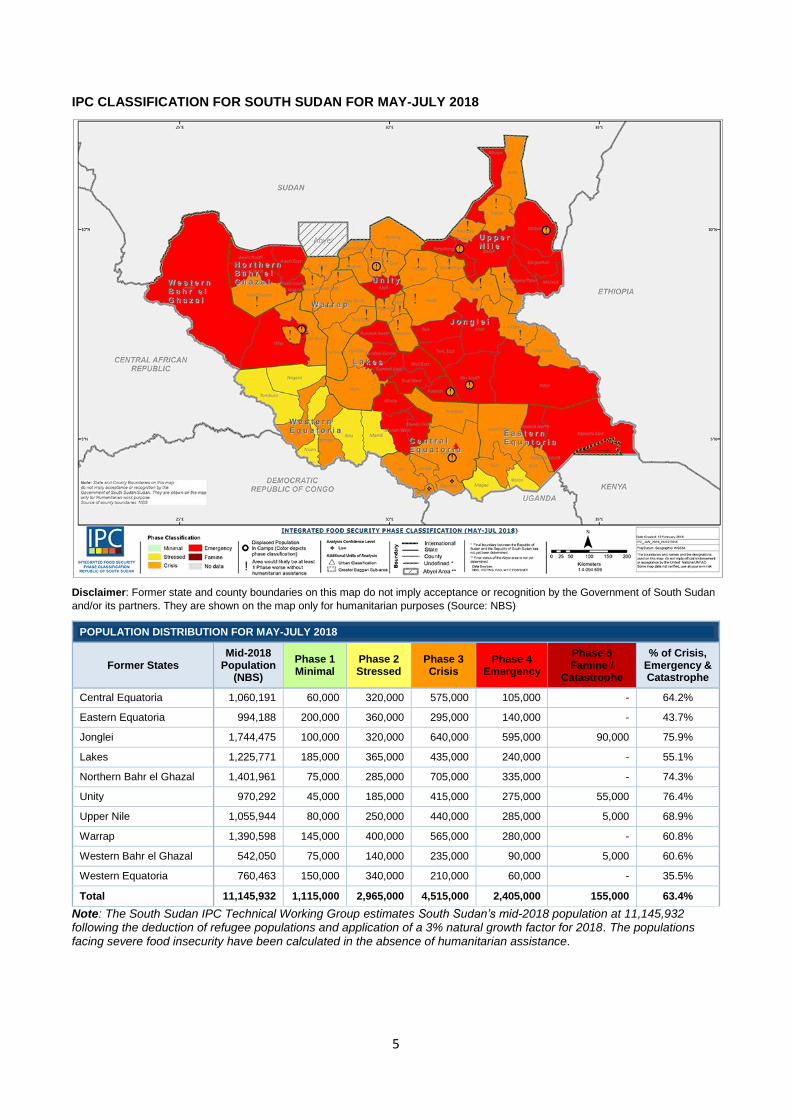
IPC CLASSIFICATION FOR SOUTH SUDAN FOR MAY-JULY 2018
Disclaimer: Former state and county boundaries on this map do not imply acceptance or recognition by the Government of South Sudan
and/or its partners. They are shown on the map only for humanitarian purposes (Source: NBS)
POPULATION DISTRIBUTION FOR MAY-JULY 2018
Former States Mid-2018
Population (NBS)
Phase 1 Minimal
Phase 2 Stressed
Phase 3 Crisis
Phase 4 Emergency
Phase 5 Famine /
Catastrophe
% of Crisis, Emergency & Catastrophe
Central Equatoria 1,060,191 60,000 320,000 575,000 105,000 - 64.2%
Eastern Equatoria 994,188 200,000 360,000 295,000 140,000 - 43.7%
Jonglei 1,744,475 100,000 320,000 640,000 595,000 90,000 75.9%
Lakes 1,225,771 185,000 365,000 435,000 240,000 - 55.1%
Northern Bahr el Ghazal 1,401,961 75,000 285,000 705,000 335,000 - 74.3%
Unity 970,292 45,000 185,000 415,000 275,000 55,000 76.4%
Upper Nile 1,055,944 80,000 250,000 440,000 285,000 5,000 68.9%
Warrap 1,390,598 145,000 400,000 565,000 280,000 - 60.8%
Western Bahr el Ghazal 542,050 75,000 140,000 235,000 90,000 5,000 60.6%
Western Equatoria 760,463 150,000 340,000 210,000 60,000 - 35.5%
Total 11,145,932 1,115,000 2,965,000 4,515,000 2,405,000 155,000 63.4%
Note: The South Sudan IPC Technical Working Group estimates South Sudan’s mid-2018 population at 11,145,932 following the deduction of refugee populations and application of a 3% natural growth factor for 2018. The populations facing severe food insecurity have been calculated in the absence of humanitarian assistance.
6
IPC FOR ACUTE MALNUTRITION MAP, JANUARY 2018
IPC FOR ACUTE MALNUTRITION MAP, FEBRUARY-APRIL 2018
7
IPC FOR ACUTE MALNUTRITION MAP, MAY-JULY 2018
For more information about this report, please contact the following:
Mr. John Pangech, IPC TWG Chair and Director General Planning, Ministry of Agriculture and Food Security, [email protected]
Mr. Phillip Dau Thiong, Deputy IPC TWG Chair and Director of Monitoring and Evaluation, National Bureau of Statistics, [email protected]
Mr. Nicholas Kerandi, Food Security Analyst, FAO South Sudan, [email protected]