Embed Size (px)
Citation preview

© Hitachi, Ltd. 2012. All rights reserved.
HITACHI CONFIDENTIAL
2012.11.05
Youichi NONAKA, Yuuichi SUGINISHI, Toshiharu MIWA Yokohama Research Laboratory, Hitachi,Ltd.
Japan
Integrated Maintenance System Trend and
A Maintenance Scheduling System Application

2
Power Plants
Loading Shovel(80t)
Construction Machinery
Disk Array Subsystem
Storage Systems
British CTRL Train
Transportation
CTRL: Channel Tunnel Rail Link
Open MRI System
Medical Equipments Building Systems
Intelligent Elevators
Hitachi Products
Combined Cycle Plant

HITACHI Yokohama Research Lab.
System/service Autonomous
decentralization
Mathematical engineering
Security
Support fusion business by info./telecomm. and manufacturing tech.
IT platform
Storage
Middleware
Network
Embedded system System
engineering
Digital image application
Embedded Linux
Manufacturing Production system
Processing/packa-ging/assembling
Inspection/mea-suring
Improving/totally optimizing by effective utilization of Big Data
Social infrastructure business
Highly-reliable cloud construction led by storage system
Info./telecomm. business
x
Fusion Business
Info.: information Telecomm.: telecommunication
3

© Hitachi, Ltd. 2012. All rights reserved.
HITACHI CONFIDENTIAL
1.Integrated Maintenance System Trend
2.Maintenance Scheduling System Application
Contents

© Hitachi, Ltd. 2012. All rights reserved.
HITACHI CONFIDENTIAL
1.Integrated Maintenance System Trend
2.Maintenance Scheduling System Application
Contents

$
Reference: Kim, S. et al, Intl. journal of services technology and management,Vol.3(2010)
It is reported that O&M(operation & maintenance) revenue such as service and parts replacement during product life-cycle exceeds sales revenue in aircraft engine industry.
Maintenance is a key activity to prevent from the stoppage due to machine failure.
However, maintenance causes the decrease of working ratio…
Impact of Maintenance on Revenue 6

Time
Functional Level
A. Improvement B. Preventive Maintenance
Failure Initial Malfunction
C. Breakdown Maintenance
D. Upgrade
Required Functional Level Degradation
Change of Required Functional Level
RUL
Prognostics Condition Monitoring
RUL: Remaining Useful Life
Various Maintenance Activities 7

Maintenance methods become advanced with the progress of condition monitoring and failure diagnosis technologies utilizing information and communication technology.
Trends of Maintenance Methods 8
Breakdown Maintenance
Preventive Maintenance
Time Based Maintenance
Condition Based
Maintenance
Prognostic and Health
Management
Advantage Easy to Operate Improvement of Maintenance Efficiency Due to Proactive
Action
Challenge Avoidance of Critical Stoppage
Difficulty of Appropriate
Maintenance Timing
Need of Practical Failure Detection / Prediction Method

Op.: Operation, Maint.: Maintenance, O&M: Operation and Maintenance :Product / Equipment
1
2
3
Maintenance
Mobility
O&M Type
Distributed
Centralized
No. Example of Business Situation
Site User
Op. / Maint. •Power Plant
•Manufacturing Line
•Construction Machine for Mine
Site
User/ Maker
(on-site)
Site
Site
Op.
Op. Op.
Maint. •Elevating Machine
•Medical Equipment
•Electronic Device
User
User (Operation Company)
Maint.
Maker (Dispatch & On-site)
User/ Maker
(Maintenance Station)
Op.
Op.
Op.
Station
Operation
Requirement of Maintenance Scheduling 9 Each O&M type requires different scheduling approaches
•Railway
•Aircraft

Op.: Operation, Maint.: Maintenance, O&M: Operation and Maintenance :Product / Equipment
1
2
3 Mobility
O&M Type
Distributed
Centralized
No.
Requirement of Maintenance Scheduling 10 Each O&M type requires different scheduling approaches
Previous Study
Proactive scheduling method is developed to improve the operation ratio and productivity since operations are complicated and timing of maintenance is flexible in the production line (Nonaka, 2010).
Remote monitoring system of products distributed all over the world is introduced in order to manage the maintenance scheduling and parts inventory efficiently using remote and real-time monitoring data (Xiang,2011).
The adaptive and heuristic scheduling method is applied to quickly find new suitable vehicle movement plans and reconstruct maintenance packages with as few maintenance stops as possible while keeping the risk of breakdowns low (Bohlin,2008).

Op.: Operation, Maint.: Maintenance, O&M: Operation and Maintenance :Product / Equipment
1
2
3 Mobility
O&M Type
Distributed
Centralized
No.
Requirement of Maintenance Scheduling 11 Each O&M type requires different scheduling approaches
Previous Study
Proactive scheduling method is developed to improve the operation ratio and productivity since operations are complicated and timing of maintenance is flexible in the production line (Nonaka, 2010).
Remote monitoring system of products distributed all over the world is introduced in order to manage the maintenance scheduling and parts inventory efficiently using remote and real-time monitoring data (Xiang,2011).
The adaptive and heuristic scheduling method is applied to quickly find new suitable vehicle movement plans and reconstruct maintenance packages with as few maintenance stops as possible while keeping the risk of breakdowns low (Bohlin,2008).

© Hitachi, Ltd. 2012. All rights reserved.
HITACHI CONFIDENTIAL
1.Integrated Maintenance System Trend
2.Maintenance Scheduling System Application
Contents

Power Plants Storage Systems Transportation
Target Products & Process 13
Manufacturing System Materials
Parts for Products

Characters of Manufacturing System 14
Manufacturing System Materials
Parts for Products
Process A
Process B
Process C

Characters of Manufacturing System 15
Process A Process B Process C
Step4
Group A Group B Group C
Materials
Parts
Step5
Step1 Step2 Step3
Step6 Step7
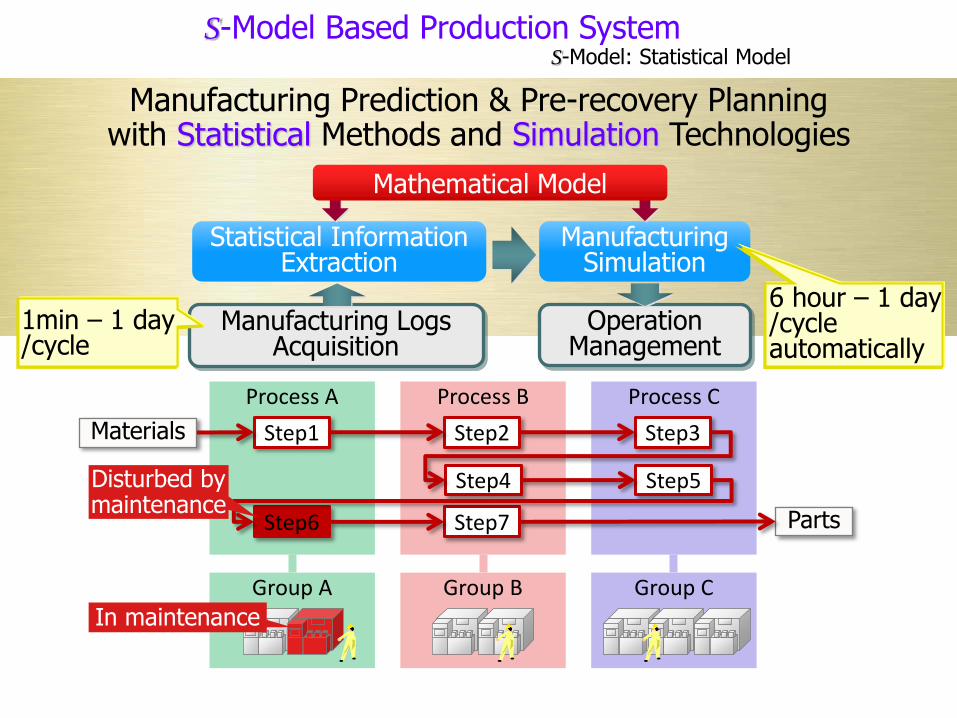
1.Target manufacturing system is “re-entrant type”, in which process routing goes through same process repeatedly.
2.Each process in the system has machine group. In the group, one machine owes one process step at the same time.

Characters of Manufacturing System 16
Process A Process B Process C
Group A Group B Group C
3.In one product case, the process routing consists of hundred process steps, and manufacturing lead time takes several weeks.
4.Another case has multiple part type, so various process routings are defined to the manufacturing system.
Material2
Material3
Part2
Part3
Step4
Material1
Parts
Step5
Step1 Step2 Step3
Step6 Step7

Machine Maintenance Problem 17
Process A Process B Process C
Group A Group B Group C
5.In this system, when a machine turns to maintenance condition, some process steps would be disturbed its work by the maintenance.
6.This situation affects the system throughput and manufacturing lead time.
In maintenance
Step4
Materials
Parts
Step5
Step1 Step2 Step3
Step6 Step7
Disturbed by maintenance

Maintenance Type 18
Process A Process B Process C
Group A Group B Group C
In maintenance
Step4
Materials
Parts
Step5
Step1 Step2 Step3
Step6 Step7
Disturbed by maintenance
1. Preventive Maintenance
a. Time-Based Maintenance
b. Condition-Based Maintenance
2. Breakdown Maintenance
Today’s Topic

Our Approach: S-Model Based Production System S-Model: Statistical Model 19
Process A Process B Process C
Group A Group B Group C In maintenance
Step4
Materials
Parts
Step5
Step1 Step2 Step3
Step6 Step7
Disturbed by maintenance
Statistical Information Extraction
Operation Management
Manufacturing Logs Acquisition
Manufacturing Simulation
Manufacturing Prediction & Pre-recovery Planning with Statistical Methods and Simulation Technologies
Mathematical Model
1min – 1 day /cycle
6 hour – 1 day /cycle automatically

S-Model Based Production System S-Model: Statistical Model 20
Process A Process B Process C
Group A Group B Group C In maintenance
Step4
Materials
Parts
Step5
Step1 Step2 Step3
Step6 Step7
Disturbed by maintenance
Statistical Information Extraction
Operation Management
Manufacturing Logs Acquisition
Manufacturing Simulation
1. Manufacturing Condition Prediction 2. Pre-recovery Planning
Mathematical Model
1min – 1 day /cycle
6 hour – 1 day /cycle automatically

S-Model Based Production System S-Model: Statistical Model 21
Process A Process B Process C
Group A Group B Group C In maintenance
Step4
Materials
Parts
Step5
Step1 Step2 Step3
Step6 Step7
Disturbed by maintenance
Statistical Information Extraction
Operation Management
Manufacturing Logs Acquisition
Manufacturing Simulation
1. Manufacturing Condition Prediction 2. Pre-recovery Planning
Mathematical Model
1min – 1 day /cycle
6 hour – 1 day /cycle automatically

Manufacturing Condition Prediction Method 22
Multi-agent based manufacturing data mining technology breaks huge amount of
manufacturing actual data mining calculation for manufacturing condition prediction
Simulation Data Base
Manufacturing Actual Data Base
Report Agent
Data Mining Agent
Simulator for Manufacturing
Condition Prediction
TSUNAMI
Over 1M records/day

23
cix-1
Pn . . .
Pi+1 Pi Pi-1 . . .
P2 P1 . . .
Tx
Tx+1
Tx-1
. . .
. . .
cix
cix+1
. . .
ci-1x-1
. . .
ci-1x
ci-1x+1
. . .
ci+1x-1
. . .
ci+1x
ci+1x+1
. . .
. . .
. . .
. . .
. . .
. . .
. . .
. . .
. . .
. . .
. . .
c2x-1
. . .
c2x
c2x+1
. . .
c1x-1
. . .
c1x
c1x+1
. . .
cnx-1
. . .
cnx
cnx+1
. . .
Time
Process Chain
cix = { Moving Average of Performance Indicator
at Process i Time x with a period }
{ Variance of Performance Indicator at Process i Time x with a period }
Performance Indicator: WIP, Throughput, Cycle Time, Yield, etc.
Visualization Coefficient
Manufacturing Condition Prediction Method

24
cix-1
Pn . . . Pi+1 Pi Pi-1 . . . P2 P1
. . .
Tx
Tx+1
Tx-1
. . .
. . .
cix
cix+1
. . .
ci-1x-1
. . .
ci-1x
ci-1x+1
. . .
ci+1x-1
. . .
ci+1x
ci+1x+1
. . .
. . .
. . .
. . .
. . .
. . .
. . .
. . .
. . .
. . .
. . .
c2x-1
. . .
c2x
c2x+1
. . .
c1x-1
. . .
c1x
c1x+1
. . .
cnx-1
. . .
cnx
cnx+1
. . .
Time
Process Chain
Type
A
B
C
Class
LB < < UB
cix
cix
cix
< LB . . .
. . .
. . .
UB <
=
=
Color
Area that has ignorable fluctuations
Supposed Condition of Material Flow
Focused area that fluctuations tends to occur
Special area that has to be stabilized
LB; Lower Boundary, UB; Upper Boundary
Some patterns are composed reflecting
supply fluctuation propagation
Manufacturing Condition Prediction Method

Process Chain
Mfg System Shut Down & Resumption
Tool Performance Fluctuation
TSUNAMI of WIP
• Special clusters was generated by tool performance fluctuations at the system resumption
• Accumulated WIP is transferred into the downstream
25 Manufacturing Condition Prediction Method

Manufacturing Logs
26 Manufacturing Condition Prediction Method
Future
Past
Process Chain
cix-1
Pn . . . Pi+1 Pi Pi-1 . . . P2 P1
. . .
Tx
Tx+1
Tx-1
. . .
. . .
ci-1x-1
. . .
ci+1x-1
. . . . . .
. . .
. . .
. . .
c2x-1
. . .
c1x-1
. . .
cnx-1
. . .
Now
Statistical Information Extraction
Manufacturing Simulation
Propagation Prediction

cix
cix+1
. . .
ci-1x
ci-1x+1
. . .
ci+1x
ci+1x+1
. . . . . .
. . .
. . .
. . .
. . .
. . .
c2x
c2x+1
. . .
c1x
c1x+1
. . .
cnx
cnx+1
. . .
Manufacturing Logs
27 Manufacturing Condition Prediction Method
Future
Past
Process Chain
cix-1
Pn . . . Pi+1 Pi Pi-1 . . . P2 P1
. . .
Tx
Tx+1
Tx-1
. . .
. . .
ci-1x-1
. . .
ci+1x-1
. . . . . .
. . .
. . .
. . . c2x-1
. . .
c1x-1
. . .
cnx-1
. . .
Now
Statistical Information Extraction
Manufacturing Simulation
Propagation Prediction

Maintenance Impact Study
Process Chain
Down Period
Time
• A tool down for maintenance is simulated in the former part of the process routing, and its down period is indicated at the time axis
•In the figure, several clusters can be seen composed by yellow and red
•Most of small clusters would occur by tool process time fluctuation, but some clusters are recognized as TSUNAMI
•Some of large TSUNAMI occurred from the down period
28
Machine Maintenance
Down for Maintenance

Maintenance Impact Study
Process Chain
Down Period
Time
29
Machine Maintenance
Oscillation
Pendulum Swing Phenomenon
• Along with time axis, TSUNAMI occurs not only by tool down directly, but also by the aftermath like an oscillation of pendulum swing
• Once large TSUNAMI occurs, production planning and scheduling should pay attention to this phenomenon

Maintenance Impact Study
Process Chain
Down Period
Time
30
Machine Maintenance
Stemming Phenomenon
•Along with process flow axis, some bottleneck processes stem TSUNAMI
•Even when a large TSUNAMI occurs, latter portion of the process routing might have no TSUNAMI Effect if a bottleneck tool is placed between TSUNAMI and the latter portion
Stemming Point
Down for Maintenance

31
Manufacturing System Size •Num of Process: About 1000 - 1300 •Num of Tools: About 400 •Num of Workers: About 150 •Frequency of Manufacturing Logs: About 1M Items/Day
Process Chain
Now
Machine Maintenance
Propagation Prediction
Logs Visualization
Tim
e
Result of Manufacturing Condition Prediction

Demonstration

Our Approach: S-Model Based Production System S-Model: Statistical Model 33
Process A Process B Process C
Group A Group B Group C
In maintenance
Step4
Materials
Parts
Step5
Step1 Step2 Step3
Step6 Step7
Disturbed by maintenance
Statistical Information Extraction
Operation Management
Manufacturing Logs Acquisition
Manufacturing Simulation
1. Manufacturing Condition Prediction 2. Pre-recovery Planning
Mathematical Model
1min – 1 day /cycle
6 hour – 1 day /cycle automatically

34
Time
Time-Based Maintenance Problem
1
2
3
Pro
cess
Ste
p
Vertical line indicates the process steps of the system, and horizontal like indicates time line. Therefore, production works moves from left top to right down along with green arrows.
a b c d Production Work

35
Time
1
2
3
Pro
cess
Ste
p
Maintenance
Delay
Time-Based Maintenance Problem
If the machine of process step 2 turns to maintenance condition, the maintenance schedule will disturb work b process, and that leads to manufacturing lead time delay.
In maintenance
a b c d

36
Time
1
2
3
Pro
cess
Ste
p
Maintenance
Findings of Maintenance Characters
a b c d
This study found almost all maintenance works have some margin between the maintenance scheduling period and the real maintenance work in the period.
Production Work
Maintenance schedule margin

37
Time
1
2
3
Pro
cess
Ste
p
Production Work
Concept of Proactive Scheduling for Maintenance (PSM)
Maintenance
So our approach optimizes both maintenance work schedules and production work schedule to avoid conflicts each other, even if the system has hundreds of process steps and various work types as “re-entrant type” system.
Slide

38 PSM Numerical Model
Period of Maintenance Plan
Ei,k-1 Bi,k tj
Job k-1 of Ai,s
Time Si,k+1
Job k+1 of Ai,s
Maintenance Job k
Ei,k
Maintenance Job k
Si,k
Target Lot Job r
S*i,k
E*i,k
Target Lot Job r
t*j
Slide Back of Maintenance Job
Slide Forward of Lot Job
A model in Machine i, Process s

39 PSM Overall Algorithm
Step.1 Initialization
Step.2 Scheduling time count up
Step.3 Lot selection for scheduling
Step.4 Process selection of the lot
Step.5 Candidate machine selection
Step.6 Schedule allocation by PSM model
Start
Time end
No lot
All process end
End
•This overall algorithm can not convince an optimal schedule for entire manufacturing lead time reduction, since this algorithm modifies the priority of production lot from input process to final process "by process".
•Therefore, PSM takes the multi-start method and the greedy method, to the selection criteria for both production lots and machines.

40 Multi-start Greedy Algorithm for PSM Optimization
Lj = {Lx | min(RDx / RWx) e-αC + RN0-1}
•Multi-start algorithm application for lot selection
Lj: Selected production lot
RDx: Time remaining until deadline date as of scheduling time t
RWx: Process time remaining as of scheduling time t
RN0-1: Random number between 0 and 1
α: Weighting coefficient applied to increase randomness
C: Number of starts
β < Ns
•Greedy algorithm application for machine selection
β: Threshold value
Ns: Number of machines in the job shop responsible for process s
When this formula is broken, then the procedure stops machine allocation and return to lot selection step.

41 Performance Verification of Multi-start Greedy Algorithm for PSM Optimization
Item
Method
Ratio Lagrangian Decomposition Coordination
Multi-start Greedy
Calculation Time (sec) 2491 3 830.2
Manufacturing Lead Time (min) 3604 3604 1.0
Total Slide Time (min) 6654 5241 1.3
Num of Slide Machine 2 1 2.0
1.Multi-start Greedy method and the Lagrangian Decomposition Coordination algorithm obtained the same result for the manufacturing lead time of the prototype lot
2.But Lagrangian Decomposition Coordination took approximately 830 times as much calculation time as Multi-start Greedy approach.
3.Lagrangian Decomposition Coordination-generated plan required rescheduling of two machines, while Multi-start Greedy method-generated plan only required rescheduling one machine.

42 Performance Verification of Multi-start Greedy Algorithm for PSM Optimization
1.While Lagrangian decomposition coordination method rescheduled maintenance for Machine No.40 and 79, Multi-start Greedy method only rescheduled Machine No.79.
2.Additionally, the slide volumes were lower in the latter method.
Maintenance No.
Machine No.
Slide Volume (min)
Lagrangian Decomposition Coordination
Multi-start Greedy
1 14 0 0
2 27 0 0
3 40 697 0
4 44 0 0
5 79 5957 5241

43 Performance Verification of Multi-start Greedy Algorithm for PSM Optimization
1.In the initial condition, an approximately 12,000-minute interference exists between the prototype lot schedule and the maintenance schedule for Machine No.79.
6000 9000 12000 15000 18000 21000 24000 27000 Scheduling Time (min)
Initial Condition
Idling Lagrangian Decomposition
Coordination
Maintenance Schedule Production Work Schedule
Conflict
Multi-start Greedy
Rescheduled Maintenance

44 Performance Verification of Multi-start Greedy Algorithm for PSM Optimization
2.Lagrangian Decomposition Coordination result shows a gap between the prototype lot schedule and Machine No.79 maintenance schedule, which represents wasted time.
3.Multi-start Greedy method result assigns a maintenance schedule to Machine No.79 just after the prototype lot schedule.
6000 9000 12000 15000 18000 21000 24000 27000 Scheduling Time (min)
Initial Condition
Idling Lagrangian Decomposition
Coordination
Maintenance Schedule Production Work Schedule
Conflict
Multi-start Greedy
Rescheduled Maintenance

45 PSM Application Sample
0
5
10
15
20
25
30
Manufacturing Lot Scheduled by PSM
Manufacturing Routing
Manufa
cturing L
ead T
ime (
days)
Scheduled Machine Maintenance
Lot Scheduled by Conventional Approach
4.5days
Num of Processes : Approx.1000 Num of Machines : Approx.400
1. System automatically collects all process start and finish times for all lots, so these data were collated to obtain the manufacturing lead times for each process.
2.In this sample, PSM schedules were provided to all of the offices in charge of machine maintenance
Main
tenance W
ork
Main
tenance W
ork
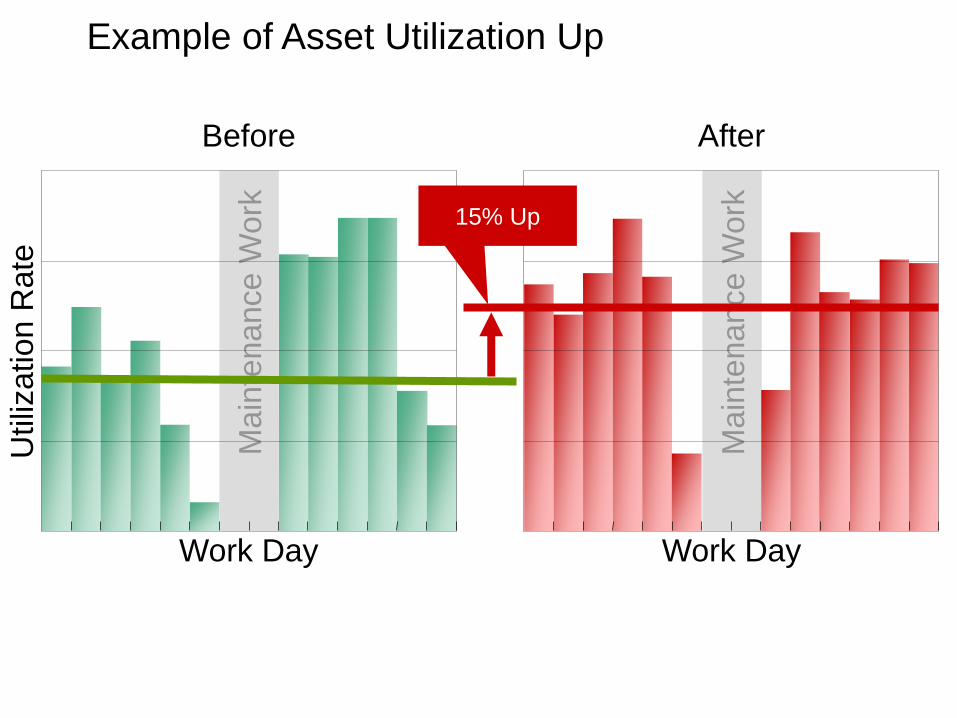
46 U
tiliz
ation R
ate
Work Day Work Day
Before After
15% Up
Example of Asset Utilization Up

Serv
ice R
ate
for
Due D
ate
100
98
96
94
92
90
Before After
Jul Jun Aug Sep May
47
8% Up
Example of Service Rate for Due Date
S-Model Based Production System S-Model: Statistical Model 48
Process A Process B Process C
Group A Group B Group C
In maintenance
Step4
Materials
Parts
Step5
Step1 Step2 Step3
Step6 Step7
Disturbed by maintenance
Statistical Information Extraction
Operation Management
Manufacturing Logs Acquisition
Manufacturing Simulation
Manufacturing Prediction & Pre-recovery Planning with Statistical Methods and Simulation Technologies
Mathematical Model
1min – 1 day /cycle
6 hour – 1 day /cycle automatically

49 Awards of S-Model Based Production System
2007 CIRP Manufacturing System,
Royal Academy of Engineering, Best Paper Award
2009 Japan Electrical Manufacturers' Association, Award
2010 Japan Society for Precision Engineering, Takagi Prize
2011 FANUC FA Robot Foundation, Paper Award
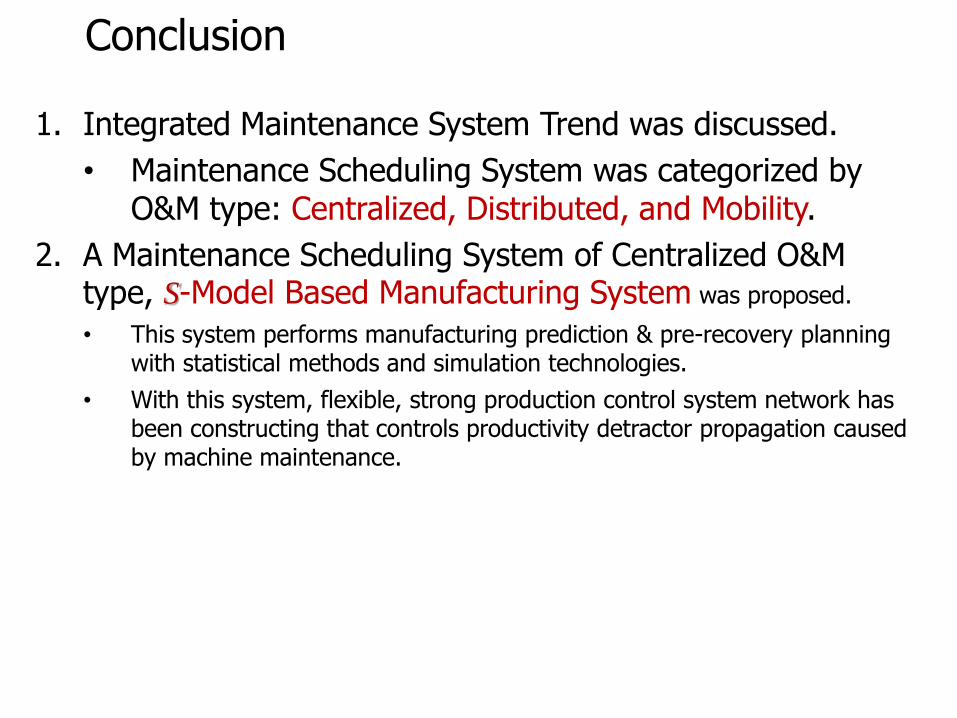
50 Conclusion
1. Integrated Maintenance System Trend was discussed.
• Maintenance Scheduling System was categorized by O&M type: Centralized, Distributed, and Mobility.
2. A Maintenance Scheduling System of Centralized O&M type, S-Model Based Manufacturing System was proposed.
• This system performs manufacturing prediction & pre-recovery planning with statistical methods and simulation technologies.
• With this system, flexible, strong production control system network has been constructing that controls productivity detractor propagation caused by machine maintenance.