Embed Size (px)
Citation preview

Integrated Management Systems - testing a model for integration
Sten Abrahamsson – MSc, Lecturer, Gotland University – [email protected]
Jonas Hansson – PhD, Ass. Professor, University West – [email protected]
Raine Isaksson – PhD, Senior Lecturer, Gotland University - [email protected]
Abstract Management systems are widely used for creating order, minimising risks and for assuring
performance. Management systems are in many occasions integrated since this has been
found to be beneficial. In this paper a model for a fully integrated management system (IMS)
based on the three axes of level, extent and scope of integration is tested for relevance. The
studied system permits the integration of all relevant process dimensions. The research is only
in a pilot stage, but the initial results are promising and indicate that there are advantages in
using the process view as a base for identifying critical aspects to be managed. A review of
the current situation for system integration is studied and the model is subjected to some tests
using Sweden as a case. The background study shows that system integration still is limited,
especially when comparing with a fully integrated IMS. The feedback from the organisations
interviewed is positive and supports continued work with development of the model.
Introduction Effective management requires a good management system. Management systems, e.g. those
used for quality management and environmental management, have been accused of being
bureaucratic and paper driven. In order to comply with the requirements, each management
system demands vast extent of documentation and written procedures. Previous research has
pointed out the challenge of handling several separate management systems and their
alignment with the organization’s strategy. Integrated Management Systems (IMS) have been
presented as a solution to decrease these negative consequences. In previous research, a
framework for a fully integrated management system based on managing all stakeholder
needs was presented (Abrahamsson & al., 2010). The framework describes management
systems using the three axes of level, extent and scope, see Figure 1.
Figure 1. Conceptual presentation of and IMS (Abrahamsson & al., 2010)
The theoretical framework needs to be validated by empirical findings. One important
question is whether the three chosen axes are relevant and if they are enough for capturing the
main elements in a fully integrated management system. Another important question is how to
Level
Max= full amalgamation
Extent
Max= All process/organisations in supply network
Scope
Max = All stakeholder needs
Organisation A
Organisation B

quantify the scales for level, extent and scope in such a way that these levels can distinguish
between systems of different maturity while being easy enough to understand for quick
deployment and assessment. Additionally we review the general situation of management
system integration to portray the general interest for integration and how far this work has
been carried out.
Methodology The relevance of the axes in Figure 1 is checked by interviewing companies working with
integrated management systems. The companies are randomly selected from a database
containing Swedish certified organisations. Sweden is believed to be a typical example for
European Union countries with respect to the number of certificates (Sampaio, et al. 2009)
and as such a relatively good example for developed countries. The model is presented to
interviewees for a quick comment on relevance. Based on literature studies and induction,
scales for the three axes in Figure 1 are proposed. Case-studies are used to test and develop
the framework in Figure 1 and the proposed scales. Extent, scope and level are tested using a
supply network approach looking at education from initial needs to use of knowledge. A
process is defined and a virtual process walk through is carried out. To simplify this we
choose a known educational product – a course in quality management – and analyse it from
input to output identifying the aspects that would need to be managed. The identified aspects
are then related to scope and extent in the framework and the proposed scales. Additionally
the scale for level is discussed and criteria are proposed. The purpose of this is testing model
relevance and the usability of the scales. Another case study is carried out looking at a
company that is certified according to quality management, environmental management and
work environment. The company is a medium sized organisation and operates within the
automotive sector. The case is chosen in order to outline integration strategies and reasons for
choosing integration. The general level of management system integration is reviewed based
on literature studies and with using Sweden as an example.
Integrating management systems There are several advantages with integrated management systems. Increased efficiency and
the possibility to develop management systems better matching stakeholder interests are some
reasons for integrating, see e.g. Miles & Russel (1997), Wilkinson & Dale (1999), Lundh
(2002), Ofori et al. (2002), Berg et al. (2003) Karapetrovic (2003), Zutshi & Sohal (2005) and
Abrahamsson & al. (2010). There are also studies indicating that integration is becoming
more common than stand-alone systems, see e.g. Bernado et al. (2009) and Karapetrovic &
Casadesús (2009).
In spite of all the apparent advantages it still seems that system integration has a long way to
go. Commonly only a few ISO-based management systems are integrated. Abrahamsson & al
(2010) point out that a fully developed IMS should have a scope that includes all relevant
stakeholder needs. The level of system integration should be high, close to amalgamation. The
extent should cover the entire supply chain from first supplier to last customer. The more
specific issues on level, extent and scope are reviewed below in more detail within the context
of proposing scales.
Defining scales for level, extent and scope of integration
Level of integration
Bernado et al. (2009) summarise different levels of integration that have been described by
several authors. We propose to extend the level scale to make it more descriptive. We propose
a 0 for the level of no integration, see Table 1. The number of integration levels is from two

Karapetrovic (2003) to four in Wilkinson and Dale (1999). The description that are closest to
our suggestion is Karapetrovic (2002) that goes from 1) Integrating documentation through 2)
aligning core processes, objectives and resources to 3) Creating an “all-in-one system”. We
have from our experience from companies and non-profit organisations seen that it is a rather
long step from level one to two and we believe that there are advantages in a more detailed
scale. These could be such as a better description of the level, which should be beneficial in
both assessing and improving performance. We therefore suggest six levels of integration as
presented in Table I.
Table I. Proposed maturity scale for the level of integration. Note that the previous level must
be included in the next higher level. Maturity level
Description Comments
0 No integration, x different separate systems.
1 A common system for documentation. Karapetrovic (2002)
2 Common audits internally and externally.
3 Common processes, systems for risk analyses, systems for non conformances, etc.
4 Common processes for managing objectives,
implementation and follow up.
Karapetrovic (2002)
5 Business plan and organisational management system are one. Full amalgamation.
Karapetrovic (2002)
Extent of integration The extent defines the proportion of all processes and all parts of the organisation included.
This could be graded with % from 0 to 100 with suitable increments. Ideally this would be
done based on a process chart of the entire organisation or supply chain. However, since most
organisations are defined by their functions an alternative way of looking at the extent would
be to look at the departments that have been integrated.
Table II. Proposed maturity scale for the extent of integration. Maturity level
Description Comments
0 No IMS in any process 0 %
1 Proportion of relevant processes in the chosen system 20 %
2 40 %
3 60 %
4 80 %
5 All processes and all organisation of the studied
system (supply network)
100% The limits of the studied
system can vary. On the highest level all organisations and all
processes in the supply network
are included
Relevant processes are defined as per the Pareto-principle identifying the 20% of the system
processes that correspond to 80% of the aspects. This is done because we estimate that few or
no organisations will define all of their processes.
Scope of integration – process dimensions included The scope could be set in relation to a fixed set of dimensions (quality, environment,
occupational health and safety, economy, information security, etc.) or set by amount of
management systems included out of those relevant for the process. Relevance of an aspect

would have to be defined by management taking into consideration the stakeholders involved.
When there are relevant aspects that need to be managed they should be part of the integrated
management system. A proposal for maturity of scope is presented in Table III.
Table III. Proposed maturity scale for the scope of integration. Maturity level
Description Comments
0 The management of the organisation is not following
or guided by any standard
1 No IMS but the organisation is following or guided by a standard
E.g. Quality or Environment
2 Integration of the processes has started and around 30
% of the identified risk are managed in an IMS
3 A broad perspective on all risks is taken and these are identified. More than 70% of the identified risks are
managed in an IMS
E.g. Quality, Environment and Health and safety
4 More than 90% of the identified risks are managed in
an IMS
5 All dimensions with relevant stakeholder needs are
managed in an IMS
A common structure of defining management system integration is to include quality,
environment and occupational health and safety and some common ISO standards. In Table
IV an example of such structure is presented based on Swedish empirical data.
Results from Sweden on the extent of management system integration Information about existing certificates in Sweden has been collected. The web page
www.certifiering.nu was used as a source. The web page belongs to a cooperation within the
organization SWETIC - Swedish Association for Testing, Inspection and Certification. This is
a trade association for companies that are accredited within testing, inspection and
certification. SWETIC provides a quality assured search of companies that have received one
or more certifications. All members are accredited by SWEDAC (Swedish Board for
Accreditation and Conformity Assessment) or by an equivalent foreign body. The purpose of
SWETIC is to provide a forum for member companies to discuss industry-wide issues.
SWETIC is also the industry's representative in the community and responds as such on
referrals from agencies on new laws, etc. The data does not include all certificates in Sweden,
but all of the big certification companies are cooperating with SWETIC. Of the companies
accredited by the Swedish accreditation body SWEDAC 8 of 10 are reporting to the data base
and none of the big companies is missing. We have made the interpretation that the database
is representative for the situation of management system certification in Sweden.
Results in Table IV show that there are three dominating areas for certification in Sweden,
Quality, Environment and Occupational Safety and Health. There are a several companies that
have more than one certificate. Large proportions (66-69%) have both quality and
environment. Around 13% of certified companies for quality and environment are also having
a management system for occupational health and safety. The information security standard
has not had a significant impact on integrated systems. Energy management systems are
included to a small extent to the number of integrated management systems (may be more
common in some type of industry).

We estimate that about 75% of those companies certified in Sweden are included in Table IV.
This would indicate almost 7000 ISO 9001 certificates.
Table IV. Number of certificates in Sweden collected from the database www.certifiering.nu
for different selection of standards.
Standard
ISO 9001 Quality management systems – Requirements
x x x x x x x
ISO 14001 Environmental management systems -- Requirements with guidance
for use
x x x x x x x
EMAS x OHSAS 18001 Occupational health and safety management systems – Requirements
x x x x
AFS 2001:1 Systematic work environment management
x x x
ISO 27001 Information security management systems – Requirements
x x x
SS62 77 50 Energy management systems – Specification
x
EN 16001 Energy management
systems – Specification x
Number 5104 4912 47 381 252 30 92 27 3376 318 197 85 6 4
The total number of companies in Sweden is more than 900 000, but if only those with 10 or
more employees are included then the number is 35000 (Ekonomifakta, 2010). This means
that out of the group of companies with more than 10 employees only about 20% would have
an ISO 9001 certificate. There probably are companies with quality management systems and
even those with systems that are not certified. Sampaio & al (2009) use the indicators of ISO
9001 certificates per 1000 persons and ISO 9001 certificates per companies above 10
employees. These two parameters seem to have a positive linear correlation with Sweden
placed well on the line drawn, when using data from 22 EU countries. Based on the graph the
figures for Sweden are 0.55 ISO 9001 certificates per 1000 persons and 17% of companies
with 10 or more employees having an ISO 9001 certificate. With a population of 9.4 million
in the end of 2010 (SCB, 2011) the number of certificates based on Sampaio & al. (2009)
would be about 5000. This supports the assumption of our estimated figure and indicates that
the maturity in Sweden for integrated management systems still is rather low. Sweden is in
the sample of 22 EU-countries close to the middle with eight countries scoring higher on the
per capita indicator. This means that our results could also serve as an indication for the
situation in the EU-countries.
Relevance of proposed framework From the selected database we chose companies with quality, environmental and occupational
health and safety management systems (318 companies for ISO 9001, ISO 14001and OHSAS
18001 + 197 companies for ISO 9001, ISO 14001and AFS 2001:1). From the selection we
chose every 25th
company for an interview. This gave us 20 companies to contact. We
reached 18 of them and conducted a phone interview describing our model and asking what
they thought about the proposed framework and the three axes of scope, level and extent.
Additionally we asked them to grade themselves using the proposed structure.
We also included an open question about further development of their management system,
how it was developed and the most important parts in the system.

The model was perceived as easy to understand and 17 of 18 had no difficulty to define the
organization's position on the different dimensional scales. The graduation was perceived as
relevant. Results from the self assessment carried out by the interviewees in Table V.
Table V. Result from self-estimation of level of integration made by 18 interviewed
companies Level 0-5 Extent % Scope (Number of standards)
Average 3,8 94 3
Max 5 100 4
Min 2 80 3
Grading of the level has a weakness relating to the difficulty of deciding which parts of the
organization that should be considered. The level can vary within the organization. Depending
on how we want to use the model we can use the lowest value or mean and we could also
indicate a range.
A remark made on the level graduation was that there are external auditors who cannot handle
all areas (audit team should be able to do this). Another complication with assessing the level
could be that several models for risk analysis might be needed giving the impression that
systems have not been integrated. However, it could be that there are functional requirements
that specify a certain type of risk analysis. The company that had some difficulties to see the
usefulness of the model is a large public organization that certifies only when there is external
demand for this. Systems audits at the corporate level were not conducted.
The reason for that we in this interview scored relatively high on the scales may be that we in
our interview sample as entry criteria had a certification in three areas. It can be assumed that
these companies have come a long way in their integration, which could explain why the
scope and level is assessed as relatively high. Another explanation could be that companies
still see integration based on existing areas of ISO certification and not based on all risks that
need to be managed in different dimensions. The interviews were relatively short and the
interviewees only had the numeric scale as a base not all the details found in Tables I, II and
III. Here, further research testing the scales is needed. However, we have found support for
the relevance of using the proposed three axes of level, extent and scope. The attempt to
visualize the integration was positive according to our interviews. The need for this is for both
top management and for employees and other stakeholders.
The summarised findings from the interviews were:
• The model can easily be understood by those interviewed
• Graduations are perceived as realistic
• Interviewees could relatively easy place their company using the model
• The visualization was seen as positive
• The companies interviewed were relatively high on the scale of self-estimation.
In Figures 2 and 3 we have illustrated the interview results.
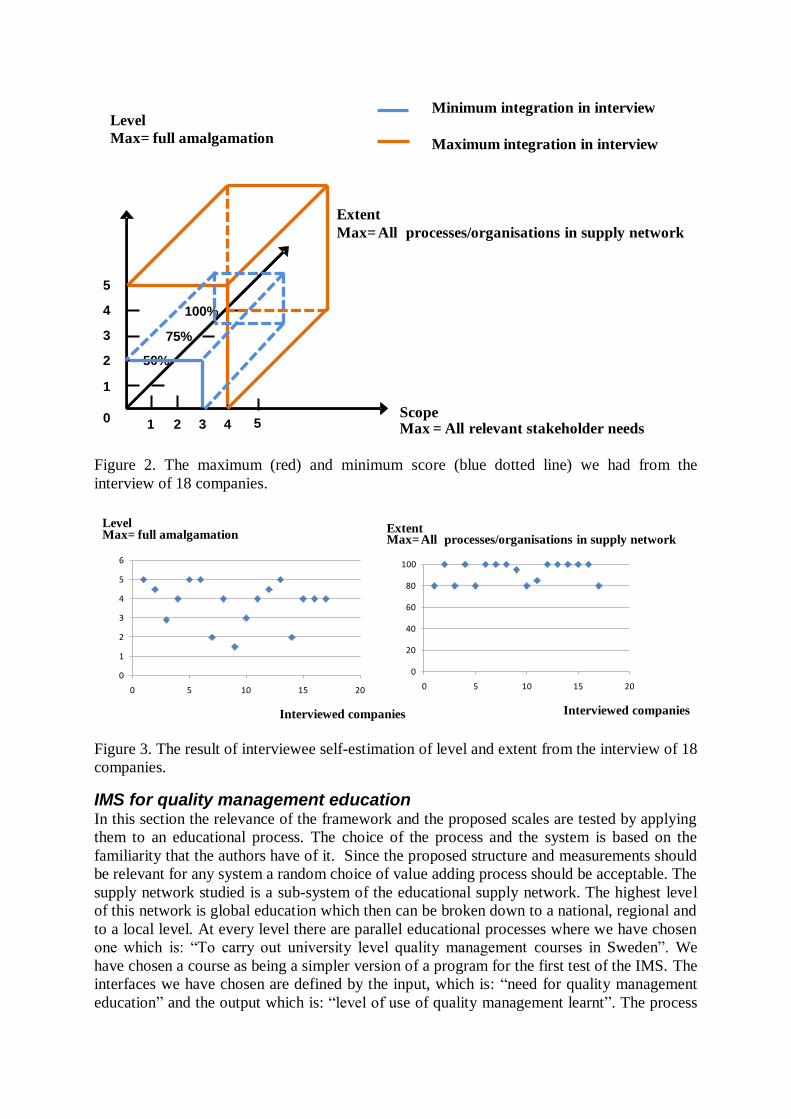
Figure 2. The maximum (red) and minimum score (blue dotted line) we had from the
interview of 18 companies.
Figure 3. The result of interviewee self-estimation of level and extent from the interview of 18
companies.
IMS for quality management education In this section the relevance of the framework and the proposed scales are tested by applying
them to an educational process. The choice of the process and the system is based on the
familiarity that the authors have of it. Since the proposed structure and measurements should
be relevant for any system a random choice of value adding process should be acceptable. The
supply network studied is a sub-system of the educational supply network. The highest level
of this network is global education which then can be broken down to a national, regional and
to a local level. At every level there are parallel educational processes where we have chosen
one which is: “To carry out university level quality management courses in Sweden”. We
have chosen a course as being a simpler version of a program for the first test of the IMS. The
interfaces we have chosen are defined by the input, which is: “need for quality management
education” and the output which is: “level of use of quality management learnt”. The process
1
2
5
4
530
1 2
3
4
100%
75%
50%
Level
Max= full amalgamation
Extent
Max= All processes/organisations in supply network
ScopeMax = All relevant stakeholder needs
Minimum integration in interview
Maximum integration in interview
0
20
40
60
80
100
0 5 10 15 20
Interviewed companies
ExtentMax= All processes/organisations in supply network
0
1
2
3
4
5
6
0 5 10 15 20
LevelMax= full amalgamation
Interviewed companies

is seen from the perspective of the provider of education since the purpose is to identify
elements for an IMS. In Table VI we have described the proposed sub-processes of the
educational process. The process is also described in Figure 4.
Table VI. Process Table with sub-processes describing the process to provide quality
management education starting with a need and ending with the acquired education being
used. Process step Input Output Stakeholders Comment
Marketing the
university
and quality management
Need for quality education
Interest in some course or
courses of the
university studied
Student, University
Management
The output could be seen as a potential student that has
chosen the studied university
Selling a
course
Interest for some
quality
management courses
Application for
a particular
course
University
Management
The output is a course
application
Approval
process
Application Decision on
acceptance
University
Management, Student,
Lecturer
Education Accepted
students with an initial level of
knowledge
Students with
acquired QM-knowledge
Student,
lecturer, management,
State (use of
funds, type of education)
Those leaving can be
graduated or drop-offs with level of graduation being an
important Key Performance
Indicator
Using the
knowledge
Student with
acquired level of
quality management
Level of use of
quality
management learnt
Student,
Employer,
state (employability)
Usability of education as
what has been taught and
what has been retained of that.
Based on the identified stakeholders their needs can be exemplified, which then gives an idea
of the scope of the management system needed (which dimensions are involved). The scope is
needed to assess both level of integration and extent of use. Identification of the scope could
be done by interviewing different stakeholders on the critical parameters they need to control
in the process. Here, we base this part on our understanding of the educational process. In
Table VII some examples of stakeholder needs that could need management in the studied
course process.
The presentation in Table VII indicates that quality and economic indicators are important. In
addition to the process dimensions identified in Table VII there could be others. For lecturers
and for students there could be occupational health and safety aspects such as stress and social
aspects and gender equality as well as other diversity issues. Concerning the running of the
university premises and managing technology used there are energy and carbon emissions
issues. One important process is travel of personnel and students. The course content and to
the extent it takes up sustainable development could be an aspect. It could be argued that there
are synergies between quality management and sustainable development (Isaksson, 2006).
This means that we in the start would review all dimensions as proposed in Abrahamsson &
al. (2010). See Table VIII

Table VII. Proposed indicators required for identified stakeholders in the process of quality
education. GAP refers to measuring service quality using the GAP-model (Zeithaml & al,
1990). Process step Student Lecturer University
Management State Employer
Marketing the
university and
quality management
Can my needs
be fulfilled
with available resources?
Selling a
course
Is this the
right thing
(level and content)?
Approval
process
Time for reply Right number
of students; Level of
competence
Budgeted
number
Education Service
quality (GAP) – received
service
compared to expectations
Level of work
needed, Throughput;
Student
satisfaction
Budgeted time
for work; Throughput;
Student
satisfaction
Throughput;
Student satisfaction
Using the
knowledge
Usability as
final student
satisfaction; Competence
value per
resources used
Relevance of
Course Plan
content
Employability Competence
received
compared to expectations
(GAP)
Results from Table VII indicate that there should be several quality indicators that need to be
monitored with indicators being corresponding both to the user based and the value based
perspective (Garvin, 1988). A general comment is that there seem to be many indicators that
should be managed within the scope of quality and economy that currently are not managed.
Table VIII. Process dimensions to be considered in quality management. Dimensions are from
Abrahamsson & al. (2010) and compared with identified stakeholders. Relevance for risk
management is assessed with a scale from 1-5 (as average of the author assessment and with 5
as most important).
Stake-
holder
Account-ability
Ethical behavio
ur
Transpa-rency
Econo-my
Health and
Safety
Quality
Envi-ronment
Job security
Student 2 2 3 5 2 5 2
Lecturer 3 3 2 3 4 3 3 5
Univ.
Manag. 3 3 2 5 4 3 2 4
State 5 1 4 4 2 3 2
Employer 5
Nature 4
Total 13 9 11 17 12 19 13 9

The presentation in Table VIII should be primarily seen as a test of how to prepare a reference
for the scale of IMS scope. The assessment is dynamic and the proposal in Table VIII reflects
the current situation in a Swedish University. For example for the student the ethical
behaviour of the university is normally not a problem. Ethical behaviour is important, but
within the current structure it is not a priority risk that needs to be managed. Nature has been
added as a stakeholder. Normally there are advocates in the form of NGOs and legislation, but
even in their absence the effect of education should be considered. The direct effects from
carrying out quality management education are at the level of 1, but the indirect effects are
assessed as 4. The reason is that the content of the education which deals with improving
value adding to customers also could be used to improve environmental performance and to
work with sustainable development. In Sweden it is a legally defined requirement that
universities should work with sustainable development. Looking at the total sum, Quality and
Economy emerge as the most important dimensions. Which dimensions to include should be
discussed with stakeholders. Our proposal is to include any dimension that has at least one
level 3 stakeholder, see Table VIII. This means that in our example the benchmark scope for
Table III includes all eight dimensions in Table VIII. The level assessment could be based on
to what extent the eight dimensions are integrated into the management system using Table I.
The reference for extent could be defined by identifying key processes in the system studied.
The main process and its sub-processes are described in Table VII. However, to enable these
processes to work, management and support processes are needed. The system studied could
be described using a process based system model (Isaksson, 2006). In Figure 4 a proposed
description of Quality Management education as described in Table VI with addition of
generic management and support processes. Processes in Figure 4 should only be seen as
examples. Relevant processes need to be identified by the stakeholders concerned.
Figure 4. A process based system model describing the process of carrying out Quality
Management (QM) education in Gotland University, adapted from Isaksson (2006).
Input
Managing courses
Supporting courses (developing
courses, providing IT-services,
class rooms, information,
registration etc.)
External resources – Sweden, Gotland University
Marketing and selling education
Resources (lecturer competence
and time, support for development
etc.)
Drivers
OutputOut-
comeCarrying out quality education Using
knowledge
Admitting students
Needs for quality
Education; Otherstakeholder
needs
Students with
acquired QM-knowledge; Other
effects affecting
stakeholders
Level of use of
QM education learnt
With identification of the key processes in an organisation, which could be management, main
or support processes, we can define the reference for the benchmark of the scale for “Extent”.
The example highlights the need of having a reasonably high level of process maturity to be
able to define extent. Similarly the scope defined by process definitions requires an agreement
within the organisation of which the different process dimensions are.
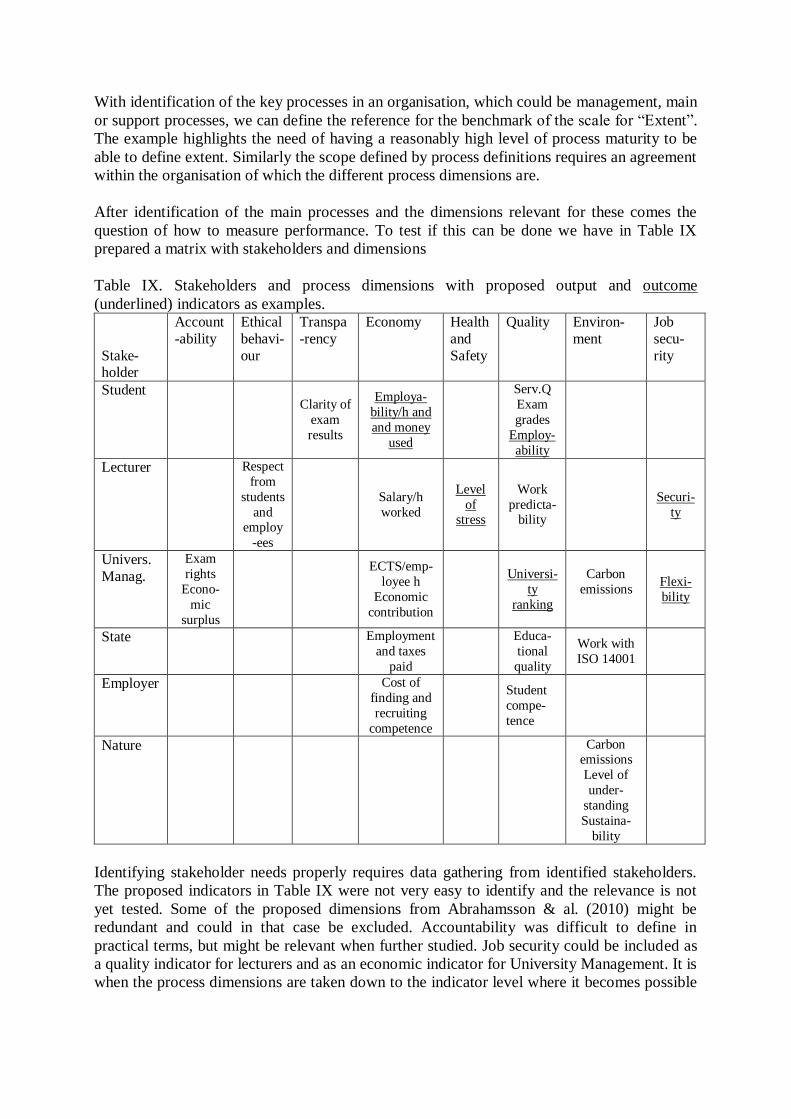
After identification of the main processes and the dimensions relevant for these comes the
question of how to measure performance. To test if this can be done we have in Table IX
prepared a matrix with stakeholders and dimensions
Table IX. Stakeholders and process dimensions with proposed output and outcome
(underlined) indicators as examples.
Stake-holder
Account
-ability
Ethical
behavi-
our
Transpa
-rency
Economy
Health
and
Safety
Quality
Environ-
ment
Job
secu-
rity
Student
Clarity of
exam
results
Employa-
bility/h and
and money
used
Serv.Q
Exam
grades
Employ-
ability
Lecturer
Respect
from
students
and employ
-ees
Salary/h
worked
Level
of stress
Work
predicta-bility
Securi-
ty
Univers.
Manag.
Exam
rights
Econo-
mic
surplus
ECTS/emp-
loyee h
Economic
contribution
Universi-
ty
ranking
Carbon
emissions
Flexi-
bility
State
Employment
and taxes
paid
Educa-
tional
quality
Work with
ISO 14001
Employer
Cost of
finding and
recruiting
competence
Student
compe-
tence
Nature
Carbon emissions
Level of
under-
standing
Sustaina-
bility
Identifying stakeholder needs properly requires data gathering from identified stakeholders.
The proposed indicators in Table IX were not very easy to identify and the relevance is not
yet tested. Some of the proposed dimensions from Abrahamsson & al. (2010) might be
redundant and could in that case be excluded. Accountability was difficult to define in
practical terms, but might be relevant when further studied. Job security could be included as
a quality indicator for lecturers and as an economic indicator for University Management. It is
when the process dimensions are taken down to the indicator level where it becomes possible
to check the relevance of a proposed dimension. Here, further research is needed and possibly
the number of dimensions defining the reference for scope could be reduced.
IMS in a medium sized automotive supplier This case has been included in order to outline integration strategies and reasons for the
chosen integration model. The empirical material was collected by interviewing the quality
management manager.
The organisation is certified according to ISO 9001 and ISO 14001. The organisation also has
an Occupational Health and Safety management system. According to the manager the 14001
system is integrated with the Occupational Health and Safety management system since it
makes more sense in their context. The 9001 and 14001 management systems are integrated
to the extent that some of the core documentation is aligned along with core processes in the
purchasing department, but except from this the systems could be considered as separately
handled.
The reasons for not fully integrating all systems are partly due to lack of competence and
experience. For example most of the internal auditors are not sufficiently trained and
experienced to make an audit that covers both quality management and environmental
management. The manager also stressed the need of further elucidation of the prerequisites of
how to achieve successful integration. Aspects that were pointed out as essential were the
maturity level of the organisation and involved staff, along with evident benefits of an
integration effort.
Conclusions The level of management system integration in Sweden still seems to be low. In Sweden
about 20% of companies with more than ten employees have an ISO 9001 certificate. Out of
the 20% only about 13% have an IMS with the three systems Quality, Environment and
Occupational Health and Safety. This means that less than 3% of the total population of
companies with 10 employees or more have an IMS with the basic scope relevant for most
companies. Since the use of an IMS has been found to be beneficial there still is an important
non realised improvement potential in further integration. One of the issues that could support
integration work is to better clarify the benefits of integration.
The main conclusion for the studied model describing an IMS with the axes Level, Extent and
Scope is that these seem to be relevant and that they could be used. The model has been
simple to describe for the interviewed companies and organisation and it has been positively
received particularly because of the visualisation it provides. The grading of Level seems to
be relevant based on the interviews. The definition of Extent and Scope was handled well by
the interviewees. However, when studying a process based on the significant aspects from a
stakeholder risk analyses perspective the issue of defining Scope and Extent becomes
complex. Still, the indication is that the Extent and Scope are relevant. The work should start
with identifying the magnitude of Scope – how many different process dimensions to
consider? Here, the proposed criterion is to include all those dimensions where there is a
stakeholder with a significant aspect. This gives the number of process dimensions to include.
With the identified Scope for the system its processes can be studied using a process based
system model to identify the Extent that processes have included the identified dimensions.
The maximum level of the Extent for a process is defined as including all the dimensions
identified for the Scope. For defining the system reference of 100% one option could be to
choose an average of the most relevant processes. Relevance could be defined relatively using

the Pareto principle. This would limit the number of processes to be assessed for Extent and
for Scope and make it more manageable.
Discussion Our research is in a preliminary stage and has mainly served to provide a number of working
hypotheses for how fully integrated management system could be visualised when studying
organisations and supply chains as process based systems. Further research is required in
further defining the scales for Level, Extent and Scope with focus on Scope and Extent.
The preliminary results for Sweden could possibly be generalised for the European Union.
Sweden is close to the median for the European Union countries based on the number of ISO
9001 certificates (Sampaio et al., 2011). To the extent that integration follows the number of
certificates the low level of integration found in Sweden with less than 3% of companies
having an IMS for Quality, Environment and Occupational Health and Safety could apply for
the entire European Union. One possible reason for the low level of integration mentioned is
that the benefits are not obvious.
References Abrahamsson, S., Hansson, J. and Isaksson, R. (2010).” Integrated Management Systems –
advantages, problems and possibilities”, 13th Toulon-Verona Conference University of
Coimbra, 2nd – 4th September 2010.
Berg, H. P., Beckmerhagen, I. A., Karapetrovic, S. V. and Willborn, W. O. (2003).
"Integration of management systems. Focus on safety in the nuclear industry." International
Journal of Quality & Reliability Management 20(2): 210-228.
Bernardo, M., Casadesus, M., Karapetrovic, S. & Heras, I. (2009). ”How integrated are
environmental, quality and other standardized management systems? An empirical study”
Journal of Cleaner Production 17(8): 742–750
Certifiering (2011). www.certifiering.nu (in Swedish) – downloaded June 21, 2011.
Ekonomifakita (2010). Företagens storlek (in Swedish).
http://www.ekonomifakta.se/sv/Fakta/Foretagande/Naringslivet/Naringslivets-struktur/ -
downloaded July 11, 2011.
Garvin, D.A. (1988). Managing Quality. The Free Press, New York.
Isaksson, R. (2006). Total Quality Management for Sustainable Development – process based
system models. Business Process Management Journal, 12 (5), 632-645.
Karapetrovic, S. (2002) Strategies for the integration of management system and standards.
The TQM Magazine, 14(1): 61-67.
Karapetrovic, S. (2003). "Musings on integrated management systems." Measuring Business
Excellence 7(1): 4-13.
Karapetrovic, S. & Casadesús, M. (2009). Implementing environmental with other
standardized management systems: Scope, sequence, time and integration. Journal of Cleaner
Production, 17, 533-540.

Lundh, J. (2002). Trippelintegrerade ledningssystem. Samordning av ledningssystem för
kvalitet, arbetsmiljö och miljö. Master thesis. Luleå, Sweden, Luleå University of Technology
(In Swedish).
Miles, M. P. and Russel, G. R. (1997). "ISO 14000 Total Quality Environmental
Management. The integration of environmental marketing, Total Quality Management, and
corporate environmental policy." Journal of Quality Management 2(1): 151-168.
Sampaio, P, Saraiva, P. and Rodrigues, A.M. (2009). A Statistical Analysis of ISO 9000-
Related Data for European Union Ultra-Peripheral and Portuguese Regions. Quality
Management Journal, 16(2), 45-58.
Ofori, G., Gang, G. and Briffett, C. (2002). "Implementing environmental management
systems in construction: lessons from quality systems." Building and Environment 37(12):
1397-1407.
SCB (2011). SCB, Befolkningsstatistik (In Swedish).
http://www.scb.se/Pages/TableAndChart____262459.aspx - downloaded July 12, 2011.
Wilkinson, G. and Dale, B. G. (1999). "Integrated management systems: an examination of
the concept and theory." The TQM Magazine 11(2): 95-104.
Wilkinson, G. & Dale, B.G. (2001). Integrated management system: A Model based on a total
quality approach. Managing Service Quality 11(5): 318-330.
Zeithhaml, V.A., Parasuraman and A., Berry, L.L. (1990). Delivering Quality Service -
Balancing Customer Perceptions and Expectations. The Free Press, New York.
Zutshi, A. & Sohal, A.S. (2005). Integrated management system – The experience of three
Australian organisations. Journal of Manufacturing Technology Management, 16(2): 211-232.