Embed Size (px)
Citation preview

Integrated Math 1
Course Standards
& Resource Guide

1
Integrated Math 1
Unit Overview
Fall Spring
Unit 4:
Creating, Solving, and Graphing Equations w/Two or More Variables
Unit 12:
Transformations
Unit 5:
Solving Systems of Equations/Inequalities
Unit 13:
Congruency
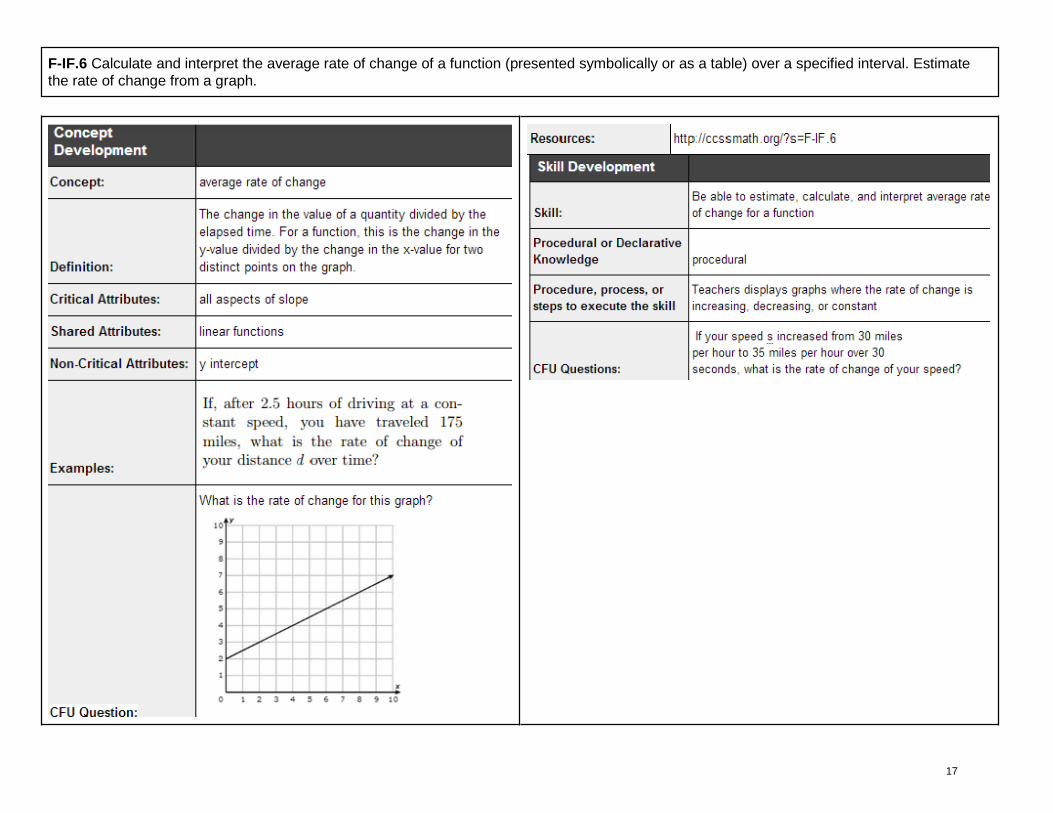
Unit 6:
Creating, Solving, and Graphing Exponential
Equations
Unit 14:
Coordinate Proofs
Unit 10:
Statistics
Unit 3:
Creating and Solving Inequalities
Unit 11:
Introduction to Geometry
Unit 7:
Interpreting Functions
Unit 8:
Analyzing to Build Functions
Unit 9:
Sequences
Unit 1:
Unit Conversion
Unit 2:
Creating and Solving Equations

2
Integrated Math 1
Unit 1: Unit Conversion
Unit 2: Creating and Solving Equations
Unit 3: Creating and Solving Inequalities
Unit 4: Creating, Solving, and Graphing Equations w/Two or More Variables
Unit 5: Solving Systems of Equations/Inequalities
Unit 6: Creating, Solving, and Graphing Exponential Equations
Unit 7: Interpreting Functions
Unit 8: Analyzing to Build Functions
Unit 9: Sequences
Unit 10: Statistics
Unit 11: Introduction to Geometry
Unit 12: Transformations
Unit 13: Congruency
Unit 14: Coordinate Proofs

3
Integrated Math1 Course Standard and Resource Guide
Unit 1: Unit Conversion
Overview Reason quantitatively and use units to solve problems.
Standards
N-Q.1
Use units as a way to understand problems and to guide the solution of multi-step problems; choose and interpret units consistently in
formulas; choose and interpret the scale and the origin in graphs and data displays.

4
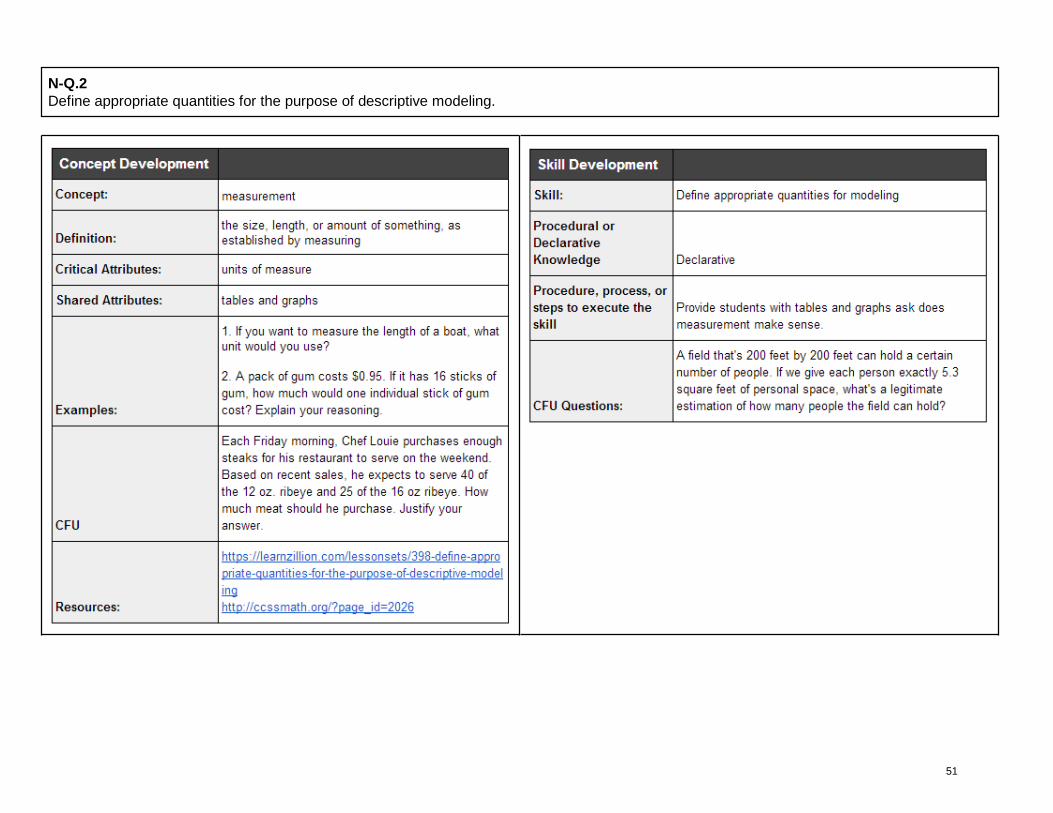
N-Q.2
Define appropriate quantities for the purpose of descriptive modeling.

5
N-Q.3. Choose a level of accuracy appropriate to limitations on measurement when reporting quantities.

6
Integrated Math1 Course Standard and Resource Guide
Unit 2: Creating and solving equations
Overview: Interpreting the structure of expressions, creating and understanding the reasoning of solving equations
Standards:
A-SSE.1 Interpret expressions that represent a quantity in terms of its context.
a. Interpret parts of an expression such as terms, factors and coefficients(focus on this part only at this time)
b. Interpret complicated expressions by viewing one or more of their parts as single entity. For example interpret P(1+r)n as the product of P and a factor not
depending on P.
A-CED.1 Create equations and inequalities in one variable including ones with absolute value and use them to solve problems.

7
Include equations arising from linear and quadratic functions, and simple rational and exponential functions. CA
[Linear and exponential (integer inputs only)]

8
A-REI.1Explain each step in solving a simple equation as following from the equality of numbers asserted at the previous step, starting from the
assumption that the original equation has a solution. Construct a viable argument to justify a solution method.

9
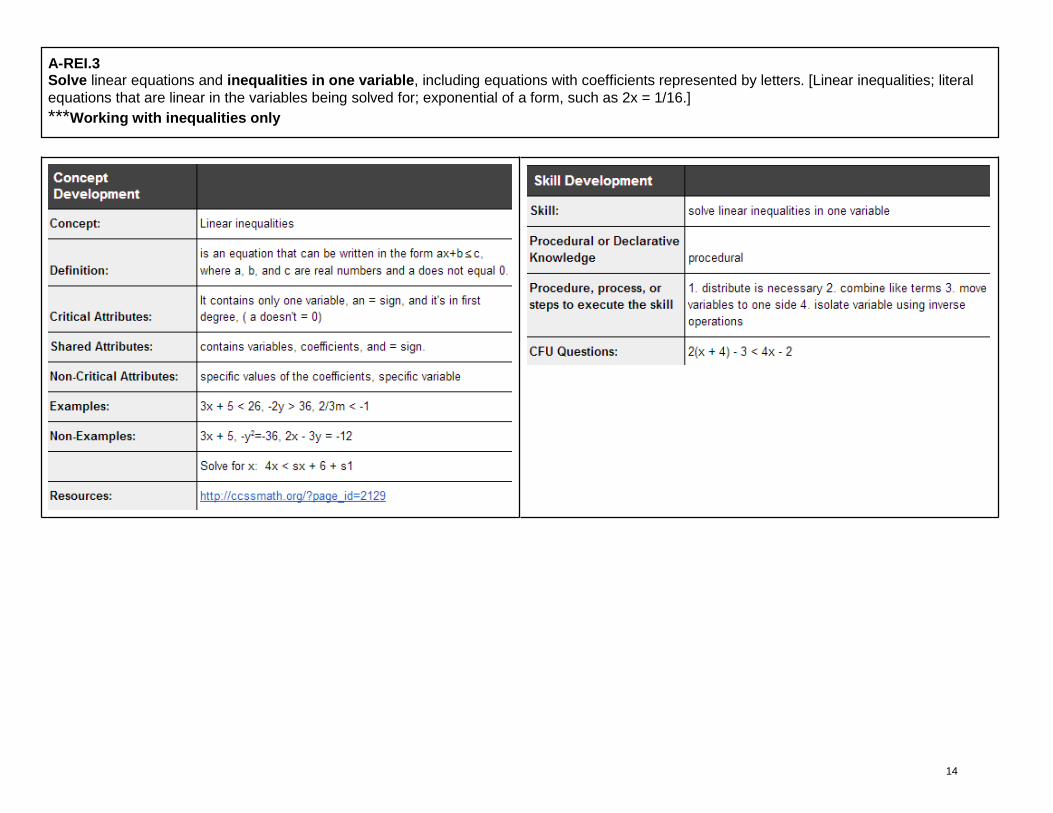
A-RE.3 Solve linear equations and inequalities in one variable, including equations with coefficients represented by letters. [Linear inequalities; literal equations that are linear in the variables being solved for; exponential of a form, such as 2x = 1/16.]
10
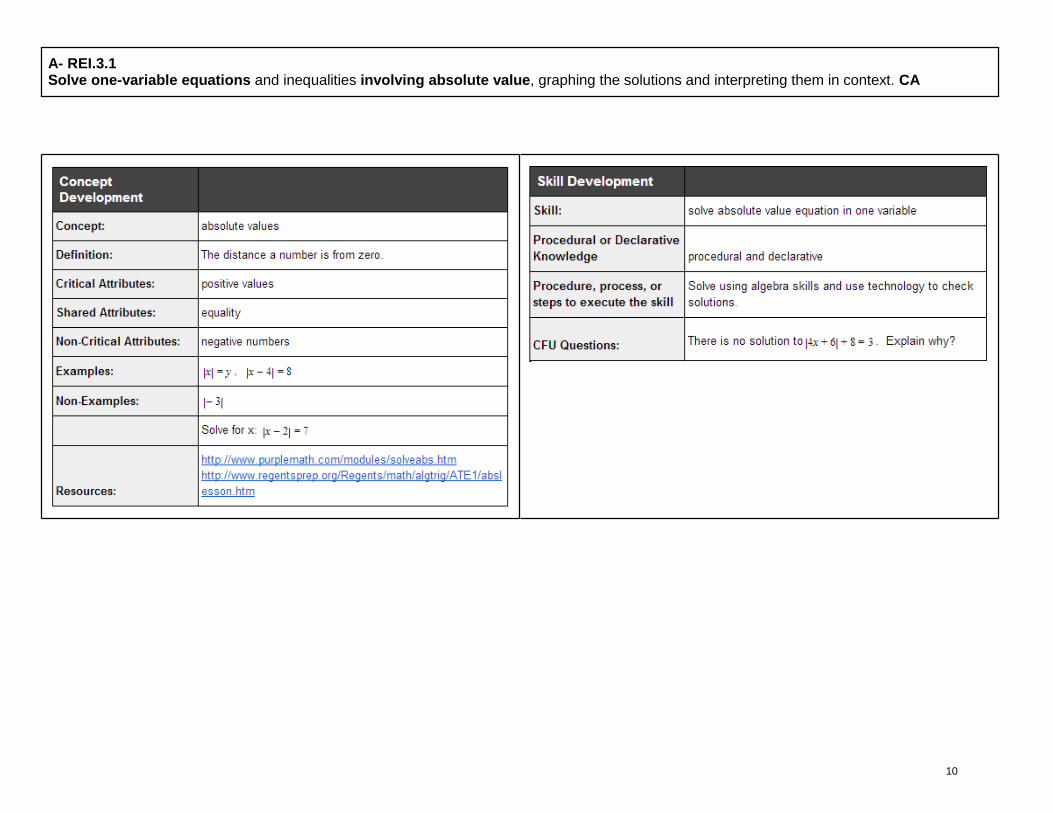
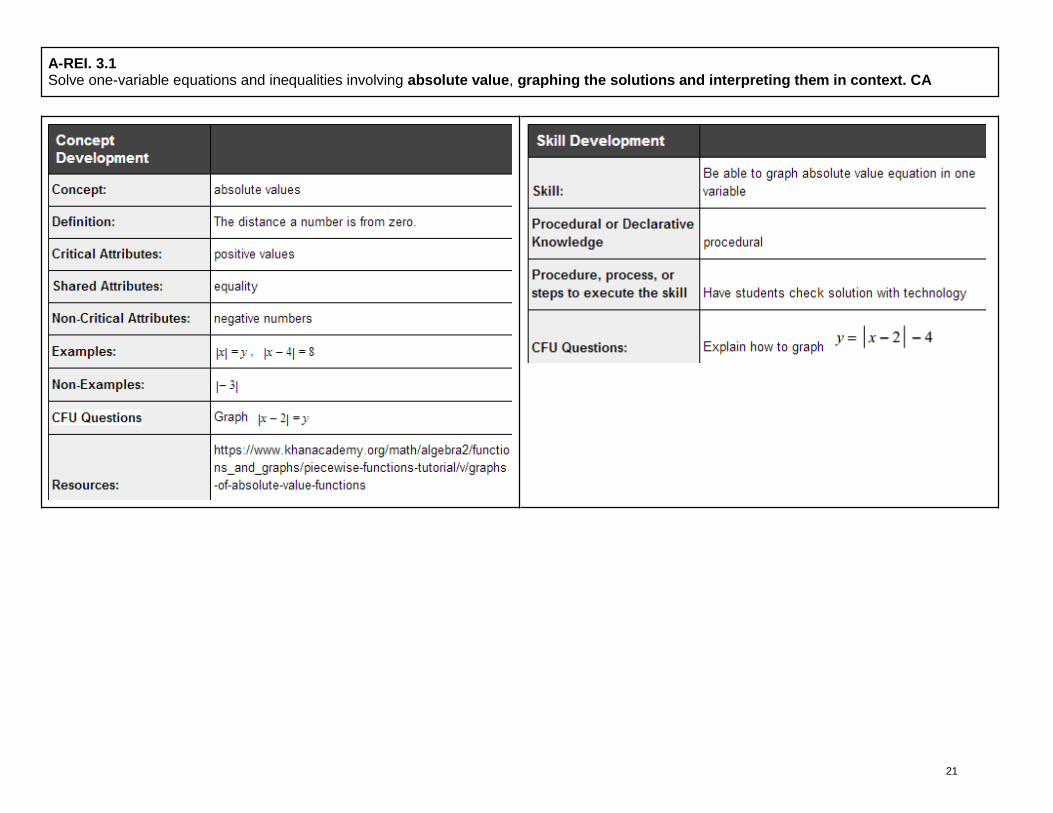
A- REI.3.1 Solve one-variable equations and inequalities involving absolute value, graphing the solutions and interpreting them in context. CA

11
A-CED.4 Rearrange formulas to highlight a quantity of interest, using the same reasoning as in solving equations. For example, rearrange Ohm’s
law V = IR to highlight resistance R

12
Integrated Math1 Course Standard and Resource Guide
Unit 3: Creating and solving inequalities
Overview Interpreting the structure of expressions, creating and understanding the reasoning of solving inequalities
Standards:
A-CED.1 Create equations and inequalities in one variable including ones with absolute value and use them to solve problems. Include equations arising from linear and quadratic functions, and simple rational and exponential functions. CA [Linear and exponential (integer inputs only)] ***Working with inequalities only

13
A-REI.I Explain each step in solving a simple equation as following from the equality of numbers asserted at the previous step, starting from the
assumption that the original equation has a solution. Construct a viable argument to justify a solution method
***Working with inequalities only
14
A-REI.3 Solve linear equations and inequalities in one variable, including equations with coefficients represented by letters. [Linear inequalities; literal
equations that are linear in the variables being solved for; exponential of a form, such as 2x = 1/16.]
***Working with inequalities only

15
A.REI 3.1 Solve one-variable equations and inequalities involving absolute value, graphing the solutions and interpreting them in context. CA

16
Integrated Math1 Course Standard and Resource Guide
Unit 4: Creating, solving and graphing equations two or more variables
overview: Creating and graphing linear equations, inequalities and absolute value
Standards:
A-CED.2.
Create equations in two variables to represent a relationship between quantities; graph equations on a coordinate axes with labels and scales.
17
F-IF.6 Calculate and interpret the average rate of change of a function (presented symbolically or as a table) over a specified interval. Estimate
the rate of change from a graph.

18
A-REI.10
Understand that the graph of an equation in two variables is the set of all its solutions plotted in the coordinate plane, often forming a curve (which could be a line).

19
G.GPE.5 Prove the slope criteria for parallel and perpendicular lines and use them to solve geometric problems (e.g., find the equation of a line parallel or perpendicular to a given line that passes through a given point)

20
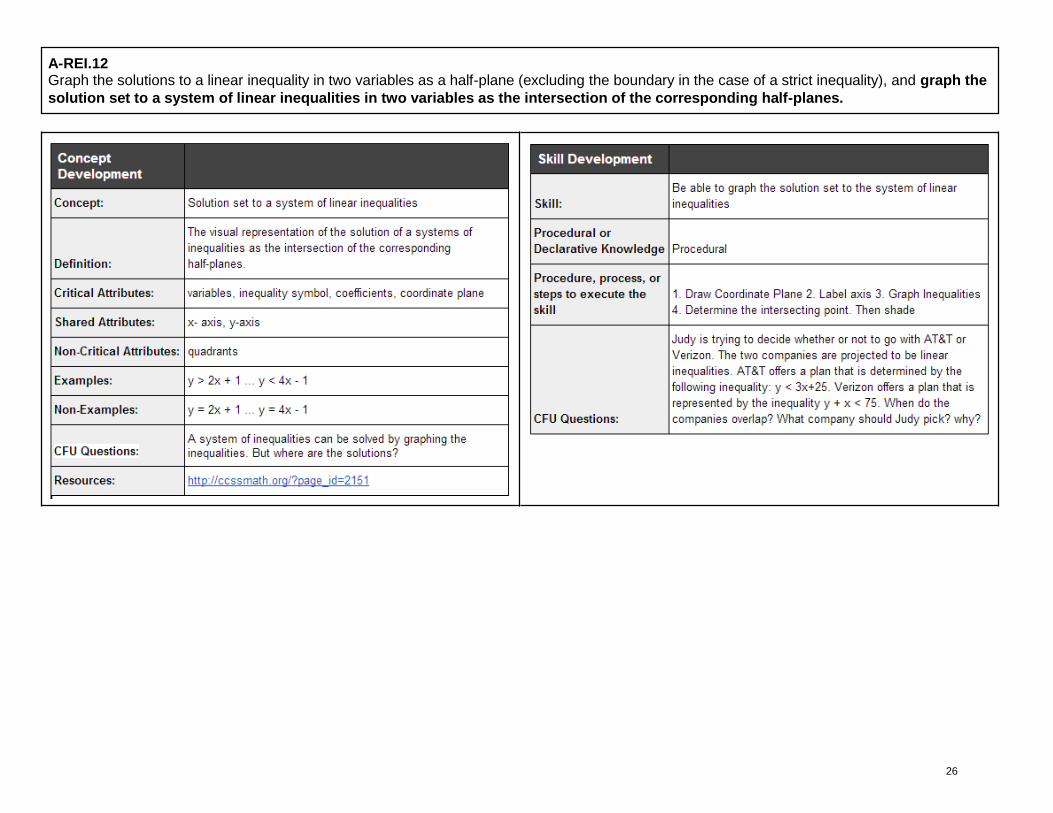
A- REI.12 Graph the solutions to a linear inequality in two variables as a half-plane (excluding the boundary in the case of a strict
inequality), and graph the solution set to a system of linear inequalities in two variables as the intersection of the corresponding half-planes.
21
A-REI. 3.1 Solve one-variable equations and inequalities involving absolute value, graphing the solutions and interpreting them in context. CA

22
A-CED.3 Represent constraints by equations or inequalities, and by systems of equations and/or inequalities, and interpret solutions as viable or
non-viable options in a modeling context. For example, represent inequalities describing nutritional and cost constraints on combinations of different foods.

23
Integrated Math1 Course Standard and Resource Guide
Unit 5: Solving system of equations/inequalities
Overview: Solving system of equations/inequalities algebraically and graphically
Standards:
A-REI.11 Explain why the x-coordinates of the points where the graphs of the equations y = f(x) and y = g(x) intersect are the solutions of the equation f(x) = g(x); find the solutions approximately, e.g., using technology to graph the functions, make tables of values, or find successive approximations. Include cases where f(x) and/or g(x) are linear, polynomial, rational, absolute value, exponential, and logarithmic functions.

24
A-REI.6
Solve systems of linear equations exactly and approximately (e.g., with graphs), focusing on pairs of linear equations in two variables.

25
A-REI.5 Prove that, given a system of two equations in two variables, replacing one equation by the sum of that equation and a multiple of the other produces a system with the same solutions.
26
A-REI.12 Graph the solutions to a linear inequality in two variables as a half-plane (excluding the boundary in the case of a strict inequality), and graph the
solution set to a system of linear inequalities in two variables as the intersection of the corresponding half-planes.

27
A-CED.3 Represent constraints by equations or inequalities, and by systems of equations and/or inequalities, and interpret solutions as viable or non-viable options in a modeling context. For example, represent inequalities describing nutritional and cost constraints on combinations of different foods.

28
Integrated Math1 Course Standard and Resource Guide
Unit 6: Creating, solving and graphing exponential equations
overview: Creating and graphing exponential equations
Standards:
8.EE.1 (review)
Know and apply the properties of integer exponents to generate equivalent numerical expressions. For example, For example, 32× 3–5 = 3–3 = 1/33= 1/27.

29
A-SSE.1 Interpret expressions that represent a quantity in terms of its context.
a. Interpret parts of an expression such as terms, factors and coefficients(focus on this part only at this time)
b. Interpret complicated expressions by viewing one or more of their parts as single entity. For example interpret P(1+r)n
as the product of P and a
factor not depending on P.

30
A-CED.1 Create equations and inequalities in one variable including ones with absolute value and use them to solve problems. Include equations arising from linear and quadratic functions, and simple rational and exponential functions. CA
[Linear and exponential (integer inputs only)]

31
A-REI.3
Solve linear equations and inequalities in one variable, including equations with coefficients represented by letters. [Linear inequalities; literal equations that are linear in the variables being solved for; exponential of a form, such as 2x = 1/16.]

32
F-L E.1 Distinguish between situations that can be modeled with linear functions and with exponential functions. a. Prove that linear functions grow by equal differences over equal intervals, and that exponential functions grow by equal factors over equal intervals. b. Recognize situations in which one quantity changes at a constant rate per unit interval relative to another. c. Recognize situations in which a quantity grows or decays by a constant percent rate per unit interval relative to another.

33
A-REI.10
Understand that the graph of an equation in two variables is the set of all its solutions plotted in the coordinate plane, often forming a curve (which could be a line).

34
A-REI.11 Explain why the x-coordinates of the points where the graphs of the equations y = f(x) and y = g(x) intersect are the solutions of the equation f(x) = g(x); find the solutions approximately, e.g., using technology to graph the functions, make tables of values, or find successive approximations. Include cases where f(x) and/or g(x) are linear, polynomial, rational, absolute value, exponential, and logarithmic functions.

35
Integrated Math1 Course Standard and Resource Guide
Unit 7: Interpreting Functions
overview: Understanding and interpreting the concept of functions
Standards:
F-IF.1 Understand that a function from one set (called the domain) to another set (called the range) assigns to each element of the domain exactly one element of the range. If f is a function and x is an element of its domain, then f(x) denotes the output of f corresponding to the input x. The graph of f is the graph of the equation y = f(x).

36
F-IF.2
Use function notation, evaluate functions for inputs in their domains, and interpret statements that use function notation in terms of a context.
37
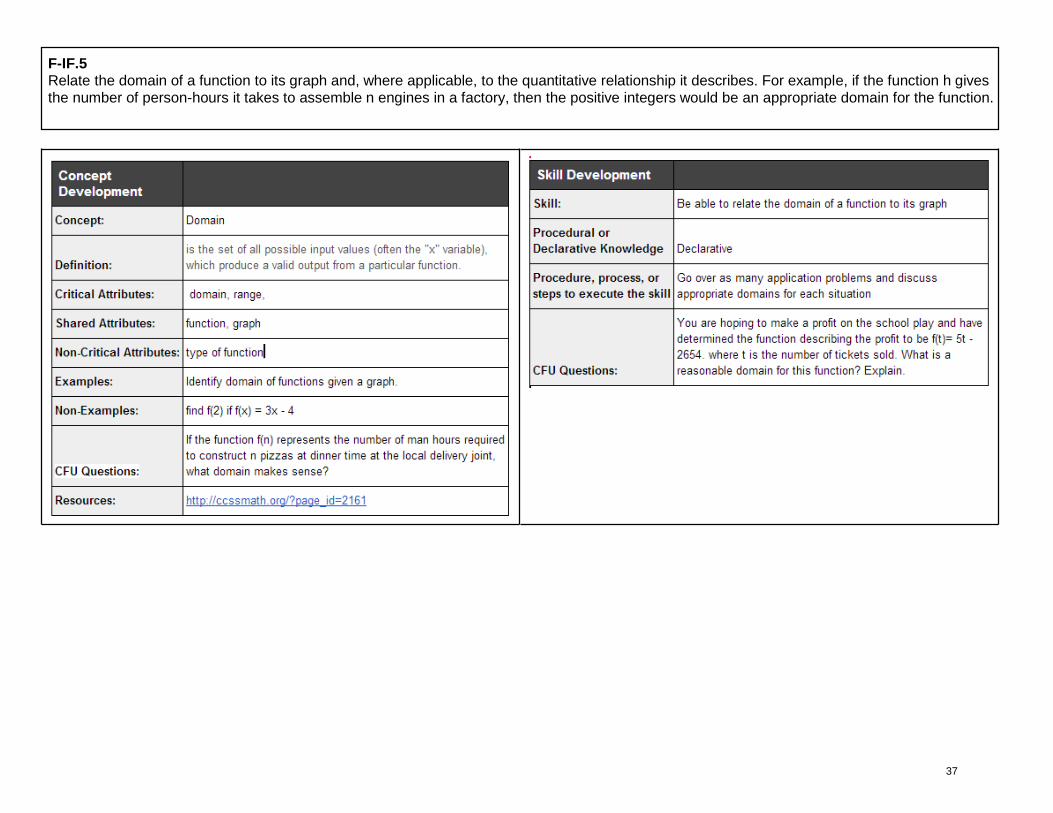
F-IF.5 Relate the domain of a function to its graph and, where applicable, to the quantitative relationship it describes. For example, if the function h gives the number of person-hours it takes to assemble n engines in a factory, then the positive integers would be an appropriate domain for the function.
38
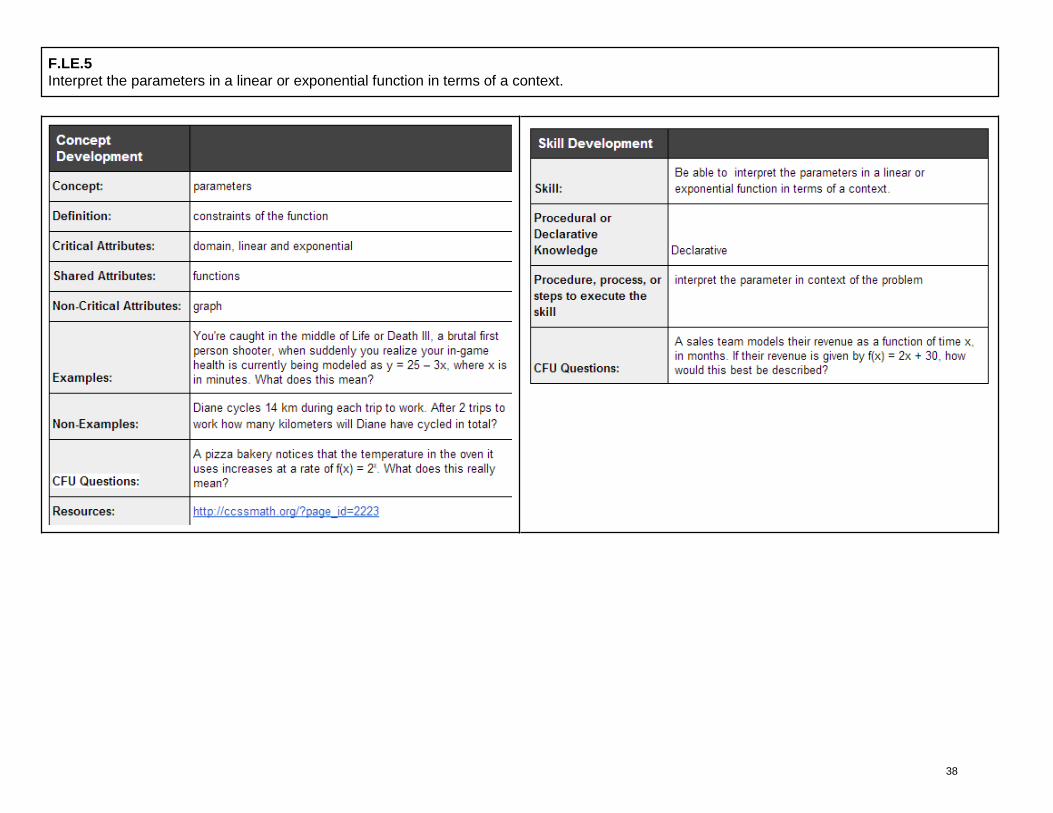
F.LE.5
Interpret the parameters in a linear or exponential function in terms of a context.

39
F.LE.2 Construct linear and exponential functions, including arithmetic and geometric sequences, given a graph, a description of a relationship, or two input-output pairs (include reading these from a table).

40
Integrated Math1 Course Standard and Resource Guide
Unit 8: Analyzing to build functions
overview: Building functions by analyzing the tables and graphs
Standards:
F.LE.3 Observe using graphs and tables that a quantity increasing exponentially eventually exceeds a quantity increasing linearly, quadratically,
or (more generally) as a polynomial function.

41
F-IF.9
Compare properties of two functions each represented in a different way (algebraically, graphically, numerically in tables, or by verbal descriptions).

42
F-IF.4 For a function that models a relationship between two quantities, interpret key features of graphs and tables in terms of the quantities, and sketch graphs showing key features given a verbal description of the relationship. Key features include: intercepts; intervals where the function is increasing, decreasing, positive, or negative; relative maximums and minimums; symmetries; end behavior; and periodicity.

43
F-IF.7 Graph functions expressed symbolically and show key features of the graph, by hand in simple cases and using technology for more complicated cases. a. Graph linear and quadratic functions and show intercepts, maxima, and minima. e. Graph exponential and logarithmic functions, showing intercepts and end behavior, and trigonometric functions, showing period, midline, and amplitude.
44
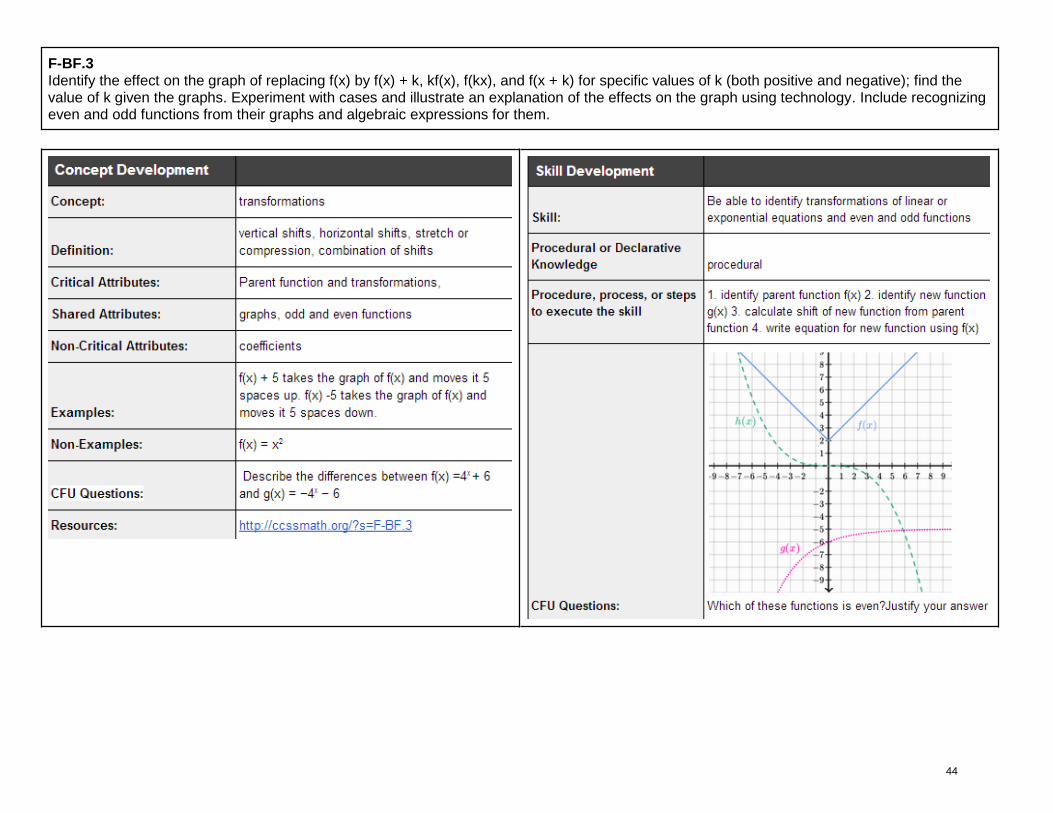
F-BF.3 Identify the effect on the graph of replacing f(x) by f(x) + k, kf(x), f(kx), and f(x + k) for specific values of k (both positive and negative); find the value of k given the graphs. Experiment with cases and illustrate an explanation of the effects on the graph using technology. Include recognizing even and odd functions from their graphs and algebraic expressions for them.

45
Integrated Math1 Course Standard and Resource Guide
Unit 9: Sequences
overview: Understanding the concept of building functions for sequences
Standards:
F-IF.3
Recognize that sequences are functions, sometimes defined recursively, whose domain is a subset of the integers. For example, the Fibonacci sequence is defined recursively by f(0) = f(1) = 1, f(n + 1) = f(n) + f(n − 1) for n ≥ 1.

46
F-BF.1 Write a function that describes a relationship between two quantities.
a. Determine an explicit expression, a recursive process, or steps for calculation from a context.

47
F-BF.1 Write a function that describes a relationship between two quantities.
b. Combine standard function types using arithmetic operations. For example, build a function that models the temperature of a cooling body by adding a constant function to a decaying exponential, and relate these functions to the model.
48
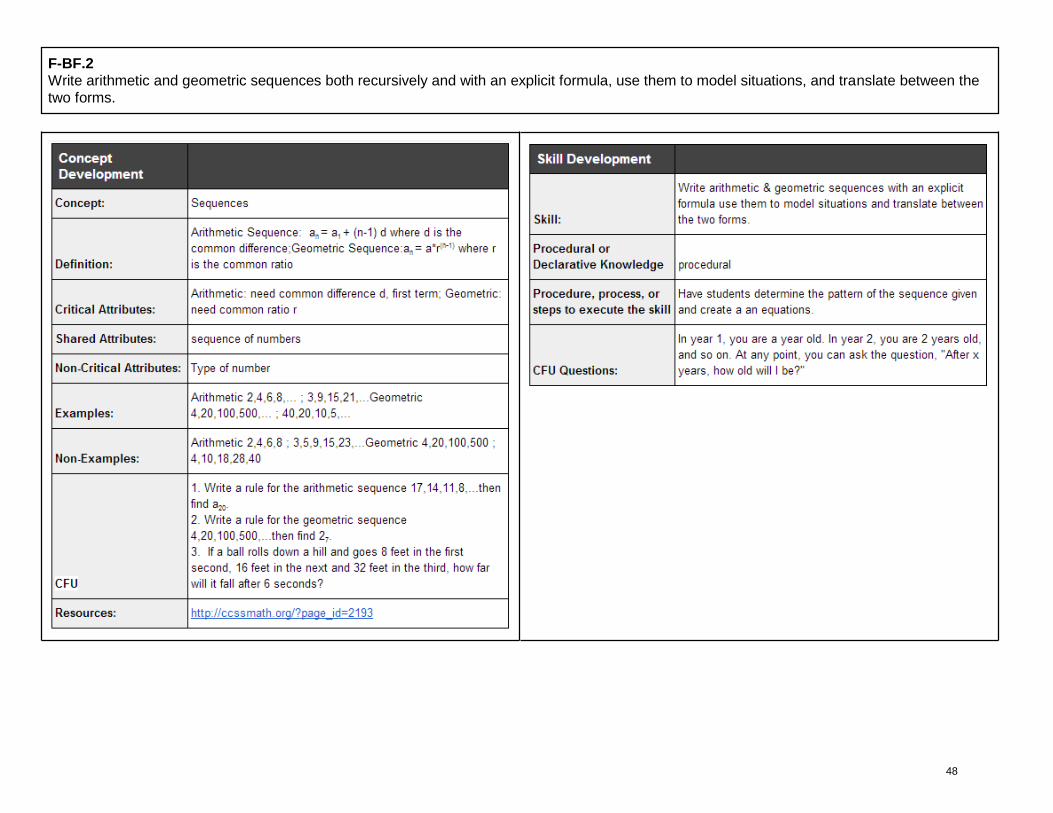
F-BF.2 Write arithmetic and geometric sequences both recursively and with an explicit formula, use them to model situations, and translate between the two forms.
49
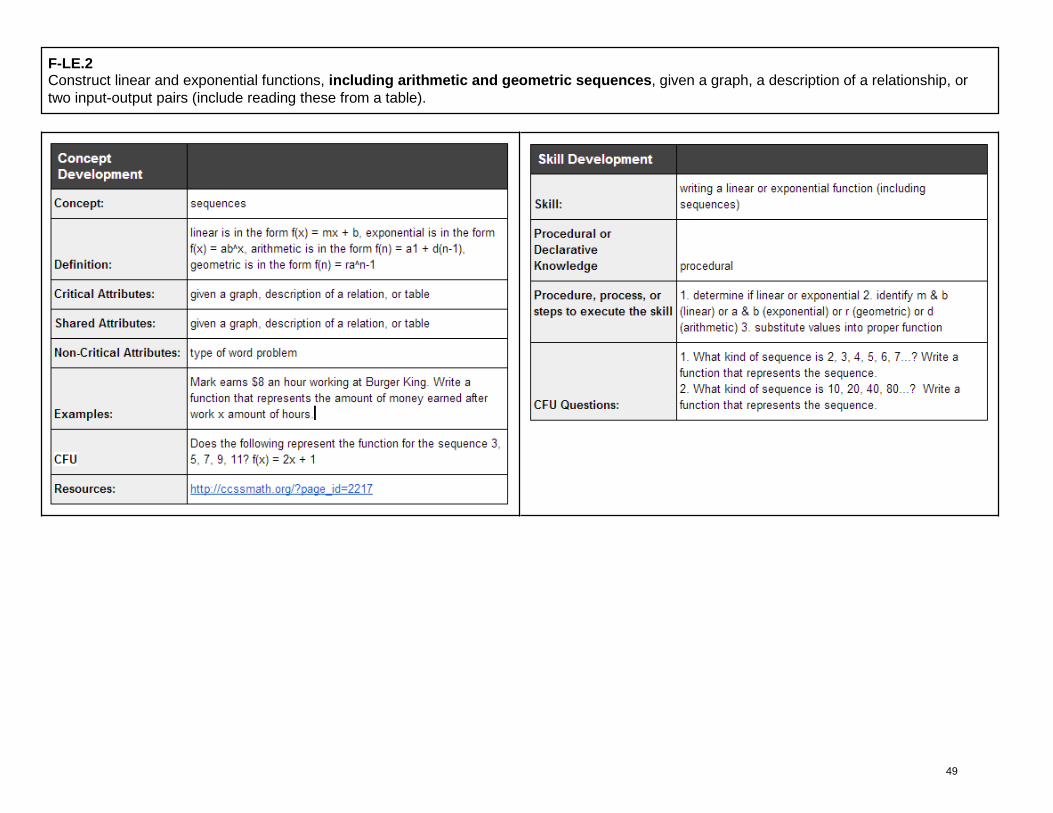
F-LE.2 Construct linear and exponential functions, including arithmetic and geometric sequences, given a graph, a description of a relationship, or
two input-output pairs (include reading these from a table).

50
Integrated Math 1 Course Standard and Resource Guide
UNIT 10: Statistics
Overview Interpreting categorical and quantitative variables. Summarize, represent, and interpret data on a single count or measurement variable.
Standards:
N-Q.1 Use units as a way to understand problems and to guide the solution of multi-step problems; choose and interpret units consistently in formulas; choose and interpret the scale and the origin in graphs and data displays.
51
N-Q.2
Define appropriate quantities for the purpose of descriptive modeling.

52
S-ID.1
Represent data with plots on the real number line (dot plots, histograms, and box plots).
53
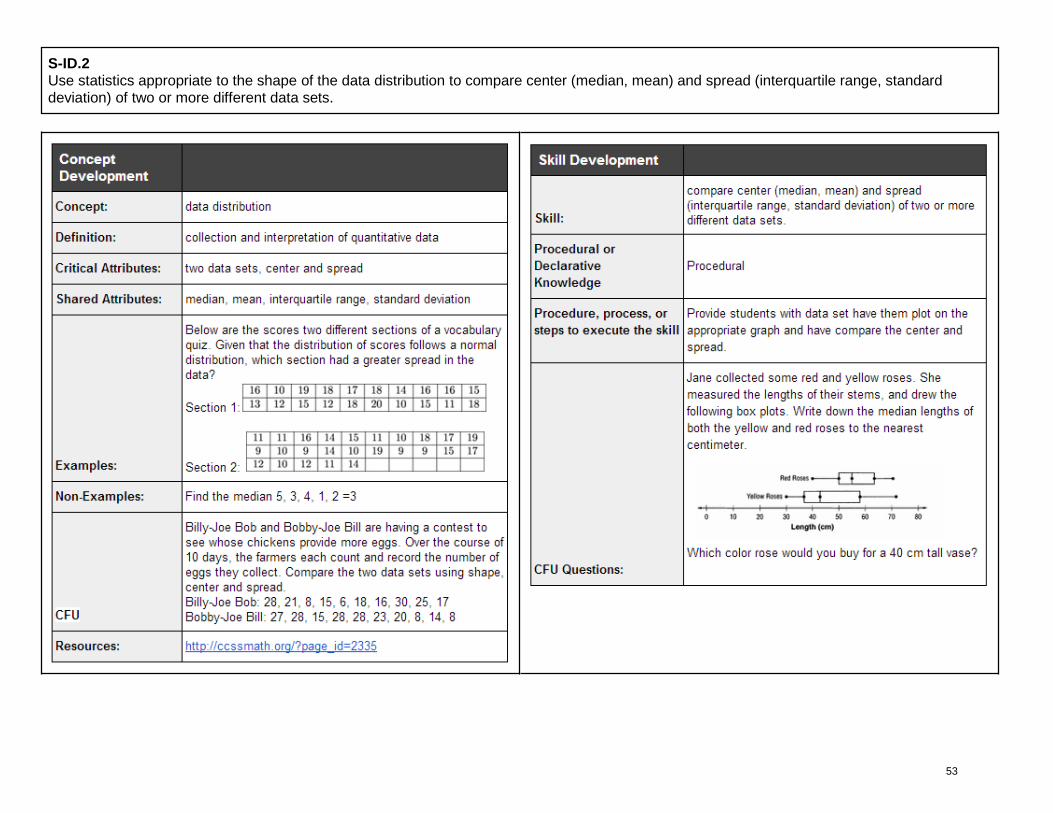
S-ID.2 Use statistics appropriate to the shape of the data distribution to compare center (median, mean) and spread (interquartile range, standard deviation) of two or more different data sets.

54
S-ID.3
Interpret differences in shape, center, and spread in the context of the data sets, accounting for possible effects of extreme data points (outliers).

55
S-ID.5 Summarize categorical data for two categories in two-way frequency tables. Interpret relative frequencies in the context of the data (including joint, marginal, and conditional relative frequencies). Recognize possible associations and trends in the data.
56
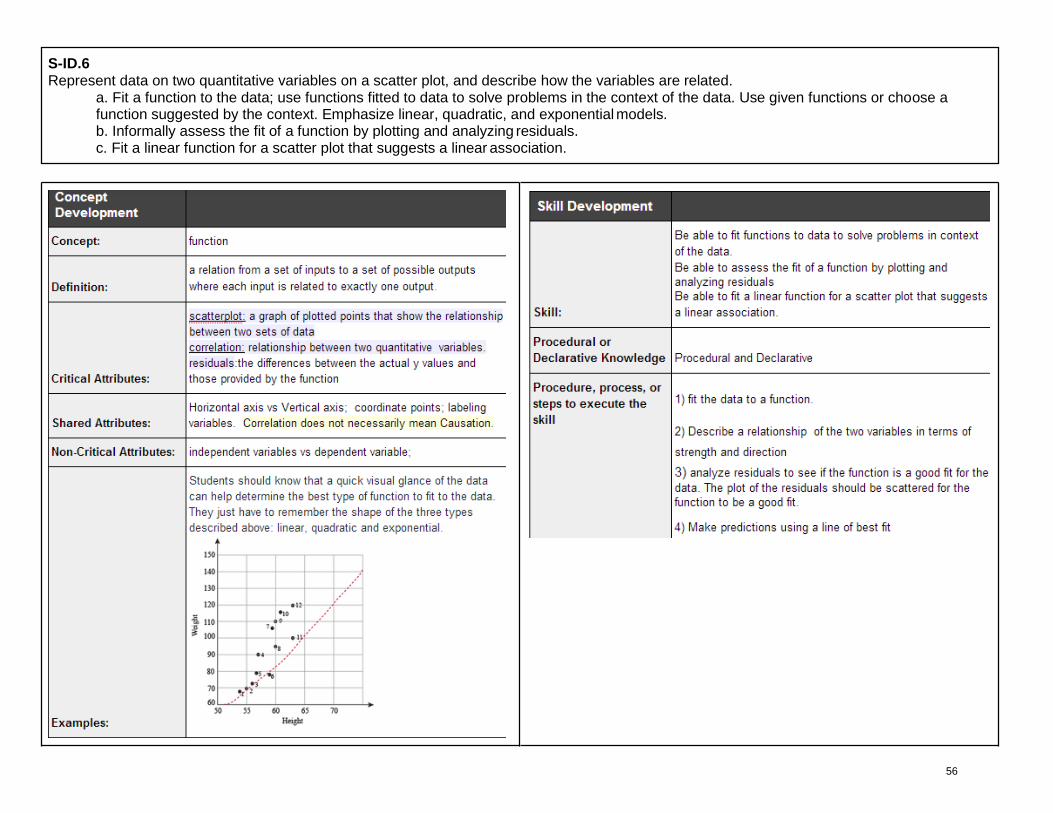
S-ID.6 Represent data on two quantitative variables on a scatter plot, and describe how the variables are related.
a. Fit a function to the data; use functions fitted to data to solve problems in the context of the data. Use given functions or choose a function suggested by the context. Emphasize linear, quadratic, and exponential models. b. Informally assess the fit of a function by plotting and analyzing residuals. c. Fit a linear function for a scatter plot that suggests a linear association.

57

58
S-ID.7
Interpret the slope (rate of change) and the intercept (constant term) of a linear model in the context of the data.

59
S-ID.8 Compute (using technology) and interpret the correlation coefficient of a linear fit

60
S-ID.9
Distinguish between correlation and causation.

61
Integrated Math 1 Course Standard and Resource Guide
UNIT 11: Introduction to Geometry
Overview With the use of constructions the definitions of line, rays, points, angles, bisectors, congruency, parallel, perpendicular and angle relationship will arise.
Standards:
G.CO.1 Know precise definitions of angle, circle, perpendicular line, parallel line, and line segment, based on the undefined notions of point, line, distance along a line, and distance around a circular arc.
62
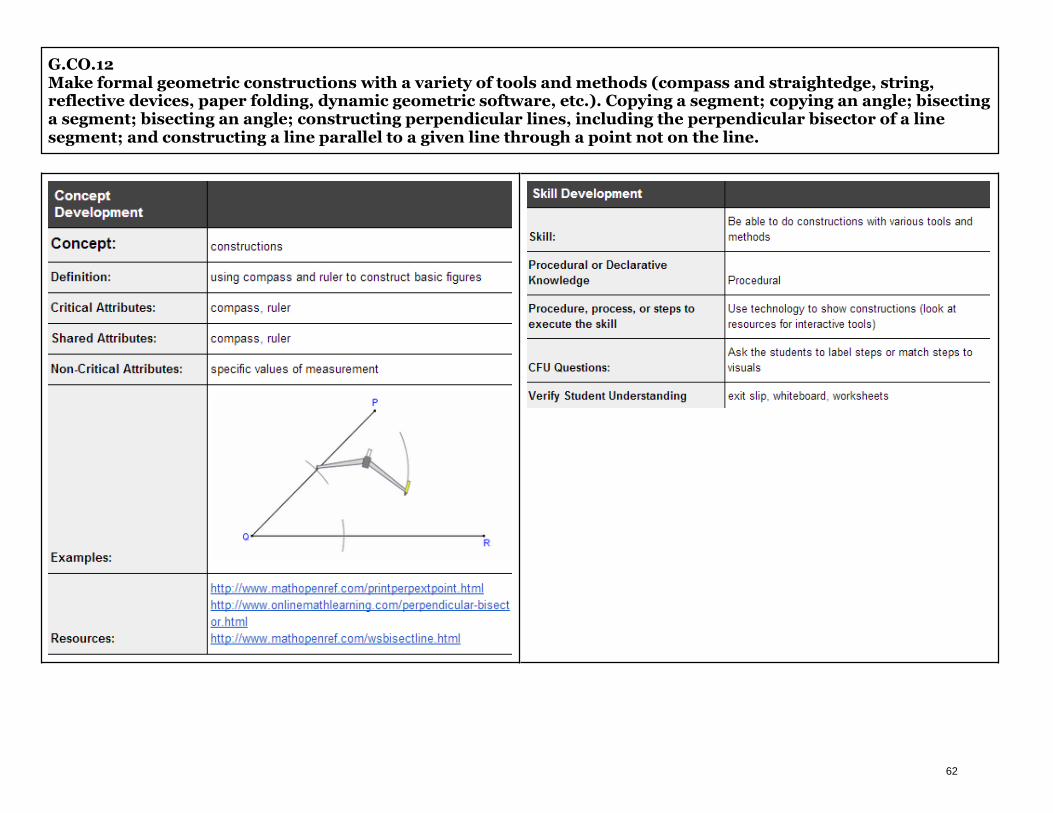
G.CO.12 Make formal geometric constructions with a variety of tools and methods (compass and straightedge, string, reflective devices, paper folding, dynamic geometric software, etc.). Copying a segment; copying an angle; bisecting a segment; bisecting an angle; constructing perpendicular lines, including the perpendicular bisector of a line segment; and constructing a line parallel to a given line through a point not on the line.

63
Supporting standards: Examples
Segment addition postulate show using constructions
Angle addition postulate show using constructions
Resources: http://ccssmath.org/
http://www.geometrycommoncore.com/index.html
https://sites.google.com/site/misterbledsoe/cc2-videos
http://www.geogebratube.org/
G.CO.13
Construct an equilateral triangle, a square, and a regular hexagon inscribed in a circle.

64
Integrated Math 1 Course Standard and Resource Guide
UNIT 12: Transformations
Overview Define the isometric transformations of Reflection, Rotation, & Translation.
Standards
G.CO.2
Represent transformations in the plane using, e.g., transparencies and geometry software; describe transformations as functions that
take points in the plane as inputs and give other points as outputs. Compare transformations that preserve distance and angle to
those that do not (e.g., translation versus horizontal stretch).
Resources:http://ccssmath.org/
http://www.geometrycommoncore.com/index.html
https://sites.google.com/site/misterbledsoe/cc2-videos
http://www.geogebratube.org/

65
G.CO.3
Given a rectangle, parallelogram, trapezoid, or regular polygon, describe the rotations and reflections that carry it
onto itself.
Resources: http://ccssmath.org/
http://www.geometrycommoncore.com/index.html
https://sites.google.com/site/misterbledsoe/cc2-videos
http://www.geogebratube.org/

66
Resources:http://ccssmath.org/
http://www.geometrycommoncore.com/index.html
https://sites.google.com/site/misterbledsoe/cc2-videos
http://www.geogebratube.org/
G.CO.4
Develop definitions of rotations, reflections, and translations in terms of angles, circles, perpendicular line, parallel lines, and line
segment.

67
Resources:http://ccssmath.org/
http://www.geometrycommoncore.com/index.html
https://sites.google.com/site/misterbledsoe/cc2-videos
http://www.geogebratube.org/
G.CO.5
Given a geometric figure and a rotation, reflection, or translation, draw the transformed figure using, e.g., graph paper, tracing paper,
or geometry software. Specify a sequence of transformations that will carry a given figure onto another.

68
Resources: http://ccssmath.org/
http://www.geometrycommoncore.com/index.html
https://sites.google.com/site/misterbledsoe/cc2-videos
http://www.geogebratube.org/
G.CO.6
Use geometric descriptions of rigid motions to transform figures and to predict the effect of a given rigid motion on a given figure;
given two figures, use the definition of congruence in terms of rigid motions to decide if they are congruent.

69
Integrated Math 1 Course Standard and Resource Guide
UNIT 13: Congruency
Overview Use transformations to prove triangles are congruent and proofs ( flow chart, 2 column, paragraph)
Standards
G.CO.7 Use the definition of congruence in terms of rigid motions to show that two triangles are congruent if and only if corresponding pairs of sides and
corresponding pairs of angles are congruent.

70
Resources: http://ccssmath.org/
http://www.geometrycommoncore.com/index.html
https://sites.google.com/site/misterbledsoe/cc2-videos
http://www.geogebratube.org/
G.CO.8 Explain how the criteria for triangle congruence (ASA, SAS, and SSS) follow from the definition of congruence in terms of rigid motions.

71
Integrated Math 1 Course Standard and Resource Guide
UNIT 14: Coordinate Proofs
Overview The algebraic representation of a geometric problem can be used to prove theorems in coordinate plane.
Standards:
G.GPE.4 Use coordinates to prove simple geometric theorems algebraically.

72
G.GPE.5 Prove the slope criteria for parallel and perpendicular lines and use them to solve geometric problems (e.g., find the equation of a line parallel or perpendicular to a given line that passes through a given point).

73
Resources:
http://ccssmath.org/
http://www.geometrycommoncore.com/index.html
https://sites.google.com/site/misterbledsoe/cc2-videos
http://www.geogebratube.org/
G.GPE.7 Use coordinates to compute perimeters of polygons and areas of triangles and rectangles, e.g., using the distance formula. * *(Modeling Standard)