Embed Size (px)
Citation preview

INTEGRATED MOBILITY
PLAYER
FS GREEN BOND PROGRAMME
Investor PresentationNovember 2017

Disclaimer
IMPORTANT NOTICE – STRICTLY CONFIDENTIAL
By accessing this investor presentation, you agree to be bound by the following limitations.
This presentation has been prepared by Ferrovie dello Stato Italiane S.p.A, is the sole responsibility of Ferrovie dello Stato Italiane S.p.A.. The information set outherein may be subject to updating, revision, verification and amendment and such information may change materially. Ferrovie dello Stato Italiane S.p.A. isunder no obligation to update or keep current the information contained in this presentation or in the presentation to which it relates and any opinions expressedin them is subject to change without notice. None of Ferrovie dello Stato Italiane S.p.A. or any of its respective affiliates, advisers or representatives shall haveany liability whatsoever (in negligence or otherwise) for any loss whatsoever arising from any use of this presentation or its contents, or otherwise arising inconnection with this presentation.
This presentation is being communicated in the United Kingdom only to persons who have professional experience in matters relating to investments falling withinArticle 19(5) of the Financial Services and Markets Act 2000 (Financial Promotion) Order 2005 and to persons to whom it may otherwise be lawful tocommunicate it to (all such persons being referred to as relevant persons). This presentation is only directed at relevant persons and any investment orinvestment activity to which the presentation relates is only available to relevant persons or will be engaged in only with relevant persons. Solicitations resultingfrom this presentation will only be responded to if the person concerned is a relevant person. Other persons should not rely or act upon this presentation or anyof its contents.
The information in this presentation is confidential and this presentation is being made available to selected recipients only and solely for the information of suchrecipients. This presentation may not be reproduced, redistributed or passed on to any other persons, in whole or in part. This presentation is for informationpurposes only and does not constitute or form part of, and should not be construed as, any offer for sale or subscription of, or solicitation of any offer to buy orsubscribe for, any securities of Ferrovie dello Stato Italiane S.p.A. nor should it or any part of it form the basis of, or be relied on in connection with, any contractor commitment whatsoever. This presentation does not constitute a recommendation regarding the securities of Ferrovie dello Stato Italiane S.p.A.
This presentation and the information contained herein are not an offer of securities for sale in the United States and are not for publication or distribution to personsin the United States (within the meaning of Regulation S under the United States Securities Act of 1933, as amended.
This presentation is for distribution in Italy only to "qualified investors" (investitori qualificati), as defined pursuant to Article 100 of Legislative Decree no. 58 of 24February 1998, as amended and restated from time to time (the Financial Services Act), and as defined in Article 34-ter, paragraph 1(b) of CONSOBRegulation no. 11971 of 14 May 1999, as amended and restated from time to time (the CONSOB Regulation), or in other circumstances provided under Article100 of the Financial Services Act and Article 34-ter, CONSOB Regulation, where exemptions from the requirement to publish a prospectus pursuant to Article 94of the Financial Services Act are provided.
This presentation may contain projections and forward-looking statements. Any such forward-looking statements involve known and unknown risks, uncertaintiesand other factors which may cause Ferrovie dello Stato Italiane S.p.A.’s actual results, performance or achievements to be materially different from any futureresults, performance or achievements expressed or implied by such forward-looking statements. Any such forward-looking statements will be based onnumerous assumptions regarding Ferrovie dello Stato Italiane S.p.A.’s present and future business strategies and the environment in which Ferrovie dello StatoItaliane S.p.A. will operate in the future. Furthermore, any forward-looking statements will be based upon assumptions of future events which may not prove tobe accurate. Any such forward-looking statements in this presentation will speak only as at the date of this presentation and Ferrovie dello Stato Italiane S.p.A.assumes no obligation to update or provide any additional information in relation to such forward-looking statements.
2

Contents
1 Ferrovie dello Stato Italiane Group Overview
2 Operations and Industry Overview – Focus on Trenitalia
3 Corporate Sustainability
4 Green Bond Programme
5 Financial Overview
6 Appendix
3
Ferrovie dello Stato Italiane
Group Overview
1

Revenue 8,928**
EBITDA 2,293
EBITDA Margin 25.7%
EBIT 892
EBIT Margin 10%
Net Income 772
Net Invested Capital 45,257
Equity 38,497
Net Financial Debt 6,760
Group Revenue by segment (2016)**
* Effective from September 2017
** Net of (1,604)m of cons.adj.
(a) FS Group main line and operating segments
Source: FS 2016 Annual Report
FS Group in a snapshot
Transport66%
Infrastructure25%
Commercial Real Estate
7%
Other services
2%
5
2016 Consolidated Highlights (€mn)
TRANSPORT COMMERCIAL REAL ESTATE
Fercredit FerserviziTrenitaliaGrandi
StazioniRail
MercitaliaCento
stazioniRFI Italferr
Busitalia Sita Nord
ItalcertiferFS Sistemi
Urbani
Grandi Stazioni
Immobiliare
Netinera DL
GmbH
Trainose*
55,66% 100%100% 100%60,00%100% 100%51.00% 100% 100% 100%100% 100%100%
INFRASTRUCTURE OTHER SERVICES
Ferrovie dello Stato Italiane SpA (“FS” or the “Issuer”) – 100% Italian State owned – is the holding company of the Italianrailway group (FS Group), which is the main provider of transport services in Italy by rail and bus both passenger and freight.
As one of the largest industrial groups in the country, it manages rail networks and transport services, contributing todevelop integrated mobility and logistics in Italy and abroad.
Ferrovie Sud Est
100%
(a)
100%

Key Operating Data
Road transport
Long-haul transport
market services -
“Arrows”-“Frecce”
Long-haul transport
PSC services
Regional transport
Railway network
Cargo transport
Passengers - km million Trains\Bus - km thousand Tons Km total - million
Tons Km abroad - million
Stations
6Source: FS 2016 Annual Report

(€b) 2016 2015 2014
Revenue 8.9 8.5 8.4
EBITDA margin % 25.7% 23% 25.2%
EBIT margin % 10% 7.5% 7.9%
(€b) 2016 2015 2014
Revenue 43.3 43.2 39.7
EBITDA margin % 10.3% 10% 12.9%
EBIT margin % 3.4% -0.4% 5.3%
(€b) 2016 2015 2014
Revenue 32.3 31.4 27.2
EBITDA margin % 12.8% 14% 8.7%
EBIT margin % 6.6% -0.3% 2.5%
Issuer Rating
S&P AA-
Moody’s Aa1
Issuer Rating
Fitch AA
S&P AA-
Moody’s Aa3
Issuer Rating
Fitch BBB
S&P BBB
Trend in passenger and cargo traffic
Benchmarking with European rail players
40
60
80
100
120
140
160
2011 2012 2013 2014 2015 2016
GRUPPO FS ITALIANE
40
60
80
100
120
140
160
2011 2012 2013 2014 2015 2016
SNCF
40
60
80
100
120
140
160
2011 2012 2013 2014 2015 2016
DBAG
40
60
80
100
120
140
160
2011 2012 2013 2014 2015 2016
DBAG
40
60
80
100
120
140
160
2011 2012 2013 2014 2015 2016
GRUPPO FS ITALIANE
40
60
80
100
120
140
160
2011 2012 2013 2014 2015 2016
SNCF
40
60
80
100
120
140
160
2011 2012 2013 2014 2015 2016
DBAG
40
60
80
100
120
140
160
2011 2012 2013 2014 2015 2016
DBAG
40
60
80
100
120
140
160
2011 2012 2013 2014 2015 2016
GRUPPO FS ITALIANE
40
60
80
100
120
140
160
2011 2012 2013 2014 2015 2016
SNCF
40
60
80
100
120
140
160
2011 2012 2013 2014 2015 2016
DBAG
40
60
80
100
120
140
160
2011 2012 2013 2014 2015 2016
DBAG
40
60
80
100
120
140
160
2011 2012 2013 2014 2015 2016
GRUPPO FS ITALIANE
40
60
80
100
120
140
160
2011 2012 2013 2014 2015 2016
SNCF
40
60
80
100
120
140
160
2011 2012 2013 2014 2015 2016
DBAG
40
60
80
100
120
140
160
2011 2012 2013 2014 2015 2016
DBAG
7Source: FS, DB, SNCF Annual Reports and rating agencies’ websites

FS' rating reflects the:
“very important” role for the Italian government as
holding group of the country’s national railway and the
“integral” link with its sole owner (Italian Govt)
“Strong” business risk profile: «…dominant market
position in the Italian transport segment and network
concessionaire…the vertical integration combines
infrastructure manager and transportation services and
gives earnings operating stability»
“Intermediate” financial risk profile: «FS’s financial
metrics remain solid with FFO/debt at ~ 20% in 2016»
Corporate Rating BBB
OutlookSTABLEStand
Alone Credit Profile
bbb
Rating Overview
8
FS' rating reflects the:
Full ownership and high integration with the Italian
government and its key role for railway transport
and mobility in Italy as well as the national
infrastructural development
Revenue Defensibility: «…a dominant market share
in passenger transportation services in Italy and
growing operations in UK, Greece and Netherlands»
Financial profile: «…Fitch expects FS to maintain
strong operating cash flow generation capacity»
RATING COMMENTS
CorporateRating BBB
OutlookSTABLE
Stand Alone Rating
BBB
1 notch upgrade on
October 30th 2017
Rating confirmed on
November 2nd 2017
Source: S&P and Fitch reports. Please refer to the rating agencies’ websites for further information.
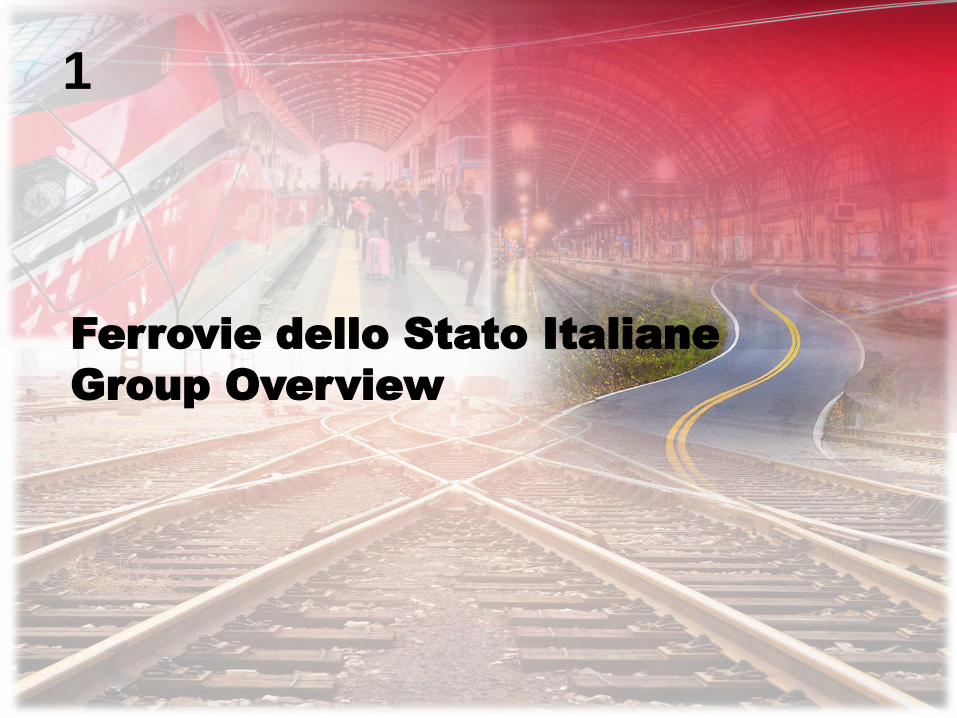
An International Integrated Mobility Player: Moving Forward
April 2017Busitalia FAST: JV between Busitalia and SIMET for the
long distance bus transportation in Italy and Germany
July 2016Closing of the sale of 100% of GS Retail
after the demerger process of GS
Group started in 2015.
January 2017Buy-back of Centostazioni 40%
stake by FS
September 2017Acquisition of Trainose, the leading
Greek railway transport company
February 2017Trenitalia enters the UK rail market
acquiring the franchisee C2C which
operates the London- South Essex line
2° HY 2016Creation of the Mercitalia Hub to
restructure the freight transportation
and logistics business of the Groups.
June 2017 Acquisition of 36.7% stake from Astaldi in M5, the
concessionnaire of the new underground line 5 in Milan.
November 2016Ownership transfer from the Italian Ministry of
Infrastructure and Transport to FS of Ferrovie del
Sud Est e Servizi Automobilistici, the local public
transport company operative in Puglia region.
The restructuring and asset enhancement activities completed in 2016 and first half of 2017 move towards the FS
Group’s new vision to become an INTEGRATED MOBILITY PLAYER in line with the 2017-2026 industrial plan
9
September 2016
Buy-back of Thello 33% stake
by Trenitalia
Source: Company information
August 2017Busitalia acquires Qbuzz: a public bus
transport services company in
Netherlands
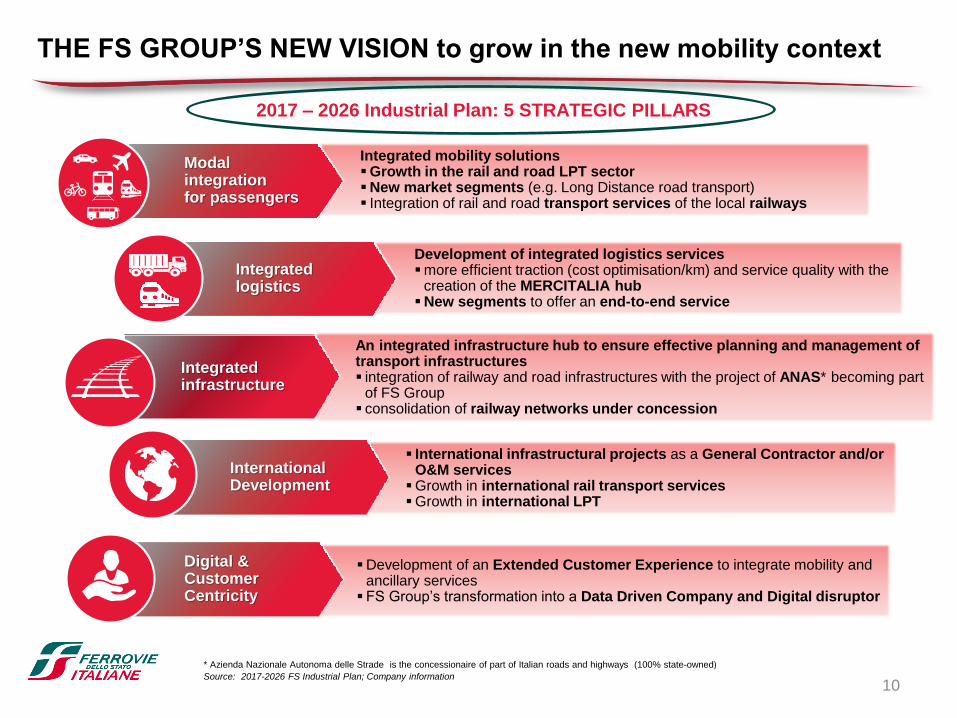
Integrated mobility solutionsGrowth in the rail and road LPT sectorNew market segments (e.g. Long Distance road transport) Integration of rail and road transport services of the local railways
Development of integrated logistics servicesmore efficient traction (cost optimisation/km) and service quality with the
creation of the MERCITALIA hubNew segments to offer an end-to-end service
An integrated infrastructure hub to ensure effective planning and management of transport infrastructures integration of railway and road infrastructures with the project of ANAS* becoming part
of FS Group consolidation of railway networks under concession
International infrastructural projects as a General Contractor and/or O&M services
Growth in international rail transport servicesGrowth in international LPT
Development of an Extended Customer Experience to integrate mobility and ancillary services
FS Group’s transformation into a Data Driven Company and Digital disruptor
10
Modalintegrationfor passengers
Integratedlogistics
Integratedinfrastructure
InternationalDevelopment
Digital & CustomerCentricity
THE FS GROUP’S NEW VISION to grow in the new mobility context
2017 – 2026 Industrial Plan: 5 STRATEGIC PILLARS
* Azienda Nazionale Autonoma delle Strade is the concessionaire of part of Italian roads and highways (100% state-owned)
Source: 2017-2026 FS Industrial Plan; Company information

Operations and Industry Overview
Focus on Trenitalia
2

12
Key highlights
Trenitalia is one of the leading railway operators in Europe
Everyday manages about 9,000 trains and each year transports c. 600 million
of passengers
Trenitalia is also abroad with c2c in UK and Thello in France
Organized in two* business segments:
medium/long distance passengers
regional passengers
(a) Figures as at 31 December 2016 reflect the application of IFRS 5. For the purposes of a better comparison, figures as at 31 December 2015 were restated accordingly.
Source: Company information, Trenitalia 2016 Annual Report
€mn 2016 * 2015 (a)
Revenues 5,078.7 5,114.3
EBITDA 1,394.5 1,480.4
EBIT 332.5 511.9
Net Income 116* 230
EBITDA Margin 27.5% 28.9%
EBIT Margin 6.5% 10%
Financial highlights
* Note:
Trenitalia demerged its Cargo division allocating the related assets to Mercitalia Rail with effect as of 1 January 2017. This transaction is part of FS Group’s 2017-2026
business plan to relaunch the Cargo business via a specific dedicated company structure.
In accordance with IFRS 5 “Non-current assets held for sale and discontinued operations”, the revenue and costs of such division are recognised in the separate item
“Loss from discontinued operations” in the income statement, after the profit from continuing operations.
Therefore Trenitalia’s 2016 Revenues, EBITDA and EBIT items hereby shown does not include freight division results, which however contributed to the Net Income.
Trenitalia: rail passenger transport in Italy and abroad
Medium Long
distance revenues* (€mn)
High Speed services
International and
domestic services
2016 2015 Change
2,295 2,398 -4,3%
Regional revenues* (€mn)
Commuter
passenger services
Regional/Inter-
regional services
2016 2015 Change
2,751 2,685 2,47%

13
Frecce
High Speed services Torino-
Milano-Brescia-Bologna-Firenze-
Roma-Napoli-Salerno
Fast services connecting Roma to
Venezia, Verona, Bari and Reggio
Calabria
Fast services connecting: Milano
to Lecce, Genova to Roma and
Milano to Venezia
Source: Company information
Focus: High Speed Transport
Eligible
Green
Project
The Medium\Long Haul Passenger Division ensures the national and
international passenger transportation, including High Speed services
The Italian High Speed network connects the main metropolitan area of the
country
High Speed services have been the key element for the modal shift
from plane to rail in Italy
Frecciarossa trains are the Trenitalia's flagship product, combining high-
speed and maximum comfort
The ETR 1000, named “Frecciarossa 1000” is the new high-speed train of
Trenitalia, comfortable, safe and environmentally friendly, designed to meet the
most advanced techniques.
Able to travel on all European high-speed networks.
The fleet counts 50 ETR 1000 with the last delivered in June 2017
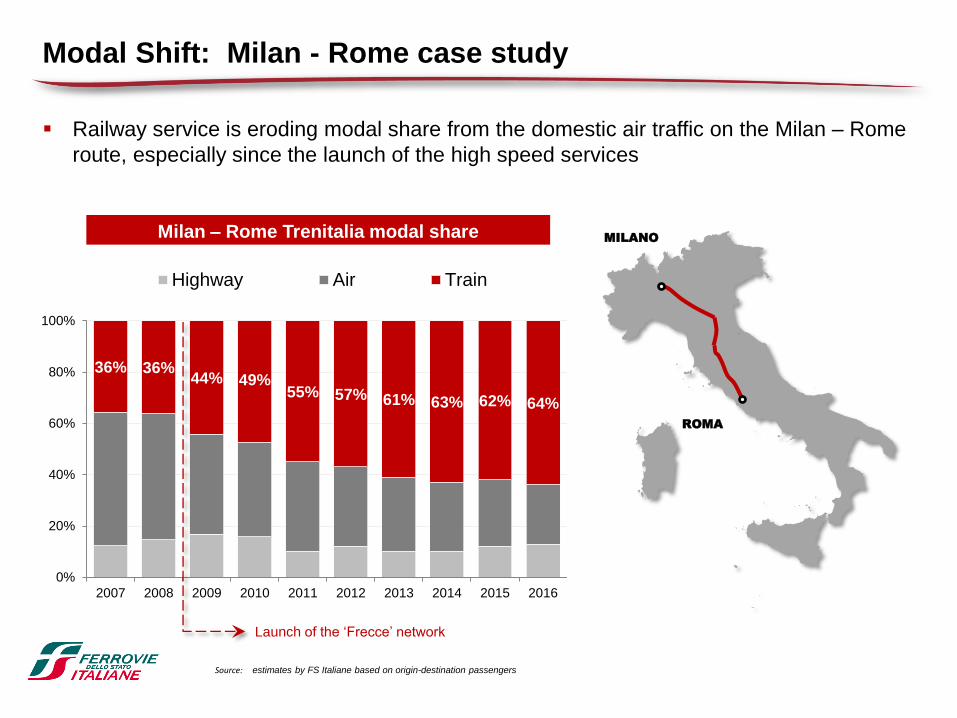
Milan – Rome Trenitalia modal share
Modal Shift: Milan - Rome case study
Railway service is eroding modal share from the domestic air traffic on the Milan – Rome
route, especially since the launch of the high speed services
Source: estimates by FS Italiane based on origin-destination passengers
MILANO
ROMA
36% 36%44% 49%
55% 57% 61% 63% 62% 64%
0%
20%
40%
60%
80%
100%
2007 2008 2009 2010 2011 2012 2013 2014 2015 2016
Highway Air Train
Launch of the ‘Frecce’ network
15
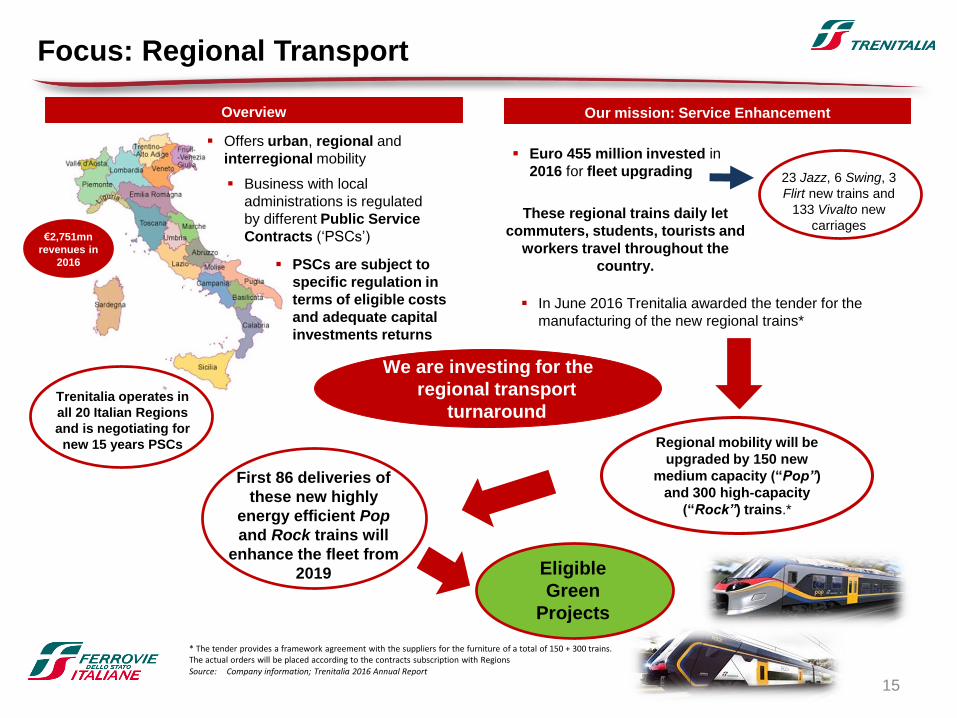
Focus: Regional Transport
PSCs are subject to
specific regulation in
terms of eligible costs
and adequate capital
investments returns
We are investing for the
regional transport
turnaround
Euro 455 million invested in
2016 for fleet upgrading
Trenitalia operates in
all 20 Italian Regions
and is negotiating for
new 15 years PSCs
Offers urban, regional and
interregional mobility
* The tender provides a framework agreement with the suppliers for the furniture of a total of 150 + 300 trains. The actual orders will be placed according to the contracts subscription with Regions
Source: Company information; Trenitalia 2016 Annual Report
23 Jazz, 6 Swing, 3
Flirt new trains and
133 Vivalto new
carriagesThese regional trains daily let
commuters, students, tourists and
workers travel throughout the
country.
First 86 deliveries of
these new highly
energy efficient Pop
and Rock trains will
enhance the fleet from
2019 Eligible
Green
Projects
Our mission: Service Enhancement
In June 2016 Trenitalia awarded the tender for the
manufacturing of the new regional trains*
Regional mobility will be
upgraded by 150 new
medium capacity (“Pop”)
and 300 high-capacity
(“Rock”) trains.*
Business with local
administrations is regulated
by different Public Service
Contracts (‘PSCs’)
Overview
€2,751mn
revenues in
2016

16
Busitalia: road passenger transport in Italy and abroad
Source: Company information; Busitalia Annual Reports
2012Partnership with
2011Busitalia was established from the
division of SITA (1912) into two
independent companies
2012 - 2013Acquisition of 70% of ATAF Gestioni
(Firenze LPT road transport) in
partnership with Autoguidovie
2014Incorporation of Busitalia Rail
Service (road transport
services to support the
railway service)
2015Incorporation of Busitalia Veneto with a
55% controlling interest (Padova and
Rovigo urban and extra-urban LPT)
2014Tender awarded for 100%
Umbria Mobilità Esercizio
(regional mobility)
2015Incorporation of
Venezia City Sightseeing
2016Incorporation of Busitalia
Campania and acquisition of
CSTP the local public transport
company of Salerno municipality
2017Busitalia FAST: JV with SIMET for the
long distance bus transportation in
Italy and Germany
68.5110.5
203.1
292.7330 354
2011 2012 2013 2014 2015 2016
BUSITALIA GROUP
REVENUE+417%vs 2011
Key Financial figures
€mn 2016 2015
Revenues 354 330
EBITDA 36 30.2
EBITDA Margin 10% 9%
EBIT 13 10.5
EBIT Margin 4% 3%
2017
Busitalia acquires Qbuzz: a public bus
transport services company in
Netherlands

17
RFI: Infrastructure Manager
Source: Company information; RFI 2016 Annual report and RFI Website
€mn 2016 2015
Revenues 2,575 2,486
Track access charges 1,058 1,006
CdP-Service 975.5 975.5
Sale of electrical energy for traction 200 159
Other income 341 345
EBITDA 357 279
EBITDA margin % 14% 11%
EBIT 215 160
EBIT margin % 8% 6%
Net Income 181 129
Key figures
Network highlights (km)
Classification for: 2016
Type of track
Double track lines 7,647
Single track lines 9,141
Electrification
Double track electrified lines 7,570
Single track electrified lines 4,453
Not electrified lines 4,765
Total km of lines 16,788
Type of service
Conventional network 23,085
HS lines 1,350
Total tracks Length 24,435
HS lines in Italy
Draft
Work In progress
Operating (HS)
Operating (HS up to 250 km\h)
Linee TO-MI MI-BO BO-FI RM-NA RM-MI
Before
HS1: 22’ 1: 42’ 60’ 1: 27’ 4: 30’
HS 1: 00’ 1: 02’ 35’ 1: 08’
2:55’ no stop
2:40’
MI Rogoredo
RM Tiburtina
Travel time on ETR trains

Corporate Sustainability
3

19
Moving by train is the greenest solution, emitting about ¾ less CO2 than travelling by plane and
about 2⁄3 less CO2 than travelling by car.
Source: http://www.ecopassenger.org, using the RM-MI route as calculation baseline
The train: a sustainable journey

20
ECONOMICCOMMITMENT
Be a leaderin the mobility sector
by promoting the quality and efficiency of transport and infrastructure services
Be at the forefront of an integrated mobility
project that, through avirtuous business model, encourages fair business
practices and activeengagement
Be pioneers in the development and
implementationof large-scale integrated
mobility solutions that help regenerate natural
capital
BE A BUSINESS THAT IS PART OF THE E C O N O M I C COMMUNITY TO PROVIDE INTEGRATED AND SUSTAINABLE MOBILITY
AND LOGISTICS SERVICES, USING TRANSPORT INFRASTRUCTURES SYNERGICALLY AND CREATING VALUE IN ITALY AND ABROAD
SOCIALCOMMITMENT
ENVIRONMENTALCOMMITMENT
FS Sustainability approach
Our sustainability approach permeates the full organizational structure ensuring integration of
environmental, social and economical aspects within strategic business decisions

energy
CO2
NOX
water
accidents at work
frequency of
accidents
social
improvement
reputation
attractiveness
skills
lever
productivity
gender gap
21
FS Sustainability pillars

FS Sustainability governance
22
Guarantee integration of social and environmental aspects into the
strategies of the Group as well as the promotion of principles and values of
sustainable development with respect to the expectations and needs of all the
stakeholders.
In 2016, FS established a Sustainability Committee, an advisory board made up of senior managers from the main
Group companies, pursuing value creation for all stakeholders, with respect to sustainable development principles
Mission
Draw up the Group vision, in compliance with the environmental and social
dimensions along with the business, to be approved by the Board of Directors of
FS;
Define long-term objectives and action plans, as per the Group vision, to be
approved by the Board of Directors of FS;
Ensure the transposition of long-term objectives in short / medium term
objectives to be integrated in the business plan;
Evaluate the Group sustainability performance and resolve any critical issues,
through inter-companies work tables;
Ensure stakeholder dialogues through engagement processes;
Ensure the dialogue with Ethic, Investment and Equal Opportunities
Committees, to manage potential risks and opportunities.
Responsibilities
23
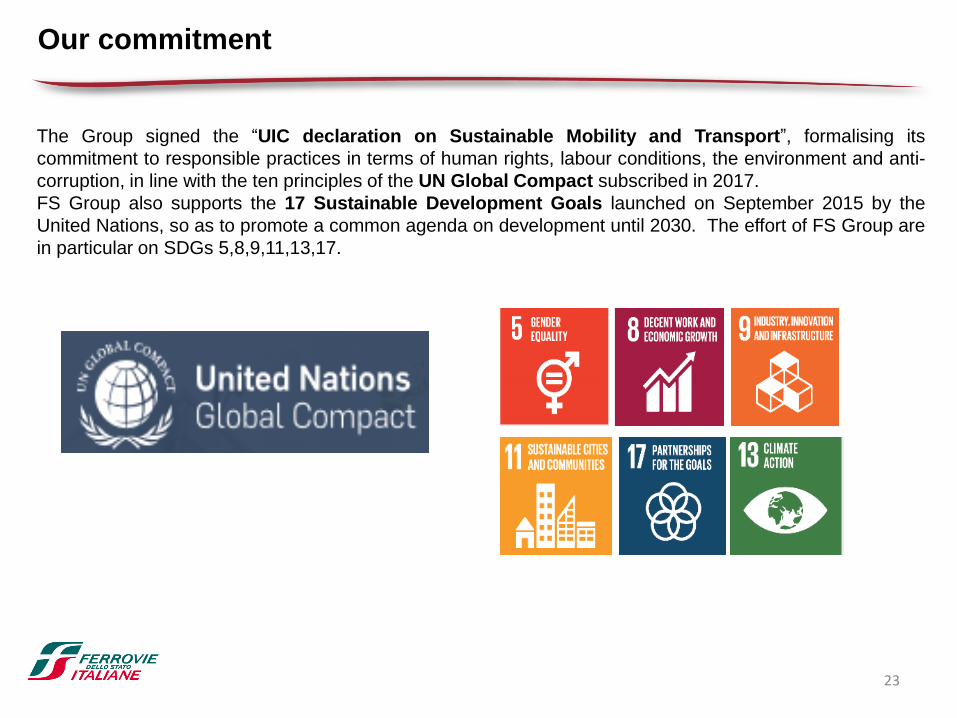
The Group signed the “UIC declaration on Sustainable Mobility and Transport”, formalising its
commitment to responsible practices in terms of human rights, labour conditions, the environment and anti-
corruption, in line with the ten principles of the UN Global Compact subscribed in 2017.
FS Group also supports the 17 Sustainable Development Goals launched on September 2015 by the
United Nations, so as to promote a common agenda on development until 2030. The effort of FS Group are
in particular on SDGs 5,8,9,11,13,17.
Our commitment

24
FS Italiane Group and the main Group companies are committed to implement and certify their
environmental management systems. In 2016, the Group companies launched a transition process to
adopt the new UNI EN ISO 14001:2015 standard.*
FS Group companies follow environmental policies aimed at maximising environmental benefits
and minimising the impacts of our activities.
Consumption trends 2016 vs 2015:
Environmental Management System & Energy efficiency
Diesel
1.1%
CO2 emissions: high speed train vs car
1.8%
2,100 t per day
Natural gas Total direct energy
consumption
0.5%
* ISO 14001: 2015 is a standard related to environmental management that helps organizations to: (a) minimize how their operations
(processes, etc.) negatively affect the environment (i.e. cause adverse changes to air, water, or land); (b) comply with applicable laws,
regulations, and other environmentally oriented requirements; (c) continually improve in the above. For further information, also
regarding the certification scope, please refer to 2016 Group Sustainability Report.

Green Bond Programme
4

26
Green Bond Framework and Use of Proceeds
Ferrovie strongly believes that rail and public transport are critical for sustainable development and global efforts to
combat climate change, by facilitating the modal shift away from cars into less carbon intensive modes of transport.
Ferrovie has developed a Green Bond Framework which is in accordance with the 2017 ICMA Green Bond
Principles and which aims at financing projects with a positive impact in terms of environmental and social
sustainability
To ensure energy efficiency improvements, carbons emission reduction and modal shift to rail in
the long distance transport market, among other improvements related to air quality and comfort
for passengers
Eligible
Green
Projects
To ensure energy efficiency improvements, carbons emission reduction and modal shift to rail in
the local public transport, among other improvements related to air quality and comfort for
passengers
New Electric Multiple Unit trains for regional passenger transport
New High speed Trains “ETR 1000”
1
2
Ferrovie Green Bond Framework will focus on Investments in Public Transport Rolling Stock
Renewal, including:
Ferrovie may decide to include additional Project Categories for future issuances
An amount equal to the net proceeds of the Green Bond will be allocated for investments in
one or more of the “Eligible Green Projects“, which include new and on-going projects which
may have a disbursement within the past 2 years.
~ € 950
million
Total pool of
Eligible Green
Projects for the
years 2016-2018
66%
2016
34%
2017-2018*
* FS forecast on disbursement timing

27
New Electric Multiple Unit trains for regional transport
An estimated reduction of 30% in energy consumption with respect to comparable trains operating in
Italy
Innovative technologies for energy efficiency (engines with natural ventilation, use of light alloys, LED
lighting, CO2 sensors for optimal climatization, smart parking mode, etc)
Recyclability rate over 92%
More bikes racks, with charging points for electric bikes
Access to "White Certificate" mechanism (national incentives scheme for high energy efficiency
investments) obtained on February 15th, 2017
Awarded in the top ten Italian initiatives for sustainable mobility 2017
Eligible
Green
Projects
1

28
New High Speed Train “Frecciarossa ETR 1000"
An average reduction of 18% in energy consumption with respect to comparable
Frecciarossa ETR 500 Expected CO2 avoided in 2018: about 25.000 tons
Extremely accurate aerodynamic design to minimize motion resistance
High efficiency of traction system
LED lighting
Recyclability rate over 94%
First HS train provided with Environmental Product Declaration (EPD)*
Access to "White Certificate" mechanism (national incentives scheme for high energy efficiency
investments) obtained on December 1st, 2015
Eligible
Green
Projects2
* EPD is an Environmental Product Declarations defined by ISO 14025 as a document that quantifies the environmental
performance of a product through appropriate categories of parameters calculated with the Life Cycle Assessment (LCA)
method according to the ISO 14040 standard. See also Appendix for further details on EPD
pantograph aerodynamic ETR 1000 (r) vs traditional (l)

29
Process for Selection and Evaluation & Management of Proceeds
Process for
Selection and
Evaluation
Ferrovie’s internal Green Bond Working Committee will be
established to review eligible projects, and monitor Ferrovie’s Green
Bond Framework, on a semi-annual basis.
Committee consists of members of Ferrovie‘s Finance, Sustainability
teams and Ferrovie’s subsidiaries involved. It will be chaired by
Ferrovie’s Head of Finance.
Management
of Proceeds
Ferrovie’s Treasury will allocate, via intercompany loan, the Green
Bond proceeds from the Treasury to the approved projects recorded in
the Green Bond Register.
Whilst any bond proceeds remain unallocated, they will be invested in
accordance with Ferrovie’s liquidity management policies and
guidelines in money market products.

30
Reporting
Reporting
On an annual basis, at least until full allocation, Ferrovie will provide:
o Allocation reporting: detailing the bond proceeds allocation by
category of Eligible Projects
o Performance reporting: for each category of Eligible Projects and
where feasible, Ferrovie will report on relevant impact metrics
Relevant metrics could include:
Project Category Indicative Key Performance Indicators
Public Transport Rolling
Stock Renewal
Energy savings (GWh saved)
Total GHG emissions avoided (tCO2 eq)
Other polluting emissions avoided (i.e. NOx, PM,
etc)
Ferrovie’s annual Green Bond reporting will be made available on its
website.
After full allocation, reporting will only be issued in the event of any
material changes

31
Second Party Opinion
Ferrovie has appointed Sustainalytics to provide a Second Party Opinion on this Green Bond
Framework.
Second Party Opinion document is published on Ferrovie’s website
Ferrovie Green
Bond Framework
Ferrovie’s
sustainability
strategy
Impact of Use of
Proceeds
“Ferrovie’s Green Bond
Framework is robust and
transparent and in alignment
to the four pillars of the Green
Bond Principles 2017.”“Ferrovie has started the process to
fully integrate environmental
management into its business model
through:
o Reduction in its own
consumption of natural capital
o promote a shift towards more
efficient modes of transport”
“Given the declared energy
improvements of the new electric
trains compared to previous models,
as well as recyclability of the trains,
Sustainalytics is of the opinion that
the use of proceeds contributes to
increased sustainability and energy
efficiency of Ferrovie Group’s
operations and the mobility system in
Italy.”

32
FS Inaugural Green Bond
Indicative Terms for New FS Italiane RegS Offering – First Green Bond Issuance
Issuer Ferrovie dello Stato Italiane Spa
Issuer RatingS&P: BBB stab / Fitch: BBB stab
DocumentationREG S Bearer Senior Notes off Euro 4.5 bn EMTN Programme
Size Benchmark
Tenor 6-10 yr
Use of Proceeds Eligible Green Projects
Denomination Eur 100k+1k
Listing Irish Stock Exchange

Financial Overview
5

8,264 8,2288,329 8,390
8,5858,928
6,4826,310 6,296 6,276
6,6106,635
6,000
6,500
7,000
7,500
8,000
8,500
9,000
2011 2012 2013 2014 2015 2016
Consistent profitability and margins
Increase in revenueover the period
…focus on expenses containment
CAGR
+1.56%
CAGR
+0.47%
Revenue
Operating Costs
EBITDA
2,1141,782
1,918 2,030
FS Group financial performance continues to improve
€mn1,975
2,293
2,1141,975
2,293
659 644
892
303464
772
0
500
1,000
1,500
2,000
2,500
2014 2015 2016
EBITDA EBIT Net Income
25.2%23.0%
25.7%
7.9% 7.5%10.0%
0%
5%
10%
15%
20%
25%
30%
2014 2015 2016
EBITDA Margin EBIT Margin
€mn
34Source: FS 2016 Annual Report

In 2016 Revenues increased by €343 million (+4% vs 2015), as a result of the rise in revenue from sales and services (+€27
million) and other income (+€316 million).
Transport Services “Market”: strong performance of the short-haul passenger segment - both domestic rail and road and
international rail - offset by the decrease in the long-haul passenger segment, mainly due to the tightening in the average yield
following the increased intermodal competitive pressure, in addition to the lack of the incremental traffic originated by Expo 2015.
Transport Services “PSCs”: revenue from Public Service Contracts – Regions and Government - increase by €62 million
Infrastructure: increase in toll revenues due to the greater production volumes requested by railway companies whereas
revenues from CdP-Services keep stable
Other income rose by €316 million, mainly as a result of the €365 million gain from the sale of Grandi Stazioni Retail’s
assets
Revenues breakdown
€mn 2016 2015 change %
Transport services 6,385 6,383 0.0%
Passenger traffic products 3,164 3,207 -1.3%
Cargo traffic products 860 878 -2.1%
Market revenues 4,024 4,084 -1.5%
PSCs and other contracts 248 247 0.4%
Fees from the Regions 2,113 2,052 3.0%
Public service contract fees 2,361 2,299 2.7%
Infrastructure services 1,282 1,256 2.1%
Other services revenues 241 242 -0.4%
Other income 1,020 704 44.9%
Total Group Revenues 8,928 8,585 4%
Group revenues breakdown
63% 64%
37% 36%
2016 2015
Transport Revenues: Market vs. PSCs
Market revenues Public service contract fees
35Source: FS 2016 Annual Report
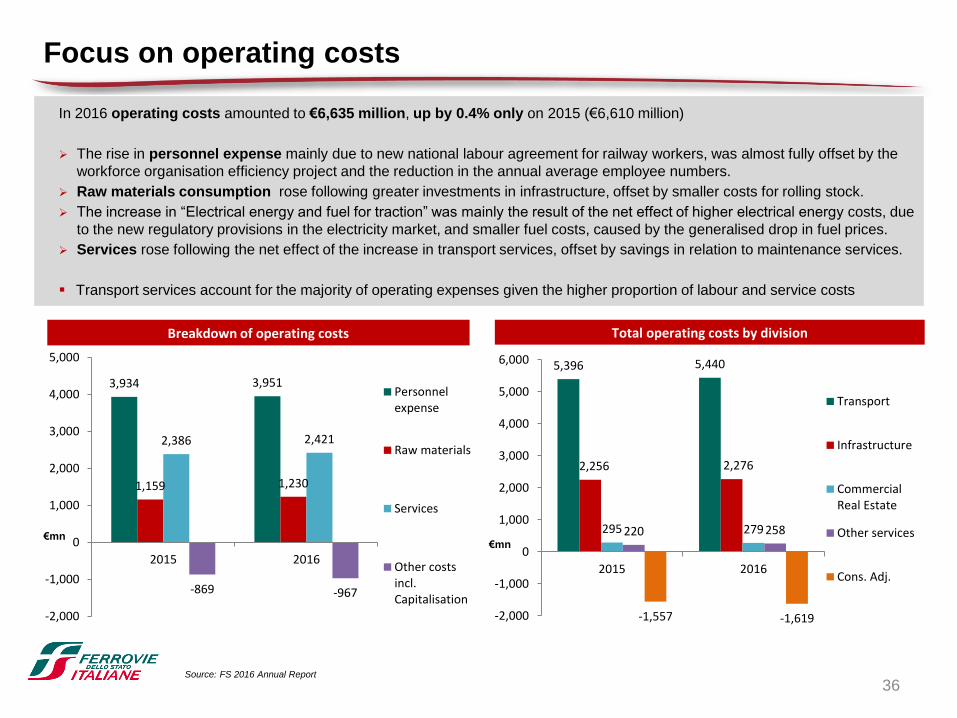
5,396 5,440
2,256 2,276
295 279220 258
-1,557 -1,619-2,000
-1,000
0
1,000
2,000
3,000
4,000
5,000
6,000
2015 2016
Transport
Infrastructure
CommercialReal Estate
Other services
Cons. Adj.
In 2016 operating costs amounted to €6,635 million, up by 0.4% only on 2015 (€6,610 million)
The rise in personnel expense mainly due to new national labour agreement for railway workers, was almost fully offset by the
workforce organisation efficiency project and the reduction in the annual average employee numbers.
Raw materials consumption rose following greater investments in infrastructure, offset by smaller costs for rolling stock.
The increase in “Electrical energy and fuel for traction” was mainly the result of the net effect of higher electrical energy costs, due
to the new regulatory provisions in the electricity market, and smaller fuel costs, caused by the generalised drop in fuel prices.
Services rose following the net effect of the increase in transport services, offset by savings in relation to maintenance services.
Transport services account for the majority of operating expenses given the higher proportion of labour and service costs
Focus on operating costs
Total operating costs by divisionBreakdown of operating costs
3,934 3,951
1,159 1,230
2,386 2,421
-869 -967
-2,000
-1,000
0
1,000
2,000
3,000
4,000
5,000
2015 2016
Personnelexpense
Raw materials
Services
Other costsincl.Capitalisation
€mn€mn
36Source: FS 2016 Annual Report

5,4975,950
0
1,000
2,000
3,000
4,000
5,000
6,000
7,000
2015 2016
62%
3%
26%
9%
67%3%
26%
4%RFI - Traditionalnetwork
RFI - High Speednetwork
Trenitalia
Other capex
FS Italiane Group confirms its position as the leading investor in development of transport, infrastructure and logistics
FS’s investment expenditure in 2016 came to € 5,950 million (of which €4,301 million through government grants mainly
earmarked to infrastructure) up by 8.2% on the already sizeable amount invested in 2015.
The majority of capex is related to the maintenance and development of the rail infrastructure network carried on by RFI, with
a focus on Traditional network (~ €4bn). Infrastructure capex is almost totally funded by the Government according to provisions of
“Contratto di Programma” between Ministry of Infrastructure and Transport and RFI.
Trenitalia accounts for 26% (~ €1,5bn) up by 9% on the previous year and invested 63% of its capex to purchase new rolling
stock both for long haul and regional passenger transport:
€ 614 million was earmarked to additional “Frecciarossa 1000” (part of these will be refinanced via Green Bond)
€ 455 million went to the new regional fleet
2015 - 2016 capex breakdown
Change
+8.2%
FS Capex in 2015 - 2016
2015
2016
FS Group’s CAPEX profile
€mn
37Source: FS 2016 Annual Report

88%
12%
76%
13%
11%
54%
32%
14%
Supranational Entities EMTN Bonds Bank Loans
Breakdown Financial sources as of 30 June 2017 (a)
2013
2017
FS’ debt profile
2012
(a) These percentages are calculated on the long term debt held by FS\RFI\TI which amounts to around 9 billion
(b) In PSCC from July 2015 to July 2016
Source: FS 2016 Annual Report and 2017 interim report highlights 38
EMTN bonds in CSPP since July 2016 (b)
FS Group’s total gross financial debt (long term+short term) amounts to € 11,862mn* at YE 2016 vs. €11,143mn at YE 2015
The bulk of FS Group’s debt is held by FS Holding (€ 7,770mn)
Part of FS' debt is funded directly through guaranteed State transfers (€ 2.99 billion out of the total debt of € 11.86 billion at YE
2016). This debt is earmarked to infrastructure investments.
With € 3.05 bn outstanding, FS has significantly increased the use of senior unsecured bonds for its funding needs since
the establishment of the EUR 4.5bn EMTN Programme, which now account for 32% of financial sources. Supranational
entities such as EIB, Cdp, Eurofima, still act as important Group’s lenders whereas bank lending accounts for 14%.
Furthermore FS has a € 1.5bn committed revolving credit facility underwritten by the a pool of 10 banks and additional
uncommitted credit lines granted by many primary banks.
Net Financial Debt amounts to € 6,760mn at YE 2016 keeping stable vs. € 6,742mn at YE 2015 and € 6,218mn at YE 2014.
Split of debt by company as of 31 Dec 2016
€mnGross financial debt
FS (Holding Company) 7,770
Rete Ferroviaria Italiana 1,951
Trenitalia 1,092
Other Group’s Companies 1,049
Total Long Term Debt + Short Term
Financing 11,862*
*Of which € 8,652mn long term debt and € 3,210mn short term debt and current
portion of long term debt

0
200
400
600
800
1,000
1,200
1,400
1,600
1,800
2,000
Balanced debt maturity profile
Effective management of financial expense
The Group has a balanced debt maturity profile extending over the next 15 years, with the majority of maturities falling due over
the next 5 years.
Historically low borrowing costs and an effective management of financial costs, including interest rate risk management
policies, has resulted in a containment of interest expense on debt generating value for the Group.
In 2016 interest expense on debt was a record low at 1.7%.
Group long term debt maturity profile as of 30 June 2017*
€mn
39
* Maturity profile calculated on the long term debt, included the current portion of the long term debt, held by FS\RFI\TI which amounts to around 9 billion
** The financial expense is net of government grants, therefore the ratio is calculated on the debt not funded through guaranteed government grants
Source: FS 2016 Annual Report
3.1%
2.8% 2.8%2.7%
2.4%
1.7%
2011 2012 2013 2014 2015 2016
Interest on financial liabilities **
Debt service capacity
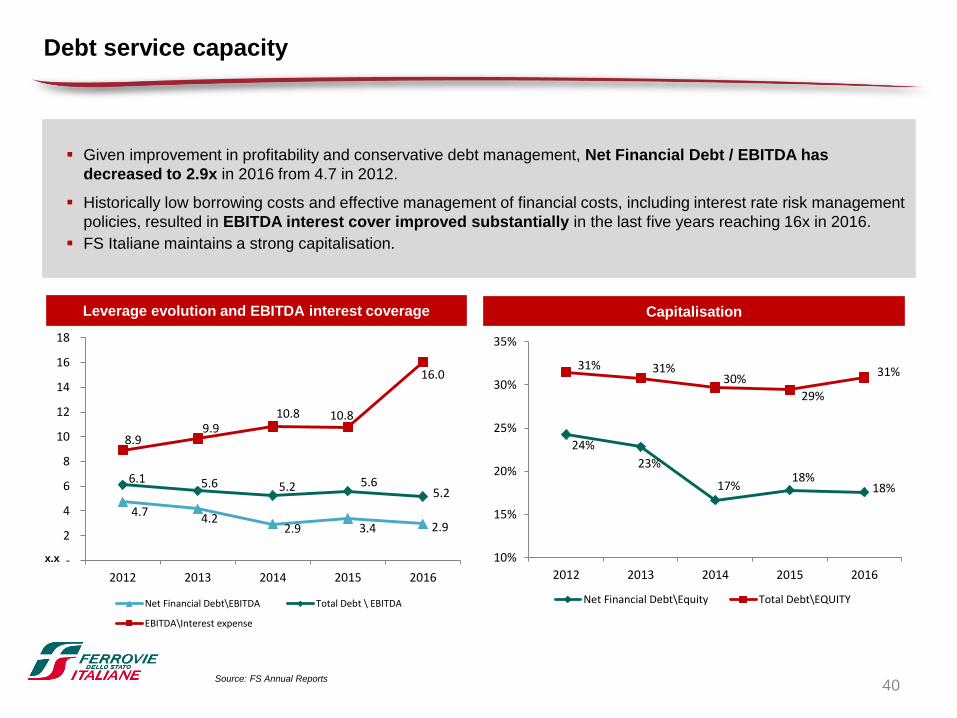
Given improvement in profitability and conservative debt management, Net Financial Debt / EBITDA has
decreased to 2.9x in 2016 from 4.7 in 2012.
Historically low borrowing costs and effective management of financial costs, including interest rate risk management
policies, resulted in EBITDA interest cover improved substantially in the last five years reaching 16x in 2016.
FS Italiane maintains a strong capitalisation.
Leverage evolution and EBITDA interest coverage
Source: FS Annual Reports
Capitalisation
24%
23%
17%18%
18%
31% 31%30%
29%
31%
10%
15%
20%
25%
30%
35%
2012 2013 2014 2015 2016
Net Financial Debt\Equity Total Debt\EQUITY
4.74.2
2.9 3.4 2.9
6.1 5.6 5.2 5.65.2
8.99.9
10.8 10.8
16.0
-
2
4
6
8
10
12
14
16
18
2012 2013 2014 2015 2016
Net Financial Debt\EBITDA Total Debt \ EBITDA
EBITDA\Interest expense
40
x.x

BUSINESS AND CREDIT
Integrated Mobility Operator
Sole concessionaire of the rail network
until 2060
Regulated Infrastructure business
Market leading positions in all passenger
rail transport services in Italy
Business diversification
(product\geographical)
Track record of resilient performance
High technical barriers to entry and capital
requirements
Effective and disciplined financial
management
Key Strengths
41
SUSTAINABILITY
Strong commitment for a sustainable
integrated mobility
Promote modal shift to rail
Strong sustainability governance
Compliant with international standard
Environmental Management System for
the whole Group
Sustainability KPIs improving over time
Eligible Green Projects strongly contribute
to increased sustainability and energy
efficiency of FS operations

Appendix
6

The engagement of the Group
is disclosed in the
Sustainability Report
• Results
• Investments
• Funding
Economic
• Human resources
• Safety
• Customer care
• Customer satisfaction
• Community
• Human rights
Social
• Energy
• Emissions
• Waste
• Noise
• Other impacts (i.e. water)
Environmental
• Group profile
• Corporate Governance
• Strategy and Analysis
• Stakeholder engagement
Specific standard
disclosures
General standard
disclosures
Reporting practices
43

44
Use of materials provided with
environmental labels (Oeko – Tex
standard and FSC)
Minimum recyclability rate of 92%
Rack for 18 bikes + charging station for
electric bikes
Maximization of usable space
Reduced mass per seat (280 vs 370
kg/seat)
CO2 sensors for optimal regulation of
heating and cooling ventilation based on
vehicle actual occupation
Materials for thermal insulation, with
reduced dimensions and weights
ROCK - High Capacity EMUEligible
Green
Projects
1

45
POP - Medium Capacity EMU
Minimum recyclability rate of 96%
Rack for 8 bikes + charging station for
electric bikes
Reduced mass per seat (370 vs 410
kg/seat)
Use of natural ventilation for cooling
(engines, braking resistance, etc)
Improved torque characteristics both in
traction and in electric braking
Eligible
Green
Projects
1

46
Trenitalia won the “Sustainable Development Award 2017” for its new Rock and Pop regional trains
designed and built with strong energy and environmental performances.
The Sustainable Development Award is an important award for those companies that have been able to
combine environmental quality and industrial competitiveness. The award is promoted by the Sustainable
Development Foundation1 and Ecomondo2.
Trenitalia is resulted among the top 10 Italian companies in the "Sustainable Mobility" category.
Sustainability award
Note 1: The purpose of the Foundation is the promotion of a green economy, one of the core principles of sustainable development
Note 2: Ecomondo is the leading Euro-Mediterranean area green and circular economy expo
47
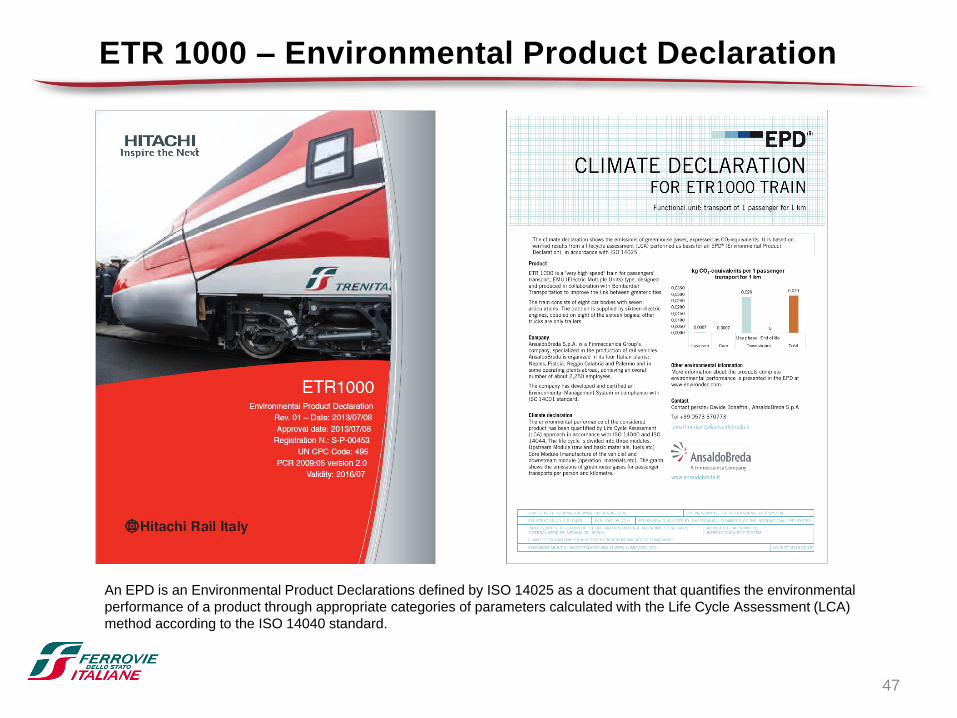
ETR 1000 – Environmental Product Declaration
An EPD is an Environmental Product Declarations defined by ISO 14025 as a document that quantifies the environmental
performance of a product through appropriate categories of parameters calculated with the Life Cycle Assessment (LCA)
method according to the ISO 14040 standard.
48
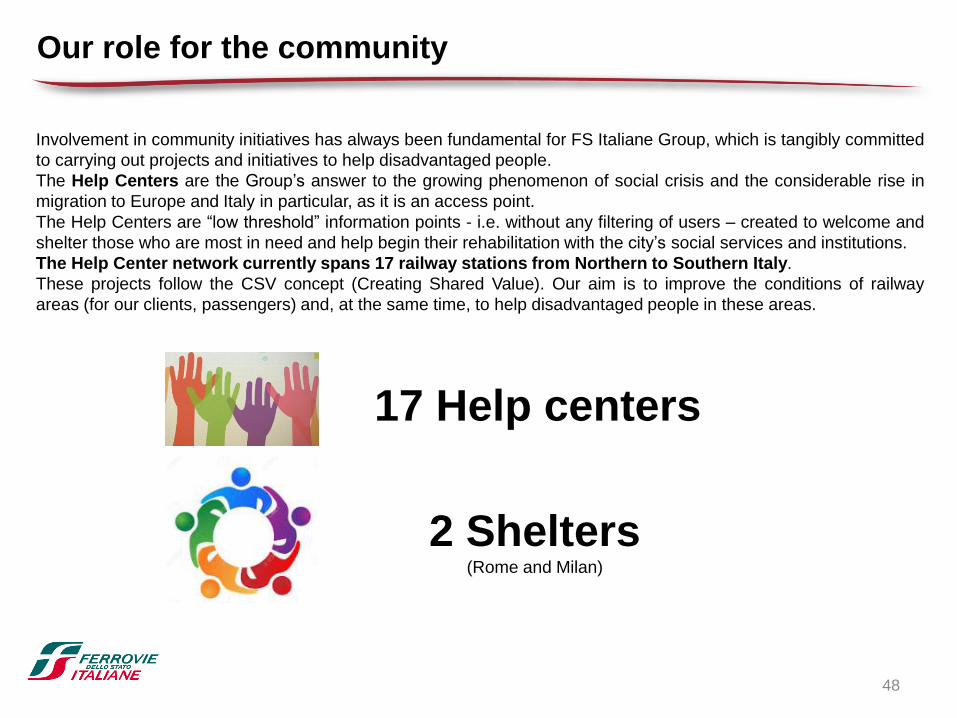
Involvement in community initiatives has always been fundamental for FS Italiane Group, which is tangibly committed
to carrying out projects and initiatives to help disadvantaged people.
The Help Centers are the Group’s answer to the growing phenomenon of social crisis and the considerable rise in
migration to Europe and Italy in particular, as it is an access point.
The Help Centers are “low threshold” information points - i.e. without any filtering of users – created to welcome and
shelter those who are most in need and help begin their rehabilitation with the city’s social services and institutions.
The Help Center network currently spans 17 railway stations from Northern to Southern Italy.
These projects follow the CSV concept (Creating Shared Value). Our aim is to improve the conditions of railway
areas (for our clients, passengers) and, at the same time, to help disadvantaged people in these areas.
17 Help centers
2 Shelters(Rome and Milan)
Our role for the community

49
FY 2016 Consolidated Financial Statements
Income Statement€mn 2016 2015 Change %
Total Revenues 8,928 8,585 4.0%
Of which:
Transport 6,385 6,383 +1.6%
Infrastructure 1,282 1,256 2.1%
Others 1,261 946 33.3%
Operating Costs (6,635) (6,610) 0.4%
Of which:
Employee costs (3,951) (3,934) 0.4%
Raw materials (1,230) (1,159) 6.1%
Service costs (2,421) (2,386) 1.5%
Other net operating costs 967 869 11.3%
EBITDA 2,293 1,975 +16.1%
EBIT 892 644 38.5%
Profit before Tax 798 537 48.6%
Income taxes (26) (73) 64.4%
Group Profit 772 464 66.4%
Reclassified Statement of Financial Position
€mn 2016 2015 Change
Net operating Working Capital 404 929 (525)
Other Net Assets 591 (581) 1,172
Working Capital 995 348 647
Net non-current assets 47,330 47,357 (27)
Other provisions (3,068) (3,010) (58)
Net assets held for sale
NET INVESTED CAPITAL 45,257 44,695 562
Net current financial debt 353 884 (531)
Net non-current financial debt 6,407 5,858 549
Net financial debt 6,760 6,742 18
Equity 38,497 37,953 544
COVERAGE 45,257 44,695 562
Statements of Cash Flows€mn 2016 2015
Profit for the year 772 464
Net cash flows generated by operating activities 1,395 1,468
Net cash flows used in investing activities (1,177) (1,878)
Net cash flows generated by financing activities 815 407
Total cash flows 1,032 (3)
Opening cash and cash equivalents 1,305 1,308
Closing cash and cash equivalents 2,337 1,305

WEB
http://www.fsitaliane.it/
https://www.fsitaliane.it/content/fsitaliane/en/investor-relations
https://www.fsitaliane.it/content/fsitaliane/en/Sustainability
Contacts
Stefano Pierini – Head of Finance
Tel.+39 06 44102348
Mail: [email protected]
Vittoria Iezzi – Head of Investor Relations and Credit Rating
Tel. +39 06 44106655
Mail: [email protected]
50


![Taller de Inve[1]. Original](https://img.pdfslide.net/doc/110x75/5571f86049795991698d497e/taller-de-inve1-original.jpg)

![Israeli Inve. English[1]](https://img.pdfslide.net/doc/110x75/577d391d1a28ab3a6b9919dc/israeli-inve-english1.jpg)