Embed Size (px)
Citation preview
Integrated monitoring system for power transformers and hydro generators as an asset
management and "smart grid" component
Miroslav Poljak, Ph.D

Monitoring - Definition
• On-line monitoring system (MS) is a
system which continuously monitors
asset parameters by measuring or
estimating them automatically
•2
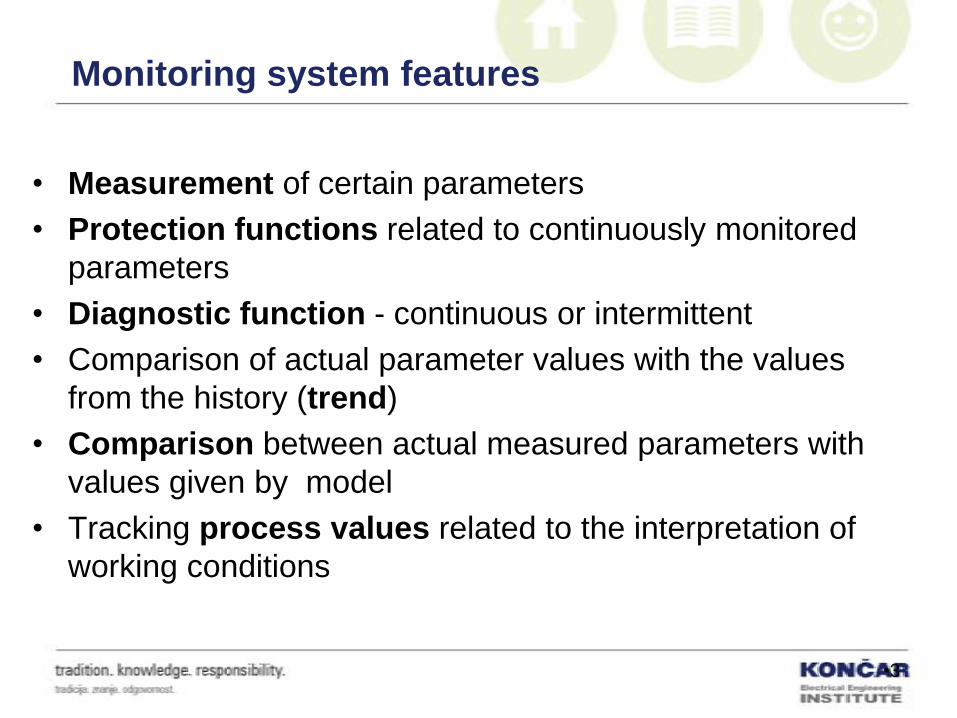
Monitoring system features
• Measurement of certain parameters
• Protection functions related to continuously monitored
parameters
• Diagnostic function - continuous or intermittent
• Comparison of actual parameter values with the values
from the history (trend)
• Comparison between actual measured parameters with
values given by model
• Tracking process values related to the interpretation of
working conditions
•3
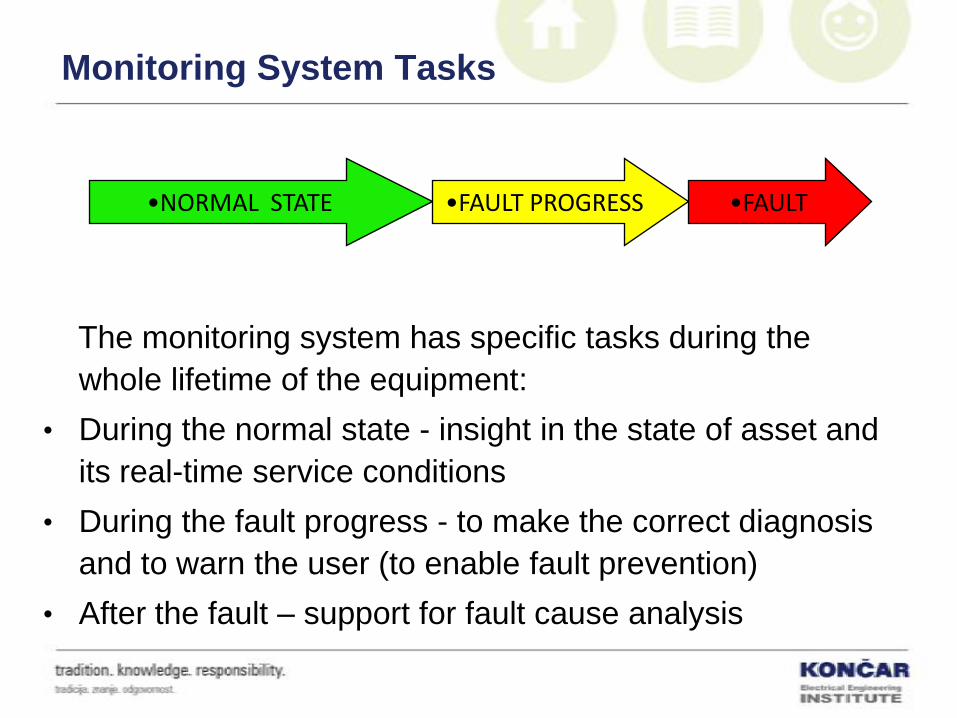
Monitoring System Tasks
The monitoring system has specific tasks during the
whole lifetime of the equipment:
• During the normal state - insight in the state of asset and
its real-time service conditions
• During the fault progress - to make the correct diagnosis
and to warn the user (to enable fault prevention)
• After the fault – support for fault cause analysis
•NORMAL STATE •FAULT PROGRESS •FAULT
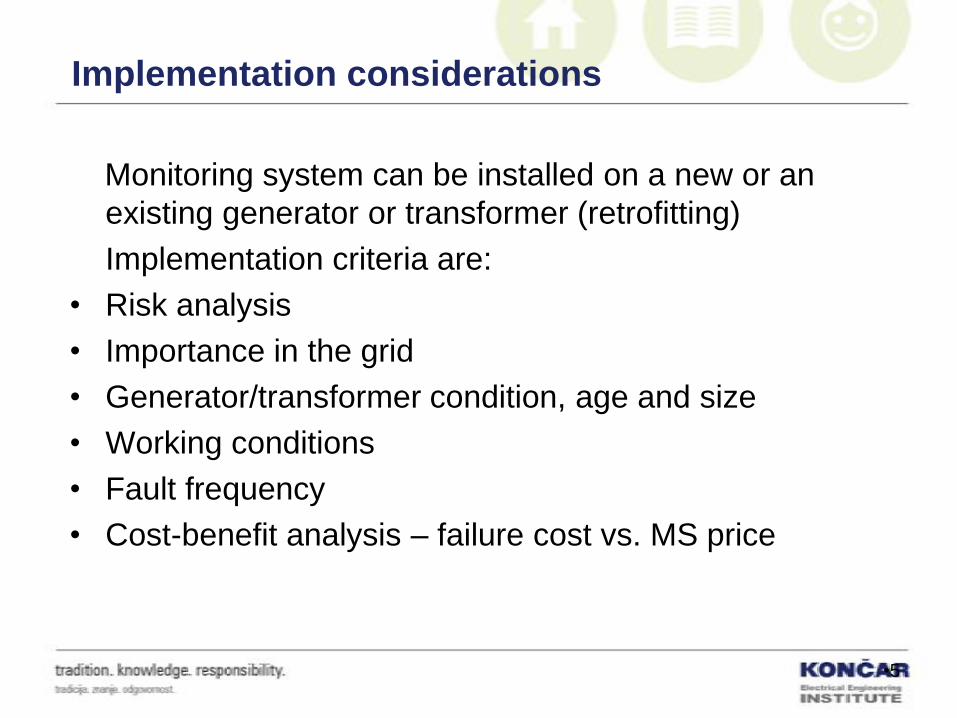
Implementation considerations
Monitoring system can be installed on a new or an
existing generator or transformer (retrofitting)
Implementation criteria are:
• Risk analysis
• Importance in the grid
• Generator/transformer condition, age and size
• Working conditions
• Fault frequency
• Cost-benefit analysis – failure cost vs. MS price
•5
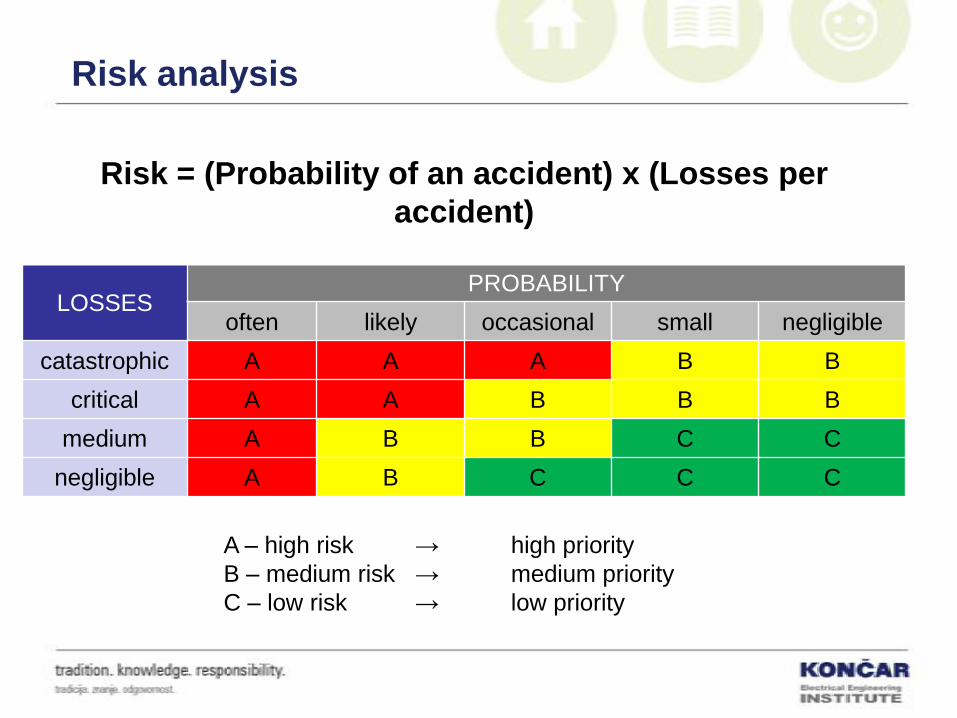
Risk analysis
Risk = (Probability of an accident) x (Losses per
accident)
LOSSESPROBABILITY
often likely occasional small negligible
catastrophic A A A B B
critical A A B B B
medium A B B C C
negligible A B C C C
A – high risk → high priority
B – medium risk → medium priority
C – low risk → low priority
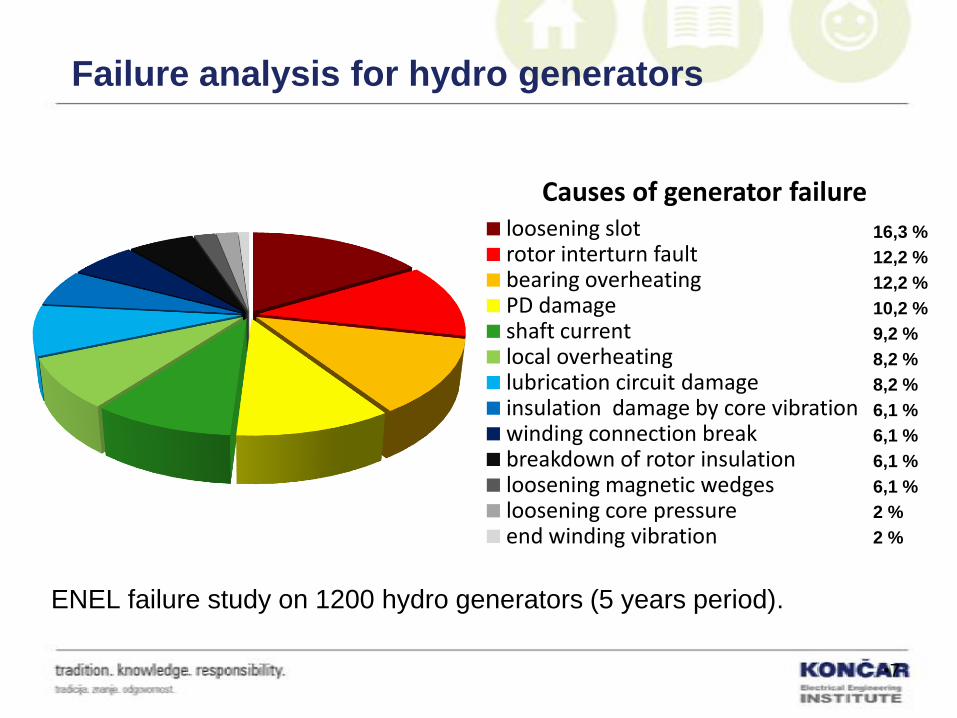
Failure analysis for hydro generators
ENEL failure study on 1200 hydro generators (5 years period).
•7
Causes of generator failureloosening slotrotor interturn faultbearing overheatingPD damageshaft currentlocal overheatinglubrication circuit damageinsulation damage by core vibrationwinding connection breakbreakdown of rotor insulationloosening magnetic wedgesloosening core pressureend winding vibration
16,3 %
12,2 %
12,2 %
10,2 %
9,2 %
8,2 %
8,2 %
6,1 %
6,1 %
6,1 %
6,1 %
2 %
2 %
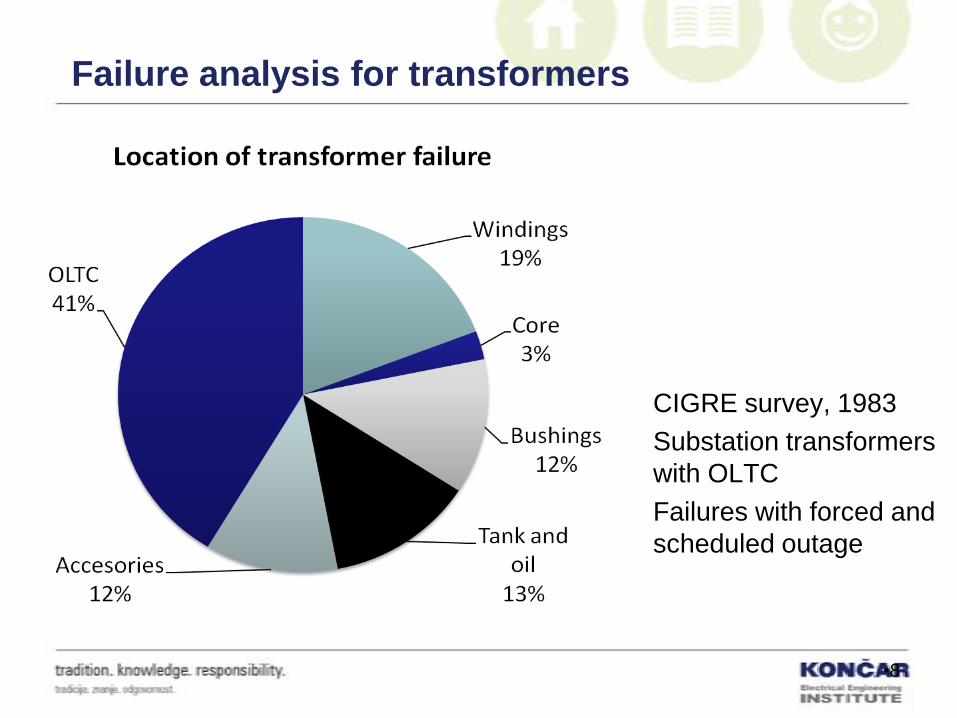
Failure analysis for transformers
CIGRE survey, 1983
Substation transformers
with OLTC
Failures with forced and
scheduled outage
•8
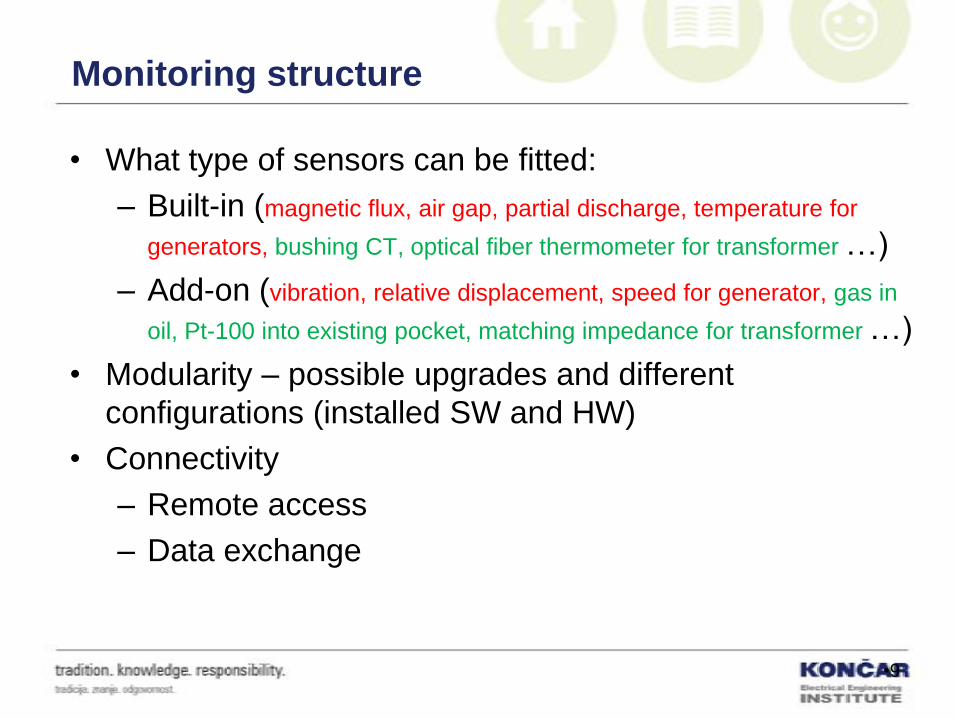
Monitoring structure
• What type of sensors can be fitted:
– Built-in (magnetic flux, air gap, partial discharge, temperature for
generators, bushing CT, optical fiber thermometer for transformer …)
– Add-on (vibration, relative displacement, speed for generator, gas in
oil, Pt-100 into existing pocket, matching impedance for transformer …)
• Modularity – possible upgrades and different
configurations (installed SW and HW)
• Connectivity
– Remote access
– Data exchange
•9
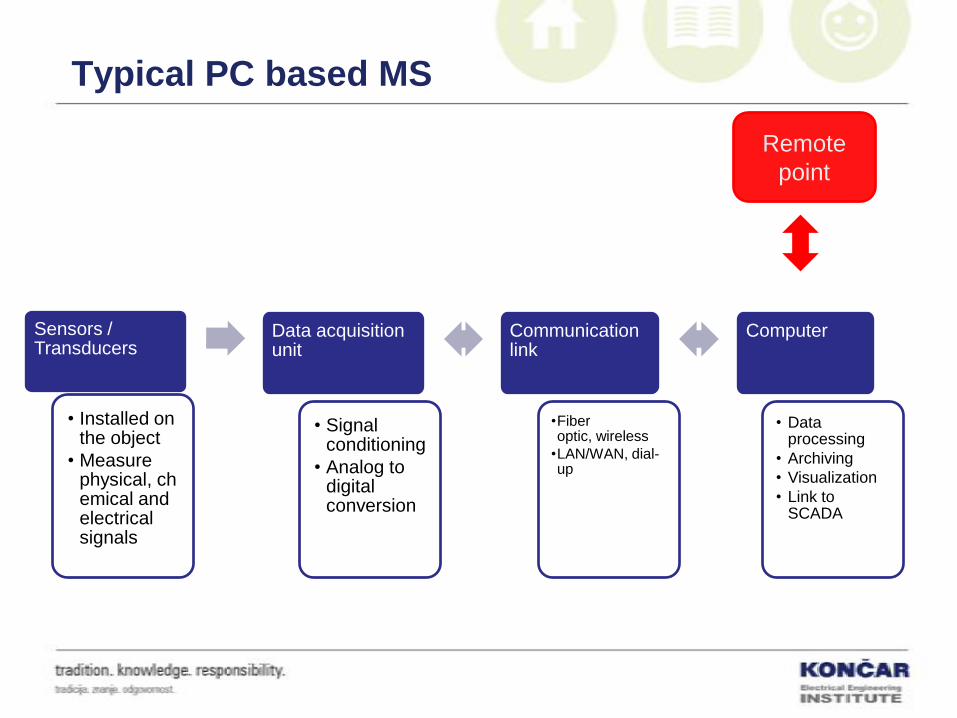
Typical PC based MS
Sensors / Transducers
• Installed on the object
• Measure physical, chemical and electrical signals
Data acquisition unit
• Signal conditioning
• Analog to digital conversion
Communication link
•Fiber optic, wireless
•LAN/WAN, dial-up
Computer
• Data processing
• Archiving
• Visualization
• Link to SCADA
Remote
point
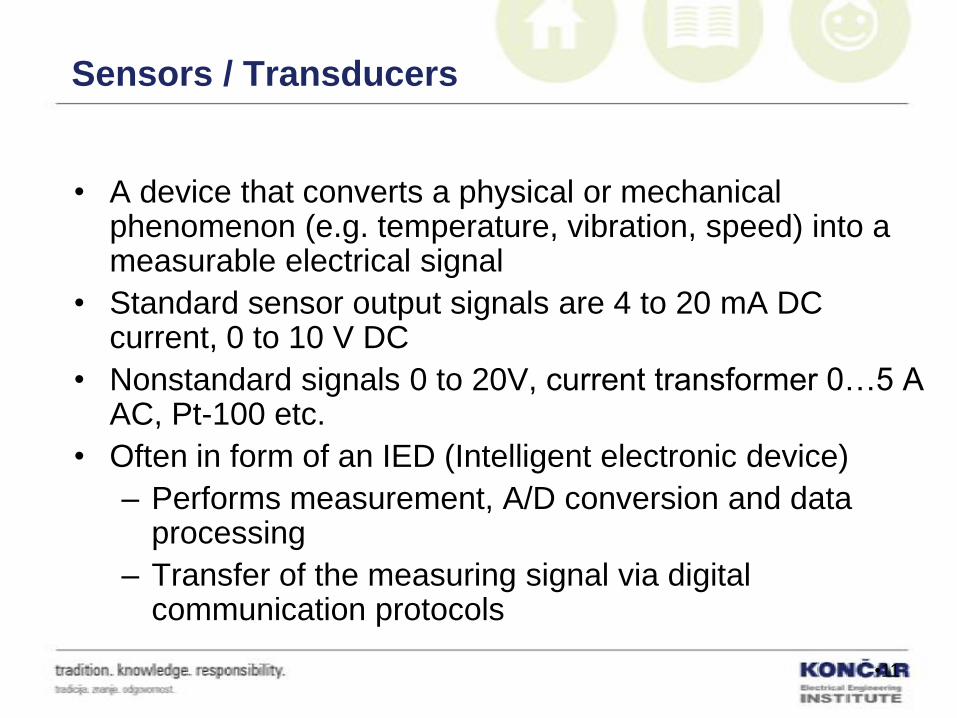
Sensors / Transducers
• A device that converts a physical or mechanical phenomenon (e.g. temperature, vibration, speed) into a measurable electrical signal
• Standard sensor output signals are 4 to 20 mA DC current, 0 to 10 V DC
• Nonstandard signals 0 to 20V, current transformer 0…5 A AC, Pt-100 etc.
• Often in form of an IED (Intelligent electronic device)
– Performs measurement, A/D conversion and data processing
– Transfer of the measuring signal via digital communication protocols
•11
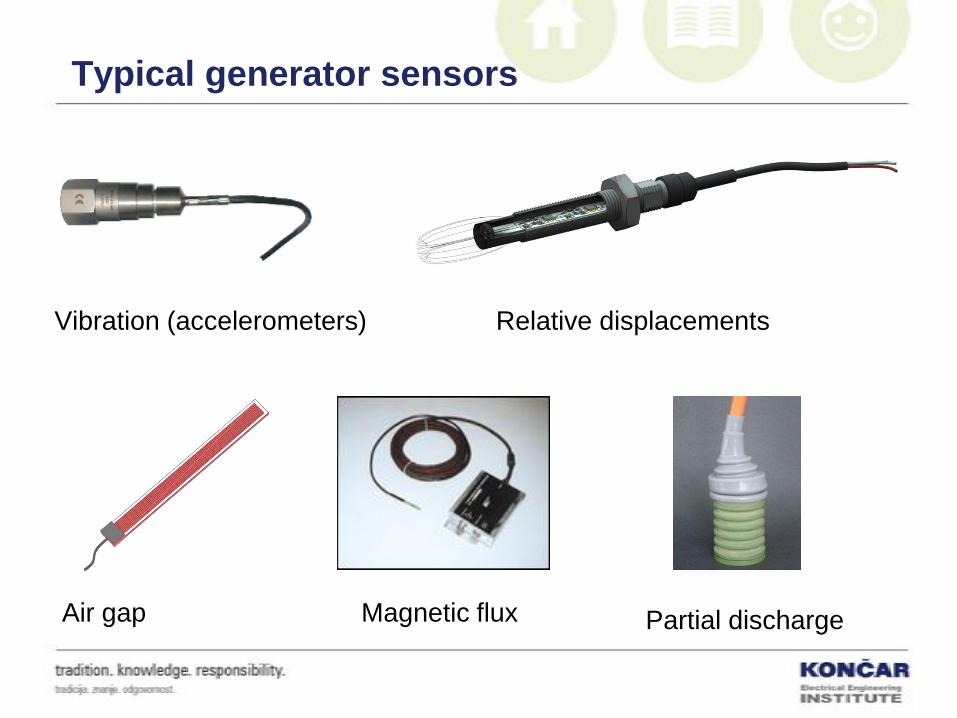
Typical generator sensors
Air gap
Vibration (accelerometers)
Magnetic flux
Relative displacements
Partial discharge
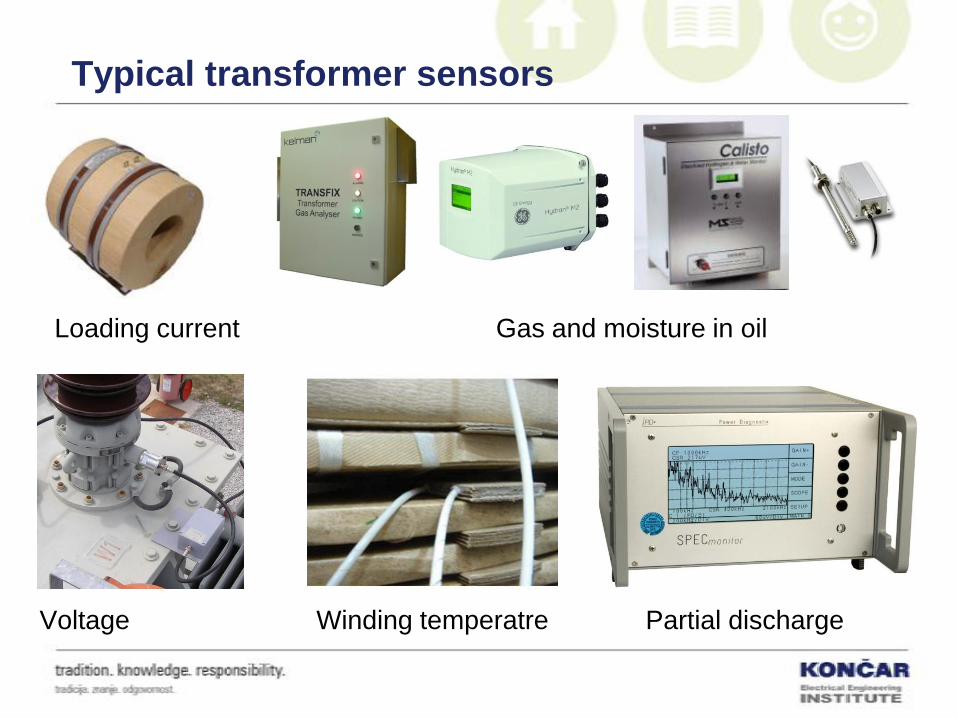
Typical transformer sensors
Voltage
Loading current
Winding temperatre
Gas and moisture in oil
Partial discharge
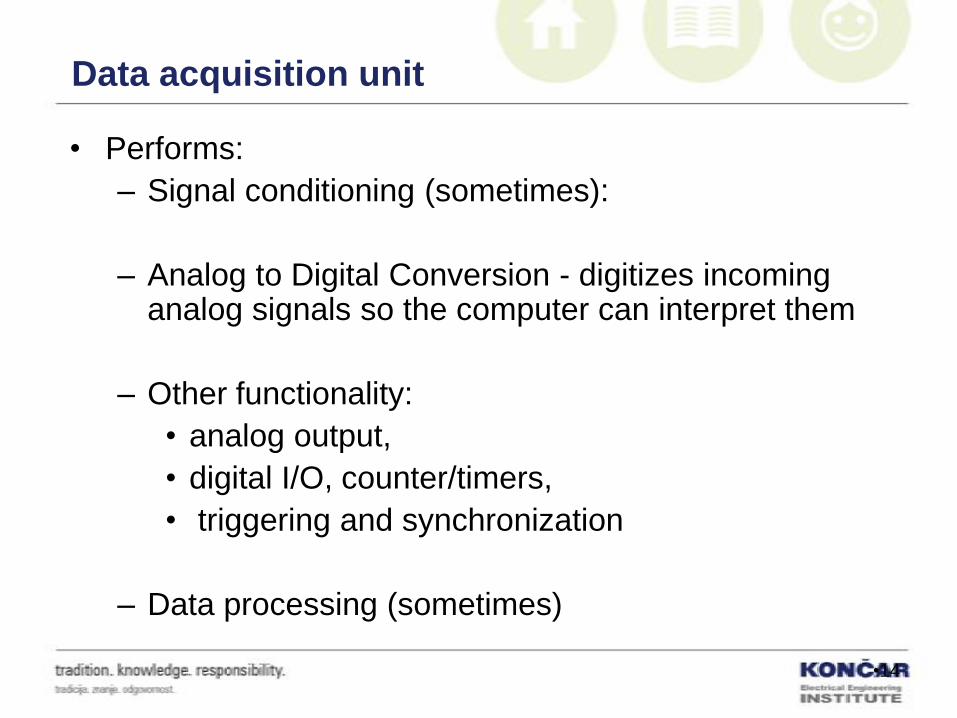
Data acquisition unit
• Performs:
– Signal conditioning (sometimes):
– Analog to Digital Conversion - digitizes incoming analog signals so the computer can interpret them
– Other functionality:
• analog output,
• digital I/O, counter/timers,
• triggering and synchronization
– Data processing (sometimes)
•14
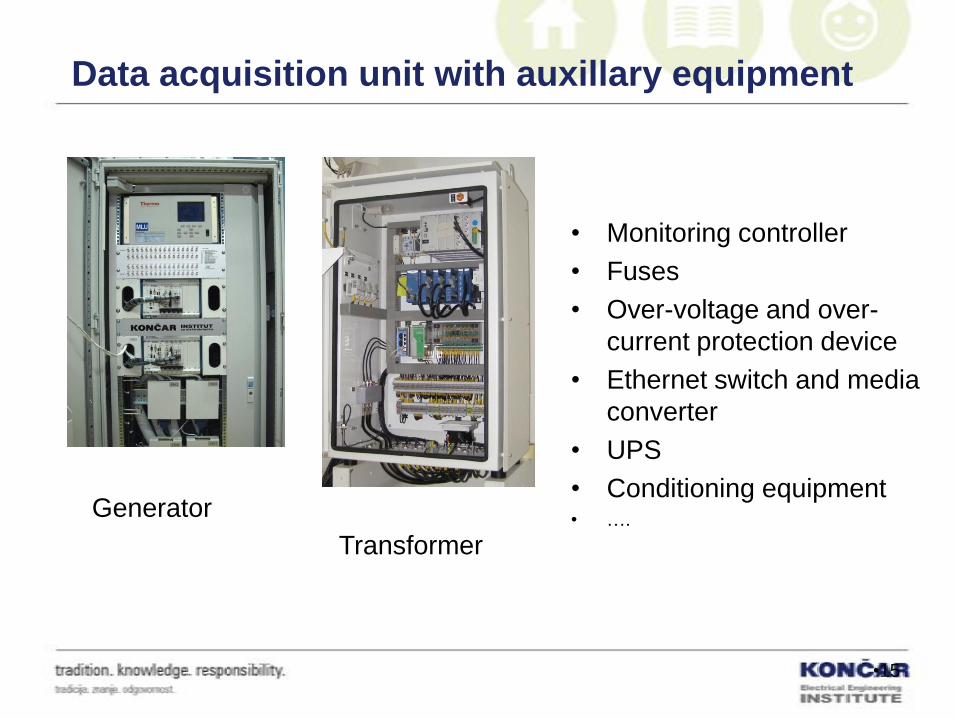
Data acquisition unit with auxillary equipment
•15
Generator
Transformer
• Monitoring controller
• Fuses
• Over-voltage and over-
current protection device
• Ethernet switch and media
converter
• UPS
• Conditioning equipment• ….
Communication link
• Media:
– Copper cabling / twisted pair cabling - short distance
(25/100m), low EMI (Electro Magnetic Immunity)
– Optical fiber – Ethernet to fiber convertor on both ends
of optical fiber – distance up to 80 km, excellent EMI
– Wireless (Bluetooth, WiFi – Wireless Local Area
Network (WLAN)) – easy to install, short range, security
issues
•16
Communication protocols
• Monitoring system is usually connected with other
systems in the substation
– Communication protocols:
• Modbus
• IEC 60870-5-101/103/104
• DNP 3.0 (USA)
• IEC 61850
•17
Remote access to aw MS
• Monitoring systems are almost always accessed
remotely
• KONČAR has implemented secure and efficient
remote access via:
– LAN/WAN
– Direct dial-up
• modem + phone network (analogue or ISDN)
• mobile modem or wireless card + mobile network
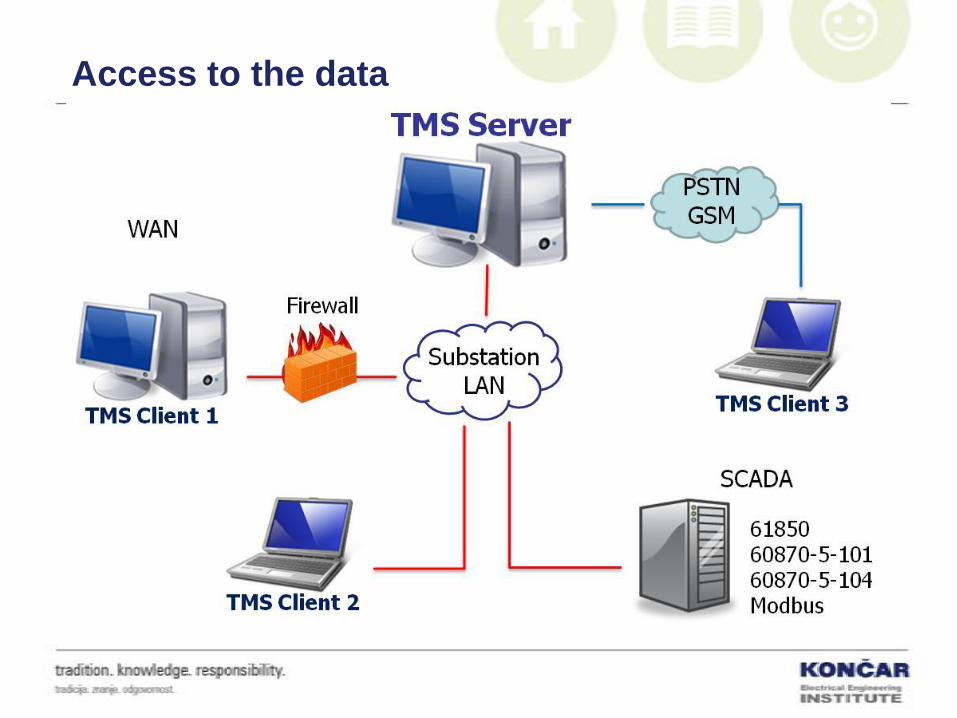
Access to the data
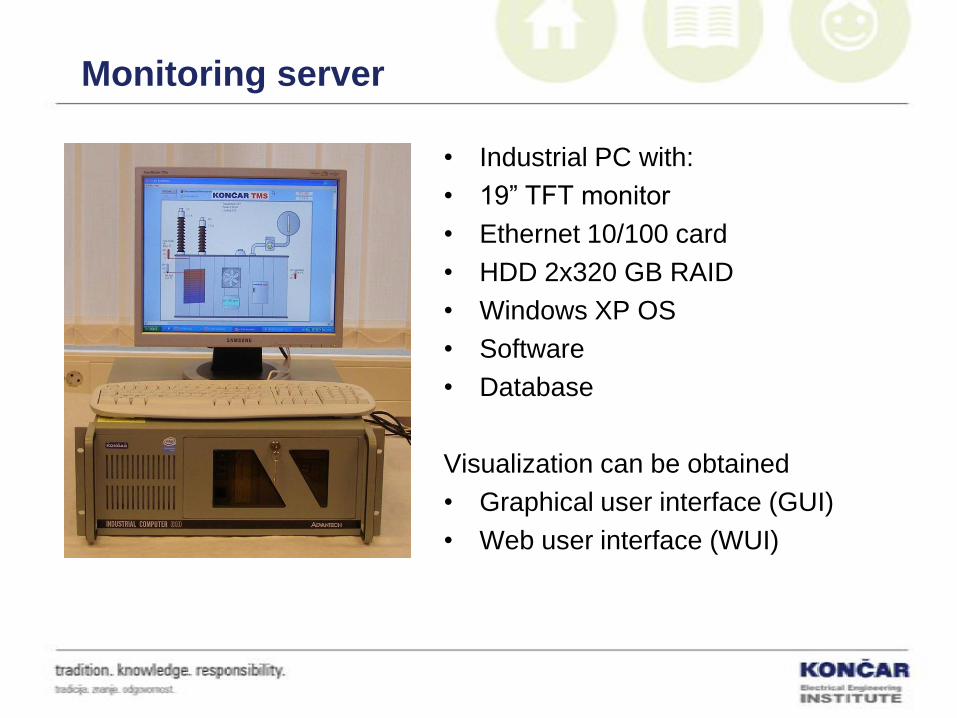
Monitoring server
• Industrial PC with:
• 19” TFT monitor
• Ethernet 10/100 card
• HDD 2x320 GB RAID
• Windows XP OS
• Software
• Database
Visualization can be obtained
• Graphical user interface (GUI)
• Web user interface (WUI)
Monitoring according to the models
• Models perform real-time on-line computation to
convert measured data into useful information
• Usually are based on internationally recognized
standards (IEC, IEEE), manufacturer calculation
algorithms etc.
• Inputs:
– On-line data – directly measured values
– Off-line data – asset parameters from factory testing
and design
•21
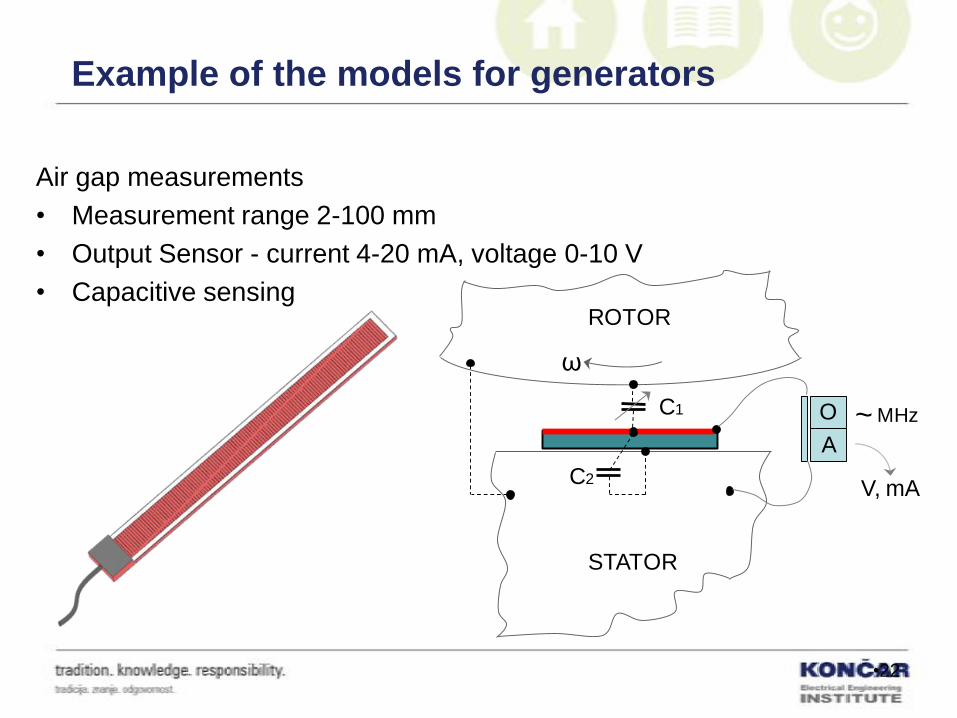
Example of the models for generators
Air gap measurements
• Measurement range 2-100 mm
• Output Sensor - current 4-20 mA, voltage 0-10 V
• Capacitive sensing
•22
C1
ROTOR
STATOR
~
C2
MHz
ω
V, mA
O
A

Example of the models for generators
•23
Air gap sensor 1
Air gap sensor 2
Air gap sensor 3
….
Model according
to machine factory acceptance tests
roundness of the rotor
roundness of the stator
eccentricity
• Roundness is an indicator of how the shape resembles a circle
• Eccentricity is the relative position of the approximate geometric center vector of the rotor, relative to the rotating axis of the stator
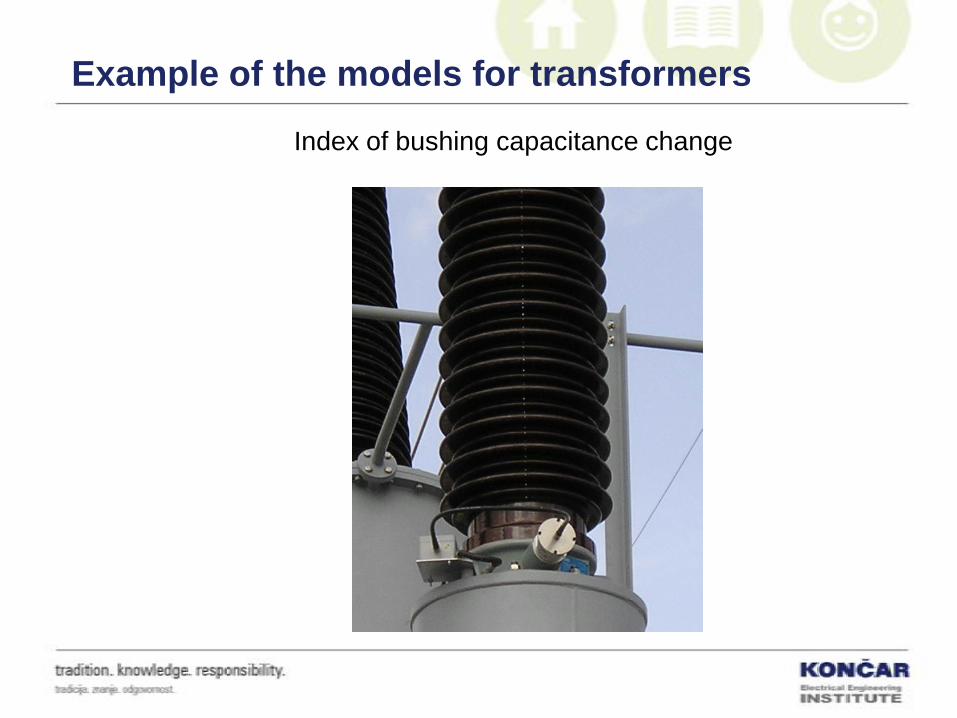
Example of the models for transformers
Index of bushing capacitance change

Example of the models for transformers
•25
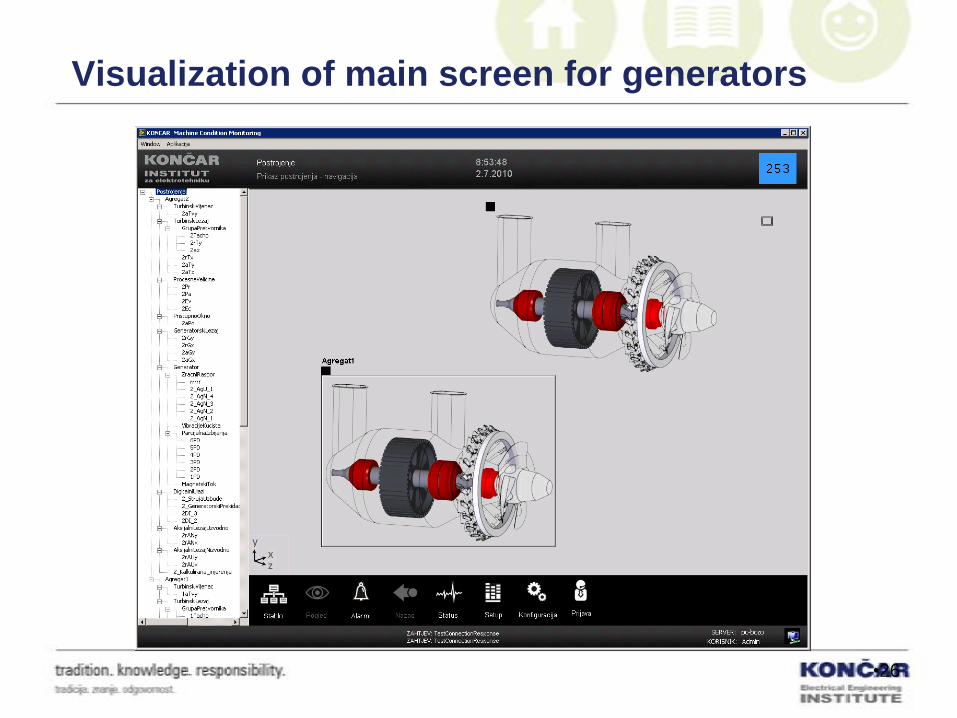
Visualization of main screen for generators
•26
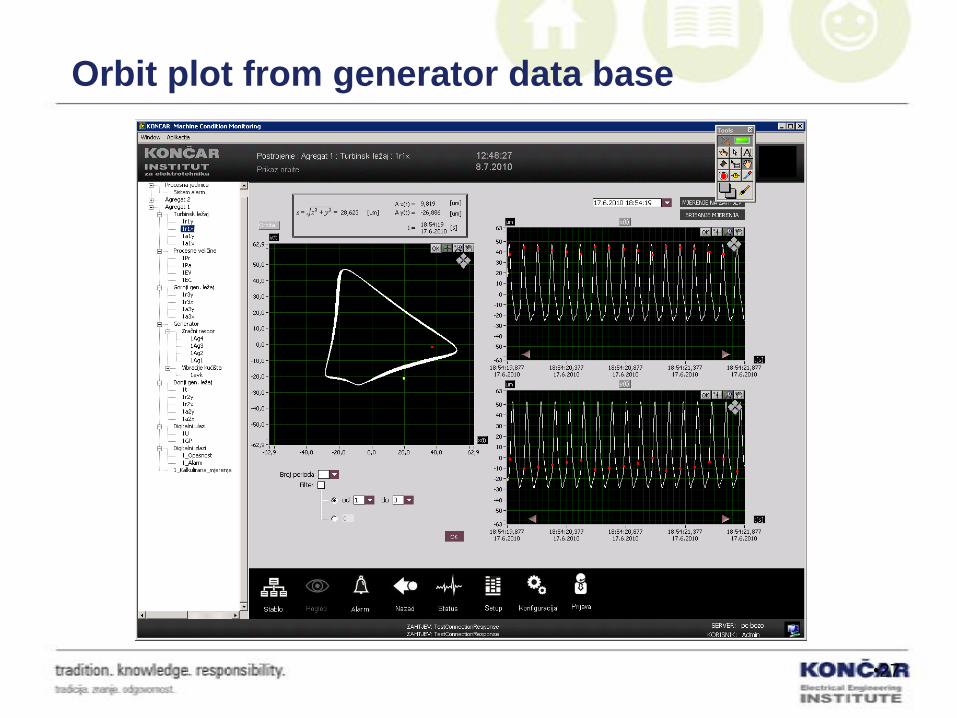
Orbit plot from generator data base
•27
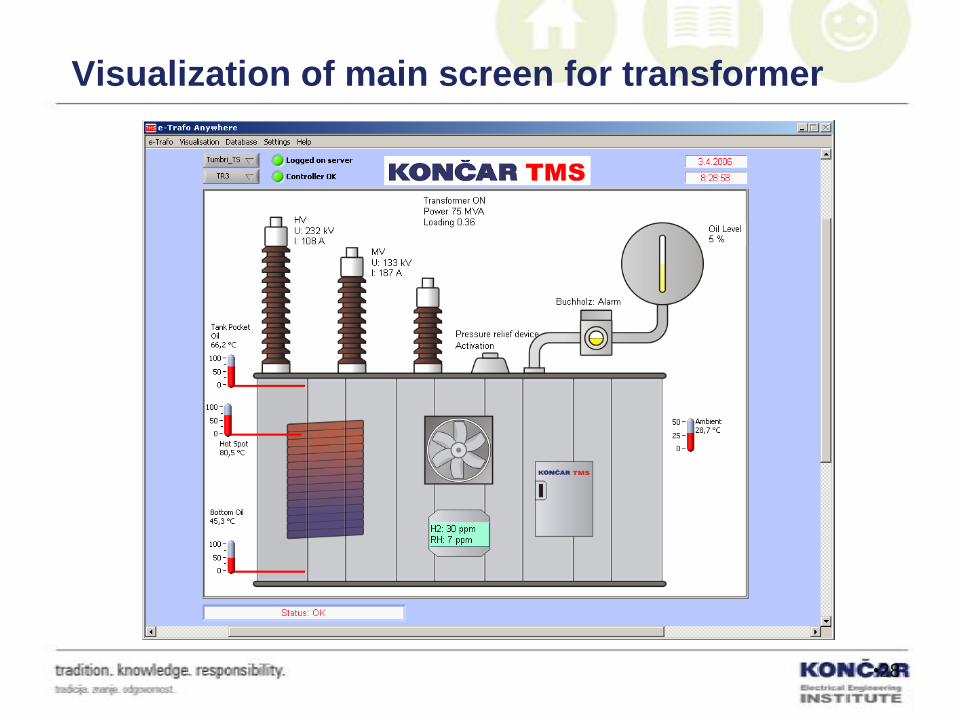
Visualization of main screen for transformer
•28
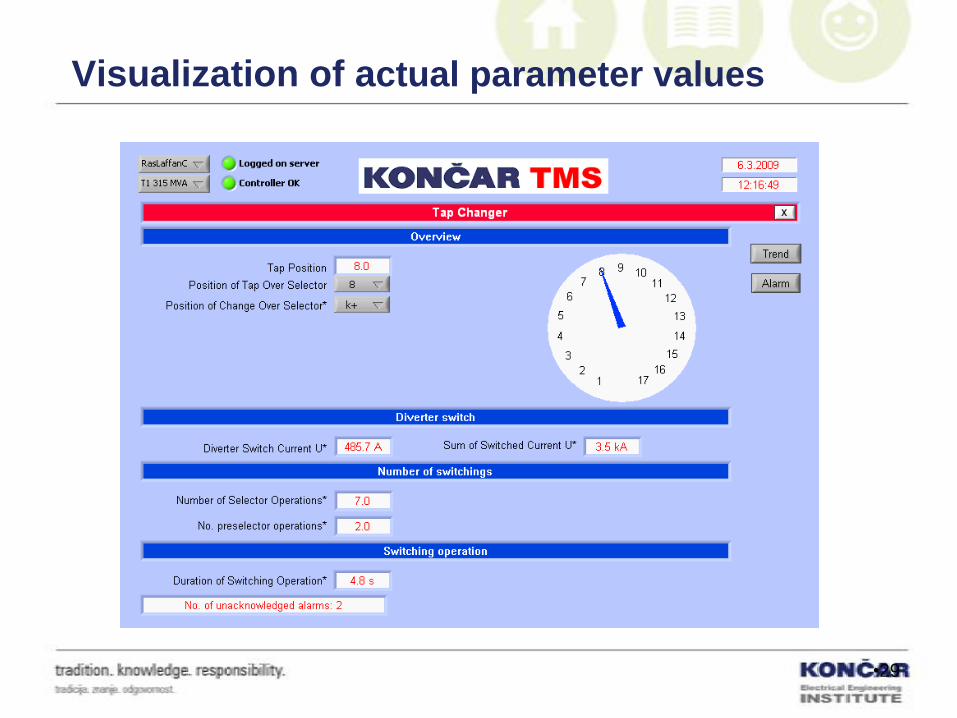
Visualization of actual parameter values
•29
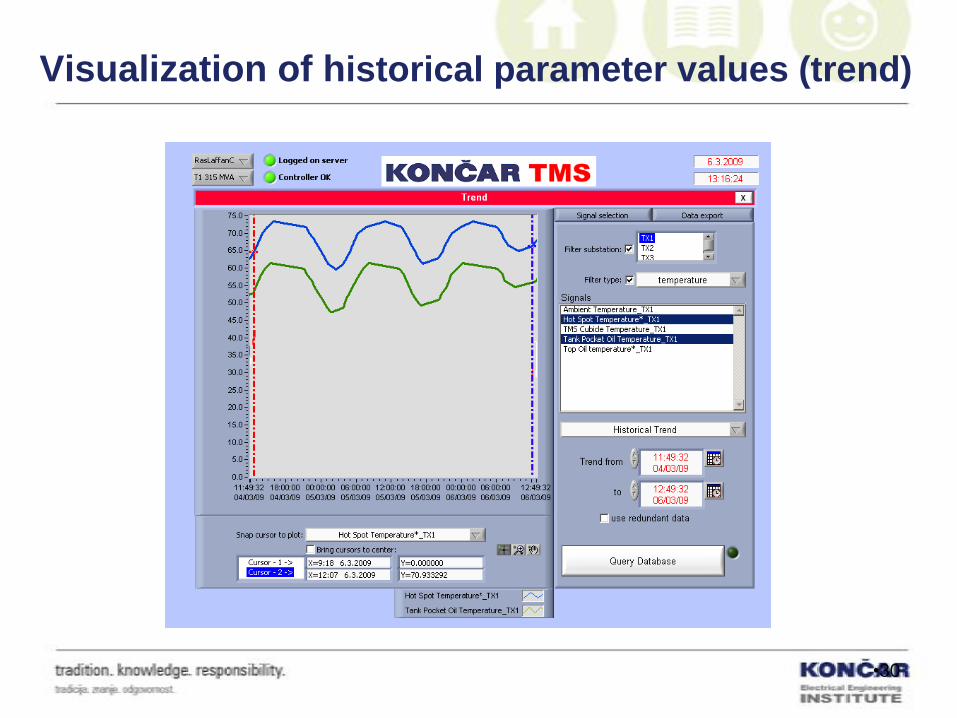
Visualization of historical parameter values (trend)
•30
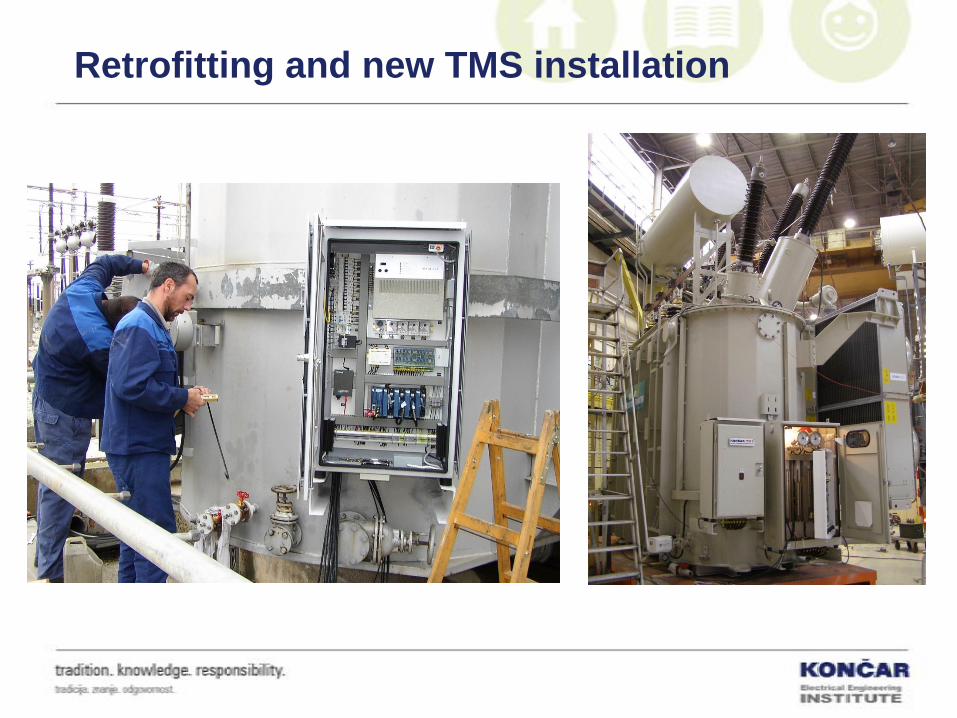
Retrofitting and new TMS installation
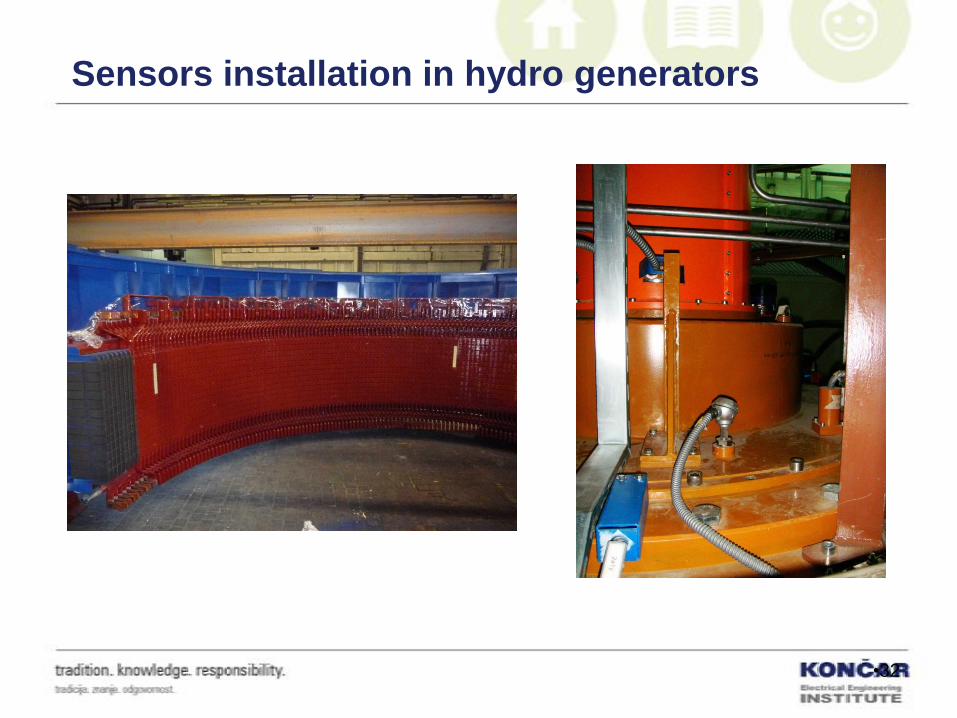
Sensors installation in hydro generators
•32
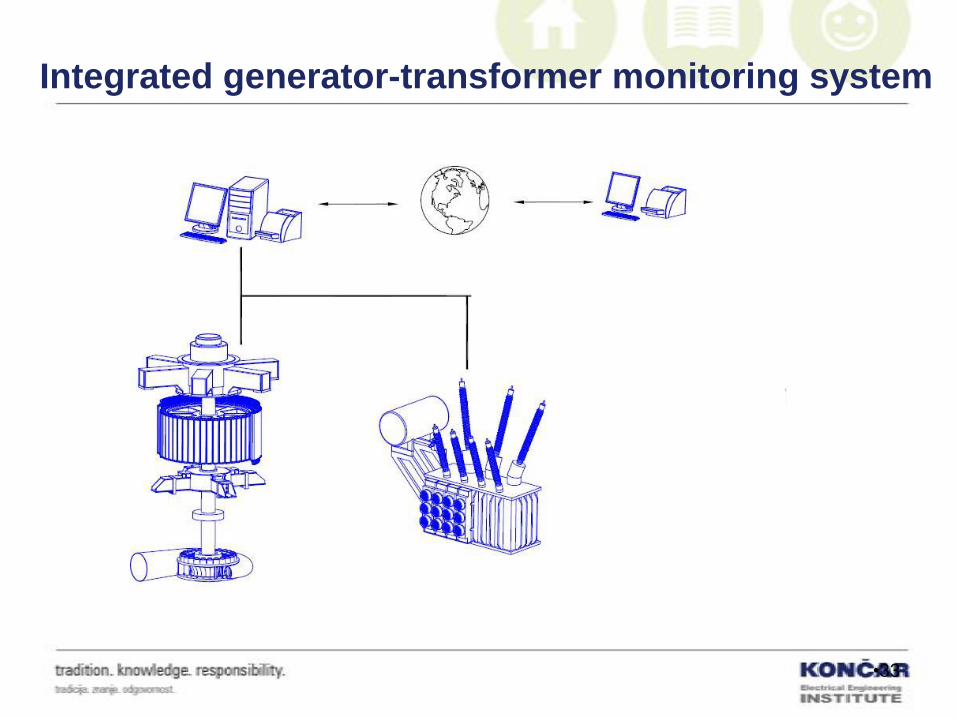
Integrated generator-transformer monitoring system
•33
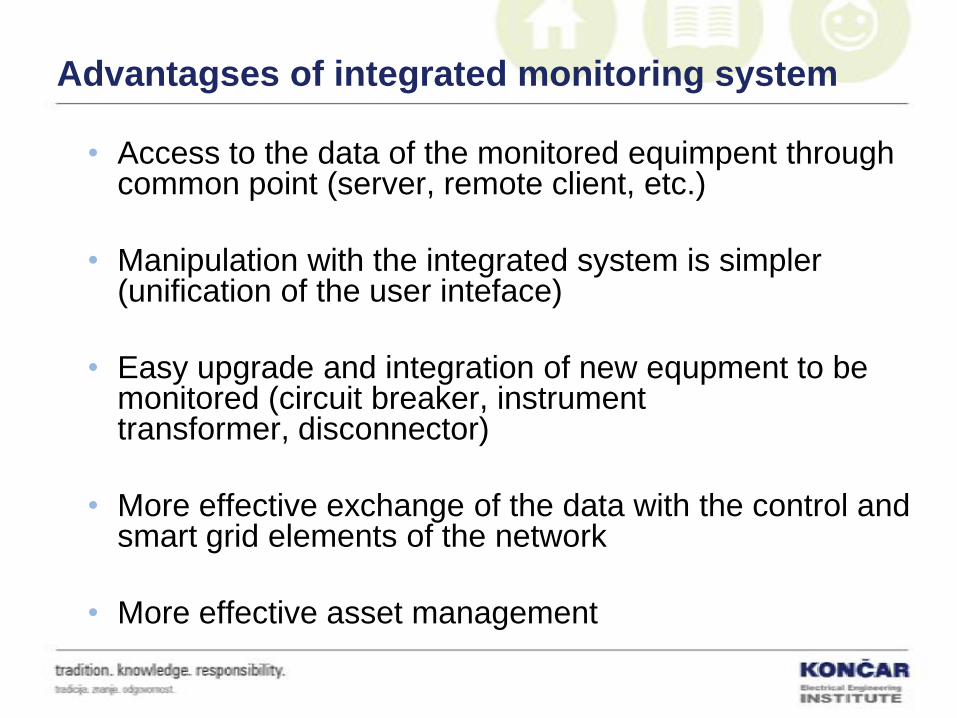
Advantagses of integrated monitoring system
• Access to the data of the monitored equimpent through common point (server, remote client, etc.)
• Manipulation with the integrated system is simpler (unification of the user inteface)
• Easy upgrade and integration of new equpment to be monitored (circuit breaker, instrument transformer, disconnector)
• More effective exchange of the data with the control and smart grid elements of the network
• More effective asset management
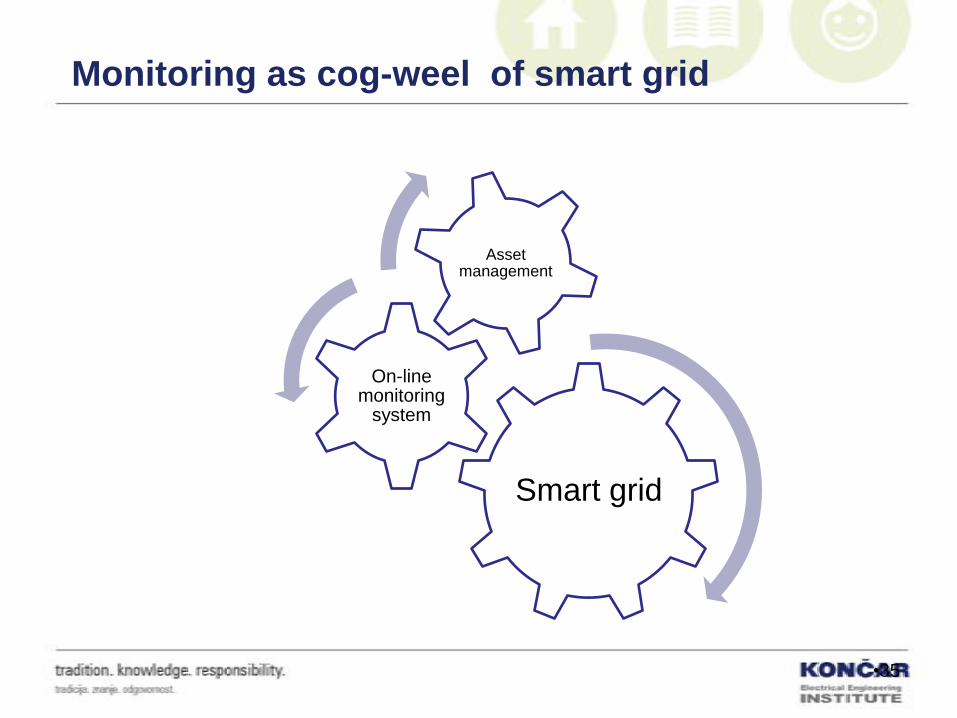
Monitoring as cog-weel of smart grid
Smart grid
On-line monitoring
system
Asset management
•35
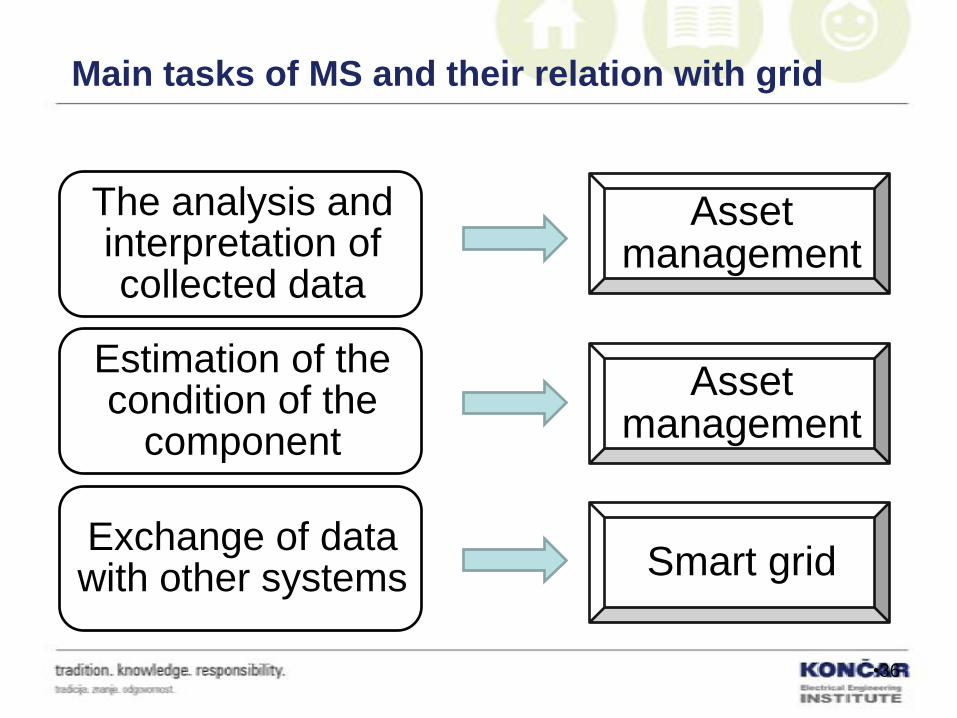
Main tasks of MS and their relation with grid
The analysis and interpretation of collected data
Asset management
Estimation of the condition of the
component
Asset management
Exchange of data with other systems Smart grid
•36

What does interpretation of data enable ?
•37
The analysis and interpretation of collected data
• Warning of faults, trends and possible failure
• Insight into operating conditions and actual state
• Improvement of grid reliability and security
• Improvement of personnel and environment safety
• Enhanced fault cause analysis
• Long-term data archival
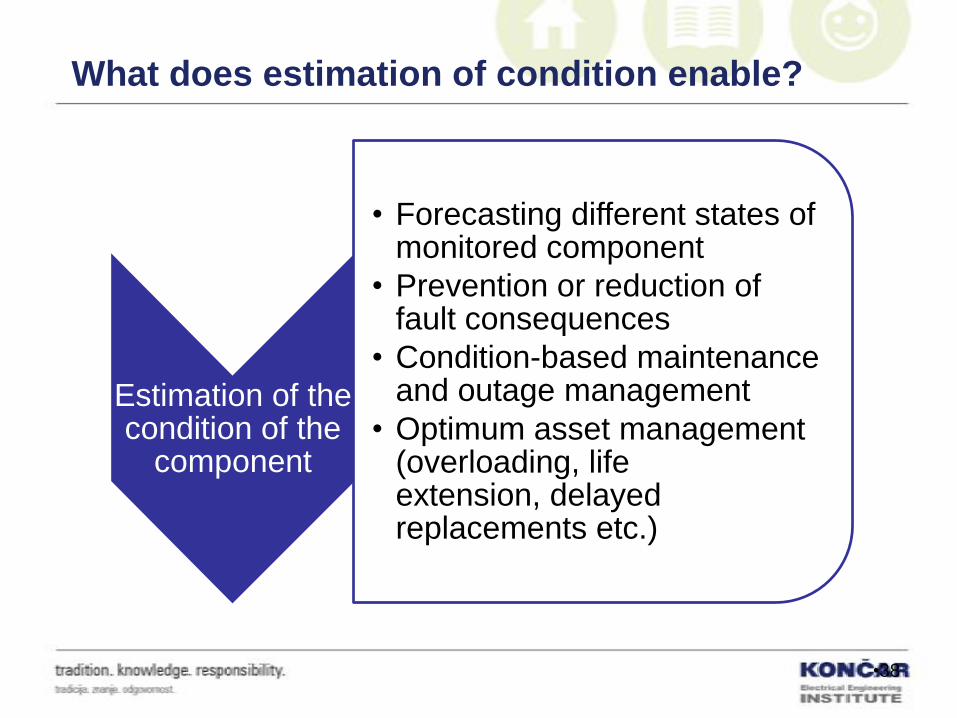
What does estimation of condition enable?
•38
Estimation of the condition of the
component
• Forecasting different states of monitored component
• Prevention or reduction of fault consequences
• Condition-based maintenance and outage management
• Optimum asset management (overloading, lifeextension, delayed replacements etc.)

What does exchange of data enable?
•39
Exchange of data with other
systems
• Improvements of the network control and load flows
• Determination and taking appropriate actions autonomously or through operators
• Faster than real-time action
• Computer-aided asset and workflow management
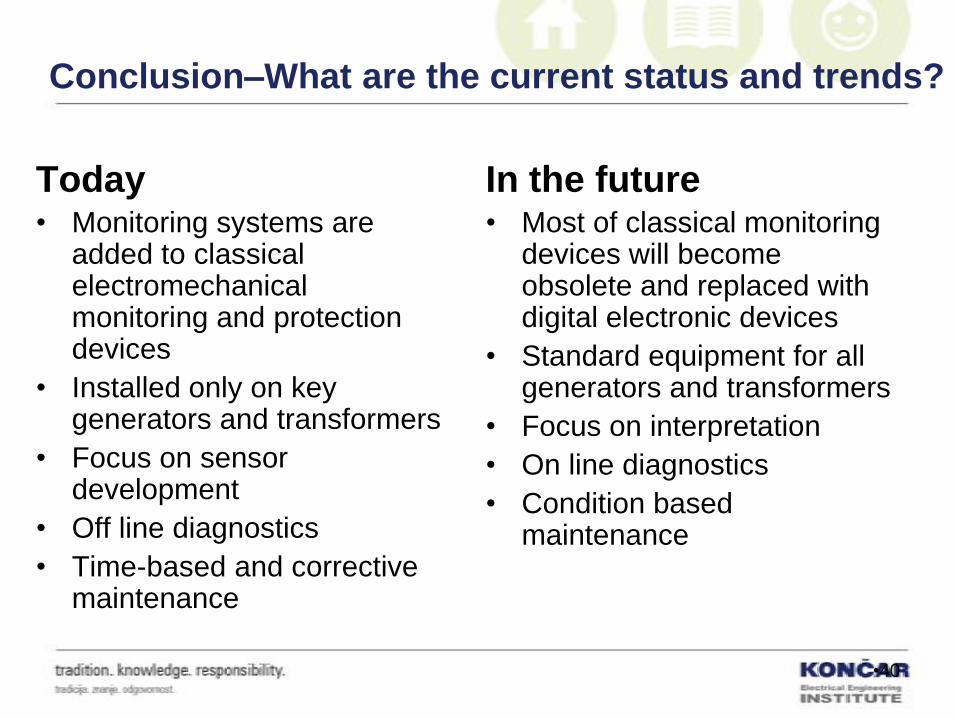
Conclusion–What are the current status and trends?
Today • Monitoring systems are
added to classical electromechanical monitoring and protection devices
• Installed only on key generators and transformers
• Focus on sensor development
• Off line diagnostics
• Time-based and corrective maintenance
In the future• Most of classical monitoring
devices will become obsolete and replaced with digital electronic devices
• Standard equipment for all generators and transformers
• Focus on interpretation
• On line diagnostics
• Condition based maintenance
•40