Embed Size (px)
Citation preview

FINAL TECHNICAL REPORT October 1, 2007, through May 31, 2009
Project Title: INTEGRATED, MULTI-CONTAMINANT REMOVAL PROCESS
FOR SYNGAS CLEANUP – PHASE 2 ICCI Project Number: 07-1/2.3A-1 Principal Investigator: Howard S. Meyer, Gas Technology Institute Other Investigators: Dr. Diana Matonis, Gas Technology Institute
Dr. Scott Lynn, University of California (Consultant) Project Manager: Dr. Francois Botha, ICCI
ABSTRACT The overall objective of this project is to undertake the development of an integrated multi-contaminant removal process in which hydrogen sulfide (H2S), carbonyl sulfide (COS), ammonia (NH3), chlorides and heavy metals, including mercury, arsenic, selenium and cadmium, present in the coal-derived syngas will be removed in a single process step. To accomplish this, a novel process called UCSRP-HP (University of California Sulfur Recovery Process-High-Pressure) directly converts H2S into elemental sulfur at 285 °F to 300 °F and at any given sour gas pressure. Other contaminates, such as NH3, hydrogen chloride (HCl) and trace heavy metals, are also removed in a separate section of the same reactor column. The process is tightly integrated and is expected to be significantly more economical in terms of both capital and operating costs because it replaces with one single unit the acid-gas removal, Claus, and SCOT units used in conventional sulfur management schemes, as well as removing trace contaminants that effect downstream equipment. During this research, data critical to developing and evaluating UCSRP-HP technology for multi-contaminant removal from syngas derived from Illinois #6 coal was obtained. Testing during this period indicated that 50% hydrogen selenide (H2Se) and 33% arsine (AsH3) removal was achieved during a 30 minute test. Ammonia and HCl solubility are dependent on the water content within the diethylene glycol (DEG) solvent. Experiments illustrated that when sulfur dioxide is added to the feed, both hydrogen sulfide and carbonyl sulfide are consumed. Ninety five percent of the carbonyl sulfide (from 490 to 35 ppm in a single stage reactor) was consumed and 99 percent of the hydrogen sulfide (from 10% to 70 ppm). Any COS that is not converted to H2S within the reaction zone of the process will be absorbed into the lean diethylene glycol methyl ether (DGM) at the top of the column and brought back to react with the SO2 and water. Further laboratory tests are required to determine the COS concentrations expected at the top of the reaction section of the column in order to size the DGM circulation rate. Experimentation has continued to indicate the advantages of the UCSRP-HP for making a significant impact on the purification of coal-derived syngas. Illinois coals will benefit by this low-cost sulfur management option.
EXECUTIVE SUMMARY Advanced gasification systems are planned to provide synthesis gas feed for advanced, combined cycle power plants; for separation systems for hydrogen production or for separating CO2 for sequestration purposes; or for chemical conversion plants. All of these advanced applications will require that any sulfur-containing species, as well as other contaminants, be reduced to parts-per-million (ppm) or in some cases parts-per-billion (ppb) levels. For acid-gas and trace contaminant removal, technologies that are either currently available or under development include: low-temperature or refrigerated solvent-based scrubbing systems using amines, such as MDEA, or physical solvents, such as Rectisol, Selexol, Sulfinol, low temperature sorbents, such as sulfur-impregnated carbon, or high temperature sorbents (not yet demonstrated at commercial scale). However, these gas-cleaning processes operate at temperatures that are either below or above the temperature of the downstream processing operations (for gas turbine fuel systems and catalytic synthesis processes), which are in the range of 300 to 700 °F. These temperature differences lead to lower energy efficiencies: the low-temperature clean-up processes require temperature reductions to below 100 °F and then reheating to downstream process requirements; the high-temperature sorbent systems operate at 1000 °F, leading to unnecessary gas stream corrosivity. The development of desulfurization systems that can be matched to the elevated temperature and pressure conditions of gasification processes (i.e., temperatures in the range of 300-700 oF and pressures in the range 400-1200 psig) and that can be integrated with the warm-gas cleanup of other contaminants (trace components and heavy metals) is, therefore, of critical importance for early commercialization of advanced gasification technologies being promoted by U.S. DOE in the FutureGen and Clean Coal Power Initiative programs. GTI is developing the UCSRP-HP (University of California Sulfur Recovery Process-High-Pressure) process, an integrated multi-contaminant removal process whereby coal-derived syngas is sent first to an absorbing column where chlorides and ammonia, as well as trace heavy metals (mercury, selenium, arsenic, and cadmium) are removed from the gas stream. The partially cleaned gas then passes to a reactor column at a temperature above the melting point (247 °F) and below the polymerization temperature (310 °F) of elemental sulfur and a gasification pressure of 400 psig (or any higher pressure). Hydrogen sulfide in the syngas, together with injected sulfur dioxide, dissolves in a solvent that is circulated co-currently or counter-currently in the column. The Claus reaction is carried out in the liquid phase. Sulfur is only sparingly soluble in the solvent and so forms a separate liquid phase. The solvent contains a homogeneous liquid catalyst (less than 1% by weight of the solution). The catalyst is a commonly available and inexpensive material that does not degrade nor dissolve in the sulfur. The water formed in the Claus reaction vaporizes and forms part of the syngas. One-third of the recovered sulfur product is burned with oxygen (if an oxygen-blown gasifier is involved this would be a fraction of the oxygen requirement for the process), and fed to the reactor column. The process is ideal for syngas desulfurization at 285 to 300 °F and at any given pressure (higher the better) and offers a tighter integration with the process for removal of trace

contaminants and heavy metals. It is expected to be significantly lower in capital and operating cost compared to conventionally applied amine or physical solvent-based acid-gas removal process followed by Claus/SCOT process plus systems to remove other contaminants. The current project is a laboratory program to obtain critical process data for the treatment of syngas derived from Illinois basin coals. The ultimate application of this process will favor high sulfur coals, such as Illinois #6, by reducing the cleanup costs and providing an environmentally benign facility to utilize economically these coals. The specific objectives of the project includes (i) laboratory work on the removal of heavy metals, ammonia and halogens, and carbonyl sulfide and the regeneration of the DEG; (ii) development of an Aspen-Plus based computer simulation model, and (iii) techno-economic evaluation of the process applied to syngas cleanup for a 500 MWe coal-based IGCC power plant. This projected was co-funded by the U.S. DOE through National Energy Technology Laboratory (NETL) under their funding opportunity announcement number DE-PS26-04NT42249. The funding received from ICCI was used to conduct work under each task using test conditions and gas compositions representative of Illinois # 6 coal. Task 1 is the experimental work of this project. Three major subtasks were completed during this period. The first two, heavy metals removal and ammonia/halogen removal, would take place in the scrub section of the UCSRP-HP process. The trace sulfur removal would take place in the reaction section of the process. During the last phase of this development program, GTI showed mercury was effectively removed from the raw synthesis gas. Selenium and arsenic were studied in this phase. Selenium was introduced into the simulated syngas as H2Se and the arsenic as AsH3. The syngas also contained H2S, ammonia, and the DEG solvent contained HCl. EPA Method 29 was used to analyze the inlet and outlet streams to determine the overall removal of selenium and arsenic during a 30-minute run. We achieved about 50% removal of the H2Se and 33% of the AsH3 during the test. Precipitated solids were collected and serve as an indication that filtration can be used to collect the removed metals. Ammonia and halogens (in the form of HCl) are very soluble to totally miscible in water. Depending on the water solubility in DEG, these compounds will quickly absorb. The measurement of their solubility was difficult with our existing apparatus. We have measured a lower bound and have initiated a new method to obtain a meaningful level. Previous testing has shown that COS can form within the UCSRP-HP process. During this period, further testing was conducted to determine means to mitigate the amount of COS that is in the product gas. Experiments illustrated that when sulfur dioxide is added to the feed, both hydrogen sulfide and carbonyl sulfide are consumed. Ninety five percent of the carbonyl sulfide (from 490 to 35 ppm in a single stage reactor) was consumed and 99 percent of the hydrogen sulfide (from 10% to 70 ppm). Any COS that is not converted to H2S and then elemental sulfur will be absorbed into the lean DGM at the top of the column.

To support the Task 2, computer simulation, Aspen Plus models have been completed for H2S and SO2 absorption in DGM, the sulfur furnace, and the absorption of ammonia, chloride, and H2Se in DEG. Some of the units that still need to be completed includes the high pressure flash vessel and the top of the reaction column where hydrogen sulfide and sulfur dioxide are absorbed into DGM to produce water and liquid sulfur and COS is stripped out of the vapor. A differential techno-economic analysis of Task 3 was performed. This identified the areas in the base case E-Gas Gasifier IGCC facility with Illinois #6 coal that are impacted by the UCSRP-HP process. Qualitatively, the UCSRP-HP continues to offers great potential as an integrated sulfur and trace component removal technology to lower significantly the cost of electricity or chemicals from coal-derived gasification processes. The UCSRP-HP process continues to be a viable technology that can significantly simplify the clean up of coal-derived syngas. Further laboratory development of the UCSRP-HP is recommended. That program should complete the work initiated here on heavy metal, ammonia, and halogen removal, COS control, and regeneration of the DEG solvent system used to remove these components. These results should be incorporated into the computer simulation model and the economic evaluation completed for an IGCC and a hydrogen production plant using Illinois #6 as the feed material. This work would be coordinated with the continuation of the DOE program.

1
OBJECTIVES The overall objective of this project is the development of an integrated multi-contaminant removal process in which H2S, NH3, HCl, and heavy metals including Hg, As, Se and Cd present in the coal-derived syngas will be removed to specified levels in a single process step. To accomplish this, we used the high pressure University of California Sulfur Recovery Process (here after referred to as UCSRP-HP) that directly converts H2S into elemental sulfur at 285 °F to 300 °F and at any given sour gas pressure. Other contaminates, such as NH3, HCl and other trace contaminants, are also removed in separate sections of the same reactor column. The specific objectives of the project include (i) experimental work on the removal of heavy metals, ammonia, chloride, and COS; (ii) development of an Aspen-Plus based computer simulation model; and (iii) techno-economic evaluation of the process applied to syngas cleanup for a 500 MWe coal-based IGCC power plant. This projected was co-funded by the U.S. DOE through National Energy Technology Laboratory (NETL) under their funding opportunity announcement number DE-PS26-04NT42249. The funding received from ICCI was used to conduct work under each task using test conditions and gas compositions representative of Illinois # 6 coal.
INTRODUCTION AND BACKGROUND This work relates to the ICCI’s program goal priority 2.3A: Advanced Methods of Syngas Cleanup. The number of coal gasification facilities in design is growing every year. Advanced gasification systems are planned to provide synthesis gas feed for advanced, combined cycle power plants; for separation systems for hydrogen production or for separating CO2 for sequestration purposes; or for chemical conversion plants. All of these advanced applications will require that any sulfur-containing species, as well as other contaminants, be reduced to parts-per-million (ppm) or in some cases parts-per-billion (ppb) levels. For acid-gas removal, technologies that are either currently available or under development include low-temperature or refrigerated solvent-based scrubbing systems using amines, such as MDEA, or physical solvents, such as Rectisol, Selexol, Sulfinol, or high temperature sorbents (not yet demonstrated at commercial scale). However, these gas-cleaning processes operate at temperatures that are either below or above the temperature of the downstream processing operations (for gas turbine fuel systems and catalytic synthesis processes), which are in the range of 300 to 700 °F. These temperature differences lead to lower energy efficiencies: the low-temperature clean-up processes require temperature reductions to below 100 °F and then reheating to downstream process requirements; the high-temperature sorbent systems operate at 1000 °F, leading to unnecessary gas stream corrosivity. In advanced gasification applications where a low-temperature absorption process, such as Rectisol or Selexol, is employed to scrub the gas and remove the sulfur compounds,
2
the sulfur-containing species such as H2S and COS are recovered as an acid gas, which then requires a sulfur-recovery process. The modified Claus process coupled with a tail gas treatment (TGT) process such as SCOT are typically used to recover elemental sulfur and produce a dischargeable plant tail gas. The development of desulfurization systems that can be matched to the elevated temperature and pressure conditions of gasification processes (i.e., temperatures in the range of 300-700 oF and pressures in the range 400-1200 psig) and that can be integrated with the warm-gas cleanup of other contaminants (trace components and heavy metals) is, therefore, of critical importance for early commercialization of advanced gasification technologies being promoted by U.S. DOE in the FutureGen and Clean Coal Power Initiative programs. Research at the University of California, Berkeley (UCB), coupled with experimental work at Gas Technology Institute (GTI), is leading to the development of an integrated multi-contaminant removal process whereby syngas is sent to a reactor column at a temperature above the melting point (247 oF) and below the polymerization temperature (310 oF) of elemental sulfur and a gasification pressure of 400 psig or higher. H2S in the syngas, together with injected SO2, dissolves in a solvent that is circulated in the column. The Claus reaction is carried out in the liquid phase. Sulfur is only sparingly soluble in the solvent and therefore forms a separate liquid phase. The solvent contains 3-Pyridinemethanol, a homogeneous liquid catalyst at less than 1% by weight of the solution. This catalyst is a commonly available and inexpensive material that does not degrade nor dissolve in the sulfur. The water formed in the Claus reaction vaporizes and forms part of the syngas. One-third of the sulfur product is burned with oxygen (if an oxygen-blown gasifier is involved this would be a fraction of the oxygen requirement for the process), and fed to the reactor column. Means are also provided to remove COS, HCl, NH3, and trace heavy metals. The treated gas leaving the reactor column will meet the strict specifications set for H2S and the other contaminants for turbines, fuel cells, and catalytic processes. The process is ideal for syngas desulfurization at 285 to 300 oF and at any given pressure (the higher the better) and offers a tighter integration with the process for removal of trace contaminants and heavy metals. It is expected to be significantly lower in capital and operating cost compared to conventionally applied amine or physical solvent-based acid-gas removal process followed by Claus/SCOT process. Testing done at GTI has shown negligible chemical consumption (including catalyst), unlike typical chemicals costs of $300 - $1000 per ton sulfur removed found in competing processes. There is much less need for stainless steels in the process, and no apparent cut-off point in terms of sulfur handling at which Claus/SCOT becomes more economical. This process differs from liquid redox processes in important ways. There is no need for filtering a solid sulfur paste with attendant handling problems and loss of solvent. The sulfur quality can be as good as Claus sulfur due to the low solubility of the solvent in the liquid sulfur, and to the large density difference and ease of liquid/liquid separation in the process. The process can operate at significantly higher temperatures than the liquid

3
redox or CrystaSulf processes, which is of value in IGCC applications. No foaming of the solution occurs since the solvent is non-aqueous and has no surfactant properties. No sticky or solid sulfur is present anywhere in the system so the problems of liquid redox plugging and pump wear would not be present. The UCSRP-HP process, in addition, employs the reaction between H2S and SO2 to sweeten a gas at high pressure in a reactor column under the following conditions: • the organic liquid solvent contains a homogeneous catalyst that promotes the
liquid-phase reaction 2 H2S + SO2 ⇒ 3 S + 2 H2O (1)
• the temperature in the reactor column is above the melting point of sulfur, and • the SO2 is fed in stoichiometric excess to the H2S. Although there is no minimum (or maximum) pressure at which the process can operate, the flow of solvent is reduced and reaction rates are increased at higher pressures. This permits the use of smaller equipment and lowers operating costs; hence the process will be most attractive for the treatment of H2S-containing gases at high pressure. Treatment of Synthesis Gas from Coal Gasification When coal is gasified, the syngas produced may contain not only H2S, but also NH3 and HCl and heavy metals, such as As, Cd, Hg, and Se. Before the syngas is used as fuel for a gas turbine or further processing to methane, liquid hydrocarbons, or hydrogen, all of the above should be reduced to very low values. A process flow diagram demonstrating one application of UCSRP to this problem is shown in Figure 1. a) Reactor: The countercurrent reactor column is divided into two sections: the scrub section and the reactor section. The sour gas feed enters scrub section, 2A, where it is contacted with a stream of diethylene glycol (DEG) or other glycol ether. At the pressure, temperature and water content of the syngas, the DEG will have a steady-state water content of about 10 to 20 wt%. It will also have substantially smaller, but significant, steady-state contents of NH3 and H2S. As a result, the HCl content of the feed gas will be absorbed very effectively to form highly soluble NH4Cl. A small but significant concentration of NH4HS will also be present in the liquid phase, and the heavy metals As, Cd and Hg will be absorbed to form their respective, very insoluble sulfides. Selenium will be present in the syngas as H2Se and will be absorbed to form highly soluble (NH4)2Se under these conditions. At the bottom of the scrub section, the DEG stream is withdrawn and circulated by pump back to the top. A small slipstream of the DEG stream may be withdrawn, perhaps intermittently, for filtration and other treatment to remove the accumulated impurities, and then returned. The gas stream leaving the scrub section passes into the reactor section through a chimney that effectively prevents the mixing of the solvent in the two sections. In the operation of the reactor column, 2B, a stream of glycol ether, such as diethylene glycol methyl ether (DGM) is circulated from the bottom of Stripper 1 to the top of the reactor section. The temperature of this stream may be increased or decreased by the

4
heater-cooler, depending on the heat balance in the reactor section. This lean solvent stream, depleted of COS, SO2 and NH3, effectively absorbs those components from the gas stream flowing upward in the reactor section. NH3 passes through the reactor section without being oxidized but is absorbed as an ammonium salt through its reaction with SO2. The solvent has a water content that is essentially in equilibrium with the syngas. A stream of liquid SO2 is injected into the reactor section at one or more points below the entry of the solvent stream, and is mixed with the solvent flow within the column. The quantity of SO2 fed into the column exceeds that required to react with the H2S and COS in the feed stream by an amount between 0.5 and 1 mole per mole of NH3 in the feed stream. The solvent catalyzes the reaction between H2S and SO2. The water formed by the reaction remains in the vapor phase. The sulfur forms a second liquid phase. The two liquids flow from the bottom of the reactor section to a liquid/liquid separator. The solvent stream then flows to Stripper 1, STR1, by way of HX2. The liquid sulfur stream flows to the furnace. b) NH3 and SO2 Removal: The gas stream leaving the reactor section of the reactor column has passed through a section in which the gas has been contacted with a solvent stream that is depleted in NH3 and SO2, but has a water content that is in near equilibrium with the gas. Depending on the water content of the solvent, NH3 and SO2 will be absorbed as the separate compounds, as the ion pair or as ammonium sulfite and/or bisulfate. The treated gas leaving the process has a temperature, water, and CO2 content that are little changed from those of the feed stream but is substantially free of H2S, NH3, HCl, SO2 and heavy metals. The solvent stream that exits the reactor section of the reactor column exchanges heat with the bottoms stream as it flows to Stripper 1, which operates at near-ambient pressure. The overhead vapor from Stripper 1 is condensed to form a solution of ammonium sulfite and bisulfate. The water stream entering the condenser is provided to insure that no solid salts are formed. As was noted above, the flow of SO2 to the reactor column is regulated so that the molar ratio of SO2 to NH3 stripped out of the fat solvent stream fed to Stripper 1 is between 0.5 and 1. Both can therefore be absorbed in the water stream (plus the water from the condensed overhead vapor) and pumped as a solution to the furnace to moderate the combustion temperature, destroying the NH3 and recovering the SO2.
c) SO2 Generation: The stream of liquid sulfur leaving the reactor column flows directly to the furnace, where, when time-averaged, exactly one-third of it is burned with a stream of oxygen to form the SO2 required for the process. The high pressure in the reactor column, about 10 bar absolute, makes it advantageous to use oxygen for the combustion, so that the SO2 formed may readily be condensed and pumped as a liquid to reactor pressure. The aqueous solution from Stripper 1 is used to moderate the temperature of combustion in the furnace. The high temperature that would result when one-third of the sulfur combusted reacts with oxygen could damage the materials in the furnace if such moderation were not provided. The NH3 content of the aqueous stream is converted to N2 and H2O as it passes through the furnace. The presence of S2 vapor prevents any NOx formation. The combustion gas raises steam in the boiler and then passes through the condenser, where liquid sulfur is collected. The wet SO2 gas then flows to a cooler, where liquid water, saturated with dissolved SO2, is condensed. The

5
SO2 stream leaving the cooler is converted to liquid in another condenser, and then pressurized to the pressure of the reactor column by a pump as shown. This pump must also be able to handle the small amounts of N2 and CO2 that will be present. d) CO2 Capture: An option for non-IGCC facilities would be to capture the CO2 for sequestration. Here, the gas stream leaving the reactor column is cooled to near-ambient temperature in the heat exchanger(s) before entering a dryer column, where it is contacted with a part of the physical solvent stream, such as Morphysorb or Selexol, from a CO2 column. The solvent absorbs H2O together with some CO2 and syngas components. The dissolved CO2 tends to desorb from the solvent as H2O is absorbed, which reduces the temperature rise that might otherwise occur. The reboiler at the bottom of column heats the solvent sufficiently to strip out a large fraction of the CO2, and syngas dissolved in it while retaining substantially all of the H2O. The solvent stream then flows to the H2O stripper. The gas stream leaving the dryer column flows to the CO2 column and is contacted with freshly stripped, cooled solvent. A major fraction of the CO2 in the natural gas stream is absorbed. The reboiler at the bottom of the CO2 column heats the rich solvent sufficiently to strip out a large fraction of the syngas while retaining substantially all of the CO2. The reboiler serves also to cool the stream leaving the solvent strippers. The product gas leaving the CO2 column will have a CO2 content of 1 vol % or less and will be dried to a dew point of 0 oC or to meet process specifications. The CO2-rich solvent then flows to the CO2 stripper, which operates near ambient pressure and removes most of the CO2 from the solvent. The solvent contains about 1 wt% water, so that most of the stripping vapor in the reboiler of the CO2 stripper is H2O and the temperature is low enough to prevent thermal degradation of the solvent. No water is removed from the system in the CO2 stripper; the water vapor condensed at the top is returned as a reflux that prevents loss of solvent vapor. The captured CO2 can then be compressed for transfer to a sequestration facility. e) Syngas Temperature Recovery: To maximize thermal efficiency, it is preferable to minimize the temperature drop during sulfur removal. This process is preferably operated above the melting point (247 °F) and below the polymerization temperature (310 °F) of elemental sulfur. Therefore, if the temperature of the sour syngas feed to the reactor is above this range, stream 1 will be passed through a gas-gas heat exchanger, HX1. The feed gas temperature will be reduced to about 280 to 300 °F by exchange with the treated syngas stream 5. This way we expect that almost all heat will be recovered and the maximum temperature differential between sour feed gas and treated sweet gas will be around 30 to 40 °F. This technology offers great advantages for Illinois basin coals. The ability to reduce the cost for sulfur and other coal impurities will lead to a greater usage of the high sulfur Illinois coals that are not currently competitive for power generation.

6
DGM-L
FEED
BFW
STEAM
WATER
DGM-R
LIQ-S1
OXYGEN
NH4HSO3
LIQ-S2
GAS-SO2
SO2-GAS
SO2-LIQ
DEG
GAS-OUT
HT-COOL
HX1-H
BOILER
STR-1
LL-SEP
FURNACE CNDNSR-1
HX2
CNDNSR-3
PUMP-5
PUMP-4
PUMP-1
PUMP-3
CNDNSR-2
HX1-C
High-PressureSour Gas
Sulfur Product
Sweet Wet Gas
Application of UCSRP to Removal ofMetals + NH3 + HCl + H2S + COS
from High-Pressure Syngas(gasified coal)S. Lynn 9/2/04
UCSRP-HP4
2B
To DEG Clean-up
From DEGClean-up
2A
ReactorColumn
Figure 1 UCSRP-HP Block Diagram

7
EXPERIMENTAL PROCEDURES The overall approach for this project is the use of simulated coal-derived syngas for laboratory testing of the UCSRP-HP process, augmented by computer simulations. These gas mixtures were fairly complex, consisting of a number of components down to the parts per million (ppm) level. This was deemed to be a reasonable compromise between simple gas mixtures without the major syngas components, such as H2S and SO2 in N2, and a gas from an operating gasifier for the scale of development. Heavy Metal Removal Figure 3 shows the schematic and Figure 2 shows a photograph of apparatus that was used to conduct the investigation of heavy metals removal from coal-derived syngas. The apparatus consists of the following main components: • three rotameter (3) (6) (9) systems to blend an inlet gas from three gas cylinders; • a 3000 ml Pyrex glass reactor vessel (21) fitted with a variable speed stirrer and a
drain valve for liquid sample acquisitions; • a heating jacket around the glass reactor to heat the DEG solvent to 135 °C (not
shown); • a Water Knock-Out (12), Caustic Trap (19), and Drierite Trap (16); • a rotameter (17) to measure the outlet gas rate; • two 3-way valves (10) (14) to divert either inlet or outlet gases for sampling; • 3-way valve (18) to divert inlet for bubble meter flow rate verification (bubble meter
is temporary device); • two gas sample trains (11) (13) consisting of two wash bottles in a water bath. The arsine, hydrogen selenide, and ammonia gas cylinders were installed in a safety chamber that vents into the safety hood. A face mask with a regulator specific for NH3 and HCl, and personal protection monitors were obtained for use .The inlet gas flow rates were calculated for a desired composition in the feed gas and, once verified by bubble meter measurements, were maintained during experimentation by the rotameters, designated as (3), (6) and (9) in the Figure 3. The exit gas stream passed through a wash bottle containing sodium hydroxide (caustic - NaOH) for excess H2S removal after the trace metals were collected in inlet or outlet sample trains. The hydrogen-sulfide-free outlet gas flow rate was measured by a rotameter (17). The trace metal, As and Se, components in the inlet and outlet streams were first captured by the sample trains (11) or (13) in Figure 3 using EPA Method 291
1 U.S. Environmental Protection Agency, Method 29 - Metals Emissions from Stationary Sources, http://www.epa.gov/ttn/emc/promgate/m-29.pdf
for loading and timing of sampling, approximately 15 minutes of collection for the inlet samples and 30 minutes for the outlet samples. The remaining exit gas stream was passed through a wash bottle containing sodium hydroxide (NaOH) for excess H2S removal. The method is designed to specifically absorb each of the metals in an aqueous acidic solution of hydrogen peroxide for analysis of all metals. These samples were then sent to the GTI

8
Analytical Lab for elemental analysis for As and Se by inductively coupled argon plasma emission spectroscopy (ICAP). Samples were also taken of the reactor solvent (2146 g of solvent) and of various solids that were found in the system.
Figure 2 Trace Component Removal with Ammonia, Chloride, and Selenium
Figure 3 Trace Metal Experimental Schematic
Ammonia and Halogen Removal Aqueous solutions of weak electrolyte gases (like ammonia) and strong electrolytes (hydrogen chloride) have to be treated in many processes (e.g., in coal gasification). Reliable models for the thermodynamic properties of such complex, chemical reacting mixtures are required to design and optimize those processes. In particular, the basic design of the absorption equipment requires experimental information on the equilibrium
21
9
properties (basically vapor–liquid equilibrium data). The equilibrium speciation of the liquid mixtures must be known reliably in order to describe not only the equilibrium properties, but also the kinetic processes, as the driving force for any kinetic process results from the deviation from equilibrium. The experimentation plans focused on ammonia and halogen removal from the syngas in the bottom section of the column by examining the solubility of NH3 and HCl in diethylene glycol (DEG) solvent. Gas solubility can be measured experimentally using several instruments working based on pressure–volume–temperature–composition (p, V, T, x) determinations. The available techniques were reviewed, taking into account different characteristics of the solvents studied (vapor pressure, viscosity, surface tension, etc.) and the levels of precision and accuracy on the gas solubility. We studied three potential experimental techniques, namely an extraction technique, isobaric saturation, and isochoric saturation methods and selected the isochoric saturation method as the most viable technique for the NH3-HCl-H2O-DEG system. The isochoric saturation method has been used to measure gas solubility in a number of systems, requiring even smaller volumes of solvent when compared to the isobaric method and having no mobile parts2
. In this case, known amounts of dry gas, determined by a (p, V, T) measurement, and liquid solvent, determined gravimetrically, are put in contact at constant temperature. The equilibrium pressure is in direct relation with the gas solubility, provided the saturation properties of the pure solvent are known. The temperature can very easily be changed, and a new state point is obtained when a constant pressure value is attained (indicating that thermodynamic equilibrium at the new temperature is reached). Equilibration times are longer than in the isobaric method, especially with volatile solvents, for an uncertainty that is similarly below 1%. This technique can be easily extended to the study of mixtures of solvents. In this case, the vapor pressure of the mixture needs to be determined before the gas is put in contact with the liquids and the gas/liquid equilibrium has been attained.
The solubility testing will be performed in GTI’s high-pressure vapor-liquid equilibrium (VLE) unit. The experimental arrangement has been used previously with success at GTI. The experimental set-up for mass transfer and kinetic measurements was build around a stirred cell reactor, see Figure 4 and Figure 5. The equilibrium cell is made of nonmagnetic stainless steel 9-1/8 in. in length and 3 in. inside diameter. Liquid is drawn into the test cell by vacuum. The gas feed system allows the use of up to three gas sources/cylinders at a time to pre-blend gas mixtures. The gases are first mixed by means of partial pressure utilizing a high-precision pressure gauge and then added to the test cell by means of the system pressure. The equilibrium vessel has a nominal volume of one liter and is rated for operation at up to 5,000 psig. This vessel is contained in an environmental chamber, so that temperatures can be controlled between -85 °F to 350 °F. The vapor-liquid system is mixed thoroughly by a magnetically-driven agitator that is 2 R. P. Bonifacio, M. F. Costa Gomes, E. J. M. Filipe. Fluid Phase Equilib. 193, 41 (2002).

10
supplied with a hollow shaft for gas circulation and is extended so that the agitator drive can be located outside the environmental chamber.
This arrangement allowed the Vapor-Liquid Equilibrium Unit to be run in the batch phase for both the liquid and gas phase only with no sampling. This is adequate for furnishing vapor-liquid equilibrium information from P-V-T measurements; with no need for sampling or analysis of either phase when the assumption that the vapor contains essentially none of the nonvolatile components is valid or the vapor consists of a pure gas. However, when dealing with a more volatile liquid phase or when more complex static equilibrium studies are necessary, such as reaction kinetics, not only must gas and liquid sampling be performed, but the consideration of a continuous running phase must be included. Two gas chromatographs, with a range of detector options, analyze the vapor and liquid samples in those cases.
Figure 5 Schematic of GTI Vapor-Liquid Equilibrium Cell
A Hewlett-Packard PLC‐based control system is used to assure reliable operation of the chamber, cell and the logging of the data. The data are logged regularly from this control
Figure 4 High-Pressure Vapor Equilibrium Cell

11
system onto a dedicated computer for permanent storage. The system also provides the operator flexibility for displaying system parameters, total vessel pressure and temperature, trends during and after the experiments. The unit has an ambient gas monitor for H2S, CO, and SO2 and alarms to notify operators of levels above OSHA PEL-TWA. All process and pressure reliefs are sent to a scrubber containing a caustic solution prior to entering the building vent system. A block diagram, Figure 6, describes the general procedure of the technique used for gas solubility experiments in this type of V-L-E equipment. The uncertainty in solubility, expressed as Henry’s law constant, has been found to be lower than 5 % for several aqueous solutions previously reported for CO2 in water.
Figure 6 Block diagram of the Experimental Determination of Gas Solubility at
Set Pressure A safety procedure that includes PPE usage and alarms was written and distributed to personnel working with these toxic gases. The preliminary experimental plan is shown in Table 1. Trace Sulfur Removal The fate of COS in the process is a critical issue for the success of the process. The mechanism for COS either forming or being consumed under our operating conditions is being studied. The test system is shown schematically in Figure 7 and as a photograph in Figure 8.

12
Table 1 Experimental Plan for NH3 and HCl Solubility
Test Solvent
Solvent volume, ml Test gas
Temp, °C
N2 partial
pressure, psia
Gas partial pressure, psia
1 Water 270 NH3 27 100 73.5 2 DEG 270 NH3 27 100 73.5 3 DEG 270 NH3 40 100 73.5 4 DEG 270 NH3 60 100 73.5 5 DEG 270 HCl 22 100 10.0 6 DEG 270 HCl 40 100 10.0 7 DEG 270 HCl 60 100 10.0
8 DEG + 5% H2O 270 HCl 22 100 10.0
9 DEG + 5% H2O 270 HCl 40 100 10.0
10 DEG + 5% H2O 270 HCl 60 100 10.0
The apparatus consisted of a 4 L steel reaction vessel equipped with a variable speed stirrer. The vessel was also equipped with a bottom drain valve that was used to remove periodically sulfur produced during a side reaction. The reaction vessel was designed to be operated from 120-160°C at pressures up to 500 psia. The exit gas stream passed through the gas-washing bottle to condense water produced in the reaction and then to a second gas-washing bottle filled with 50% sodium hydroxide (NaOH) solution to consume all the untreated H2S before it is sent to vent. H2S and SO2 leak detectors were placed near the setup to detect any leaks. The flow rates of H2S and SO2 were controlled by using two Brooks Mass Flow Controllers (MFC) and a back pressure regulator was used to maintain a constant reactor pressure of 400 psia. The outlet flow was measured with a bubble flow meter. The gas streams were analyzed using a Varian CP-4900 Micro Gas Chromatograph. It is equipped with a Thermal Conductivity Detector (TCD) and calibrated with known gas standards. To minimize noise and small baseline changes that could be interpreted as real peaks, a minimum peak area threshold value is selected to reject all peaks that are below the threshold. A mathematical formula is then established to determine the concentration of the components of interest. The entire peak area scan is maintained so that the total peak areas can be examined if required. The threshold concentration for these experiments is approximately 7-10 ppmv. Based on our previous experience with the detector at low ppm levels, the standard deviation in the peak area results is quite high and the precision is not good. Table 2 shows the minimum detection limit for the GC without using special methods and procedures.

13
Figure 7 COS Experimental Set up
Figure 8 COS Test Equipment

14
Table 2 GC Minimum Detection Limits The outlet flow is measured with a bubble flow meter, but the flow rate is measured before the knock-out pot rather than after the knock-out pot as shown in the diagram. The following chemical reactions are still believed to be the major contributors to the formation and consumption of COS:
H2S + CO2 COS + H2O (2) H2S + CO COS + H2 (3) S + CO COS (4) COS + ½ SO2 CO2 + 1½ S (5)
Reaction (2) has an equilibrium constant in the reverse direction of Kp = 579 at 500 °F (260 °C). The reverse reaction becomes less favorable at higher temperatures with Kp = 304 at 600 °F. This may indicate that no COS is likely to form by way of Reaction (2) at 300 °F and below, and possibly the reverse reaction dominates. Reaction (3) is analogous to the Water Gas Shift reaction for making H2 from CO and H2O, with H2S replacing the H2O in that reaction. The WGS reaction requires catalysis below about 600 °F, and becomes highly favorable at 300 °F, where Kp is 783. Reaction (3), in contrast, has a Kp = 9.68 in the reverse direction at 600 °F and Kp = 7.96 in the reverse direction at 500 °F. It becomes slightly less unfavorable at lower temperatures. If these kinetics are found to be slow, and if the partial pressure of H2S is also low, COS should not be found under our experimental conditions. Reaction (4) has a log Kp of 7.79 in the forward direction at 300 °F, so it is highly favorable. Factors that may mitigate this COS forming reaction are the very low partial pressure of S in the gas phase and the low solubility of CO in the liquid phase. In addition, if the rate of Reaction (2) is much faster than the reverse Reaction (4), any COS formed could be consumed. Earlier investigations of the reaction with H2S and SO2 performed in this equipment showed the possibility of COS production through these side reactions. The blend gas composition, hereinafter referred to as “the blend gas”, is presented in Table 3. SO2 is introduced to the reactor from a cylinder with nitrogen as the carrier gas. The reaction of the gases then takes place in a calorimetric-type 4 L reactor. The solution is heated to the
Component mol% ppm H2S 1.55E-03 15.5 COS 1.13E-03 11.3 N2 8.20E-04 8.20 H2 9.89E-05 0.99 SO2 1.28E-03 12.8 CO 7.88E-04 7.88 CO2 1.25E-03 12.5

15
required operating temperature of 275 °F and pressurized to 400 psig before the gases were introduced into the reactor. The inlet and outlet liquid flow rates are measured by a bubble meter and the temperature is controlled with an electric heater. The blend gas and 1% to 5% sulfur dioxide in nitrogen are fed to the reactor in flow rates controlled by Brooks mass flow controllers. Gas rates varied between 0.25 and 1.3 slpm and are bubbled into the reactor into solvent at the operating temperature.
Table 3 Experimental Gas Composition Used in March 2008 Experiments
Component Target Volume Percent3 Measured Volume Percent (used by GTI)
Blend Gas CO 40 41.6 H2 30 30 CO2 16 10.8 COS 0.01 0 H2O 10 0 N2 3.49 16.82 H2S 5000 ppmv 7764 ppmv
SO2 Gas SO2 3 3.01 N2 97 96.99
RESULTS AND DISCUSSION
Task 1 – Laboratory Experiments Task 1 is the main focus of the proposed project and is divided into four subtasks. The testing will be done using a simulated syngas representative of Illinois #6 coal. Subtask 1.1 – Heavy Metal Removal Heavy metals that can be in the syngas stream include selenium, mercury, cadmium, and arsenic. Selenium is expected to be in the form of H2Se while mercury is expected in the metallic form. The Phase-1 testing showed the increased solubility of H2Se in DEG with the presence of ammonia chloride. We also showed mercury removal down to 0.2 ppb levels through a reaction with sulfur. In this subtask, GTI will investigate means to increase the heavy metal solubility and/or reactivity at 275-300 °F and pressures from atmospheric to 400 psi. Means to regenerate the loaded solvent will also be investigated. The results from the chemical analyses are presented in Table 4. The molar flows for each element were calculated by two methods. The feed flow rates (ml/min) and the gas cylinder content (volume %) were used to calculate the Inlet Flow 3 D. Bauersfeld, I. Rochner, Prof. B. Meyer, “Dry desulfurization of coal gas by partial oxidation of H2S”, Paper presented at the 23rd Annual International Pittsburgh Coal Conference, Pittsburgh, Pa, September 25-29, 2006.

16
molar rate. The analytical results in Table 5 were used to calculate the “Analytical Results” molar rates presented in Table 4. This was performed by adding the mass of each metal in the two sets of wash bottles, converting the mass to moles and dividing by the sampling time. The last column on Table 4 shows a 97% correspondence between the two methods for H2Se, but only 40% for AsH3. In addition, Table 4 shows that we achieved about 50% removal of the H2Se and 33% of the AsH3 during the 30 minute test. DEG was identified as a likely solvent for the scrub section. The major reason for using DEG as the scrubbing liquid instead of plain water is to minimize the water vapor in the gas leaving that section and the NH4Cl in plain water would be much more corrosive than it would be in DEG containing only 5 wt% or so water. DEG is not necessarily the best glycol ether to use for this service. One that is more hydrophobic and lower in volatility might be better - some experimentation will be required after the solubility of ammonia and chloride in DEG/water mixtures is determined. Several alternative glycol ethers are shown in Table 6.
Task 1.2 – Ammonia and Halogen Removal The purpose of this subtask is to understand the effect of water content and ammonia solubility on formation of NH4Cl as assumed for the removal of chlorides. The ammonia solubility may also affect the solubility of the heavy metals in the removal solvent system. At least two other glycol ethers will also be tested to determine the impact of the solvent on absorption and reactivity. The preliminary experimental results for the NH3 – HCl – H2O – DEG system as per the testing plan shown in Table 1, are given in Table 7. Although the results obtained were consistent in a qualitative manner, the error was large for the equilibrium distribution ratios. The numerical values for the gas solubilities are very low with the distribution parameter being an order of magnitude higher than literature values as shown in Table 10. The literature data for NH3-Air-Water system was for 1 atm pressure. However, the effect of pressure on the distribution ratio (or equivalently Henry’s Law constant) is weak. The effect of pressure on gas solubility is given by the Krischevsky-Kasarnovsky equation.4 For ammonia, the partial molar volume in dilute aqueous solution is
at 30 oC. Initial and final total pressures for the runs were 173.5 psia (11.8 atm) and 129.5 psia (8.8 atm). Using these numbers and the following equation, the pressure effect can be neglected. The weak dependence can be attributed to the linear dependence of pressure on the logarithm of Henry’s Law constant at any given temperature.
4 Prausnitz, et al., Molecular Thermodynamics of Fluid-Phase Equilibria, 3rd ed., Prentice-Hall, New Jersey, 1999

17
Table 4 Trace Component Flows and Removal
Element
Gas Inlet # in Fig.
Gas Cylinder Content
Feed Flow
Rates, ml/min
Flow Rate Analytical Results Percent Removal
Compare Inlet Flow vs. Analytical, (mol/min)/(mol/min)
Inlet, mol/min
Inlet, mol/min
Outlet, mol/min
Based on Analytical
Results
Based on
Flow Rates
Se Gas
2 15%H2Se/ N2 196.5 9.4E-04 9.1E-04 4.8E-04 47% 49% 97%
As Gas
3 1%AsH3/N2 318.4 1.0E-04 4.1E-05 2.7E-05 34% 73% 41%
Table 5 Analytical Results as per EPA Method 29
Sample Description
Inlet wash bottle #1, mg
Inlet wash bottle #2, mg
Outlet wash
bottle #3, mg
Outlet wash
bottle #4, mg
Reactor Solvent, μg/g
Inlet wash bottle #1, red
particulates, wt %
Outlet wash bottle #3, red
particulates, wt %
Arsenic, mg 46 3 61 4 20 0.2 0.04
Selenium, mg 1106 0.4 1592 0.3 290 3.7 1.8
Total wt. of solids in Sample Solution, g 2250 0.027 0.154

18
Table 6 Potential Glycol Ethers for Scrub Section
Glycol Ethers
Empirical Formula Mol. Wt.
Boiling point
Molar volume
Density (20 oC)
Viscosity (20 oC)
Vapor Pressure (25 oC)
CAS-Reg. No.
(REF: Knovel Solvents - A Properties Database, Wypych, G., ChemTec
Publishing, 2008 ) (g/mol) (oC) (cm3/mol) (g/cm3) (cP or mPa s) (Pa)
Diethylene glycol C4H10O3 106.14 245 94.9 1.120 38.5 1 111-46-6 Dipropylene glycol (a) C6H14O3 134.18 224 130.9 1.025 107 4.25
25265-71-8
Dipropylene glycol (isomer) (a) C6H14O3 134.18 225.7 142 1.023 1.6 110-98-5 H (of -OH) substituted by ALKYL GROUP at one end of diethylene glycol Diethylene glycol monomethyl ether C5H12O3 120.17 193 118
1.017 (@ 25
oC) 3.48 (@ 25 oC) 24 111-77-3
Diethylene glycol monoethyl ether (isomer) (a) C6H14O3 134.2 202 130.9
0.984 (@ 25
oC) 3.85 (@ 25 oC) 17 111-90-0
Diethylene glycol monobutyl ether (isomer) (b) C8H18O3 162.26 225.5 170.6 0.953 5.83 3 112-34-5 Diethylene glycol isobutyl ether (isomer) (b) C8H18O3 162.26 217 0.950
18912-80-6
Diethylene glycol n-hexyl ether C10H22O3 190.28 259 204.3 0.936
1.3 (@ 20 oC) 112-59-4
H (of -OH) substituted by ALKYL GROUP at both ends of diethylene glycol Diethylene glycol dimethyl ether (isomer) (a) C6H14O3 134.2 162
0.938 (@ 25
oC) 0.989 (@
25 oC) 394 111-96-6 Diethylene glycol diethyl ether (isomer) (b) C8H18O3 162.26 188.9 179.8 0.906 1.40
50 (@ 20 oC) 112-36-7

19
Diethylene glycol dibutyl ether
C12H26O3 218.38 256 248.1 0.890 2.39 1.33 (@ 20 oC)
112-73-2
Related Esters Diethylene glycol monomethyl ether acetate C7H14O4 162.21 209.1 1.040
16 (@ 20 oC) 629-38-9
Diethylene glycol monoethyl ether acetate C8H16O4 176.24 217.4 175.5 1.009 2.80
1 (@ 20 oC) 112-15-2
Diethylene glycol monobutyl ether acetate C10H20O4 204.3 245 208.2 0.980
3.02 (@ 25 oC)
5.3 (@ 20 oC) 124-17-4
Table 7 Experimental and Literature Equilibrium Distribution Ratios for
Ammonia-Gas-Water System
System NH3-N2-Water NH3-Air-Water a NH3-Air-Water b
T, oC 26.7 20 26.7 30 20 30 Equilibrium
Ratio, yNH3/xNH3
129.0
0.69 0.97 1.15 0.77 1.14
a – Wnek W.J and Snow R.H., Design of Cross-flow Cooling Towers and Ammonia Stripping Towers, Ind. Eng. Chem. Process Des. Dev., vol.11 (3), p. 343-349, 1972. b – Huang Ju-Chang and Shang C. Air Stripping (Chapter 2), Handbook of Environmental Engineering, Vol 4: Advanced Physicochemical Treatment Processes, 2007. It was determined that a change in experimental set up would have to be made for studying systems where gas components are absorbed rapidly into the solvent phase. The initial number of moles in the system was estimated using the pressure reading from the VLE cell (together with known VLE cell headspace volume and temperature). However, for a fast absorbing system, the initial pressure reading is only indicative of the moles of gas remaining in the headspace volume after rapid absorption. The amount of gas transferred to the VLE cell can be calculated using the mixing chamber conditions (P,V,T) as well. Using the initial and final pressures in the mixing chamber, together with the mixing chamber volume, the number of moles admitted to the VLE cell can be readily estimated. This required that an additional pressure transducer be connected to read the pressure changes in the mixing chamber. The test plan was revised to calibrate the volumes and pressures along the entire tubing path leading to the VLE cell and then monitoring the pressure changes in the mixing chamber during the filling of the VLE cell. Table 9 lists the data used to determine the volume of the mixing chamber and the 1 Equilibrium ratio is given by yNH3/xNH3 = 0.10*exp(0.0284T) where T is between 32 and 140°F.

20
previously measured volume of the VLE cell. The manufacturer supplied nominal size of the mixing chamber is 1 gallon (3.79 L), so the resulting average error in the volume measurements is approximately 3%.
Table 8 Equilibrium Distribution of Species (Ammonia-Nitrogen-Water)
System
VLE Cell
Distribution -ratio, NH3
T (oC)
pNH3, psia Vapor phase conc., NH3
Liquid phase conc., NH3
initial final yi,
NH3 yf,
NH3 x, NH3 mol/L (M) yf,NH3 / x,NH3
NH3-N2-H2O
26.7 73 29.8 0.42 0.23 7.93E-03 0.44 29
NH3-N2-DEG
26.7 73 26.6 0.42 0.21 8.34E-03 0.46 25.2
NH3-N2-DEG
40 71.6 31.2 0.42 0.24 6.72E-03 0.37 35.7
NH3-N2-DEG
60 71.6 32.9 0.42 0.24 6.87E-03 0.38 34.9
NH3-N2-DEG
135 71.6 52.3 0.42 0.29 5.25E-03 0.29 55.2
New solubility measurements were then made for the NH3-N2-H2O system to verify the procedure. The distribution ratios and the associated errors are given in Table 10. Although the new experimental values are of the same order of magnitude as the literature values, the errors are still large. Table 9 Temperature and Pressure Measurements to Determine the Volume of Mixing Chamber
VLE CELL MIXING CHAMBER
Pi, psia
Pf, psia
V, L T, F
Moles, n Pi, psia Pf, psia T, F Moles, n V, L
0.29 172.24 1.29 76.0 0.619 413.64 357.18 75.2 0.619 3.91 0.29 170.33 1.29 76.0 0.612 357.18 301.30 75.2 0.612 3.91 0.29 170.33 1.29 75.9 0.612 301.30 246.49 75.2 0.612 3.99 0.37 124.07 1.29 76.3 0.445 419.41 377.72 75.2 0.445 3.80 0.29 122.92 1.29 76.4 0.441 377.72 337.30 75.2 0.441 3.89

21
Table 10 Equilibrium Distribution Ratios for NH3-Gas-Water System: Comparison of Experimental Results with Literature Values
T (oC)
Distribution ratio (yNH3/xNH3)
% Error Experimental
Literature values (NH3+Air+Water)
26.8 1.32 ± 0.17 0.98a
25.8 %
30.1 0.82 1.16a, 1.15b (30 oC)
-40.2 %
59.3 2.37 5.14a
-116.9 %
a – Wnek W.J and Snow R.H., Design of Cross-Flow Cooling Towers and Ammonia Stripping Towers, Ind. Eng. Chem. Process Des. Develop. vol 11 (3), p. 343-349., 1972. b – Huang Ju-C and Shang C. Air Stripping (Chapter 2), Handbook of Environmental Engineering, Vol 4: Advanced Physicochemical Treatment Processes. A sensitivity analysis was performed for the distribution ratio calculation to identify the sources of error (Figure 9). It can be seen that uncertainty in the calculated composition and pressure readings of the mixing chamber has a huge effect on the value of the final equilibrium distribution ratio. The equilibrium value is also significantly impacted by the pressure measurements in the VLE cell.
0.00
0.20
0.40
0.60
0.80
1.00
1.20
1.40
yNH3 ± 0.005 P ± 0.5 psi T ± 1.0 C V ± 10.0 mL V ± 5.0 mL T ± 1.0 C P ± 0.5 psi V ± 5.0 mL
y NH
3/xN
H3
(30.
1 o C
)
value - delta
value
value + delta
Mixing Chamber
VLE Cell
Solvent
yNH3/xNH3 = 1.15 (Literature Value)
yNH3/xNH3 = 0.82 (Expt. Value)
Figure 9 Sensitivity Analysis: Calculation of Distribution Ratio for the N2-NH3-
Water System (30 oC)
22
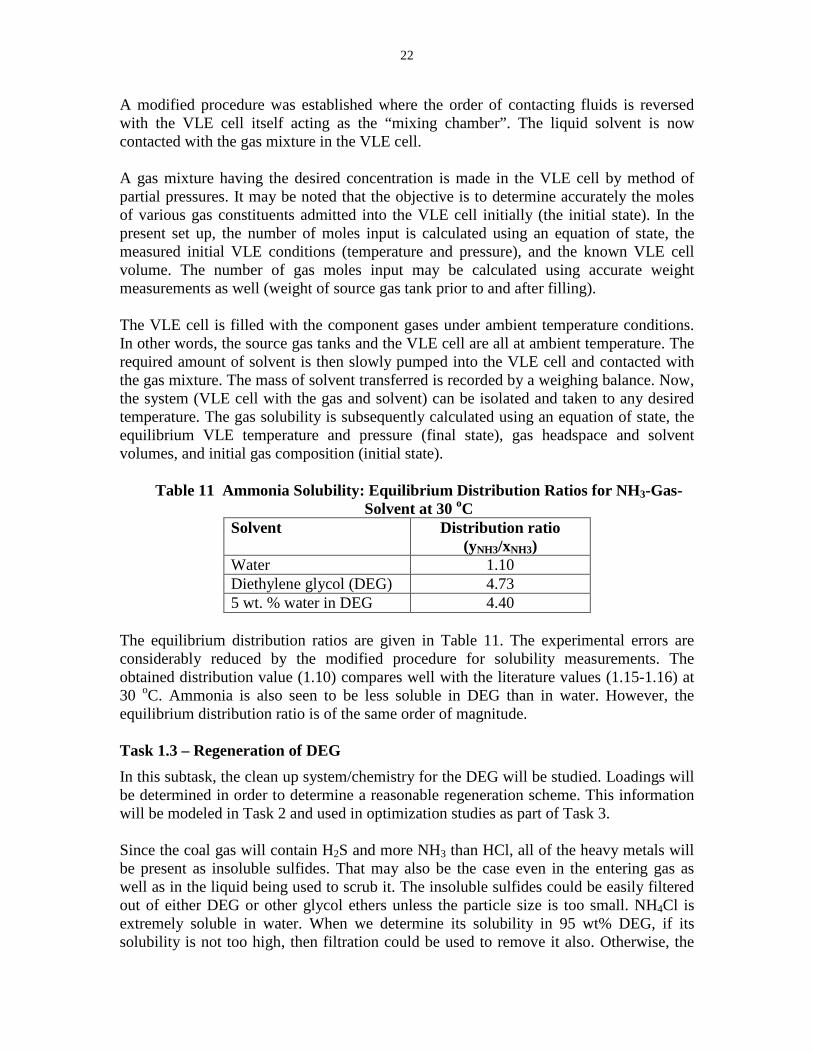
A modified procedure was established where the order of contacting fluids is reversed with the VLE cell itself acting as the “mixing chamber”. The liquid solvent is now contacted with the gas mixture in the VLE cell. A gas mixture having the desired concentration is made in the VLE cell by method of partial pressures. It may be noted that the objective is to determine accurately the moles of various gas constituents admitted into the VLE cell initially (the initial state). In the present set up, the number of moles input is calculated using an equation of state, the measured initial VLE conditions (temperature and pressure), and the known VLE cell volume. The number of gas moles input may be calculated using accurate weight measurements as well (weight of source gas tank prior to and after filling). The VLE cell is filled with the component gases under ambient temperature conditions. In other words, the source gas tanks and the VLE cell are all at ambient temperature. The required amount of solvent is then slowly pumped into the VLE cell and contacted with the gas mixture. The mass of solvent transferred is recorded by a weighing balance. Now, the system (VLE cell with the gas and solvent) can be isolated and taken to any desired temperature. The gas solubility is subsequently calculated using an equation of state, the equilibrium VLE temperature and pressure (final state), gas headspace and solvent volumes, and initial gas composition (initial state).
Table 11 Ammonia Solubility: Equilibrium Distribution Ratios for NH3-Gas-Solvent at 30 oC
Solvent Distribution ratio (yNH3/xNH3)
Water 1.10 Diethylene glycol (DEG) 4.73 5 wt. % water in DEG 4.40
The equilibrium distribution ratios are given in Table 11. The experimental errors are considerably reduced by the modified procedure for solubility measurements. The obtained distribution value (1.10) compares well with the literature values (1.15-1.16) at 30 oC. Ammonia is also seen to be less soluble in DEG than in water. However, the equilibrium distribution ratio is of the same order of magnitude. Task 1.3 – Regeneration of DEG In this subtask, the clean up system/chemistry for the DEG will be studied. Loadings will be determined in order to determine a reasonable regeneration scheme. This information will be modeled in Task 2 and used in optimization studies as part of Task 3. Since the coal gas will contain H2S and more NH3 than HCl, all of the heavy metals will be present as insoluble sulfides. That may also be the case even in the entering gas as well as in the liquid being used to scrub it. The insoluble sulfides could be easily filtered out of either DEG or other glycol ethers unless the particle size is too small. NH4Cl is extremely soluble in water. When we determine its solubility in 95 wt% DEG, if its solubility is not too high, then filtration could be used to remove it also. Otherwise, the

23
regeneration system could adjust the pH to precipitate it out of solution. Task 1.4 – Trace Sulfur Removal The objective of this subtask is to complete the COS studies started in Phase-1 to estimate the ultimate cost of removal/converting COS from the feed gas. Phase-1 showed that by controlling the various reaction pathways, COS formation can be minimized. This may require additional water within the reactor to promote the WGS equivalent reaction to minimize the amount of COS in the product gas. These experiments illustrated that when sulfur dioxide is added to the feed, both hydrogen sulfide and carbonyl sulfide are consumed. Ninety five percent of the carbonyl sulfide (from 490 to 35 ppm in a single stage reactor) was consumed and 99 percent of the hydrogen sulfide (from 10% to 70 ppm). Any COS that is not converted to H2S and then elemental sulfur will be absorbed into the lean DGM at the top of the column. Further laboratory tests are required to determine the COS concentrations expected at the top of the reaction section of the column in order to size the DGM circulation rate. The following experiments were performed to determine the influence of the solvent at conditions of 275 0F (135 °C) and reactor pressure of 400 psia. Figure 7 shows the experimental set-up.
1. Experiment 2a – July 9, 2008 – With 0.2 standard liters per minute (slpm) CO (in N2) to quantify its solubility in solvent at 135 oC.
2. Experiment 1 – July 18, 2008 – Slowly flow 0.2 slpm COS (in N2) to quantify its solubility in solvent; this test was to compare solubility to previously reported tests in pure DGM and DGM with 3-HP, at 135 oC.
3. Experiment 2c – September 14, 2008 – Slowly flow CO and CO2 through the system with elemental sulfur present to study Equation 4, CO + S = COS. This showed that this reaction contributes very little towards COS formation.
4. Blend Gas – September 19, 2008 – Here the feed gas contained a typical syngas composition without any SO2 added to provide a baseline measurement. It showed a significant increase in the number of COS moles.
5. Experiment 5d – April 23, 2008 – This older test is shown to illustrate the effect of excess SO2 on H2S and COS conversion. Two steams are being blended as the feed gas, one containing SO2 and CO in N2 and the other H2S, COS, and CO2 in nitrogen. The amount of nitrogen from the two streams is counted separately in the inlet steams. There is only one outlet steam so all of the nitrogen is reported on one line.
Table 12 shows the results of these experiments. Column one in Table 12 refers to the experiment number and date. Column two identifies the compounds for the gas steams in and out of the reactor. Columns 3 and 4 show the gas input to the reactor, and 5 and 6 the gas output. The last column summarizes the difference between the input and output, and shows whether each specific compound was absorbed or released by the solvent. When making a check on the nitrogen flow, we observed that the product gases entering the bubble meter were above room temperature. The correction factors that were applied

24
using Equation 1 were based on assuming the gas was at the reactor outlet temperature. This may contribute to a slight error due of the decrease in temperature on the gas traveling to the bubble meter, but is not considered significant. Moving the measurement downstream of the water knockout did not help the nitrogen balance. After rechecking the calibration on the feed gas flow controllers, it was found that the deviation within the mass flow controllers accounted for some of the gain in nitrogen at the exit, but not in the losses. Experiments were conducted to reduce the error in the material balance, including minimization of solvent losses to the vapor. The last two experiments in this table illustrate that when sulfur dioxide is added to the feed, both hydrogen sulfide and carbonyl sulfide are consumed. Ninety five percent of the carbonyl sulfide was consumed and 99 percent of the hydrogen sulfide. Additional testing will be needed to confirm the consumption of these compounds to below the required levels by using the actual field levels as in the blend gas composition along with a 2:1 ratio of hydrogen sulfide to sulfur dioxide in the next batch of upcoming experiments. To meet the DOE specifications for sulfur content of the product gas, a scavenger guard bed will be required. The data to date indicates that the guard bed can be decreased in size and cost by the bulk removal occurring in the UCSRP-HP process. This tradeoff between the degree of removal between UCSRP-HP and the guard bed will be addressed in the economic evaluation. The test conditions are shown in Table 13. The flow rates for the two feed gases, blend gas and SO2 gas were varied to achieve targeted molar H2S/SO2 ratios in accordance with the equations above. A GC was online to measure and record the effluent stream for H2S, COS and SO2. The first tests to evaluate the underlying cause for no SO2 or COS in the effluent began with the 2:1 stoichiometric molar ratio for H2S reacting with SO2 in Experiment C. No SO2 was expected or measured. However, we also did not detect H2S. We proceeded to increase the inlet H2S stream flow rate until we had excess H2S with 3:1 molar ratio. These results are reported as Experiment B of Table 13 and are not in agreement with the expected effluent H2S concentration of zero. Therefore, we ran the test under H2S deficient condition (1.2:1) as presented Experiment A. After 12 hours of operation, a trace level of COS with no SO2 or H2S was identified in the effluent so the mole ratio of H2S to SO2 was further reduced to 0.5:1 in the next experiment to force some H2S reading. Experiment D, in Table 13, again supported a problem with the SO2 recording. No SO2 or H2S were identified in the outlet stream although SO2 was expected. The configuration of the inlet was changed to accommodate measurement of the total combined inlet stream with a bypass to either the GC or the reactor. With known flow rates for both the blend gas and SO2, the inlet concentration were calculated and compared to those given by the GC. The reported inlet SO2 concentration by the GC continued to be zero SO2. We tested the Mass Flow Controller and found the filter had been plugged up. We exchanged this and reran the test with only SO2 in the inlet stream. The GC continued to report zero levels of SO2. We placed the GC inlet to measure the gas directly from the cylinder. At first it recorded SO2 at the correct level, but after 10 minutes the inlet SO2 concentration began to gradually decrease until it could not be

25
detected anymore. Figure 10 illustrates this. Based on this test, the problem could not be the first probable cause. This leaves the last two causes: the column itself leading to a faulty signal/response or the GC mathematical method for converting the signal to concentration. (A GC mathematical method describes the equation that best fits the column/detector response to the component. This is non-linear and requires at least three calibration points to obtain a valid calibration curve for the component. A new curve must be created whenever the detector response changes due to the absorption of contaminants or other column/gas interactions.)
Table 12 Experimental Results Conducted at 275 °F and 400 psig
Experiments Compound Input,
%mole Input,
mol/min Outlet, %mole
Output, mol/min
Produced, mol/min
2a, July 9
N2 89.2000 26.9000 89.9000 28.9000 1.9700 CO 10.8000 3.2400 9.9900 3.2100 -0.0346 CO2 0.0054 0.0016 0.0095 0.0031 0.0014 COS 0.0000 0.0000 0.0780 0.0250 0.0250 H2S 0.0000 0.0000 0.0041 0.0013 0.0013
1, July 18
N2 98.5300 29.7000 97.1000 34.0000 4.2600 COS 1.4600 0.4410 2.7600 0.9640 0.5220 H2S 0.0033 0.0010 0.0178 0.0062 0.0052 CO2 0.0000 0.0000 0.0713 0.0249 0.0249 CO 0.0000 0.0000 0.0304 0.0106 0.0106
2c, Sept. 14
N2 89.9000 40.6000 89.5000 35.5000 -5.1800 CO 10.1000 4.5700 10.0000 3.9600 -0.6060 CO2 0.0103 0.0047 0.0473 0.0187 0.0141 COS 0.0000 0.0000 0.0184 0.0073 0.0073 H2S 0.0000 0.0000 0.4650 0.1840 0.1840 Sulfur 91.42g 90.78g
Blend Gas, Sept. 19
N2 17.8000 5.3600 16.7000 4.1500 -1.2000 CO 40.1000 12.1000 40.9000 10.2000 -1.9100 H2S 0.8560 0.2580 0.4780 0.1190 -0.1390 CO2 10.1000 3.0300 9.1700 2.2800 -0.7480 H2 31.2000 9.4100 32.3000 8.0300 -1.3800 COS 0.0093 0.0028 0.4380 0.1090 0.1060
5d, April 23
N2 98.2000 176.394 99.8000 199.0000 8.0000 CO 0.9130 1.6400 0.0100 0.0199 -1.6201 SO2 0.9280 1.7500 0.1700 0.3380 -1.4120 N2 89.7000 14.1585 * * * H2S 10.2000 1.6100 0.0070 0.0139 -1.5961 COS 0.0492 0.0077 0.0035 0.0070 -0.0008 CO2 0.0006 0.0001 0.0054 0.0107 0.0106
The GC mathematical method was modified to enhance the signal by creating a new

26
curve. This did not improve the error, however. SO2 concentrations of zero continued to be reported after several minutes. The decreasing SO2 signal pointed to a problem with the GC column itself. To overcome the decrease in SO2 absorption, a new mathematical method was implemented after the column was cleaned out by the chemist. The new recordings of SO2 are now stable along with the other gas components. The experiment is now ready to go into a series of tests to verify mass flow balance and answer the question of COS production by the reaction under our operating conditions. Task 2 – Computer Simulation Model The UCSRP-HP Aspen Plus model is being completed as illustrated in Figure 11. Some of the units that still need to be completely defined include the high-pressure flash vessel, LL-Sep, leading from the TOP reactor to separate the liquid sulfur from the solvent for recycle. The TOP column is the reactor where hydrogen sulfide and sulfur dioxide are absorbed into DGM to produce water and liquid sulfur. Some of the K-values for hydrogen sulfide and sulfur dioxide still need to be put into the physical properties set. After the completing these prescribed conditions for these reactors, the Aspen model will be completed and a trial conversion of the entire model will be attempted. The computer model will be used for the purpose of bench-scale data analysis, process optimization, and economic analysis in Task 3. The model will also be used for designing and planning of pilot-scale unit for later phases. Task 3 – Techno-Economic Analysis The DOE report entitled, “Cost and Performance Baseline for Fossil Energy Plants,” DOE/NETL-2007/1281, Volume 1 will be used as the base line for our evaluation. The Conoco-Phillips’ (CP) E-Gas gasifier for an IGCC application using Illinois #6 coal without CO2 capture (Case 3) will be used to complement the review that CP plans to perform for the project. The process flow diagram (PFD) is shown in Figure 12. The cost documentation appears sufficient to allow a differential analysis, where we will use the costs of systems unchanged by our technology and only need costs for the affected systems. This will provide a clearer difference between UCSRP-HP and conventional technologies. The UCSRP-HP will replace, eliminate, or decrease the size/cost of the process blocks as shown in green on Table 14. The base case equipment sizes for the Syngas Cleanup area are shown in Table 15. This analysis does not yet include the impact on the water and compression systems. Task 4 – Project Management and Reporting GTI submitted the required monthly and annual reports to ICCI in a timely manner. Two papers and presentations were made on the subject of this project, namely: Meyer, H. S., Diana Matonis, Timothy Tamale, Dennis Leppin, and Scott Lynn, “UCSRP-HP – an Integrated Multi-Contaminant Removal Process for Treating Coal-Derived Syngas”, Presented at Twenty Fifth Annual International Pittsburgh Coal Conference, September 29 – October 2, 2008, Pittsburgh, PA.

27
Table 13 Results of Experiments for the Evaluation of COS in UCSRP-HP
Figure 10 Illustration of Decreasing SO2 Concentration Being Delivered to the
UCSRP-HP Reactor

28
Figure 11 UCSRP-HP Aspen Model
Table 14 Differential Analysis of UCSRP-HP into E-Gas Case
Unit Operation Effect of UCSRP-HP Impact Elevated Pressure ASU No significant impact E-Gas Gasifier Eliminate recycle of tail gas Syngas Cooling, Cyclones & Filters No significant impact Syngas Scrubber No significant impact COS Hydrolysis No significant impact
Gas Cooling, BFW Heating & Knockout
Reduce cooling requirement, base has cooling from 401 F to 103F, UCSRP-
HP will cool to about <300F
Sour Water Stripper Reduced stripping water related to
higher temperature Mercury Removal Eliminated, included in UCSRP-HP MDEA Eliminated, included in UCSRP-HP Claus Plant Eliminated, included in UCSRP-HP Hydrogenation Reactor and Gas Cooling Eliminated, included in UCSRP-HP Tail Gas Recycle to Gasifier Eliminated Syngas Humidification No significant impact Syngas Reheat No significant impact Gas Turbine Combustor No significant impact Turbines and HRSG No significant impact
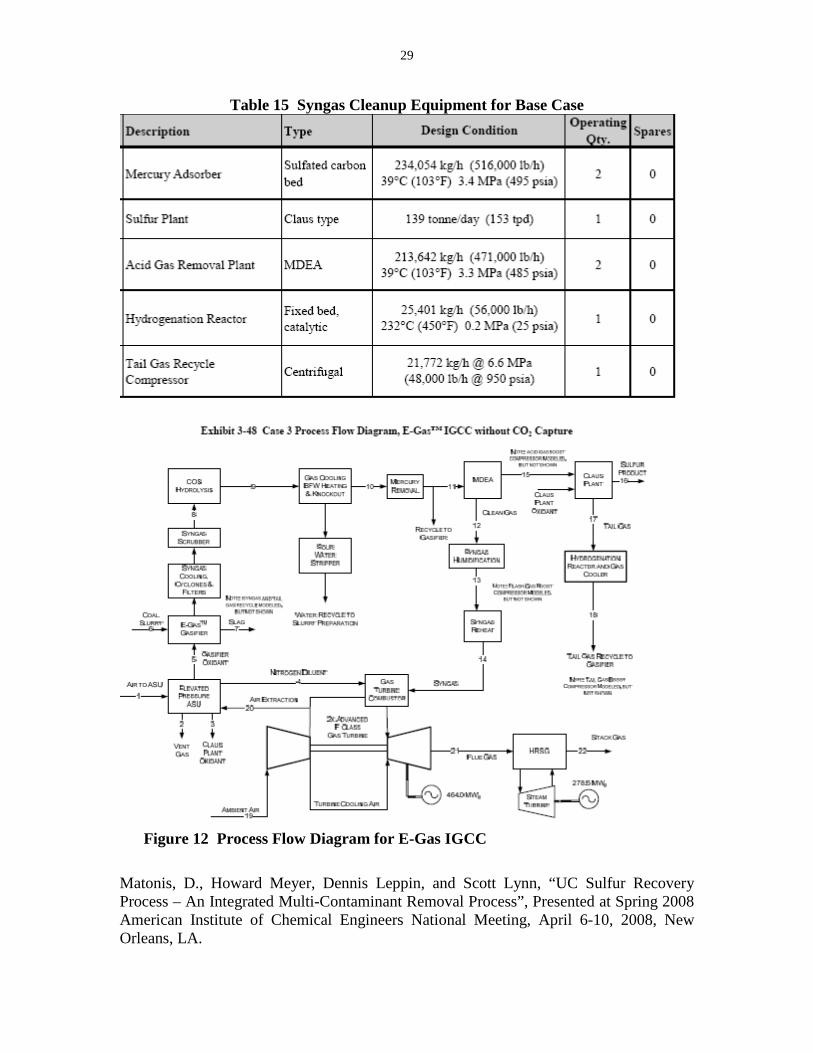
29
Table 15 Syngas Cleanup Equipment for Base Case
Figure 12 Process Flow Diagram for E-Gas IGCC
Matonis, D., Howard Meyer, Dennis Leppin, and Scott Lynn, “UC Sulfur Recovery Process – An Integrated Multi-Contaminant Removal Process”, Presented at Spring 2008 American Institute of Chemical Engineers National Meeting, April 6-10, 2008, New Orleans, LA.
30
CONCLUSIONS AND RECOMMENDATIONS The following conclusions were reached in this project:
o The UCSRP-HP process continues to be a viable technology that can significantly simplify the cleanup of coal-derived syngas.
o Preliminary results indicate that COS formation can be controlled by excess SO2 in the gas. Any COS that is still in the vapor above the reaction zone will be soluble in the lean DGM solvent at the top of the column and brought back to the reaction zone where it will be exposed to fresh SO2.
o Heavy metals, including mercury, arsenic and selenium, ammonia, and chlorides were removed from the process gas in the scrub column conditions. Selenium and ammonia chloride will be soluble while the other heavy metals will be a precipitate that can be removed by filtration to regenerate the solvent.
o Aspen Plus model appears adequate for simulating the UCSRP-HP process.
Based on the results from the current period, GTI recommends that additional laboratory work be performed under the following tasks. This project would complement work being performed for the US Department of Energy in their follow on program that includes laboratory and bench-scale testing of the UCSRP-HP with simulated and real coal-derived syngas. This is a critical step before the technology is ready for pilot plant testing.
Task 1 – Trace Component Removal and Recovery Experiments
In earlier testing, we showed that at about 50% of the H2Se and 33% of the AsH3 were removed in one stage of absorption. These tests were performed with large concentrations of the trace metals (15% H2Se and 1% AsH3) to ensure that we could measure the change in concentration using EPA Method 29. We are currently establishing our methodology for determining the solubility/reactivity of ammonia and hydrogen chloride in DGM/water solvent. We will test at more realistic levels (H2Se at 100s ppm and AsH3 at 1 ppm) with solubility levels of ammonia and HCl with on-line measurements to determine the number of stages required in the absorber section of the column. Contaminates are removed in the first section of a compound reactor column. This is accomplished by DEG, a common solvent, absorbing H2S, NH3, HCl and trace metals from the feed gas, with NH3 and HCl forming a highly soluble NH4Cl salt and the absorbed heavy metals, As, Cd and Hg, precipitate out as their very insoluble sulfides. The Se trace metal, present in the syngas as H2Se, forms a highly soluble (NH4)2Se under these conditions and remains dissolved in the solvent. A slipstream of the solvent will be treated to remove the soluble and insoluble components. With the successful indications of trace metal removal, we need to test concepts for the regeneration of the DEG and recovery of the trace metals from the solvent. Chemistry tests will be carried out to establish a reasonable set of process steps required to clean the DEG and will be used in the process modeling below.

31
Task 2 – Trace Sulfur Removal Laboratory Experiments
In earlier testing, we showed that COS can form within the reacting section of the process depending on the levels of SO2, CO2, H2S, and H2O present. Any COS formed will be scrubbed out of the product gas when the lean DEG is introduced to the top of the column. For design of that part of the column, we will perform tests in the stirred tank reactor to measure the COS formed under our operating conditions. Task 3 – Computer Simulation Modeling and Economics
The final effort during this period will be to complete the Aspen model and perform the differential economic evaluation of the UCSRP process. The modeling effort will incorporate the laboratory data obtained above to simulate the overall process flowsheet. The model has incorporated all of the data from previous testing. For the economic evaluation, we will utilize DOE warm gas cleanup evaluation for Illinois #6 coal, replacing the acid gas removal, sulfur recovery, COS hydrolysis, mercury removal, ammonia removal, and other trace component removal as appropriate. We will identify any treating advantages not accounted for directly, such as additional contaminant removal and utility advantages that will show the potential for the UCSRP-HP.

32
DISCLAIMER STATEMENT This report was prepared by Howard S. Meyer & Gas Technology Institute with support, in part, by grants made possible by the Illinois Department of Commerce and Economic Opportunity through the Office of Coal Development and the Illinois Clean Coal Institute. Neither Howard S. Meyer & Gas Technology Institute, nor any of its subcontractors, nor the Illinois Department of Commerce and Economic Opportunity, Office of Coal Development, the Illinois Clean Coal Institute, nor any person acting on behalf of either:
(A) Makes any warranty of representation, express or implied, with respect to the accuracy, completeness, or usefulness of the information contained in this report, or that the use of any information, apparatus, method, or process disclosed in this report may not infringe privately-owned rights; or
(B) Assumes any liabilities with respect to the use of, or for damages resulting from the use of, any information, apparatus, method or process disclosed in this report.
Reference herein to any specific commercial product, process, or service by trade name, trademark, manufacturer, or otherwise, does not necessarily constitute or imply its endorsement, recommendation, or favoring; nor do the views and opinions of authors expressed herein necessarily state or reflect those of the Illinois Department of Commerce and Economic Opportunity, Office of Coal Development, or the Illinois Clean Coal Institute.
Notice to Journalists and Publishers: If you borrow information from any part of this report, you must include a statement about the state of Illinois' support of the project.