Embed Size (px)
Citation preview
“Integrated OASE Results Overview”
Concluding white paper
Deliverable 8.5
OASE_D8.5_WP8_DTAG_15102013_V2.0.doc
Version: v2.0
Last Update: 15/10/2013
Distribution Level:
PU= Public
Distribution level
PU = Public,
RE = Restricted to a group of the specified Consortium, PP = Restricted to other program participants (including Commission Services),
CO= Confidential, only for members of the OASE Consortium (including the Commission Services)

Next Generation Optical Access Seamless Evolution Concluding white paper by the OASE project team
Marco Forzati, Alberto Bianchi, Jiajia Chen, Klaus Grobe, Carmen Mas Machuca,
Jean-Charles Point, Björn Skubic, Sofie Verbrugge, Erik Weis, Lena Wosinska, Dirk Breuer
Abstract— This white paper gives an overview of potential Next
Generation Optical Access (NGOA) solutions, the enabling
optical access network technologies, architecture principles and
related economics, where the associated CAPEX and OPEX is
also all taken into account. NGOA requirements (including peak
and sustainable data rate, reach, cost, node consolidation and
open access) are proposed and the different solutions are
compared against such requirements in different scenarios (in
terms of population density and system migration).
Unsurprisingly it is found that different solutions are best suited
for different scenarios. The conclusions drawn from such
findings allow us to formulate recommendations both in terms of
technology (roughly speaking: AON or GPON/XGPON in their
simplest forms for brownfield, although node consolidation or
green field requires more sophisticated solutions such as the
introduction of star topologies for AON and, unless the
sustainable data rate per end user is below 300 Mb/s, wavelength
management for PON) and but also in terms of strategy and
policy (retail open access should be delivered either at fibre or bit
stream level as done today, not at wavelength level; additional
wholesale revenue opportunity should be sought by opening the
network at passive and active layer to any market actor, and
neutrality and non-discrimination are key to maximise this
opportunity; public financial support should be focused on the
physical layer only). The paper is based on the main results of the
OASE Integrated Project that ran between 1 January 2010 and
28 February 2013.
Keywords-component: broadband optical access, NGOA, FTTH,
Fibre optic networks
1. INTRODUCTION AND MOTIVATION
The end-user need for broader and guaranteed bandwidth
is constantly increasing [1], and access networks currently
represent a bottleneck in the delivery chain, hence further
technology development is required. There is a common
understanding that Fibre-to-the-Home (FTTH) will overcome
the bandwidth limitations of today’s copper-based and hybrid
fibre access solutions, like, e.g., Fibre-to-the-Cabinet
(FTTCab). FTTH is seen as the ultimate and most future-proof
access solution. In the long run, this will enable next-
generation optical access (NGOA) networks, where the access
network is not limited to just the first mile but will extend
beyond today’s central offices (COs) and potentially be based
on more complex topologies than today. This means building
a completely new access network, which will require new
technical solutions, an enormous investment, and potentially
new business models, including new players like utilities,
construction companies and public administrations, as key
infrastructure investors and drivers, especially in rural areas.
The new network solutions need to satisfy customers’
needs at minimum total costs of ownership (TCO). Optical
fibre in the first mile with low overall attenuation will allow
overcoming today’s access network structures based on copper
lines with inherent high loss. Thus optical fibre in the access is
a key enabler for re-structuring access and aggregation
network to potentially lower overall CAPEX and OPEX.
This white paper summarises the results of the OASE
Integrated Project, which ran between 1 January 2010 and 28
February 2013. The paper evaluates different NGOA solutions
benchmarking them against today’s commercially available
fibre solutions, such as Gigabit Passive Optical Networks (G-
PON), or Active Optical Networks (AON).
2. THE OASE NGOA DEFINITION AND REQUIREMENTS
The goal of the OASE project was to identify NGOA network
solutions to allow operators to bring down network and
production costs, while still ensuring high network quality,
availability and significantly increased bandwidth, and
bandwidth scalability per user. This goal has been defined in
quantifiable and measurable requirements that a NGOA
solution needs to meet.
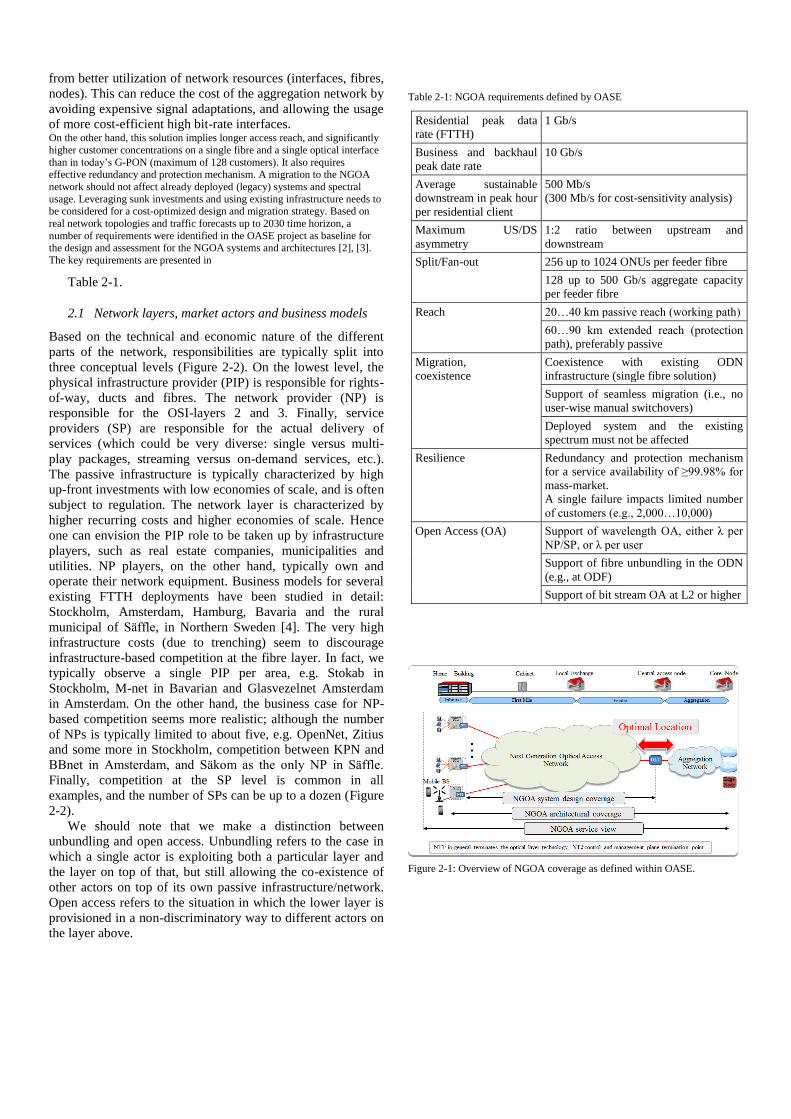
A generic NGOA solution is pictured in Figure 2-1, which
gives an overview of the coverage of a generic NGOA
solution, at system, architectural and service level. An NGOA
system comprises the segment from the user’s optical
termination (referred to NT1) up to the optical line terminal
(OLT) located at the Central Access Node (CAN). On the
architectural level the NGOA solution covers all segments
form the end user data termination (referred to as NT2) at the
customer side up to the Edge node (hence including the
aggregation section of the network).
Structural network changes as indicated in Figure 2-1, e.g.
by the potential shift of OLTs closer to the centre of the
network will be key to optimising the network and bring down
costs. Merging access and aggregation networks into a
simplified NGOA network will lead to cost savings stemming
M. Forzati is with Acreo Swedish ICT, Stockholm, Sweden (e-mail:
[email protected]). A. Bianchi is with Ericsson Telecomunicazioni SpA
(e-mail: [email protected]). D. Breuer and E. Weis are with Deutsche Telekom AG, Berlin, Germany (e-mail: [email protected];
[email protected]). J. Chen and L. Wosinska are with KTH, Stockholm,
Sweden (e-mail: [email protected]; [email protected]). K. Grobe is with ADVA Optical Networking SE, Martinsried, Germany (e-mail:
[email protected]). C. Mas Machuca is with TUM, Munich, Germany
(e-mail: [email protected]). J.C. Point is with JCP Consult, Rennes, France (e-
mail: [email protected]). B.Skubic is with Ericsson AB, Stockholm,
Sweden (e-mail: [email protected]). S. Verbrugge is with iMinds,
Ghent, Belgium (e-mail: [email protected]). Parts of the present work were financed by the European Commission
through the FP7 programme, under grant agreement n° 249025.
from better utilization of network resources (interfaces, fibres,
nodes). This can reduce the cost of the aggregation network by
avoiding expensive signal adaptations, and allowing the usage
of more cost-efficient high bit-rate interfaces. On the other hand, this solution implies longer access reach, and significantly
higher customer concentrations on a single fibre and a single optical interface
than in today’s G-PON (maximum of 128 customers). It also requires effective redundancy and protection mechanism. A migration to the NGOA
network should not affect already deployed (legacy) systems and spectral
usage. Leveraging sunk investments and using existing infrastructure needs to be considered for a cost-optimized design and migration strategy. Based on
real network topologies and traffic forecasts up to 2030 time horizon, a
number of requirements were identified in the OASE project as baseline for the design and assessment for the NGOA systems and architectures [2], [3].
The key requirements are presented in
Table 2-1.
2.1 Network layers, market actors and business models
Based on the technical and economic nature of the different
parts of the network, responsibilities are typically split into
three conceptual levels (Figure 2-2). On the lowest level, the
physical infrastructure provider (PIP) is responsible for rights-
of-way, ducts and fibres. The network provider (NP) is
responsible for the OSI-layers 2 and 3. Finally, service
providers (SP) are responsible for the actual delivery of
services (which could be very diverse: single versus multi-
play packages, streaming versus on-demand services, etc.).
The passive infrastructure is typically characterized by high
up-front investments with low economies of scale, and is often
subject to regulation. The network layer is characterized by
higher recurring costs and higher economies of scale. Hence
one can envision the PIP role to be taken up by infrastructure
players, such as real estate companies, municipalities and
utilities. NP players, on the other hand, typically own and
operate their network equipment. Business models for several
existing FTTH deployments have been studied in detail:
Stockholm, Amsterdam, Hamburg, Bavaria and the rural
municipal of Säffle, in Northern Sweden [4]. The very high
infrastructure costs (due to trenching) seem to discourage
infrastructure-based competition at the fibre layer. In fact, we
typically observe a single PIP per area, e.g. Stokab in
Stockholm, M-net in Bavarian and Glasvezelnet Amsterdam
in Amsterdam. On the other hand, the business case for NP-
based competition seems more realistic; although the number
of NPs is typically limited to about five, e.g. OpenNet, Zitius
and some more in Stockholm, competition between KPN and
BBnet in Amsterdam, and Säkom as the only NP in Säffle.
Finally, competition at the SP level is common in all
examples, and the number of SPs can be up to a dozen (Figure
2-2).
We should note that we make a distinction between
unbundling and open access. Unbundling refers to the case in
which a single actor is exploiting both a particular layer and
the layer on top of that, but still allowing the co-existence of
other actors on top of its own passive infrastructure/network.
Open access refers to the situation in which the lower layer is
provisioned in a non-discriminatory way to different actors on
the layer above.
Table 2-1: NGOA requirements defined by OASE
Residential peak data
rate (FTTH)
1 Gb/s
Business and backhaul
peak date rate
10 Gb/s
Average sustainable
downstream in peak hour
per residential client
500 Mb/s
(300 Mb/s for cost-sensitivity analysis)
Maximum US/DS
asymmetry
1:2 ratio between upstream and
downstream
Split/Fan-out 256 up to 1024 ONUs per feeder fibre
128 up to 500 Gb/s aggregate capacity
per feeder fibre
Reach 20…40 km passive reach (working path)
60…90 km extended reach (protection
path), preferably passive
Migration,
coexistence
Coexistence with existing ODN
infrastructure (single fibre solution)
Support of seamless migration (i.e., no
user-wise manual switchovers)
Deployed system and the existing
spectrum must not be affected
Resilience Redundancy and protection mechanism
for a service availability of ≥99.98% for
mass-market.
A single failure impacts limited number
of customers (e.g., 2,000…10,000)
Open Access (OA) Support of wavelength OA, either λ per
NP/SP, or λ per user
Support of fibre unbundling in the ODN
(e.g., at ODF)
Support of bit stream OA at L2 or higher
Figure 2-1: Overview of NGOA coverage as defined within OASE.
(a) (b) (c) (d) (e) (f) Figure 2-2: Conceptual business models
3. THE OASE NGOA SOLUTIONS
A survey of systems and architectures [5] examined
different ways of active optical network (AON) and passive
optical networks (PON), and identified four main groups of
solutions with the potential of fulfilling the NGOA
requirements of Section 2:
WDM-PON,
Hybrid WDM/TDM-PON,
WDM-PON backhaul,
NG-AON.
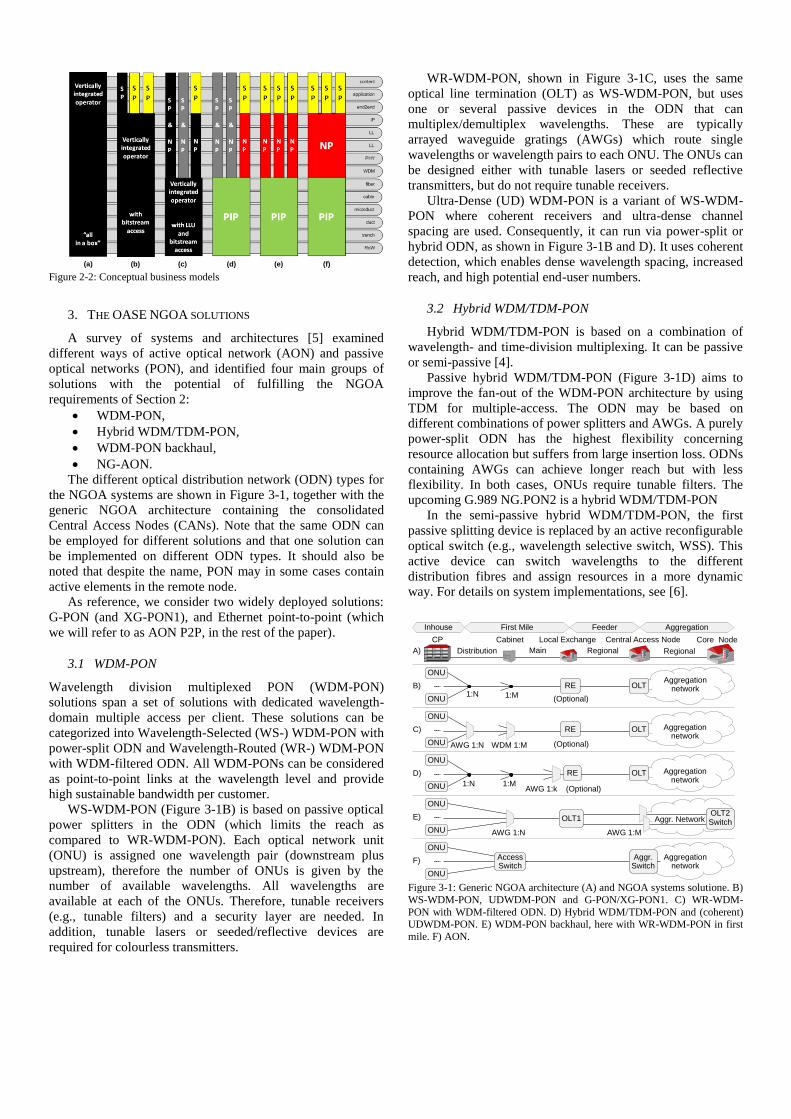
The different optical distribution network (ODN) types for
the NGOA systems are shown in Figure 3-1, together with the
generic NGOA architecture containing the consolidated
Central Access Nodes (CANs). Note that the same ODN can
be employed for different solutions and that one solution can
be implemented on different ODN types. It should also be
noted that despite the name, PON may in some cases contain
active elements in the remote node.
As reference, we consider two widely deployed solutions:
G-PON (and XG-PON1), and Ethernet point-to-point (which
we will refer to as AON P2P, in the rest of the paper).
3.1 WDM-PON
Wavelength division multiplexed PON (WDM-PON)
solutions span a set of solutions with dedicated wavelength-
domain multiple access per client. These solutions can be
categorized into Wavelength-Selected (WS-) WDM-PON with
power-split ODN and Wavelength-Routed (WR-) WDM-PON
with WDM-filtered ODN. All WDM-PONs can be considered
as point-to-point links at the wavelength level and provide
high sustainable bandwidth per customer.
WS-WDM-PON (Figure 3-1B) is based on passive optical
power splitters in the ODN (which limits the reach as
compared to WR-WDM-PON). Each optical network unit
(ONU) is assigned one wavelength pair (downstream plus
upstream), therefore the number of ONUs is given by the
number of available wavelengths. All wavelengths are
available at each of the ONUs. Therefore, tunable receivers
(e.g., tunable filters) and a security layer are needed. In
addition, tunable lasers or seeded/reflective devices are
required for colourless transmitters.
WR-WDM-PON, shown in Figure 3-1C, uses the same
optical line termination (OLT) as WS-WDM-PON, but uses
one or several passive devices in the ODN that can
multiplex/demultiplex wavelengths. These are typically
arrayed waveguide gratings (AWGs) which route single
wavelengths or wavelength pairs to each ONU. The ONUs can
be designed either with tunable lasers or seeded reflective
transmitters, but do not require tunable receivers.
Ultra-Dense (UD) WDM-PON is a variant of WS-WDM-
PON where coherent receivers and ultra-dense channel
spacing are used. Consequently, it can run via power-split or
hybrid ODN, as shown in Figure 3-1B and D). It uses coherent
detection, which enables dense wavelength spacing, increased
reach, and high potential end-user numbers.
3.2 Hybrid WDM/TDM-PON
Hybrid WDM/TDM-PON is based on a combination of
wavelength- and time-division multiplexing. It can be passive
or semi-passive [4].
Passive hybrid WDM/TDM-PON (Figure 3-1D) aims to
improve the fan-out of the WDM-PON architecture by using
TDM for multiple-access. The ODN may be based on
different combinations of power splitters and AWGs. A purely
power-split ODN has the highest flexibility concerning
resource allocation but suffers from large insertion loss. ODNs
containing AWGs can achieve longer reach but with less
flexibility. In both cases, ONUs require tunable filters. The
upcoming G.989 NG.PON2 is a hybrid WDM/TDM-PON
In the semi-passive hybrid WDM/TDM-PON, the first
passive splitting device is replaced by an active reconfigurable
optical switch (e.g., wavelength selective switch, WSS). This
active device can switch wavelengths to the different
distribution fibres and assign resources in a more dynamic
way. For details on system implementations, see [6].
1:N(Optional)1:M
Local Exchange
Distribution Main
CabinetCP Central Access Node Core Node
Regional Regional
First Mile Feeder AggregationInhouse
WDM 1:M (Optional)AWG 1:N
AWG 1:k (Optional)1:N 1:M
ONU
ONU
RE
ONU
RE Aggregation network
Aggregation network
ONU
ONU
RE Aggregation network
ONU
OLT
OLT
OLT
ONU
ONU
AccessSwitch
AWG 1:N
Aggr. Network
AWG 1:M
OLT1OLT2Switch
Aggregation network
Aggr.Switch
ONU
ONU
A)
B)
C)
D)
E)
F)
Figure 3-1: Generic NGOA architecture (A) and NGOA systems solutione. B)
WS-WDM-PON, UDWDM-PON and G-PON/XG-PON1. C) WR-WDM-
PON with WDM-filtered ODN. D) Hybrid WDM/TDM-PON and (coherent) UDWDM-PON. E) WDM-PON backhaul, here with WR-WDM-PON in first
mile. F) AON.

3.3 WDM-PON backhaul
This is a hybrid AON/PON architecture (see Figure 3-1E)
consisting of two typically PON-based stages (backhaul and
first mile) connected by an active element terminating and
regenerating the optical signal. The backhaul stage is based on
WR-WDM-PON, while the first-mile stage can be based on
G-PON, WDM-PON, or even AON P2P. Due to this mid-
stage termination, high reach and client count can be achieved,
at the cost of active equipment in the field.
3.4 NG-AON
The next-generation active optical network (NG-AON)
architecture is based on active remote nodes which are placed
somewhere in the ODN, for instance in the cellar in a multi-
dwelling unit or in a cabinet (see Figure 3-1F). Each ONU
connects to a layer-2 switch. Higher-layer (i.e., IP) and in
principle also lower-layer (i.e., lambda layer) switching is also
possible. The backhaul between RN and CAN can be based on
different point-to-point technologies, e.g., WDM-PON.
NG-AON can be based on standard star topology, as
shown in Figure 3-1F, but meshed topologies can be relatively
easily implemented to bring protection all the way to the first
aggregation point (e.g. the cellar in a multi-dwelling unit or in
a cabinet).
4. ASSESSMENT OF THE OASE SOLUTIONS
The assessment of the four NGOA solutions is presented in
this Section, together with the reference solutions. First, a
system-level assessment is performed, followed by an analysis
on the architectural level. Finally, techno-economic and
business-model assessments are performed.
4.1 System-level assessment
All solutions are assessed with respect to performance and
operational parameters with an impact on the Total Cost of
Ownership (TCO): client count per OLT port, floor space
requirement (density), energy consumption, provisioning,
maintenance, and open access compatibility.
All systems are configured to provide ≥1 Gb/s peak bit rate
and 300 Mb/s or 500 Mb/s guaranteed bit rate per client, as per
the requirements defined in Section 2. For hybrid
WDM/TDM-PON and G-PON/XG-PON1, the ODN split ratio
is adapted to these bit-rate requirements.
Assessment of reach and client count per OLT port is
based on power-budget modelling, whilst floor space and
energy consumption is based on modelling of the respective
system configurations. A common power-budget model is
used that comprises a total penalty of 5.5 dB for in-house
patching, cabling, measurement couplers, etc. End-of-life fibre
attenuation of 0.34 dB/km in the C/L-band and 0.44 dB/km at
1310 nm has been assumed. In addition, all systems were
configured in order to comply with laser safety class 1M.
In order to investigate floor space and power consumption,
a common rack and shelf model is used. Each shelf includes
mechanics, backplane, redundant power supply, management,
and Layer-2 switching which is adapted to the guaranteed per-
client data rate.
The calculations regarding cost, power consumption, form
factor and reach are based on the performances of the key
components or sub-systems of the respective system
configurations. These parameters have been extensively
discussed in industry fora like FSAN, conferences and
workshops, other research projects, and bilaterally with
various components vendors. More details on the system-level
assessment can be found in [5], [7], [8] and [9].
The component figures for power budgets, power
consumption, and cost are subject to uncertainty increasing in
this order (i.e., power-budget / IL figures are stable, relative-
cost figures have highest uncertainty). Sensitivity analysis
shows that even 3-dB changes of key-components cost does
not change the overall result significantly.
4.1.1 Technical performance assessment – calculations
Given the high requirements in particular for reach and per-
client bit rates it turned out that WR-DWDM-PON can
achieve a fibre reach of 60 km with a fully passive ODN for
client counts of up to 80 per OLT port. Higher client count is
possible, but when it is increased beyond 80, fibre reach is
reduced due to the insertion of additional WDM band splitters
or interleavers.
Coherent UDWDM-PON can achieve ~60 km reach for
client count as high as 320. Client count can again be higher,
but then reach is decreased likewise.
For hybrid WDM/TDMA-PON, reach is limited to less
than 30 km at high client count (320 and above), even though
booster and pre-amplifiers, FEC and a very high transceiver
power budget (39 dB) have all been considered.
With WDM-PON backhaul, both long reach (>40 km) and
large client count (several hundreds) can be achieved. These
advantages come at the penalty of needing active remote sites.
This is addressed by the TCO calculations.
The reach of any of the WDM-based NGOA systems can
be increased by active reach extenders, i.e., optical amplifiers.
These require local electrical powering which again has to be
considered for the resulting TCO.
The assessment further showed that power consumption is
not a major differentiator. Power consumption at the ONU
side is somewhat higher for UDWDM-PON and hybrid
WDM/TDMA-PON due to their complexity, compared to
WR-WDM-PON. At the OLT side, power consumption per
client is slightly lower for hybrid WDM/TDMA-PON due to
the sharing of wavelengths amongst multiple clients. Ethernet
PtP has the lowest power consumption per access line.
However, network-wide power consumption is increased by
the higher number of active sites with aggregation switches.
4.1.2 Technical performance assessment – experimental
We also investigated two relevant aspects of NGOA solutions
experimentally. These aspects relate to the photonic layer of
WDM-based PON. The results are applicable to WDM-PON
as well as WDM/TDMA-PON and similar hybrid PONs. The
work targeted former weaknesses of WDM-PON: the limits of
the achievable bitratereach product for seeded/reflective

approaches, and lacking concepts for massive cost reduction in
WDM-PON based on tunable lasers.
Increased bitratereach with seeded/reflective transmitters
was achieved for the specific variant of wavelength re-use
with combined IRZ/RZ modulation. Here, the modulated
downstream laser wavelength is also used as a seed for a
reflective ONU transmitter, which re-uses this wavelength for
upstream re-modulation. In any time-slot, the ONU must
receive seed light for upstream transmission. This can be
achieved be modulating the downstream with Inverse-Return-
to-Zero (IRZ) On/Off-Keying (OOK) and then using bit-
interleaved Return-to-Zero (RZ) OOK for the upstream. A
block diagram of this system is given in Figure 4-1.
The bitratereach product of the IRZ/RZ WDM-PON was
increased to 20 km at 10 Gb/s per channel and 60 km at 2.5
Gb/s, respectively [6].
As an alternative to seeded/reflective transmitters, tunable
lasers can be used for colorless ONUs. In order to allow for
low cost, the lasers must neither be fitted with their own
dedicated wavelength lockers nor with coolers. Hence, they
are subject to wavelength drift and require cost-effective
wavelength control in the PON system context.
Several control mechanisms were developed and
implemented for several different types of wide-band tuneable
lasers (DS-DBR lasers, Y-Branch DBR lasers). This included
closed-loop control and open-loop control according to a look-
up table.
For closed-loop laser control, a distributed wavelength
locker was implemented which can be shared between all
WDM channels for cost efficiency. The set-up is shown in
Figure 4-2. The upstream lasers in the ONUs were modulated
with additional (AM or FM) pilot tones which were
transparent for the payload. These pilot tones were detected in
the OLT via a tap, followed by low-speed photo diodes and
analogue-to-digital conversion. Laser drift could be detected
and corrective action be signaled to the ONUs via an
embedded control channel (ECC).
Closed-loop control allows wavelength stabilization of the
uncooled lasers to within ±5 GHz over a broad temperature
range, and ±2.2 GHz over ±0.5°C. This supports wavelength
grids down to 25 GHz [10].
OLT
ONU PIN3dB
RZDS
IRZ
US
RZ
0 0
0 01 1
1 1
RN
AW
G
C-Band
C-Band
REAM-SOA Drive
TIA
AW
G
PINTIA
IRZ
Drive Mod
T-LD
…
Figure 4-1: 10-Gb/s IRZ/RZ WDM-PON. MZM: Mach-Zehnder Modulator.
T-LD: Tuneable Laser Diode. PIN TIA: p-i-n photo diode with transimpedance amplifier.
ONU
OLT
TX/RX
Array
incl.
CAWG
Wave
Locker
+ µC
ECC
Tone
T-LD
L-Band
C-Band
CA
WG
PIN TIA
RN
Tone Tune
Figure 4-2: Closed wavelength control loop. CAWG: Cyclic AWG. Tone:
pilot-tone generator. Tune: tuning micro controller (µC).
4.1.3 Assessment of operational aspects
The operational-aspects assessment performed during the
project concluded (see [6] for details) that all potential NGOA
solutions do support the basic Operations, Administration and
Maintenance requirements. In particular, simple provisioning
is possible with all solutions given that WDM-based ONUs
are colourless self-installing (which is of course a strict
requirement). Certain advantages regarding fault isolation
were identified for NG-AON and WR-WDM-PON due to
their capabilities of unambiguously discriminating the
individual distribution fibres. This is possibly only to a limited
extent for broadcast (power-split) ODN.
Some differences were also identified with regard to the
floor-space requirements. Here, hybrid WDM/TDM-PON
shows best density, followed by WDM-PON with integrated
multi-channel transceiver arrays. In third place is WDM-PON
backhaul (due to the requirement for active RNs), which is
followed by the relatively complex UDWDM-PON. NG-AON
has the highest floor-space demand, which can clearly be
attributed to the high number of active sites.
Regarding Open Access (OA), no sever differences were
found. For all solutions, OA focuses on Layer-2. For WDM-
based PONs, OA on the wavelength level is seen possible, but
requires significant additional effort when integrated multi-
channel transceiver arrays are used.
4.1.4 System-level assessment sum-up
All assessments are based on the basic components-level
properties. The systems-level performance assessment did not
yet show a clearly winning solution. In general, maximum
reach is traded-off by fan-out for all PON solutions, due to the
increasing insertion loss. In this regard, AON solutions have
an advantage. Regarding energy consumption, there is no clear
picture, neither. On the positive side, this also means that all
solutions do comply with, e.g., the EU Broadband Code of
Conduct.
The system cost comparison shows somewhat higher cost
for coherent UDWDM-PON, and large variations depending
on specific system configurations. For most configurations,
cost clearly depends on the guaranteed bit-rate. Hence, there
are significant differences between the figures for 300 Mb/s
and 500 Mb/s, respectively.
The operational assessment did not clarify the ranking.
Most solutions perform fairly well with regard to basic
operational as well as to open-access requirements. As an
example, WR-WDM-PON performs slightly above average.
In order to single out a main system candidate for NGOA,
it is necessary to understand which system aspects are cost-
driving with regard to the Total Cost of Ownership (TCO).
This analysis is presented in Section 4.3.
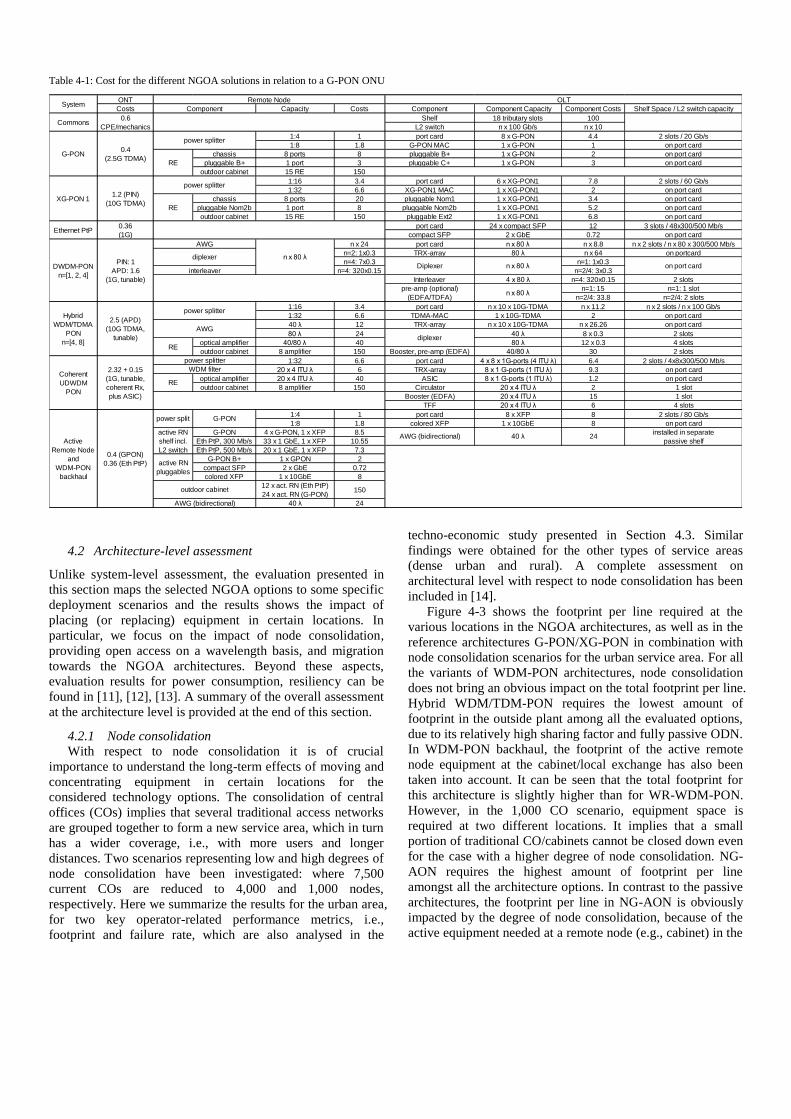
Table 4-1: Cost for the different NGOA solutions in relation to a G-PON ONU
ONT
Costs Capacity Costs Component Component Capacity Component Costs Shelf Space / L2 switch capacity
Shelf 18 tributary slots 100
L2 switch n x 100 Gb/s n x 10
1:4 1 port card 8 x G-PON 4.4 2 slots / 20 Gb/s
1:8 1.8 G-PON MAC 1 x G-PON 1 on port card
chassis 8 ports 8 pluggable B+ 1 x G-PON 2 on port card
pluggable B+ 1 port 3 pluggable C+ 1 x G-PON 3 on port card
outdoor cabinet 15 RE 150
1:16 3.4 port card 6 x XG-PON1 7.8 2 slots / 60 Gb/s
1:32 6.6 XG-PON1 MAC 1 x XG-PON1 2 on port card
chassis 8 ports 20 pluggable Nom1 1 x XG-PON1 3.4 on port card
pluggable Nom2b 1 port 8 pluggable Nom2b 1 x XG-PON1 5.2 on port card
outdoor cabinet 15 RE 150 pluggable Ext2 1 x XG-PON1 6.8 on port card
port card 24 x compact SFP 12 3 slots / 48x300/500 Mb/s
compact SFP 2 x GbE 0.72 on port card
n x 24 port card n x 80 λ n x 8.8 n x 2 slots / n x 80 x 300/500 Mb/s
n=2: 1x0.3 TRX-array 80 λ n x 64 on portcard
n=4: 7x0.3 n=1: 1x0.3
n=4: 320x0.15 n=2/4: 3x0.3
Interleaver 4 x 80 λ n=4: 320x0.15 2 slots
n=1: 15 n=1: 1 slot
n=2/4: 33.8 n=2/4: 2 slots
1:16 3.4 port card n x 10 x 10G-TDMA n x 11.2 n x 2 slots / n x 100 Gb/s
1:32 6.6 TDMA-MAC 1 x 10G-TDMA 2 on port card
40 λ 12 TRX-array n x 10 x 10G-TDMA n x 26.26 on port card
80 λ 24 40 λ 8 x 0.3 2 slots
optical amplifier 40/80 λ 40 80 λ 12 x 0.3 4 slots
outdoor cabinet 8 amplifier 150 Booster, pre-amp (EDFA) 40/80 λ 30 2 slots
1:32 6.6 port card 4 x 8 x 1G-ports (4 ITU λ) 6.4 2 slots / 4x8x300/500 Mb/s
20 x 4 ITU λ 6 TRX-array 8 x 1 G-ports (1 ITU λ) 9.3 on port card
optical amplifier 20 x 4 ITU λ 40 ASIC 8 x 1 G-ports (1 ITU λ) 1.2 on port card
outdoor cabinet 8 amplifier 150 Circulator 20 x 4 ITU λ 2 1 slot
Booster (EDFA) 20 x 4 ITU λ 15 1 slot
TFF 20 x 4 ITU λ 6 4 slots
1:4 1 port card 8 x XFP 8 2 slots / 80 Gb/s
1:8 1.8 colored XFP 1 x 10GbE 8 on port card
G-PON 4 x G-PON, 1 x XFP 8.5
Eth PtP, 300 Mb/s 33 x 1 GbE, 1 x XFP 10.55
Eth PtP, 500 Mb/s 20 x 1 GbE, 1 x XFP 7.3
G-PON B+ 1 x GPON 2
compact SFP 2 x GbE 0.72
colored XFP 1 x 10GbE 8
12 x act. RN (Eth PtP)
24 x act. RN (G-PON)150
40 λ 24
SystemRemote Node OLT
Component
Commons0.6
CPE/mechanics
G-PON0.4
(2.5G TDMA)
power splitter
RE
XG-PON 11.2 (PIN)
(10G TDMA)
power splitter
RE
Ethernet PtP0.36
(1G)
DWDM-PON
n=[1, 2, 4]
PIN: 1
APD: 1.6
(1G, tunable)
AWG
n x 80 λdiplexer
Diplexer n x 80 λ on port cardinterleaver
pre-amp (optional)
(EDFA/TDFA)n x 80 λ
Hybrid
WDM/TDMA
PON
n=[4, 8]
2.5 (APD)
(10G TDMA,
tunable)
power splitter
AWG
diplexer
RE
Coherent
UDWDM
PON
2.32 + 0.15
(1G, tunable,
coherent Rx,
plus ASIC)
power splitter
WDM filter
RE
Active
Remote Node
and
WDM-PON
backhaul
0.4 (GPON)
0.36 (Eth PtP)
power split G-PON
active RN
shelf incl.
L2 switch
AWG (bidirectional) 40 λ 24installed in separate
passive shelf
active RN
pluggables
outdoor cabinet
AWG (bidirectional)
4.2 Architecture-level assessment
Unlike system-level assessment, the evaluation presented in
this section maps the selected NGOA options to some specific
deployment scenarios and the results shows the impact of
placing (or replacing) equipment in certain locations. In
particular, we focus on the impact of node consolidation,
providing open access on a wavelength basis, and migration
towards the NGOA architectures. Beyond these aspects,
evaluation results for power consumption, resiliency can be
found in [11], [12], [13]. A summary of the overall assessment
at the architecture level is provided at the end of this section.
4.2.1 Node consolidation
With respect to node consolidation it is of crucial
importance to understand the long-term effects of moving and
concentrating equipment in certain locations for the
considered technology options. The consolidation of central
offices (COs) implies that several traditional access networks
are grouped together to form a new service area, which in turn
has a wider coverage, i.e., with more users and longer
distances. Two scenarios representing low and high degrees of
node consolidation have been investigated: where 7,500
current COs are reduced to 4,000 and 1,000 nodes,
respectively. Here we summarize the results for the urban area,
for two key operator-related performance metrics, i.e.,
footprint and failure rate, which are also analysed in the
techno-economic study presented in Section 4.3. Similar
findings were obtained for the other types of service areas
(dense urban and rural). A complete assessment on
architectural level with respect to node consolidation has been
included in [14].
Figure 4-3 shows the footprint per line required at the
various locations in the NGOA architectures, as well as in the
reference architectures G-PON/XG-PON in combination with
node consolidation scenarios for the urban service area. For all
the variants of WDM-PON architectures, node consolidation
does not bring an obvious impact on the total footprint per line.
Hybrid WDM/TDM-PON requires the lowest amount of
footprint in the outside plant among all the evaluated options,
due to its relatively high sharing factor and fully passive ODN.
In WDM-PON backhaul, the footprint of the active remote
node equipment at the cabinet/local exchange has also been
taken into account. It can be seen that the total footprint for
this architecture is slightly higher than for WR-WDM-PON.
However, in the 1,000 CO scenario, equipment space is
required at two different locations. It implies that a small
portion of traditional CO/cabinets cannot be closed down even
for the case with a higher degree of node consolidation. NG-
AON requires the highest amount of footprint per line
amongst all the architecture options. In contrast to the passive
architectures, the footprint per line in NG-AON is obviously
impacted by the degree of node consolidation, because of the
active equipment needed at a remote node (e.g., cabinet) in the

field. It also means that the old COs or cabinets cannot be
completely closed in the node consolidation scenarios. Figure 4-4 shows the average number of failures per year
normalized per line in different NGOA options and G-PON for various node-consolidation scenarios. It can be clearly seen that failures at ONUs dominate in all the evaluated options. In the case of an ONU failure it is assumed that a new device will be sent to, and installed by, the end user (plug-and-play). If excluding any faults occurring at the ONU side, then the values presented in Figure 4-4 could reflect the mean number of failures per year normalized per line, where the operator needs to send technicians to repair. From Figure 4-4, we can see that NG-AON has the lowest total failure rate, while Hybrid WDM/TDM-PON causes the least number of faults that require technicians to travel and undertake repair.
4.2.2 Open access compliance
Based on the different system concepts and architectural
investigations, in [15] all of the aforementioned NGOA
solutions were analysed with respect to their potential to
enable co-operation between different players as introduced in
section 2, e.g., sharing part or all of the infrastructure and/or
equipment. Three methods, namely fibre, wavelength and bit-
stream open access for giving access to a network have been
considered.
Wavelength open access was studied in particular detail,
since the two other main options (P2P fibre-level open access,
only feasible with AON solutions with co-location possibility
at the RN, or with P2P AON; and bit-stream open access,
which can be adapted to any NGOA architecture option) are
relatively straightforward to implement and widely used
today.
The main impact of wavelength open access on the
physical infrastructure provider (PIP) comes from the
consequent need to manage optical devices (e.g., optical
splitters, AWGs, and wavelength selective switches WSSs)
and manage wavelengths. Wavelength open access can be
implemented as:
Wavelength open access at the feeder fibre
Wavelength open access at the central access node
The latter option can be implemented by manual
reconfiguration of the network each time the customer decides
to change network provider (NP), or by automatic
reconfiguration, either in the electronic or optical domain.
Optical-domain reconfiguration can be done with:
static spectrum distribution amongst NPs, using the
waveband splitter as open access element, or
dynamic spectrum distribution amongst NPs, using
the power splitter or WSS as open access element.
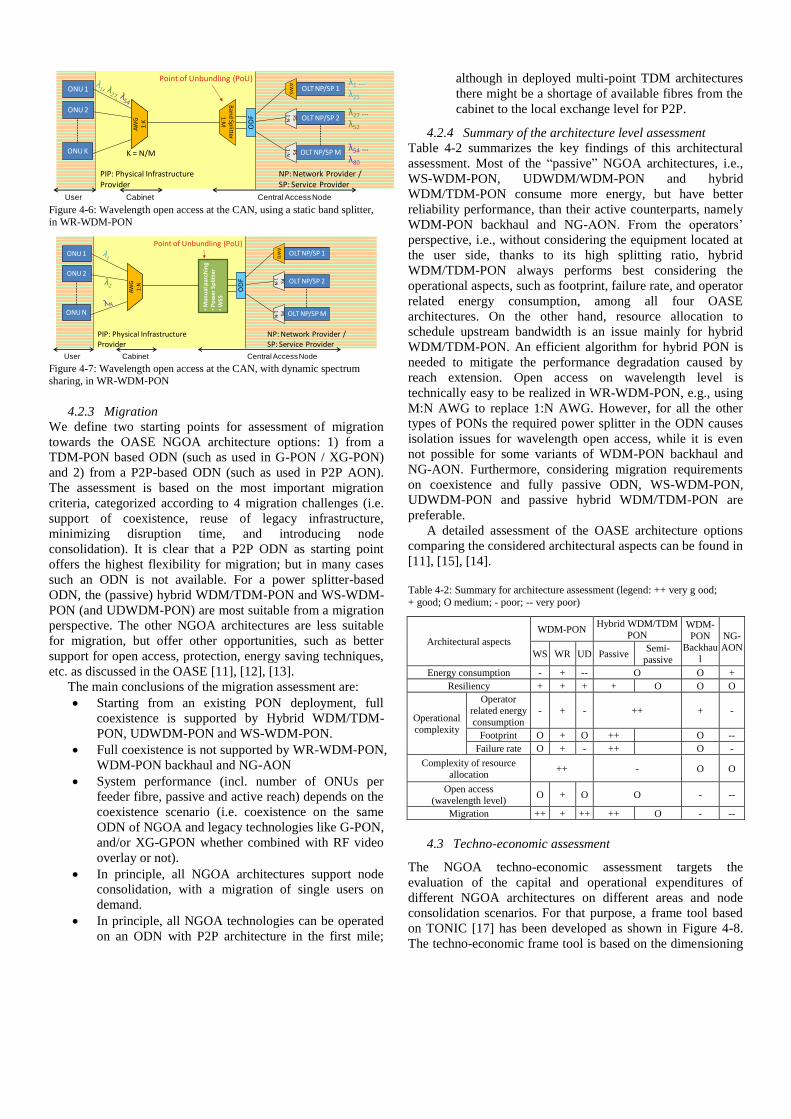
Figures 4-5, 4-6 and 4-7 illustrate wavelength open access
for a WR-WDM-PON. Similar schemes could be applied to
the other PON approaches if the isolation issue caused by
power splitter could be solved properly, while it is not always
possible for active architectures, i.e. WDM backhaul and NG-
AON (see [11] for the details and complete assessment of all
the OASE NGOA architectures). Figure 4-5 shows a typical
example for the multiple feeder fibre based WR-WDM-PON
open access, where N:M AWG is used in cabinet. Figure 4-6
shows an example of wavelength open access with a static
waveband splitter at the central access node as an open access
element. Figure 4-7 shows the general scheme for several
variants with dynamic spectrum sharing between the NPs,
either manually (using a patch panel, followed by an AWG to
(de)multiplex all wavelengths towards the user) or
automatically (using a power splitter or WSS).
It can be noted that additional fibres and/or equipment is
needed to enable open access, which further increases the
overall cost.
PIP: Physical Infrastructure Provider
NP: Network Provider / SP: Service Provider
AWG
1:N
Feeder Fibre
E.g., M=3, N=80
λ1+(M-1) … λ80+(M-1)
λ2 … λ81
λ1 … λ80
OD
F
AWG
M:N
OLT NP/SP 1
OLT NP/SP 2
OLT NP/SP M
ONU 1
ONU 2
ONU N
AW
GP
S1
:NP
S1
:N
Point of Unbundling (PoU)
User Cabinet Central Access Node Figure 4-5: Feeder Fibre based wavelength open access in WR-WDM-PON
Figure 4-3: Footprint per line [mm2]. Figure 4-4: Number of failures per year normalized per line
PIP: Physical Infrastructure Provider
NP: Network Provider / SP: Service Provider
AWG
1:N
Point of Unbundling (PoU)
λ54 … λ80
λ27 … λ52
λ1 … λ25
OD
F
AWG
1:K
OLT NP/SP 1
OLT NP/SP 2
OLT NP/SP M
ONU 1
ONU 2
ONU K
AW
GP
S1
:NP
S1
:N
Band Splitter
1:M
K = N/M
User Cabinet Central Access Node Figure 4-6: Wavelength open access at the CAN, using a static band splitter,
in WR-WDM-PON
NP: Network Provider / SP: Service Provider
AWG
1:N
Point of Unbundling (PoU)O
DF
AWG
1:N
OLT NP/SP 1
OLT NP/SP 2
OLT NP/SP M
ONU 1
ONU 2
ONU N
AW
GP
S1
:NP
S1
:N
•M
anu
al p
atch
ing
•P
ow
er S
plit
ter
•W
SS
PIP: Physical Infrastructure Provider
User Cabinet Central Access Node Figure 4-7: Wavelength open access at the CAN, with dynamic spectrum
sharing, in WR-WDM-PON
4.2.3 Migration
We define two starting points for assessment of migration
towards the OASE NGOA architecture options: 1) from a
TDM-PON based ODN (such as used in G-PON / XG-PON)
and 2) from a P2P-based ODN (such as used in P2P AON).
The assessment is based on the most important migration
criteria, categorized according to 4 migration challenges (i.e.
support of coexistence, reuse of legacy infrastructure,
minimizing disruption time, and introducing node
consolidation). It is clear that a P2P ODN as starting point
offers the highest flexibility for migration; but in many cases
such an ODN is not available. For a power splitter-based
ODN, the (passive) hybrid WDM/TDM-PON and WS-WDM-
PON (and UDWDM-PON) are most suitable from a migration
perspective. The other NGOA architectures are less suitable
for migration, but offer other opportunities, such as better
support for open access, protection, energy saving techniques,
etc. as discussed in the OASE [11], [12], [13].
The main conclusions of the migration assessment are:
Starting from an existing PON deployment, full
coexistence is supported by Hybrid WDM/TDM-
PON, UDWDM-PON and WS-WDM-PON.
Full coexistence is not supported by WR-WDM-PON,
WDM-PON backhaul and NG-AON
System performance (incl. number of ONUs per
feeder fibre, passive and active reach) depends on the
coexistence scenario (i.e. coexistence on the same
ODN of NGOA and legacy technologies like G-PON,
and/or XG-GPON whether combined with RF video
overlay or not).
In principle, all NGOA architectures support node
consolidation, with a migration of single users on
demand.
In principle, all NGOA technologies can be operated
on an ODN with P2P architecture in the first mile;
although in deployed multi-point TDM architectures
there might be a shortage of available fibres from the
cabinet to the local exchange level for P2P.
4.2.4 Summary of the architecture level assessment
Table 4-2 summarizes the key findings of this architectural
assessment. Most of the “passive” NGOA architectures, i.e.,
WS-WDM-PON, UDWDM/WDM-PON and hybrid
WDM/TDM-PON consume more energy, but have better
reliability performance, than their active counterparts, namely
WDM-PON backhaul and NG-AON. From the operators’
perspective, i.e., without considering the equipment located at
the user side, thanks to its high splitting ratio, hybrid
WDM/TDM-PON always performs best considering the
operational aspects, such as footprint, failure rate, and operator
related energy consumption, among all four OASE
architectures. On the other hand, resource allocation to
schedule upstream bandwidth is an issue mainly for hybrid
WDM/TDM-PON. An efficient algorithm for hybrid PON is
needed to mitigate the performance degradation caused by
reach extension. Open access on wavelength level is
technically easy to be realized in WR-WDM-PON, e.g., using
M:N AWG to replace 1:N AWG. However, for all the other
types of PONs the required power splitter in the ODN causes
isolation issues for wavelength open access, while it is even
not possible for some variants of WDM-PON backhaul and
NG-AON. Furthermore, considering migration requirements
on coexistence and fully passive ODN, WS-WDM-PON,
UDWDM-PON and passive hybrid WDM/TDM-PON are
preferable.
A detailed assessment of the OASE architecture options
comparing the considered architectural aspects can be found in
[11], [15], [14].
Table 4-2: Summary for architecture assessment (legend: ++ very g ood;
+ good; O medium; - poor; -- very poor)
Architectural aspects
WDM-PON Hybrid WDM/TDM
PON WDM-
PON
Backhau
l
NG-
AON WS WR UD Passive
Semi-
passive
Energy consumption - + -- O O +
Resiliency + + + + O O O
Operational
complexity
Operator
related energy
consumption
- + - ++ + -
Footprint O + O ++
O --
Failure rate O + - ++
O -
Complexity of resource
allocation ++ - O O
Open access
(wavelength level) O + O O - --
Migration ++ + ++ ++ O - --
4.3 Techno-economic assessment
The NGOA techno-economic assessment targets the
evaluation of the capital and operational expenditures of
different NGOA architectures on different areas and node
consolidation scenarios. For that purpose, a frame tool based
on TONIC [17] has been developed as shown in Figure 4-8.
The techno-economic frame tool is based on the dimensioning

of the selected NGOA architecture for a given scenario. The
dimensioning considers a geometric model of the user
distribution [19] and based on the given penetration curve,
area, and node consolidation scenario, it provides a yearly
‘shopping list’ of the equipment and infrastructure required.
Based on the yearly shopping list, and any required
information on any network component and possible
migration scenario, the cost assessment is performed and
delivers yearly distribution of both, capital and operational
expenditures (CAPEX and OPEX, respectively). In order to
use the cost assessment results in the business model studies,
the Physical Infrastructure Provider (PIP) and Network
Provider (NP) costs have been differentiated. Any cost of
equipment or infrastructure is given as CAPEX, which also
includes any associated installation costs. Fault management
(FM), energy consumption, service provisioning (SP) and
floor space are all considered as OPEX. Due to the complexity
of FM (complete failure reparation process) and SP (adding,
changing and cancelling customer services) processes, they
have been modelled in detailed using BPMN and integrated
within the extended TONIC tool.
4.3.1 Migration scenarios
Among the several studies performed within the OASE
project; this paper presents the cost evaluation of the migration
from an existing traditional optical access network such as
GPON or AON. This is the case for many operators. In this
migration scenario, the investments in terms of infrastructure
and equipment are considered assuming an existing ODN,
which can be used for migration towards the NGOA. The
considered migration scenarios have been summarized in
Table 4-8. The technology migration from G-PON 1:32 or
AON P2P to WR-WDM-PON is not studied in the 7500 node
scenario, because the new architecture requires considerable
ODN upgrade, which is generally not economically feasible.
4.3.1 Migration cost assessment (NNC)
The cost evaluation is presented in terms of Cost Units (CU),
whereby 1 CU equals the cost of one G-PON ONU. Only non-
discounted TCO values are presented. In this way, the real
cost is shown as experienced in the given years. While this
gives a very good view on when to expect which costs in both
CAPEX as well as OPEX.
OPEX
Dimensioning tool
Penetration
CurveArchitecture
Architecture
model
Area
Techno-economic Frame tool
PIP/NP
CAPEX
Node
Consolidation
scenario
Topology
model
Component
DB
Migration
parameters
PIP/NP
Energy
PIP/NP Fault
Management
PIP/NP Floor
space
PIP/NP Service
Provisioning
Figure 4-8: Techno-economic frame tool
Table 4-3: Relation of migration and upgrade scenarios and node
consolidation degrees considered in the cost assessment. The minimum bitrate
is 300Mb/s, although some solutions like HPON80 1:16 support higher
bitrates (500Mb/s).
Migration/upgrade scenarios NNC ANC
From To Referred as
G-PON 1:32 G-PON1:8 G-PON32G-PON8 Yes Yes
XG-PON1:32 XG-PON1:16 XG-PON32XG-PON16 Yes Yes
G-PON1:32 HPON40 1:32 G-PON32HPON40 Yes Yes
G-PON1:32 HPON80 1:16 G-PON32HPON80 Yes Yes
G-PON1:32 WS WDM PON 64 G-PON32WSWDM64 Yes Yes
G-PON1:32 WS WDM PON 128 G-PON32WSWDM128 Yes Yes
AON P2P WR-WDM-PON 80 AONP2PWRWDM80 N/A Yes
AON P2P AON P2P AONP2P Yes N/A
G-PON 1:32 WR-WDM-PON 80 G-PON32WRWDM80 N/A Yes
G-PON 1:32 UDWDM PON G-PON32UDWDM Yes Yes
AON
ActiveStar (AS)
AS AON
WDM Backhaul AS AONWDMBackhaul Yes Yes
The first cost comparison shows the average from 2020
(migration year) to 2030 of the non-discounted TCO per user,
taking into account the users connected in each year (based on
the penetration curve). Figure 4-12 distinguishes the CAPEX
contribution (in blue) from the OPEX contribution (in red) for
dense urban (top) and rural (bottom) areas without node
consolidation. The scenario – realistic for one geographical
area – is traditional optical access network running from 2010
to 2019, and a migration starting in 2020 and lasting 1 year, so
that at the end of 2020 all users are connected to the NGOA,
and the traditional access network can be switched off. It can
be observed that the relative cost among the architectures is
the same, independently of the area type. The upgrade of
existing access networks (AON P2P, G-PON and XG-PON)
appear to have the lowest cost, since they can reuse most of
the existing ODN and equipment (e.g., ONUs instead of
replacing it by NGOA ONUs). As also foreseen by the
component and system cost overview, UDWDM-PON appears
as the most expensive solution, driven by the high cost OLT
and less reliable components.
4.3.2 Migration cost assessment with node consolidation
Operators are weighing the possibility of implementing node
consolidation to reduce the number of central offices to be
maintained and the aggregation network cost (since the access
network reaches up to the metro access node, which is further
away from the traditional access node). In this case, the
average TCO per connected user has been evaluated for dense
urban and rural areas as shown in Figure 4-13. It can be
observed that, in contrast to the first migration study in a non-
consolidation scenario, the relative costs among the
architectures depend on the considered area. In Dense Urban
areas, the upgrade of XG-PON or the connection of AS AON
with a WDM Backhaul towards the aggregation network
shows the lowest cost due to the reuse of legacy network and
infrastructure resources. When running G-PON, the less costly
migration is towards Hybrid WDM/TDM-PON. Migration
from AON-P2P to WR-WDM-PON appears very costly.
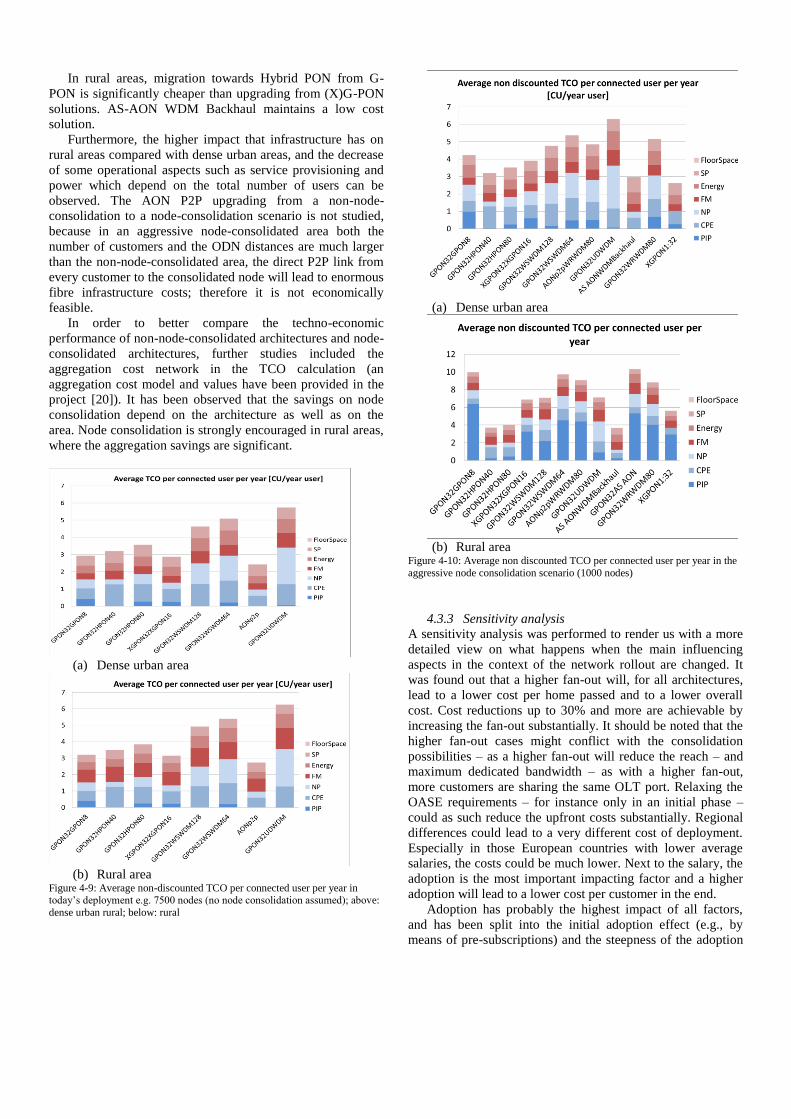
In rural areas, migration towards Hybrid PON from G-
PON is significantly cheaper than upgrading from (X)G-PON
solutions. AS-AON WDM Backhaul maintains a low cost
solution.
Furthermore, the higher impact that infrastructure has on
rural areas compared with dense urban areas, and the decrease
of some operational aspects such as service provisioning and
power which depend on the total number of users can be
observed. The AON P2P upgrading from a non-node-
consolidation to a node-consolidation scenario is not studied,
because in an aggressive node-consolidated area both the
number of customers and the ODN distances are much larger
than the non-node-consolidated area, the direct P2P link from
every customer to the consolidated node will lead to enormous
fibre infrastructure costs; therefore it is not economically
feasible.
In order to better compare the techno-economic
performance of non-node-consolidated architectures and node-
consolidated architectures, further studies included the
aggregation cost network in the TCO calculation (an
aggregation cost model and values have been provided in the
project [20]). It has been observed that the savings on node
consolidation depend on the architecture as well as on the
area. Node consolidation is strongly encouraged in rural areas,
where the aggregation savings are significant.
(a) Dense urban area
(b) Rural area
Figure 4-9: Average non-discounted TCO per connected user per year in today’s deployment e.g. 7500 nodes (no node consolidation assumed); above:
dense urban rural; below: rural
(a) Dense urban area
(b) Rural area
Figure 4-10: Average non discounted TCO per connected user per year in the
aggressive node consolidation scenario (1000 nodes)
4.3.3 Sensitivity analysis
A sensitivity analysis was performed to render us with a more
detailed view on what happens when the main influencing
aspects in the context of the network rollout are changed. It
was found out that a higher fan-out will, for all architectures,
lead to a lower cost per home passed and to a lower overall
cost. Cost reductions up to 30% and more are achievable by
increasing the fan-out substantially. It should be noted that the
higher fan-out cases might conflict with the consolidation
possibilities – as a higher fan-out will reduce the reach – and
maximum dedicated bandwidth – as with a higher fan-out,
more customers are sharing the same OLT port. Relaxing the
OASE requirements – for instance only in an initial phase –
could as such reduce the upfront costs substantially. Regional
differences could lead to a very different cost of deployment.
Especially in those European countries with lower average
salaries, the costs could be much lower. Next to the salary, the
adoption is the most important impacting factor and a higher
adoption will lead to a lower cost per customer in the end.
Adoption has probably the highest impact of all factors,
and has been split into the initial adoption effect (e.g., by
means of pre-subscriptions) and the steepness of the adoption
curve. Increases in the initial adoption lead to the most
substantial decrease in the cost per subscription year. The
effect of having a faster adoption continues to be very
important.
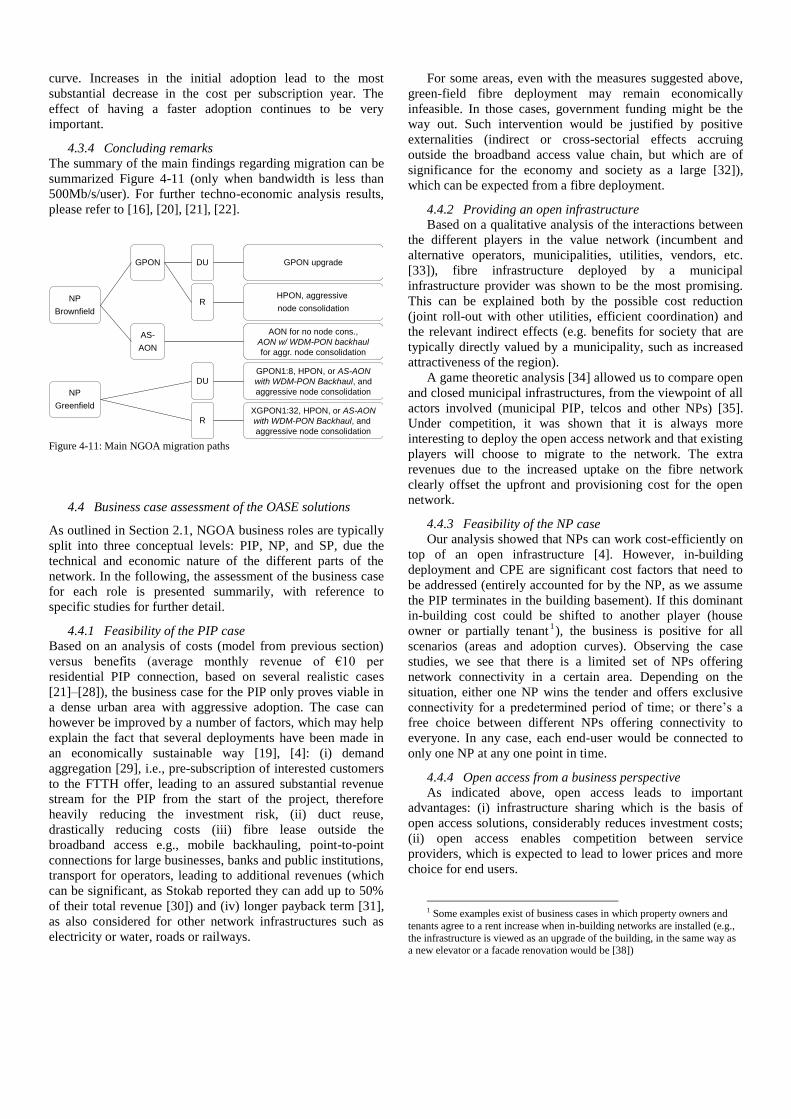
4.3.4 Concluding remarks
The summary of the main findings regarding migration can be
summarized Figure 4-11 (only when bandwidth is less than
500Mb/s/user). For further techno-economic analysis results,
please refer to [16], [20], [21], [22].
GPON upgrade
HPON, aggressive
node consolidation
AON for no node cons.,
AON w/ WDM-PON backhaul
for aggr. node consolidation
GPON1:8, HPON, or AS-AON
with WDM-PON Backhaul, and
aggressive node consolidation
XGPON1:32, HPON, or AS-AON
with WDM-PON Backhaul, and
aggressive node consolidation
NP
Brownfield
NP
Greenfield
GPON
AS-
AON
DU
R
DU
R
Figure 4-11: Main NGOA migration paths
4.4 Business case assessment of the OASE solutions
As outlined in Section 2.1, NGOA business roles are typically
split into three conceptual levels: PIP, NP, and SP, due the
technical and economic nature of the different parts of the
network. In the following, the assessment of the business case
for each role is presented summarily, with reference to
specific studies for further detail.
4.4.1 Feasibility of the PIP case
Based on an analysis of costs (model from previous section)
versus benefits (average monthly revenue of €10 per
residential PIP connection, based on several realistic cases
[21]–[28]), the business case for the PIP only proves viable in
a dense urban area with aggressive adoption. The case can
however be improved by a number of factors, which may help
explain the fact that several deployments have been made in
an economically sustainable way [19], [4]: (i) demand
aggregation [29], i.e., pre-subscription of interested customers
to the FTTH offer, leading to an assured substantial revenue
stream for the PIP from the start of the project, therefore
heavily reducing the investment risk, (ii) duct reuse,
drastically reducing costs (iii) fibre lease outside the
broadband access e.g., mobile backhauling, point-to-point
connections for large businesses, banks and public institutions,
transport for operators, leading to additional revenues (which
can be significant, as Stokab reported they can add up to 50%
of their total revenue [30]) and (iv) longer payback term [31],
as also considered for other network infrastructures such as
electricity or water, roads or railways.
For some areas, even with the measures suggested above,
green-field fibre deployment may remain economically
infeasible. In those cases, government funding might be the
way out. Such intervention would be justified by positive
externalities (indirect or cross-sectorial effects accruing
outside the broadband access value chain, but which are of
significance for the economy and society as a large [32]),
which can be expected from a fibre deployment.
4.4.2 Providing an open infrastructure
Based on a qualitative analysis of the interactions between
the different players in the value network (incumbent and
alternative operators, municipalities, utilities, vendors, etc.
[33]), fibre infrastructure deployed by a municipal
infrastructure provider was shown to be the most promising.
This can be explained both by the possible cost reduction
(joint roll-out with other utilities, efficient coordination) and
the relevant indirect effects (e.g. benefits for society that are
typically directly valued by a municipality, such as increased
attractiveness of the region).
A game theoretic analysis [34] allowed us to compare open
and closed municipal infrastructures, from the viewpoint of all
actors involved (municipal PIP, telcos and other NPs) [35].
Under competition, it was shown that it is always more
interesting to deploy the open access network and that existing
players will choose to migrate to the network. The extra
revenues due to the increased uptake on the fibre network
clearly offset the upfront and provisioning cost for the open
network.
4.4.3 Feasibility of the NP case
Our analysis showed that NPs can work cost-efficiently on
top of an open infrastructure [4]. However, in-building
deployment and CPE are significant cost factors that need to
be addressed (entirely accounted for by the NP, as we assume
the PIP terminates in the building basement). If this dominant
in-building cost could be shifted to another player (house
owner or partially tenant1), the business is positive for all
scenarios (areas and adoption curves). Observing the case
studies, we see that there is a limited set of NPs offering
network connectivity in a certain area. Depending on the
situation, either one NP wins the tender and offers exclusive
connectivity for a predetermined period of time; or there’s a
free choice between different NPs offering connectivity to
everyone. In any case, each end-user would be connected to
only one NP at any one point in time.
4.4.4 Open access from a business perspective
As indicated above, open access leads to important
advantages: (i) infrastructure sharing which is the basis of
open access solutions, considerably reduces investment costs;
(ii) open access enables competition between service
providers, which is expected to lead to lower prices and more
choice for end users.
1 Some examples exist of business cases in which property owners and
tenants agree to a rent increase when in-building networks are installed (e.g.,
the infrastructure is viewed as an upgrade of the building, in the same way as a new elevator or a facade renovation would be [38])

However, the presence of different actors at different
layers also induces some additional costs. We have modelled
the open access interfaces and calculated the costs in terms of
extra equipment, as well as management, process and business
interfaces. The combination of these equipment related costs,
together with the management and process related costs form
the production costs for the open offer, the business related
costs are the so-called transaction costs [36]. Overall,
additional costs induced by the cooperation between actors in
an open access scenario can amount to up to 20% of the yearly
PIP revenues, and will as such affect the profitability of this
player [4].
From the perspective of transaction-cost reduction, there is
a clear potential gain in promoting standardization, both at
technical and business levels. There should be a coordinating
rule set in place. This agreement should include all relevant
technical (incl. e.g., resource allocation) processes, as well as
business aspects / interfaces required for providing services to
the customers. The rule set should be monitored and
coordinated by an independent party; it should definitely not
lie with one of several NPs offering service in the same area.
The coordinating party can be the PIP or another independent
(public) entity.
4.4.5 Summary of business insights
Based on the three conceptual levels identified (PIP, NP, SP),
we have evaluated the business cases of the PIP and the NP. In
several real deployments, the business case for the PIP is
viable, because of demand aggregation, duct reuse, the
availability of additional revenues and by considering longer
payback terms. The business case for the NP is positive if the
dominant in-building cost can be shifted away. An open
infrastructure will be an enabler for competition; however, the
additional costs related this opening is to be considered
carefully. For further details, please refer to [37].
5. CONCLUSIONS AND RECOMMENDATIONS
Based on the technical, architectural and techno-economic
studies, as well as the assessment under business related
aspects, the following conclusions with respect to the
considered NGOA system concepts can now be drawn.
5.1 NGOA system recommendation enabling node
consolidation
Due to a pure technical or even architectural assessment of
the different proposed NGOA concepts, it is not possible to
single out a main system contender for NGOA. Even
introducing operational aspects like power consumption, floor
space or analysing the technical impact of system failures
doesn’t result in a clear favourite. The technology and
architectural driven analysis has clearly shown that almost
every initial requirement can be fulfilled, if additional
components like reach extenders, more fibres, or improved
technical functionalities such as superior receiver sensitivities,
or additional wavelength bands can be embraced in the
technical system evolutions. Also the studies of open access at
the wavelength level reveal that this can be achieved with
almost every WDM concept considered, if additional
components or fibres are introduced. However, all of these
technological enhancements are associated with an additional
system cost, as will be shown in this summary.
From a pure technology perspective, the maturity level of
the different technologies and associated system concepts was
also addressed and a technology roadmap (shown in Figure
5-1) was established. This roadmap is based on potential time
to market and availability of key components such as tuneable
lasers, reflective transmitters, wavelength selective receivers,
tuneable filters and coherent receivers, burst mode receivers,
analogue-to-digital converters (ADC), digital-to-analogue
converters (DAC), dispersion compensation and passive
wavelength selective devices, and reach extension
technologies as well as switching technologies. The market
availability strongly depends on demand requests from
network operators.
2012 2013 2014 2015
GPON
AON XG-PON1
WDM-PON
λ-reuse (demo)
WDM-PON
(RSOA)
WDM/TDMA-PON
(NG-PON2)
WDM-PON
(tunables)
WDM-PON
Backhaul
UDWDM-
PON
OFDM-
PON
~ ~
2011
Figure 5-1: NGOA technology roadmap
Our conclusions are somewhat in line with the current
focus of the FSAN (Full Service Access Network): a so called
TWDM approach which is a hybrid TDM/WDM PON
approach with a limited number of wavelengths of between
four to ten channels.
Specifically, based on the final techno-economic analysis
of the different NGOA concepts with the key assumption of a
high guaranteed bandwidth during the busy hour of 300 Mb/s
we conclude the following.
For a brownfield starting from a GPON or AON P2P
deployment, in a no-node consolidation scenario still
GPON/XGPON or AON P2P is the preferred low-cost
solution, depending on the start scenario for the infrastructure:
if one starts with a P2MP infrastructure then GPON or
XGPON will be the cost optimum
if one starts with a P2P infrastructure then AON P2P
gives the lowest costs, however, there is an additional
initial investment for a AON P2P infrastructure in
contrast to a P2MP.
This holds independent of the area type, e.g. dense urban,
urban or rural.
UDWDM is always the most cost intense variant to
migrate to, due to the high ONU cost.
Hybrid WDM/TDM PON is the lowest cost NGOA
option, using WDM-only as another scalability layer
WR- and WS-WDM are in-between with respect to
overall cost.
On the other hand, if in the brownfield starting from a
GPON or AON P2P deployment, a node consolidation
scenario deployment is
AON-P2P has high cost in node consolidation, and needs
to be migrated to a AON-AS solution, where a first
aggregation switch is at the cabinet level or in one of
today’s local exchanges.
Migration towards WDM concepts using WDM as the
access technology shows the highest cost in all
considered areas.
XGPON shows lowest cost in dense urban areas
followed by a hybrid WDM/TDM-PON for migration
from GPON due to reduced splitting for a high
guaranteed data-rate.
In rural areas, due to the longer reach the active remote
node concepts (WDM backhaul) also enable a low cost
AON-AS concept at similar cost like the migration of
GPON towards a WDM/TDM-PON; XGPON is not the
preferred choice in long reach (rural areas) due to
increased infrastructure costs due to low sharing
compared to WDM/TDM and WDM-backhaul concepts.
Overall cost savings for hybrid WDM/TDM-PON and
WDM backhaul are mainly due to cost savings in the
aggregation network due to improved utilization of
resources and lower cost per bit due to faster utilization
of higher bit rate interfaces offering lower cost per bit.
For a greenfield with GPON or AON-P2P deployment, in
a node consolidation scenario
AON P2P has very high initial infrastructure cost,
therefore a P2MP infrastructure is the preferred choice
For moderate data-rates (< 300 Mb/s) pure GPON or
XGPON with reduced splitting is the preferred choice
WDM/TDM-PON concepts show the lowest
infrastructure costs for a high guaranteed data rate
In summary, from this cost study it can be seen that, for
sustained bit rates up to 500 Mb/s, the NGOA concepts based
on dedicated-wavelength customer access (such as UDWDM,
WR- or WS-WDM) are outperformed by the shared-
wavelength approaches (such as GPON, XGPON or AON
AS), with WDM backhaul allowing for higher aggregation.
For GPON and XGPON the sharing takes place in the access
infrastructure itself due to the TDM mechanism; in AON-AS
the sharing takes place in the switch located in the field.
Therefore, in the context of the residential mass market, WDM
from an economical point of view makes only sense as an
additional overlay layer such as in the Hybrid WDM/TDM-
PON concepts, or WDM-backhaul concepts where WDM is
purely used for increasing the scalability but not for
addressing the residential customer. This conclusion is in good
agreement with the focus of FSAN on WDM/TDM-PON
concepts, specifically TWDM. In general it has been shown
that node consolidation enables cost savings that mainly occur
in the aggregation network due to better equipment utilisation.
From the investigated business concepts, on the other
hand, increased operational complexity and additional
requirements for coordination are unfavourable. Especially,
from an open access perspective, WDM approaches with
unbundling on wavelength level are more difficult in terms of
business implementation, than as compared with open access
at the fibre level or bit stream access.
5.2 Strategic and policy related recommendations
Based on our findings concerning the economic viability for
the different actors involved in an NGOA deployment, we
have formulated some recommendations for policy makers.
From an open access point of view the preferred way of
opening up a fibre-based access network remains either
at the passive layer (fibre lease), or bit-stream open
access, as basically used today. Infrastructure-based
competition (i.e. parallel fibre networks, one for each
competitor) is very cost inefficient, and is difficult to
implement in a smooth and effective way at the end
user’s premises. Although in principle very interesting,
open access at the wavelength layer (WDM) as an access
technology for residential customers (e.g. a single
wavelength per customer) results in significant additional
system cost, further burdening the business case for any
Network Provider. More importantly, it is not obvious
who would take care of the WDM splitters and the
wavelength management: currently PIPs are reluctant to
deal with that, while coordination between competing
NPs introduces increased complexity and cost.
The business case for the PIP remains challenging, even
when using measures such as demand aggregation and
duct reuse. However, significant extra revenue can be
generate by offering wholesale dark fibre lease to non-
telecom actors. We observed in some cases studied that
this can be up to 50% of total revenue, hence turning the
business case from negative to viable. Moreover, a lot of
indirect or cross-sectorial effects can be expected from a
fibre deployment. This could be an additional stimulus
for national, regional or municipal governments to
support investment. In this way public support (in the
form of state-aid or other) may be desirable.
In order for the above point to hold, the construction of
passive infrastructure is to be shared on an equal and
non-discriminatory basis. If the PIP is required to share
the passive infrastructure, or the PIP is the only part of
the value chain taken over by a single player, the
deployed infrastructure should be technology agnostic;
meaning that fibre consolidation should take place at
flexibility points where fibres can be connected, and in
which both active and passive equipment can placed.
This is important to maximise the potential wholesale
customer base for a PIP (some NPs may run a PON,
some an AON, some hybrids thereof, and the passive
infrastructure should be built so that all solutions are
supported.) In consequence, higher costs have to be
recouped as well, e.g. in the case of the cabinet flexibility
point, calculations have shown that significant additional
costs are incurred and all involved parties need to share
these in a fair manner.
Public financial support should be focused on the PIP
layer. Deployment of the physical infrastructure is
mainly CAPEX driven, in which case support may be
granted in terms of long-term loans, or over long
depreciation periods, in order to increase the investment
horizon.
For the NP, in-house deployment and CPE are significant
cost factors. Business models that allow the allocation of
these costs to house- or home-owners should receive
greater attention. However, public financial support to
the NP is unadvisable in the long term.
In summary, this document gives an overview of the potential
NGOA solutions examined in the OASE project, enabling
optical access network technologies, architecture principles
and related economics, while taking CAPEX and OPEX into
account. Key principles of the studies within OASE have
included future network evolution towards node consolidation
in the access network and understanding the impact of new
business models on network architectures.
6. ACKNOWLEDGEMENT
The research leading to these results has received funding
from the European Union's Seventh Framework Programme
under grant agreement n° 249025 (ICT-OASE).
REFERENCES
[1] Analysis Mason, report for OFCOM, “Fibre capacity limitations in access networks”, January 2010
[2] OASE project deliverable D2.1 “Requirements for European next- generation optical access networks”, 2010.
[3] OASE project deliverable D2.2 “Consolidated requirements for European next- generation optical access networks”, 2012.
[4] OASE project deliverable D6.3 “Value network evaluation”, 2012.
[5] EU FP7 IP OASE, Deliverable D4.1, “Survey of Next-Generation Optical Access System Concepts”, 2010
[6] EU FP7 IP OASE, Deliverable D4.2, “Technical Assessment and Comparison of Next-Generation Optical Access System Concepts”, 2011
[7] K. Grobe et al.: Cost and Energy Consumption Analysis of Advanced WDM-PONs, IEEE Comm. Mag., Vol. 49, No. 2, pp. S25-S32
[8] K. Grobe et al.: Combined Reach, Client-Count, Power-Consumption, and Cost Analysis of WDM-based Next-Generation PON, ECOC 2011, Geneva, September 2011, paper We.10.P1.113
[9] R. Huelsermann et al.: Combined OLT Form-Factor and Power-Consumption Analysis for WDM-based Next-Generation PON, Proc. 13th ITG-Fachtagung Photonische Netze, Leipzig, May 2012, pp. 132-136
[10] M. Roppelt et al.: Tuning of an SG-Y Branch Laser for WDM-PON, OFC 2012, L.A., March 2012
[11] OASE project deliverable D3.2 “Description and assessment of the architecture options”, 2012.
[12] J. Chen, “Efficient Resiliency Mechanisms for Next Generation Passive Optical Networks”, (invited), 9th International Conference on Information, Communications and Signal Processing (ICICS), December 2013.
[13] A. Dixit, J. Chen, M. Mahloo, B. Lannoo, D. Colle and M. Pickavet, “Efficient Protection Schemes for Hybrid WDM/TDM Passive Optical Networks”, IEEE International Conference on Communications (ICC), New Trends in Optical Networks Survivability, June 2012.
[14] OASE project deliverable D3.4 “Migration paths”, 2012.
[15] OASE project deliverable D3.3 “Co-operation models”, 2012.
[16] OASE project deliverable D5.3 “Techno-economic assessment studies”, December 2012.
[17] http://www-nrc.nokia.com/tonic/
[18] OASE project deliverable D3.1 “Overview and assessment of existing optical access network architectures”, 2012.
[19] OASE project deliverable D5.1 Overview of Methods and Tools” October 2010.
[20] OASE project deliverable D5.2 “Process modelling and first version of TCO evaluation tool” December 2011.
[21] C. Mas Machuca, S. Krauß, K. Casier, ”Fault Management and Service Provisioning Process Model of Next Generation Access Networks” International Conference on Network and Service Management, Paris, France, October 2011.
[22] C. Mas Machuca, K. Wang, S. Verbrugge, K. Casier, M. Kind, R. Hülsermann, S. Krauß “Cost-based assessment of NGOA architectures and its impact in the business model” CTTE 2012.
[23] Bundesnetzagentur, “Pressemitteillung: Bundesnetzagentur gibt endgültige Genehmigung der Entgelte für die „letzte Meile“ bekannt.” 17/06/2011
[24] OPTA, “Besluit Wholesale Price Cap 2009-2011 (WPC-IIa besluit),” OPTA/AM/2009/203507, December 16, 2009.
[25] A. Broberg, Stockhom IT-infrastructure, workshop presentation. Stokab, Stockholm, February 2011.
[26] Reggefibre, “Annex: Tarieven bij Overeenkomst inzakegebruik van passieve glasvezel-aansluitnetwerken.” Version 2.2 (no longer available online).
[27] Telecompaper, “Reggefibre, KPN to adjust wholesale tariffs,” (31/12/2012). Available: http://www.telecompaper.com/news/reggefibre-kpn-wholesale-to-adjust-fibre-tariffs--916449.
[28] Reggefibre, “Annex: Tarieven bij Overeenkomst inzakegebruik van passieve glasvezel-aansluitnetwerken.” Version 2.4. Available: http://www.eindelijkglasvezel.nl/tl_files/documents/Generiek%20ODF%20contract/Annex%20Tarieven%20bij%20ODF%20overeenkomst%20Reggefibre%20v2%204.pdf.
[29] W. Burger, “The Reggefibre model. Key elements of Reggefibre’s strategy in the Netherlands,” 2012.
[30] A. Broberg, “Challenges for an open physical infrastructure provider,” Workshop presentation at the ECOC conference, Amsterdam, the Netherlands, September 2012.
[31] C. Eijgenraam. C. Koopmans, P. Tang, A. Verster, “Evaluatie van Infrastruurprojecten. Leidraad voor Kosten-Batenanalyse,” Den Haag: CPB, 2000.
[32] M. Forzati, C. Mattsson, K. Wang, C. P. Larsen, The uncaptured values of FTTH (invited), proceedings of the International Conference on Transparent Optical Networks (ICTON), Stockholm, 2011.
[33] Arcade, J. and Godet, M., "Structural Analysis with the MICMAC Method & Actors' Strategy with MACTOR Method," American Council for the United Nations University: Millenium Project, Washington, D.C. (1999).
[34] Slantchev, B. L. (2008). Game Theory : Dominance , Nash Equilibrium , Symmetry.
[35] Mathieu Tahon, Sofie Verbrugge, Didier Colle, Mario Pickavet , Valuing Flexibility in the Migration to Flexgrid NEtworks, submitted to OFC/NFOEC2013
[36] Williamson O. Williamson (1981) The Economics of Organization: The Transaction Cost Approach, Am. J. of Sociology, 87(3)].
[37] OASE project deliverable D6.2 “Market demands and revenues”, 2011.
[38] M. Forzati, Socio-economic effects of FTTH/FTTx in Sweden (invited), proceedings of the International Conference on Transparent Optical Networks (ICTON), Warwick, UK, 2-7 July 2012