Embed Size (px)
Citation preview
Old Dominion UniversityODU Digital Commons
CCPO Publications Center for Coastal Physical Oceanography
2018
Integrated Ocean, Earth, and AtmosphericObservations for Resilience Planning in HamptonRoads, VirginiaJon Derek LoftisCollege of William & Mary
Molly MitchellCollege of William & Mary
Larry AtkinsonOld Dominion University, [email protected]
Ben HamlingtonOld Dominion University, [email protected]
Tom AllenOld Dominion University, [email protected]
See next page for additional authors
Follow this and additional works at: https://digitalcommons.odu.edu/ccpo_pubs
Part of the Environmental Sciences Commons, Hydrology Commons, and the Oceanographyand Atmospheric Sciences and Meteorology Commons
This Article is brought to you for free and open access by the Center for Coastal Physical Oceanography at ODU Digital Commons. It has beenaccepted for inclusion in CCPO Publications by an authorized administrator of ODU Digital Commons. For more information, please [email protected].
Repository CitationLoftis, Jon Derek; Mitchell, Molly; Atkinson, Larry; Hamlington, Ben; Allen, Tom; Forrest, David; Updyke, Teresa; Tahvildari, Navid;Bekaert, David; and Bushnell, Mark, "Integrated Ocean, Earth, and Atmospheric Observations for Resilience Planning in HamptonRoads, Virginia" (2018). CCPO Publications. 251.https://digitalcommons.odu.edu/ccpo_pubs/251
Original Publication CitationLoftis, J. D., Mitchell, M., Atkinson, L., Hamlington, B., Allen, T. R., Forrest, D., . . . Bushnell, M. (2018). Integrated ocean, earth, andatmospheric observations for resilience planning in Hampton Roads, Virginia. Marine Technology Society Journal, 52(2), 68-83.doi:10.4031/MTSJ.52.2.8
AuthorsJon Derek Loftis, Molly Mitchell, Larry Atkinson, Ben Hamlington, Tom Allen, David Forrest, TeresaUpdyke, Navid Tahvildari, David Bekaert, and Mark Bushnell
This article is available at ODU Digital Commons: https://digitalcommons.odu.edu/ccpo_pubs/251
P A P E R
Integrated Ocean, Earth, and AtmosphericObservations for Resilience Planningin Hampton Roads, VirginiaA U T H O R SJon Derek LoftisMolly MitchellCenter for Coastal ResourcesManagement, Virginia Instituteof Marine Science,College of William & Mary
Larry AtkinsonBen HamlingtonCenter for Coastal PhysicalOceanography, Old DominionUniversity
Thomas R. AllenDepartment of PoliticalScience and Geography,Old Dominion University
David ForrestDepartment of Physical Sciences,Virginia Institute of Marine Science,College of William & Mary
Teresa UpdykeCenter for Coastal PhysicalOceanography, Old DominionUniversity
Navid TahvildariDepartment of Civil andEnvironmental Engineering,Old Dominion University
David BekaertJet Propulsion Laboratory,California Institute of Technology
Mark BushnellCoastalObsTechServices LLC,Virginia Beach, Virginia
A B S T R A C TBuilding flood resilience in coastal communities requires a precise under-
standing of the temporal and spatial scales of inundation and the ability to detectand predict changes in flooding. In Hampton Roads, the Intergovernmental PilotProject’s Scientific Advisory Committee recommended an integrated network ofocean, earth, and atmospheric data collection from both private and public sectororganizations that engage in active scientific monitoring and observing. Since itsestablishment, the network has grown to include monitoring of water levels, landsubsidence, wave measurements, current measurements, and atmospheric con-ditions. High-resolution land elevation and land cover data sets have also beendeveloped. These products have been incorporated into a number of portalsand integrated tools to help support resilience planning. Significant challengesto building the network included establishing consistent data standards acrossorganizations to allow for the integration of the data into multiple, unique prod-ucts and funding the expansion of the network components. Recommendations tothe network development in Hampton Roads include the need to continue to sup-port and expand the publicly available network of sensors; enhance integrationbetween ocean, earth, and atmospheric networks; and improve shallow water ba-thymetry data used in spatial flooding models.Keywords: sensor, flood, water level, monitoring, StormSense
Introduction
The Hampton Roads, Virginia,area has experienced increasing vul-nerability to flooding due to highrates of relative sea level rise (Ezer &Atkinson, 2014) and a long historyof human waterfront settlement. Formany years, flood management strat-egy has focused on reducing vulner-abilities by addressing impactedinfrastructure while maintaining thestatus quo (i.e., elevating houses toprevent flood damage but still allow-ing people to live in the same places).However, the rising social and eco-
nomic costs from increased flood fre-quency and the recognition that sealevel rise will exacerbate these costs(Boon & Mitchell, 2015) have ledto the understanding that the govern-ment needs to address regional resil-ience, rather than continue with thead hoc patching of vulnerabilities.
A key component of resiliencyplanning is the recognition that man-agement strategies should address thenonlinear nature of changing systemsas well as the inherent uncertainty inour understanding of it (Folke, 2006).Effectively incorporating predictions
68 Marine Technology Society Journal
of near-term and future flooding withmitigating strategies into resiliencyplanning requires a precise under-standing of the temporal and spatialscales of current flooding, coastal dy-namics, and precipitation patterns(Boon et al., 2018). This level ofdetail allows for an inventory of infra-structure currently at risk, the develop-ment of flood early warning systems(reducing current vulnerabilities) andhigh-resolution hydrodynamic models(increasing our resilience to futurestorm surge and sea level rise), and im-proved predictions of future risk.
Collaborative planning is criticalin areas (such as Hampton Roads)where flood-prone regions cross juris-dictional boundaries. Locality-specificadoption of different strategies canlead to a coastline without cohesiveprotection measures and where thefailure of protection measures in onecommunity may impact the successof protection measures in an adjacentcommunity. Collaborative planningefforts require cooperation on multi-ple levels, including the generationof seamless data sets. In HamptonRoads, the Intergovernmental PilotProject (IPP; http://digitalcommons.odu.edu/odurc_pilot/) was establishedto coordinate a “whole of government”approach to regional resiliency planning(Toll, 2018). Their three key rec-ommendations were (1) to establish,maintain, and institutionalize rela-tionships to support collaboration andinformation sharing; (2) to standardizemethods for integrating and shar-ing data; and (3) to apply the “Wholeof Government and Community”approach to the watershed level asopposed to jurisdictional boundaries(Steinhilber et al., 2016).
Within the IPP, a Scientific Advi-sory Committee (SAC) comprisingrepresentatives from both private
and public sector organizations en-gaged in a review of active scientificmonitoring and observing within theHampton Roads area. This commit-tee is responsible for ensuring thatmember organizations work togetherto integrate a network of ocean,earth, and atmospheric data collec-tion. This network includes privatecompanies; academic institutions;and local, state, and federal govern-ment organizations. Although theIPP’s efforts have technically been con-cluded, integrated collaborations onthis issue continue under three maininitiatives, including the following:1. the Commonwealth Center for
Recurrent Flooding Resiliency(CCRFR; http://www.floodingresiliency.org/), a state-fundedvirtual research center establishedbetween the Virginia Institute ofMarine Science (VIMS), the OldDominion University, and theVirginia Coastal Policy Center atthe Wi l l i am and Mary LawSchool and serves as a source ofscientific, socioeconomic, legal,and policy analyses aimed atbuilding Virginia ’s resiliencyagainst flooding;
2. the Climate Change and Sea LevelRise Initiative and Old DominionUniversity’s Resilience Collabora-tive (http://www.odu.edu/impact/initiatives/resiliencecollaborative);and
3. the Hampton Roads AdaptationForum supported by Virginia SeaGrant and the Hampton RoadsPlanning District Commission(h t t p s : / / s i t e s .wp . odu . e du /HRAdaptationForum/). Betweenthese groups and the region, thekey chal lenge in the col lab-oration, thus far, has been toensure that data standards areconsistent across organizations to
allow for the integration of thedata into multiple products withunique management focuses. Inthis paper, we document all thepublicly available environmentalobservations in the region andthe resulting models and portalsfor efforts to integrating theobservations into formats usefulfor resiliency planning.
Observation Networksand Integration
Many different companies, aca-demic institutions, federal, common-wealth, and city governments makeenvironmental observations in the re-gion. There is also much collabora-tion between these organizations tofacilitate dissemination and archivingof the data. The main types of obser-vations are water level, subsidence, topo-graphic, wave/current measurements,and weather observations. All of theseobservations are critical for the model-ing of past and future precipitation-and wave-driven flood impacts thatfeed into resilience planning. Coverageof the different observation systemsvaries, creating unique challenges forthe integration of the data into robusttools. The extent and format of eachobserving system are described in thissection. In addition, nascent effortsto develop citizen science observationsare ongoing, including a recent crowd-sourcing effort using a mobile applica-tion developed in Norfolk called “sealevel rise” to measure a king tideevent in early November 2017. Spon-sored by the nonprofit WetlandsWatch and promoted by the regionalVirginian-Pilot newspaper, among othermedia partners, the “Catch the King”event portends increased awareness andpotential scientific observations from
March/April 2018 Volume 52 Number 2 69
the community that could provevaluable to mapping and model vali-dation as well as public awareness(Loftis, 2017). This section’s sub-sections outline all known availableobservations for (1) water level, (2) sub-sidence, (3) elevations, (4) waves, (5) cur-rents, (6) atmospheric data, and(7) Gulf Stream dynamics.
Water Level ObservationsThere are many different types of
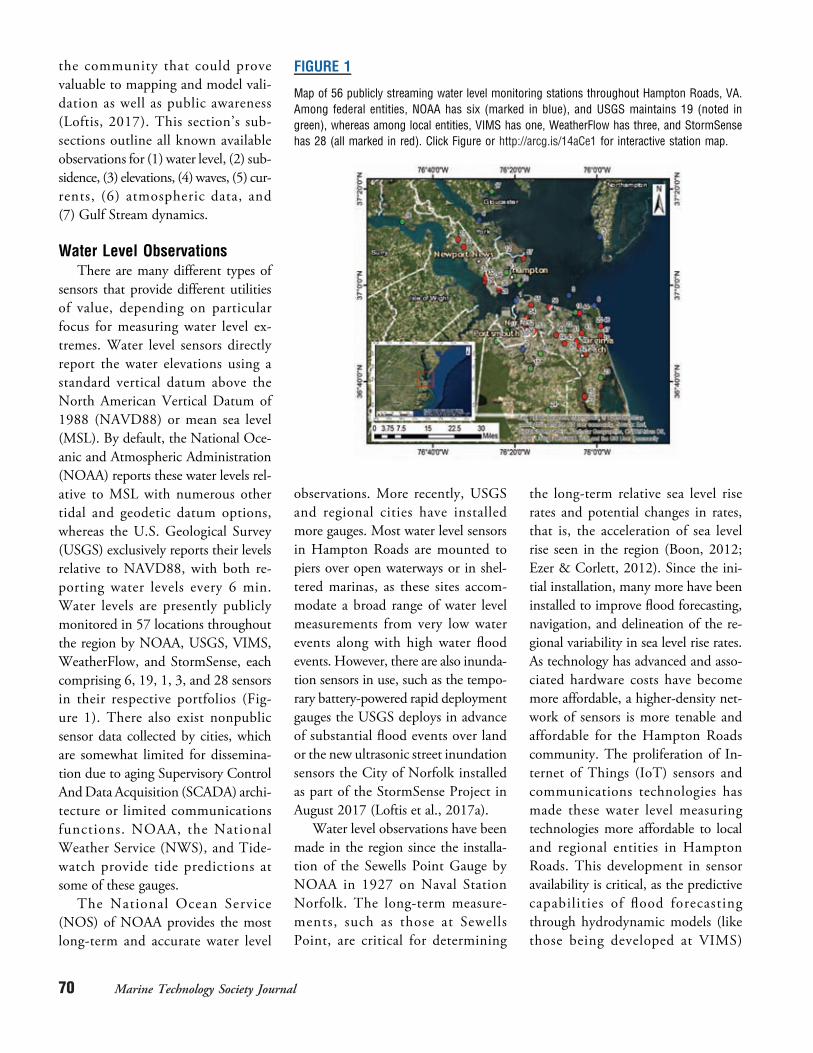
sensors that provide different utilitiesof value, depending on particularfocus for measuring water level ex-tremes. Water level sensors directlyreport the water elevations using astandard vertical datum above theNorth American Vertical Datum of1988 (NAVD88) or mean sea level(MSL). By default, the National Oce-anic and Atmospheric Administration(NOAA) reports these water levels rel-ative to MSL with numerous othertidal and geodetic datum options,whereas the U.S. Geological Survey(USGS) exclusively reports their levelsrelative to NAVD88, with both re-porting water levels every 6 min.Water levels are presently publiclymonitored in 57 locations throughoutthe region by NOAA, USGS, VIMS,WeatherFlow, and StormSense, eachcomprising 6, 19, 1, 3, and 28 sensorsin their respective portfolios (Fig-ure 1). There also exist nonpublicsensor data collected by cities, whichare somewhat limited for dissemina-tion due to aging Supervisory ControlAndData Acquisition (SCADA) archi-tecture or limited communicationsfunctions. NOAA, the NationalWeather Service (NWS), and Tide-watch provide tide predictions atsome of these gauges.
The National Ocean Service(NOS) of NOAA provides the mostlong-term and accurate water level
observations. More recently, USGSand regional cities have installedmore gauges. Most water level sensorsin Hampton Roads are mounted topiers over open waterways or in shel-tered marinas, as these sites accom-modate a broad range of water levelmeasurements from very low waterevents along with high water floodevents. However, there are also inunda-tion sensors in use, such as the tempo-rary battery-powered rapid deploymentgauges the USGS deploys in advanceof substantial flood events over landor the new ultrasonic street inundationsensors the City of Norfolk installedas part of the StormSense Project inAugust 2017 (Loftis et al., 2017a).
Water level observations have beenmade in the region since the installa-tion of the Sewells Point Gauge byNOAA in 1927 on Naval StationNorfolk. The long-term measure-ments, such as those at SewellsPoint, are critical for determining
the long-term relative sea level riserates and potential changes in rates,that is, the acceleration of sea levelrise seen in the region (Boon, 2012;Ezer & Corlett, 2012). Since the ini-tial installation, many more have beeninstalled to improve flood forecasting,navigation, and delineation of the re-gional variability in sea level rise rates.As technology has advanced and asso-ciated hardware costs have becomemore affordable, a higher-density net-work of sensors is more tenable andaffordable for the Hampton Roadscommunity. The proliferation of In-ternet of Things (IoT) sensors andcommunications technologies hasmade these water level measuringtechnologies more affordable to localand regional entities in HamptonRoads. This development in sensoravailability is critical, as the predictivecapabilities of flood forecastingthrough hydrodynamic models (likethose being developed at VIMS)
FIGURE 1
Map of 56 publicly streaming water level monitoring stations throughout Hampton Roads, VA.Among federal entities, NOAA has six (marked in blue), and USGS maintains 19 (noted ingreen), whereas among local entities, VIMS has one, WeatherFlow has three, and StormSensehas 28 (all marked in red). Click Figure or http://arcg.is/14aCe1 for interactive station map.
70 Marine Technology Society Journal
have begun extending into the urbanstreet-scale and could benefit fromdenser validation data sets. Ultimately,validations in more places throughouta city are needed to ensure a model’sefficacy and aid improvement.
In 2008, NOAA published a gapsanalysis in a technical memorandumreviewing relative coverage of regionswith their sensors and originally iden-tified few locations with need for datacoverage in Chesapeake Bay and itstributaries (Gill & Fisher, 2008). Nogaps were noted in Hampton Roadsin Figure 11 of their report. However,NOAA’s directive has a national view-point, and projected sea level risetrends and decreased costs for moni-toring technology have enabled theregion to respond more proactivelyto more frequent flooding. Due tothe dendritic shape of the many estu-aries of Hampton Roads, changes inprevailing wind directions combinedwith estuarine circulation contributeto flooding in ways that cannot be
best understood by a single sensor ateach major river mouth.
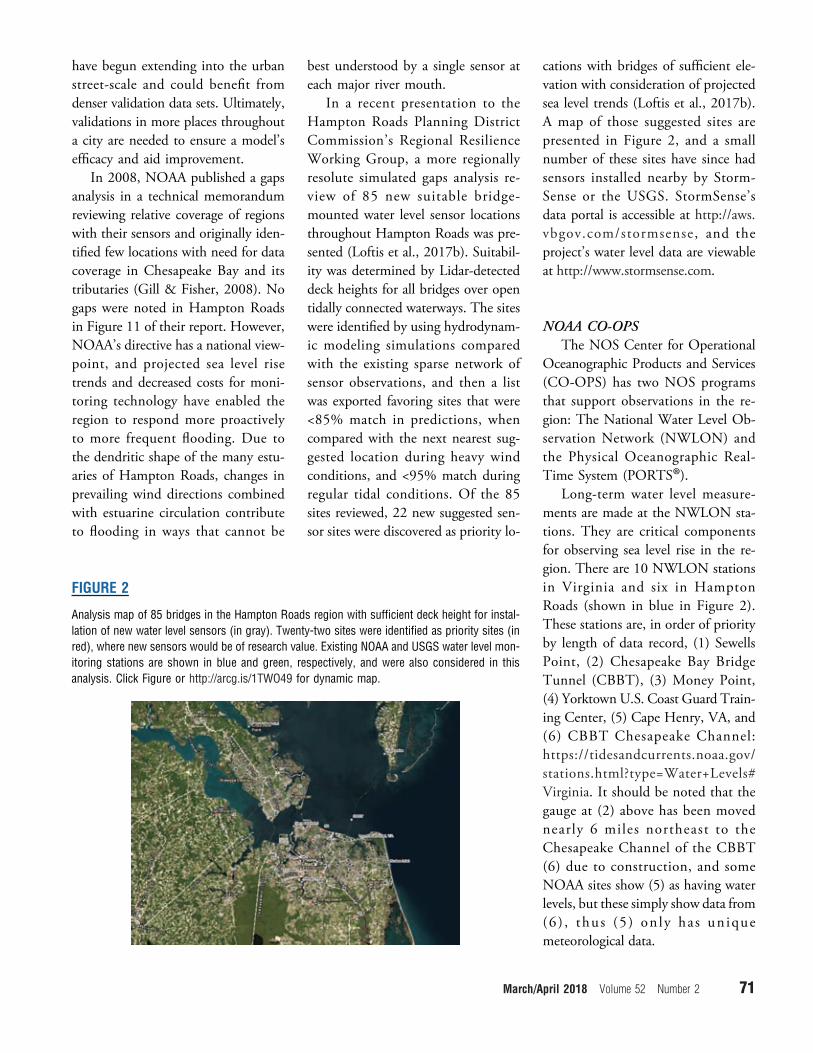
In a recent presentation to theHampton Roads Planning DistrictCommission’s Regional ResilienceWorking Group, a more regionallyresolute simulated gaps analysis re-view of 85 new suitable bridge-mounted water level sensor locationsthroughout Hampton Roads was pre-sented (Loftis et al., 2017b). Suitabil-ity was determined by Lidar-detecteddeck heights for all bridges over opentidally connected waterways. The siteswere identified by using hydrodynam-ic modeling simulations comparedwith the existing sparse network ofsensor observations, and then a listwas exported favoring sites that were<85% match in predictions, whencompared with the next nearest sug-gested location during heavy windconditions, and <95% match duringregular tidal conditions. Of the 85sites reviewed, 22 new suggested sen-sor sites were discovered as priority lo-
cations with bridges of sufficient ele-vation with consideration of projectedsea level trends (Loftis et al., 2017b).A map of those suggested sites arepresented in Figure 2, and a smallnumber of these sites have since hadsensors installed nearby by Storm-Sense or the USGS. StormSense’sdata portal is accessible at http://aws.vbgov.com/stormsense, and theproject’s water level data are viewableat http://www.stormsense.com.
NOAA CO-OPSThe NOS Center for Operational
Oceanographic Products and Services(CO-OPS) has two NOS programsthat support observations in the re-gion: The National Water Level Ob-servation Network (NWLON) andthe Physical Oceanographic Real-Time System (PORTS®).
Long-term water level measure-ments are made at the NWLON sta-tions. They are critical componentsfor observing sea level rise in the re-gion. There are 10 NWLON stationsin Virginia and six in HamptonRoads (shown in blue in Figure 2).These stations are, in order of priorityby length of data record, (1) SewellsPoint, (2) Chesapeake Bay BridgeTunnel (CBBT), (3) Money Point,(4) Yorktown U.S. Coast Guard Train-ing Center, (5) Cape Henry, VA, and(6) CBBT Chesapeake Channel:https://tidesandcurrents.noaa.gov/stations.html?type=Water+Levels#Virginia. It should be noted that thegauge at (2) above has been movednearly 6 miles northeast to theChesapeake Channel of the CBBT(6) due to construction, and someNOAA sites show (5) as having waterlevels, but these simply show data from(6 ) , thu s (5 ) on l y ha s un iquemeteorological data.
FIGURE 2
Analysis map of 85 bridges in the Hampton Roads region with sufficient deck height for instal-lation of new water level sensors (in gray). Twenty-two sites were identified as priority sites (inred), where new sensors would be of research value. Existing NOAA and USGS water level mon-itoring stations are shown in blue and green, respectively, and were also considered in thisanalysis. Click Figure or http://arcg.is/1TWO49 for dynamic map.
March/April 2018 Volume 52 Number 2 71
USGS National WaterInformation System
The USGS National Water Infor-mation System has 28 water level sta-tions in Virginia, 19 of which arelocated in the Hampton Roads region(shown in green in Figure 2; includ-ing one recurring temporary monitor-ing site in Norfolk’s Hague). All ofthe USGS Hampton Roads assetswere established in the last 2 yearsthrough cooperative agreements withlocalities through Hurricane SandyRelief funds that had to be appropri-ated and spent by the end of 2016.Thus, the Richmond Field Officehas no immediate plans for furtherdevelopment. In 2015, four sensorswere installed in Hampton, three inChesapeake, one in Portsmouth, onein Suffolk, one in Gloucester, andone in Virginia Beach, with eightmore sensors installed in VirginiaBeach in 2016: https://waterdata.usgs.gov/va/nwis/current/?type=tide&group_key=basin_cd
TidewatchVIMS operates and maintains a
water level monitoring and predictionservice called Tidewatch, which nowoperates under the CCRFR. Manyof the individuals involved in theIPP SAC are now involved in advis-ing, operating, and modeling at thisnew state-funded flood center. In itspresent state, Tidewatch mostly in-gests Web service data streams forNOAA-monitored water levels inChesapeake Bay for eight of its loca-tions. However, Tidewatch will beused as a starting point to integratesensors throughout the region to cre-ate a resilience monitoring network.Within its present installation of 10sites, two monitoring locations areunique to the network owned and op-erated by the CCRFR. One is a new
2017 installation outside of HamptonRoads at Tangier Island, VA, whereasthe other is within Hampton Roadsin Back River’s Dandy Haven, avail-able at http://www.vims.edu/bayinfo/tidewatch/stations/brdh/index.php.
WeatherFlow, Inc.WeatherFlow is a company that
collects extensive wind and selectedwater level observations. Weather-Flow installed its first microwavewater level sensor on the WytheCreek Bridge in Poquoson, VA.This sensor fills a gap in the area be-tween NWLON sites at Yorktownand Sewells Point and can be seenon the WeatherFlow DataScopeWeb por ta l (ht tp : / /da ta scope .weatherflow.com/). Their data areaccessible on a subscription basis.WeatherFlow also provides forecasts,nowcasts, and continuous wind datato subscribers via sector-specific por-tals (e.g., iWindsurf.com, iKitesurf.com, FishWeather.com, and SailFlow.com).
StormSenseStormSense is an IoT-enabled in-
undation forecasting research initia-tive and an active participant in theGlobal City Teams Challenge seekingto enhance flood preparedness in thesmart cities of Hampton Roads, VA,for flooding resulting from stormsurge, rain, and tides (Loftis et al.,2017a). In this study, we present theresults of the new StormSense waterlevel sensors to help establish the “re-gional resilience monitoring network”noted as a key recommendation fromthe IPP. To accomplish this, theCommonwealth Center for RecurrentFlooding Resiliency’s Tidewatch tidalforecast system is being used as a startingpoint to integrate the extant (NOAA)and new (USGS and StormSense)
water level sensors throughout the re-gion and demonstrate replicabilityof the solution across the cities ofNewport News, Norfolk, and VirginiaBeach within Hampton Roads, VA(Loftis et al., 2018). StormSense’s net-work employs a mix of ultrasonic andradar remote sensing IoT technologiesto record water levels in 6-min inter-vals at 28 locations around HamptonRoads established in 2017. More de-tails on data and locations of sensorsare listed on the project’s website,http://www.stormsense.com.
Subsidence ObservationsApproximately one half of the rel-
ative sea level rise in Hampton Roadsis caused by land sinking (Eggleston& Pope, 2013). Thus, it is imperativethat the rates and spatial variability ofsubsidence be well known. Subsi-dence is measured using GPS, Syn-thetic Aperture Radar satellites, andextensometer techniques. The mostcomprehensive subsidence measure-ments for the area cover the time pe-riod from 1940 to 1971, depictingsubsidence across the region that isrelatively constant spatially at a levelof approximately 2–3 mm/year. Thissubsidence is assumed to be due tothe presence of large-scale subsidencesignals associated with the glacial iso-static adjustment, groundwater with-drawal, and ongoing shifts associatedwith the Chesapeake Bay meteor im-pact crater. Until recently, this as-sumption was made, in part, becauseof the lack of higher-resolution infor-mation on vertical land motion forHampton Roads. However, newmethods employing a combinationof the technologies in the ensuingsubsections have enabled us to gainsome slight insight into subsidencein Hampton Roads (Bekaert et al.,2017). This section provides details
72 Marine Technology Society Journal
on the technologies, programs, andmethods used to obtain and accesssubsidence data.
GPS CORSThe NOAA National Geodetic
Survey manages a network for Con-tinuously Operating Reference Sta-tions (CORS). The CORS provideGlobal Navigation Satellite Systemdata through the United States, in-cluding Hampton Roads. There area total of six CORS in the HamptonRoads region, although generally lo-cated around the fringes with no cur-rent coverage in Norfolk, Hampton,or Newport News. The longest recordprovided by these stations extendsback only to 2006, with most CORShaving records spanning less than adecade in length.
InSARUsing interferometric synthetic
aperture radar (InSAR) analysis, it ispossible to generate higher spatial res-olution (20–30 m) estimates of subsi-dence in coastal areas ( Jones et al.,2016). Several SAR satellites have col-lected imagery over Hampton Roadsin the past decade, although fewwith enough acquisitions and a longenough record to provide the levelof uncertainty needed to obtain usefulresults from InSAR analysis. TheALOS-1 SAR satellite collected datafrom 2007 to 2011 over HamptonRoads. In total, 12 acquisitions wereobtained over this time period, al-though several of these acquisitionswere made during 2010 and 2011.The ALOS-1 data are freely availablefrom the Alaska Satellite Facility. Thedata have been processed and used ina recently published study to providea first look at InSAR-estimated subsi-dence for the region (Bekaert et al.,2017). Compared to the previous sur-
vey from USGS from 1940 to 1971,significant spatial variability was seenin the estimates of vertical land mo-tion for the region, although coupledwith relatively large uncertainty as aresult of the poor GPS coverage andlimited data set that was used.COSMO-SkyMed has provided SARcoverage of Hampton Roads since ap-proximately 2011, although thesedata are not freely available and subsi-dence estimates using these data havenot been published to date.
For ongoing and future monitor-ing o f Hampton Roads u s ingInSAR, there are other data possibili-ties. Since 2015, the Sentinel-1 satel-lite has been acquiring data overHampton Roads. Starting in Septem-ber 2016, the satellite began acquiringdata over the region every 12 days.Sentinel-1 also samples in the C-band,leading to dramatic reductions in un-certainty introduced by ionosphericnoise when compared to the L-bandmeasurements of ALOS-1. Important-ly, the European Union Commissionhas committed to continuing and add-ing to the Sentinel Constellation untilat least 2030, ensuring the ability tomonitor subsidence over HamptonRoads. This will eventually lead to dra-matic reductions in uncertainties as thetime series continues to increase.
ExtensometersThe Hampton Roads Sanitation
District (HRSD) will, as part of itsSustainable Water Initiative for To-morrow (SWIFT) project, install sev-eral extensometers. These devicesmeasure surface motion relative tobedrock using a cable which extendsthrough a steel pipe beneath the Poto-mac aquifer. The data will be avail-able from HRSD or USGS. HRSD’ssite at www.swiftva.com includes
further details regarding the SWIFTinitiative.
Topography and BathymetryThe inherent need for accurate and
resolute topography and bathymetryto build efficient models for predictionand estimation of flood impacts areself-evident. Models are only of valueif their input data enable them to ad-dress the concern adeptly, and eleva-tion data are the most integral inputof both nonconservative topography-based bathtub models and hydrody-namic models. If the shape, elevationof an inundated landform, and any im-pediments to fluid flow are not cor-rectly accounted for in a model, theresults will fail to accurately representreality (Loftis et al., 2016). The provi-sion of these data products involvedimplementation of a combinationof remote sensing technologies toretrieve—mostly Lidar for topographyand Sonar for bathymetry.
NOAA NCEIThe National Center for Environ-
mental Information (NCEI), formerlythe National Geophysical Data Cen-ter (NGDC), provides a wide varietyof Bathymetry Surveys and Topogra-phy data. Bathymetry offerings inHampton Roads range from rawpoint returns in the form of (1) multi-beam sonar, (2) single-beam (trackline)sonar surveys, to (3) NOS hydrographicsurveys or gridded points in the formof (4) bathymetric attributed grids(BAGs) (Figure 3).1. Multibeam surveys provide six
valuable data sets available inHampton Roads and mostlycover the Norfolk Shipping Chan-nel as depicted in Figure 3A. Sur-veys occurred on the followingdates, listed in reverse chrono-logical order: (1) MGL1409
March/April 2018 Volume 52 Number 2 73
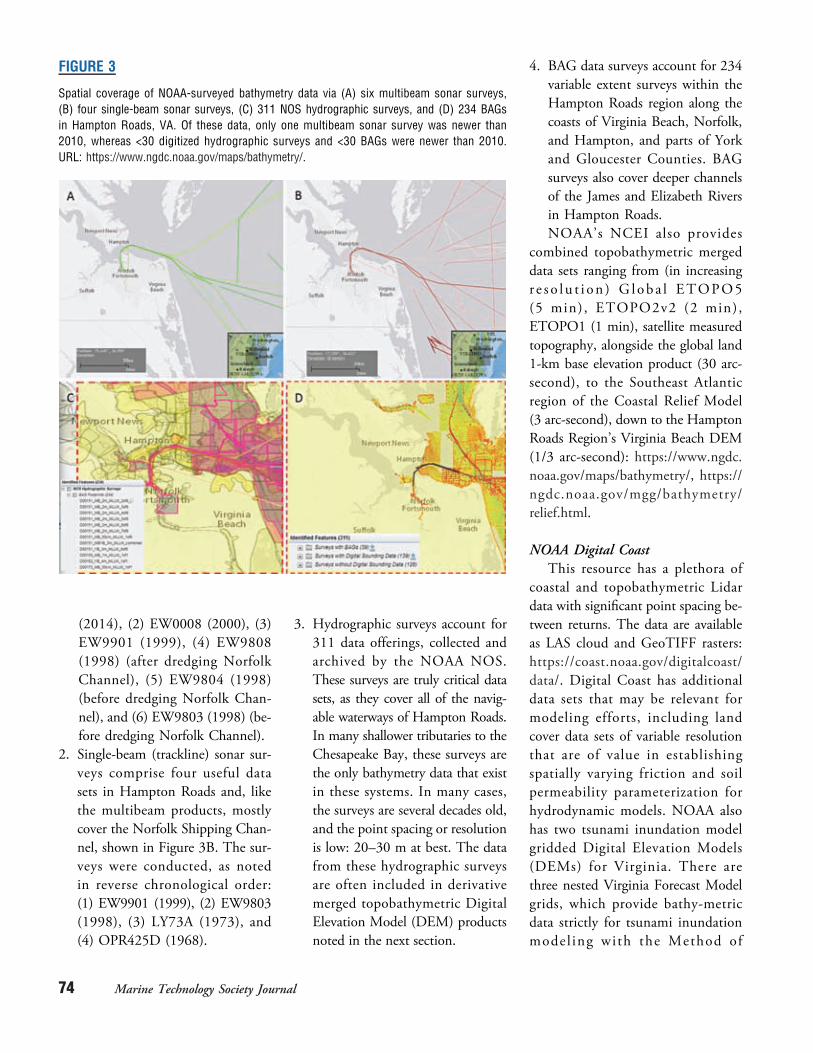
(2014), (2) EW0008 (2000), (3)EW9901 (1999), (4) EW9808(1998) (after dredging NorfolkChannel), (5) EW9804 (1998)(before dredging Norfolk Chan-nel), and (6) EW9803 (1998) (be-fore dredging Norfolk Channel).
2. Single-beam (trackline) sonar sur-veys comprise four useful datasets in Hampton Roads and, likethe multibeam products, mostlycover the Norfolk Shipping Chan-nel, shown in Figure 3B. The sur-veys were conducted, as notedin reverse chronological order:(1) EW9901 (1999), (2) EW9803(1998), (3) LY73A (1973), and(4) OPR425D (1968).
3. Hydrographic surveys account for311 data offerings, collected andarchived by the NOAA NOS.These surveys are truly critical datasets, as they cover all of the navig-able waterways of Hampton Roads.In many shallower tributaries to theChesapeake Bay, these surveys arethe only bathymetry data that existin these systems. In many cases,the surveys are several decades old,and the point spacing or resolutionis low: 20–30 m at best. The datafrom these hydrographic surveysare often included in derivativemerged topobathymetric DigitalElevation Model (DEM) productsnoted in the next section.
4. BAG data surveys account for 234variable extent surveys within theHampton Roads region along thecoasts of Virginia Beach, Norfolk,and Hampton, and parts of Yorkand Gloucester Counties. BAGsurveys also cover deeper channelsof the James and Elizabeth Riversin Hampton Roads.NOAA ’s NCEI also provides
combined topobathymetric mergeddata sets ranging from (in increasingr e s o l u t i on ) G l ob a l ETOPO5(5 min) , ETOPO2v2 (2 min) ,ETOPO1 (1 min), satellite measuredtopography, alongside the global land1-km base elevation product (30 arc-second), to the Southeast Atlanticregion of the Coastal Relief Model(3 arc-second), down to the HamptonRoads Region’s Virginia Beach DEM(1/3 arc-second): https://www.ngdc.noaa.gov/maps/bathymetry/, https://ngdc.noaa.gov/mgg/bathymetry/relief.html.
NOAA Digital CoastThis resource has a plethora of
coastal and topobathymetric Lidardata with significant point spacing be-tween returns. The data are availableas LAS cloud and GeoTIFF rasters:https://coast.noaa.gov/digitalcoast/data/. Digital Coast has additionaldata sets that may be relevant formodeling efforts, including landcover data sets of variable resolutionthat are of value in establishingspatially varying friction and soilpermeability parameterization forhydrodynamic models. NOAA alsohas two tsunami inundation modelgridded Digital Elevation Models(DEMs) for Virginia. There arethree nested Virginia Forecast Modelgrids, which provide bathy-metricdata strictly for tsunami inundationmode l ing wi th the Method of
FIGURE 3
Spatial coverage of NOAA-surveyed bathymetry data via (A) six multibeam sonar surveys,(B) four single-beam sonar surveys, (C) 311 NOS hydrographic surveys, and (D) 234 BAGsin Hampton Roads, VA. Of these data, only one multibeam sonar survey was newer than2010, whereas <30 digitized hydrographic surveys and <30 BAGs were newer than 2010.URL: https://www.ngdc.noaa.gov/maps/bathymetry/.
74 Marine Technology Society Journal
Splitting Tsunami model (https://data.noaa.gov/dataset/virginia-beach-tsunami-forecast-grids-for-most-model) and the Virginia Beach 10 mtopobathymetric DEM, also availablefrom the NOAA NGDC portal(Taylor et al., 2008; https://www.ngdc.noaa.gov/dem/squareCellGrid/download/423).
USGS NEDThe USGS National Elevation
Dataset (NED) has been a mainstayfor surface topography data in the re-gion for a long time. Their productofferings include variable formats ofDEMs ranging from 1 min to 1/9arc-second in resolution throughoutHampton Roads. Their more recent1/3 and 1/9 arc-second DEMs offersome limited hydrocorrection for largeculverts and large ditches (Evans, 2010;https://lta.cr.usgs.gov/NED). Inaddition, the USGS has developed a1-m resolution merged DEM com-posed of the “best available data”(Evans, 2010) from the above-listedtopography and bathymetry datasources for the entire Chesapeake Baywatershed, including all of HamptonRoads (Danie lson et a l . , 2016;Thatcher et al., 2016).
VITA VGINThe Virginia Information Tech-
nologies Agency’s (VITA) VirginiaGeographic Information Network(VGIN) provides elevation datathroughout parts of the Common-wealth where available. Currently,their digital topography holdingscover all of coastal Virginia, includingHampton Roads. These elevationswere obtained through Lidar surveysover an 8-year acquisition periodand are downloadable as LAS pointcloud data and bare earth LidarDEMs (Scr ivani , 2016) . Lidar
DEMs are available through VGIN’sdata portal and through ArcGIS On-line feature services, and like theUSGS NED layers, these Lidar hold-ings have limited hydrocorrection.VGIN also includes other flood risk-related shape files including BuildingFootprints and Parcel layers, whereavailable. VITA’s goals in providingservices through VGIN will be ex-tended to include Lidar throughoutthe rest of Virginia by 2020 accordingto their current 2015–2020 plan(VGIN VITA, 2015).
Wave MeasurementsObservations of ocean waves in
the region are important to predictovertopping of and impact loads oncoastal structures, quantify shorelineerosion, and understand the stormrisk to residential buildings in thecoastal zone and to maritime safety.Since waves, either wind waves orboat wakes, are high-frequency watersurface motions, wave measurementsare carried out by sensors that canmeasure water level at high temporalresolution. The subsequent sectionsoutline wave measurements from
Scripps, NOAA, and sporadic alterna-tive sources.
CDIPThe Coastal Data Information
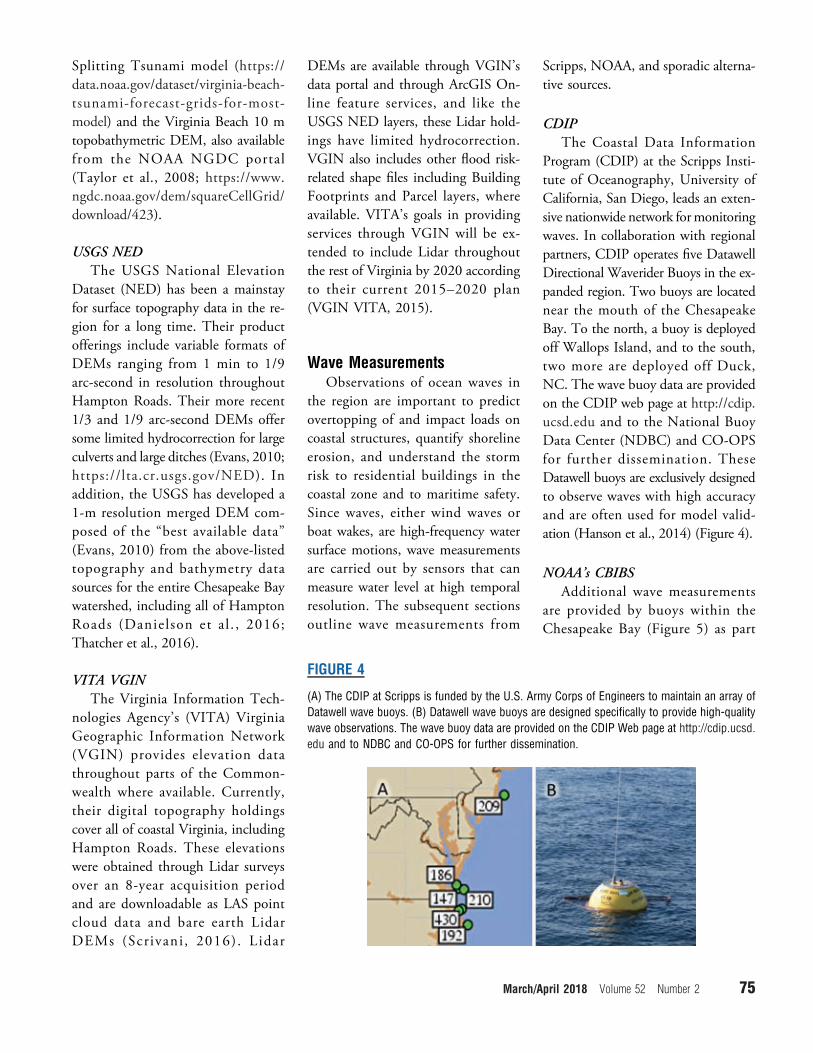
Program (CDIP) at the Scripps Insti-tute of Oceanography, University ofCalifornia, San Diego, leads an exten-sive nationwide network formonitoringwaves. In collaboration with regionalpartners, CDIP operates five DatawellDirectional Waverider Buoys in the ex-panded region. Two buoys are locatednear the mouth of the ChesapeakeBay. To the north, a buoy is deployedoff Wallops Island, and to the south,two more are deployed off Duck,NC. The wave buoy data are providedon the CDIP web page at http://cdip.ucsd.edu and to the National BuoyData Center (NDBC) and CO-OPSfor further dissemination. TheseDatawell buoys are exclusively designedto observe waves with high accuracyand are often used for model valid-ation (Hanson et al., 2014) (Figure 4).
NOAA’s CBIBSAdditional wave measurements
are provided by buoys within theChesapeake Bay (Figure 5) as part
FIGURE 4
(A) The CDIP at Scripps is funded by the U.S. Army Corps of Engineers to maintain an array ofDatawell wave buoys. (B) Datawell wave buoys are designed specifically to provide high-qualitywave observations. The wave buoy data are provided on the CDIP Web page at http://cdip.ucsd.edu and to NDBC and CO-OPS for further dissemination.
March/April 2018 Volume 52 Number 2 75
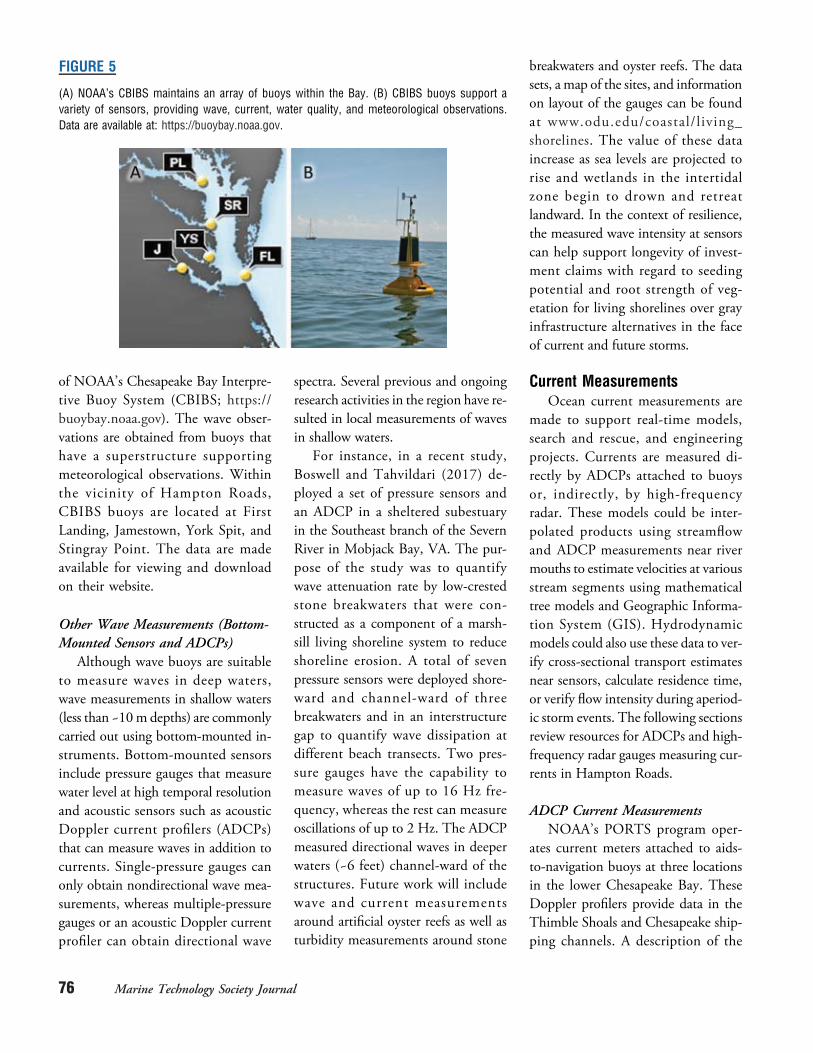
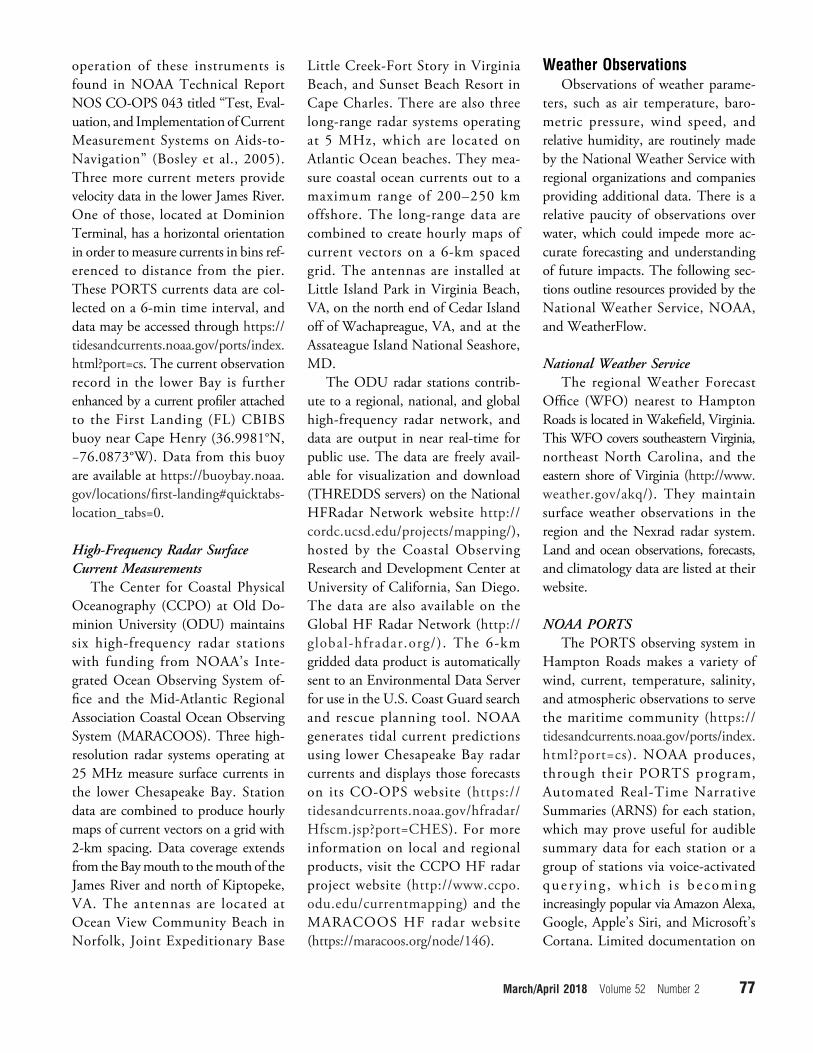
of NOAA’s Chesapeake Bay Interpre-tive Buoy System (CBIBS; https://buoybay.noaa.gov). The wave obser-vations are obtained from buoys thathave a superstructure supportingmeteorological observations. Withinthe vicinity of Hampton Roads,CBIBS buoys are located at FirstLanding, Jamestown, York Spit, andStingray Point. The data are madeavailable for viewing and downloadon their website.
Other Wave Measurements (Bottom-Mounted Sensors and ADCPs)
Although wave buoys are suitableto measure waves in deep waters,wave measurements in shallow waters(less than ~10m depths) are commonlycarried out using bottom-mounted in-struments. Bottom-mounted sensorsinclude pressure gauges that measurewater level at high temporal resolutionand acoustic sensors such as acousticDoppler current profilers (ADCPs)that can measure waves in addition tocurrents. Single-pressure gauges canonly obtain nondirectional wave mea-surements, whereas multiple-pressuregauges or an acoustic Doppler currentprofiler can obtain directional wave
spectra. Several previous and ongoingresearch activities in the region have re-sulted in local measurements of wavesin shallow waters.
For instance, in a recent study,Boswell and Tahvildari (2017) de-ployed a set of pressure sensors andan ADCP in a sheltered subestuaryin the Southeast branch of the SevernRiver in Mobjack Bay, VA. The pur-pose of the study was to quantifywave attenuation rate by low-crestedstone breakwaters that were con-structed as a component of a marsh-sill living shoreline system to reduceshoreline erosion. A total of sevenpressure sensors were deployed shore-ward and channel-ward of threebreakwaters and in an interstructuregap to quantify wave dissipation atdifferent beach transects. Two pres-sure gauges have the capability tomeasure waves of up to 16 Hz fre-quency, whereas the rest can measureoscillations of up to 2 Hz. The ADCPmeasured directional waves in deeperwaters (~6 feet) channel-ward of thestructures. Future work will includewave and current measurementsaround artificial oyster reefs as well asturbidity measurements around stone
breakwaters and oyster reefs. The datasets, a map of the sites, and informationon layout of the gauges can be foundat www.odu.edu/coastal/l iving_shorelines. The value of these dataincrease as sea levels are projected torise and wetlands in the intertidalzone begin to drown and retreatlandward. In the context of resilience,the measured wave intensity at sensorscan help support longevity of invest-ment claims with regard to seedingpotential and root strength of veg-etation for living shorelines over grayinfrastructure alternatives in the faceof current and future storms.
Current MeasurementsOcean current measurements are
made to support real-time models,search and rescue, and engineeringprojects. Currents are measured di-rectly by ADCPs attached to buoysor, indirectly, by high-frequencyradar. These models could be inter-polated products using streamflowand ADCP measurements near rivermouths to estimate velocities at variousstream segments using mathematicaltree models and Geographic Informa-tion System (GIS). Hydrodynamicmodels could also use these data to ver-ify cross-sectional transport estimatesnear sensors, calculate residence time,or verify flow intensity during aperiod-ic storm events. The following sectionsreview resources for ADCPs and high-frequency radar gauges measuring cur-rents in Hampton Roads.
ADCP Current MeasurementsNOAA’s PORTS program oper-
ates current meters attached to aids-to-navigation buoys at three locationsin the lower Chesapeake Bay. TheseDoppler profilers provide data in theThimble Shoals and Chesapeake ship-ping channels. A description of the
FIGURE 5
(A) NOAA’s CBIBS maintains an array of buoys within the Bay. (B) CBIBS buoys support avariety of sensors, providing wave, current, water quality, and meteorological observations.Data are available at: https://buoybay.noaa.gov.
76 Marine Technology Society Journal
operation of these instruments isfound in NOAA Technical ReportNOS CO-OPS 043 titled “Test, Eval-uation, and Implementation ofCurrentMeasurement Systems on Aids-to-Navigation” (Bosley et al., 2005).Three more current meters providevelocity data in the lower James River.One of those, located at DominionTerminal, has a horizontal orientationin order tomeasure currents in bins ref-erenced to distance from the pier.These PORTS currents data are col-lected on a 6-min time interval, anddata may be accessed through https://tidesandcurrents.noaa.gov/ports/index.html?port=cs. The current observationrecord in the lower Bay is furtherenhanced by a current profiler attachedto the First Landing (FL) CBIBSbuoy near Cape Henry (36.9981°N,−76.0873°W). Data from this buoyare available at https://buoybay.noaa.gov/locations/first-landing#quicktabs-location_tabs=0.
High-Frequency Radar SurfaceCurrent Measurements
The Center for Coastal PhysicalOceanography (CCPO) at Old Do-minion University (ODU) maintainssix high-frequency radar stationswith funding from NOAA’s Inte-grated Ocean Observing System of-fice and the Mid-Atlantic RegionalAssociation Coastal Ocean ObservingSystem (MARACOOS). Three high-resolution radar systems operating at25 MHz measure surface currents inthe lower Chesapeake Bay. Stationdata are combined to produce hourlymaps of current vectors on a grid with2-km spacing. Data coverage extendsfrom the Baymouth to themouth of theJames River and north of Kiptopeke,VA. The antennas are located atOcean View Community Beach inNorfolk, Joint Expeditionary Base
Little Creek-Fort Story in VirginiaBeach, and Sunset Beach Resort inCape Charles. There are also threelong-range radar systems operatingat 5 MHz, which are located onAtlantic Ocean beaches. They mea-sure coastal ocean currents out to amaximum range of 200–250 kmoffshore. The long-range data arecombined to create hourly maps ofcurrent vectors on a 6-km spacedgrid. The antennas are installed atLittle Island Park in Virginia Beach,VA, on the north end of Cedar Islandoff of Wachapreague, VA, and at theAssateague Island National Seashore,MD.
The ODU radar stations contrib-ute to a regional, national, and globalhigh-frequency radar network, anddata are output in near real-time forpublic use. The data are freely avail-able for visualization and download(THREDDS servers) on the NationalHFRadar Network website http://cordc.ucsd.edu/projects/mapping/),hosted by the Coastal ObservingResearch and Development Center atUniversity of California, San Diego.The data are also available on theGlobal HF Radar Network (http://global-hfradar.org/) . The 6-kmgridded data product is automaticallysent to an Environmental Data Serverfor use in the U.S. Coast Guard searchand rescue planning tool. NOAAgenerates tidal current predictionsusing lower Chesapeake Bay radarcurrents and displays those forecastson its CO-OPS website (https://tidesandcurrents.noaa.gov/hfradar/Hfscm.jsp?port=CHES). For moreinformation on local and regionalproducts, visit the CCPO HF radarproject website (http://www.ccpo.odu.edu/currentmapping) and theMARACOOS HF radar website(https://maracoos.org/node/146).
Weather ObservationsObservations of weather parame-
ters, such as air temperature, baro-metric pressure, wind speed, andrelative humidity, are routinely madeby the National Weather Service withregional organizations and companiesproviding additional data. There is arelative paucity of observations overwater, which could impede more ac-curate forecasting and understandingof future impacts. The following sec-tions outline resources provided by theNational Weather Service, NOAA,and WeatherFlow.
National Weather ServiceThe regional Weather Forecast
Office (WFO) nearest to HamptonRoads is located in Wakefield, Virginia.This WFO covers southeastern Virginia,northeast North Carolina, and theeastern shore of Virginia (http://www.weather.gov/akq/). They maintainsurface weather observations in theregion and the Nexrad radar system.Land and ocean observations, forecasts,and climatology data are listed at theirwebsite.
NOAA PORTSThe PORTS observing system in
Hampton Roads makes a variety ofwind, current, temperature, salinity,and atmospheric observations to servethe maritime community (https://tidesandcurrents.noaa.gov/ports/index.html?port=cs). NOAA produces,through their PORTS program,Automated Real-Time NarrativeSummaries (ARNS) for each station,which may prove useful for audiblesummary data for each station or agroup of stations via voice-activatedque r y i n g , wh i ch i s b e com ingincreasingly popular via Amazon Alexa,Google, Apple’s Siri, and Microsoft’sCortana. Limited documentation on
March/April 2018 Volume 52 Number 2 77
ARNS is here: https://tidesandcurrents.noaa.gov/arns.html.
WeatherFlow, Inc.WeatherFlow, Inc., recently in-
strumented the Chesapeake LightTower, located 14 miles off theshore of Virginia Beach after the sitewas abandoned by NOAA. The sitenow includes atmospheric and waterlevel observations. WeatherFlow colo-cated sensors as part of the VirginiaOffshore Wind Energy Develop-ment. Data are currently privatelyavailable for this and other sites onthe WeatherFlow DataScope site(http://datascope.weatherflow.com/).WeatherFlow, Inc., operates approx-imately 20 proprietary weatherstations in the Hampton Roads area.Data from those stations are availablethrough several WeatherFlow apps,with some of the data being visibleto free users of those apps and theremainder of the data being visibleonly to users who pay a subscriptionfee to get an upgraded version ofthose WeatherFlow apps.
Gulf Stream DynamicsOn long-term time scales, weaken-
ing of the Gulf Stream has beenlinked with acceleration in sea levelrise along the U.S. East Coast, espe-cially north of Cape Hatteras (Boon,2012; Ezer, 2015; Ezer et al., 2013;Sallenger et al., 2012). On shorttime scales of days to weeks, varia-tions in the Gulf Stream transportthat can be detected by the dailycable measurements of the FloridaCurrent are linked with unpredictableanomalous water level elevation thatcan cause “clear day” tidal flooding(Ezer & Atkinson, 2017; Ezer et al.,2017). Gulf Stream transport is mea-sured daily across the Straits of Floridaand reported at http://www.aoml.
noaa.gov/phod/floridacurrent/index.php.
Data IntegrationServices (Web-BasedData Consolidators)
For resiliency planning, a criticalcomponent of integrated data collec-tion is the dissemination of the datain a digestible format for decisionmakers. The variety of data that isavailable in the region combinedwith a variety of user needs has ledto a variety of websites that integratevarious parts of the overall observingsystem. Many of the data integratingsites have a nationwide scope, whereasothers are specific to the region. Allprovide a valuable service. Some ex-amples of data integration sites thatare ingesting data from the HamptonRoads observation network are de-scribed below.
Integrated Data Portalsand Viewers
These provide the ability to accessdifferent types of data through a sin-gle server. Portals are typically aimedat users who want to do their ownanalyses and provide information tounsynthesized data. Viewers providemapped and synthesized data toolsfor resilience planning. The geograph-ic scope of the data portals andviewers varies from national to local,and some examples of prominent portalsand viewers are noted below (althougha more exhaustive list is provided inAppendix B):■ NOAA’s Sea Level Rise viewer al-
lows the user to visualize potentialimpacts from sea level rise throughinteractive maps and photos inlandmark locations that have beendigitally altered to create an obli-que view of flooding at thresh-
olds up to 6 feet above MSL:https://coast.noaa.gov/digitalcoast/tools/slr.
■ ClimateCentral’s Surging Seas viewer(http://www.ClimateCentral.org)covers most of the U.S. coastal statesand allows integrated mapping ofsocial, economic, and flood riskfactors. It allows easy comparisonof different scenarios to facilitatedecision-making up to ~32 feetabove MSL.
■ AdaptVA (http://www.AdaptVA.org) is a site dedicated to providingclimate-related data specificallycurated for adaptation efforts inVirginia. It provides both a dataportal (a geoportal) and synthesizedinformation, targeting differentusers with each. The geoportal isprimarily built to deliver Virginiaspecific data but will also searchArcGIS.com for global data. Allof the synthesized data tools arespecific to Virginia.
■ Part of theU.S. IntegratedOceanOb-serving System, the MARACOOS(http://www.MARACOOS.org)serves as a portal for data from thecoastal region extending fromCape Cod, MA, to Cape Hatteras,NC. MARACOOS integrates,analyzes, and applies informationto best serve their diverse stakeholdercommunities and to meet end-user needs. They provide marine,atmospheric, and hydrodynamicdata from multiples sources andlist their priorities for data inclusionas fo l lows : mar i t ime sa fe ty ,ecological decision support, waterquality, coastal inundation, andenergy. Much of the observationaldata, satellite data, and forecastmodels are available for viewing,download, and analysis throughtheir OceansMap Viewer and tool:http://oceansmap.maracoos.org/.
78 Marine Technology Society Journal
Forecast ServicesThese provide water level forecasts
based on integrated water and atmo-spheric observations. NOAA NationalWeather Service and the Virginia In-stitute of Marine Science’s Tidewatchboth have water level forecasting sys-tems (http://water.weather.gov/ahps/and http://www.floodingresiliency.o r g /wa t e r - l e v e l - p r e d i c t i on s / ,respectively) for the Chesapeake Bayregion. Although the algorithms areslightly different, they both use windforecasts and water level observationsto graph forecasted water levels at tidegauges and water sensors. Bothprovide an effective way to measure,visualize, and predict the magnitudeand impacts of coastal flooding atlocations within the Chesapeake Bayand along Virginia’s seaside EasternShore. These systems can be used toprepare for storm tides and minimizepotential flood impacts. On a longertemporal scale, sea level forecasts arealso provided by VIMS (http://www.vims.edu/s l rc) for a number ofstations. These forecasts are based onrelative sea level rise trends at tidegauges throughout the United Statesand are updated semiannually.
Public Web Service URLsWeb services from water level sen-
sors and other flood-relevant moni-toring assets are often ingested bythe viewers and forecast services previ-ously noted in this section. The mainthree water level monitoring groupswith publicly accessible Web servicesin Hampton Roads are NOAA,USGS, and StormSense.■ NOAA’s Tides and Currents site
provides a sizable number of inte-grative services through a variety ofinteroperable data formats includ-ing XML, JSON, and CSV for-mats for the six sensors in/around
Hampton Roads. These stations(in order of length of data re-cord) are noted in the dynamicdigital Appendix A (http://www.v im s . e du /p eop l e / l o f t i s _ j d /HRVASensorAssets/index.php) inthe following order: (1) datum,(2) water levels, (3) tide predictions,(4) air temperature, (5) barometricpressure, and (6a) wind speed with(6b) direction, (7) conductivity,and (8) water temperature (https://tidesandcurrents.noaa.gov/api/).
■ USGS employs public ApplicationProgramming Interfaces (APIs) toshare the data services they pro-vide. Aggregation links for waterlevels (and additional parameters,if the city co-opted for other sen-sors) in Virginia Beach, Hampton,Gloucester, and Chesapeake areavailable for the 27 sensors theUSGS maintains in the region.Other stations can also be retrievedthis way if their station names areknown and queried within theURLs noted in Appendix A.
■ StormSense in Hampton Roadsincludes the 28 new water levelsensors noted in the Water LevelObservations section, which arecurrently publicly broadcastingtheir water levels under the pub-lic API URLs presented in Appen-dix A. StormSense also providesthe tools to accept data streamsfrom various other sources withdisparate data formats, as recentlydisplayed before and duringHampton Roads’ 2017 king tideforecast and sizable coordinatedmonitoring event, “Catch theKing” (Loftis et al . , 2017c):http://www.vims.edu/people/loftis_jd/Catch%20the%20King%20Forecast%20Nov%205th/index .php. In this instance,Tidewatch was used as a starting
point to integrate StormSense andNOAA sensors throughout theregion in pursuit of creating aresilience monitoring network todirectly address a key recom-mendation from the IPP.
Summary andRecommendations
The IPP Science Advisory Com-mittee had a number of recommenda-tions in the final report. The thirdrecommendation was directly relevantfor sensor observations and stated that“…the SAC provide a mechanism toassure that the sea level rise scienceneeds and requirements of regionalstakeholders are addressed” (Steinhilberet al., 2016; Toll, 2018). They furtheradvised that this could be accom-plished through coordination betweenall levels of government and relevantprivate organizations for data collec-tion and the delivery of data throughintegrated Web portals. These goalshave been accomplished; however,there were a number of challengesthat needed to be overcome. Both es-tablishment of data standards andfunding of network sensors havebeen major concerns. It should benoted tha t federa l fund ing toNOAA, USGS, and NASA whomaintain the land, ocean, and remotesensing instruments is crucial, yet it isexpected that network funding maycontinue to be a concern.
Challenges for Establishingan Integrated Network ofMeasurement AssetsData Communications Standards
Most of the cities in the region areinstalling their own water level gaugesemploying a broad range of sensortypes ranging from (1) Ka-band
March/April 2018 Volume 52 Number 2 79
radar, as used by NOAA and USGS,to the cheaper (2) ultrasonic sonar, asremote sensing observation methods,to (3) in situ pressure transducers,which tend to biofoul in the falltidal floods when harmful algalblooms are more frequent. With in-dustrial IoT technologies, cost savingsare realized in communities by es-chewing the more costly Iridium Sat-ellite uplink communication methodsNOAA and USGS use in favor of 4Gcellular broadband signals, 2Gmachine-to-machine through Ingenu, and longrange wireless area networks. TheseIoT communication methods, com-binedwith cheaper ultrasonic sensors, re-sult in a reasonably accurate (~10 cm)affordable water level monitoring alter-native for modern smart cities at a costof ~10× cheaper, per sensor (Loftiset al., 2017a).
The reality is that, although citiesmay have ample Public Works andData Scientists capable of installingand managing their own data, thedata types, collection intervals, formats,and error metrics should be standard-ized. Thus, this approach is still likelyto be out of the realm of affordabilityin rural localities for at least the nextdecade. It should also be noted thatIoT approaches, though cheaper, arepotentially more susceptible to inter-rupted communications during heavyflood events coincident with poweroutages. Although IoT water level sen-sors are powered by large solar panelsand batteries, their communicationsare still subject to the same overbur-dened cellular Internet and data chan-nels most denizens rely on when thepower and Internet are offline.
Funding and Resource SustainabilityFor the engaged cities installing
sensors in Hampton Roads, most areeither collaborating via cooperative
agreement with the USGS RichmondField Office or VIMS through theSmart Cities StormSense Project tolocate suitable sites, procure and in-stall the sensors, and make the datapublic. It is important to assure thatthe observations are of sufficient accu-racy and that they are made public innear-real time. To be sure of this,StormSense is funded through a Rep-licable Smart City Technologies Co-operative Agreement awarded to theCity of Newport News and VIMS,who have been directly advised bythe National Institute of Standardsand Technology. The data streamscoming from the StormSense sensorsemulate USGS’ data standards by col-lecting data in 6-min time intervalsand reporting their water levels rela-tive to NAVD88 while broadcastingtheir data via public APIs in a varietyof digestible data formats. By makingall new water level sensors public innear-real time, the observations canbe used for forecasting, emergencymanagement, and research projects.
Creating Integrated Data ProductsThe frequency at which different
types of data are upgraded can signif-icantly impact the integration of mul-tiple data into a single model or dataproduct. For example, bathymetry israrely updated, whereas the waterlevel sensors are updated on 6-mintime scales. This means that stormsurge models are working with de-tailed changes in water level, but thewater levels may be superimposedon inaccurate depths, hampering theimprovement of the models.
In Hampton Roads, bathymetricsurveys outside of the dredged pri-mary shipping channels are relativelyoutdated and somewhat sparse interms of point spacing. Given thatshallower streams’ hydrographic sur-
veys are frequently integrated as theonly digitized bathymetry source,shallow stream systems, such as theLynnhaven, Nansemond, Back, andLafayette Rivers do not have thebest possible bathymetry data for ad-equate consideration of flood risk inHampton Roads. Refined bathymetrywould result in an immediate im-provement of flood forecasting.
RecommendationsIn completing this inventory of ob-
servations and data formats, a numberof key determinations can be formulatedinto recommendations for filling gaps,leveraging historical continuity of ob-servations, and integrating systemsfor improving situational awarenessin emergencies as well as broad-based information needs for resilienceplanning. An overall premise is that in-tegration of diverse observing systemsinto a network is vital for resilienceplanning, which inherently crosses sec-tors and space-time scales. First, as eachobserving network arose out of a partic-ular sector or scientific or geotechnicaldiscipline, it is prudent to inventoryand define data standards early wheninputs are sought across networks. In-teroperability issues comprise technicalissues of communications and data for-mats, standards of unit measurements,and application requirements in tem-poral and spatial collection needs(extent, resolution, and temporal fre-quency). We find that shallow-waterbathymetry continues to be a con-straint on hydrodynamic modeling,and efforts to systematically map andupdate this parameter will result in bet-ter forecasting and planning process in-puts. Likewise, topographic data,already greatly enhanced by LidarDEMs, could be further improvedwith finer resolution, use of hydrocor-rection in disjunct, low-lying areas, and
80 Marine Technology Society Journal
leverage research on subsidence for de-veloping future topographic represen-tation (and inundation models) forrelative sea level rise (combiningeustatic rate scenarios and subsidencetrends). In addition, the growing net-work of real-time water level sensorsought to be expanded to allow fore-casting to better predict storm surgeimpacts as well as wind tides and nui-sance flooding. Finally, overall integra-tion of ocean, earth, and atmosphericobservations should be sought toenhance situational awareness in emer-gency events as well as promote scien-tific analysis and prediction.With theserecommendations in mind, thesesensor data should be used to help thepublic, stakeholders, and policy makersin the near term by recognizing whentheir home or vehicle is in danger offlooding in near-real time and validatepredictive model results for future im-provement. Simultaneously, this inte-grated network of sensors will aid inresilience efforts through researchinto compounding effects of sea levelrise and subsidence in HamptonRoads in the long term.
AcknowledgmentsThe authors would like to thank the
IPP SAC for their thought and guidancein advising Hampton Roads toward amore resilient future and MTS for rec-ognizing the value of those decisions inassembling this special issue. We wouldlike to thank NOAA, USGS, NWS,NASA, StormSense, and WeatherFlowfor their publicly shared data observa-tions outlined in this paper and theirmyriad uses for scientists, decisionmakers, and stakeholders in the pursuitof sustainable resilience. In addition,thank you to those organizations whohave taken these useful data productsand aided their interpretation through
interactive viewers through NOAA,USGS, MARACOOS, AdaptVA, andClimate Central, among others. Finally,thank you to the reviewers from MTSwhose conscientious comments invari-ably improved this manuscript duringthe peer-review process. This paper isContribution No. 3728 of the VirginiaInstitute of Marine Science, College ofWilliam&Mary. The research was car-ried out in part at the Jet PropulsionLaboratory, California Institute ofTechnology, under a contract with theNational Aeronautics and Space Ad-ministration. A portion of the publica-tion costs for this paper were furnishedby NASA’s Disasters Program throughfederal award #NNL16AA05C/216-17- 050.
Corresponding Author:Jon Derek LoftisCenter for Coastal ResourcesManagement, Virginia Instituteof Marine Science,College of William & Mary1208 Greate Road, Gloucester Point,VA 23062Email: [email protected]
ReferencesBekaert, D.P.S.,Hamlington, B.D., Buzzanga,
B., & Jones, C.E. 2017. Spaceborne synthetic
aperture radar survey of subsidence in Hampton
Roads, Virginia (USA). Sci Rep. 7:14752.
https://doi.org/10.1038/s41598-017-15309-5.
Boon, J.D. 2012. Evidence of sea level accel-
eration at US and Canadian tide stations,
Atlantic Coast, North America. J Coast Res.
28(6):1437-45. https://doi.org/10.2112/
JCOASTRES-D-12-00102.1.
Boon, J.D., & Mitchell, M. 2015. Nonlinear
change in sea level observed at North American
tide stations. J Coast Res. 31(6):1295-305.
https://doi.org/10.2112/JCOASTRES-D-
15-00251.1.
Boon, J.D., Mitchell, M., Loftis, J.D., &
Malmquist, D.M. 2018. Anthropocene sea
level change: A history of recent trends ob-
served in the U.S. East, Gulf, and West Coast
Regions. Special Report in Applied Marine
Science and Ocean Engineering (SRAMSOE),
No. 467. Virginia Institute of Marine Science,
College of William & Mary. https://doi.org/
10.21220/V5T17T.
Bosley, K.T., McGrath, C., Dussault, J.P.,
Bushnell, M., Evans, M.J., French, G.W.,
& Earwaker, K.M. 2005. NOAA Techni-
cal Report, NOS CO-OPS 043 Ocean
Systems Test and Evaluation Program
Test, Evaluation, and Implementation of
Current Measurement Systems on Aids-To-
Navigation Silver Spring, Maryland. Avail-
able at: https://tidesandcurrents.noaa.gov/
publications/technical_report_43.pdf.
(accessed November 1, 2017).
Boswell, M. K., & Tahvildari, N. 2017.
Investigating wave dissipation effects of living
shorelines (Abstract). ASCE-EWRI Congress,
Sacramento, CA.
Danielson, J.J., Poppenga, S.K., Brock, J.C.,
Evans, G.A., Tyler, D.J., Gesch, D.B., …
Barras, J.A. 2016. Topobathymetric elevation
model development using a new methodology:
Coastal national elevation database. J Coast
Res. 76(sp1):75-89. https://doi.org/10.2112/
SI76-008.
Eggleston, J., & Pope, J. 2013. Land Subsi-
dence and Relative Sea-Level Rise in the
Southern Chesapeake Bay Region: U.S. Geo-
logical Survey Circular 1392. 30 p. https://
doi.org/10.3133/cir1392.
Evans, G. 2010. National elevation dataset.
U.S. Geological Survey Earth Resources
Observation and Science (EROS) Center.
VITA Webinar Series, May 20, 2010. Avail-
able at: https://www.vita.virginia.gov/media/
vitavirginiagov/integrated-services/pdf/USGS_
NED_Overview.pdf.
Ezer, T. 2015. Detecting changes in the
transport of the Gulf Stream and the Atlantic
overturning circulation from coastal sea level
data: The extreme decline in 2009–2010 and
estimated variations for 1935–2012. Global
March/April 2018 Volume 52 Number 2 81
Planet Change. 129:23-36. https://doi.org/
10.1016/j.gloplacha.2015.03.002.
Ezer, T., & Atkinson, L.P. 2014. Accelerated
flooding along the US East Coast: On the
impact of sea‐level rise, tides, storms, the Gulf
Stream, and the North Atlantic oscillations.
Earth’s Future. 2(8):362-82. https://doi.org/
10.1002/2014EF000252.
Ezer, T., & Atkinson, L.P. 2017. On the pre-
dictability of high water level along the U.S.
East Coast: Can the Florida Current measure-
ment be an indicator for flooding caused by
remote forcing? Ocean Dyn. 67(6):751-66.
https://doi.org/10.1007/s10236-017-1057-0.
Ezer, T., Atkinson, L.P., Corlett, W.B., &
Blanco, J.L. 2013. Gulf Stream’s induced sea
level rise and variability along the U.S. mid-
Atlantic coast. J Geophys Res. 118(2):685-97.
https://doi.org/10.1002/jgrc.20091.
Ezer, T., Atkinson, L.P., & Tuleya, R. 2017.
Observations and operational model simula-
tions reveal the impact of Hurricane Matthew
(2016) on the Gulf Stream and coastal sea
level. Dyn Atm Oceans. 80:124-38. https://
doi.org/10.1016/j.dynatmoce.2017.10.006.
Ezer, T., & Corlett, W.B. 2012. Is sea level
rise accelerating in the Chesapeake Bay? A dem-
onstration of a novel new approach for analyz-
ing sea level data. Geophys Res Lett. 39(19):
L19605. https://doi.org/10.1029/2012GL053435.
Folke, C. 2006. Resilience: The emergence
of a perspective for social-ecological systems
analyses. Global Environ Change. 16:253-67.
http://www.ecologyandsociety.org/vol15/iss4/
art20/. https://doi.org/10.1016/j.gloenvcha.
2006.04.002.
Gill, S.K., & Fisher, K.M. 2008. A network
gaps analysis for the National Water Level
Observation Network. NOAA Technical
Memorandum NOS CO-OPS 0048. Avail-
able at: https://tidesandcurrents.noaa.gov/
publications/Technical_Memorandum_
NOS_COOPS_0048.pdf.
Hanson, J., Blanton, B., Gamiel, K., Bushnell,
M., & Thomas, J. 2014. Wave Observations
and Forecast Modeling to Support Develop-
ment of Virginia Offshore Wind Energy.
Report submitted to the Commonwealth of
Virginia Department of Mines, Minerals and
Energy for RFP #14DE01. Topic 2. Available
at: http://wind.jmu.edu/offshore/documents/
Waves%20Observation%20and%20Forecast
%20Modeling%20to%20Support%20Development
%20of%20Virginia%20Offshore%20Wind%
20Energy,%20October%202014.pdf.
Jones, C., An, K., Blom, R., Kent, J., Ivins, E., &
Bekaert, D. 2016. Anthropogenic and geologic
influences on subsidence in the vicinity of
New Orleans, Louisiana. Journal of Geophysical
Research: Solid Earth. 121(5):3867-3887.
https://doi.org/10.1002/2015JB012636.
Loftis, J.D. 2017. “Catch the King” tide thank
you and review. CCRFR Thank you and Re-
view Community Event at ODU, Dec. 13,
2017. William & Mary Publish Digital Ar-
chive. https://doi.org/10.21220/V5Z14X.
Loftis, J.D., Forrest, D.R., Katragadda, S.,
Spencer, K., Organski, T., Nguyen, C., &
Rhee, S. 2018. StormSense: A new inte-
grated network of IoT water level sensors
in the smart cities of Hampton Roads,
VA. Mar Technol Soc J. 52(2):(in this
issue). https://wm1693.box.com/s/
j501eg525rtqnya41n2dfm6a0o4yx7gh.
Loftis, J.D., Forrest, D.R., & Spencer, K.
2017b. StormSense Project: Forecasting flood-
ing from storm surge, rain & tide. William
& Mary Publish Digital Archive. https://doi.
org/10.21220/V5GM9B.
Loftis, J.D., Wang, H.V., DeYoung, R.J., &
Ball, W.B. 2016. Using Lidar elevation data
to develop a topobathymetric digital elevation
model for sub-grid inundation modeling at
Langley Research Center. J Coastal Res. 76(sp1):
134-48. https://doi.org/10.2112/SI76-012.
Loftis, J.D., Wang, H., Forrest, D., Rhee, S.,
& Nguyen, C. 2017a. Emerging flood model
validation frameworks for street-level inunda-
tion modeling with StormSense. SCOPE’17
Proceedings of the 2nd International Work-
shop on Science of Smart City Operations and
Platforms Engineering, 2(1):13-8. https://doi.
org/10.1145/3063386.3063764.
Loftis, J.D., Wang, H.V., & Forrest, D.R.
2017c. Catch the king tide with StormSense
on Nov. 5th: How you can help crowd-source
tidal flood event calibrations for Hampton
Roads’ newest water level sensors. William
& Mary Publish Digital Archive. https://doi.
org/10.21220/V5MB1S.
Sallenger, A.H., Jr., Doran, K.S., & Howd,
P.A. 2012. Hotspot of accelerated sea-level
rise on the Atlantic coast of North America.
Nat Clim Change. 2(12):884-8. https://doi.
org/10.1038/nclimate1597
Scrivani, J. 2016. Introduction to LiDAR in
Virginia. VITA Webinar Series. Available at:
https://www.vita.virginia.gov/media/
vitavirginiagov/integrated-services/pdf/Lidar.
pdf (accessed June 15, 2016).
Steinhilber, E.E., Boswell, M., Considine, C.,
& Mast, L. 2016. Hampton Roads Sea
Level Rise Preparedness and Resilience Inter-
governmental Pilot Project. Phase 2 Report:
Recommendations, Accomplishments and
Lessons. Available at: http://digitalcommons.
odu.edu/hripp_reports/2/. (accessed January
13, 2017).
Taylor, L.A., Eakins, B.W., Carignan, K.S.,
Warnken, R.R., Sazonova, T., Schoolcraft,
D.C.,& Sharman, G.F. 2008.Digital Elevation
Model of Virginia Beach, Virginia: Procedures,
Data Sources and Analysis, NOAA Technical
Memorandum NESDIS NGDC-7. Boulder,
CO:National Geophysical Data Center, 34 pp.
Thatcher, C.A., Brock, J.C., Danielson, J.J.,
Poppenga, S.K., Gesch, D.B., Palaseanu-
Lovejoy, M.E.,…Gibbs, A.E. 2016. Creating a
Coastal National Elevation Database (CoNED)
for science and conservation applications. J Coast
Res. 76(sp1):64-74. https://doi.org/10.2112/
SI76-007.
Toll, R. 2018. An intergovernmental blue-
print for community resiliency, The Hampton
Roads sea level rise preparedness and resilience
intergovernmental pilot project. Mar Technol
Soc J. 52(2):(in this issue).
VGIN VITA. 2015. GIS Strategic Plan 2015–
2020. Available at: https://www.vita.virginia.
gov/media/vitavirginiagov/integrated-services/
pdf/GIS_Strategic_Plan_Final_Mar19.pdf.
(accessed November 1, 2017).
82 Marine Technology Society Journal
Appendix AHampton Roads, VA, Sensor Assets and Public Web API URLs for Near-Real Time Water Level Data (http://www.vims.edu/people/loftis_jd/HRVASensorAssets/index.php)
Appendix BCoastal Flooding Products Available Near Hampton Roads, VA, from Illuminating the Challenges: Flood Data to LocalAction Workshop, September 2016 (https://wm1693.box.com/s/a8vgidonn4wmhkzx2l287n7t3zp8srgl)
March/April 2018 Volume 52 Number 2 83