Embed Size (px)
Citation preview

1
Deliverable D7.2
Integrated Pilot and Evaluation
Report
Editor David Dietrich (LUH)
Contributors Javier Melián (ATOS), Thomas Pliakas (CLDST), Michael
McGrath (INTEL), Piredda Matteo (ITALTEL), Josep Batallé
(I2CAT), Panagiotis Papadimitriou (LUH), George Xylouris
Chris Xilouris (NCSRD), Jorge Carapinha, José Bonnet, João
Silva (ALB), Alexander Phinikarides (PTL), Georgios Gardikis
(SPH), Evangelos Markakis, George Alexiou, Evangelos
Pallis (TEIC), Nicolas Herbaut, David Bourasseau (VIO), Irena
Trajkovska, Piyush Harsh (ZHAW)
Version 1.0
Date December 31st, 2016

T-NOVA | Deliverable D7.2 Integrated Pilot and Evaluation Report
©T-NOVA
Consortium
2
Executive Summary
This deliverable documents the pilot integration and evaluation phase of the FP7
project T-NOVA (tasks T7.1 and T7.2). The pilot site integration and deployment work
in Task 7.1is focused on consolidating the system components developed within the
technical work packages WP3, WP4, WP5, and WP6. This work has partially been
documented in the deliverable D7.1 (Early Pilot Site Deployment) while this deliverable
considers only the pilot’s final stage. Task T7.2 comprises the system- and service-level
evaluation phase which took place during the final year of the project.
The aim of this deliverable is to provide a proof-of-concept by presenting the
achievements with regards to the T-NOVA pilot. These achievements are compared
with the overall requirements that were formulated in the first year of the project. This
deliverable contains,
A description of the final setup of the multi-PoP T-NOVA pilot. Three pilot
setups were built, in Athens (hosted by NCSRD), Aveiro (hosted by ALB/PTIN)
and Hannover (hosted by LUH).
A system-level evaluation that considers the predefined use-cases and the
interaction of certain T-NOVA components. All Use Cases, as defined in D2.1
were tested and validated.
A service-level evaluation that reflects the user-oriented assessment of results
from the customer side. In addition, this deliverable highlights demonstrations
that showcase several applications, with the aim to enrich the service-level
evaluation. Three end-to-end demonstration scenarios are presented: Scaling
of a VNF (vSBC), Scaling of a VNF (vHG) and end-to-end Network Service
deployment over a multi-PoP infrastructure.
Distribution PUBLIC (PU)

T-NOVA | Deliverable D7.2 Integrated Pilot and Evaluation Report
©T-NOVA
Consortium
3
Index of Figures
Figure 1 Final setup for the Hannover Pilot .................................................................................. 11
Figure 2 Difference between white box and black box testing ............................................. 13
Figure 3 Selected NS ............................................................................................................................. 23
Figure 4 Running instances ................................................................................................................. 23
Figure 5 SLA agreements running .................................................................................................... 23
Figure 6 Mapping, provisioning and SFC creation times ........................................................ 27
Figure 7 Transcoding score evolution ............................................................................................ 43
Figure 8 Load / CPU utilization .......................................................................................................... 45
Figure 9 Alarm due to memory overuse ........................................................................................ 46
Figure 10 Penalties ................................................................................................................................. 48
Figure 11 Monitoring information ................................................................................................... 48
Figure 12 SLA Dashboard .................................................................................................................... 48
Figure 13 Revenue Sharing report for Function Provider ....................................................... 50
Figure 14 Bill owed by Service Provider to every Function provider(s) .............................. 51
Figure 15 Incoming Revenue reports for the Service Providers from all its customers
....................................................................................................................................................................... 51
Figure 16 Customer Bill for using various Services .................................................................... 52
Figure 17 DB entries showing lifecycle events captured by Cyclops collector ................ 52
Figure 18 DB entries showing usage values after post processing of lifecycle events by
Cyclops ....................................................................................................................................................... 53
Figure 19 Latency in Seconds vs number of records processed for generation of a
revenue sharing report by Cyclops .................................................................................................. 54
Figure 20 Latency in Seconds vs number of records processed for bill generation by
Cyclops ....................................................................................................................................................... 55
Figure 21 Network Service to be deleted ...................................................................................... 58
Figure 22 Network Service to State DELETING (Termination in Progress) ........................ 58
Figure 23 Network Service terminated and removed ............................................................... 59
Figure 24 Verify a NSD that exist in "My Services"@SP view................................................. 59
Figure 25 NSD is available to be purchased “”Buy Services”@Customer view ............... 60
Figure 26 NSD was removed "My Services" @SP view ............................................................ 60
Figure 27 Removed NSD is not available for purchase any more at "My
Services"@Customer view ................................................................................................................... 61
Figure 28 Starting Conditions ............................................................................................................ 63
Figure 29 Scale-out scenario .............................................................................................................. 64
Figure 30 Scale-in scenario ................................................................................................................. 65
Figure 31 Start of the VDUs ................................................................................................................ 67
Figure 32 TeNOR logs (step 3.2) ....................................................................................................... 67
Figure 33 TeNOR logs (step 3.3) ....................................................................................................... 68
Figure 34 TeNOR logs (step 4.2) ....................................................................................................... 68
Figure 38 Multi-PoP demo setup ..................................................................................................... 71
Figure 36 TeNOR / NSD ....................................................................................................................... 72
Figure 37 OpenStack dashboard ...................................................................................................... 73
Figure 38 Netfloc / logs ....................................................................................................................... 73
Figure 39 Restconf web interface ..................................................................................................... 74
Figure 40 Physical setup of SFC PoP environment in Aveiro pilot tesbed ........................ 79
T-NOVA | Deliverable D7.2 Integrated Pilot and Evaluation Report
©T-NOVA
Consortium
4
Figure 41 OVS bridge setup after Netfloc-OpenStack integration in PoP2 ..................... 82
Figure 42 Components of the SFC and their connections in the PoP ................................ 84
Figure 43 Service chains list API based on RESTCONF RPC ................................................... 85

T-NOVA | Deliverable D7.2 Integrated Pilot and Evaluation Report
©T-NOVA
Consortium
5
Index of Tables
Table 1 Deliverable Interdependencies ............................................................................................ 8
Table 2 Test cases for system-level validation ............................................................................. 17
Table 3 Image uploading times......................................................................................................... 18
Table 4 Duration of selected management operations ........................................................... 20
Table 5 Curl commands used in latency estimates of Cyclops interface ........................... 53

T-NOVA | Deliverable D7.2 Integrated Pilot and Evaluation Report
©T-NOVA
Consortium
6
Table of Contents
1. INTRODUCTION ....................................................................................................... 8
AIM AND SCOPE ................................................................................................................................ 8
DELIVERABLE INTERDEPENDENCIES ................................................................................................. 8
DOCUMENT STRUCTURE .................................................................................................................. 9
2. FINAL PILOT SITE SETUP ....................................................................................... 10
ATHENS PILOT ................................................................................................................................. 10
AVEIRO PILOT .................................................................................................................................. 10
HANNOVER PILOT ........................................................................................................................... 10
3. TESTING METHODOLOGY ..................................................................................... 12
WHITE BOX AND BLACK BOX TESTING .......................................................................................... 12
FUNCTIONAL TESTS AND LOAD TESTS........................................................................................... 14
APPLICATION OF THE TESTING METHODOLOGY TO T-NOVA................................................... 16
CONCLUSIONS ................................................................................................................................. 16
4. SYSTEM-LEVEL VALIDATION................................................................................. 17
UC1 ADVERTISE VNFS................................................................................................................... 18
4.1.1. Additional tests on instantiation time ......................................................................... 19
UC2.1 BID / TRADE ........................................................................................................................ 20
UC2.2 BROWSE / SELECT OFFERING ............................................................................................. 21
UC3.1 MAP AND DEPLOY SERVICE ............................................................................................... 24
UC3.2 DEPLOY AND TEST SFC ..................................................................................................... 24
4.5.1. Netfloc startup, resource creation and service invocation phase ....................... 26
4.5.2. SFC creation via TENOR NSD ......................................................................................... 26
4.5.3. WICM startup & VNFs up and running ...................................................................... 27
4.5.4. Achievements ....................................................................................................................... 28
UC4.1 SCALE-OUT/SCALE-IN ....................................................................................................... 28
4.6.1. Scale-out: VDU (Border Gateway Function) in VNF (vSBC) ................................. 28
4.6.2. Scale-in: VDU (Border Gateway Function) in VNF (vSBC) .................................... 32
4.6.3. Scale-out: VDU (Worker) in VNF (vHG) ...................................................................... 39
4.6.4. Scale-in: VDU (Worker) in VNF (vHG) ......................................................................... 41
UC5 MONITOR NFV SERVICES ..................................................................................................... 43
UC5.1 MONITOR SLA ................................................................................................................... 46
UC6 BILL NFV SERVICES ................................................................................................................ 48
4.9.1. Validation Results (Screenshots) .................................................................................... 50
4.9.2. Validation Results: latency .............................................................................................. 53
UC7.1/UC7.2 TERMINATE NFV SERVICES, DELETE NSD ...................................................... 55
4.10.1. Validation Results: Screenshots ................................................................................... 57
4.10.2. Validation Results: Measurements ............................................................................. 61
5. DEMONSTRATIONS ............................................................................................... 62
DEMO 1: SCALING A VNF: VSBC ............................................................................................... 62
5.1.1. Abstract/Description .......................................................................................................... 62
T-NOVA | Deliverable D7.2 Integrated Pilot and Evaluation Report
©T-NOVA
Consortium
7
5.1.2. Motivation ............................................................................................................................. 62
5.1.3. Storyboard ............................................................................................................................. 63
5.1.4. Validation .............................................................................................................................. 65
DEMO 2: SCALING A VNF: VHG ................................................................................................. 65
5.2.1. Abstract/Description .......................................................................................................... 65
5.2.2. Motivation ............................................................................................................................. 65
5.2.3. Storyboard ............................................................................................................................. 65
5.2.4. Validation .............................................................................................................................. 66
DEMO 3: END-2-END NS DEPLOYMENT OVER MULTI-POP INFRASTRUCTURE ..................... 69
5.3.1. Abstract/Description .......................................................................................................... 69
5.3.2. Motivation ............................................................................................................................. 69
5.3.3. Storyboard ............................................................................................................................. 69
5.3.4. Validation .............................................................................................................................. 70
6. CONCLUSIONS ........................................................................................................ 75
7. REFERENCES ............................................................................................................ 76
LIST OF ACRONYMS ................................................................................................... 77
ANNEX I: DEPLOYMENT OF SFC COMPONENTS IN THE AVEIRO PILOT .............. 79
NETFLOC SETUP AND SFC DEPLOYMENT ..................................................................................... 79
7.1.1. Prerequisites ......................................................................................................................... 80
7.1.2. Maintaining consistency with the OpenDaylight Maven repository ................. 80
7.1.3. Netfloc and OpenStack integration process .............................................................. 81
7.1.4. Configuring OpenStack HEAT for Netfloc .................................................................. 83
7.1.5. Service chain deployment ................................................................................................ 83
7.1.6. Service chain APIs and flows repository ...................................................................... 84

T-NOVA | Deliverable D7.2 Integrated Pilot and Evaluation Report
©T-NOVA
Consortium
8
1. INTRODUCTION
The final year of the T-NOVA project was focused on completing pilot implementations
and carrying out associated evaluation work. First, the correct interplay between all the
T-NOVA sub systems that were finally integrated together in the initial pilot was
verified, and in addition, a multi-PoP deployment of the T-NOVA pilot provided proof
point for the T-NOVA concept at a larger scale.
Aim and Scope
Deliverable D7.2 presents the final results from tasks T7.1 and T7.2. It comprises
documentation of the final multi-PoP pilot setup and an evaluation report. The
evaluation considers the T-NOVA system as end-to-end system and a deployment
across multiple sites (PoP). The test cases, including metrics and test sequences, are
developed based on the requirements defined during the early phases of the project.
The main part is the system-level evaluation of T-NOVA components such as the
measurement of the run time execution of specific tasks. Beyond that, the service-level
evaluation considered rather subjective metrics, i.e., the service quality perception of
the users. Exist components that have been already evaluated within the work packages
WP3, WP4, WP5 and WP6 such as single VNFs or details of SDN implementation are
not in the scope within this deliverable.
Deliverable Interdependencies
The work associated with this deliverable depends on input from work package 2
(WP2), which provided the system definition and requirements. Additionally, initial
plans for testing, where initially defined in that document. Within work package WP7,
deliverable D7.1 represents the technical basis for the pilot deployment. The following
table lists the deliverables which provide the basis for this deliverable.
Table 1 Deliverable Interdependencies
Deliverable Name Description Reference
D2.1 – System Use Cases and
Requirements
D2.1 describes use cases that are used
as a basis for the test case
formulations in D7.2, i.e., system-level
evaluation. In addition, D2.1 contains
system-level requirements to be met
during the system evaluation phase.
[D2.1]
D2.22 – Overall System Architectures
and Interfaces
The system use cases initially defined in
D2.1 have been refined in D2.22 based
on the finalization of the system
architecture. The sequence of steps to
be validated in D7.2 was added.
[D2.22]
D2.51/D2.52 - Planning of trials and
evaluation
D2.51/2.52 present the procedures that
were followed for the deployment of
the IVM components. Furthermore,
[D2.51,
D2.52]

T-NOVA | Deliverable D7.2 Integrated Pilot and Evaluation Report
©T-NOVA
Consortium
9
Document Structure
The deliverable is structured as follows:
Section 1 provided a general overview and pointers to the relevant T-NOVA
deliverables. This chapter also summarizes the pilot setup and the used test
cases and metrics.
Section 2 describes testing methodology including tools for automated testing
and evaluation.
Section 3 is the core chapter for the system-level evaluation in which a detailed
test plan including evaluation results is shown for each use case.
Section 4 shows the service-level validation of T-NOVA and focuses on
demonstrations.
Section 5 highlights the conclusions of the evaluation of the integrated pilot.
lessons learnt from the deployment
and integration efforts, as well as the
interactions of the components are
presented. A walkthrough is provided
as a technical guide for the
implementation of an NFVI testbed,
aiming at those who intent to replicate
a similar deployment.
D7.1 – Early Pilot Site Deployment
D7.1 provides a technical guide for the
installation and integration of T-NOVA
components and the integration of the
additional PoPs in Aveiro and
Hannover
[D7.1]

T-NOVA | Deliverable D7.2 Integrated Pilot and Evaluation Report
©T-NOVA
Consortium
10
2. FINAL PILOT SITE SETUP
The T-NOVA platform was deployed in
Athens-Heraklion1-pilot (Reference Pilot)
Aveiro Pilot (full installation), and
Hannover Pilot (NFVI PoP).
The following subsections provide an update to D2.52, (see Sec. 4.2) [D2.52] that
contains an initial description of the T-NOVA pilots and to the detailed technical
description included in D7.1 (see Sec. 3).
Athens Pilot
This section describes in the final deployment in Athens of T-NOVA Pilot. As per D7.1,
this was during the development and integration phases the main site for T-NOVA
experimentations. The other pilots are connected via VPN links to this Pilot forming a
star topology over the internet.
As this Pilot was incrementally deployed and used over the course of the project D7.1
already gathers all the integration and validation results. We ask the reader to consult
[D7.1] for the details. This document elaborated more on the new extensions of the T-
NOVA infrastructures in the next subsections.
Aveiro Pilot
In addition to the technical description of the technical pilot included in D7.1 and
D2.52, this section describes the additional developments required for the use case
validation, in specific the Netfloc setup and Service Function Chaining (SFC)
deployment on Aveiro Pilot. The technical procedure is described in detail in Annex I.
Hannover Pilot
Hannover Pilot as discussed in D7.1 was used for focused experimental work in the
mapping algorithms. After the interconnection and testing Athens – Aveiro
infrastructures, Hannover infrastructure was mostly used as another PoP for
deployment of VNFs using TeNOR from Athens pilot.
Hannover pilot consists of a controller node (that also provides gateway service) and
multiple compute nodes. These compute nodes are taken out of the pool of 75 multi-
core servers that are jointly used with the Emulab testbed of LUH. The Hannover pilot
represents an NFVI PoP controlled from the reference pilot. Figure 1 shows the network
configuration for the integration of Hannover pilot into T-NOVA.
1 Initially considered full deployment of NFVI-PoP in Heraklion was not fully adopted. The full
deployment of T-NOVA components was based in Athens and testing versions of the
Marketplace and the NF Store were eventually deployed in Heraklion. However, this decision
did not affect the evaluation campaigns.

T-NOVA | Deliverable D7.2 Integrated Pilot and Evaluation Report
©T-NOVA
Consortium
11
Figure 1 Final setup for the Hannover Pilot

T-NOVA | Deliverable D7.2 Integrated Pilot and Evaluation Report
©T-NOVA
Consortium
12
3. TESTING METHODOLOGY
The present section describes an approach to testing which can be applied in an
industrial environment, for the realisation of commercial products.
In the T-NOVA project, where a prototypical system is being developed, only a subset
of the tests described below are executed, due to the effort required and to time and
resources available.
The first step is the definition of the System Under Test (SUT), which can be the whole
System, or a component.
The definition of the SUT is important, because the type of test to be executed and the
SUT have a mutual influence: on the one hand, a given test may stimulate just one part
of the System (this part is the SUT); on the other hand, the choice of a given SUT (part
of the System) implies the execution of specifically designed tests.
Moreover, as explained below, a given test may stimulate in different ways different
subsystems of the SUT, so that we can have a global test which is simultaneously a
functional test for one subsystem and a load test for another subsystem.
The conditions of the SUT are to be known before the start and after the stop of each
test.
White box and black box testing
The system tests can be executed in two different ways:
White box tests
Black box tests
A combination of black box and white box tests can also be executed.
A white box test consists of stimulations of the system (or of parts of it) and observation
of its internal modifications.
What is needed to execute such tests is:
Knowledge of the internal structure of the system (hardware and software
architecture, data structures and so on)
Knowledge of the instruments for internal investigation of the system (CLI
commands, GUI)
In the black box testing, a deep knowledge of the system is not strictly needed, because
all actions to verify the success of tests are executed are from the point of view of the
user (here “user” is intended in the most general sense): if the user expects a service to
be offered with a specific SLA, what must be verified is the compliance to the SLA; this
compliance can be verified by processing the data made available by the test
environment (mainly: test instruments), with limited or even no access to the internal
structure of the system.
The combined white box and black box testing allows the observation of the system
reactions to stimulations from the point of view of the user (external observation

T-NOVA | Deliverable D7.2 Integrated Pilot and Evaluation Report
©T-NOVA
Consortium
13
through test instruments) and considering the system (observation of the internal parts
of it).
The advantage of the combined white box and black box approach is that some
internal observation of the system may allow the detection of defects that should
otherwise be detected through the execution of very long tests.
The following figure can be used to illustrate the difference between white box and
black box testing.
Figure 2 Difference between white box and black box testing
The SUT is stimulated through Channel A (with requests by the user, calls, etc.).
In white box testing, the reactions of the SUT to the stimulations are observed by
means of the Testing Environment (e.g. counters of the testing instruments) and
through Channel B (reading of the CPU status, memory consumption, status of the
subsystems etc.).
In black box testing, Channel B isn’t used at all and the evaluation of the behaviour of
the SUT is based only on the information provided by the Testing Environment.
In a combined white box and black box approach, the use of Channel B is limited to
the information that would be too expensive if obtained only through Channel A (as
an example, consider the case of memory leak: a simple reading of the free memory
value avoids the execution of a potentially very long test leading to the total
consumption of memory, which is the only way to detect a leak in the black box
approach).
As an example of white box testing, let’s consider for the T-NOVA System the following
steps for a test which involves the Orchestrator functionalities:
Verify that all memory and CPU resources are free
Start a VNF consisting of one instance
stimulate the system so that a second instance is needed to guarantee the
fulfilment of the SLA
verify (through a GUI or a CLI) that the second instance has been really activated
SYSTEM UNDER TEST (SUT)
User Interface Operator Interrface
Testing Environment
Channel A Channel B

T-NOVA | Deliverable D7.2 Integrated Pilot and Evaluation Report
©T-NOVA
Consortium
14
stop or reduce the stimulation of the system to such an extent that the second
instance of the VNF is no more needed
verify (through a GUI or a CLI) that, after a transient, the second instance has
been deactivated
stop the stimulation of the system
stop and terminate the VNF
verify that all memory and CPU resources are free and available for future usage
The above test, in the black box version, might consist of the following steps:
Start a number of VNF’s, consisting of one instance, such that the system has
enough memory and CPU resources for just another instance of the VNF
stimulate one of the VNF’s so that a second instance is needed to guarantee
the fulfilment of the SLA
verify that the second instance has been really activated, i.e.: verify that, after a
transient, the SLA is properly fulfilled (measure the quality parameters on the
test instruments, whatever the system can say about the number of instances
activated)
stop or reduce the stimulation of the system to such an extent that the second
instance of the VNF is no more needed
wait for the second instance to be deactivated
stimulate a different VNF so that a second instance is needed to guarantee the
fulfilment of the SLA
verify that the second instance has been really activated, i.e.: verify that, after a
transient, the SLA is properly fulfilled (measure the quality parameters on the
test instruments, whatever the system can say about the number of instances
activated; this verification guarantees that the instance activated in the first step
has been properly deactivated and the resources have been correctly released,
for otherwise the system wouldn’t have enough resources for the activation of
the instance in the second step)
stop the stimulation of the system
stop and terminate the VNF
As already pointed out, in the black box approach the verification of the proper release
of all the memory and CPU resources at the end of the test can be executed only in an
indirect way, by repeating the test a high number of times: if, at each iteration, a quota
of the memory or CPU resources isn’t released, the system will transit in a block
condition, or, at least, in a condition which doesn’t allow SLA compliance.
The white box approach is easier, because it requires less time, fewer steps and less
stimulation of the system.
On the other hand, the black box approach is more likely to detect conditions of failure
as perceived by the user, no matter what the internal detection instruments (GUI or
CLI) may claim.
Functional tests and load tests
Functional tests aim to verify the correct behaviour of each unique functional element
of the system.

T-NOVA | Deliverable D7.2 Integrated Pilot and Evaluation Report
©T-NOVA
Consortium
15
No attention is given to the concurrent stimulation of more functionalities nor on the
rate of execution, which is the scope of the load tests.
A functional test cannot detect defects related to the concurrent execution of multiple
stimulations of the same kind or of different kinds (e.g. more users connected, more
simultaneous calls, etc.).
The correctness of the system behaviour in real conditions is verified through the load
tests.
In the load tests the attention is focused on the activities that can overload the system
or a subsystem in terms of:
Number of operations per time unit (in the T-NOVA System: calls per second,
scaling per second, Start/Stop/Terminate per second, etc.) consumption of
CPU resources
Number of concurrent operations (in the T-NOVA System: number of calls
simultaneously active, number of customers simultaneously connected, etc.)
consumption of memory resources
Load tests include:
Maximum capacity tests
Overload tests
Stability tests
Robustness tests
A maximum capacity test measures the maximum number of operations (in the most
general sense) the system can execute while respecting specific requisites (or
complying a SLA).
An overload test verifies the correct behaviour of the system in overload conditions,
i.e. when the number of requests received the system is higher than its maximum
capacity.
Correct behaviour in overload conditions means that the system:
Serves correctly a significant quota of the offered requests while rejecting the
exceeding part
Recovers quickly when the overload conditions cease
A stability test is a long duration test (maybe one night or one week-end) where the
system works in conditions not far from the maximum capacity (say 70% the maximum
capacity).
The system is supposed to maintain the expected grade of service for the whole
duration of the test.
A typical stability test often includes more stimulations (for the T-NOVA System:
different types of calls, different customer activities, etc.) which involve more
subsystems (Marketplace, Orchestrator, VNF’s, etc.).
A robustness test aims to verify that the system recovers the correct working conditions
after a failure.
The result of the execution of the functional and the load tests is the validation of the
system.

T-NOVA | Deliverable D7.2 Integrated Pilot and Evaluation Report
©T-NOVA
Consortium
16
Application of the testing methodology to T-NOVA
The testing of the T-NOVA System can be structured in three phases:
VNF testing (both functional and load) performed locally by the developers
Integration of the VNF’s into the whole system, followed by the functional
tests defined based on the specified use cases (pilot sites)
Final validation through the load tests (maximum capacity, overload, stability
and robustness) of the whole system
In the T-NOVA System, some tests involve just one level, while others involve multiple
levels.
As an example, tests described in sections 5.1.1 through 5.1.4 in [D2.52] involve just
one level (Marketplace plus Network Function Store).
On the other hand, tests described in sections5.1.5 through 5.1.8 involve at least two
levels (Orchestrator and VNF).
In the latter tests, a stimulation on the VNF (e.g. increasing traffic) produces a
stimulation of the Orchestrator (scaling of the VNF).
Moreover, we can have a different type of test at different levels: a functional test for
the Orchestrator (single scaling of a VNF) implies a load test for the VNF (the traffic
must be increased to such extent that the maximum capacity of the single instance is
exceeded).
Conclusions
In the previous sections, we have described the general steps required for the testing
of a product in an industrial environment.
For the T-NOVA System, due to limits related to time, effort and resources, the most
reasonable approach to be adopted is as follows:
Execution of local tests on the single VNF’s
Integration of the VNF’s and execution of functional tests according to the
specified use cases, in a combined black box and white box approach

T-NOVA | Deliverable D7.2 Integrated Pilot and Evaluation Report
©T-NOVA
Consortium
17
4. SYSTEM-LEVEL VALIDATION
This section provides the system-level validation of the T-NOVA components. Tests
were based on the use cases that have been developed in the early project stage –
documented in [D2.52]. The preparation for the testing of these use cases included an
extension that describes the exact testing procedure, involved components, evaluation
metrics and expected results. This work is documented in the following subsections
each describing one use case. Table 2 summarizes the use cases of the testing
campaign.
Table 2 Test cases for system-level validation
Test Case Description Validation / Purpose
UC1 Advertise VNFs Image uploading, interaction with FP
UC2.1 Bid/trade Bidding/trading procedure
UC2.2 Browse/select offerings User interaction
UC3.1 Map and deploy service Mapping algorithms
UC3.2 Deploy and test SFC Service function changing and
correctness
UC4.1 Scale-out/scale-in Resource management / SLA fulfilment
under scaling operations
UC5 Monitor NFV services Service states, resource consumption and
utilization
UC5.1 Monitor SLA SLA states, violation reports
UC6 Bill NFV services Billing procedure for customers and SPs
based on accounting and SLAs
UC7.1 Terminate NFV services NFV service termination by customer
UC7.2 Delete NSD SP removes service from catalogue

T-NOVA | Deliverable D7.2 Integrated Pilot and Evaluation Report
©T-NOVA
Consortium
18
UC1 Advertise VNFs
Below table shows average image uploading times for images of size 1, 2 and 4 GBytes.
Table 3 Image uploading times
Image Size Uploading Time Total Uploading time
1GB 1m 44s 2m 23s
2GB 4m 20s 5m 20s
Test Case: UC 1 Advertise VNFs
Identifier UC1
Metrics Image upload time
System response time (VNF availability time)
NF Store specific database performance metrics e.g. query time
Purpose This UC is related to the interactions required for a FP to publish and
advertise a VNF.
Configuration Involved T-NOVA components: FP Dashboard, Marketplace, NF Store,
TeNOR
Tools -
References D2.22, Sec. 4.1; D2.52, Sec. 5.1.2
Pre-test
conditions
There is an offline exchange of authorisation information and certification
for each FP, subject to bilateral discussions between the FP and the SP,
acceptance of the Terms of Service etc.
Test Sequence Step Type Description Result
1 Stimulus Authenticated FP uploads
the VNF package
2 Check VNF finally registered in
the offerings
Duration of
certification,
assignment and
registration process
Test Verdict Fast response of the dashboard for the
uploading of the VNF Quick update of the
service catalogues.

T-NOVA | Deliverable D7.2 Integrated Pilot and Evaluation Report
©T-NOVA
Consortium
19
4GB 8m 03s 12m 27s
4.1.1. Additional tests on instantiation time
To experiment with instantiation time and VNF image size, the vPXaaS image was
produced in two versions: 1) a “fat” version, using the original image produced using
vagrant and, 2) a “lean” version, by optimizing the free disk space of the same image.
In the latter case, the original image’s free space was zeroed by writing zeroes from
/dev/zero to a file in /tmp, using dd, inside a booted instance. When all disk space was
filled up, the file was deleted, therefore freeing up disk space to the OS. The instance
was then shut down and the disk image was resized and compressed with “qemu-img
convert $IN –c -O qcow2 $OUT”, where $IN was the path of the existing disk image
and $OUT was the path of the new image. For reference, the original vPXaaS VNF image
was 4.4 GB prior to optimization and 1.1 GB post-optimization.
A VNFD and NSD was created for each of the two cases described in the previous
paragraph. A focused experimentation in times of low usage of the T-NOVA
infrastructure (two deployed VNFs and no activity at the time of testing) yielded results
that have shown that the NSD which used the VNFD of the “lean” image was deployed
faster than the alternative, “fat” image. In terms of instantiation time, the “fat” image
took 7:17 mins to appear as “START” in the marketplace, whereas the “lean” image took
only 4:30 mins, an improvement of 45% over the “fat” image.
These results can be extrapolated to times of medium/high usage of the T-NOVA
platform. It can be inferred that the overall responsiveness of the system will be
improved if the VNFs follow the lean approach outlined above.

T-NOVA | Deliverable D7.2 Integrated Pilot and Evaluation Report
©T-NOVA
Consortium
20
UC2.1 Bid / trade
Table below illustrates the average duration of management operations (providing
lists, process requests, etc.)
Table 4 Duration of selected management operations
Operation Duration (sec)
VNF LISTING (BROKER): 0.3s
TRADE REQUEST (BROKER): 0.7s
TRADE ACCEPT/REJECT OFFER(BROKER): 0.4s
SERVICE CATALOG LISTING: 0.3s
Test Case: UC 2.1 Bid / trade
Identifier UC2.1
Metrics Elapsed time since the customer sends the requirement until
the system returns the NS
Purpose Validation of the bidding / trading procedure using the brokerage
platform
Configuration Involved T-NOVA components: Customer Dashboard, SLA Management
Module, Brokerage Module
Tools -
References D2.22, Sec. 4.2.1; D2.52, Sec. 5.1.3
Pre-test
conditions
The customer has selected a NS that is offered via Service Catalogue and
requires brokerage.
Test Sequence Step Type Description Result
1 Stimulus Initiate bidding procedure
2 Check Offerings to customer
(NS)
Bidding / trading
duration
Test Verdict Brokerage platform returns the appropriate NS
matching the requirements set by the Customer.
Validate that the returned NS is always the best
fit to the customer requirements.

T-NOVA | Deliverable D7.2 Integrated Pilot and Evaluation Report
©T-NOVA
Consortium
21
UC2.2 Browse / select offering
Test Case: UC 2.2 Browse / select offerings: service + SLA agreement + pricing
Identifier UC2.2
Metrics Elapsed time between the customer introducing a search
parameter and the system showing a suitable service offerings.
Elapsed time since the customer has accepted the applicable
conditions and the SLA contract is stored in the SLA module
(including SLA parameters that will need to be monitored by
the orchestrator monitoring system)
Purpose This use case defines how the customer selects the service among the
offerings provided by the SP (service, SLA and pricing), and how the SLA
agreement is established among the different involved parties. A contract
is established between the Customer and Service Provider, and another
between Service Provider and Function Provider (also Infrastructure
Provider, if a separate actor), containing (among other things) target
service metrics.
Configuration T-NOVA components involved: SP Dashboard, Customer Dashboard,
Business Service Catalogue, SLA Management Module, Accounting,
TeNOR., vProxy VNF, vSA VNF
Tools -
References D2.22, Sec. 4.2.2; D2.52, Sec. 5.1.1; D6.1, Sec. 4; D6.3, Sec. 5.5
Pre-test
conditions
A T-NOVA customer has authenticated into T-NOVA system and has
performed a request. The SP has described the service offerings including
SLA specifications.
Test Sequence Step Type Description Result
1 Stimulus Customer applies
different search
parameters
There is no searching
filter
2 Check System reply: Service
options
-

T-NOVA | Deliverable D7.2 Integrated Pilot and Evaluation Report
©T-NOVA
Consortium
22
3 Stimulus The customer selects an
offering.
Selection of the NS
from the customer
dashboard
(Figure 3 Selected NS)
4 Check SLA negotiation
finished
Validated: The selection
of the NS implies the
acceptance of the SLA
conditions described
5 Stimulus NS instantiation Instantiation command
is sent to the
Orchestrator from the
customer dashboard.
(Figure 4 Running
instances)
see UC3 and UC3.1 for
different instantiation
times
6 Check SLA registration Validated: Once the NS
is correctly instantiated,
the SLA agreement for
the NS and for the
VNFs involved are
started: 0.5s (avg.)
(Figure 5 SLA
agreements running)
Test Verdict The dashboard must show in a reasonable time
the offerings available in the business service
catalogue matching the search parameters, the
conditions shown to the customer to be
accepted, and the SLA agreement between
customer and SP.

T-NOVA | Deliverable D7.2 Integrated Pilot and Evaluation Report
©T-NOVA
Consortium
23
Figure 3 Selected NS
Figure 4 Running instances
Figure 5 SLA agreements running

T-NOVA | Deliverable D7.2 Integrated Pilot and Evaluation Report
©T-NOVA
Consortium
24
UC3.1 Map and deploy service
Test Case: UC 3.1 Map and deploy services
Identifier UC3.1
Metrics Mapping algorithm (or respective LP solver) run time
Time to setup and activate the service from the moment the
request is submitted by the customer
Purpose Validation of the NFV service provisioning w.r.t. resource mapping
Configuration Involved T-NOVA components: IVM, Orchestrator, VNF
Tools -
References D2.22, Sec. 4.3.1; D2.52, Sec. 5.1.4
Pre-test
conditions
A customer has sent a request which is processed and handed over to
UC3.
Test Sequence Step Type Description Result
1 Stimulus Service mapping phase
2 Check Resource mapping Requested to
physical resources,
algorithm run time
Test Verdict The service should be fully operational after the
NFV service provisioning sequence. Algorithm
runtime does not exceed the magnitude of
seconds.
Initial evaluation results w.r.t. service mapping efficiency were already published in
[D3.3]. The algorithm run time measured in the T-NOVA pilot is less than 3 seconds
and thus UC3.1 is validated. This is true for the heuristic as well as for the MIP/LP-based
algorithm variants. For the latter, the maximum runtime can be limited at the price of
sub-optimality of the resource mapping results. This can be used to achieve runtimes
below the above reported 3 seconds or to support larger topologies.
UC3.2 Deploy and test SFC

T-NOVA | Deliverable D7.2 Integrated Pilot and Evaluation Report
©T-NOVA
Consortium
25
The goal of the tests performed was to validate Service function chaining as an
integrated solution among several T-Nova components. These tests were performed
only on the Demokritos Pilot (Aveiro Pilot task came a poteriori). However the results
should not differ to a significant extent between other similar Pilots.
Below table summarizes the UC 3.2, including the metrics and the test sequences
performed in the validation. The component set included in the use case is:
SDK4SDN (ZHAW) – the SDN-based set of toolkit and libraries for
datacenter network programming
WICM (PTIN) - specialised infrastructure manager for integrating VNFs
with WAN
TENOR (i2CAT) – T-Nova orchestrator
T-Nova VNFs
vTC: Traffic Classifier (Demokritos)
vTU: Virtual Transcoding Unit (Italtel)
Test Case: UC 3.2 Deploy Service Function Chaining
Identifier UC3.2
Metrics Time to setup and activate the service chain from the moment
the request is submitted (this should be done via Tenor, but for
current case heat is invoked manually)
Time to run the server script that initiated all VNFs
Time to setup the required vMT flows (manual task)
Purpose Validation of the SFC service chain setup and its correctness
Configuration Involved T-NOVA components: WICM, vMT, vTC, Netfloc, TENOR
Tools Heat, Netfloc, OpenStack, OpenDaylight, Neutron, PF_RING, mpeg
References D4.31, D4.32, D5.2, D5.31, D4.21
Pre-test
conditions
The orchestrator processes a request by the customer to create a SFC,
which is processed and handed over to UC3.3
Test Sequence Step Type Description Result
1 Check Resource creation and
service invocation phase
in Netfloc using Heat and
using TENOR
Neutron port IDs and
Chain ID returned –
SFC created

T-NOVA | Deliverable D7.2 Integrated Pilot and Evaluation Report
©T-NOVA
Consortium
26
2 Check Invoke VNF services and
WICM
Traffic flows correctly
from ingress to
egress in each VNF.
WICMis steering the
traffic to the SFC PoP.
3 Check Make manual port
detection and flow
installation for vMT VNF
Video is captured on
output node and
transcoding function
is applied
Test Verdict The service should be fully operational after the
chain is created and the VNFs are started. Video
stream output and ICMP messages are captured
on the final interface of the end user, as well as
on the intermediate interfaces within each of the
VNFs.
In continuation, we report the outcomes of each of the tests.
4.5.1. Netfloc startup, resource creation and service invocation
phase
• Netfloc startup time: running ./bin/karaf:
– 1min 40 sec – 1 min 45 sec
• OpenStack resource creation: networks and VNF VMs all specified via HoT:
heat stack create of demo_create
• Chain creation: create chain resource from same heat template
– 60 sec
• Expected output: VNFs created and running, Neutron port IDs and Chain ID
returned in heat stack info
4.5.2. SFC creation via TENOR NSD
Figure 6 depicts the time it takes for TeNOR to make a service mapping and
instantiation, as well as for Netfloc to create two service chains. The total time is also
shown. Overall, NSD creation time varies in the interval of approximately 1min for
Netfloc to create SFC via Heat, and a bit more, 1.3 min for Tenor to make the resource
mapping and instantiation in OpenStack (networks, subnets, VNFs).

T-NOVA | Deliverable D7.2 Integrated Pilot and Evaluation Report
©T-NOVA
Consortium
27
Figure 6 Mapping, provisioning and SFC creation times
4.5.3. WICM startup & VNFs up and running
• VNFs start-up time and flows installation. This includes running the server.js
script that makes VNF port mapping with port IDs and starts the VNF services.
– Immediate after running the script.
– Few mins for flow mapping and flow rewrite is done manually for vMT
flows.
• Start time for the WICM Docker setup:
– First time 116s: create containers and run
– Else: 82s: assumes the containers exist but are stopped
• WICM traffic switching time since the request for VLAN is received is
immediate (after applying curl REST commands)
• Expected output: Traffic flows correctly from ingress to egress in each VNF.
WICM is steering the traffic to the SFC PoP.
Port matching & install vMT flows
• Install 2 flows: manual process to rewrite Netfloc rules to meet vMT requirements (usually takes few mins):
Flow 1: ovs-ofctl add-flow br-int
priority=21,in_port=1,dl_dst=02:00:00:00:00:00/ff:ff:00:00:00:00,actions=s
trip_vlan,mod_dl_dst:<vMT eth0 mac>,mod_nw_dst:<vMT eth0
IP>,mod_nw_tos:4,output:<vMT eth0 port>
Flow 2: ovs-ofctl add-flow br-int priority=21,in_port=<vMT eth0
port>,dl_type=0x0800,nw_proto=17,nw_src=<vMT eth0
IP>,nw_dst=10.50.0.2,dl_src=<vMT eth0 mac>,dl_dst=<GET PACKET DST MAC FROM

T-NOVA | Deliverable D7.2 Integrated Pilot and Evaluation Report
©T-NOVA
Consortium
28
TCPDUMP ETH0 IN
vMT>,actions=mod_vlan_vid:401,mod_nw_src=10.50.0.1,mod_dl_src:00:90:27:22:
d2:68,mod_dl_dst:b8:ae:ed:77:73:bc,output:773
• Expected output: ICMP traffic is captured on output node User2 & video stream with watermark displayed
This concludes the validation tests performed in July 2016, an exercise that established
the time frame of deploying end-to-end a simple SFC demonstration in T-Nova.
4.5.4. Achievements
With the integration of Netfloc and Heat, the time required to setup an end-to-end
chain has been significantly reduced as in the initial demos on the Demokritos testbed,
since the stack deployment includes all the necessary setup to have the environment
ready in approximately 1-2 min. Apart from some manual intermediate steps, most of
the error-prone setup is now managed by Heat. Both the SFC deployment by Heat was
tested successfully in the NCSR Demokritos and Aveiro’s testbeds.
At this point Netfloc is integrated with TeNOR orchestrator and a service deployment
can be achieved both via HEAT and VNFFGD service descriptors.
Finally, the chain was tested with the vTC and vTC-forwarder VNFs, as shown in the Y1
demo of the project T-Nova. Briefly, the vTC classifies the traffic according to a ToS
field and sends out the specific traffic to dedicated ports, whereas the vTC-f just uses
the PF_RING library to make a L2 traffic forwarding from one port of the VNF to the
other in a bridged setup.
UC4.1 Scale-out/Scale-in
4.6.1. Scale-out: VDU (Border Gateway Function) in VNF (vSBC)
Test Case: UC 4.1.1 Scale-out of a VDU1 (Border Gateway Function) in a VNF (vSBC)
Identifier UC4.1.1
Metrics “CPU usage” chosen as metric for scaling
Accuracy and validity of the scale-out decision compared with the SLA
defined in the VNFD/NSD
Measurement of the time delay from the decision of the scale-out
procedure by the Orchestrator and the completion of the scale-out in
VNF
VNF (vSBC)’s Service inefficiency during the scale-out procedure (must
be without inefficiency - no failure rate)
Purpose UC4.1 is focused on the adaptation of the resources allocated to a specific VNF
towards SLA fulfilment and resource usage optimization.

T-NOVA | Deliverable D7.2 Integrated Pilot and Evaluation Report
©T-NOVA
Consortium
29
More specifically the purpose is to verify the right management of the scaling-
out procedure that depends on the monitoring data generated by the VNF
according to the scaling policy declared inside the VNFD/NSD.
Configuration Involved T-NOVA components: Orchestrator, VIM, Monitoring Manager, VNF
(vSBC)
Tools Traffic generator to emulate SIP and MEDIA packets towards the VNF (vSBC)
References D2.22, Sec. 4.4.1 and D5.32 Sec. 3.2, D5.32 Sec. 5 ANNEX 3
Pre-test
conditions
The VNFD/NSD scaling data must have been previously configured by the
Marketplace.
The Collectd of each VDU scaling instance (BGF in our tests) sends its metric
data to the Monitoring Manager, that provides this data to the SLA Monitor
component of the Orchestrator. The SLA Monitor detects if the collected metrics
overcome the scale-out threshold. The SLA Monitor determines the required
actions based on the associated SLA.
This behaviour can be obtained, by generating a signalling and media traffic
exceeding the scale-out threshold.
Test
Sequence
Step Type Description Result
1 Step Activation of video
traffic from the
sip/rtp emulator
(SIPP) towards the
vSBC, where the
VDU1 works to
transcode the
incoming video
codec
Emulation of 6 active calls from a UAC that
sends media video codec H264, and a UAS
that sends media video codec VP8
(transcoding requested).
2 Check Check the value of
the CPU load
during the
transcoded traffic
(using an internal
VDU1 log)
In the following internal log file of VDU1
(instance 0): /home/Italtel/csv/b7e2f522-
3298-4b48-ae75-
1ba6acfd951a/aggregation-cpu-
average/cpu-idle-2016-12-13 (e.g.), verify
the instant when the value of the cpu load
exceeds the threshold of the service
descriptor, with the following properties
needed to trigger the scale-out:
"value":"GT(70)"
"violations":"breaches_count":2
"interval":60
The first instant when the value of the cpu
load exceeds 70% in VDU1 is written in the
following string (where the first field is the
T-NOVA | Deliverable D7.2 Integrated Pilot and Evaluation Report
©T-NOVA
Consortium
30
timestamp, while the second field is the
VDU1 idle cpu (instance 0)):
1481876509.662,23.300018
The data-ora can be obtained from the
timestamp in this way:
date -s@1481876509
Fri Dec 16 08:21:49 UTC 2016
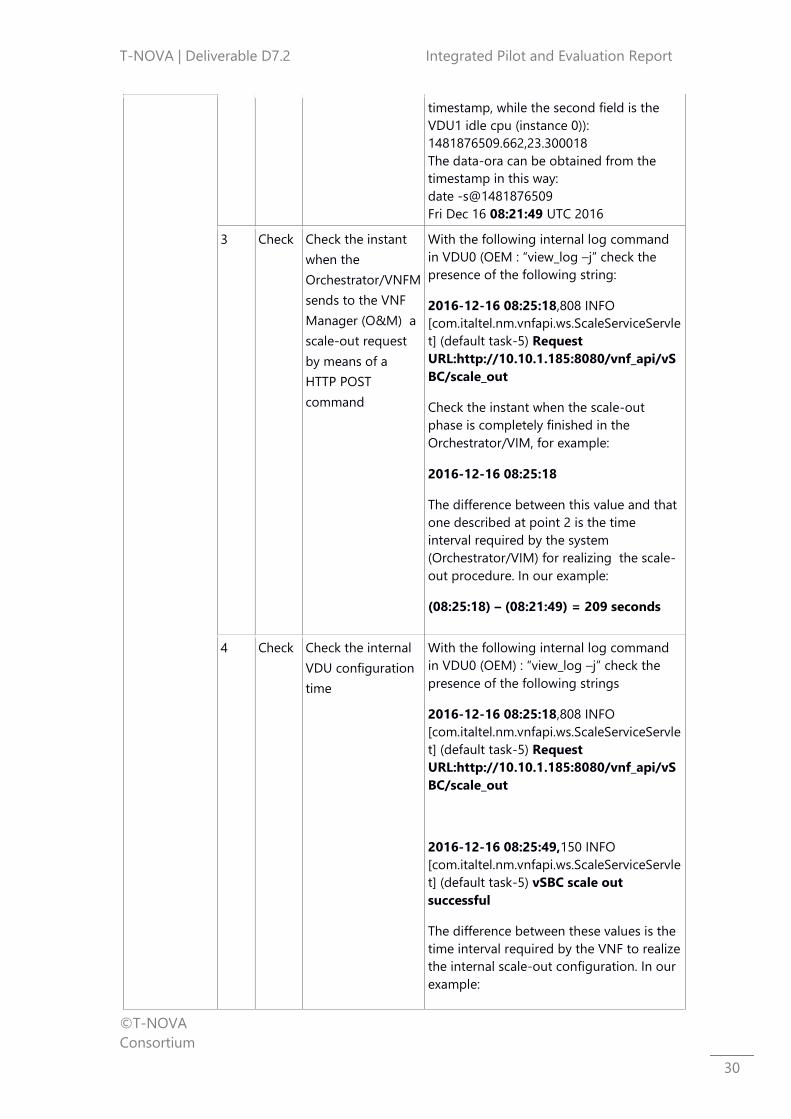
3 Check Check the instant
when the
Orchestrator/VNFM
sends to the VNF
Manager (O&M) a
scale-out request
by means of a
HTTP POST
command
With the following internal log command
in VDU0 (OEM : “view_log –j” check the
presence of the following string:
2016-12-16 08:25:18,808 INFO
[com.italtel.nm.vnfapi.ws.ScaleServiceServle
t] (default task-5) Request
URL:http://10.10.1.185:8080/vnf_api/vS
BC/scale_out
Check the instant when the scale-out
phase is completely finished in the
Orchestrator/VIM, for example:
2016-12-16 08:25:18
The difference between this value and that
one described at point 2 is the time
interval required by the system
(Orchestrator/VIM) for realizing the scale-
out procedure. In our example:
(08:25:18) – (08:21:49) = 209 seconds
4 Check Check the internal
VDU configuration
time
With the following internal log command
in VDU0 (OEM) : “view_log –j” check the
presence of the following strings
2016-12-16 08:25:18,808 INFO
[com.italtel.nm.vnfapi.ws.ScaleServiceServle
t] (default task-5) Request
URL:http://10.10.1.185:8080/vnf_api/vS
BC/scale_out
2016-12-16 08:25:49,150 INFO
[com.italtel.nm.vnfapi.ws.ScaleServiceServle
t] (default task-5) vSBC scale out
successful
The difference between these values is the
time interval required by the VNF to realize
the internal scale-out configuration. In our
example:

T-NOVA | Deliverable D7.2 Integrated Pilot and Evaluation Report
©T-NOVA
Consortium
31
(08:25:49) – (08:25:18) = 31 seconds
5 Check Check that the new
VDU1 instance (1)
must register itself
on the other VDUs
of the VNF (vSBC)
Check the activation of the internal
software functionalities (SERVICE UNITS)
of VDU1 (instance 1), using the following
internal command of VDU0 (OEM) (the
final state must be: “up active”):
quest -an 3
===========================
==================
SHELF 1-1 (atsh_0_1_1)
===========================
===================
-----------------------------------------------
----------------------------
Node 1-1-3 tnova_1_1_3 vServer-
8Upl front:3 OP:enable AV:available
-----------------------------------------------
----------------------------
SERVICE UNITS:
257 itl-bpcli_1 1-1-3 AD:unlocked OP:
up active (SG 0 : platform)
258 itl-bpicp_2 1-1-3 AD:unlocked OP:
up active (SG 0 : --- )
259 itl-bpicp_3 1-1-3 AD:unlocked OP:
up active (SG 0 : --- )
260 itl-utility_4 1-1-3 AD:unlocked OP:
up active (SG 0 : --- )
261 mrfp-mssw_5 1-1-3 AD:unlocked
OP: up active (SG 0 : --- )
262 mrfp-rtc_6 1-1-3 AD:unlocked
OP: up active (SG 0 : --- )
### COMMAND EXECUTED CORRECTLY
(Fri Dec 16 09:26:27 UTC 2016, 'quest'
4.2.1)
6 Check Check that the
VDU0 (OEM) sends
to the Orchestrator
the positive
response of the
scale-out
procedure
By means of the following internal log
command in VDU0 (OEM): “view_log –j”
check the presence of the following string:
2016-12-16 08:25:49,150 INFO
[com.italtel.nm.vnfapi.ws.ScaleServiceServle
t] (default task-5) vSBC scale out
successful
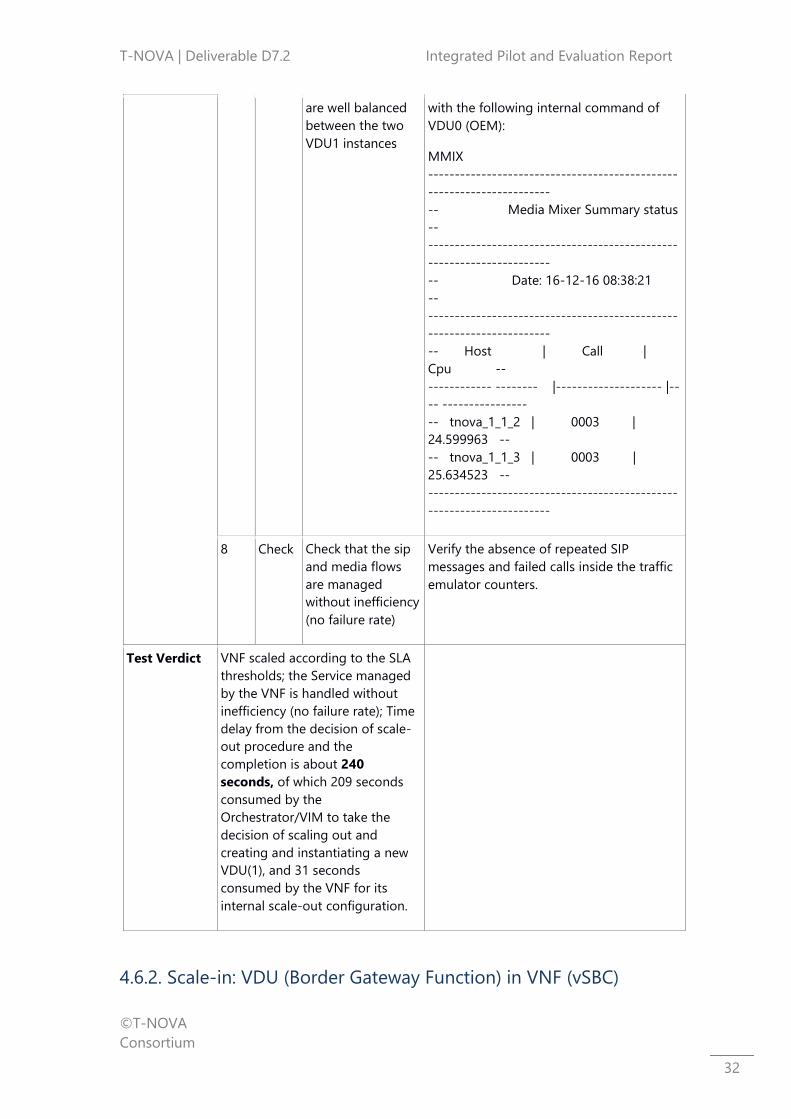
7 Check Check that the
incoming signaling
and media flows
Check the presence of the same number of
active calls in both the VDU1 instances
T-NOVA | Deliverable D7.2 Integrated Pilot and Evaluation Report
©T-NOVA
Consortium
32
are well balanced
between the two
VDU1 instances
with the following internal command of
VDU0 (OEM):
MMIX
-----------------------------------------------
-----------------------
-- Media Mixer Summary status
--
-----------------------------------------------
-----------------------
-- Date: 16-12-16 08:38:21
--
-----------------------------------------------
-----------------------
-- Host | Call |
Cpu --
------------ -------- |-------------------- |--
-- ----------------
-- tnova_1_1_2 | 0003 |
24.599963 --
-- tnova_1_1_3 | 0003 |
25.634523 --
-----------------------------------------------
-----------------------
8 Check Check that the sip
and media flows
are managed
without inefficiency
(no failure rate)
Verify the absence of repeated SIP
messages and failed calls inside the traffic
emulator counters.
Test Verdict VNF scaled according to the SLA
thresholds; the Service managed
by the VNF is handled without
inefficiency (no failure rate); Time
delay from the decision of scale-
out procedure and the
completion is about 240
seconds, of which 209 seconds
consumed by the
Orchestrator/VIM to take the
decision of scaling out and
creating and instantiating a new
VDU(1), and 31 seconds
consumed by the VNF for its
internal scale-out configuration.
4.6.2. Scale-in: VDU (Border Gateway Function) in VNF (vSBC)

T-NOVA | Deliverable D7.2 Integrated Pilot and Evaluation Report
©T-NOVA
Consortium
33
Test Case: UC 4.1.2 Scale-in of a VDU1 (Border Gateway Function) in a VNF (vSBC)
Identifier UC4.1.2
Metrics “CPU usage” chosen as metric for scaling
Accuracy and validity of the scale-in decision compared with the SLA
defined in VNFD/NSD
Measurement of the time delay from the decision of activating the
scale-in procedure by the Orchestrator and the completion of the
scale-in in VNF
VNF (vSBC)’s Service inefficiency during the scale-in procedure (must
be without inefficiency - no failure rate)
Purpose UC4.1 is focused on the adaptation of the resources allocated to a specific VNF
towards SLA fulfilment and resource usage optimization.
More specifically the purpose is to verify the right management of the scale-in
procedure, that depends on the monitoring data generated by the VNF
according to the scaling policy declared inside the VNFD/NSD.
Configuratio
n
Involved T-NOVA components: Orchestrator, VIM, Monitoring Manager, VNF
(vSBC)
Tools Traffic generator to emulate SIP and MEDIA packets towards the VNF (vSBC)
References D2.22, Sec. 4.4.1 and D5.32 Sec. 3.2, D5.32 Sec. 5 ANNEX 3
Pre-test
conditions
The VNFD/NSD scaling data must have been previously configured by the
Marketplace.
The Collectd of each VDU scaling instance (BGF in our tests) sends its metric
data to the Monitoring Manager, that provides this data to the SLA Monitor
component of the Orchestrator. The SLA Monitor detects if the collected
metrics step down the scale-in threshold. The SLA Monitor determines the
required actions based on the associated SLA.
This behavior can be obtained generating a signaling and media traffic below
the scale-in threshold.
Step Type Description Result

T-NOVA | Deliverable D7.2 Integrated Pilot and Evaluation Report
©T-NOVA
Consortium
34
Test
Sequence
1 Step Decrement of
video traffic from
the sip/rtp
emulator (SIPP)
toward vSBC,
where the VDU1
instances works to
transcode the
incoming video
codec.
Emulation of only 2 active calls from the
UAC that sends media video codec
H264, and a UAS that sends media
video codec VP8 (transcoding
requested).
2 Check Check the value of
the CPU load
during the
transcoded traffic
(using an internal
VDU1 log)
In the following internal log file of the
VDU1 (instance 0):
/home/Italtel/csv/b7e2f522-3298-4b48-
ae75-1ba6acfd951a/aggregation-cpu-
average/cpu-idle-2016-12-13 (e.g.),
verify the instant when the value of the
cpu load is lower than the threshold of
the service descriptor, with the following
properties needed to trigger the scale-
in:
"value":"LT(20)"
"violations":"breaches_count":2
"interval":60
The first instant when the value of the
cpu load is lower of 20% in VDU1 is
written in the following string (where
the first field is the timestamp, and the
second field is the VDU1 idle cpu
(instance 0)):
1481896508.117,89.700030
The data-ora can be obtained from the
timestamp in this way:
date -s@1481896508
Fri Dec 16 13:55:08 UTC 2016
T-NOVA | Deliverable D7.2 Integrated Pilot and Evaluation Report
©T-NOVA
Consortium
35
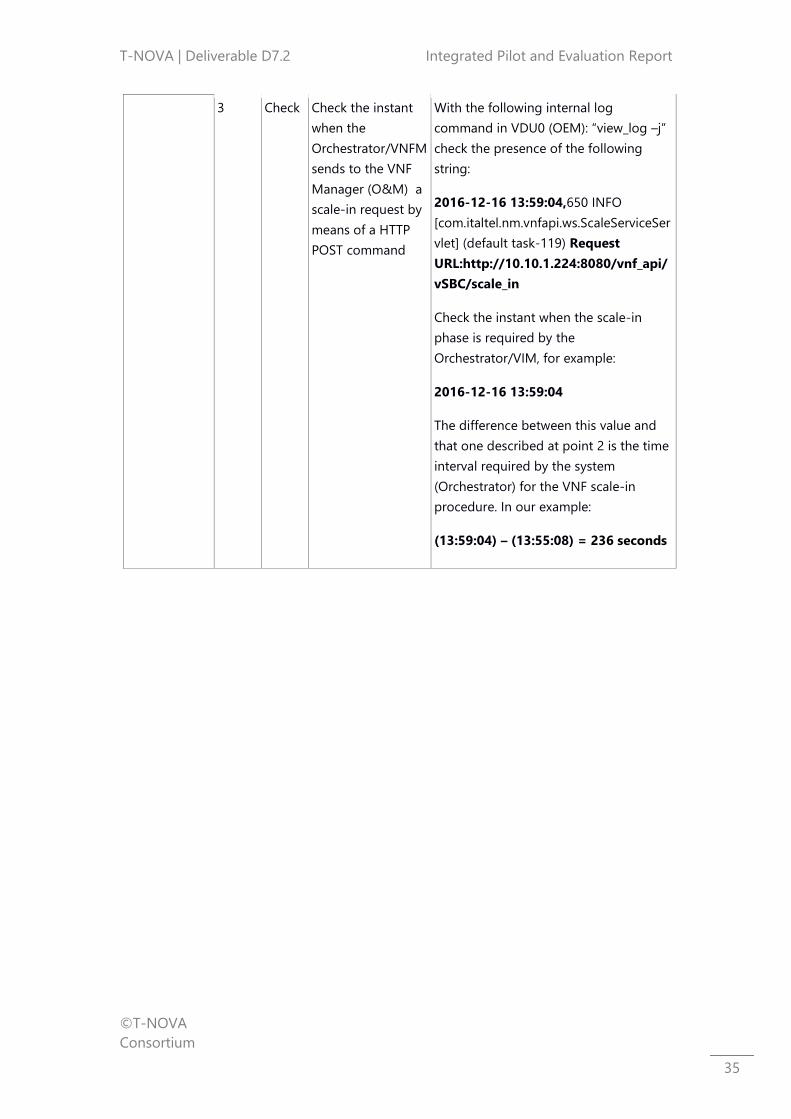
3 Check Check the instant
when the
Orchestrator/VNFM
sends to the VNF
Manager (O&M) a
scale-in request by
means of a HTTP
POST command
With the following internal log
command in VDU0 (OEM): “view_log –j”
check the presence of the following
string:
2016-12-16 13:59:04,650 INFO
[com.italtel.nm.vnfapi.ws.ScaleServiceSer
vlet] (default task-119) Request
URL:http://10.10.1.224:8080/vnf_api/
vSBC/scale_in
Check the instant when the scale-in
phase is required by the
Orchestrator/VIM, for example:
2016-12-16 13:59:04
The difference between this value and
that one described at point 2 is the time
interval required by the system
(Orchestrator) for the VNF scale-in
procedure. In our example:
(13:59:04) – (13:55:08) = 236 seconds

T-NOVA | Deliverable D7.2 Integrated Pilot and Evaluation Report
©T-NOVA
Consortium
36
4 Check Check the internal
VNF time interval
needed for the
deletion of VDU1
(instance 1)
With the following internal log
command in VDU0 (OEM), (view_log –j)
check the presence of the following
strings:
2016-12-16 13:59:04,650 INFO
[com.italtel.nm.vnfapi.ws.ScaleServiceSer
vlet] (default task-119) Request
URL:http://10.10.1.224:8080/vnf_api/
vSBC/scale_in
2016-12-16 13:59:04,683 INFO
[com.italtel.nm.vnfapi.ws.ScaleServiceSer
vlet] (default task-119) vSBC scale-in
successful
The difference between these values is
the time interval required by the VNF to
realize the internal scale-in procedure
and the removal of the resources.
In our example:
(13:59:05) – (13:59:04) = 1 second

T-NOVA | Deliverable D7.2 Integrated Pilot and Evaluation Report
©T-NOVA
Consortium
37
5 Check Check that the
VDU1 instance (1)
is deregistered on
the other VDUs of
the VNF (vSBC)
Check the deactivation of the internal
software functionalities (SERVICE UNITS)
of the VDU1 instance (1), using the
following internal command of VDU0
(OEM) (the final state must be “down
unassigned”):
quest -an 3
==========================
==================
SHELF 1-1 (atsh_0_1_1)
==========================
==================
--------------------------------------------
------------------------------
Node 1-1-3 tnova_1_1_3 vServer-
8Upl front:3 OP:disabled AV:failed
--------------------------------------------
------------------------------
SERVICE UNITS:
257 itl-bpcli_1 1-1-3 AD:unlocked
OP:down unassigned (SG 0 : platform)
258 itl-bpicp_2 1-1-3 AD:unlocked
OP:down unassigned (SG 0 : --- )
259 itl-bpicp_3 1-1-3 AD:unlocked
OP:down unassigned (SG 0 : --- )
260 itl-utility_4 1-1-3 AD:unlocked
OP:down unassigned (SG 0 : --- )
261 mrfp-mssw_5 1-1-3
AD:unlocked OP:down unassigned (SG
0 : --- )
262 mrfp-rtc_6 1-1-3 AD:unlocked
OP:down unassigned (SG 0 : --- )
### COMMAND EXECUTED CORRECTLY
(Fri Dec 16 14:01:03 UTC 2016, 'quest'
4.2.1)

T-NOVA | Deliverable D7.2 Integrated Pilot and Evaluation Report
©T-NOVA
Consortium
38
6 Check Check that the
VDU0 (OEM) sends
to the Orchestrator
the positive
response of the
scale-in procedure
By means of the following internal log
command in VDU0 (OEM): “view_log –j”
check the presence of the following
string:
2016-12-16 13:59:04,683 INFO
[com.italtel.nm.vnfapi.ws.ScaleServiceSer
vlet] (default task-119) vSBC scale in
successful
7 Check Check that the
incoming signaling
and media flows
are managed only
by the VDU1
(instance 0)
With the following internal command in
VDU0 (OEM) check the presence of
active calls only for the VDU1 (instance
0).
MMIX
--------------------------------------------
--------------------------
-- Media Mixer Summary
status --
--------------------------------------------
--------------------------
-- Date: 16-12-16 13:59:38
--
--------------------------------------------
--------------------------
-- Host | Call |
Cpu --
------------ ------------|-------------------
-|-----------------------
-- tnova_1_1_2 | 0002 |
26.199886 --
-- tnova_1_1_3 | 0000 |
2.300180 --
--------------------------------------------
--------------------------
8 Check Check that the sip
and media flows
are managed
without inefficiency
(no failure rate)
Verify the absence of repeated SIP
messages and failed calls inside the
traffic emulator counters .

T-NOVA | Deliverable D7.2 Integrated Pilot and Evaluation Report
©T-NOVA
Consortium
39
Test Verdict VNF scaled according to the SLA
thresholds; the Service managed by
the VNF is handled without
inefficiency (no failure rate); Time
delay from the decision of scale-in
procedure and its completion is
237 seconds , of which 236
seconds consumed by the
Orchestrator/VIM to take the
decision of scaling in, and 1 second
consumed by the VNF for its
internal scale-in procedure.
4.6.3. Scale-out: VDU (Worker) in VNF (vHG)
Test Case: UC 4.1.1 Scale-out of a VDU (Worker) in VNF (vHG)
Identifier UC4.1
Context ● The VHG offers an ingestion API where videos are downloaded,
transcoded and stored.
● The VHG being implemented by a micro service architecture
offers the possibility to add transcoding workers to increase the
capacity of the VNF to handle multiple ingestion at the same
time.
● Workers are stateless components configured to listen incoming
transcoding demands pushed on a Queue by the frontend
microservice.
● Docker Swarm pool implemented where each agent is able to
provider 1 worker to the VNF. To increase the amount of
workers, adding a specific VDU is sufficient.
● When booting, the VHG is composed of 5 identical VDUs. When
the VNF Controller receives the first lifecycle event, every VDU is
assigned a “role” in the VNF. For example, a “Worker” VDU will
have the Docker daemon installed, and it will be automatically
configured to join the Docker swarm cluster which master node
is located on the VF Controller VDU.
Metrics ● We used the “transcoding score” custom metric for scaling
purposes. It is computed from the maximum time a request for
transcoding has spent on the queue. It is computed on the VNF
Controller node, and published to the metric API.
Purpose UC4.1 is focused on the adaptation of the resources allocated to a
specific VNF towards SLA fulfilment and resource usage optimization.

T-NOVA | Deliverable D7.2 Integrated Pilot and Evaluation Report
©T-NOVA
Consortium
40
More specifically the purpose is to verify the right management of the
scaling-out procedure that depends on the monitoring data generated
by the VNF according to the scaling policy declared in VNFD.
Configuration Involved T-NOVA components: Orchestrator, VIM, Monitoring Manager,
VNF (vHG)
Tools Curl, bash scripting, Celery Flower, RabbitMQ Management GUI
References D2.22, Sec. 4.4.1 and D5.32 Sec. 3.2, D5.32 Sec. 5 ANNEX 3
Pre-test
conditions
The VNFD scaling data must have been previously configured by the
Marketplace.
The VNF should be properly instantiated in the platform, including 1
transcoding worker container, the admission worker container, the
frontend container, the VHG proxy container, the storage nodes (2) and
load balancer, and the monitoring container.
A script simulating users requesting video transcoding is launched to
trigger the actual transcoding process. Videos are requested at a specific
rate per minute, which we can changed to test scale-out and scale-in
Test Sequence Step Type Description Result
1 Step The Orchestrator sends a
request to the VIM to add a
new worker instance
2 Check Check the VIM internal log
that should be registered
3 Step VIM instantiates the requested
resources
4 Check Check the correct instantiation
of the requested resources
5 Step A scale-out lifecycle event is
sent to the VNF controller
container the IP address of the
new VDU
6 Check Check in Rundeck if the job is
properly configured.
7 Step The VNF Controller triggers
the configuration of the VDU
i.e. The installation/update of
Docker components on the
workers. The swarm token is
provided to the VDU so that
the worker can join the swarm
cluster

T-NOVA | Deliverable D7.2 Integrated Pilot and Evaluation Report
©T-NOVA
Consortium
41
8 Check The swarm consists of one
more worker. The new worker
appears in Celery Flower and
in Rabbit MQ Management
GUI.
9 Step The VDU instance (via OEM)
sends to the Orchestrator the
positive response of the scale-
out procedure
10 Check Check the Orchestrator
internal log that should be
registered
Test Verdict VNF scaled according to the SLA thresholds; Worker
count must have increased; The transcoding score
metric must decrease, other things being equal.
4.6.4. Scale-in: VDU (Worker) in VNF (vHG)
Test Case: UC 4.1.2 Scale-in of a VDU (Worker) in VNF (vHG)
Identifier UC4.1.2
Context ● Same aas before
Metrics ● Same as before
Purpose UC4.1 is focused on the adaptation of the resources allocated to a
specific VNF towards SLA fulfilment and resource usage optimisation.
More specifically the purpose is to verify the correct management of the
scaling-in procedure that depends on the monitoring data generated by
the VNF according to the scaling policy declared in VNFD.
Configuration Involved T-NOVA components: Orchestrator, VIM, Monitoring Manager,
VNF (vHG)
Tools Curl, bash scripting, Celery Flower
References D2.22, Sec. 4.4.1 and D5.32 Sec. 3.2, D5.32 Sec. 5 ANNEX 3
Pre-test
conditions
The transcoding score metric defined in the previous section must 0 (real
time transcoding)
Test Sequence Step Type Description Result
1 Step The Orchestrator/VNFM sends
a scale-in request to the VNF
Manager (O&M) through the
middleware API. The request

T-NOVA | Deliverable D7.2 Integrated Pilot and Evaluation Report
©T-NOVA
Consortium
42
contains the IP/UUID of the
VDU to be scaled-in
2 Check Check the VDU - OEM internal
log that should be registered
3 Step The scale-in target worker
should be decommissioned,
such that it should not
consume any more
transcoding request and the
worker should exist when
current transcoding jobs are
finished.
4 Check Celery flower shows that the
scale-in targeted workers is
offline. The RabbitMQ
Management GUI shows one
less consumer.
5 Step The VDU instance (via OEM)
sends to the Orchestrator the
positive response of the scale-
in procedure
6 Check Check the Orchestrator
internal log that should be
registered
7 Step The Orchestrator sends to the
VIM a request to remove the
scale-in targeted VDU
8 Check Check the VIM internal log
that should be registered
9 Step VIM remove the resources
10 Check Check the correct removal of
the requested resources
Test Verdict VNF scaled according to the SLA thresholds; Worker
should be put offline, to transcoding jobs is in error
The following graph (Figure 7) is a screen capture of the Orchestrator Monitoring
feature which displays VNF specific metrics. Specifically, the evolution of the
"transcoding score" metrics is shown which relates to the maximum waiting time in the
queue for a transcoding order. The metric is plotted against the time

T-NOVA | Deliverable D7.2 Integrated Pilot and Evaluation Report
©T-NOVA
Consortium
43
Figure 7 Transcoding score evolution
For the purposes of the experiment, we launched a script that simulate the ingestion
of 18 videos per minutes. Each worker can ingest up to 8 videos, so in the cruising
phase, the workload requires 3 workers to ingest the videos in "real time". The scaling
policy implemented is the following: if the transcoding score is more than120s for more
than 1 minute, then scale-out a new worker. If the transcoding score is zero for more
than 1 minute, then scale-in one worker.
Let us examine the graph, From 12:03 to 12:18, we can see that the transcoding score
shows a sharp increase. This increase can be explained by the fact that there is only 1
worker coping with the transcoding demand and processing on average 8 of them per
minutes, which is not enough to have a null transcoding score.
Starting 12:09, the transcoding score threshold is breached for the first time, at 12:10
the SLA is breached and scaling-out occurs. The VDU takes 3 minutes to be instantiated
and available on the testbed. Then the VDU is configured (new images are downloaded;
swarm agents are installed and configuration actions are taken) in 3 more minutes. We
can see that starting at 12:17 a downward trend can be observed.
Due to the VM instantiation lag and the configuration lag occurring in 6-7 minutes
overall, more scale-outs takes place. In this experiment, 5 workers have been
instantiated.
Starting at 12:18, the transcoding score is null, so scaling-in occurs gradually. At 12:42,
the number of workers is once again insufficient to sustain the demand, so we have an
oscillation between 12:42 and 12:50, with a series of scale-out and scale-in.
UC5 Monitor NFV services
Test Case: UC 5 Monitor NFV services
Identifier UC5
Metrics Accuracy of measurement
Response time

T-NOVA | Deliverable D7.2 Integrated Pilot and Evaluation Report
©T-NOVA
Consortium
44
Purpose This test validates the function of the monitoring with respect to NFV
services (e.g., service status, infrastructure utilisation, fault and anomaly
detection). We use the vTC VNF as example.
Configuration Involved T-NOVA components: virtual traffic classifier (vTC) VNF, NFVI, VIM,
Orchestrator
Tools tcpreplay (http://tcpreplay.synfin.net/ ) as traffic generator.
stress (http://people.seas.harvard.edu/~apw/stress/) to introduce artificial
stressing of VNFC in terms of CPU and memory utilization.
Linux top and iptraf tools for measuring locally CPU and network utilization
at the CPU.
References D2.22, Sec. 4.5; D2.52, Sec. 5.1.6
Pre-test
conditions
The service is established and active. The Orchestrator has sent, upon
service deployment, a subscription request to the monitoring system to
dispatch generic and application-specific VNF metrics every second.
Test Sequence Step Type Description Result
1 Stimulus Stress the VNF with
artificially generated traffic
2 Check Update of subscribed
metrics from the
Orchestrator callback
endpoint and Orchestrator
GUI.
Accuracy and
duration
3 Stimulus Configure an alarm to be
triggered when VNF free
memory falls below 3GB.
Artificially stress the VNF by
launching memory-
consuming processes (stress
tool)
4 Check (Subscribed) alarm received
after approx. 21 seconds
after the event.
When memory consumption
returns to normal, the alarm
is no more sent.
Duration between
event and alarm

T-NOVA | Deliverable D7.2 Integrated Pilot and Evaluation Report
©T-NOVA
Consortium
45
Test Verdict Metrics are properly propagated and correspond to
the known traffic parameters and/or stress
process. Response time is kept down to the minimum.
Below is the report to the Orchestrator including among others CPU utilisation. Actual
CPU utilization (measured via top) was about 16%
Figure 8 CPU utilisation report
Figure 8 Load / CPU utilization
Finally, below is the alarm report due to memory overuse, following the artificial
stressing.
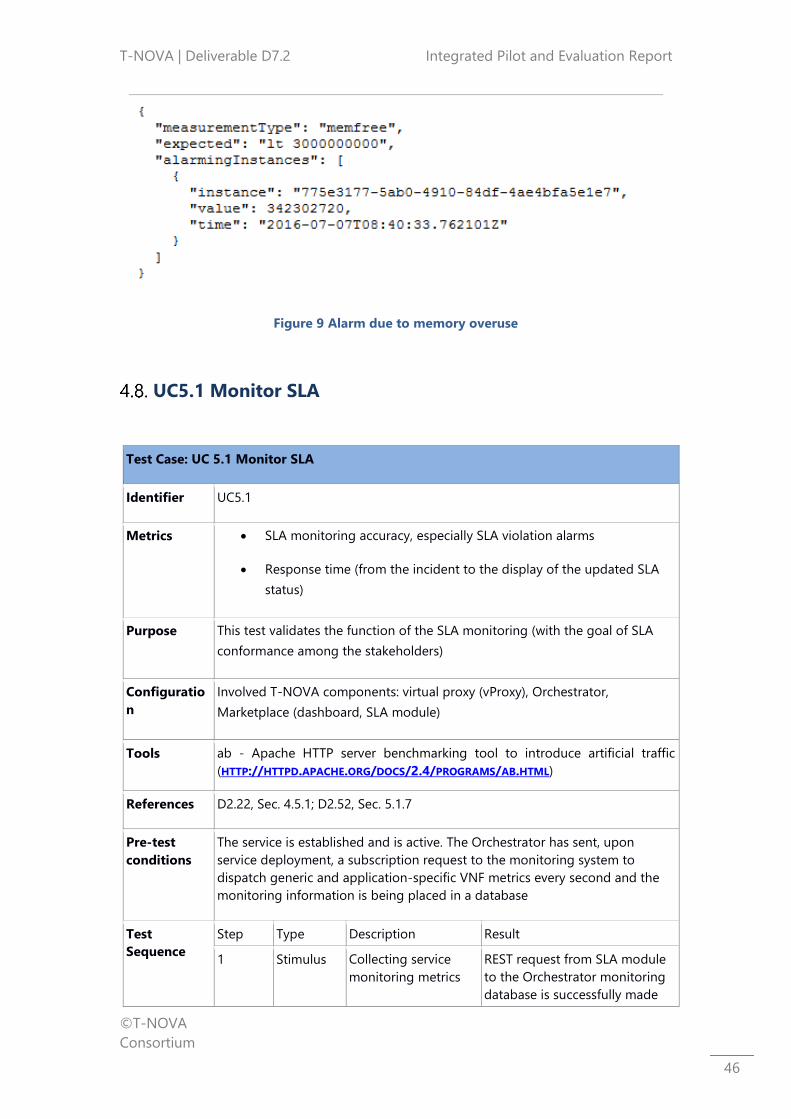
T-NOVA | Deliverable D7.2 Integrated Pilot and Evaluation Report
©T-NOVA
Consortium
46
Figure 9 Alarm due to memory overuse
UC5.1 Monitor SLA
Test Case: UC 5.1 Monitor SLA
Identifier UC5.1
Metrics SLA monitoring accuracy, especially SLA violation alarms
Response time (from the incident to the display of the updated SLA
status)
Purpose This test validates the function of the SLA monitoring (with the goal of SLA
conformance among the stakeholders)
Configuratio
n
Involved T-NOVA components: virtual proxy (vProxy), Orchestrator,
Marketplace (dashboard, SLA module)
Tools ab - Apache HTTP server benchmarking tool to introduce artificial traffic
(HTTP://HTTPD.APACHE.ORG/DOCS/2.4/PROGRAMS/AB.HTML)
References D2.22, Sec. 4.5.1; D2.52, Sec. 5.1.7
Pre-test
conditions
The service is established and is active. The Orchestrator has sent, upon
service deployment, a subscription request to the monitoring system to
dispatch generic and application-specific VNF metrics every second and the
monitoring information is being placed in a database
Test
Sequence
Step Type Description Result
1 Stimulus Collecting service
monitoring metrics
REST request from SLA module
to the Orchestrator monitoring
database is successfully made

T-NOVA | Deliverable D7.2 Integrated Pilot and Evaluation Report
©T-NOVA
Consortium
47
periodically for the requested
metrics
2 Check Signalling of
monitoring
information
Validated: After each request, all
present data is received and
evaluated.
See Figure 10: penalties after
the evaluation of the monitoring
information for each metric
3 check SLA monitoring
results to the
customer
Validated: Relevant data is
presented to the user in the
dashboard. SLA penalties
occurred and the monitoring
information for each SLA metric
is plotted
See Figure 12 and Figure 11:
SLA dashboard and graphical
representation of the
monitoring of the metrics
Test Verdict Correct SLA status update, correct indication
of SLA violation; minimum response time.
The response time between the actual SLA violation, its detection by the SLA module
and the representation in the marketplace dashboard can vary from 1sec. (in the best
case) to up to 2,5 minutes: The monitoring information is issued by the VNF at different
rates depending on the kind of metric, it’s collection periodically every 2 minutes for
evaluation(introducing a delay to allow the monitoring system time enough to collect
the information and don’t miss anything) and plotted in the dashboard which is
refreshed every 30secs.

T-NOVA | Deliverable D7.2 Integrated Pilot and Evaluation Report
©T-NOVA
Consortium
48
Figure 10 Penalties
Figure 11 Monitoring information
Figure 12 SLA Dashboard
UC6 Bill NFV services
In T-Nova, the billing and revenue sharing report generation is an interplay between
several components which make up the T-Nova Dashboard. As the billing reports
depend mainly on the agreed billing and penalty models between various involved

T-NOVA | Deliverable D7.2 Integrated Pilot and Evaluation Report
©T-NOVA
Consortium
49
actors of the ecosystem, the validation of UC6 – Bill NFV services depends on the
successful integration between the accounting module, SLA management module and
the Cyclops rating-charging and billing engine. The bill generation functional
validation was performed using the structure which is described in below table
Test Case: UC 6 Bill NFV services
Identifier UC6
Metrics Time that take the billing records to show up once requested.
Purpose Validation of the billing procedure for the T-NOVA Customer and for the
SP by the FP (and NIP/CIP) based on accounting and SLA fulfilment
Configuration Involved T-NOVA components: VNF, NFVI, VIM, Marketplace, Monitoring
@ Marketplace level, Accounting, SLA management module, Cyclops
Tools Cyclops Internal in-code Measurements, curl latency measurement
capability
References D2.22, Sec. 4.6; D2.52, Sec. 5.1.8; D6.4
Applicability Identical billing procedure for SP and customers.
Revenues report for SP and FPs.
Pre-test
conditions
A Customer is assigned a bill cycle valid for all his subscriptions (a SP is
also assigned a bill cycle). A Customer has requested and selected T-
NOVA services, possibly with different corresponding pricing conditions
and SLAs (UC 2.2). The service(s) has(ve) been deployed (UC 3). The bill
cycle for T-NOVA Customer is about to close.
Test Sequence Step Type Description Result
1 Stimulus Collect and process
accounting and SLA
information and generate
bills to Customers and SP.
REST request from
Dashboard is
successfully made to
Cyclops
2 Check Billing presented to
customer (or SP)
(including consumed
resources)
Validated: See
screenshots (Figure
14 and Figure 16)
3 Stimulus Collect and process
accounting and SLA
information to generate
revenues report to FPs
and SP.
Cyclops periodic
collector is active,
and is processing
lifecycle events and
transforming usages
(see Figure 18)

T-NOVA | Deliverable D7.2 Integrated Pilot and Evaluation Report
©T-NOVA
Consortium
50
4 Check Revenues report
presented to the user
Validated: See
screenshots (Figure
13 and Figure 15)
Test Verdict Billing integration and validation tests are
completed successfully.
4.9.1. Validation Results (Screenshots)
The following screenshots of relevant dashboard elements show the timely and correct
response from the Cyclops billing framework. The figures below show the revenue
generation report for a function provider (Figure 13), the cost owed by the service
provider to all the function providers from whom it has purchased the functions to
compose his network service (Figure 14), incoming revenue report for a service
provider from all its customers (Figure 15) and finally the bill for the customers of all
the services s/he is consuming in a specified period (Figure 16).
Figure 13 Revenue Sharing report for Function Provider

T-NOVA | Deliverable D7.2 Integrated Pilot and Evaluation Report
©T-NOVA
Consortium
51
Figure 14 Bill owed by Service Provider to every Function provider(s)
Figure 15 Incoming Revenue reports for the Service Providers from all its customers

T-NOVA | Deliverable D7.2 Integrated Pilot and Evaluation Report
©T-NOVA
Consortium
52
Figure 16 Customer Bill for using various Services
Figure 17 DB entries showing lifecycle events captured by Cyclops collector

T-NOVA | Deliverable D7.2 Integrated Pilot and Evaluation Report
©T-NOVA
Consortium
53
Figure 18 DB entries showing usage values after post processing of lifecycle events by
Cyclops
4.9.2. Validation Results: latency
Latency tests were carried out through built in measurement capability of curl. The
following commands were used from the VM where Dashboard was deployed to the
VM where Cyclops billing engine was deployed (see Table 5).
Table 5 Curl commands used in latency estimates of Cyclops interface
Purpose Curl command used
Daily Bill Generation
Request
curl -w "%{time_total}\n" -o NUL -s
"http://10.10.1.226:4569/bill?userId=2&from=2016-12-
07%2014:49:00&to=2016-12-07%2015:01:00"
Daily Invoice
Generation Request
curl -w "%{time_total}\n" -o NUL -s
"http://10.10.1.226:4569/invoice?userId=2&from=2016-12-
07%2014:49:00&to=2016-12-07%2015:01:00"
Daily Revenue Sharing
Report Generation
Request
curl -w "%{time_total}\n" -o NUL -s
"http://10.10.1.226:4569/revenue?provider=3&from=2016-12-
07%2014:49:00&to=2016-12-07%2015:01:00"
Monthly Bill
Generation Request
curl -w "%{time_total}\n" -o NUL -s
"http://10.10.1.226:4569/bill?userId=2&from=2016-12-
07%2014:49:00&to=2016-12-07%2018:27:30"

T-NOVA | Deliverable D7.2 Integrated Pilot and Evaluation Report
©T-NOVA
Consortium
54
Monthly Invoice
Generation Request
curl -w "%{time_total}\n" -o NUL -s
"http://10.10.1.226:4569/invoice?userId=2&from=2016-12-
07%2014:49:00&to=2016-12-07%2018:27:30"
Monthly Revenue
Sharing Report
Generation Request
curl -w "%{time_total}\n" -o NUL -s
"http://10.10.1.226:4569/revenue?provider=3&from=2016-12-
07%2014:49:00&to=2016-12-07%2018:27:30"
Latency measurements were undertaken to capture the responsiveness of the Cyclops
framework with respect to the increasing number of records required to be processed
before the results are generated and sent back. In the figures below, the x-axis
represents the number of data-records processed by Cyclops before responding to a
query, and the y-axis shows the time in seconds taken to respond to the REST request
by the T-Nova dashboard. Figure 19 shows the time it takes (in seconds) versus the
number of records that were processed by Cyclops in response to revenue sharing
report request and Figure 20 shows the data plot for bill generation request. All tests
were repeated 10 times and the median value was used in the data plots below.
Figure 19 Latency in Seconds vs number of records processed for generation of a
revenue sharing report by Cyclops
0,0000
0,5000
1,0000
1,5000
2,0000
2,5000
3,0000
3,5000
0 20 40 60 80 100 120 140 160
Revenue Sharing Generation (s)

T-NOVA | Deliverable D7.2 Integrated Pilot and Evaluation Report
©T-NOVA
Consortium
55
Figure 20 Latency in Seconds vs number of records processed for bill generation by
Cyclops
UC7.1/UC7.2 Terminate NFV Services, Delete NSD
The UC7 named “Terminate NFV Services” defines the procedures and steps related to
termination of a NFV service. It is separated into different sub-use cases depending on
different T-NOVA internal role Service Provider (SP) or CS (Customer). The following
sub use cases where identified:
1. A Customer is terminating an active NFV Service
2. A SP removes a T-NOVA Service from the Service catalogue
The following tables present the details for each sub use case:
Test Case: UC 7.1 Terminate NFV Services ( Customer is terminating an active network
service )
Identifier UC7.1
Metrics Terminated and removed a service for “My Services” view of Customer
Portal.
Purpose Validation of delete/terminate actions
Configuration Involved T-NOVA components: Marketplace, TENOR
Tools Manual testing was performed.
References D2.21, D2.52, D6.3
Applicability To all active network services in customer view in T-NOVA Portal
0,0000
0,5000
1,0000
1,5000
2,0000
2,5000
3,0000
3,5000
4,0000
0 20 40 60 80 100 120 140 160
Bill Generation (s)

T-NOVA | Deliverable D7.2 Integrated Pilot and Evaluation Report
©T-NOVA
Consortium
56
Pre-test
conditions
An existing active network service must exist in START and/or is
INSTANTIATED
Test Sequence Step Type Description Result
1 Stimulus Verify that and active NSD
was created
Check Marketplace
My Services”” view.
Check Status. (see
Figure 21)
2 Check Terminate selected active
network service.
Verify that the status
of NS changed to
DELETING”, in my
services (see Figure
22)
3 Check Network Services
terminated
Verify that the
service does not
exist at My Services
View (see Figure 23)
Test Verdict Active network service was deleted successfully

T-NOVA | Deliverable D7.2 Integrated Pilot and Evaluation Report
©T-NOVA
Consortium
57
Test Case: UC 7.2 Delete NSD
Identifier UC7.2
Metrics Verify that the following NSD is not available to be purchased.
Purpose Validation of deletion of NSD and not available to be purchased.
Configuration Involved T-NOVA components: Marketplace, TENOR
Tools Manual testing was performed.
References D2.21, D2.52, D6.3
Applicability To all active network services that are available to be purchased.
Pre-test
conditions
An available NSD to be purchased.
Test Sequence Step Type Description Result
1 Stimulus Create a NSD as SP See Figure 24
2 Stimulus Check if network services
is available to be purchase
as a Customer.
Verify that the
created services is
available to be
purchased (see
Figure 25)
3 Check Network Service is not
existing any more in Buy
Services View at Customer
View.
Verify that the
service is not exist at
My Services View
(see Figure 26)
3 Check Network Service is not
existing any more in Buy
Services View at Customer
View.
Verify that the
service is not exist at
My Services View
(see Figure 27)
Test Verdict Network services was deleted and does not exist
anymore.
4.10.1. Validation Results: Screenshots
The following screenshots validate the results for termination of an instantiated/active
network service.

T-NOVA | Deliverable D7.2 Integrated Pilot and Evaluation Report
©T-NOVA
Consortium
58
Figure 21 Network Service to be deleted
Figure 22 Network Service to State DELETING (Termination in Progress)

T-NOVA | Deliverable D7.2 Integrated Pilot and Evaluation Report
©T-NOVA
Consortium
59
Figure 23 Network Service terminated and removed
Figure 24 Verify a NSD that exist in "My Services"@SP view

T-NOVA | Deliverable D7.2 Integrated Pilot and Evaluation Report
©T-NOVA
Consortium
60
Figure 25 NSD is available to be purchased “”Buy Services”@Customer view
Figure 26 NSD was removed "My Services" @SP view

T-NOVA | Deliverable D7.2 Integrated Pilot and Evaluation Report
©T-NOVA
Consortium
61
Figure 27 Removed NSD is not available for purchase any more at "My
Services"@Customer view
4.10.2. Validation Results: Measurements
Use Case Description Response Time
UC 7.1 Terminate an active NS 180 – 480 secs
(depending on the complexity of NSD)
UC 7.2 Delete NSD < 10 msec

T-NOVA | Deliverable D7.2 Integrated Pilot and Evaluation Report
©T-NOVA
Consortium
62
5. DEMONSTRATIONS
This section presents the T-NOVA final demonstrators:
Scaling of a VNF (vSBC)
Scaling of a VNF (vHG)
End-to-end NS deployment over multi-PoP infrastructure.
DEMO 1: Scaling a VNF: vSBC
5.1.1. Abstract/Description
This DEMO is related to the scaling procedures of the Italtel VNF named vSBC.
An interesting feature of this scenario is the capability to apply scaling procedures to
only one of the two VDUs composing this vSBC (instead of the whole VNF). This means
adding/removing VDU instances with the same deployment flavour.
Since the most critical internal function to be handled is the media controller, especially
in case of application of video transcoding, this was the functionality chosen for the
scaling of this VNF.
5.1.2. Motivation
The aim of this DEMO is to demonstrate the vSBC capability to scale in/out according
to the level and type of traffic flowing through it. This capability is based on the
information configured inside the Network Service Descriptor (NSD), more specifically
in the “assurance_parameters” field and in the “auto_scale_policy” field. All this
information can be configured by the Marketplace.
As shown in the following example, we choose the CPU utilization (“cpu_util”) as scaling
parameter to be sent to the Monitoring server. The scaling in/out procedures
(“formula” and “actions”) are applied only if the CPU utilization exceeds the configured
upper or lower thresholds (“value” = 70% and 20% in this example), and only if this
condition, during the monitoring interval (“interval”= 60 sec in this example), is
detected for at least “x” times (“breaches_count” = 2 in this example).
Example of NSD
……..
"assurance_parameters":
[{"formula":"MAX(VNF:2808.cpu_util)","id":"cpu_util","name":"cpu_util",
"penalty":{"value":0},"unit":"%","value":"GT(70)","violations":
[{"breaches_count":2,"interval":60}],"uid":"ap0"},
{"formula":"MIN(VNF:2808.cpu_util)","id":"cpu_util","name":"cpu_util",
"penalty":{"value":0},"unit":"%","value":"LT(20)","violations":
[{"breaches_count":2,"interval":60}],"uid":"ap1"}]
"auto_scale_policy":
[{"criteria":[{"assurance_parameter_id":"ap0"}],"actions":[{"type":"Scale
Out"}]},
{"criteria":[{"assurance_parameter_id":"ap1"}],"actions":[{"type":"Scale
In"}
………

T-NOVA | Deliverable D7.2 Integrated Pilot and Evaluation Report
©T-NOVA
Consortium
63
5.1.3. Storyboard
The Italtel vSBC is composed by two VDUs:
VDU0 (O&M + SIP signalling controller): this VDU doesn’t scale never
VDU1 (RTP media controller): this VDU can scale from 1 to 2 instances.
1) Starting conditions
At the start of this DEMO scenario the vSBC is composed by:
one VDU0 instance
one VDU1 instance (named VDU1(0) ).
Both these instances were created according to the main rules of the T-NOVA lifecycle,
handled by the http protocol. Figure 28 summarizes this condition.
Figure 28 Starting Conditions
Note: The Traffic Generator exchanges both signalling packets (SIP) and media packets
(RTP) with the vSBC. The SIP packets contain the media coordinates (IP address/port)
that must be used by the Traffic Generator, chosen according to a “SDP Offer/Answer”
negotiation during the call setup phase.
2) Scale-out scenario
Greatly increasing the traffic coming from the Traffic Generator, the ”CPU utilization”
of the VDU1(0) instance overcomes the scale-out threshold (70%). If during the

T-NOVA | Deliverable D7.2 Integrated Pilot and Evaluation Report
©T-NOVA
Consortium
64
monitoring interval (60 sec) the collected samples are over this threshold for at least
two times, Tenor requires VIM the allocation of a new VDU1 instance and, in case of
positive outcome, notifies this request also to the VNFM. A scale-out http message is
sent to the O&M of the VDU0, which sets to “enable” the administrative status of the
VDU1(1) instance. From now on, the SIP controller of VDU0 sets the media information
of the SIP signalling (IP address/port) in such a way that the Traffic Generator can
achieve both the VDU1 instances, achieving in this way a load balancing of RTP packets.
Figure 29 summarizes all these actions.
Figure 29 Scale-out scenario
3) Scale-in scenario
Greatly reducing the traffic coming from the Traffic Generator, the “CPU utilizaton” of
VDU1 goes below the scale-in threshold (20%). If during the monitoring interval (60
sec) the collected samples are under this threshold for at least two times, Tenor
requires VIM to remove the VDU1(1) instance, and notify this request also to the VNFM.
A scale-in message is sent to the O&M of VDU0 (via http). The O&M sets to “disable”
the administrative status of the VDU1(1) instance. From now on, the SIP controller of
VDU0 sets the media information of SIP signalling (IP address/port) in such a way that
the Traffic Generator can achieve only the first VDU1(0) instance. Figure 30 summarizes
all these actions.

T-NOVA | Deliverable D7.2 Integrated Pilot and Evaluation Report
©T-NOVA
Consortium
65
Figure 30 Scale-in scenario
In this way, the vSBC is again in the same initial condition described in step 1).
5.1.4. Validation
A short video related to the scaling procedures previously described is available at
https://drive.google.com/file/d/0B-GXkt5u56b-WU5GTGNoT1dvZFk/view?usp=sharing
DEMO 2: Scaling a VNF: vHG
5.2.1. Abstract/Description
Deployment of the vHG VNF and scaling in/out of VDUs (workers) to support
consumption spikes.
5.2.2. Motivation
Adaptation of resources allocated to the vHG VNF in order to dynamically use an
optimal number of workers (and their CPU resources), relative to the number of users
of the service.
5.2.3. Storyboard
Phase 1: Instantiation of the vHG VNF through the Marketplace.

T-NOVA | Deliverable D7.2 Integrated Pilot and Evaluation Report
©T-NOVA
Consortium
66
Step 1.1: As a customer in the Marketplace, we select and purchase the VHG
service
Phase 2: Video consumption by one End-User.
Step 2.1: The End-User wants to watch a video for the first time. The video has
not yet been cached in a virtual CDN node by any vHG. So the video is
retrieved from the original server
Step 2.2: The VHG sends a request to a service (Frontend) to cache the video
in a virtual CDN cache node, close to the End-User.
Step 2.3: When the End-User wants to watch again the same video, the video
now comes from the virtual CDN cache node, thanks to the redirection
performed by the VHG
Step 2.4: When the End-User wants to watch again the same video but in
another context (device changed, network degradation, …) obliging him to
save bandwidth, the video still comes from the virtual CDN cache node but
adapted in reduced quality
Phase 3: Arrival of additional number of End-Users for consuming the video -> scale-
out procedure launch
Step 3.1: We simulate a massive arrival of users willing to watch videos (all
different).
Step 3.2: The single existing VDU « Worker » starts to suffer. One VDU is not
enough, the metric "Transcoding_score" increases. So, the Orchestrator of the
Service Provider sends requests to add another VDU
Step 3.3: The new VDU is started and the metric "transcoding_score »
decreases. There are enough VDU "Workers" to support new users
Phase 4: Removal of End-Users in video consumption process -> scale-in procedure
launch
Step 4.1: We stop the arrival of new users
Step 4.2: Since the metric "transcoding_score" has been zero for a few
seconds, the Orchestrator of SP sends request to remove a VDU
Step 4.3: The additional VDU is deleted
5.2.4. Validation
Phase 1:
We notice in OpenStack the start of the VDUs (Figure 31).

T-NOVA | Deliverable D7.2 Integrated Pilot and Evaluation Report
©T-NOVA
Consortium
67
Figure 31 Start of the VDUs
Phase 2: Observe logs on TeNOR interface
Phase 3:
Step 3.2: logs on Tenor
Figure 32 TeNOR logs (step 3.2)
Step 3.3: Celery flower interface, we can see 2 workers and one admission
logs on Tenor

T-NOVA | Deliverable D7.2 Integrated Pilot and Evaluation Report
©T-NOVA
Consortium
68
Figure 33 TeNOR logs (step 3.3)
Phase 4:
Step 4.2: logs on Tenor
Figure 34 TeNOR logs (step 4.2)
Step 4.3: Celery flower interface

T-NOVA | Deliverable D7.2 Integrated Pilot and Evaluation Report
©T-NOVA
Consortium
69
It is observed that one of the workers in now stopped.
DEMO 3: end-2-end NS deployment over multi-PoP
infrastructure
5.3.1. Abstract/Description
Service function chaining is currently de-facto use case to demonstrate automatic
service deployment and VNF coupling in NFV environment in order to provide value-
added services to network customers using out-of-the-box components. In the second
year review an SFC service was demonstrated that showed the provisioning of video
transcoding and traffic classification within two different service chains. In this
demonstration, a different network service is targeted: the user traffic is classified using
the vTC and redirected to a specific web service using the vProxy and vSA T-Nova VNFs,
depending on the user's preference. The services is running across multi-PoP
environment the traffic is steered via service chain and VPN, and the VNFs are
distributed across two OpenStack deployments. Components involved: Netfloc, WICM,
vTC, vProxy, vSA, Tenor.
5.3.2. Motivation
Further works in T-Nova have remarked the completion and testing of VNFs such as
the vProxy and vSA. In parallel, Netfloc SFC mechanism has been tested and validated,
including a support for Heat plugin for Netfloc SFC deployment. Moreover the
resilience of the entire NFI-Cloud infrastructure has been improved to support
differentiated service chains. The integration Tenor-Netfloc has been completed and
tested which has contributed to automatic top-down deployment of NSD
(Marketplace-Tenor-Netfloc) in a click of a button. Finally the pilot testbed has been
interconnected (Demokritos and Aveiro). The aim is to engage all these developments
into a new use case scenario that will show the automatic provisioning of SFC, using
new VNFs in a novel service deployed in multi-PoP scenario.
5.3.3. Storyboard
Phase 1: Initially the service chains are specified in the provisioning template (yaml file)
of Tenor, specifying the required resources for each VNF of the chain, Netfloc
endpoints and the ID of the public network in OpenStack.
Phase 2: Tenor deploys the template in the PoP2 (Demokritos) and PoP2 (Aveiro), a
process that includes the creation of networks, subnets, ports and VNF VMs (vTC and
vProxy in Demokritos, and vSA in Aveiro) in OpenStack and invokes the Netfloc API
chain creation via Heat.

T-NOVA | Deliverable D7.2 Integrated Pilot and Evaluation Report
©T-NOVA
Consortium
70
Phase 3: At this stage the service chain is invoked but there is not yet traffic in the
pops. A client attached to the Pica8 switch in Demokritos triggers a web server page
from a Server attached in the Pica8 switch in the PoP in Aveiro.
Phase 4: The traffic is steered to the PoP2 in Demokritos by WICM and throughout the
chain. The traffic is initially classified by the vTC and part of it is steered towards the
vProxy. From there the same traffic goes out of the PoP2 and with the redirection
configured by the WICM, it is sent to Aveiro SFC PoP to pass via the vSA VNF before
reaching the server.
Phase 5: A mirror instance of the WICM in Aveiro redirects the incoming traffic from
the chain (tagged with VLAN ID) from Demokritos into the SFC PoP and out to the
Server. Finally the Client sees the web page in his browser (This has to be yet
configured.)
5.3.4. Validation
Demo setup (Multi Pop: Demokritos and Aveiro)
The following graph shows the demo setup in multi-pop environment. It depicts the
vTC, vProxy VNFs and the vTC-f and vSA as secondary VNFs in the scenario, all
deployed in the Demokritos PoP2. OpenStack nodes are hosting the VNFs and Netfloc
is in charge of the SDN configuration and the SFC setup. WICM is controlling the Pica8
swtich. following graph shows the SFC PoP in the Aveiro Pilot (Figure 38). In the Aveiro
testbed, there is all-in-one OpenStack setup connected to Netfloc instance in control
of the network. The Pica8 switch is controlled by a WICM instance.

T-NOVA | Deliverable D7.2 Integrated Pilot and Evaluation Report
©T-NOVA Consortium 71
Figure 35 Multi-PoP demo setup

T-NOVA | Deliverable D7.2 Integrated Pilot and Evaluation Report
©T-NOVA
Consortium
72
SFC NSD Tenor
Tenor defined an IETF MANO compliant NSD that includes all the resources foe the
NSD, including the specification of the chain and its connection points.
Figure 36 TeNOR / NSD
OpenStack VNFs and networks in Demokritos PoP
Figure 37 shows the OpenStack dashboard for the Neutron network setup that includes
the interfaces assigned to the VNFs (ingress and egress ports).

T-NOVA | Deliverable D7.2 Integrated Pilot and Evaluation Report
©T-NOVA
Consortium
73
Figure 37 OpenStack dashboard
Service chain creation log in Netfloc
The figure below shows the logs in Netfloc during NS service deployment triggered by
TeNOR.
Figure 38 Netfloc / logs
NetFLOC Restconf API
Following is the Restconf web interface showing the List chain API.

T-NOVA | Deliverable D7.2 Integrated Pilot and Evaluation Report
©T-NOVA
Consortium
74
Figure 39 Restconf web interface

T-NOVA | Deliverable D7.2 Integrated Pilot and Evaluation Report
©T-NOVA
Consortium
75
6. CONCLUSIONS
Deliverable D7.2 provides a report on the final integration and the deployment of T-
NOVA on distributed pilots in geographically separated testbeds operated by different
partners. This setup was used to assess and evaluate the T-NOVA solution under
various setups and configurations. The actual testing campaign has taken place in the
final year of the project. At the same time components have been improved and
parameters have been adjusted based on intermediate results.
The system-level testing procedure was directly based on the earlier defined use cases
eventually describing all the steps of a service lifecycle from the resource advertisement
to the service termination. This deliverable provides the validation procedure and
results for the T-NOVA system components.
Besides the hard evaluation of the system components, another perspective from the
user’s side was considered for further evaluation of the T-NOVA concept. For this
reason, demonstrators were developed that showcase individual applications.
In summary, the results presented in this deliverable confirm the validity and efficiency
of the T-NOVA proof-of-concept.
T-NOVA | Deliverable D7.2 Integrated Pilot and Evaluation Report
©T-NOVA
Consortium
76
7. REFERENCES
[D2.1] Jorge Carapinha (ed.) et al., T-NOVA project, Deliverable D2.1, System
Use Cases and Requirements, 2014
[D2.21] George Xilouris (ed.) et al., T-NOVA project, Deliverable D2.22, Overall
System Architecture and Interfaces - Interim, 2014
[D2.22] George Xilouris (ed.) et al., T-NOVA project, Deliverable D2.22, Overall
System Architecture and Interfaces, 2015
[D2.51] George Xilouris (ed.) et al., T-NOVA project, Deliverable D2.51, Planning
of trials and evaluation – Interim, 2014
[D2.52] George Xilouris (ed.) et al., T-NOVA project, Deliverable D2.51, Planning
of trials and evaluation – Final, 2015
[D3.3] F. Liberati (ed.) et al, T-NOVA project, Deliverable D3.3, Service
Mapping, 2016
[D4.21] Letterio Zuccaro (ed.) et al., T-NOVA project, Deliverable D4.21, SDN
Control Plane – Interim, 2015
[D4.31] I. Trajkovska (ed.) et al., T-NOVA project, Deliverable D4.31, SDK for
SDN – Interim, 2015
[D4.32] I. Trajkovska (ed.) et al., T-NOVA project, Deliverable D4.32, SDK for
SDN – Final, 2015
[D5.2] B. Parreira, J. Bonnet (ed.) et al., T-NOVA project, Deliverable D5.2,
Function Deployment, Configuration and Management, 2016
[D5.31] P. Paglierani (ed.) et al., T-NOVA project, Deliverable D5.31, Network
Functions Implementation and Testing – Interim, 2015
[D5.32] P. Paglierani (ed.) et al., T-NOVA project, Deliverable D5.32, Network
Functions Implementation and Testing – Final, 2016
[D6.1] Aurora Ramos (ed.) et al., T-NOVA project, Deliverable D6.1, Service
Description Framework, 2015
[D6.3] Evangelos K. Markakis (ed.) et al., T-NOVA project, Deliverable D6.3,
User Dashboard, 2015
[D6.4] Aurora Ramos (ed.) et al., T-NOVA project, Deliverable D6.4, SLAs and
Billing, 2015
[D7.1] George Xilouris (ed.) et al., T-NOVA project, Deliverable D7.1, Early Pilot
Site Deployment, 2015

T-NOVA | Deliverable D7.2 Integrated Pilot and Evaluation Report
©T-NOVA
Consortium
77
LIST OF ACRONYMS
Acronym Explanation
AAA Authentication, Authorisation, and Accounting
API Application Programming Interface
DHCP Dynamic Host Configuration Protocol
DNS Domain Name System
DoS Denial of Service
DoW Description of Work
DPI Deep Packet Inspection
DUT Device Under Test
E2E End-to-End
EU End User
FP Function Provider
KPI Key Performance Indicator
LAN Local Area Network
NF Network Function
NFaaS Network Functions-as-a-Service
NFS Network File System
NFV Network Functions Virtualisation
NFVI Network Functions Virtualisation Infrastructure
NIC Network Interface Controller
NIP Network Infrastructure Provider
NS Network Service
ODL OpenDaylight
OSS / BSS Operational Support System / Business Support System
OVS Open vSwitch
PoC Proof of Concept
PoP Point of Presence
REST Representational State Transfer
RID PCI Express Requestor ID
SA Security Appliance

T-NOVA | Deliverable D7.2 Integrated Pilot and Evaluation Report
©T-NOVA
Consortium
78
SaaS Software-as-a-Service
SBC Session Border Controller
SFC Service Function Chaining
vDPI Virtual Deep Packet Inspection
vHG Virtual Home Gateway
VM Virtual Machine
VNF Virtual Network Function
VNFaaS Virtual Network Function as a Service
VNPaaS Virtual Network Platform as a Service
vPxaaS Virtual Proxy as a Service
vSA Virtual Security Appliance
vSBC Virtual Session Border Controller
vTC Virtual Transcoding Unit
WAN Wide Area Network
WICM Wide-area Network Infrastructure Connection
Manager
WP Work Package

T-NOVA | Deliverable D7.2 Integrated Pilot and Evaluation Report
©T-NOVA
Consortium
79
ANNEX I: DEPLOYMENT OF SFC COMPONENTS IN THE
AVEIRO PILOT
Netfloc setup and SFC deployment
The integration of Netfloc SDK with some of the T-Nova VNFs and the WICM has been
achieved successfully on the Aveiro premises testbed.
In this section, the detailed steps are described on how to achieve a complete Netfloc
setup in the OpenStack PoP environment offered by Aveiro Pilot.
In Figure 40, a diagram of the physical setup of the SFC PoP is shown. The traffic that
entering the PoP, is controlled by WICM which is in charge of configuring and
controlling the external packets coming to the Pica 8 switch.
The Pica 8 switch is communicated with an all-in-one OpenStack setup, containing
Compute, Control and Network nodes in a single physical machine, denoted as PoP2
in the figure.
The vRouter is a virtual router created and managed by the Neutron agent in
OpenStack. Finally, an additional physical host is attached to OpenStack deployment
that contains the Netfloc SDN component.
Figure 40 Physical setup of SFC PoP environment in Aveiro pilot tesbed

T-NOVA | Deliverable D7.2 Integrated Pilot and Evaluation Report
©T-NOVA
Consortium
80
The OpenStack setup along with the networking configuration was carried out
beforehand. This document describes the steps for installing Netfloc and testing the
validity of this integration.
7.1.1. Prerequisites
Netfloc is an SDN toolkit that is based on the OpenDaylight controller. Details on the
implementation design of Netfloc have been outlined in deliverables [D4.2], [D4.31]
and [D4.32].
Netfloc can be installed as a feature in the ODL standard edition, or run as standalone
component as it already includes the karaf binaries of the controller. In the second
case, a pre-compiled version of Netfloc can be downloaded from the ICCLab git
repository:
git clone https://github.com/icclab/netfloc
In the case of developing applications and libraries in Netfloc, you will have to rebuild
the code. In this scenario installation of following is required:
JAVA 7 JDK
Maven 3.1.1
OpenFlow 1.3 enabled network devices
OpenvSwitch
Open Stack basic environment (ex. 3 nodes: compute, control, neutron)
As the OVS already comes in a standard Ubuntu 14.04.4 LTS installation, the commands
applied to install Maven and Java are:
7.1.2. Maintaining consistency with the OpenDaylight Maven
repository

T-NOVA | Deliverable D7.2 Integrated Pilot and Evaluation Report
©T-NOVA
Consortium
81
The next step includes updating the settings.xml local Maven file. The ODL project
maintains its own repository outside of Maven Central, which prevents Maven from
resolving by default the ODL artifacts. Since ODL includes several tightly coupled
projects, building a project (using mvn clean install) results in the inclusion of some
artifacts. To ensure the project compilation is successful, the local maven installation
has to point to the ODL repository. One way to do this is to keep the current version
of the file ~/.m2/settings.xml same as in:
https://github.com/opendaylight/odlparent/blob/master/settings.xml
This is achieved with the following command:
Repeating this process in different machines may result in errors related to “non-
resolvable pom file“ which us due to missing features and artifacts’ visioning mismatch.
This is a common error related to some ODL libraries in which there were changes in
the repository over time, while the local version was preserved unchanged. In this case,
the approach is to find the correct candidate in the ODL repository and substitute it in
the local configuration. An alternative approach is to configure it as stated in the
following ODL instructions:
https://wiki.opendaylight.org/view/Infrastructure:Nexus
This consists of installing the Nexus repository manager and configuring a Proxy to
handle the ODL builds. The principal repositories to be added are: maven central and
OpenDaylight snapshot.
The Nexus application is however difficult to configure remotely, so we recommend
downloading a pre-packed Netfloc version, provided the aim is to use it as a Customer,
i.e. by using the custom defined libraries and APIs. Should you need to use Netfloc as
a Provider (i.e. plugin development and source code modification), then all the
dependencies have to be managed beforehand.
7.1.3. Netfloc and OpenStack integration process
The next step after installing Netfloc is to configure the underlying OpenStack
environment to work with Netfloc. This means that up to this point, OpenStack is not
SDN enabled, and uses primarily the Neutron component for network management.
The following guide was fully applied for that purpose:
http://www.hellovinoth.com/openstack-kilo-opendaylight-lithium-integration-on-ubuntu-14-04-lts/
This consisted of integrating Netfloc (based on THE Lithium release of ODL) with
OpenStack Kilo (installed in the PoP).
Overall the procedure consists of wiping the previous OpenStack configuration and
any Open vSwitch agent setup, along with the entire networks and VMs already
running in the environment. This includes clean-up and recreation of the Neutron and

T-NOVA | Deliverable D7.2 Integrated Pilot and Evaluation Report
©T-NOVA
Consortium
82
Open vSwitch databases. After this, Netfloc (ODL) was set as the only source in charge
of the Open vSwitch and the connectivity was tested.
This creates OVS br-int bridge on the OpenStack node to which later, the VMs are
attached. We created the br-ex bridge needed for the external Neutron network. Also
the qrXXX and qgYYY interfaces for the Neutron vRouter and the DHCP were
automatically attached, as Figure 41 shows.
Next step was to configure the OVS on the Open Stack node to connect to ODL on
port 6633 and set up ODL as manager on port 6640 using the following OVS
commands:
ovs-vsctl set-manager tcp:[Controller_IP]:6640
ovs-vsctl set-contorller tcp:[Controller_IP]:6633
Figure 41 OVS bridge setup after Netfloc-OpenStack integration in PoP2
The sanity checks passed correctly and we were able to do network configuration and
setup.
To ensure all the state are clear before running Netfloc, the following steps and check-ups were required:
OVS is running on the OpenStack node
SDK not running: ./karaf/target/assembly/bin/status
Clean OpenStack environment (no VMs, router interfaces, routers, and networks)
Source the admin file: source keystonerc_admin
Make sure you delete the following directories in the SDN node:
rm -rf karaf/target/assembly/data/; rm -rf karaf/target/assembly/journal/;
rm -rf karaf/target/assembly/snapshots/
Finally Netfloc was started with the following command:
./karaf/target/assembly/bin/start
To monitor Netfloc logs in the ODL run:
tail -f ./karaf/target/assembly/data/log/karaf.log

T-NOVA | Deliverable D7.2 Integrated Pilot and Evaluation Report
©T-NOVA
Consortium
83
7.1.4. Configuring OpenStack HEAT for Netfloc
To setup the SFC environment in an automatic way, we configured the OpenStack HEAT
plugin for Netfloc:
https://github.com/icclab/netfloc-heat
This consists of copying the netfloc.py library in the heat plugins directory and defining
a HoT-specific yaml template to create all the required OpenStack resources (VNF VMs,
networks, and ports) and invoke the chain in Netfloc.
Prepare the plugin
Create a heat plugin directory under /usr/lib and copy inside the file netfloc.py
(or place it alternatively under existing user-defined library):
mkdir /usr/lib/heat; cp src/netfloc.py /usr/lib/heat/
Uncomment the plugin_dirs line in /etc/heat/heat.conf and include the path to
the library. In Demokritos testbed:
plugin_dirs=/var/lib/heat/heat/contrib/nova_flavor/nova_flavor,/var/lib/heat
/heat/contrib/netfloc/resources Netfloc:
/var/lib/heat/heat/contrib/netfloc/resources/netfloc.py
Restart the heat engine service:
service heat-engine restart
Run heat resource-type-list and verify that the following two Netfloc resources
show up:
Netfloc::Service::Chain
7.1.5. Service chain deployment
Before creating a chain, Netfloc must be running in a clean OpenStack
environment and a public network has to be manually created, assigning its ID
as a parameter in the sfc_create.yaml file.
Once the setup is done and the chain is created using:
heat stack-create -f sfc_create.yaml [name_of_stack]
the chain ID is listed in the Outputs section of the Stack Overview. You can verify
that the traffic steering is correct (ex. using tcpdump) inside the VNF and on
the endpoints.
To delete the chain run:
heat stack-delete [name_of_stack]
Figure 42 depicts the SFC setup and the ports and bridges created in the OpenStack
virtual switch.

T-NOVA | Deliverable D7.2 Integrated Pilot and Evaluation Report
©T-NOVA
Consortium
84
Figure 42 Components of the SFC and their connections in the PoP
7.1.6. Service chain APIs and flows repository
Once the stack is created, we can verify the correct creation of the chain by looking in
the Restconf API documentation in the following URL:
[Neftloc-URL]:8181/apidoc/explorer/index.html#!/netfloc(2015-01-05)
Netfloc and its APIs are listed among the current features (projects) loaded in the ODL
run-time. From there, one can call the List chain API that will results in output similar
as in Figure 43.

T-NOVA | Deliverable D7.2 Integrated Pilot and Evaluation Report
©T-NOVA
Consortium
85
Figure 43 Service chains list API based on RESTCONF RPC
This is related to some of the improvements implemented in Netfloc for data
persistency and API extension. This has made the controller more stable for re-
deployment, since Netfloc now preserves the last state upon start-up. More
information can be found here:
https://blog.zhaw.ch/icclab/data-model-definion-in-netfloc-and-data-representation-in-netflogi/
The chain rules inserted by Netfloc, can be visualized in URL as the following:
[Neftloc-URL]:8181//restconf/operational/network-topology:network-topology/topology/flow:1/
Finally this information can be further verified inside Netflogi, the GUI of Netfloc, in a
user-friendly manner. This is a work in progress and has been partially described in the
previous URL: https://blog.zhaw.ch/icclab/data-model-definion-in-netfloc-and-data-
representation-in-netflogi/.