Embed Size (px)
Citation preview

ADVANCED MANUFACTURING
INTEGRATED REPORT 2017
NA
MPA
K LIMITED
INTEG
RATED REPO
RT 2017

Contents
NAVIGATIONThe following icons provide links to additional information:
This icon gives you references to supporting information throughout the report.
PAGE
This icon tells you where you can find more information online and on our website: www.nampak.com.
These icons are for our material issues, details of which appear on page 29 .
1 About our report
WHO WE ARE
2 This is Nampak
4 How we define value and the stakeholders who help us create it
5 Our operating context
6 How we performed in 2017
8 Chairman’s review
HOW WE CREATE VALUE
10 How we create value using the six capitals
12 Human capital
14 Manufactured capital
16 Financial capital
18 Intellectual capital
20 Social and relationship capital
21 The key relationships on which we rely to create value
22 Natural capital
STRATEGIC CONTEXT
24 Our strategy – performance and plans
26 Chief executive’s report
29 Material issues
32 Our top risks and opportunities
STRATEGIC PERFORMANCE
36 Chief financial officer’s review
47 Five-year financial review
50 Summarised financial statements
Operational reviews
58 Metals
63 Glass
65 Plastics
68 Paper
GOVERNANCE AND REMUNERATION
70 Creating value through good corporate governance
76 Board of directors
78 Executive committee
80 Remuneration report
92 Social, ethics and transformation committee report
SHAREHOLDER INFORMATION
94 Notice of annual general meeting
103 Notes to the notice of annual general meeting
105 Form of proxy
107 Glossary of terms
108 Shareholders’ diary
IBC Corporate information
www.nampak.com
Scan this QR code with your mobile device for quick
access to the report.
Our integrated report is our primary report to shareholders and other Nampak stakeholders. In it, we aim to provide a balanced and accurate assessment of our financial, economic, social, governance and environmental issues. It provides information on our operating context, strategy, business model, operational and financial performance, risks and opportunities and corporate governance.
We report on the six capitals on which we rely, the stakeholders with whom we engage and the material issues that have the potential to affect the delivery of strategy and the group’s ability to create value in the short, medium and long term.
In addition to the integrated report, we have published audited annual financial statements, as well as comprehensive sustainability and remuneration reports which are available on our website www.nampak.com.

About our report
Forward-looking informationThis integrated report contains forward-looking statements that, unless otherwise indicated, reflect the group’s expectations at year-end. Actual results may differ materially from the group’s expectations. The group cannot guarantee that any forward-looking statements will materialise and, accordingly, readers are cautioned not to place undue reliance on them. The group disclaims any intention and assumes no obligation to revise any forward-looking statement, even if new information becomes available, other than as required by the JSE Limited Listings Requirements or any other applicable regulations.
REPORT FEEDBACKWe strive to improve our reporting and welcome any comments that will assist us in doing so. Please contact [email protected].
SCOPE AND BOUNDARYThis report covers the period from 1 October 2016 to 30 September 2017. Where there have been any significant events after year-end and before the approval date of this report, these have also been included. The content covers all Nampak’s businesses in all territories in which it operates, except where specifically noted.
We report on our operations by packaging substrate, being metals, glass, plastics and paper and also by geographical region, being South Africa, Rest of Africa, the United Kingdom and the Republic of Ireland.
All significant items are reported on a comparable basis.
SIGNIFICANT CHANGES DURING THE REPORTING PERIODNampak provided R569 million to eligible pensioners to enable them to fund their own post-retirement medical aid. Although this had an immediate negative impact on cash resources, it resulted in a reduction of Nampak’s post-retirement medical aid liability. R433 million was funded using 25% of the proceeds from the property sale and leaseback transaction in 2016. We impaired assets amounting to R668 million, mainly in the Plastics business in Europe and in the Glass packaging business where goodwill was written off. The group incurred foreign exchange losses of R160 million, mainly in the Nigerian business. See page 40 of the CFO review. Intangible assets amounting to R114 million were impaired in the Glass business.
MATERIALITY We define material issues as those which have the potential to significantly affect our ability to create stakeholder value and contribute to future sustainability for the group. These form the anchor of this report and are detailed on page 30 .
INTERNAL CONTROL AND ASSURANCENampak assesses risks based on material risks that will impede the performance against the six capitals. The current combined assurance model in place is representative of how the risks are currently being managed between four lines of defence, the fourth line being the board and its committees.
The coordination, integration and alignment of assurance activities are under refinement. The aim is to ensure that a robust combined assurance framework is adopted to provide the governing body with a
holistic view of risks and controls and whether the mitigations are effective. This will enable the combined assurance model to be further entrenched across the group.
The board, supported by the audit committee, ensures an effective control environment which supports the integrity of our information. Our systems of internal control are designed to provide reasonable assurance against material misstatement. The audit committee on behalf of the board assessed the adequacy and the effectiveness of controls as adequate through the confirmation of management and reports from the internal and external auditors.
Financial informationThe financial information in this report has been prepared in accordance with the recognition and measurement criteria of International Financial Reporting Standards (IFRS). These summarised financial statements have been derived from the consolidated financial statements and are consistent in all material respects. Copies of the independent auditor’s report are available for inspection at the company’s registered office.
Other informationWe considered the following main standards in providing other information: » JSE Listings Requirements » The Companies Act » King III and King IV » The IIRC’s International <IR> Framework » The FTSE/JSE Responsible Investment Index Series » GRI G4 guidelines and CDP standard
APPROVAL BY THE BOARDThe board acknowledges its responsibility for ensuring the integrity of the integrated report and has applied its collective mind in the preparation and presentation of this report. In our opinion, the 2017 integrated report addresses all material matters, fairly represents Nampak’s performance and is presented in accordance with the framework of the IIRC.
Tito Mboweni André de RuyterChairman Chief executive officer
WHO WE ARE ] Nampak Limited Integrated Report 2017
1
HOW WE CREATE VALUE
STRATEGIC CONTEXT
STRATEGIC PERFORMANCE
GOVERNANCE AND REMUNERATION
SHAREHOLDER INFORMATIONWHO WE ARE

This is Nampak
NigeriaProduct substrate: Metals, plastics and paperOperations: 3Employees: 509
AngolaProduct substrate: MetalsOperations: 1Employees: 227
BotswanaProduct substrate: Metals and plasticsOperations: 2Employees: 33
South Africa (including corporate office and R&D)Product substrate: Metals, glass and plasticsOperations: 28Employees: 4 141
TanzaniaProduct substrate: MetalsOperations: 1Employees: 68
United Kingdom and IrelandProduct substrate: PlasticsOperations: 8Employees: 422
Corporate office:Employees: 12
Nampak is Africa’s largest diversified packaging group. We are the market leader in the manufacture of beverage cans in South Africa and Angola and a major player in Nigeria. We have strong positions in other metal and plastic packaging in South Africa and other parts of the continent. We are a credible second supplier of glass in South Africa and are the sole producer of cigarette cartons in Nigeria. We are a significant manufacturer of paper packaging in several other African countries. In the United Kingdom, we are the leading producer of plastic milk bottles and we also have a presence in Ireland.
2
Nampak Limited Integrated Report 2017

SwazilandProduct substrate: Plastics
Operations: 1 Employees: 7
MalawiProduct substrate: Paper
Operations: 1 Employees: 111
EthiopiaProduct substrate: Metals and plastics
Operations: 2 Employees: 9
KenyaProduct substrate: Metals and paper
Operations: 2 Employees: 175
ZimbabweProduct substrate: Metals, plastics and paper
Operations: 3 Employees: 567
ZambiaProduct substrate: Metals, plastics and paper
Operations: 2 Employees: 139
Many of our customers are among the world’s largest FMCG companies.
Our world-class R&D facility in Cape Town assists our factories in achieving operational excellence and supports our customers’ varied packaging requirements.
54 operations in13 countries, employing6 420 people
Our vision
To provide best-in-class packaging throughout our selected markets.
Our mission
To deliver sustainable value to stakeholders as a responsible corporate citizen and leader in packaging in our selected markets.
Our material issues
Our operational and financial performance
Liquidity restrictions
Challenging macro-economic environment
People – safety, skills and transformation
Uncertain regulatory and policy environment
Our values
EXCELLENCE RESPONSIBILITYSAFETY
TEAMWORK INTEGRITY
WHO WE ARE ] Nampak Limited Integrated Report 2017
3
HOW WE CREATE VALUE
STRATEGIC CONTEXT
STRATEGIC PERFORMANCE
GOVERNANCE AND REMUNERATION
SHAREHOLDER INFORMATIONWHO WE ARE

How we define value and the stakeholders who help us create itWe endeavour to create value for all our stakeholders in the short, medium and long term. By defining what value means to us, we align the organisation to a common purpose: we all understand what we need to do.
Sustainable value creation depends on successful interactions with our stakeholders. Using our refreshed values as the basis of all exchanges, we aim to engage proactively with those who impact Nampak, as well as those on whom we have an impact. This informs our strategy development and evaluation, our risk management as well as our material issues.
Although stakeholder relationship management is implemented across the group, our social, ethics and transformation committee monitors the company’s activities in this regard. The Nampak board of directors, however, retains ultimate responsibility for corporate reputation and stakeholder relationships. Opportunities and risks arising from stakeholder engagements are also addressed in our risk management process.
we aim to maximise total shareholder return over
time by delivering sustainable profitability.
TO CREATE VALUE
1. Manage costs, particularly cash fixed costs2. Manage total gross margin by: » Optimising, not necessarily
maximising, volumes » Optimising unit margins » Not focusing unduly on
maximising revenue3. Manage capital, both working capital and capital projects
To drive profitability,
we need to:
To ensure sustainability,
we need to:1. Focus on safety, health and
the environment2. Grow by pursuing expansion 3. Transform by: » Investing in people development » Focusing on social upliftment4. Comply with the law, our value
system and code of ethics
IF WE DO ALL THESE THINGS RIGHT, WE CREATE SUSTAINABLE VALUE FOR ALL STAKEHOLDERS
Shareholders and other fundersProvide financial capital for sustainable earnings growth
EmployeesSupply skills needed to deliver on our strategy
Trade unionsProvide a platform on which to engage on issues
facing the business and employees
CustomersPurchase appropriate products at competitive prices
SuppliersSupply quality materials and services
Industry bodiesEngage on issues facing the industry
Governments and regulatorsProvide enabling environment for value creation
Civil societyHolds us accountable for being a
responsible corporate citizen
HOW WE DEFINE VALUE: OUR STAKEHOLDERS WHO HELP US CREATE VALUE:
4
Nampak Limited Integrated Report 2017

Our operating context
The environment in which we operate impacts our ability to deliver on our strategy and create value. In 2017, subdued economic activity, limited foreign exchange in Angola and Zimbabwe, improved conditions in Nigeria and policy uncertainty and skills shortages remained major features of Nampak’s macro-environment, making up our material issues in the year. These are discussed in detail on pages 29 to 31 .Within the packaging sector, and in our markets in particular, the most notable developments in 2017 included:
MARKET TRENDSGrowing demand for:
Some customers are backward integrating, making their own plastic packaging
A new beverage can manufacturer has entered the South African market,
operating a single line
Consolidation is occurring among some of our customers
We have recently completed the recapitalisation and modernisation of our Bevcan and DivFood businesses and continue to invest in state-of- the-art equipment and process enhancements.
Our response:
We secured a supply contract with a large brewer and continue to develop opportunities to grow.
We have doubled our share of the SA wine market since 2015.
We focus our efforts on the market for bottled beverages.
Constant innovation in packaging
Returnable glass bottles as the packaging of choice for beer with market growth driven by ongoing float replacements
Glass as the dominant choice of packaging for wine
Declining demand for glass packaging of food
products, with tendency to move to PET
Lighter weight packaging
Through Nampak R&D’s technology partnerships we work to reduce the weight of our products after significant reductions in recent years.
Recyclable, reusable, bio-based and biodegradable packaging
All Nampak products are recyclable and we support the recycling and re-use of packaging. We have developed a new design centre at R&D. Our water bottles are 25% rPET, juice bottles up to 40% rPET.
Our response:
Tamper evidence and easy opening packaging
DivFood is the only local manufacturer of easy open cans.Plastics offers a new water closure with reliable tamper evidence. Our twist-off food closures have vacuum buttons with an audible “click” as they are opened.
Packaging that preserves contents, extends shelf life and reduces food waste
Nampak R&D’s thermal processing specialists assist customers in ensuring a safe time and temperature combination for the packaging of all food.
Larger beverage cans for beer and energy drinks, smaller cans for CSDs
Bevcan now supplies 500ml beer cans in SA, and slender cans for CSDs in Angola.
More rigid plastic packaging, with demand growth exceeding GDP growth
We seek opportunities to provide additional packaging solutions for customers and actively source new customers to diversify our base.
UHT milk, traditionally packed in cartons, rather than fresh milk
We offer UHT packaging in both cartons and PET and we work with our customers to market the benefits of fresh milk, packaged in HDPE.
Motor vehicle oil in rigid plastic, rather than steel cans
We continue to grow our market share, supplying large oil distributors.
Continuing trend of:
Our response:
We are working to diversify into new markets, including personal, home and laundry care.
We see opportunity to rationalise underutilised assets and defend market share through focusing on operations excellence.
By improving operational efficiency, we are able to ensure a competitive offering.
A CHANGING COMPETITIVE LANDSCAPEWhat is happening:
WHO WE ARE ] Nampak Limited Integrated Report 2017
5
HOW WE CREATE VALUE
STRATEGIC CONTEXT
STRATEGIC PERFORMANCE
GOVERNANCE AND REMUNERATION
SHAREHOLDER INFORMATIONWHO WE ARE
In 2017, we extended the progress made in recent years to use new technologies, processes and management methods to improve our overall performance.
Net impairments
of R668 million
2%Decrease in group revenue 15%
Headline earnings per share up
Net finance costs down 19%
Gearing reduced from 49% to
Earnings per share down
due to once-off capital profit of R1.3 billion in the prior year
45%
86%
Rest of Africa trading profit up, now at 64% of total group trading profit
27%
Financial performance
How we performed in 2017
6
Nampak Limited Integrated Report 2017

23%Reduced water consumption
Nampak apprenticeships increased by 19% to
210
Achieved safety rate of
0.41 compared to our tolerance level of 0.40
63 000 tonnes of glass recycled
Reduction in CO2 emissions
7%
Social and environmental performance
R9.7 millionspent on corporate social investment
WHO WE ARE ] Nampak Limited Integrated Report 2017
7
HOW WE CREATE VALUE
STRATEGIC CONTEXT
STRATEGIC PERFORMANCE
GOVERNANCE AND REMUNERATION
SHAREHOLDER INFORMATIONWHO WE ARE

Chairman’s review
FOCUSING ON OPERATIONAL EXCELLENCEAgainst a backdrop of moribund economic activity and political volatility, increased regulatory requirements and growing competition, in 2017 Nampak remained focused on the task at hand: to enhance its performance across the board.
The singular focus on operations excellence resulted in exceptional performances in some parts of the business, most notably Bevcan, while others – such as Glass and Nampak Plastics Europe – are still heading up the curve of improvement.
Headline earnings per share increased 15%. The board took the difficult decision not to resume dividends to shareholders until the sustainability of cash repatriation from Nampak’s substantial businesses in Nigeria, Angola and Zimbabwe is assured, and the operating challenges at the Glass business, which took a R321 million goodwill and R114 million intangible asset impairment in the year, are resolved.
The board and management identified the key levers that Nampak must pull to ensure value creation for all stakeholders in the years ahead. In his review on page 26 , the CEO outlines the group’s approach to unlocking operating leverage, which I see as simply getting the most out of Nampak’s existing facilities, many of which have been upgraded in recent years to now operate the latest generation equipment.
CONTENDING WITH A DIFFICULT ENVIRONMENTIn 2017, business confidence in South Africa dropped to its lowest level in a quarter of a century. Unemployment was at its highest in 13 years. Demand was weak and political and policy uncertainty heightened. The de-industrialisation of the economy – which has seen the manufacturing sector’s contribution to GDP fall from 24% in the early 1980s to around 13% now – continued, correlating with more job losses. Local government became increasingly inefficient, and the supply of key infrastructure such as roads and electricity became less reliable.
This environment is clearly not conducive to efficient manufacturing – and the disruption caused to the Glass business in the second half of 2017 by protracted problems with the quality of the municipal electricity supply to its site is a case in point. Without investor and consumer confidence, underpinned by stable and predictable policies and reliable infrastructure, South Africa will continue to de-industrialise, putting both business and jobs at risk.
In other key Nampak markets in the Rest of Africa, the impact of soft commodity prices continued; however, there were some signs of recovery. The Nigerian economy emerged from its first contraction in 25 years, Zimbabwe’s GDP was supported by a
rebound in agriculture, and Angola started to benefit from the upturn in oil markets. But foreign currency shortages remained a problem in many markets, with businesses struggling to pay for imports and Nampak facing difficulties in repatriating cash. The launch of the Nigerian Autonomous Foreign Exchange (NAFEX) market in April 2017 did, however, lead to significantly improved liquidity and cash repatriation from Nigeria.
The contribution of the South African businesses to Nampak’s group revenue increased to 60% in 2017 from 57% in 2016 and that of the Rest of Africa businesses edged up to 32% from 31%. Due to the extremely strong performance of Bevcan Angola, the Rest of Africa operations’ contribution to trading profit increased to 64% from 52%.
STICKING TO STRATEGY, ENHANCING GOVERNANCEIn the year, while Nampak retained its broad strategy, more attention was given to the group’s first strategic objective (to unlock further value from the base business) than to the second (to accelerate growth in the Rest of Africa). This was a direct result of the issues around forex liquidity in key Rest of Africa operations, and slow recovery in commodity markets, which constrained growth in key African markets.
The board, which is responsible for the strategic direction of the group, continued to work to create value for all stakeholders through ensuring that the company is governed in an ethical and effective way. To this end, it oversaw a refresh of Nampak’s values and an update of its code of ethics in the year, and also welcomed two new directors.
Ms Jenitha John joined as an independent non-executive director of the board and a member of the audit committee and Ms Mandisa Seleoane was appointed as an executive director responsible for human resources. They replaced Ms Nosipho Molope and Mr Fezekile Tshiqi, who both retired from the board and whom we thank for their valuable contribution over the years.
We are satisfied that the board comprises the appropriate balance of knowledge, skills, experience, diversity and independence to discharge its governance roles and responsibilities objectively and effectively. Transformation is a key focus of the board, and like many corporates, Nampak was negatively affected in the year by the reconfiguration of the B-BBEE codes, suffering a significant downgrade to its contributor status. The Nampak B-BBEE ownership scheme had matured and was wound up. But the company was not pushed off course; Nampak’s employment equity has never been stronger and it has redoubled its efforts on every aspect of
Nampak Limited Integrated Report 2017
8

The board and management identified the key levers that Nampak must pull to ensure value creation for all stakeholders in the years ahead.
B-BBEE. In the year ahead, we will work on a new B-BBEE ownership scheme, which we intend to implement with great care to ensure that shareholder value is created during the process.
LOOKING FORWARDAfter a challenging year, Nampak is clear on what it needs to do in 2018 to further improve performance across the board in an environment of growing competition and greater regulatory requirements. It will focus first and foremost on delivering more operational improvements, most particularly at Glass and at Nampak Plastics Europe. It will do that in collaboration with its many stakeholders, to whom I would like to extend the sincere thanks of the board for their constructive engagement and support in 2017.
Tito MboweniChairman
Bryanston28 November 2017
OPERATIONAL EXCELLENCE
● South Africa● Rest of Africa● UK/Ireland
Revenue (%)
2017
Trading pro�t (%)
2017
64
40
(4)
60
32
8
WHO WE ARE ] Nampak Limited Integrated Report 2017
9
HOW WE CREATE VALUE
STRATEGIC CONTEXT
STRATEGIC PERFORMANCE
GOVERNANCE AND REMUNERATION
SHAREHOLDER INFORMATIONWHO WE ARE

How we create value using the six capitalsWe create value for society by converting raw materials into packaging products used to protect, preserve and transport consumer products. To do this, we rely on various relationships and resources, which we refer to as the six capitals.
The health, skills, safety, expertise and diversity of our people, suppliers and partners
Equity and debt financing; cash generated from operations and investments
Communities; customers; suppliers; trade unions; industry bodies; governments; our brand and reputation; regulatory authorities
Water, land, air, limestone, sand and soda ash, energy
Our production and research facilities; head office; public infrastructure; cullet, tinplate; aluminium; plastic; paper
Our experience; proprietary and licensed technology; innovation; operational, marketing and procurement excellence initiatives
INPUTS HOW WE DO BUSINESS
Informed by our vision and mission, our refreshed values and governance, our business model supports
delivery of our strategy and is our approach to people, processes and product
PEOPLEAttract, develop and
retain engaged employees
Develop and manage stakeholder relationships
Ensure ethics and accountability
Deliver an empowered company
PRODUCTProvide reliable,
fit-for-purpose products
Ensure consistent quality
Support initiatives to reduce, re-use and recycle
Invest in innovation through research and development
PROCESSESContinue to invest in new
technologies
Maintain a safe workplace
Secure our advantage by buying, making and selling better
Manufacture to the best quality and environmental standards
Continuously improve our performance
By considering our operating environment and material issues, we are responsive
to changes and are able to adapt
Human capital
Manufactured capital
Financial capital
Intellectual capital
Social and relationship capital
Natural capital
Nampak Limited Integrated Report 2017
10

We need inputs of each to deliver on our strategy and generate value for all stakeholders. When deciding on how best to grow and sustain our business, we carefully consider the trade-offs between the capitals, aiming to maximise positive outputs and outcomes, and limit any negative impacts.
OUTCOMES
Dependable and innovative packaging products made of metals, glass, plastics
and paper
Greenhouse gas emissions (scope 1 and 2) 26.62 tonnes CO2e per Rm revenue (down 7%)
OUTPUTS
VALUE CREATION
R18.822billion
REVENUE
» Number of employees
6 420» Amount paid in wages and salaries
R3.1 billion» LTIFR of
0.41 nearing tolerance level
» R735 million in capex
» Trading profit of
R1.967 billion» Impaired assets to value of
R668 million
» R44 million invested in R&D
» B-BBEE status
Level 6 (down from level 3)
» R9.7 million spent in social investment
» 54% of cullet used in glass manufacturing process
HOW WE CREATE VALUE ] Nampak Limited Integrated Report 2017
11
HOW WE CREATE VALUE
STRATEGIC CONTEXT
STRATEGIC PERFORMANCE
GOVERNANCE AND REMUNERATION
SHAREHOLDER INFORMATIONWHO WE ARE

Human capitalWe depend on the expertise and experience of our people, and their health, skills and safety, to operate our manufacturing facilities safely and efficiently, and in so doing assist in the delivery of our strategy. Our thorough people management methodology contributes to resolving inequalities in the workplace and our substantial investment in employee training and development ensures that we have the appropriate skills to sustain and grow our business.
We have an inclusive culture and we value diversity. Our people operate within a clearly defined framework and must adhere to the group’s code of conduct and business ethics.
Trade-offs in our use of human capitalA sluggish economy in South Africa and across the continent resulted in a highly competitive environment which led to the closure of some of our manufacturing sites and lines with a resultant reduction of employee numbers.
This negatively impacted human and social and relationship capital but has been positive for financial capital as we have benefited from a lower cost structure.
KEY INPUTS2017 2016
Number of employees Number 6 420 6 678Graduate development programme graduates
Men 17 11Women 11 15
Nampak apprenticeships Number 210 176Bursaries awarded Number 31 40Employee development investment R million 23.5 53.3Annual HIV counselling and testing in South Africa
%employees 76 59
OUTCOMES2017 2016
Wages and salaries paid R billion 3.1 3.1Lost-time injury frequency rate Rate 0.41 0.48Work-related fatalities Employees Number 0 0 Contractors Number 1 1Non-work-related fatalities Number 0 2Managers attending leadership training Number 129 109Graduate development programme graduates employed Number 13 26Employees retrenched Number 25 158
HOW WE ACHIEVED THESE OUTCOMES » Continued to focus on implementation of our health and safety programmes, including self-audits on risk control standards augmented by peer audits
» Refreshed our values and updated our code of conduct and business ethics » Provided bursaries for studies in engineering, science and accounting, and key disciplines in our business
» Invested in our training and development programmes » Continued to conduct annual reviews to identify potential management talent » Appointed a specialist manager to enhance group corporate finance and treasury
» Strengthened the executive committee with appointment of an experienced manager to oversee group restructuring
How we create value using the six capitalscontinued
Nampak Limited Integrated Report 2017
12
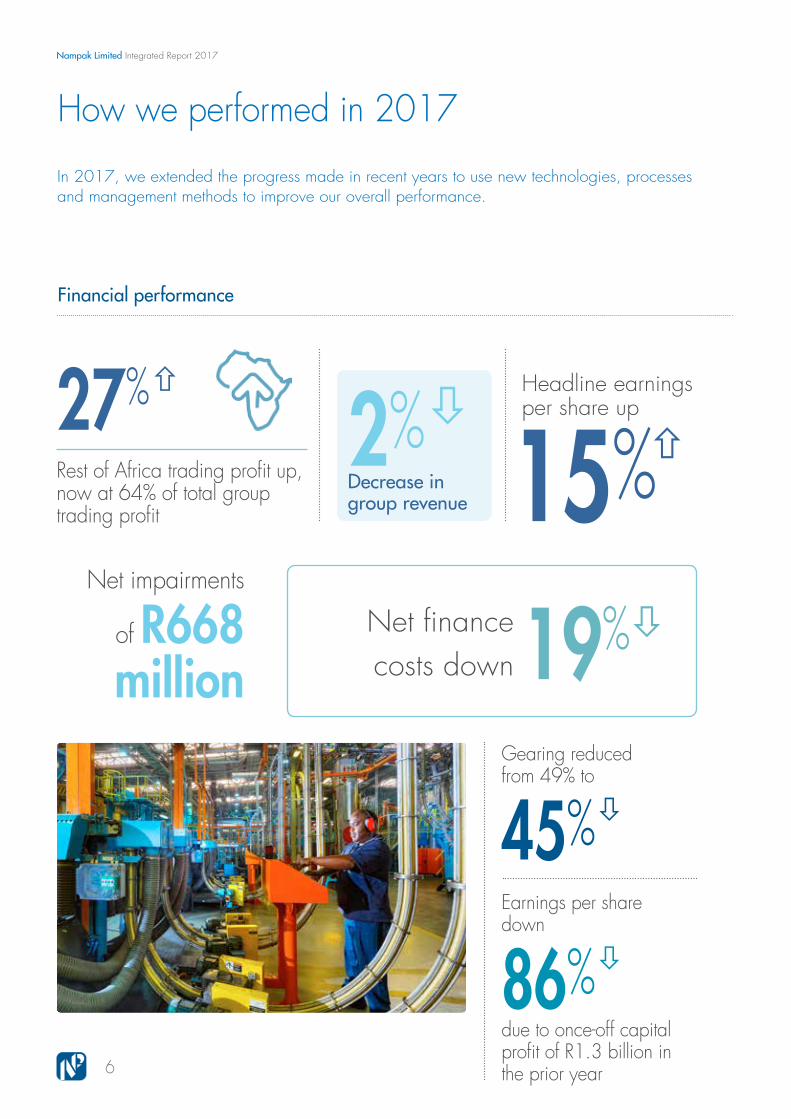
We regard training and developing our employees as essential to maintaining our overall competitive advantage in the market. The Nampak graduate development programme, which has been operating for many years, is one of the ways of growing our own talent. This programme is aimed at ensuring we have managers and leaders to sustain Nampak into the future.
HUMAN CAPITAL FOCUS: SECURING OUR TALENT PIPELINE
Thandeka Hlabane comes from Pretoria and attended Tokelo Secondary School in Evaton Small Farms. She holds a Bachelor of Business Administration degree from Cida City Campus. She joined Nampak in 2008 as a trainee at Bevcan Springs and completed the Nampak graduate development programme with distinction. Her individual project during her time on the programme contributed R2 million in annual savings for Bevcan.
After being promoted over the next few years, in 2012 she went on to complete a management development programme and was third-top student overall. On this occasion, her project contributed savings of R5 million for Nampak Liquid Petpak, Isando. In 2015, Thandeka was promoted to management accountant at DivFood Vanderbijlpark.
“Nampak provides room for growth and development and one can learn different processes of manufacturing without actually changing companies. Each time one moves from one cluster to another, one grows. The fact that Nampak is willing to invest in people development even in tough times excites me and tells me that Nampak values human capital,” she says.
Millicent Nyakaza was born in Kuruman in the Northern Cape and attended high school in Boshof in the Free State. Her mother was too poor to send her to university but through her own hard work she managed to attend the University of Cape Town and graduated with a Bachelor of Social Sciences degree.
She joined the Nampak graduate development programme in 2013 as a human resources graduate trainee based at Bevcan, Epping. After holding several roles in this field she was appointed HR manager of the Bevcan division at Woodmead.
Millicent says the graduate development programme taught her that patience and humility get you far. “The one thing that can be the downfall for many university graduates is that they come into the working world thinking that they know it all.
“What excites me about Nampak are the endless opportunities that one has to make a success of your career in this company,” Millicent enthuses. “I am the first graduate from my home and the young ones look up to me.”
Khanya Makiza joined Nampak Bevcan as a supply chain graduate in 2014. He holds a BCom Honours degree in logistics and supply chain management and is currently studying towards his master’s degree.
After spending some time in raw materials tracking and production scheduling he is now a sales account manager at Nampak Bevcan’s Woodmead offices. He says that this position gives him the opportunity to observe how Bevcan’s processes and systems translate into customer service, which is a perspective few individuals get to experience.
Khanya says, “Nampak invests greatly in its people. We are afforded multiple people development programmes, an accessible management structure through an ‘open door’ cultural approach, and a vibrant working environment.”
HOW WE CREATE VALUE ] Nampak Limited Integrated Report 2017
13
HOW WE CREATE VALUE
STRATEGIC CONTEXT
STRATEGIC PERFORMANCE
GOVERNANCE AND REMUNERATION
SHAREHOLDER INFORMATIONWHO WE ARE

Manufactured capitalWe use our substantial base of factories and equipment in 11 African countries and the United Kingdom and Ireland to manufacture the fit-for-purpose packaging products our customers require. We also rely on public infrastructure, including roads, rail and ports, to transport both raw materials and finished products. To achieve our promise of “Packaging Excellence”, we continue to upgrade and invest in new technologies. This enables us to further reduce the impact on the environment of our manufacturing processes and products.
Trade-offs in our use of manufactured capitalBy investing in more efficient modern equipment and closing factories to remain competitive, we require fewer employees. Job losses negatively impact human capital. Investments have a short-term negative impact on financial capital, but a long-term beneficial impact on this capital stock. The closure of the tinplate Bevcan facility in Durban is forecast to result in savings of R30 million a year.
KEY INPUTS2017 2016
Production facilitiesSouth Africa Number 28 28Rest of Africa Number 18 13UK/Ireland Number 8 10
Cullet Tonnes 63 000 59 000Polymer resin Tonnes 105 000 97 600Aluminium and tinplate usage not disclosed for competitive reasons.
OUTPUTS
Dependable packaging products made of metals, glass, plastics and paper, the quantities of which we do not disclose for competitive reasons.
OUTCOMES2017 2016
Capital expenditureExpansion R billion 0.3 1.0Replacement R billion 0.4 0.4
Depreciation and amortisation R million 896 912Impairment of assets R million 668 360
HOW WE ACHIEVED THESE OUTPUTS AND OUTCOMES » Pursued operations excellence and enhanced our maintenance practices » Benefited from first full year of production of expanded beverage can ends plant in Springs
» Installed and commissioned a gas transmission line to our Glass plant » Incurred transport costs and delays because of poor state of some public roads near our sites
» Closed our tinplate Bevcan line in Durban » Acquired two can assembly lines in Botswana » Installed multi-deck printer at our paint pail facility in Mobeni » Upgraded large format can assembly line in Paarl
How we create value using the six capitalscontinued
Nampak Limited Integrated Report 2017
14

Growing beverage can demand in South Africa and Angola as well as the acquisition of Alucan in Nigeria resulted in there being insufficient capacity to manufacture all the ends required for the cans.
Most of the ends for the entire sub-Saharan market are manufactured at Bevcan’s factory in Springs. This plant was recently expanded and this involved acquiring new equipment as well as reconfiguring the existing lines to bring them up to world-class efficiency standards.
Half of these ends are supplied to the South African market, while the remainder is exported to mainly Angola and Nigeria.
2017 marked the first full year of production of the expanded can ends plant in Springs, Gauteng. The end is an essential part of the beverage can – it is the top of the can, containing the aperture through which the drink can be poured or sipped.
This project has led to the creation of an additional 29 jobs and positively impacts Nampak’s human capital. The end handling system includes several robotic transfer systems plus auto-baggers all of which ensure high efficiencies and product quality. The opportunity was taken to reconfigure some equipment, which has enabled Bevcan to be globally competitive.
The new end profile is the most material-efficient in the Bevcan offering and has potential for further downgauging, which will result in even less raw material being used. The technology for this end design, the Interchangeable SuperEnd, has been supplied by Crown Cork.
MANUFACTURED CAPITAL FOCUS: BEVCAN EXPANDS ENDS CAPACITY
HOW WE CREATE VALUE ] Nampak Limited Integrated Report 2017
15
HOW WE CREATE VALUE
STRATEGIC CONTEXT
STRATEGIC PERFORMANCE
GOVERNANCE AND REMUNERATION
SHAREHOLDER INFORMATIONWHO WE ARE

Financial capitalOur financial capital inputs are made up of cash generated by our operations and debt and equity financing. These funds are used to provide working capital to run our business and to finance both expansion and replacement capital expenditure. They are also used to pay interest on borrowed money and distribute dividends to shareholders, when appropriate. Our financial capital is reinvested in all the other capitals in a measured way to grow and sustain our business, after careful consideration of the returns they will generate.
Trade-offs in our use of financial capitalWe sustain and grow our business with the use of financial capital and this has positive impacts on all the other capital stocks. By using financial capital to fund the installation of new equipment, at times we negatively impact on human capital when jobs are lost. The suspension of dividends over the past 18 months has improved our financial position but has been to the detriment, in the short term, of social and relationship capital.
KEY INPUTS2017 2016
Market capitalisation R billion 12.1 13.4Total equity R billion 9.7 9.4Working capital R billion 2.3 1.9Capital investment R billion 0.7 1.4Net interest-bearing debt R billion 4.4 4.6Net interest incurred R million 391.1 485.5
OUTCOMES2017 2016
Trading profit R billion 2.0 1.9Operating profit R billion 1.0 2.2Cash generated from operations before working capital R billion 2.4 2.3Cash generated from operations** R billion 2.1 2.8Net gearing % 45.0 49.0Earnings attributable to shareholders R billion 0.2 1.6Headline earnings per share Cents 123.8 107.6Dividends paid to shareholders* R million – 576Return on net assets % 12.3 11.2Employment costs R billion 3.1 3.1Interest paid to providers of capital R million 391.1 485.5Earnings per share Cents 36.6 254.5 * No dividend was paid for the 2016 financial year. The 2016 figure refers to the
amount paid in respect of 2015. ** Refer page 44 of CFO review – normalised cash generated before financing
activities up 11%.
HOW WE ACHIEVED THESE OUTCOMES » Actively monitored liquidity issues in the Rest of Africa » Cash repatriation from Nigeria and Angola » Hedging against currency devaluation » Established a capital assurance committee » Tightly controlled the capital investment programme » Continued focus on the reduction of exposure to defined benefit plans » Focused on improving working capital » Daily cash management » Actively managed debt maturity profiles » Operations excellence programme » Reduction of interest-bearing debt
How we create value using the six capitalscontinued
Nampak Limited Integrated Report 2017
16

We formed a multi-disciplinary capital assurance committee to vet all capital projects – both proposed and existing. It ensures that Nampak’s capital programme is tightly controlled using a stage-gate model, evaluating capex requests through various stages. It critically reviews both the commercial and financial aspects of all capital projects, evaluating their assumptions. It also scrutinises projects after the capex has been allocated to see that these live up to their targets in terms of returns, and if not, why not?
The capital assurance committee makes Nampak’s process of capital allocation more rigorous, making it more difficult for operations to access capital. For all proposed capital projects, we require a return of 1.5 times the weighted average cost of capital (WACC). With a current WACC of 11.9%, the hurdle rate is 17.85%.
As a result of the work of this new committee, we have noted significant improvements in capex forecasts. In 2017, Nampak committed capex of R0.7 billion, down from
In pursuit of the delivery of our strategy, we continued our work in 2017 to tighten Nampak’s financial disciplines and create a platform for growth. To this end, we made further enhancements to the way we govern processes within the finance portfolio.
R1.4 billion in 2016. The target for the year ahead is between R1.0 billion and R1.2 billion.
The cash management committee, in its second year of operating, focuses on the cash generation of each business unit. It requires each business to forecast daily cash movements for the following month, and overall expected cash movements in months two and three. As a result, we now benefit from a much improved correlation between forecast and actual cash flows, lending an “owner managed” feel to the business.
The head office cost evaluation committee meets once a month. It closely monitors all costs and ratios. This resulted in a further cut in head office costs in 2017 of R57 million.We continue to focus on optimising our working capital position, targeting an optimal working capital cycle that is facilitated by inventory being funded by trade payables, the funding by the group of high-quality trade receivables, and a focus on improving working capital velocity.
FINANCIAL CAPITAL FOCUS: TIGHTENING FINANCIAL DISCIPLINE
HOW WE CREATE VALUE ] Nampak Limited Integrated Report 2017
17
HOW WE CREATE VALUE
STRATEGIC CONTEXT
STRATEGIC PERFORMANCE
GOVERNANCE AND REMUNERATION
SHAREHOLDER INFORMATIONWHO WE ARE
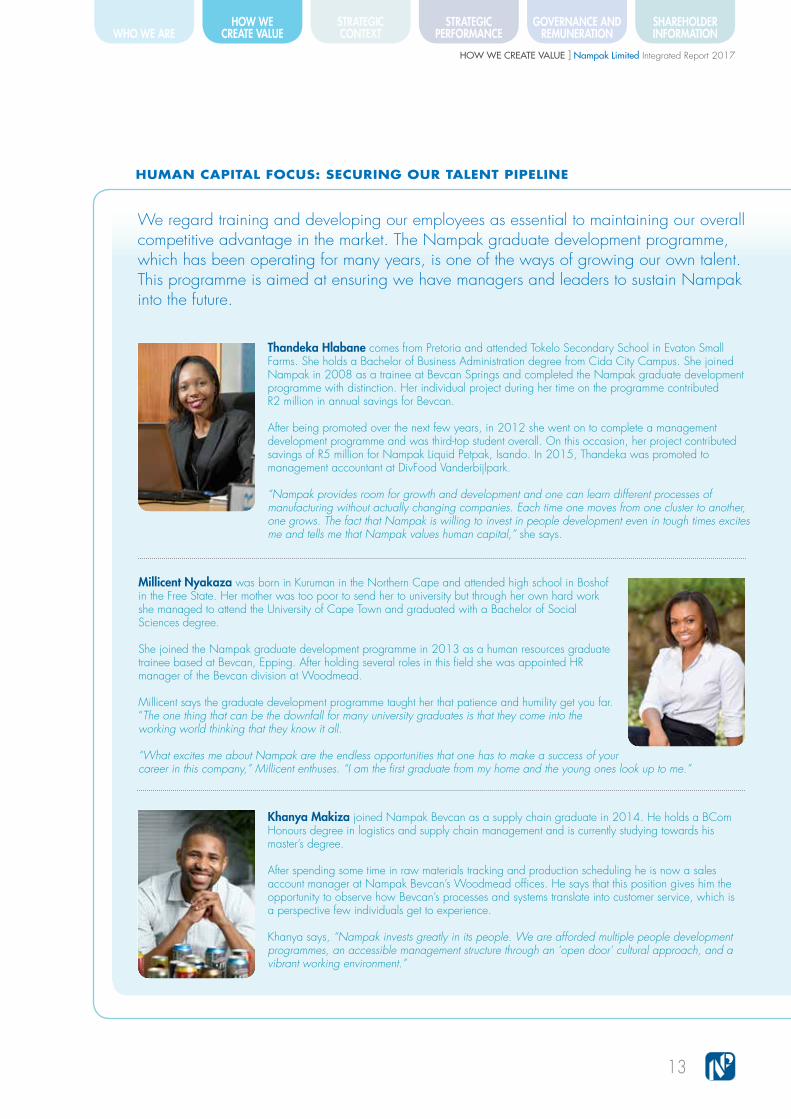
Intellectual capital Innovation in the design and functionality of packaging is an important competitive advantage. Our R&D facility in Cape Town is staffed by highly qualified scientists, engineers and technicians who assist in ensuring that Nampak provides customers with world-class packaging solutions. This facility has been in operation for over 70 years and is unique in Africa. Our brand, promising “Nampak Packaging Excellence”, provides customers with the confidence that they will receive the desired level of quality and service. Our operations excellence initiative and ongoing investment in modern technology ensures that we adapt to the changing needs of the market.
Trade-offs in our use of intellectual capitalOur investment in intellectual capital reduces our financial capital in the short term but increases our human, manufactured, financial, social and relationship and natural capitals in the longer term.
HOW WE ACHIEVED THESE OUTCOMES » Trialled, evaluated and approved new tinplate raw materials » Evaluated new generation BPA-NI coatings for food and beverage cans » Reduced raw material requirements for plastic bottles by up to 10% » Assisted customers with advice on how best to package their products » Continued to provide bursaries to develop our intellectual capacity » Followed an established programme methodology for restructure of IT infrastructure
» Tested new IT solutions thoroughly
» Delivery of robust operating, financial and human resource practices » Manufacture of more convenient products with improved performance » More consistent and stable production in our metals operations » Reduction in the amount of edge trimming of tinplate coil » Appropriate coating technology to comply with EU legislation » Better customer relationships » Light-weighting of plastic packaging and down-gauging on metal substrates used in can making
» A new, reliable computing storage IT infrastructure » New configured servers, new disaster recovery facility » Updated business intelligence platform
OUTCOMES
» Experience, skills, competencies of all our employees established over numerous years
» At least 23 scientists, two engineers, 10 technologists, three technicians and four business information researchers at our R&D facility
» An R&D budget of R44 million » Our operational excellence initiative, other business processes and management systems
» Technical association and agreements with several global packaging companies » A programme to restructure our central IT infrastructure
KEY INPUTS
How we create value using the six capitalscontinued
Nampak Limited Integrated Report 2017
18

Nampak R&D is key to our competitive advantage. Over 70 years, it has provided Nampak and our customers with scientific and technical expertise in the development, production and use of world-class packaging. In 2017, we looked to take better advantage of this key strategic capability, particularly regarding the assessment of new raw materials and achieving process enhancements. We worked to better integrate R&D’s capability within the business, and increase its interface with Nampak businesses in the Rest of Africa.
OUR 2017 HIGHLIGHTSIn Metals, we trialled, evaluated and approved new tinplate grade materials that have improved ageing characteristics thanks to changes made to the chemical composition of the alloy. This enabled the manufacturing sites of DivFood and the Rest of Africa general metal packaging business to achieve more consistent and stable production, even when the metal aged.
By working closely with our local and international suppliers, we were able to reduce the edge trimming of tinplate coil. This resulted in less waste by our suppliers and hence lower input costs for Nampak.
For the production of metal paint pails, we identified, trialled and evaluated the use of soft ultra-low carbon steel. This very flexible steel, which we adopted, allowed us to follow a more consistent manufacturing process when producing paint pails.
For Bevcan in South Africa, Angola and Nigeria, we trialled and qualified three new international aluminium can body stock suppliers. This was to mitigate the risk of dependence on limited suppliers and ensure a continuous supply of raw materials should there ever be a delay in supply from one supplier. Driven to mitigate this risk, we also started qualifying additional suppliers of pre-coated can end stock.
We continued our work carried out over many years on BPA-NI (Bisphenol-A not intentionally added) internal lacquers. We focused on ensuring that Nampak has the appropriate coating technology available to comply with upcoming EU legislation, particularly for those customers who export their canned products to Europe. Working closely with international coating suppliers, we trialled numerous new BPA-NI coatings for use in aluminium beverage cans and tinplate food cans, undertaking pack tests to determine which coatings are most suitable to package various different foods. This is to mitigate the risk related to not being able to retain customers.
We continued to target process improvements, including work on optimising our coating equipment. One such project involves endeavouring to increase the speed of our manufacturing line and so increase our capacity. By sending more coated sheets through the oven at the same time, we would require less energy while still delivering a functional coated sheet.
In Plastics, in the year we continued to reduce incrementally our usage of raw materials for various packaging formats while ensuring that the new designs and lighter containers continue to perform satisfactorily. In recent years we have reduced the weight of the 2 litre HDPE milk bottle from 42g to 38g. We continue to work on other lightweighting projects for bottles and crates.
In addition to facilitating the manufacture of crates made of 100% recycled material and those made of 100% virgin material, we introduced an option of using 60% recycled and 40% virgin material. Crates made of 100% virgin material are stronger than those made of 100% recycled material. The new option gives a blend of recycled and virgin material with almost the same strength as virgin crates, but at a lower cost. It also gives our businesses in the Rest of Africa flexibility to produce crates when supplies of raw materials are insufficient to make 100% virgin crates. In the year we also reduced the weight of a bread crate made of recycled material from 1 320g to 1 300g with the help of finite element analysis. Subsequent testing showed that the new lighter design had an improved top load strength.
INTELLECTUAL CAPITAL FOCUS: R&D – CENTRAL TO OUR STRATEGIC DELIVERY
HOW WE CREATE VALUE ] Nampak Limited Integrated Report 2017
19
HOW WE CREATE VALUE
STRATEGIC CONTEXT
STRATEGIC PERFORMANCE
GOVERNANCE AND REMUNERATION
SHAREHOLDER INFORMATIONWHO WE ARE

Social and relationship capital Our business activities impact many aspects of society and our relationships with our employees, investors, suppliers, customers, industry and government are important for our success. Helping uplift the communities in which we operate is fundamental to our business sustainability. Building partnerships with trade unions and engaging in other structured forums assists us in effectively managing the risks associated with industrial action.
Trade-offs in our use of social and relationship capitalOur ongoing investment in social and relationship capital reduces our financial capital in the short term, but as it helps create a stronger environment for operations and investments, over the long term it has a positive impact on our financial capital.
Our support of enterprise development supports the stocks of intellectual, manufactured and financial capital.
HOW WE ACHIEVED THESE OUTCOMES » Initiated work on our B-BBEE efforts including a new ownership scheme » Refreshed our values, updated our code of ethics » Held joint consultative discussions with all trade unions » Extended our participation with industry partners on waste management and recycling initiatives
» Provided comment to government on proposed waste management legislation » Informed investors on performance and strategy progress » Funded upgrades to our partner schools; offered teachers opportunities to enhance their skills
» Supported various enterprise development initiatives
» Strong employee relations, positive relationships with trade unions » Constructive engagements with government and tax authorities » Solid partnerships with our customers and suppliers » The confidence of our shareholders » The trust of the communities in which we operate » A well-established schools’ partnering programme, with a Nampak champion appointed for each of the seven schools
KEY INPUTS
OUTCOMES2017 2016
Taxes paid to governments R million 1 251.3 889.7Long-term agreements with key customers ü ü
Economic value added R billion 5.60 6.73Corporate social investment R million 9.7 8.5B-BBEE contributor status Level 6 3Strike action None NoneBlack management % 58 55
How we create value using the six capitalscontinued
Nampak Limited Integrated Report 2017
20

We considered the following to be the key issues of each of our stakeholder groups in 2017. The icons show the links to our material issues.
THE KEY RELATIONSHIPS ON WHICH WE RELY TO CREATE VALUE
SHAREHOLDERS AND OTHER FUNDERS
Key issues» Changing competitive environment» Repatriation of funds from Angola and Nigeria» Cash generation» Resumption of dividend payments» Nampak’s B-BBEE contributor status
Our actions» Focused on operations excellence to improve competitiveness, rationalised product offering» Secured US$79 million cash repatriation from Nigeria and US$48 million from Angola» Implemented tighter financial disciplines on working capital and capex» Appointed group corporate finance and treasury manager» Improved hedging of cash balances in Angola from 61% to 89%
EMPLOYEES
Key issues » Safety in the workplace » Drive for high-performance culture requiring shift in skills and
attitude » Impact of cost-reduction initiatives on job security » Performance management
Our actions » Continued focus on workplace safety; reduced LTIFR to 0.41 from 0.48 in 2016
and 0.89 in 2015 » 129 employees completed various training programmes across all levels » Engaged with employees affected by line closure to minimise retrenchments
TRADE UNIONS
Key issues » Establishment of Nampak Enterprise Bargaining Forum » Conclusion of strike-free wage negotiations » Wage demands higher than inflation » Partnership and cooperation
Our actions » Established Nampak Enterprise Bargaining Forum in consultation with unions » Concluded successful wage negotiations in all divisions » Agreed wage increases marginally ahead of inflation over three years » Strengthened our partnerships with labour
CUSTOMERS
Key issues » Retaining key customers » Changes to the purchasing strategies of large customers
in the Rest of Africa » Ensuring constructive customer relationships » Offering quality and innovation » Rationalising product offering (SKUs)
Our actions » Concluded supply contracts with major customers » Formalised plans to rationalise our paper facilities in southern and east Africa » Engaged with customers to ensure that we understand their needs » Provided quality products in full on time » Assured customers that any reduction in SKUs would be managed responsibly
SUPPLIERS
Key issues » Benefits of “buy better” initiative » B-BBEE procurement targets » Consistent supply of quality raw materials
Our actions » Centralised procurement to generate savings » Negotiated long-term contracts for the supply of essential raw materials » Secured by way of contract all glass raw materials » Increased purchases from accredited B-BBEE suppliers
INDUSTRY BODIES
Key issues » Waste management; impact of post-consumer packaging » Proposed new taxes on sugar-sweetened beverages and
carbon emissions » Weak manufacturing activity in South Africa
Our actions » Engaged with forums on waste management plans » Provided submissions to government on policy changes » Participated in the Manufacturing Circle’s Map to a Million new jobs initiative
GOVERNMENT AND REGULATORS
Key issues » Good governance and compliance » Sound relations with local authorities » Liquidity issues in Angola, Nigeria and Zimbabwe » Plastic bottle deposit in the UK » Proposed taxes on carbon emissions and sugar-sweetened
beverages
Our actions » Upheld comprehensive governance policies and practices; complied with JSE Listings
Requirements and revenue authorities » Engaged constructively with municipalities » Maintained close contact with banking sectors in Angola and Nigeria » Continued engagement with government on potential negative impact of proposed taxes » Engaged authorities on proposed health promotion levy (sugar tax)
CIVIL SOCIETY
Key issues » Supporting the communities in which we operate » Contributing to secondary and tertiary education » Our long-term initiative of providing environmental education
Our actions » Contributed R9.7 million to social investment » Extended our support to partnered schools for 15th year; provided bursaries » Renewed support for eco-schools initiative
HOW WE CREATE VALUE ] Nampak Limited Integrated Report 2017
21
HOW WE CREATE VALUE
STRATEGIC CONTEXT
STRATEGIC PERFORMANCE
GOVERNANCE AND REMUNERATION
SHAREHOLDER INFORMATIONWHO WE ARE

We apply our resources and technology to convert natural capital into value across all the other capitals. Reliable supplies of water, energy, land and air are critical to the success of our business. We also depend on a consistent supply of limestone, silica sand and soda ash for the manufacture of glass packaging.
We strive to reduce the impact of post-consumer packaging waste on landfills and are committed to encouraging recycling and further reducing the weight of our packaging products. We adhere to well-defined environmental and producer responsibility standards.
Trade-offs in the use of our natural capitalOur use of non-renewable resources such as limestone, silica sand and soda ash, as well as our emissions and wastes, negatively impacts natural capital. But by converting natural capital into value-added products, we boost the stocks of all the other capitals. The use of cullet in our glass business and closed-loop raw material systems in our plastics operations positively impacts natural capital. We continue to explore other ways of limiting our impact on the natural environment.
KEY INPUTS2017 2016
Water consumption Mega litres 1 431 1 652Land area used Square metres 991 700 980 373Energy use Gigajoules 4 376 599 4 555 381Electricity purchased Megawatt hours 389 070 424 161Limestone Tonnes 32 700 36 600Silica sand Tonnes 133 965 133 139Soda ash Tonnes 36 027 39 312
OUTCOMES2017 2016
Emissions (scope 1 and 2) tCO2e/Rm revenue 26.62 28.67
Energy intensity (scope 1 and 2) % tCO2e fromelectricity 66 66
Cullet usage % 54 47
Post-consumer recycling rates in South Africa* 2016 2015Metal collection % 73 70Glass cullet collection % 42 41Plastic packaging collection % 45 46CDP climate change score A – A –
* Recycling Association’s reporting periods.
HOW WE ACHIEVED THESE OUTPUTS AND OUTCOMES » Continued to promote recycling initiatives – all Nampak products are recyclable » Installed gas line at our Glass operation » Submitted preliminary carbon budget to South African government » Utilised borehole water at our Zambian operations in Lusaka and Ndola and at Agbara in Nigeria
» Participated in establishing MetPac-SA which will promote the recycling of metal packaging
» Secured, by way of contract, the supply of all raw materials to Glass » Unpredictable power supply, with volatility of voltage, to Glass disrupted operations
OUTPUTSTotal greenhouse gas emissions (scope 1 and 2) of 538 980.98 tonnes versus 548 650.95 tonnes in 2016.
Natural capital
How we create value using the six capitalscontinued
Nampak Limited Integrated Report 2017
22

Recycling of post-consumer packaging waste is one of the initiatives we use to make a positive contribution to the environment in which we operate. Many of these initiatives are done in conjunction with other packaging companies and industry bodies.
We hold a 25% share of the glass packaging market in South Africa and through our association with The Glass Recycling Company we have contributed to increasing the recycling rate of glass from 18% 10 years ago to 41% in the 2016 calendar year. During this time, 50 000 income opportunities and 263 entrepreneurs were created. Our usage of cullet, or waste glass, in 2017 was 63 000 tonnes and represented 54% of the final production.
In 2016, 1.144 million tonnes of post-consumer recyclables were available in the waste stream and 47% of plastics packaging was collected for recycling, 6% more than in 2015. This is equivalent to 374 million 2 litre milk bottles. South Africa mechanically recycled 309 520 tonnes of plastic in 2016, an increase of 6% from 2015. A total of 329 099 tonnes of plastic were diverted from landfill in 2016; 6% more than 2015.
Plastics industry recycling rate (%)
45
40
35
30
25
2012 2013 2014 2015 2016
We are committed to ensuring that Nampak is an environmentally responsible company and believe that integrated actions that we take within our operations to conserve natural resources and protect the environment make sound business sense.
Collect-a-Can was established as a joint venture over 20 years ago to collect used beverage cans and during this time it has increased the collection rate to 72%, which is one of the highest in the world. In 2017 we participated in the establishment of MetPac-SA to promote recycling of other metal packaging.
Southern Africa: beverage can recovery rate (%)
0403020100999897969594 1514131211100908070605
80
70
60
50
40
30
20
10
Glass industry recycling rate* (%)
1615141312111019080706
45
40
35
30
25
20
15
Before The Glass Recycling Co.Since The Glass Recycling Co. * Glass recycling rate for all glass packaging (includes food and beverages).
NATURAL CAPITAL FOCUS: RECYCLE, RECYCLE, RECYCLE
HOW WE CREATE VALUE ] Nampak Limited Integrated Report 2017
23
HOW WE CREATE VALUE
STRATEGIC CONTEXT
STRATEGIC PERFORMANCE
GOVERNANCE AND REMUNERATION
SHAREHOLDER INFORMATIONWHO WE ARE

Our strategy – performance and plans
Nampak’s strategy is our plan to get the best out of our business over the near to medium term, and in so doing deliver value to all our stakeholders through our advanced manufacturing offering. We measure progress against our strategy through the key
STRATEGIC OBJECTIVE HOW WE WILL ACHIEVE THIS HOW WE DID IN 2017
HOW WE RATE OUR
PERFORMANCE WHAT WE WILL DO NEXT
Actively manage our portfolio » Closed Bevcan Durban tinplate line » Closed small crown line in Ndola, Zambia » Launched five-year derisking plan to address unfunded UK pension
fund liability » Impaired R321 million of goodwill and R114 million of intangibles
at Glass, R112 million related to Nampak Plastics Europe in-plant
» Rationalise Paper, Plastic and Metals production facilities in southern and east Africa
» Engage with UK pensioners to find acceptable solutions under strict guardianship of trustees
Manage costs stringently » Reduced head office costs by R57 million » Reduced supply chain costs by approximately R100 million » Commissioned dedicated gas transmission line to Glass factory gate » Reduced DivFood headcount by 50 » Established capital assurance committee to oversee capex » Cut finance costs by 19% through reduction in interest-bearing debt
» Consolidate the Isando and Industria Plastics Liquid Packaging facilities » Extract value and savings on total cost of ownership » Focus on operations excellence to drive efficiencies » Ensure below inflation cash fixed cost increases » Continue to tightly control our capital investment programme
Manage working capital prudently » Reduced working capital days, reached optimal inventory holdings » Introduced a new sales and operations planning system at DivFood
» Secure reductions in working capital » Maintain optimal inventory holdings » Further streamline procurement processes » Increase working capital velocity
Improve business performance by buying, making and selling better
» Simplified Glass’s manufacturing footprint » Reduced spoilage, reported world-class safety performance at Bevcan » Grew Glass’s market share in wine sector » Diversified our Plastics product portfolio » Focused on further improving safety, delivered LTIFR of 0.41 » Continued to rationalise DivFood’s product offering and customer base
» Introduce new technical skills and greater management oversight at Glass to improve operation of our furnaces
» Continue to embed systems and processes to improve Plastics business effectiveness
» Further rationalise underutilised Bevcan assets » Leverage Nampak R&D capabilities to grow product and customer base
in Plastics » Optimise contribution margins and continue SKU rationalisation » Drive sales excellence for margin expansion, driven by data
Invest to compete » Commissioned new bottle inspection equipment at Glass » Invested in multi-deck printer for DivFood Mobeni and upgraded
large-format can assembly plant, Paarl » Marked first full year of production of new Bevcan ends plant » Entered joint venture in Botswana to make can ends; acquired
two can-assembly lines for Paarl and Nigeria
» Convert Angola tinplate beverage can line to aluminium at cost of US$13 million using kwanza/US dollar swap
» Recapitalise Plastics crate business and a key customer in-plant for liquids » Launch second phase of DivFood recapitalisation » Ensure return on capital invested at benchmark rates
Grow through greenfield investment and acquisitions in Glass, Metals and Plastics
» Put this strategic imperative on hold, pending improvement in macro-economic conditions
» Continue to explore feasibility of opportunities, but be judicious in our investments and risks
» Consider further rigid plastic investments in Zambia and Zimbabwe » Extend Nigerian closure business
Grow at a reasonable and sustainable return
» Increased Bevcan Angola’s profitability » Grew Bevcan Nigeria’s market share
» Pursue market development and business rationalisation initiatives in Kenya » Growth at hurdle rate
Partner with major multinational customers
» Increased Bevcan Nigeria sales » Reported robust demand for Nigerian plastic closures from
multinational customers
» Continue to leverage strong relationships with multinationals » Closely monitor changes in the purchasing strategies of multinationals » Extend technology partnerships to sustain market positions
Sensibly manage and grow our presence in current jurisdictions
» Leveraged import replacement opportunities in Zimbabwe and Nigeria
» Drive exports in select markets where margins are attractive
UNLOCK
FURTHER
VALUE
FROM
BASE
BUSINESS
ACCELERATE
GROWTH
IN THE REST
OF AFRICA
Nampak Limited Integrated Report 2017
24

performance indicators (KPIs) of our group executive committee, details of which are in the remuneration report on page 87 .
KEY PERFORMANCE INDICATORS
Among the most important KPIs in 2017 were:
Performance against KPIs determines a component of executives’ annual STI
Good progress made Some progress, more to come Disappointing performance
» Improve safety performance
» Focus on integrity and ethics management
» Deleverage balance sheet
» Manage liquidity
» Manage inventory
» Implement DivFood plan
» Reduce Bevcan spoilage; ensure solid project execution and minimise impacts of competitor activity
» Effect Glass operating efficiency improvements and business turnaround
» Achieve Plastics operational excellence targets, business turnaround and new customers
» Ensure world-class project execution
» Secure operational excellence
» Maintain project pipeline in Rest of Africa
» Establish functional Nampak Enterprise Bargaining Forum
» Enhance energy and water efficiency
These will remain the most important KPIs in 2018, along with:
LINK TO REMUNERATION
STRATEGIC OBJECTIVE HOW WE WILL ACHIEVE THIS HOW WE DID IN 2017
HOW WE RATE OUR
PERFORMANCE WHAT WE WILL DO NEXT
Actively manage our portfolio » Closed Bevcan Durban tinplate line » Closed small crown line in Ndola, Zambia » Launched five-year derisking plan to address unfunded UK pension
fund liability » Impaired R321 million of goodwill and R114 million of intangibles
at Glass, R112 million related to Nampak Plastics Europe in-plant
» Rationalise Paper, Plastic and Metals production facilities in southern and east Africa
» Engage with UK pensioners to find acceptable solutions under strict guardianship of trustees
Manage costs stringently » Reduced head office costs by R57 million » Reduced supply chain costs by approximately R100 million » Commissioned dedicated gas transmission line to Glass factory gate » Reduced DivFood headcount by 50 » Established capital assurance committee to oversee capex » Cut finance costs by 19% through reduction in interest-bearing debt
» Consolidate the Isando and Industria Plastics Liquid Packaging facilities » Extract value and savings on total cost of ownership » Focus on operations excellence to drive efficiencies » Ensure below inflation cash fixed cost increases » Continue to tightly control our capital investment programme
Manage working capital prudently » Reduced working capital days, reached optimal inventory holdings » Introduced a new sales and operations planning system at DivFood
» Secure reductions in working capital » Maintain optimal inventory holdings » Further streamline procurement processes » Increase working capital velocity
Improve business performance by buying, making and selling better
» Simplified Glass’s manufacturing footprint » Reduced spoilage, reported world-class safety performance at Bevcan » Grew Glass’s market share in wine sector » Diversified our Plastics product portfolio » Focused on further improving safety, delivered LTIFR of 0.41 » Continued to rationalise DivFood’s product offering and customer base
» Introduce new technical skills and greater management oversight at Glass to improve operation of our furnaces
» Continue to embed systems and processes to improve Plastics business effectiveness
» Further rationalise underutilised Bevcan assets » Leverage Nampak R&D capabilities to grow product and customer base
in Plastics » Optimise contribution margins and continue SKU rationalisation » Drive sales excellence for margin expansion, driven by data
Invest to compete » Commissioned new bottle inspection equipment at Glass » Invested in multi-deck printer for DivFood Mobeni and upgraded
large-format can assembly plant, Paarl » Marked first full year of production of new Bevcan ends plant » Entered joint venture in Botswana to make can ends; acquired
two can-assembly lines for Paarl and Nigeria
» Convert Angola tinplate beverage can line to aluminium at cost of US$13 million using kwanza/US dollar swap
» Recapitalise Plastics crate business and a key customer in-plant for liquids » Launch second phase of DivFood recapitalisation » Ensure return on capital invested at benchmark rates
Grow through greenfield investment and acquisitions in Glass, Metals and Plastics
» Put this strategic imperative on hold, pending improvement in macro-economic conditions
» Continue to explore feasibility of opportunities, but be judicious in our investments and risks
» Consider further rigid plastic investments in Zambia and Zimbabwe » Extend Nigerian closure business
Grow at a reasonable and sustainable return
» Increased Bevcan Angola’s profitability » Grew Bevcan Nigeria’s market share
» Pursue market development and business rationalisation initiatives in Kenya » Growth at hurdle rate
Partner with major multinational customers
» Increased Bevcan Nigeria sales » Reported robust demand for Nigerian plastic closures from
multinational customers
» Continue to leverage strong relationships with multinationals » Closely monitor changes in the purchasing strategies of multinationals » Extend technology partnerships to sustain market positions
Sensibly manage and grow our presence in current jurisdictions
» Leveraged import replacement opportunities in Zimbabwe and Nigeria
» Drive exports in select markets where margins are attractive
» Improve information management focus
» Reinvigorate maintenance policy and practice
» Carry out group restructuring project to improve operating effectiveness using external benchmarks
» Continue to review and engage with stakeholders to manage exposure to legacy defined benefit liabilities
STRATEGIC CONTEXT ] Nampak Limited Integrated Report 2017
25
HOW WE CREATE VALUE
STRATEGIC CONTEXT
STRATEGIC PERFORMANCE
GOVERNANCE AND REMUNERATION
SHAREHOLDER INFORMATIONWHO WE ARE

Chief executive’s report
UNLOCKING OPERATING LEVERAGE “Advanced manufacturing”, the theme of this year’s integrated report, appropriately sums up what we at Nampak are driven to deliver. In 2017, we extended the progress made in recent years to use new technologies, processes and management methods to improve our overall performance in the manufacture of packaging products.
In so doing, we advanced delivery of the group’s strategy, which is to extract operating leverage from our recently modernised assets over the near to medium term. We are determined to maximise total shareholder return by producing sustainable profitability which creates value for all stakeholders. To understand exactly what this means to Nampak, please see page 4 .
In the past six years we have invested R9.2 billion in state-of-the-art water and power-efficient machinery and facilities, including new high-speed beverage and food can lines, upgraded plastics equipment and a new glass furnace. Now, the challenge is to make the equipment work harder and deliver value to shareholders from the investments we have made.
Our South African beverage can business, Bevcan, achieved just that in the year. After launching a comprehensive operations excellence initiative in 2016, in 2017 it reported a truly world-class safety performance of 0.11, a substantial improvement in production, reduced spoilage and a significant increase in profitability. This underlines the value of operations excellence, and we see room for further operational improvements in the year ahead.
Apart from efficiencies and safety, the operations excellence initiative across the group also targets improvements in people development, supply chain management, planning, forecasting, and in branding and marketing. This new way of working, facilitated by our investment in new systems and processes, will in turn enhance our competitiveness in an environment of growing competition.
Safety remains our highest priority and as such is a key performance metric for executive remuneration. It is an excellent proxy for operational performance and the trend in recent years is most encouraging. In 2017, we reported a lost-time injury frequency rate (LTIFR) of 0.41, bettering our performance of 0.48 in 2016 and 0.89 in 2015, but just shy of our tolerance level for 2017 of 0.40. We are committed to even stronger outcomes in the years ahead.
Indicative of our steadily improving operational performance in 2017 was our ability to maintain our trading margin of 10.4% (2016: 10.0%) and trading profit under challenging macro-economic circumstances. Our continuing effort to reduce our cost base also yielded pleasing results. We have further cut head office costs by an additional R57 million and reduced supply chain costs by R100 million, in addition to savings previously banked of R126 million. This enabled us to remain competitive in the face of new entrants, pressure which has been exacerbated by decreased demand in the market.
Headline earnings per share rose 15% but the board considered it prudent to hold off on the resumption of dividends to shareholders, in particular having regard to demonstrating the sustainability of cash repatriation from Nigeria, Angola and Zimbabwe, as well as the operating challenges of our Glass business.
CFO Glenn Fullerton details Nampak’s financial performance in his report on page 38 , in which he also points to the strength of the balance sheet, the reduction in finance costs and the group’s rigorous management of capital expenditure.
SIMPLIFYING OUR BUSINESS TO SUPPORT STRONGER OPERATIONSThe challenging macro-economic environment in our key markets, which remained a material issue for the group in the year (see page 30 ), meant demand for many of the products for which DivFood produces packaging was constrained, dampening revenue and profitability. A very poor fish catch meant reduced demand for cans for this category. Despite this, thanks to the decisive measures taken since 2014 to simplify the business, it reported a stronger operational performance.
Our South African Plastics business continued to catch up with a backlog of maintenance and capital expenditure required to strengthen operations. Nampak Plastics Europe had a tough year; however, new leadership was able to drive improvements in operational performance, which are expected to result in improved financial performance in 2018. By consolidating our footprint, standardising our processes, procedures and systems, eliminating waste, renewing equipment, focusing on energy efficiency and diversifying our product and customer base, we will make our Plastics business sustainably profitable.
Nampak Limited Integrated Report 2017
26

Our unrelenting focus on operational excellence will ensure that we are better able to make every can, bottle, carton, crate, tube and closure profitably.
After a good operational performance in 2016, Glass had a disappointing second half of 2017 caused by unpredictable and erratic power supply following the failure of a major transformer on the electricity grid. Excellence in manufacturing cannot be built if the right infrastructure is lacking – this includes a reliable supply of power and water, and well-maintained roads and ports. While Glass’s performance was exacerbated by the electricity issues, we acknowledge that there are things we need to do better. We recently introduced management changes to allow for a more focused effort to turn Glass around. We are also investing in new technical skills.
Our businesses in the Rest of Africa had a mixed year. Bevcan recorded increased profitability in Angola and grew market share in Nigeria. Easing of currency restrictions in Nigeria led to improved liquidity and cash repatriation from that market; however, in Angola we continued to face difficulties in repatriating cash. Our general metal packaging business in the Rest of Africa delivered better revenue and trading profit, lifted by a strong performance in Nigeria. A very strong performance from our Zimbabwe business supported our otherwise weak Paper business. Dependence on foreign exchange liquidity, one of the group’s top risks, had a significant impact on our Rest of Africa businesses in the year.
ADVANCED MANUFACTURING
STRATEGIC CONTEXT ] Nampak Limited Integrated Report 2017
27
HOW WE CREATE VALUE
STRATEGIC CONTEXT
STRATEGIC PERFORMANCE
GOVERNANCE AND REMUNERATION
SHAREHOLDER INFORMATIONWHO WE ARE

Our strategic performance table on pages 24 and 25 shows the progress made to deliver on our strategy in 2017, and also the initiatives we have in place to ensure stronger delivery in the year ahead. While our strategic objective to accelerate growth in the Rest of Africa is largely on hold for now because of the negative impact on liquidity of the commodity slowdown, we still believe in the African growth story. While we plan to rationalise some businesses in southern and east Africa in the year ahead, we remain mindful of the need to retain our first-mover advantage in many markets.
LOOKING AHEADAs a company significantly exposed to the consumer market, the 27.7% unemployment rate and the fact that more than half of all South Africans are living below the poverty line is a cause for considerable concern. The catalyst required to unlock consumer demand is confidence among investors and consumers, which in turn depends to a large extent on improved certainty in the political environment.
In the year ahead, we will continue to concentrate on those factors within our control. Our unrelenting focus on operational excellence will ensure that we are better able to make every can, bottle, carton, crate, tube and closure profitably. To this end, we will extend our work to unlock operating leverage and streamline our cost structure.
Our approach to capex will remain judicious, and we forecast spending of between R1.0 billion and R1.2 billion, from R735 million in 2017. Among our most significant capital projects in the year ahead will be the US$13 million first phase conversion of our tinplate beverage line in Angola to aluminium funded by a kwanza/US dollar swap.
Correcting the poor operational performance of Glass, and that of Nampak Plastics Europe are special areas of focus for 2018. I am counting on the continued dedication and hard work of Nampak people everywhere to ensure that ours is an advanced manufacturing offering, and thank them for their notable contribution in 2017.
André de RuyterChief executive officer
Bryanston28 November 2017
Chief executive’s report continued
Nampak Limited Integrated Report 2017
28

Material issues are those with the potential to significantly affect our ability to deliver on our strategy, to create sustainable value for the group in the short, medium and long term. The most noticeable impact of these issues in the short term is on the group’s share price, which lost more than 9% of its value in 2017.
We prioritise them by
assessing:
We respond to them by:
We identify them by
reviewing:
We report on them:
We continuously
monitor them:
MANAGING MATERIAL ISSUES
» Information at divisional board and group executive committee meetings
» Industry developments and the group’s risks and opportunities
» Economic research
» Stakeholder engagements
» Applicable policies and regulations
» Relevant media coverage
» Input from key management
» Potential impact
» Our risk and reward metrics
» Evaluating the effect on our risk tolerance and risk appetite
» Putting in place management actions to mitigate against negative outcomes
» Considering the trade-offs between the capitals
» At regular board and sub-committee meetings
» To shareholders in formal reporting sessions
» To employees and unions through structured channels
» Through industry bodies
» Against internal and published performance targets
» Against competitor activities
» In consultation with our stakeholders
Material issues
In 2017, we considered that the five material issues identified in 2016 remained relevant:IDENTIFYING MATERIAL ISSUES
Liquidity restrictions and the exposure of
restricted cash to currency volatility
People – safety, skills and
transformation
Uncertain regulatory and
policy environment
Challengingmacro-economic
environment
Our operational and financial performance
STRATEGIC CONTEXT ] Nampak Limited Integrated Report 2017
29
HOW WE CREATE VALUE
STRATEGIC CONTEXT
STRATEGIC PERFORMANCE
GOVERNANCE AND REMUNERATION
SHAREHOLDER INFORMATIONWHO WE ARE

MATERIAL ISSUE IMPLICATIONS FOR VALUE OUR STRATEGIC RESPONSE IN 2017
OUR OPERATIONAL AND FINANCIAL PERFORMANCE
Bevcan South Africa reported a strong overall performance, with efficiency gains, a reduction in spoilage levels and a world-class safety record. DivFood completed its equipment modernisation programme but reported lower revenue and profitability in the second half amidst tough SA market conditions. Glass experienced operational challenges in the second half, aggravated by electricity supply problems. Plastics in South Africa and the UK lost customers to backward integration. Paper reported pressure on revenue and lower trading profits.
Trading pro�t (R million)
2013 2014 2015 2016 2017
2 000
1 500
1 000
500
» Impaired goodwill of R321 million and intangibles of R114 million at Glass and impaired in-plant at Nampak Plastics Europe of R112 million which adversely impacted on earnings per share and the group effective tax rate but were excluded from headline earnings per share
» Continued to focus on interventions to improve operational efficiencies
» Freed up executive management’s time to focus exclusively on Glass
» Appointed new management at Nampak Plastics Europe
» Devoted considerable attention to addressing our defined benefit liabilities
» Formalised plans to consolidate two large liquid packaging sites in Gauteng
» Maintained a strengthened balance sheet
LIQUIDITY RESTRICTIONS AND THE EXPOSURE OF RESTRICTED CASH TO CURRENCY VOLATILITY
After a steep fall between mid-2014 and early 2016, oil prices recovered slightly. Crude exporters Angola and Nigeria continued to suffer low export earnings, declines in their currencies and shortages of forex. The naira depreciated 14% against the US dollar but forex liquidity improved significantly with the launch of the NAFEX market. The functional currency for Bevcan in Angola and Nigeria is the US dollar, and that for our paper and metals businesses in Nigeria is the naira. In our accounts, when translating from functional currency to reporting currency, all movements in monetary items are made through the profit and loss account.
NAFEX brings US dollar liquidity to Nigeria
April 15■ Interbank rate ■ CBN of�cial rate
April 16 April 17 Nov 2017
550
500
450
400
350
300
250
200
150
100
■ Parallel ■ NAFEX ■ Government budget
» Experienced losses from the currency devaluation on translation in Nigeria, resulting in losses of R160 million compared to R507 million in 2016. The loss of R174 million in Angola in 2016 was not repeated in 2017
» Substantially increased our cash repatriation from Nigeria after the launch of NAFEX with US$79 million being repatriated
» Inconsistent availability of forex led to supply chain disruptions in Nigeria and Ethiopia; hampered Zimbabwe operational performance
» Limited our ability to settle intergroup loans and creditors » Cash balances in Angola, Nigeria and Zimbabwe increased from
R2.3 billion to R3.7 billion
» Increased hedging of Angolan exposures » Continued to link Bevcan Nigeria product pricing
to dollar » Secured cash repatriation of US$127 million from
Angola and Nigeria
CHALLENGING MACRO-ECONOMIC ENVIRONMENT
Across our markets, economies were weak as commodity prices remained soft and political uncertainty dented confidence. In South Africa, poverty and unemployment increased, hurting consumer spending, and confidence waned. The country’s sovereign credit rating was downgraded to sub-investment status. There were some tentative signs of recovery in Nigeria, which, like South Africa, emerged from recession in the second quarter. Consolidation of both the competitive and customer landscape continued.
SA and Nigeria GDP growth (%)
2014 2015 2016 2017■ SA ■ Nigeria
876543210
(1)(2)(3)
» Decline in demand for packaging products as consumers trade down to value brands and products and consume less
» Decline in revenue, pressure on earnings » Limited potential for organic growth as well as opportunities for new
investments
» Intensified our efforts to improve overall performance with operational excellence approach
» Took steps to address fixed costs throughout our business
» Further reduced gearing to lessen the impact of the sovereign downgrade
» Planned to rationalise some Rest of Africa operations, mindful of the need not to lose our first-mover advantage
PEOPLE – SAFETY, SKILLS AND TRANSFORMATION
Ensuring the safety of our people and that of our contractors is critical. Tragically, on 1 October 2016 a logistics contractor at our Glass facility died in a fork-lift truck accident. Our overall safety performance improved, nearing our tolerance level. We continued to face a shortage of skills. The fall in Nampak’s share price had implications for our ability to retain key talent. Under the new codes, our B-BBEE contributor status fell to level 6 from level 3.
■ Actual ■ Tolerance
Lost-time injury frequency rate over a �ve-year period
2013 2014 2015 2016 2017
1.5
1.0
0.5
0
» Unsafe operations harm people, the environment, quality and our reputation » Insufficient skills may impact our ability to meet customer requirements, harm
operational effectiveness and our ability to deliver on strategy, with the potential to affect revenue, profitability, investor returns and tax payable to authorities
» Poor B-BBEE rating could impact the revenue of South African operations » Without transformation to a more equal society, the sustainability of the
South African market is at risk
» Continued to prioritise safety across the group » Injected new talent as opportunities arose » Provided external managerial training aligned with
Nampak skills imperatives » Set up a B-BBEE steering committee to initiate our
efforts; commenced work on a new B-BBEE ownership scheme
UNCERTAIN REGULATORY AND POLICY ENVIRONMENT
South Africa has a multitude of existing and planned legislative requirements, directly affecting Nampak or our customers. The increased regulatory load includes implications of the National Pricing Strategy for Waste Management Charges; the requirement to prepare and submit for government approval waste management plans; the planned tax on carbon emissions and the proposed tax on sugar-sweetened beverages. In other parts of Africa, significant levels of red tape, port and logistics inefficiencies hamper the importation of raw materials.
■ Glass ■ Metals ■ Plastics
Glass, metals and plastics collected for recycling (%)
2012 2013 2014 2015 2016
80
70
60
50
40
30
» Unpredictable policy changes make planning difficult » Waste management levies will place local manufacturing at a
structural disadvantage » Additional fees could lead to the industry recycling less post-consumer
packaging » Failure to remain compliant could lead to penalties and harm our licence
to operate » Profitability will be pressured, impacting returns to investors
» Participated in industry-wide engagement with government to improve the environment for manufacturers
» Maintained our significant contributions to recycling » Sustained our efforts on further reducing the weight
of products » Engaged with policy makers on proposed regulatory
changes » Focused on unlocking further value from base
businesses to build resilience to withstand requirements of greater regulatory burden
Material issues continued
Nampak Limited Integrated Report 2017
30

MATERIAL ISSUE IMPLICATIONS FOR VALUE OUR STRATEGIC RESPONSE IN 2017
OUR OPERATIONAL AND FINANCIAL PERFORMANCE
Bevcan South Africa reported a strong overall performance, with efficiency gains, a reduction in spoilage levels and a world-class safety record. DivFood completed its equipment modernisation programme but reported lower revenue and profitability in the second half amidst tough SA market conditions. Glass experienced operational challenges in the second half, aggravated by electricity supply problems. Plastics in South Africa and the UK lost customers to backward integration. Paper reported pressure on revenue and lower trading profits.
Trading pro�t (R million)
2013 2014 2015 2016 2017
2 000
1 500
1 000
500
» Impaired goodwill of R321 million and intangibles of R114 million at Glass and impaired in-plant at Nampak Plastics Europe of R112 million which adversely impacted on earnings per share and the group effective tax rate but were excluded from headline earnings per share
» Continued to focus on interventions to improve operational efficiencies
» Freed up executive management’s time to focus exclusively on Glass
» Appointed new management at Nampak Plastics Europe
» Devoted considerable attention to addressing our defined benefit liabilities
» Formalised plans to consolidate two large liquid packaging sites in Gauteng
» Maintained a strengthened balance sheet
LIQUIDITY RESTRICTIONS AND THE EXPOSURE OF RESTRICTED CASH TO CURRENCY VOLATILITY
After a steep fall between mid-2014 and early 2016, oil prices recovered slightly. Crude exporters Angola and Nigeria continued to suffer low export earnings, declines in their currencies and shortages of forex. The naira depreciated 14% against the US dollar but forex liquidity improved significantly with the launch of the NAFEX market. The functional currency for Bevcan in Angola and Nigeria is the US dollar, and that for our paper and metals businesses in Nigeria is the naira. In our accounts, when translating from functional currency to reporting currency, all movements in monetary items are made through the profit and loss account.
NAFEX brings US dollar liquidity to Nigeria
April 15■ Interbank rate ■ CBN of�cial rate
April 16 April 17 Nov 2017
550
500
450
400
350
300
250
200
150
100
■ Parallel ■ NAFEX ■ Government budget
» Experienced losses from the currency devaluation on translation in Nigeria, resulting in losses of R160 million compared to R507 million in 2016. The loss of R174 million in Angola in 2016 was not repeated in 2017
» Substantially increased our cash repatriation from Nigeria after the launch of NAFEX with US$79 million being repatriated
» Inconsistent availability of forex led to supply chain disruptions in Nigeria and Ethiopia; hampered Zimbabwe operational performance
» Limited our ability to settle intergroup loans and creditors » Cash balances in Angola, Nigeria and Zimbabwe increased from
R2.3 billion to R3.7 billion
» Increased hedging of Angolan exposures » Continued to link Bevcan Nigeria product pricing
to dollar » Secured cash repatriation of US$127 million from
Angola and Nigeria
CHALLENGING MACRO-ECONOMIC ENVIRONMENT
Across our markets, economies were weak as commodity prices remained soft and political uncertainty dented confidence. In South Africa, poverty and unemployment increased, hurting consumer spending, and confidence waned. The country’s sovereign credit rating was downgraded to sub-investment status. There were some tentative signs of recovery in Nigeria, which, like South Africa, emerged from recession in the second quarter. Consolidation of both the competitive and customer landscape continued.
SA and Nigeria GDP growth (%)
2014 2015 2016 2017■ SA ■ Nigeria
876543210
(1)(2)(3)
» Decline in demand for packaging products as consumers trade down to value brands and products and consume less
» Decline in revenue, pressure on earnings » Limited potential for organic growth as well as opportunities for new
investments
» Intensified our efforts to improve overall performance with operational excellence approach
» Took steps to address fixed costs throughout our business
» Further reduced gearing to lessen the impact of the sovereign downgrade
» Planned to rationalise some Rest of Africa operations, mindful of the need not to lose our first-mover advantage
PEOPLE – SAFETY, SKILLS AND TRANSFORMATION
Ensuring the safety of our people and that of our contractors is critical. Tragically, on 1 October 2016 a logistics contractor at our Glass facility died in a fork-lift truck accident. Our overall safety performance improved, nearing our tolerance level. We continued to face a shortage of skills. The fall in Nampak’s share price had implications for our ability to retain key talent. Under the new codes, our B-BBEE contributor status fell to level 6 from level 3.
■ Actual ■ Tolerance
Lost-time injury frequency rate over a �ve-year period
2013 2014 2015 2016 2017
1.5
1.0
0.5
0
» Unsafe operations harm people, the environment, quality and our reputation » Insufficient skills may impact our ability to meet customer requirements, harm
operational effectiveness and our ability to deliver on strategy, with the potential to affect revenue, profitability, investor returns and tax payable to authorities
» Poor B-BBEE rating could impact the revenue of South African operations » Without transformation to a more equal society, the sustainability of the
South African market is at risk
» Continued to prioritise safety across the group » Injected new talent as opportunities arose » Provided external managerial training aligned with
Nampak skills imperatives » Set up a B-BBEE steering committee to initiate our
efforts; commenced work on a new B-BBEE ownership scheme
UNCERTAIN REGULATORY AND POLICY ENVIRONMENT
South Africa has a multitude of existing and planned legislative requirements, directly affecting Nampak or our customers. The increased regulatory load includes implications of the National Pricing Strategy for Waste Management Charges; the requirement to prepare and submit for government approval waste management plans; the planned tax on carbon emissions and the proposed tax on sugar-sweetened beverages. In other parts of Africa, significant levels of red tape, port and logistics inefficiencies hamper the importation of raw materials.
■ Glass ■ Metals ■ Plastics
Glass, metals and plastics collected for recycling (%)
2012 2013 2014 2015 2016
80
70
60
50
40
30
» Unpredictable policy changes make planning difficult » Waste management levies will place local manufacturing at a
structural disadvantage » Additional fees could lead to the industry recycling less post-consumer
packaging » Failure to remain compliant could lead to penalties and harm our licence
to operate » Profitability will be pressured, impacting returns to investors
» Participated in industry-wide engagement with government to improve the environment for manufacturers
» Maintained our significant contributions to recycling » Sustained our efforts on further reducing the weight
of products » Engaged with policy makers on proposed regulatory
changes » Focused on unlocking further value from base
businesses to build resilience to withstand requirements of greater regulatory burden
STRATEGIC CONTEXT ] Nampak Limited Integrated Report 2017
31
HOW WE CREATE VALUE
STRATEGIC CONTEXT
STRATEGIC PERFORMANCE
GOVERNANCE AND REMUNERATION
SHAREHOLDER INFORMATIONWHO WE ARE

Our top risks and opportunities
We consider each risk’s potential impact on the achievement of the group’s strategy, as well as the probability of each arising. The risk rating position on the heat map reflects the residual risk position after considering the effectiveness of the mitigation strategies. We have ranked these risks in order of their magnitude, although we recognise that these positions may change during the year. We have provided a forward-looking view of the risks and opportunities that we believe may impact future performance.
Our risk framework, risk guidelines and other group policies and procedures inform our risk management culture. The risk and sustainability committee considers the material outcomes of these processes and measures the level of risk exposure against risk appetite and tolerance levels. Understanding the risk environment informs the group strategy and assists with decision making at board level. We participate in the Carbon Disclosure Project (CDP) and have formalised our assessment of Nampak’s
environmental impact on climate change. In 2017, we extended this participation to include our approach to water management. Key risks are identified and disclosed through this process.
Information management services (IMS) is a standing agenda item for the risk and sustainability committee, with ultimate responsibility for IMS governance resting with the board.
RISK NAME AND RANK
2 Dependence on foreign exchange liquidity and currency movements
Financial underperformance at certain operations1 5 Uncertain regulatory and
policy environment
Inadequate diversity, people development and a skills shortage
6
Challenging macro-economic and political conditions in our key markets
3
Not being able to retain key customers4
7 Uncontrollable increases to legacy defined benefit liabilities
Potential to fall prey to cyber crime8
maximum
IMPA
CT
maxi
mum
minimum PROBABILITY
1
3
8
6
4
7
5
2
RISK HEAT MAP
min
imum
Nampak Limited Integrated Report 2017
32

Impact if not managed:
How we did in 2017:
Value created from our mitigation strategies:
Looking forward: Opportunities for value:
FINANCIAL UNDERPERFORMANCE AT CERTAIN OPERATIONS
» This can result in asset impairments and harm the group’s profitability and sustainability
» Reduced the carrying value of our Glass business
» Provided for an onerous contract and reduced the carrying value of certain assets at our rigid plastics operation in Nampak Plastics Europe
» Improved performance by our Bevcan operations offset poor performance at Glass and Nampak Plastics Europe
» Continued to deliver on our drive towards advanced manufacturing by extracting value from newly installed technologies and improved processes and management methods
» Improved plant maintenance
» Reduced complexity in our manufacturing processes; engaged customers about further restructure of our product mix
» Considered and implemented plant and line rationalisation
» Plan to introduce external Glass technical skills in 2018
» Continue to drive operational efficiencies
» Introduced group restructuring initiative
» Financial turnaround of our underperforming divisions
» Group restructuring initiatives to reduce complexity, limit non-value-add activities and reduce cash fixed costs
» Bevcan expanded ends plant’s delivery to performance targets
» Improved operating efficiencies and reduced spoilage at Bevcan Springs plant will contribute to improved margins
DEPENDENCE ON FOREIGN EXCHANGE LIQUIDITY AND CURRENCY MOVEMENTS
» Swings in the translated rand value of earnings from the Rest of Africa impacts our financial performance. A lack of market liquidity holds up the repatriation of earnings and limits our ability to pay for raw material imports and investments
» In Nigeria, we were able to extract cash as planned thanks to liquidity provided by the new NAFEX market
» In Angola, our cash repatriation slowed in the year
» Zimbabwe is strongly cash generative but experienced liquidity constraints
» Our cash management committee, in its second year of operation, ensured cash flow remained a strong focus
» We improved the strength of the balance sheet, with attention being paid to improved forecasting, capex management and a focus on cash generation
» We increased our hedged exposure in Angola through US$-indexed kwanza bonds from 61% to 89%
» Currency volatility will continue to have a bearing on financial results
» Strengthened balance sheet is able to withstand further currency volatility
» Our ability to invest in growth opportunities increases with improvements in forex liquidity
CHALLENGING MACRO-ECONOMIC AND POLITICAL CONDITIONS IN OUR KEY MARKETS
» Reduced consumer demand leads to lower volumes and revenue and pressure on profit margins. It also limits opportunities for growth
» DivFood’s revenue and profitability declined on constrained demand
» Plastics also felt the weight of the economic slowdown, with consumer demand declining
» Strained economic activity across Africa, notably Nigeria and Zimbabwe affected group revenue and trading profit
» Ongoing drive to deliver improved operating efficiencies and cash fixed cost reductions
» Operations geared to meet increased capacity requirements
» Business and consumer confidence in South Africa is likely to remain weak until there is some resolution to the uncertain political situation
» Economic activity in Nigeria and Angola is showing signs of recovery
» Potential impact of South African leadership succession
» We are well positioned to take advantage of organic growth in our markets
» Long-term fundamentals for packaging growth in African markets remains intact
» Our market positions are strong with more than 60% of our customer base consisting of large multinationals with strong brands and strong credit ratings
1
2
3
The icons show the links to our material issues.
STRATEGIC CONTEXT ] Nampak Limited Integrated Report 2017
33
HOW WE CREATE VALUE
STRATEGIC CONTEXT
STRATEGIC PERFORMANCE
GOVERNANCE AND REMUNERATION
SHAREHOLDER INFORMATIONWHO WE ARE

Our top risks and opportunities continued
Impact if not managed:
How we did in 2017:
Value created from our mitigation strategies:
Looking forward: Opportunities for value:
NOT BEING ABLE TO RETAIN KEY CUSTOMERS
» Should key customers reduce their purchases we would lose revenue and margins
» Impacted by backward integration by large customers in liquid plastics as well as entrance of international competitor
» Prepared for start-up of competitor’s new manufacturing facilities in South Africa
» Our R&D facility provided value-added benefits, specifically in respect of food safety and packaging lightweighting services
» We continually work on understanding our cost competitiveness and levers of value creation
» We have long-term customer relationships supported by long-term contracts
» We apply a continuous improvement approach in order to improve service and product quality
» New manufacturer recently commenced production of trial beverage cans and so we anticipate some loss of volume in 2018 in South Africa
» Focus on reduction in cash fixed costs in 2018 including group restructuring initiative
» In the rigid plastics division our capacity selling project is delivering revenue growth
UNCERTAIN REGULATORY AND POLICY ENVIRONMENT
» Given the complexity, magnitude and regular changes to laws, there are challenges to full compliance, failure to remain compliant could lead to penalties and affect our licence to operate
» Continued to prepare to comply with potential regulatory changes such as the implementation of punitive post-consumer waste management responsibilities, carbon tax and sugar tax
» Continued engagement with South Africa’s DEA, dti and Treasury on all aspects of proposed legislation both directly, with aligned stakeholders and through industry bodies
» Participated in the establishment of a metals recycling producer responsibility organisation (PRO)
» We have established governance procedures and practices in place and non-compliance is reported to the board sub-committees
» Established process controls and internal audit practices
» Our active participation in a number of industry PROs provides a solid foundation for engagement and alignment with government and other stakeholders on post-consumer packaging waste recycling objectives
» The group has commenced defining its approach to combined assurance
» Good corporate governance practices will continue to boost revenue and contractual arrangements and opportunities with large multinational customers
4
5
Nampak Limited Integrated Report 2017
34

Impact if not managed:
How we did in 2017:
Value created from our mitigation strategies:
Looking forward: Opportunities for value:
INADEQUATE DIVERSITY, PEOPLE DEVELOPMENT AND A SKILLS SHORTAGE
» Without transforming to a more equal society, the sustainability of our market in South Africa is in jeopardy
» A poor B-BBEE rating could impact the revenues of the South African operations
» Insufficient skills could impact operational effectiveness and our ability to deliver on strategy
» B-BBEE rating declined to level 6 from 3 but we remained steadfast in our work to help transform South Africa
» Established B-BBEE steering committee to oversee our efforts
» Initiated work on a new B-BBEE ownership scheme, which is intended to minimise cost to shareholders
» Maintained strong graduate development programme
» Increased number of apprenticeships
» Recorded a reduction in our investment in employee development
» External managerial training and development course content aligned with Nampak skills imperatives for value creation
» Proven track record of improvements in manufacturing efficiencies as a result of key technical partnerships with suppliers and customers
» We have a clear and active plan in place to improve our B-BBEE rating in South Africa
» Potential improvement in employee productivity with an improving skills profile
» An improved B-BBEE rating can improve revenue in the South African operations through procurement benefits
» A transformed and more equal society in South Africa would benefit the economy and therefore our operations
UNCONTROLLABLE INCREASES TO LEGACY DEFINED BENEFIT LIABILITIES
» If cost increases outstrip affordability, profits will be adversely affected
» Deficits in the Nampak UK pension plan continued to increase, impacted by low interest rates, improved mortality and inflation as well as investment market volatility
» 947 pensioners accepted the annuity offer in 2016 and 2017 with the cash purchase amount of R569.2 million for the annuities flowing in 2017
» The remaining liability in South Africa continued to grow, hurt by medical inflation running above consumer price inflation
» We review opportunities to derisk the defined benefit liabilities and provide pensioners with voluntary alternative offers when feasible
» We have commenced with a voluntary enhanced transfer value exercise and sent transfer offers to qualifying members of the Nampak Staff Pension Plan in the UK. As part of the process, members have been provided with access to independent financial advice
» Our defined benefit liabilities are reducing as benefits from the various derisking activities materialise
POTENTIAL TO FALL PREY TO CYBER CRIME*
» Ransomware attacks could paralyse the business, rendering it unsustainable
» Better understanding of the potential impact from a financial point of view (insurance) and from an operational point of view (carried out penetration tests and internal audit tests)
» Increased awareness campaigns
» Ongoing monitoring of risk and testing of strength of IT infrastructure, and implementation of actions to eliminate risk exposures
» Preventing cyber crime is an ongoing commitment as hackers become more sophisticated
» Greater security of IT infrastructure and business sustainability
*Replaces risk of dependence on limited suppliers which we consider to be sufficiently addressed in 2017.
6
7
8
STRATEGIC CONTEXT ] Nampak Limited Integrated Report 2017
35
HOW WE CREATE VALUE
STRATEGIC CONTEXT
STRATEGIC PERFORMANCE
GOVERNANCE AND REMUNERATION
SHAREHOLDER INFORMATIONWHO WE ARE

KEY FINANCIAL FEATURES
» Revenue down 2% at R18.8 billion but up 6% in constant currency, despite market pressures and depressed consumer spending
» Trading profit of R2.0 billion up 3% (12% in constant currency) due to improved gross profit and overhead control
» Trading profit up 11% after adjusting for external rent paid pursuant to the 2016 sale and leaseback transaction
» Rest of Africa trading profit up 27% following strong performance from Bevcan Angola
» Operating profit of R1.0 billion down 56% on 2016 due to capital profit on sale and leaseback of property portfolio in South Africa in prior year, but up 14% net of this once-off item
» Net finance costs down 19% due to strengthened balance sheet on the back of the sale and leaseback
» Goodwill impairment of R321 million and R114 million impairment of intangible asset at Glass with an adverse impact on earnings per share and group effective tax rate
» Nampak Plastics Europe in-plant impairment and onerous contract provision negatively impacted earnings and group effective tax rate
» Significantly lower foreign exchanges losses, improved cash repatriation and increased hedging of Angolan exposures
» EPS down 86% due to 2016’s capital profit on sale and leaseback, 20% down net of this once-off item
» HEPS up 15.0%
» Balance sheet remains strong with gearing down to 45% from 49%
» Capital expenditure well managed, down 50% from R1.4 billion to R0.7 billion in 2017
» Defined benefit obligation down 16% from prior year
» Covenants, acid test ratio and current ratio remain strong and well controlled
» Working capital management focus maintained
» Effective tax rate increased to 37.5% from 11.9% due to impairments with no tax shield but in line with guidance at half-year before impairments
Chief financial officer’s review
Achieved consistent financial ratios; operations to now deliver off sound platform.
OVERVIEWThe year under review was characterised by challenging market conditions due to depressed consumer demand as a result of low consumer confidence in various markets. We adopted a prudent approach to managing the group’s finances in uncertain markets with new entrants. We paid increased attention to operations excellence, cash management, the judicious allocation of funding for capital expenditure and the rigorous evaluation of the carrying value of various assets. These activities required some bold decisions which we detail in this report. Nampak’s balance sheet remains strong with growth potential.
In 2016, the balance sheet was restructured primarily through the sale and leaseback of the group’s property portfolio, focus on working capital, capital expenditure management and a cessation of the dividend to provide 2017 with a sound platform with improved gearing, strong short-term liquidity and adequate funding. This theme continued in 2017, with operating profitability, cost control, cash management and the review of the group’s portfolio being focus areas. Driven to deliver advanced manufacturing, Nampak is well positioned to leverage off its recently modernised asset base and to benefit from further operations excellence initiatives and turnaround plans in operations that have not performed to expectations during 2017.
With an extremely pleasing performance from the Bevcan businesses across the continent, the overall results at a HEPS level achieved expectations. EPS in the prior year were boosted materially by the once-off capital profit on the sale and leaseback of the South African property portfolio which was not repeated in 2017.
Nampak Limited Integrated Report 2017
36

DRIVING PROFITABILITY
AND PRUDENTLY ALLOCATING
CAPITAL
Focus areaHow we did
in 2017
Capital expenditure management
Cash generation
Working capital management
Managing overheads/improving profitability
Forecasting
Managing Rest of Africa liquidity, cash repatriation and hedging
– Nigeria
– Angola
Balance sheet management
Good progress made Some progress, more to come
STRATEGIC PERFORMANCE ] Nampak Limited Integrated Report 2017
37
HOW WE CREATE VALUE
STRATEGIC CONTEXT
STRATEGIC PERFORMANCE
GOVERNANCE AND REMUNERATION
SHAREHOLDER INFORMATIONWHO WE ARE

Chief financial officer’s review continued
Profit for the year
2017Rm
2016Rm
%change
Revenue 18 822 19 139 (2)
Trading profit 1 967 1 905 3Abnormal items# (1 006) (1 076) 6
Trading profit before property-related items 961 829 16Other abnormal items* – 1 334
Operating profit 961 2 163 (56)
EBITDA** 2 460 3 435 (28)EBITDA*** 2 798 2 817 (1)PBT 570 1 677PAT 356 1 478EPS – cents 36.6 254.5HEPS – cents 123.8 107.6Ordinary dividend – cents – –
# Excluding net capital profit on disposal of property sale and leaseback.* Net capital profit on disposal of property sale and leaseback.** Adjusted for impairments.*** Based on trading profit.
Nampak’s trading profit increased by 3% to R1 967 million in 2017 from R1 905 million in 2016, with trading margins improving to 10.4% from 10.0%. A commendable result from Bevcan South Africa and Angola assisted in delivering a 32% increase in trading profits from Metals off a 7% increase in revenue. DivFood had a challenging year. It is pleasing to note that Glass achieved a 7% increase in revenue compared to the prior year. However, during the second half, Glass experienced electrical supply issues which adversely impacted its performance and resulted in a 40% reduction in trading profit from R105 million in the prior year to R63 million in 2017. Glass incurred abnormal items of R79 million attributable to lost production as a consequence of the electrical supply issue and fire on one of the lines. Plastics’ trading profit declined 58% off a revenue decline of 17%, with most of the revenue decline being attributable to the loss of certain customers in the United Kingdom who chose to vertically integrate. South Africa Plastics experienced tough trading conditions with depressed demand and pressure on trading margins. With the exception of our Zimbabwean operations, Paper reported pressure on revenue with a concomitant reduction in trading profits and trading margins. Corporate costs were well controlled with a reduction of R57 million in operating expenses at the South African head office. The overall increase of R29 million in corporate costs was primarily attributable to a lower post-retirement medical aid curtailment gain in the year compared to the prior year.
From a geographical perspective, the South African contribution to revenue increased from 57% to 60% while its contribution to trading profit declined from 49% to 46%. The Rest of Africa contribution to revenue increased marginally from 31% to 32% but due to an extremely strong performance from Bevcan Angola, the segment’s contribution to trading profit increased from 52% to 64%.
Profit on sale and leasebackEBITDA inclusive of impairments declined by 28% from R3 435 million to R2 460 million mainly due to the prior year including a capital profit of R1 334 million on the sale and leaseback of the South African property portfolio. EBITDA of R2 798 million (based on trading profit) declined by 1% from R2 817 million in the prior year.
CONSTANT CURRENCY REVENUE AND TRADING PROFIT
0
5000
10000
15000
20000
25000
0
2
4
6
8
10
12
14
Revenue (R million)
2013 2014 2015 2016 2017
25 000
20 000
15 000
10 000
5 000
0
14%
12%
10%
8%
6%
4%
2%
0%
Revenue Constant currency Trading margin
In constant currency terms, revenue in 2017 increased by R1.4 billion or 6% off the back of a 9.5% appreciation in the average exchange rate of the US dollar to the rand. Non-South African sources contributed 40% (2016: 57%) to the group’s revenue with the strengthening of the rand impacting the group on consolidation of these foreign operations. Significant revenue growth in the Bevcan business was offset by a general decline in several sectors across the continent and the UK experiencing a 36% revenue decline in 2017 due to the loss of a major customer that chose to vertically integrate. Group trading margins, which have declined since 2014, increased for the first time in 2017, through improved operating efficiencies in certain operations and strong cost control.
Nampak Limited Integrated Report 2017
38

Trading profit in constant currency terms reflects growth of 12% or R163 million compared to 3% in comparative terms. In 2017, we paid external rental of R150 million following the sale and leaseback transaction in September 2016, thereby reducing trading profit compared to the prior year, but with a compensating reduction in net finance costs. Adjusting for this external rental payment, trading profit for true comparative purposes increased by 11%.
Key issues during the current year:
Revenue (R million)
2016
at c
onsta
nt
curre
ncy
Sout
h A
frica
Euro
pe
Rest
of A
frica
Con
stant
cu
rrenc
y
Con
stant
cu
rrenc
y
2017
Data to be
supplied
Increase Decrease
20 000
19 000
18 000
17 000
16 000
Trading pro�t (R million)
2016
at c
onsta
nt
curre
ncy
Sout
h A
frica
Euro
pe
Rest
of A
frica
Con
stant
cu
rrenc
y
Con
stant
cu
rrenc
y
2017
Increase Decrease
2 200
2 100
2 000
1 900
1 800
1 700
1600
1500
ABNORMAL ITEMSThe year was characterised by various abnormal items. We fully disclose and comment on these to assist users of the financial statements in their analysis and understanding of the group’s results.
Abnormal items of R1 006 million excluding the capital profit on the sale and leaseback of land and buildings decreased by 7% from R1 076 million.
Abnormal items2017
Rm2016
Rm
Net impairment costs 668 360 Devaluation of financial instruments 160 681 Glass power and fire – loss of production 79 –Nampak Plastics Europe in-plant onerous contract and related costs 82 – Retrenchment costs 57 30 Gain on acquisition of business (27) – Profit on disposal of investments (25) (4)Restructuring/rationalisation expenses 16 4 Other (4) 5
Sub-total 1 006 1 076Profit on sale of property/sale and leaseback of land and buildings – (1 334)
Total 1 006 (258)
Net impairment costsIn 2017, Nampak recorded impairments of R668 million compared to R360 million in 2016. Significant items of impairment include R321 million goodwill and R114 million intangible assets impaired in Glass, a R112 million impairment related to the Nampak Plastics Europe in-plant, site closures associated with the decision by major dairies in the UK to vertically integrate which resulted in asset impairments of R82 million as well as R35 million related to the Bevcan Cape Town tinplate can line.
In terms of International Accounting Standard (IAS) 36: Impairment of Assets, the group tests the carrying value of goodwill annually. The goodwill impairment model is highly sensitive to small changes in key variables that have a material effect on the valuation of Glass. We rigorously tested this model and after careful consideration, management fully impaired goodwill of R321 million related to the purchase of the remaining 50% of the business from our joint venture partner in 2012. In addition, the carrying value of the intangible asset of R114 million was impaired.
STRATEGIC PERFORMANCE ] Nampak Limited Integrated Report 2017
39
HOW WE CREATE VALUE
STRATEGIC CONTEXT
STRATEGIC PERFORMANCE
GOVERNANCE AND REMUNERATION
SHAREHOLDER INFORMATIONWHO WE ARE

Chief financial officer’s review continued
Devaluation of financial instrumentsWe experienced losses from the currency devaluation of financial instruments in Nigeria where the naira depreciated by 14.0% during the year from 315 to 359 to the US dollar, resulting in additional foreign exchange losses of R160 million compared to R507 million in the prior period. The foreign exchange loss of R174 million in Angola in 2016 was not repeated in 2017. Total abnormal foreign exchange losses for the year represent a significant reduction from the losses of R681 million incurred during 2016.
Significant attention continues to be placed on the liquidity issues in the Nigerian, Angolan and Zimbabwean foreign exchange markets. Our businesses in these respective countries
continue to produce cash with growing cash balances. The table below clearly sets out the cash held, the proportion hedged and the cash repatriation rates. These operations are funded on loan accounts using US dollars by the group’s offshore procurement and treasury operation that continues to play an extremely important strategic role in funding the Rest of Africa. Where possible, cash balances in countries with poor dollar liquidity, have been hedged.
During the year under review US$127 million was extracted from Nigeria and Angola with cash repatriations of US$79 million and US$48 million respectively. This was a pleasing result in challenging market conditions with the offshore treasury company being adequately funded.
Cash repatriation and hedging
AngolaRm
ZimbabweRm
Sub-totalRm
NigeriaRm
TotalRm
30 September 2017Cash on hand 2 188 654 2 843 828 3 670 Hedged 1 954 –# 1 954 –** 1 954 Net unhedged cash 234 654 889 828 1 716 Cash repatriation rate (%)* 47 – – 93 –Percentage of cash on hand hedged (%) 89 – 65 – 114
31 March 2017Cash on hand 1 436 426 1 863 954 2 817 Hedged 1 107 –# 1 107 344 1 451 Net unhedged cash 330 426 756 610 1 366 Cash repatriation rate (%)* 80 40 – 80 –Percentage of cash on hand hedged (%) 77 – 59 36 52
30 September 2016Cash on hand 1 004 290 1 294 984 2 278 Hedged 614 –# 614 376 990 Net unhedged cash 390 290 680 608 1 288 Cash repatriation rate (%)* 95 56 – 57 –Percentage of cash on hand hedged (%) 61 – 47 38 43
* Cash repatriation rate = cash extracted as a percentage of invoices presented for payment in the period. ** Not hedged due to US dollar liquidity provided by the NAFEX. # No suitable hedges available.
NigeriaIn April 2017, the Central Bank of Nigeria introduced the Nigerian Autonomous Foreign Exchange (NAFEX) market which allowed importers and exporters to conclude foreign currency trades outside of the Nigerian Inter-bank Foreign Exchange (NIFEX) market rate. The below graph demonstrates the positive effect that the introduction of the NAFEX market had in Nigeria.
At 30 September 2016, the group translated its naira monetary items to US dollars at the NIFEX closing rate of NGN315 to the dollar. The introduction of the NAFEX market significantly improved dollar liquidity in Nigeria during the year with in excess of US$4 billion being traded on the NAFEX market. Monetary items held at 30 September 2017 were translated at the NAFEX rate compared to NIFEX in the prior year.
Nampak Limited Integrated Report 2017
40
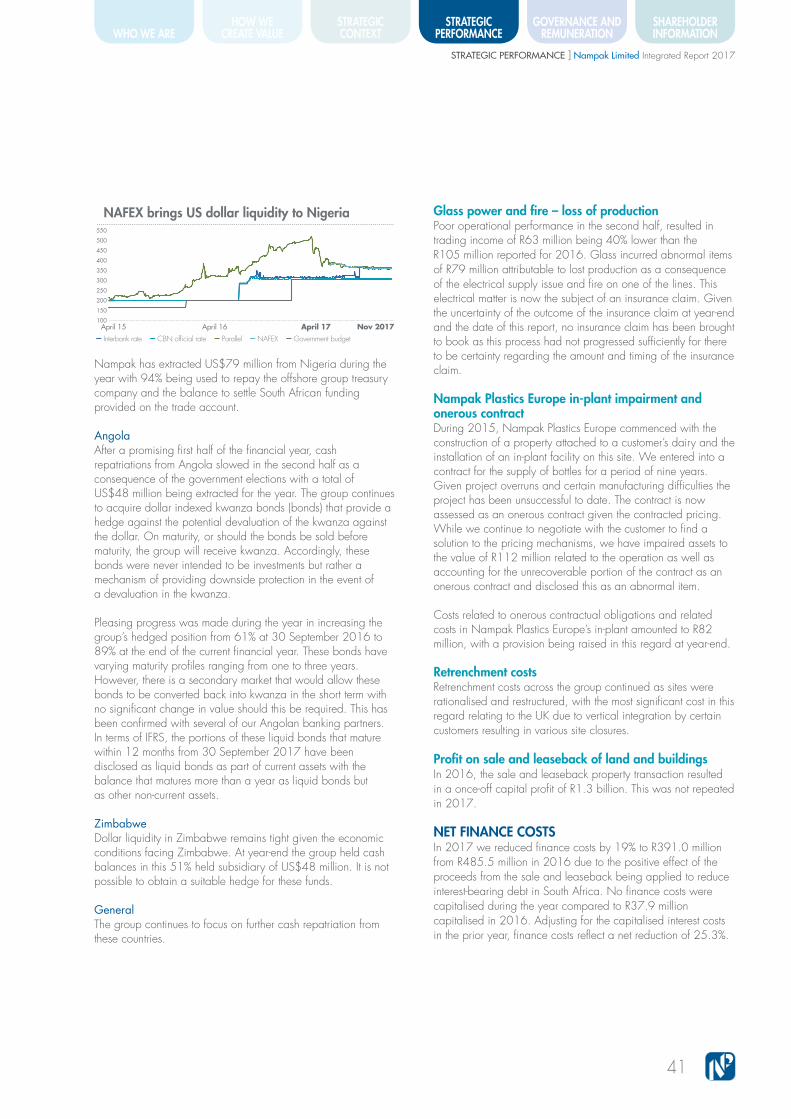
NAFEX brings US dollar liquidity to Nigeria
April 15■ Interbank rate ■ CBN of�cial rate
April 16 April 17 Nov 2017
550
500
450
400
350
300
250
200
150
100
■ Parallel ■ NAFEX ■ Government budget
Nampak has extracted US$79 million from Nigeria during the year with 94% being used to repay the offshore group treasury company and the balance to settle South African funding provided on the trade account.
AngolaAfter a promising first half of the financial year, cash repatriations from Angola slowed in the second half as a consequence of the government elections with a total of US$48 million being extracted for the year. The group continues to acquire dollar indexed kwanza bonds (bonds) that provide a hedge against the potential devaluation of the kwanza against the dollar. On maturity, or should the bonds be sold before maturity, the group will receive kwanza. Accordingly, these bonds were never intended to be investments but rather a mechanism of providing downside protection in the event of a devaluation in the kwanza.
Pleasing progress was made during the year in increasing the group’s hedged position from 61% at 30 September 2016 to 89% at the end of the current financial year. These bonds have varying maturity profiles ranging from one to three years. However, there is a secondary market that would allow these bonds to be converted back into kwanza in the short term with no significant change in value should this be required. This has been confirmed with several of our Angolan banking partners. In terms of IFRS, the portions of these liquid bonds that mature within 12 months from 30 September 2017 have been disclosed as liquid bonds as part of current assets with the balance that matures more than a year as liquid bonds but as other non-current assets.
ZimbabweDollar liquidity in Zimbabwe remains tight given the economic conditions facing Zimbabwe. At year-end the group held cash balances in this 51% held subsidiary of US$48 million. It is not possible to obtain a suitable hedge for these funds.
GeneralThe group continues to focus on further cash repatriation from these countries.
Glass power and fire – loss of productionPoor operational performance in the second half, resulted in trading income of R63 million being 40% lower than the R105 million reported for 2016. Glass incurred abnormal items of R79 million attributable to lost production as a consequence of the electrical supply issue and fire on one of the lines. This electrical matter is now the subject of an insurance claim. Given the uncertainty of the outcome of the insurance claim at year-end and the date of this report, no insurance claim has been brought to book as this process had not progressed sufficiently for there to be certainty regarding the amount and timing of the insurance claim.
Nampak Plastics Europe in-plant impairment and onerous contractDuring 2015, Nampak Plastics Europe commenced with the construction of a property attached to a customer’s dairy and the installation of an in-plant facility on this site. We entered into a contract for the supply of bottles for a period of nine years. Given project overruns and certain manufacturing difficulties the project has been unsuccessful to date. The contract is now assessed as an onerous contract given the contracted pricing. While we continue to negotiate with the customer to find a solution to the pricing mechanisms, we have impaired assets to the value of R112 million related to the operation as well as accounting for the unrecoverable portion of the contract as an onerous contract and disclosed this as an abnormal item.
Costs related to onerous contractual obligations and related costs in Nampak Plastics Europe’s in-plant amounted to R82 million, with a provision being raised in this regard at year-end.
Retrenchment costs Retrenchment costs across the group continued as sites were rationalised and restructured, with the most significant cost in this regard relating to the UK due to vertical integration by certain customers resulting in various site closures.
Profit on sale and leaseback of land and buildings In 2016, the sale and leaseback property transaction resulted in a once-off capital profit of R1.3 billion. This was not repeated in 2017.
NET FINANCE COSTSIn 2017 we reduced finance costs by 19% to R391.0 million from R485.5 million in 2016 due to the positive effect of the proceeds from the sale and leaseback being applied to reduce interest-bearing debt in South Africa. No finance costs were capitalised during the year compared to R37.9 million capitalised in 2016. Adjusting for the capitalised interest costs in the prior year, finance costs reflect a net reduction of 25.3%.
STRATEGIC PERFORMANCE ] Nampak Limited Integrated Report 2017
41
HOW WE CREATE VALUE
STRATEGIC CONTEXT
STRATEGIC PERFORMANCE
GOVERNANCE AND REMUNERATION
SHAREHOLDER INFORMATIONWHO WE ARE

Chief financial officer’s review continued
TAXATIONNampak has a good record of managing the group’s taxation affairs and prioritises compliance in all respects across several jurisdictions while optimising allowable deductions and taking opportunities to the full extent possible. During the year we continued to benefit from the pioneer tax status in Nigeria and the tax holiday in Angola. It should be noted that the Nigerian pioneer status ends on 31 December 2017 while the tax holiday in Angola will be available until 31 December 2018. Taxation years in these respective countries are based on calendar years. The group benefits from tax incentives granted in relation to our beverage can lines and Glass business in South Africa with management actively managing the requirements to benefit from these favourable tax laws that encourage investment.
The effective tax rate for the year increased from 11.9% to 37.5% and exceeded the half-year effective tax rate of 8.5% primarily due to the material asset, goodwill and intangible asset impairments in the second half of the financial year that do not offer a tax shield. In addition, an agreement was reached with the Bevcan Angola minority shareholders to charge interest on the trade loan account representing funding provided by Bevcan South Africa which had the effect of increasing the effective tax rate with compensatory credit on the profit attributable to minority shareholders on consolidation. The reconciliation that follows highlights the material reconciling items from the group’s statutory tax rate to its effective tax rate.
The effective tax rate for the year before impairments was 8.5% in line with the 8.5% forecast at the half-year.
2017%
2016%
Statutory tax rate 28.0 28.0Sale and leaseback – (21.4)Government incentives (21.1) (6.4)Tax rate differential 20.1 (10.3)Impairments and other losses – Glass, UK and Ireland 29.0 –Forex losses not protected 7.9 21.2Withholding and other foreign taxes 8.5 3.0Other 5.3 (2.2)
Effective tax rate 37.5 11.9
Adjustments in second halfImpairment and other losses – Glass, UK and Ireland (29.0) –
Forecast tax rate 31 March 2017 8.5 11.9
Effective tax rate (%)
2013 2014 2015 2016 2017
Effective tax rate Effective tax rate excluding impairments and other losses
4540353025201510
50
(5)(10)
EARNINGS PER SHARE (EPS) AND HEADLINE EARNINGS PER SHARE (HEPS)
EPS and HEPS (cps)
2013 2014 2015 2016 2017
300
250
200
150
100
50
0
EPS HEPS
HEPS grew by 15% in 2017 to 123.8 cents per share compared to 107.6 cents per share in 2016. This is attributable to an improved trading margin, increased trading profit, reduced finance costs and the reduction in foreign exchange losses related to the depreciation in the kwanza and naira compared to the prior year. This was partially offset by the higher minority share of profits in Bevcan Angola following a significant increase in profitability from this entity in 2017.
EPS declined 86% to 36.6 cents per share compared to 254.5 cents per share in 2016. It should be noted that the once-off R1.3 billion capital profit on the sale and leaseback transaction in 2016 contributed 208.5 cents or 82% to the 2016 EPS. In addition, the impairment of R321 million of goodwill and impairment of intangible assets of R114 million in Glass reduced the 2017 EPS by 68.0 cents.
Nampak Limited Integrated Report 2017
42
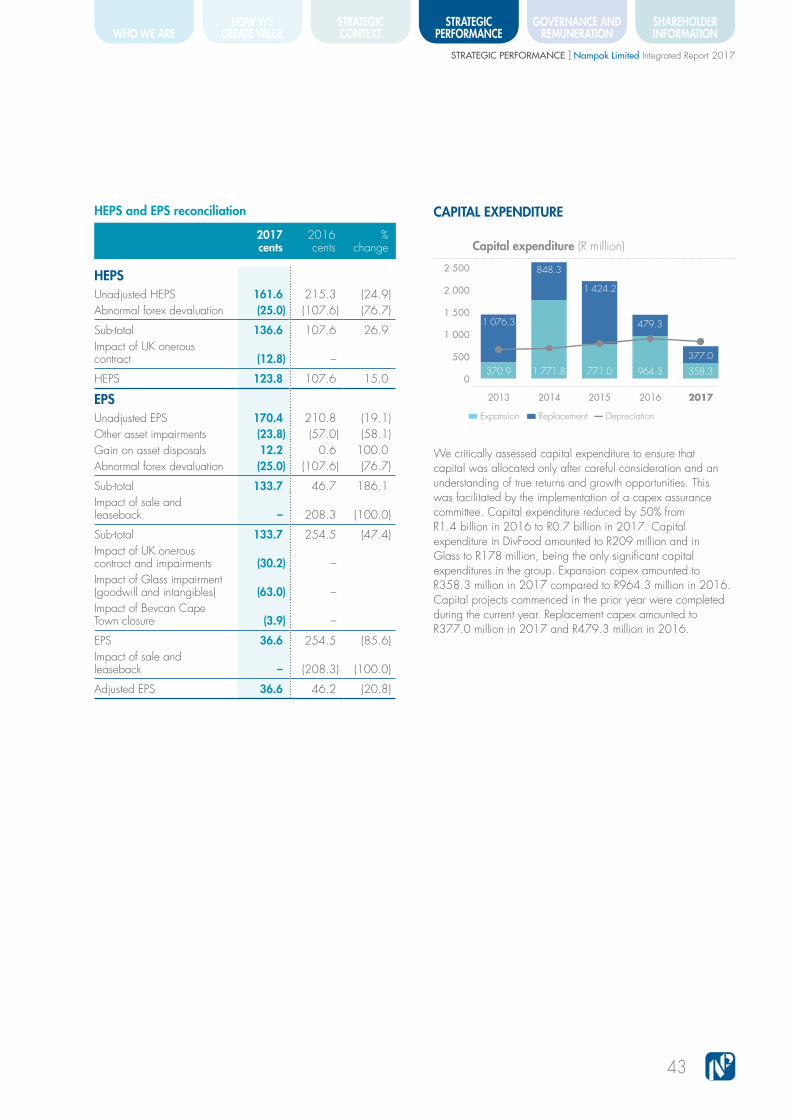
HEPS and EPS reconciliation
2017cents
2016cents
%change
HEPSUnadjusted HEPS 161.6 215.3 (24.9)Abnormal forex devaluation (25.0) (107.6) (76.7)
Sub-total 136.6 107.6 26.9Impact of UK onerous contract (12.8) –
HEPS 123.8 107.6 15.0
EPSUnadjusted EPS 170.4 210.8 (19.1)Other asset impairments (23.8) (57.0) (58.1)Gain on asset disposals 12.2 0.6 100.0Abnormal forex devaluation (25.0) (107.6) (76.7)
Sub-total 133.7 46.7 186.1Impact of sale and leaseback – 208.3 (100.0)
Sub-total 133.7 254.5 (47.4)Impact of UK onerous contract and impairments (30.2) –Impact of Glass impairment (goodwill and intangibles) (63.0) –Impact of Bevcan Cape Town closure (3.9) –
EPS 36.6 254.5 (85.6)Impact of sale and leaseback – (208.3) (100.0)
Adjusted EPS 36.6 46.2 (20.8)
CAPITAL EXPENDITURE
0
500
1000
1500
2000
2500
0
500
1000
1500
2000
2500
Capital expenditure (R million)
2013 2014 2015 2016 2017
2 500
2 000
1 500
1 000
500
0
Replacement DepreciationExpansion
370.9
1 076.3
1 771.8
848.3
771.0
1 424.2
964.3
479.3
358.3
377.0
We critically assessed capital expenditure to ensure that capital was allocated only after careful consideration and an understanding of true returns and growth opportunities. This was facilitated by the implementation of a capex assurance committee. Capital expenditure reduced by 50% from R1.4 billion in 2016 to R0.7 billion in 2017. Capital expenditure in DivFood amounted to R209 million and in Glass to R178 million, being the only significant capital expenditures in the group. Expansion capex amounted to R358.3 million in 2017 compared to R964.3 million in 2016. Capital projects commenced in the prior year were completed during the current year. Replacement capex amounted to R377.0 million in 2017 and R479.3 million in 2016.
STRATEGIC PERFORMANCE ] Nampak Limited Integrated Report 2017
43
HOW WE CREATE VALUE
STRATEGIC CONTEXT
STRATEGIC PERFORMANCE
GOVERNANCE AND REMUNERATION
SHAREHOLDER INFORMATIONWHO WE ARE

CASH FLOW AND WORKING CAPITALThe table below highlights the group’s cash flows with a focus on cash generated from normal operations:
2017Rm
2016Rm
%change
Cash generated from operations before working capital changes 2 395 2 264 6
Cash flows from operations 1 391 1 942 (28)Cash utilised in investing activities (2 571) (202)
Cash generated before financing activities and dividends (1 181) 1 740
Non-operational adjustmentsAdd: Increase in liquid bonds (included in investing activities) 1 337 618Add: Post-retirement medical aid buy-out 569 –Deduct: Proceeds from the sale and leaseback – (1 701)*
Normalised cash generated before financing activities 725 657 11* Proceeds net of transactional costs.
Cash generated before working capital changes of R2 395 million increased by 6% from R2 264 million in the prior year primarily due to a 3% increase in trading profit off improved operating margins that were assisted by a reduction in impairment losses and good cost control. During 2016, a R561 million reduction in the investment in net working capital was achieved from an elevated investment at 30 September 2015 resulting in a net release of cash of R561 million in 2016. Inventory holdings in Nigeria and Angola were significantly reduced during 2016 and contributed R488 million to the release of cash from the net working capital cycle in that year.
During 2017, additional inventory levels were required to meet customer demand and to provide adequate raw material supply headroom given constraints that arose at the respective ports during the year. Accordingly, a further R621 million was invested in inventories during the year with the majority of the funding being allocated to Angola to fund its record sales level and in Nigeria to replenish the low inventory levels at 30 September 2016.
The quality of trade receivables remains exceptionally good with a net reduction in the funding of trade and other debtors of R168 million being achieved. This inflow was augmented by an increase of R127 million in the use of funding provided by trade creditors. The net outflow of R327 million, therefore, relates primarily to the funding of additional inventories in Angola to meet record demand.
Normalised cash generated before financing activities of R726 million increased 11% compared to the prior year.
R133 million of cash generated during the year was utilised to augment the R436 million, being 25% of the sale and leaseback proceeds of R1 744 million in 2016, to fund the top up of the post-retirement medical aid buy-out.
RETURN ON NET ASSETS
02468
1012141618
Return on net assets (RONA) (%)
2013 2014 2015 2016 2017
1816141210
86420
RONA
Trendline showing rolling average (RONA)
Linear trendline (RONA)
Chief financial officer’s review continued
Nampak Limited Integrated Report 2017
44

The 3% improvement in trading profit coupled with reduced net assets has resulted in RONA of 12.2% increasing from 11.2% in the prior year.
KEY RATIOS
0
20
40
60
80
100
Net gearingGross gearing
0102030405060708090
100
Trendline showing net gearing
Net gearing (%)
2013 2014 2015 2016 2017
1009080706050403020100
We applied 75% of the sale and leaseback proceeds of R1.3 billion received during September 2016 to repay South African interest-bearing debt. The downward trend in the net gearing ratio was pleasing, with net gearing declining to 45% from 49%. Managing down the gearing ratio remained a focus area during the year with the final ratio well within the indicated range of 40% to 60% targeted by the board.
Current ratio (times) including liquid non-current portion of US dollar-linked kwanza bonds
2013 2014 2015 2016 2017
Current ratio
2.01.81.61.41.21.00.80.60.40.2
0
Short-term liquidity remained a focus area and was successfully managed through an active management of the working capital cycle. The current ratio of 1.5 times was consistent with the prior year and one that reflects the strength of the group’s balance sheet.
Acid test ratio (times)including liquid non-current portion of US dollar-linked kwanza bonds
2013 2014 2015 2016 2017Acid test ratio including liquid non-current portion of kwanza bonds
1.4
1.2
1.0
0.8
0.6
0.4
0.2
0
The acid test ratio of 1.0 times showed an improvement from the 0.9 times in the prior year and indicated the group’s ability to settle all short-term creditors without having to liquidate any of its inventory holdings.
COVENANTSAt 30 September 2017 the group’s exposure to US dollar interest-bearing debt amounted to US$413 million (2016: US$378 million). The closing rand/US dollar exchange rate of R13.56 strengthened 1.2% from R13.72 in the prior year. The application of 75% of the proceeds from the sale and leaseback transaction on 1 September 2017 is reflected in the reduced gearing with significant headroom in the interest-bearing debt/EBITDA covenant at year-end. The group continues to operate well within the EBITDA/interest cover covenant.
Net debt/EBITDA (times)
2013 2014 2015 2016 2017
Net debt/EBITDA (<3 times) Covenant
3.5
3.0
2.5
2.0
1.5
1.0
0.5
0
STRATEGIC PERFORMANCE ] Nampak Limited Integrated Report 2017
45
HOW WE CREATE VALUE
STRATEGIC CONTEXT
STRATEGIC PERFORMANCE
GOVERNANCE AND REMUNERATION
SHAREHOLDER INFORMATIONWHO WE ARE

EBITDA/interest cover (times)
2013 2014 2015 2016 2017
EBITDA/interest cover (>4 times) Covenant
12
10
8
6
4
2
0
DEBT REDEMPTION AND FUNDING PLANTotal funding capacity tenors excluding overnight
Group long-term debt maturity (R million)
2017 2018 2019 2020 2021 2022 2023
2 500
2 000
1 500
1 000
500
0
Note programme Bank A Bank BBank B Bank D Bank B Bank D
Bank C
The group is reviewing its long-term maturity debt profile with a view to securing term funding with profiles that are more appropriate to the group’s requirements.
DIVIDENDIn line with the prior year’s decision to suspend the payment of a dividend, the group maintained this stance for 2017 in the interests of further strengthening the balance sheet and taking into account the geographic profile of the group’s available cash.
HEAD OFFICE COST REDUCTION PLANSWe achieved head office cost savings of R57 million during 2017. This was largely due to the significant impact of the reduced cost of post-retirement benefits following the buy-outs completed in the prior year and initial part of 2017 and other cost-saving initiatives.
EVENTS AFTER THE REPORTING PERIODThere were no significant reportable events after the reporting period.
LOOKING FORWARDOur focus will remain on maintaining and improving our balance sheet structure and continuing to enhance our capital expenditure controls to ensure capital is employed for maximum return and growth. We will prudently review capital allocations, supported by the multidisciplinary capital assurance committee that has been established to review all capital expenditure.
The finance function plays a significant role in assisting operations to drive profitability and to prudently allocate capital. We will continue to closely monitor liquidity issues in the Rest of Africa and build on successes achieved in this regard during the year.
I would like to thank the finance team for their diligence and resourcefulness in a challenging year, and the group executive committee, board and other group committees as well as our providers of capital for the support during the year.
We look forward to meeting the challenge of remaining the largest diversified packaging company on the African continent, delivering value to all our stakeholders.
Glenn FullertonChief financial officer
Bryanston28 November 2017
Chief financial officer’s review continued
Nampak Limited Integrated Report 2017
46

Five-year financial review
DEFINITIONSTreasury sharesTreasury shares represent shares in Nampak Ltd held by group subsidiary companies and trusts.
Weighted average number of sharesWeighted average number of shares in issue is calculated as the number of shares in issue at the beginning of the year (net of treasury shares), increased by shares issued during the year, weighted on a time basis for the period during which they have participated in the profit of the group.
Dividends declared/cash distributions per ordinary shareInterim dividend/cash distribution paid per ordinary share plus the final dividend/cash distribution declared in respect of the current year’s profits.
Trading profitOperating profit adjusted for abnormal gains/(losses).
Abnormal gains/(losses)Gains/(losses) which do not arise from normal trading activities or are of such size, nature or incidence that their disclosure is relevant to explain performance for the period.
Net assetsTotal assets, excluding tax, deferred tax, bank balances, deposits and cash equivalents and non-current receivables, less trade and other payables, provisions and other non-current liabilities.
EBITDAOperating profit before depreciation and amortisation.
EBITDA (debt covenants)Operating profit before depreciation, amortisation and abnormal items.
Net debtLoans, borrowings and overdrafts, less bank balances, deposits and cash equivalents and non-current receivables (including current portion).
Net debt (debt covenants)Loans, borrowings and overdrafts, less bank balances, deposits and cash equivalents.
Net finance costs (debt covenants)Net finance costs before interest capitalised.
Employee numbers used for calculationsTotal number of employees adjusted for discontinued operations.
Market capitalisationNumber of ordinary shares in issue multiplied by the year-end market price per share.
Return on equityNet profit attributable to ordinary shareholders
Average ordinary shareholder’s equity
Return on net assetsTrading profit plus investment income and share of profit in
associates and joint venturesAverage net assets
Net asset turnRevenue
Average net assets
Return on invested capitalTrading profit less notional taxation adjustment
Average net debt plus average total equity
Current ratioCurrent assets including assets classified as held for sale
Current liabilities including liabilities classified as held for sale
Acid-test ratioCurrent assets before inventories, including assets classified
as held for saleCurrent liabilities including liabilities classified as held for sale
Net debt to EBITDA (debt covenants)Net debt (debt covenants)EBITDA (debt covenants)
EBITDA interest coverEBITDA
Net finance costs
EBITDA interest cover (debt covenants)EBITDA (debt covenants)
Net finance costs (debt covenants)
Gross gearingLoans, borrowings and overdrafts
Total equity
Net gearingNet debt
Total equity
Productivity per employeeEBITDA
Employee numbers used for calculations
Employment cost per employeeEmployee benefit expense
Employee numbers used for calculations
Earnings yieldHeadline earnings per share
Year-end market price per share
Dividends/cash distributions yieldDividends/cash distributions per ordinary share
Year-end market price per share
Price/earnings ratioYear-end market price per share
Headline earnings per share
STRATEGIC PERFORMANCE ] Nampak Limited Integrated Report 2017
47
HOW WE CREATE VALUE
STRATEGIC CONTEXT
STRATEGIC PERFORMANCE
GOVERNANCE AND REMUNERATION
SHAREHOLDER INFORMATIONWHO WE ARE

Five-year financial review continued
2017 2016 2015 2014 2013
STATISTICSEarnings and dividend dataWeighted number of ordinary shares in issue ‘000 640 496 632 667 629 726 627 728 624 921Headline earnings per share cents 123.8 107.6 182.1 234.7 205.3
Continuing operations cents 123.8 107.6 208.2 221.9 141.4Discontinued operations cents – – (26.1) 12.8 63.9Change over previous year (continuing operations) % 15 (48) (6) 57 (12)
Earnings per share cents 36.6 254.5 165.6 186.3 207.2Continuing operations cents 36.6 254.5 228.3 221.7 156.4Discontinued operations cents – – (62.7) (35.4) 50.8Change over previous year (continuing operations) % (86) 11 3 42 (5)
Dividends declared/cash distributions per share cents – – 134.0 153.0 140.0Change over previous year % – (100) (12) 9 8 Five-year compound annual growth rate % – – (4) (12) (21)
Dividend cover/cash distribution times – – 1.5 1.5 1.5
FINANCIAL DATAReturn on equity
Continuing operations % 2.5 17.9 19.1 23.6 19.6 Continuing and discontinued operations % 2.5 17.9 12.5 15.4 19.8
Return on net assetsContinuing operations % 12.3 11.2 10.7 16.7 16.6 Continuing and discontinued operations % 12.3 11.2 11.0 14.8 18.4
Net asset turnContinuing operations times 1.2 1.1 1.1 1.3 1.8 Continuing and discontinued operations times 1.2 1.1 1.2 1.5 1.9
Return on invested capital % 10.1 9.2 9.0 12.2 16.0 Current ratio times 1.3 1.4 1.0 1.2 1.7Current ratio (including non-current portion of liquid bonds) times 1.5 1.5 1.0 1.2 1.7 Acid test ratio times 0.8 0.8 0.6 0.7 1.2Acid test ratio (including non-current portion of current liquid bonds) times 1.0 0.9 0.6 0.7 1.2 EBITDA interest cover times 6.3 7.1 9.3 8.3 13.3 EBITDA interest cover – debt covenants times 7.2 5.4 9.7 7.3 10.0 Effective rate of tax
Continuing operations % 37.5 11.9 (4.1) 9.1 25.9 Continuing and discontinued operations % 37.5 11.9 (21.5) 4.1 21.4
Net debt 4 351.8 4 625.3 6 582.1 5 721.5 1 155.6Gross gearing % 90.7 79.7 90.8 89.8 80.0 Net gearing % 45.0 49.0 71.8 72.6 16.1 Net debt to EBITDA – debt covenants times 1.6 1.7 2.3 2.2 0.6 Net debt to EBITDA – debt covenants (excluding liquid bonds) times 2.3 1.9 2.3 2.2 0.6Number of ordinary shares in issue* ‘000 640 620 639 884 630 057 628 267 625 457Net asset value per ordinary share cents 1 454 1 438 1 456 1 255 1 150Change over previous year % 1 (1) 16 9 25 * Net of treasury shares.
EMPLOYEE DATAPermanent employees 6 420 6678 6 663 9 269 9 965Temporary employees 1 706 1422 1 328 1 851 1 734Total employees 8 126 8 100 7 991 11 120 11 699Employee numbers used for calculations 8 126 8 100 7 945 7 543 7 411Revenue per employee R’000 2 316 2 363 2 176 2 029 1 834 Employment cost per employee R’000 380 386 353 333 311 Productivity per employee index 23 38 25 21 22
OPERATING RESULTS R millionContinuing operationsRevenue 18 821.7 19 138.9 17 291.3 15 305.6 13 594.5 Trading profit 1 966.8 1 905.1 1 839.6 1 867.7 1 688.1 Profit after tax from continuing operations 356.0 1 478.3 1 456.1 1 426.0 957.6 Discontinued operations(Loss)/profit from discontinued operations – – (394.8) (222.4) 318.0 Profit for the year 356.0 1 478.3 1 061.3 1 203.6 1 275.6
Nampak Limited Integrated Report 2017
48

2017 2016 2015 2014 2013
Attributable to: R millionEquity holders of Nampak Ltd 234.8 1 610.4 1 043.2 1 169.4 1 295.0Non-controlling interests 121.2 (132.1) 18.1 34.2 (19.4)
356.0 1 478.3 1 061.3 1 203.6 1 275.6EBITDA 1 792.4 3 074.5 1 989.4 2 378.3 2 563.7
Continuing operations 1 792.4 3 074.5 2 483.7 2 538.0 2 352.3Discontinued operations – – (494.3) (159.7) 211.4
EBITDA (adjusted for impairments) 2 460.2 3 434.9 2 188.5 2 809.7 2 680.0Continuing operations 2 460.2 3 434.9 2 605.1 2 575.2 2 474.5Discontinued operations – – (416.6) 234.5 205.5
STATEMENTS OF FINANCIAL POSITION R millionTotal shareholders’ funds 9 681.1 9 444.5 9 172.4 7 883.1 7 190.6 Retirement benefit obligation 1 558.0 1 855.7 2 008.4 2 173.0 2 193.1 Deferred tax and other non-current liabilities 359.3 267.1 390.8 503.5 811.5 Non-current loans and borrowings 6 007.2 6 202.1 4 212.0 4 753.3 3 249.5 Current liabilities 7 624.3 6 334.4 8 623.9 6 578.2 6 179.2
Total equity and liabilities 25 229.9 24 103.8 24 407.5 21 891.1 19 623.9 Property, plant and equipment 10 151.4 10 573.4 11 025.7 9 864.3 7 835.3 Intangible assets 3 568.8 4 043.4 4 118.6 3 419.5 814.5 Other non-current financial assets and deferred tax 1 235.1 772.2 222.4 414.0 455.7 Current assets 10 274.6 8 714.8 9 040.8 8 193.3 10 518.4
Total assets 25 229.9 24 103.8 24 407.5 21 891.1 19 623.9
CASH FLOW R millionCash generated from operations before working capital changes 2 395.1 2 264.0 2 395.1 2 929.2 2 687.1Cash generated from operations 2 068.3 2 825.3 1 726.5 2 740.1 2 484.1Cash generated from/(utilised in) operating activities 1 390.6 1 366.1 (1 457.8) 419.5 (103.4)Additions to property, plant, equipment and intangibles (735.3) (1 443.6) (2 195.2) (2 620.1) (1 447.2)Net (decrease)/increase in cash (1 419.0) 3 545.0 (1 535.2) (3 653.1) 1 944.9
SHARE PERFORMANCEMarket price per share
Highest cents 2 361 2 820 4 885 4 154 3 780Lowest cents 1 551 1 635 2 572 4 001 2 809Year-end cents 1 760 1 944 2 580 4 113 3 121
Number of ordinary shares in issue ‘000 689 404 688 668 702 497 700 708 697 897Market capitalisation R million 12 134 13 388 18 124 28 820 21 781Volume of shares traded ‘000 539 937 523 826 437 360 388 869 496 327Value of shares traded R million 9 814.4 9 520.0 13 055.2 24 525.0 16 082.8Volume of shares traded as a percentage of total issued shares % 78.3 76.1 62.3 55.5 71.1Earnings yield % 7.0 5.5 7.1 5.7 6.6Dividend/cash distribution yield % – – 5.2 3.7 4.5 Price/earnings ratio times 14.2 18.1 14.2 17.5 15.2
EXCHANGE RATESRand/UK pound
Average 16.96 21.07 18.56 17.54 14.49Closing 18.17 17.80 20.97 18.33 16.25
Rand/euroAverage 14.78 16.43 13.77 14.36 12.19Closing 15.98 15.42 15.50 14.27 13.59
Rand/US dollarAverage 13.38 14.79 12.02 10.58 9.28Closing 13.56 13.72 13.86 11.30 10.05
Naira/US dollarAverage 321.90 229.60 191.21 161.77 158.75Closing 358.99 315.00 199.00 163.70 161.77
Kwanza/US dollarAverage 171.74 161.57 114.52 100.76 96.33Closing 171.75 171.72 140.06 101.21 100.56
STRATEGIC PERFORMANCE ] Nampak Limited Integrated Report 2017
49
HOW WE CREATE VALUE
STRATEGIC CONTEXT
STRATEGIC PERFORMANCE
GOVERNANCE AND REMUNERATION
SHAREHOLDER INFORMATIONWHO WE ARE

Summarised consolidated statement of comprehensive incomefor the year ended 30 September 2017
Notes2017
R million2016
R million
Revenue 18 821.7 19 138.9Operating profit 3 961.0 2 162.8Finance costs (508.8) (527.5)Finance income 117.7 42.0Share of net profit from associates and joint ventures 0.1 0.1
Profit before tax 570.0 1 677.4Income tax expense (214.0) (199.1)
Profit for the year 356.0 1 478.3Other comprehensive income/(expense), net of taxItems that will not be reclassified to profit or lossNet actuarial gain/(loss) from retirement benefit obligations 19.5 (491.0)Items that may be reclassified subsequently to profit or lossExchange difference on translation of foreign operations 11 (122.1) (509.4)Loss on cash flow hedges (14.1) (34.3)
Other comprehensive expense for the year, net of tax (116.7) (1 034.7)
Total comprehensive income for the year 239.3 443.6
Profit/(loss) attributable to:Owners of Nampak Ltd 234.8 1 610.4Non-controlling interest in subsidiaries 121.2 (132.1)
Total 356.0 1 478.3
Total comprehensive income/(expense) attributable to:Owners of Nampak Ltd 120.3 572.6Non-controlling interest in subsidiaries 119.0 (129.0)
Total 239.3 443.6
Basic earnings per share (cents) 36.6 254.5Diluted basic earnings per share (cents) 36.5 253.9
Nampak Limited Integrated Report 2017
50

Summarised consolidated statement of financial position
at 30 September 2017
Notes2017
R million
Restated2016
R million
ASSETSNon-current assetsProperty, plant, equipment and investment property 10 151.4 10 573.4Goodwill and other intangible assets 3 568.8 4 043.4Joint ventures, associates and other investments 21.8 27.7Deferred tax assets 49.3 70.6Liquid bonds and other loan receivables* 6 1 164.0 673.9
14 955.3 15 389.0Current assetsInventories 3 980.3 3 376.7Trade receivables and other current assets* 3 009.9 3 101.2Tax assets 17.3 11.2Liquid bonds and other loan receivables – current* 6 882.1 7.8Bank balances and deposits* 2 385.0 2 217.9
10 274.6 8 714.8
Total assets 25 229.9 24 103.8
EQUITY AND LIABILITIESCapital and reservesShare capital 35.5 35.4Capital reserves (116.4) (121.4)Other reserves (84.4) 51.0Retained earnings 9 476.9 9 238.5
Shareholders’ equity 9 311.6 9 203.5Non-controlling interest 369.5 241.0
Total equity 9 681.1 9 444.5Non-current liabilitiesLoans and other borrowings 6 007.2 6 202.1Retirement benefit obligation 1 558.0 1 855.7Deferred tax liabilities 294.5 230.1Other non-current liabilities 64.8 37.0
7 924.5 8 324.9Current liabilitiesTrade payables, provisions and other current liabilities 4 766.0 4 937.7Tax liabilities 82.6 73.9Loans and other borrowings – current 221.9 329.4Bank overdrafts 2 553.8 993.4
7 624.3 6 334.4
Total equity and liabilities 25 229.9 24 103.8
* During the year, the US dollar indexed kwanza bonds (described as “liquid bonds”) were reclassified from cash equivalents to loan receivables after a reassessment of their nature in terms of IAS 7: Statement of Cash flows. As a result of this reclassification, these bonds (amounting to R617.5 million and being all non-current) were removed from “bank balances, deposits and cash equivalents” where they had been presented in the prior year and presented together with other non-current loan receivables (previously described as “other non-current assets”) as “liquid bonds and other loan receivables”. In addition, the current portion of loan receivables, which was previously presented as part of “trade receivables and other current assets” has now been separately presented as “liquid bonds and other loan receivables – current” due to a portion of the liquid bonds being current at the end of the current year.
STRATEGIC PERFORMANCE ] Nampak Limited Integrated Report 2017
51
HOW WE CREATE VALUE
STRATEGIC CONTEXT
STRATEGIC PERFORMANCE
GOVERNANCE AND REMUNERATION
SHAREHOLDER INFORMATIONWHO WE ARE

Summarised consolidated statement of changes in equityfor the year ended 30 September 2017
Note2017
R million2016
R million
Opening balance 9 444.5 9 172.4Net shares issued during the year 11.8 28.9Share-based payment expense 5.0 13.9Share grants exercised (11.7) (28.8)Share of movement in associate’s and joint venture’s non-distributable reserves – 0.9Shares repurchased and cancelled – (0.8)Treasury shares disposed – 384.2Acquisition of business 4.1 (7.7) –Total comprehensive income for the year 239.3 443.6Dividends paid (0.1) (569.8)
Closing balance 9 681.1 9 444.5
Comprising:Share capital 35.5 35.4Capital reserves (116.4) (121.4)
Share premium 262.4 250.7Treasury shares (557.9) (557.9)Share-based payments reserve 179.1 185.8
Other reserves (84.4) 51.0Foreign currency translation reserve 1 375.0 1 494.9Financial instruments hedging reserve 4.7 18.8Recognised actuarial losses (1 447.1) (1 466.6)Share of non-distributable reserves in associates and joint ventures – 3.7Other (17.0) 0.2
Retained earnings 9 476.9 9 238.5
Shareholders’ equity 9 311.6 9 203.5Non-controlling interest 369.5 241.0
Total equity 9 681.1 9 444.5
Nampak Limited Integrated Report 2017
52

Summarised consolidated statement of cash flows
for the year ended 30 September 2017
Notes2017
R million
Restated2016
R million
Cash generated from operations before working capital changes 2 395.1 2 264.0Working capital changes (326.8) 561.3
Cash generated from operations 2 068.3 2 825.3Net interest paid (405.8) (521.4)Retirement benefits, contributions and settlements (119.1) (161.0)Income tax paid (152.7) (201.3)
Cash flows from operations 1 390.7 1 941.6Dividends paid (0.1) (575.5)
Net cash generated from operating activities 1 390.6 1 366.1
Capital expenditure (735.3) (1 443.6)Replacement1 (377.0) (479.3)Expansion (358.3) (964.3)
Net proceeds on the disposal of business 4.2 57.8 –Net proceeds from sale and leaseback transaction – 1 701.1Post-retirement medical aid buy-out 4.3 (569.2) –Increase in liquid bonds for hedging purposes2 (1 336.5) (617.5)Other investing activities 12.0 158.2
Net cash utilised in investing activities (2 571.2) (201.8)
Net cash (utilised)/generated before financing activities (1 180.6) 1 164.3Net cash (repaid in)/raised from financing activities (238.4) 2 380.7
Net (decrease)/increase in cash and cash equivalents (1 419.0) 3 545.0Net cash and cash equivalents/(overdraft) at beginning of year 1 224.5 (2 084.9)Translation of cash in foreign subsidiaries 25.7 (235.6)
Net (overdraft)/cash and cash equivalents at end of year 7 (168.8) 1 224.51 Following the JSE’s proactive monitoring process, the replacement capital expenditure cash flow has been reclassified from “cash flow from operations” to “cash
flows from investing activities” and the comparatives restated. The result of this reclassification is an increase in cash generated from operating activities of R475.7 million in the prior year and a decrease in cash generated from investing activities of R475.7 million in the prior year. In addition, capital expenditure relating to intangible assets (R16.2 million) in the prior year has been removed from “other investing activities” and presented together with capital expenditure relating to tangible assets being classified accordingly as replacement expenditure (R3.6 million) and expansion expenditure (R12.6 million) respectively.
2 As indicated on the summarised consolidated statement of financial position, US dollar indexed Angolan kwanza bonds were reclassified from cash equivalents to loan receivables after a reassessment of their nature in terms of IAS 7: Statement of Cash Flows. As a result of this reclassification, the movement in these assets is now presented as investing activities.
STRATEGIC PERFORMANCE ] Nampak Limited Integrated Report 2017
53
HOW WE CREATE VALUE
STRATEGIC CONTEXT
STRATEGIC PERFORMANCE
GOVERNANCE AND REMUNERATION
SHAREHOLDER INFORMATIONWHO WE ARE

Notes to the summarised consolidated financial statementsfor the year ended 30 September 2017
1. BASIS OF PREPARATIONThe summarised consolidated financial statements are derived from the consolidated financial statements, approved by the directors on 28 November 2017. They are prepared in accordance with the requirements of the JSE Limited Listings Requirements for preliminary reports, and the requirements of the Companies Act of South Africa applicable to summarised consolidated financial statements. The Listings Requirements require preliminary reports to be prepared in accordance with the framework concepts and the measurement and recognition requirements of International Financial Reporting Standards (IFRS), the SAICA Financial Reporting Guides as issued by the Accounting Practices Committee and the Financial Pronouncements as issued by the Financial Reporting Standards Council, and to also, as a minimum, contain the information required by IAS 34: Interim Financial Reporting.
The consolidated financial statements and the summarised consolidated financial statements have been prepared under the supervision of the chief financial officer, GR Fullerton CA(SA).
2. ACCOUNTING POLICIES AND RESTATED COMPARATIVESThe accounting policies applied in the preparation of the consolidated financial statements for 2017, from which the summarised consolidated financial statements were derived, are in terms of IFRS and are consistent with the accounting policies adopted and methods of computation used in the preparation of the previous year’s consolidated financial statements except for the useful lives applied to property, plant and equipment at several of the group’s operations as indicated below.
Change in accounting estimateDuring the year, the group reassessed the useful lives of its property, plant and equipment as required by IAS 16. The useful lives of the assets were extended as the adjusted useful lives reflect more appropriately the pattern of the consumption of the future economic benefits embodied in the assets concerned. In accordance with IAS 16: Property, Plant and Equipment, this represents a change in an accounting estimate and is therefore applied prospectively in terms of IAS 8: Accounting Policies, Changes in Accounting Estimates and Errors. The impact of the change in useful lives for the year ended 30 September 2017 is a decrease in the depreciation expense of R52.4 million with a similar amount expected to be incurred annually in the future.
3. INCLUDED IN OPERATING PROFIT ARE:
2017R million
2016R million
Depreciation 799.0 863.1 Amortisation 32.4 48.6 Reconciliation of operating profit and trading profit1
Operating profit 961.0 2 162.8 Profit on disposal of property subject to sale and leaseback – (1 318.9)
Operating profit – adjusted 961.0 843.9Net abnormal losses2 – excluding profit on disposal of property subject to sale and leaseback 1 005.8 1 061.2
Net impairment losses on property, plant, equipment, goodwill, intangible assets, investments and shareholder loans 667.8 360.4Devaluation loss arising from Angolan and Nigerian exchange rate movements 160.0 681.0Onerous contract and related losses 81.8 –Production losses due to electrical supply and fire 79.2 –Retrenchment and restructuring costs 73.1 34.1Profit on disposal of other property (3.0) (15.2)Net profit on disposal of investments and businesses (25.4) (3.5)Gain on acquisition of business (27.0) –Other (0.7) 4.4
Trading profit 1 966.8 1 905.11 Trading profit is the main measure of profitability used for segmental reporting purposes.2 Abnormal losses/(gains) are defined as losses/(gains) which do not arise from normal trading activities or are of such size, nature or incidence that their disclosure is relevant to explain the performance for the year.
Nampak Limited Integrated Report 2017
54

4. CORPORATE ACTIVITY4.1 DivFood Botswana
The group acquired a 74% interest in Nampak DivFood Botswana (Pty) Ltd (DB) for strategic purposes effective 2 February 2017 on its incorporation for a nominal consideration. The Botswana Development Corporation (BDC), being the holder of the remaining interest in this entity, transferred plant and equipment to the value of R36.5 million to this entity on its incorporation resulting in a consolidated gain on acquisition of R27.0 million.
As part of this transaction, BDC has a put option to sell its 26% interest in DB to the group at the end of a period of five years from the effective date of acquisition. This option has been valued at R17.2 million and is presented on the statement of financial position as part of “other non-current liabilities”.
4.2 Operations located at customersThe group disposed of its operations at two sites in the United Kingdom of a customer of Nampak Plastics Europe Ltd, on termination of the respective contracts. Plant, equipment and net working capital with a carrying value of R26.4 million was disposed of for a net consideration of R57.8 million resulting in a profit on disposal of these operations of R31.4 million.
4.3 Post-retirement medical aid buy-outDuring the 2016 financial year, the group offered a specific group of 1 285 continuation members, out of the total continuation members who receive a monthly medical scheme contribution subsidy, the option of converting the monthly subsidy into an annuity secured in the pensioner’s individual name.
A total of 697 (54%) of these continuation members accepted this offer. The total settlements paid to these continuation members during the current financial year was R569.2 million, of which R406.4 million was accrued at 30 September 2016.
R436.0 million of the settlements paid was funded using 25% of the gross proceeds from the sale and leaseback transaction in 2016 with the balance of R133.2 million funded from current year cash generation.
4.4 Group Risk Holdings The group terminated its membership in the Mutual Risk Group (MRG) with effect from 1 September 2017 due to competitiveness in the insurance market. Nampak Ltd disposed of its interest in Group Risk Holdings (Pty) Ltd (the holding company of MRG) for no consideration, resulting in a loss on disposal of R6.0 million.
5. DETERMINATION OF HEADLINE EARNINGS
2017R million
2016R million
Profit attributable to equity holders of the company for the year 234.8 1 610.4 Less: Preference dividend (0.1) (0.1)
Basic earnings 234.7 1 610.3 Adjusted for:
Net impairment losses on property, plant, equipment, goodwill, intangible assets and investments 667.8 360.8 Net profit on disposal of investments and businesses (25.4) (3.5)Gain on acquisition of business (27.0) – Profit on disposal of property subject to sale and leaseback – (1 318.9)Net (profit)/loss on disposal of other property, plant, equipment and intangible assets (7.4) 6.8 Tax effects and non-controlling interests (49.9) 25.4
Headline earnings for the year 792.8 680.9
Headline earnings per share (cents) 123.8 107.6Diluted headline earnings per share (cents) 123.4 107.3
STRATEGIC PERFORMANCE ] Nampak Limited Integrated Report 2017
55
HOW WE CREATE VALUE
STRATEGIC CONTEXT
STRATEGIC PERFORMANCE
GOVERNANCE AND REMUNERATION
SHAREHOLDER INFORMATIONWHO WE ARE

Notes to the summarised consolidated financial statements continued
for the year ended 30 September 2017
2017R million
2016R million
6. LIQUID BONDS AND OTHER LOAN RECEIVABLESLiquid bonds1 1 954.0 617.5Equipment sales receivables2 68.7 62.3 Other loans and receivables 23.4 1.9
Total liquid bonds and other loan receivables 2 046.1 681.7Less: Amounts receivable within one year reflected as current 882.1 7.8
Liquid bonds 867.0 –Equipment sales receivables 10.7 7.1Other loan receivables 4.4 0.7
Net non-current liquid bonds and other loan receivables 1 164.0 673.91 Liquid bonds relate to US dollar indexed Angolan kwanza bonds. As at 30 September the Angolan kwanza equivalent of US$144.1 million
(2016: US$45.0 million) had been hedged through these bonds in order to protect the group against further Angolan kwanza devaluation. Interest rates charged are between 5.0% to 7.8%.
2 Equipment sales receivables are repayable from 2018 to 2025. Interest rates charged are between 5.8% to 14.0%.
2017R million
2016R million
7. NET (OVERDRAFT)/CASH AND CASH EQUIVALENTS AT END OF YEARBank balances and deposits 2 385.0 2 217.9Bank overdrafts (2 553.8) (993.4)
Total (168.8) 1 224.5
2017R million
2016R million
8. CARRYING AMOUNT OF FINANCIAL INSTRUMENTSThe carrying amounts of financial instruments as presented on the statement of financial position are measured as follows:At fair value – level 2Financial assets
Derivative financial assets1 19.1 –Financial liabilities
Derivative financial liabilities1 22.6 40.7At amortised costFinancial assets 7 266.6 5 789.7
Non-current liquid bonds and other loan receivables 1 164.0 673.9Trade receivables and other current assets2 2 835.5 2 890.1Current liquid bonds and other loan receivables 882.1 7.8Bank balances and deposits 2 385.0 2 217.9
Financial liabilities 13 166.7 12 152.9Non-current loans and other borrowings 6 007.2 6 202.1Trade payables and other current liabilities3 4 383.8 4 628.0Current loans and other borrowings 221.9 329.4Bank overdrafts 2 553.8 993.4
1 Derivative financial assets and liabilities consist of forward exchange contracts and commodity futures. Their fair values are determined using the contract exchange rate at their measurement date, with the resulting value discounted back to the present value.
2 Excludes derivative financial assets (disclosed separately) and prepayments.3 Excludes derivative financial liabilities (disclosed separately) and provisions.
Nampak Limited Integrated Report 2017
56

2017R million
2016R million
9. CAPITAL EXPENDITURE, COMMITMENTS AND CONTINGENT LIABILITIESCapital expenditure 735.3 1 443.6
Replacement 377.0 479.3Expansion 358.3 964.3
Capital commitments 589.9 454.4 Contracted 256.4 276.3 Approved not contracted 333.5 178.1
Lease commitments (including sale and leaseback transaction) 3 585.5 3 759.5 Land and buildings 3 542.6 3 732.2 Other 42.9 27.3
Contingent liabilities 6.8 83.6 Customer claims and guarantees 6.8 6.7 Tax contingent liabilities – 76.9
10. SHARE STATISTICSOrdinary shares in issue (‘000) 689 404 688 668 Ordinary shares in issue – net of treasury shares (‘000) 640 620 639 884 Weighted average number of ordinary shares on which basic earnings and headline earnings per share are based (‘000) 640 496 632 667 Weighted average number of ordinary shares on which diluted basic earnings and diluted headline earnings per share are based (’000) 642 630 634 335
11. RELATED PARTY TRANSACTIONSGroup companies, in the ordinary course of business, entered into various purchase and sale transactions with associates, joint ventures and other related parties. The effect of these transactions is included in the financial performance and results of the group.
12. SUBSEQUENT EVENTSThere have been no subsequent events from the reporting date to the date of the consolidated financial statements.
13. INDEPENDENT AUDITOR’S OPINIONThe auditors, Deloitte & Touche, have issued their opinion on the consolidated financial statements for the year ended 30 September 2017, as well as, these summarised consolidated financial statements. The audit was conducted in accordance with International Standards on Auditing. They have issued an unmodified audit opinion. These summarised consolidated financial statements have been derived from the consolidated financial statements and are consistent in all material respects with these consolidated financial statements. Copies of their audit report on the consolidated financial statements and on these summarised consolidated statements, together with the accompanying financial statements are available for inspection at the company’s registered office.
STRATEGIC PERFORMANCE ] Nampak Limited Integrated Report 2017
57
HOW WE CREATE VALUE
STRATEGIC CONTEXT
STRATEGIC PERFORMANCE
GOVERNANCE AND REMUNERATION
SHAREHOLDER INFORMATIONWHO WE ARE

Operational review – Metals
Bevcan is the largest manufacturer of beverage cans in Africa. We have production facilities in South Africa, Angola and Nigeria. Our cans represent the majority of the South African and Angolan markets and about 40% of the market in Nigeria.
Operating from five sites in South Africa and one in Botswana, DivFood manufactures two- and three-piece tinplate food cans, and a number of diversified tinplate cans. We hold strong market positions and are the only producer of two-piece tinplate cans and aluminium monobloc aerosol cans in South Africa. Some 64% of our sales go to the food industry. Outside the food sector, our major product categories are tinplate aerosol cans, monobloc aerosols and paint and polish cans.
Key developments » Reported strong improvement in safety performance, ahead of group tolerance level
» Participated in establishment of MetPac-SA to promote recycling of metal packaging
» Bevcan South Africa benefited from volume growth, additional can ends production and efficiency gains
» Bevcan Angola performed exceptionally, but faced difficulties in repatriating cash
» DivFood’s financial performance was challenged by poor demand
Erik SmutsGroup executive: Bevcan
Christiaan BurmeisterGroup executive: DivFood
METALS60
65
70
75
Metals packaging collected for recycling in South Africa (%)
75
70
65
60
2012 2013 2014 20162015
2017 2016 % change
Key natural capital inputsEnergy use (GJ) 1 527 722 1 543 075 (1.0)Outputs affecting natural capitalEmissions intensity (tCO2e/Rm revenue) 16.01 18.37 (12.8)Financial capitalRevenue (Rm) 11 281 10 510 7.3Trading profit (Rm) 1 695 1 285 31.9Trading margin (%) 15.0 12.2 –Human capitalEmployees 3 074 3 314 (7.2)LTIFR 0.180 0.407 Improved
Source: Packaging SA
Nampak Limited Integrated Report 2017
58

SOUTH AFRICA BevcanA 2.8% increase in sales volumes, the first full year of production of our expanded can ends plant, and efficiency gains across the board supported a strong overall performance for Bevcan South Africa in 2017, in pursuit of the group’s objective to deliver advanced manufacturing.
We continued to benefit from the recent recapitalisation of our facilities, as well as from our operations excellence initiative targeting improvements in efficiencies, safety, people development, supply chain management and planning, as well as in our brand and marketing. We reduced spoilage levels and reported a world-class safety performance, reaching two million lost-time injury-free manhours in our Springs factory at the end of September. This represents delivery on the strategic imperatives to invest to compete as well as to improve business performance by buying, making and selling better. Trading profit increased sharply.
After a weak first half of the financial year, we experienced good growth in the second half, when demand for can packaging for beer, cider and energy drinks was robust. The pack share of beverage cans in the market increased relative to other packaging formats. Beer continued to migrate to value packs (440ml and 500ml) and we witnessed a migration towards more value brands amid straitened economic conditions. Demand for energy drinks continued to grow at rates in excess of general market trends.
By year-end, the bigger packs (440ml and 500ml), which consumers consider better value for money, accounted for more than half of Bevcan’s total can size volumes produced. This compared to just 10% in 2010. The standard 330ml can – representing three-quarters of our overall can size offering in 2010 – made up only about a third of our offering by year-end.
Our expanded can ends plant in Springs, which added two billion ends per annum to the existing manufacturing facility, performed in line with expectations, with the new volumes destined primarily for our can manufacturing businesses in Angola and Nigeria.
In December 2016, in line with the strategic imperatives to manage costs stringently and to actively manage our portfolio, we closed our tinplate can line in Durban. As far as possible, we worked to redeploy skills from this facility to other Bevcan operations. The line’s closure led to a saving in our 2017 financial year of approximately R23 million, a figure that is forecast to rise to R30 million in the years ahead.
We maintained world-class operating systems at our facilities, retaining certification under the relevant ISO quality, food safety and environmental standards.
In the year, Nampak R&D trialled and qualified three new aluminium can body stock suppliers. This was to mitigate the risk of dependence on limited suppliers and allow for a continuous supply of raw materials. Nampak R&D also started qualifying suppliers of pre-coated can end stock, and continued its development work on BPA-NI (Bisphenol-A not intentionally added) coating systems (see page 19 ).
In response to new regulatory requirements, in the year both Bevcan and DivFood participated in the establishment of independent industry body MetPac-SA which will promote and assist with the recycling of metal packaging.
DivFoodIn a weak economy, DivFood had a challenging year, with revenue and profitability led lower by constrained demand for our products across many categories. However, we improved our operational performance and made good progress on the delivery of Nampak’s strategy.
Focused on the strategic imperative to improve business performance by buying, making and selling better, we continued to optimise profitability on both a customer and product basis, rationalising our product offering and customer base, while looking to grow specific product categories such as two-piece cans. To ensure that we achieved appropriate levels of profitability, we optimised run sizes and running campaigns, where appropriate.
STRATEGIC PERFORMANCE ] Nampak Limited Integrated Report 2017
59
HOW WE CREATE VALUE
STRATEGIC CONTEXT
STRATEGIC PERFORMANCE
GOVERNANCE AND REMUNERATION
SHAREHOLDER INFORMATIONWHO WE ARE

Operational review – Metals continued
We continued to focus on safety, reporting further improvements in our overall performance ahead of group targets. In response to weaker demand, we reduced employee numbers by 50.
In May, we introduced a new sales and operations planning system, providing significant benefits in terms of inventory management, in turn supporting delivery on the strategic imperative to manage working capital prudently.
One of Nampak’s risks is dependence on limited suppliers. The only tinplate supplier in South Africa is under significant financial and operational pressure and has instituted general and safeguard duties on all flat steel products except tinplate. Local tinplate volumes continue to decline and the viability of the long-term supply of tinplate is questionable. To mitigate this risk, in the year we established a more reliable supply of good quality raw materials, including an imported supply of tinplate.
In line with our strategic imperative to invest to compete, we continued with the recapitalisation of the business, making it more efficient. Among our most significant capital projects was the installation of a R67 million multi-deck printer for our facility in Mobeni to support products destined for the paint and polish markets. It led to the reduction by more than half in the number of lines in the printing and coating department, thereby realising numerous maintenance, energy and employee cost savings. We also upgraded a large format can assembly line in Paarl at a cost of R35 million, reaping significant light weighting benefits.
We acquired two can assembly lines from an operation in Botswana: one is being installed in Paarl in South Africa, while the other is destined for Nampak in Nigeria. As part of this transaction, we entered into a joint venture with the Botswana Development Corporation to produce can ends in Lobatse, Botswana.
With the South African consumer under increasing pressure in a weak economy, demand for our customers’ products declined, leading to lower DivFood volumes across many product categories. This was particularly evident in discretionary spending items such as paint (down as much as 20%), as consumers postponed home renovations; personal care items such as premium anti-perspirants sold in monobloc aerosol cans;
as well as higher-priced canned fish, as consumers traded down to lower-priced sources of protein. Volumes of cans for baked beans in tomato sauce – the largest of our canned vegetable categories – remained stable.
A sharp reduction in the allowable fish catch quota in both South Africa and Namibia, as well as a lower landed catch and slow imports of frozen fish, led to lower sales of fish cans in the year. The canned meat category continued to grow at rates in excess of GDP, while sales in the canned fruit category were negatively influenced by the weaker agricultural harvest and the strong exchange rate.
Nampak R&D continued to play an important role in supporting DivFood. It trialled, evaluated and approved new tinplate grade materials that have improved ageing characteristics because of changes made to the chemical composition of the alloy. Nampak R&D’s close developmental work with suppliers led to the reduction of edge trimming of tinplate coil, resulting in less waste and lower input costs. It also identified, trialled and evaluated the use of soft ultra-low-carbon steel in the production of paint pails. The flexible steel allows us to follow a more consistent manufacturing process when producing paint pails.
Nampak R&D also continued with its work over many years to develop internal lacquers that are BPA-NI compliant, which means we are well prepared to comply with new European standards when they come into force.
We continued to focus on building the stocks of intellectual capital by developing technical skills. In the year, DivFood had 78 apprentices in training and 11 new graduates on the payroll. Our plants remained certified under the relevant ISO environmental, quality and food safety standards.
Looking aheadThe recent entrance of a competitor in the South African beverage can sector will likely lead to the loss of some of Bevcan’s volumes in the new year, particularly as a contract with a large customer comes to an end in March 2018. The start of the long-mooted competition will provide us with an opportunity to rationalise underutilised assets in line with our strategic imperative to actively manage our portfolio. It will also give customers a realistic reference point in terms of price and service levels: our well-established, cost-competitive manufacturing footprint and strong market position place Bevcan in the best possible position to defend market share and leverage opportunities.
Nampak Limited Integrated Report 2017
60

We will continue work to grow the market for beverage cans through our dynamic “Can DO!” marketing campaign. In particular, we see room for growth in the pack share of the carbonated soft drinks market as consumer preference for more environmentally sound packaging – such as aluminium – grows. Aluminium is infinitely recyclable: by using recycled material, aluminium producers use just 5% of the energy required to produce virgin aluminium.
We will continue to monitor developments in the policy environment, including the proposed tax on sugar-sweetened beverages which, if implemented, is likely to lead to different pack configurations to hold price points at current levels. This, in turn, will lead to greater production complexity.
Amid forecasts of continued sluggish economic activity, at DivFood we expect the South African market to remain challenging in the new financial year. We see room to grow in the market for two-piece cans, currently our single biggest product, as well as opportunity to supply more pails to the water-based paint sector. In 2018, the fruit canning business will likely feel the impact on harvests of the drought in the Western Cape.
Despite the weak economic outlook, we will continue to extract value from the investments made in recent years, optimising our state-of-the-art equipment and ensuring that we realise benefits relating to energy consumption and productivity. We will accelerate our efforts to improve our cost competitiveness, and continue to advance our planning capabilities to optimise our inventories and provide excellent customer service at a lower cost.
REST OF AFRICABevcanDelivering on our strategic objective to accelerate growth in the Rest of Africa, in the year Bevcan increased profitability in Angola and grew market share in Nigeria. The start in April 2017 of the Nigerian Autonomous Foreign Exchange (NAFEX) market led to improved liquidity and improved cash repatriation from Nigeria. However, in Angola we continued to face difficulties in repatriating cash.
In Nigeria we changed our accounting practices to use the NAFEX rate, resulting in a foreign exchange loss of R116 million. To mitigate the risk of dependence on foreign exchange liquidity and currency movements, we continued to apply US dollar hedge strategies in Angola, with active cash repatriation and hedged structures in place. Limited forex availability is a material issue for Nampak, and is discussed in detail on pages 30 and 31 .
In Angola, Bevcan lifted sales as the first full year of a contract to supply a large local customer (previously reliant on imported beverage cans) supported our production volumes. Another customer reversed an earlier decision to move most of its packaging to glass, choosing instead to package in cans, exporting some of this product to neighbouring territories to earn foreign exchange. We also supplied a number of smaller local beverage producers as a forex shortage led to the substitution of alternative packaging imports.
In the past five years, Bevcan volumes in Angola have more than doubled.
In Nigeria, we increased our estimated market share to 40% from 35% a year earlier. However, the overall market for beverage cans declined, impacted by a weak economy, a shortage of foreign exchange and as some non-alcoholic malt drinks moved to relatively cheaper PET packaging.
In both Angola and Nigeria, we retained certification under the relevant ISO quality and food safety standards and environmental management systems.
Other metal packagingOur general metal packaging business in the Rest of Africa increased its trading profit in the year, lifted by a strong performance in Nigeria.
Demand for our range of diversified cans and aerosols from the Nigerian food, household, industrial, personal care and paint markets was strong, because of the substitution of imported products with locally manufactured products.
STRATEGIC PERFORMANCE ] Nampak Limited Integrated Report 2017
61
HOW WE CREATE VALUE
STRATEGIC CONTEXT
STRATEGIC PERFORMANCE
GOVERNANCE AND REMUNERATION
SHAREHOLDER INFORMATIONWHO WE ARE

In Kenya, demand was subdued, a result of a poor agricultural season following the drought, as well as the ongoing expansion of self-manufacture of certain can sizes by our key customer. The ongoing political uncertainty related to the elections also impacted consumer demand.
Demand for crowns in Tanzania and Zimbabwe was subdued in the first half, but improved towards the end of the year. In Zambia, a change in the procurement strategy of a large customer led to the closure of our Ndola crown line.
Looking aheadIn the year ahead, we plan to convert our first beverage can line in Angola from tinplate to aluminium, with capability to produce slender cans. We expect to complete the US$13 million first phase of the project, which will be fully funded out of local cash balances, in 2019. This will help meet the greater filling capacity that is coming on line in that country.
In Nigeria, despite renewed economic optimism and improved foreign exchange availability, in the year ahead we expect demand for beverage cans to remain muted as the economy continues its slow recovery from recession. We will watch closely for any further migration of malt drinks to relatively cheaper PET packaging. In both countries, we will continue with our initiatives to drive improvements and cost efficiencies as well as cash repatriation, and remain optimistic about the longer-term outlook for our Bevcan businesses in these countries.
In general metal packaging, in Nigeria, we remain cautiously optimistic about the prospects for our business in the year ahead as the economy turns.
Operational review – Metals continued
Nampak Limited Integrated Report 2017
62

Operational review – Glass
Nampak Glass is one of two container glass manufacturers in South Africa and has a market share of approximately 25%. We operate three furnaces at our site southeast of Johannesburg and have installed capacity of 285 000 tonnes. Our bottles make up 18% of the beer, 25% of the flavoured alcoholic beverages, 21% of the wine and 67% of the spirits markets.
2017 2016 % change
Key natural capital inputsEnergy use (GJ) 2 079 480 2 137 609 (2.7)Limestone (t) 32 700 36 600 (10.7)Silica sand (t) 133 965 133 139 0.6Soda ash (t) 36 027 39 312 (8.3)
Outputs affecting natural capitalEmissions intensity (tCO2e/Rm revenue) 127.45 145.15 (12.2)
Financial capitalRevenue (Rm) 1 420 1 323 7.3Trading profit (Rm) 63 105 (40.0)Trading margin (%) 4.4 7.9 –
Human capitalEmployees 433 435 (0.5)LTIFR 1.07 0.79 Deteriorated
Key developments » Maintained sales in a generally depressed market
» Faced significant problems with quality of electricity supply
» Grew market share in the wine sector » Incurred impairment of R321 million on goodwill and R114 million on intangible assets
Rob MorrisGroup executive: Glass
GLASS30
35
40
45
50
Glass packaging collected for recycling in South Africa (%)
2012 2013 2014 20162015
50
45
40
35
30
Source: Packaging SA
STRATEGIC PERFORMANCE ] Nampak Limited Integrated Report 2017
63
HOW WE CREATE VALUE
STRATEGIC CONTEXT
STRATEGIC PERFORMANCE
GOVERNANCE AND REMUNERATION
SHAREHOLDER INFORMATIONWHO WE ARE

SOUTH AFRICANampak Glass had a challenging year, with operations disrupted by protracted problems with the quality of the municipal electricity supply to our site. Turnover rose 7.4% as we secured new sales in a subdued market but we reported a decline in our trading profit, as operations were impacted by a sustained period of volatile electricity supply and general disappointing operational efficiencies.
The group impaired R321 million which relates to the goodwill on the 2012 acquisition of the remaining 50% of Nampak Wiegand Glass (Pty) Ltd. The impairment was in light of the current trading conditions in Glass. A further R114 million was impaired in respect of intangible assets.
We continued to focus on safety, but our performance was disappointing, and was overshadowed by the death of a contractor on 1 October 2016 in a fork-lift truck accident.
The South African market for glass containers remained weak, with growth pedestrian at 1% to 2% a year, and demand well below the installed capacity of the country’s two producers. However, we increased our share in some sectors of the market, most notably wine, and continue to see opportunities for growth. In the second half, we secured new sales volumes to a large brewer. Our relationships with customers remained good.
Driven to deliver on the strategic imperative to improve business performance by buying, making and selling better, we continued to further simplify our manufacturing footprint. This entailed ongoing optimisation of furnace draw by rationalising product lines and dedicating furnaces to specific colours. We initiated discussions with certain key customers about plans to further rationalise our product mix. We engaged specialised glass consultants to facilitate a further improvement in operational efficiencies.
Aligned to our strategic imperative to manage costs stringently, we successfully installed and commissioned a dedicated gas transmission line to our factory gate and began reaping the related cost savings. We improved management of costs by securing, by way of contract, the supply of all our raw materials.
To enhance our inspection capability, specifically relevant to wine bottles, we installed and commissioned new bottle inspection equipment in July on Furnace 1. This is in line with our strategic imperative to invest to compete. Since 2015, Nampak Glass has doubled its share of the market in wine. In 2017, our market share expanded to 21% from 15%, and we see further room to grow.
We kept up our participation in the voluntary industry initiative, The Glass Recycling Company (TGRC), which is well positioned to submit industry waste management plans in response to proposed new legislative requirements. In 2016, 41% of all glass consumed in South Africa was collected for recycling. We also worked on a number of water-saving initiatives, targeting the goal of becoming a zero-effluent discharge plant by recycling process water. In the year we retained certification of our glass operations for environmental and energy management standards, as well as those for food safety.
Looking aheadWe expect the trading environment to remain challenging. Our focus in 2018 will be largely internal – in an effort to improve our operational efficiencies and manufacturing disciplines. We will introduce new technical skills and greater management oversight to ensure improved and optimal operation of our furnaces. We expect to grow our volumes of emerald green glass, while rationalising our flint bottle product mix. Furnace 1 is scheduled for a rebuild in 2019 and preparations are well advanced for this project.
A number of product development opportunities in the beer sector bode well for Nampak Glass as does the opportunity for volume growth in this sector. We will continue to leverage further growth in sales to the Cape wine sector.
REST OF AFRICAWhile we still see opportunity to invest in glass-making facilities in the Rest of Africa in the medium to longer term, the unfavourable macro-economic environment across much of the continent means that any decisions will only be taken once conditions improve significantly.
Operational review – Glass continued
Nampak Limited Integrated Report 2017
64

Operational review – Plastics
Nampak has 19 plastics facilities in South Africa, running 209 lines for a portfolio of customers across a number of industries. We make PET preforms and bottles and HDPE bottles; paper gable-top cartons; drums and intermediate bulk containers; closures; tubes and crates. Nampak Plastics Europe operates eight facilities producing HDPE bottles, mostly for the dairy market in the United Kingdom and the Republic of Ireland. In the Rest of Africa, we have bottle, preform, crate and closure businesses in Ethiopia, Nigeria, Zambia and Zimbabwe.
2017 2016 % change
Key natural capital inputsEnergy use (GJ) 654 492 720 003 (9.1)
Outputs affecting natural capitalEmissions intensity (tCO2e/Rm revenue) 27.93 25.28 10.5
Financial capitalRevenue (Rm) 4 624 5 577 (17.1)Trading profit (Rm) 166 392 (57.7)Trading margin (%) 3.6 7.1 –
Human capitalEmployees 1 998 2 036 (1.9)LTIFR 0.62 0.67 Improved
Mxolisi KhutamaGroup executive: Plastics
Rob MorrisGroup executive: Rest of Africa
PLASTICS
Key developments » Improved safety performance » Lost CSD preform volumes to backward integration by customers
» Delivered growth of HDPE and PET bottle volumes, and sales of crates, drums and cartons
» Formalised plans to consolidate liquid packaging sites in Gauteng, cut costs
» Dependence on forex liquidity impacted Rest of Africa plastics businesses
» In Europe, we reported a loss, but recorded improvements in operational performance
40
42
44
46
Plastics packaging collected for recycling in South Africa (%)
46
44
42
40
2012 2013 2014 20162015
Source: Packaging SA
STRATEGIC PERFORMANCE ] Nampak Limited Integrated Report 2017
65
HOW WE CREATE VALUE
STRATEGIC CONTEXT
STRATEGIC PERFORMANCE
GOVERNANCE AND REMUNERATION
SHAREHOLDER INFORMATIONWHO WE ARE

SOUTH AFRICAGuided by the strategic objective to unlock further value from our base business, in 2017 we advanced our work to sustainably improve the performance of our plastics business, delivering a stronger safety result, improved product quality and enhancing our maintenance, sales and operations practices.
We also gained traction in our efforts to embed a learning culture in the business and further improved our working capital management.
The market remained challenging, impacted by weak consumer demand and heightened competition, putting pressure on volumes and profitability. However, plans to grow sales started to yield results, as did those aimed at improving operations through a number of interventions designed to deliver value in the years ahead.
We continued to benefit from Nampak R&D’s work to reduce the usage of raw materials for various plastic packaging formats by designing lightweight containers that do not compromise on performance.
Liquid packaging – HDPE and PET bottles, drums and cartonsDemand from new customers and the recovery of sales volumes by a large existing customer supported growth in Liquid Packaging’s turnover and profitability in the year. This was despite the loss of a significant amount of preform business to backward integration and self-manufacture by two large CSD bottlers in the second quarter.
We remained focused on optimising our basket of products to the dairy industry and allied customers, while growing our presence in the market for packaging of water, sauces and condiments. We also made some progress in improving our position in the market for packaging of industrial, household chemical and personal care items.
After a difficult 2016, demand for drums – many used for bulk alcohol exports into the Rest of Africa – increased. We gained market share in both the large and small drum categories and continued our work to improve the efficiencies of our drums facility. Product launches by customers in the sorghum beer and juice sector drove some recovery in demand for cartons in the year. The cartons business also achieved very good cost control, supporting profitability.
Closures, tubes and cratesOur closures and tubes businesses felt the weight of the economic slowdown, but good control of costs mitigated against the pressure on volumes. The tubes business extended a contract with a large customer and successfully launched a drive to re-enter the non-dental personal care market.
Demand for crates was good, and we signed new contracts with two large customers, supporting our approach to shift volumes to more sustainable revenue sources. Recapitalisation of the crate business remains a priority for 2018, when we will continue to support a key beverage customer and grow our presence in the agriculture and bakery segments.
Looking aheadIn addition to the impact of the loss of preform volumes in the year ahead, we expect our business to come under pressure due to margin and volume losses as a result of customer tender allocation and the consolidation of operations.
Despite this, we have a portfolio of strong and diverse customers, a wide product range and good positions in the markets in which we operate. We expect further progress in our efforts to optimise capacity utilisation and drive growth. Our biggest opportunity in the year ahead lies in our project to address our cost base as well as improve the efficiency and effectiveness of particular parts of the business. Our focus remains on driving all aspects of operations excellence.
The first step in our site consolidation intervention is the consolidation of the Isando and Industria liquid packaging facilities in Gauteng, for which capital expenditure of R35 million has been earmarked. The closure of the Industria site in the second quarter of the new financial year will lead to the loss of up to 50 jobs.
In line with the strategic imperative to manage costs stringently, we will address all our fixed costs: we will look to reduce overheads and increase capacity utilisation in part by rationalising lines that are not adequately loaded, including those at the consolidated Isando site. As we reduce our cost base and fill available capacity with appropriate opportunities in adjacent markets, we will target a gradual widening of our trading margin towards industry norms.
Recapitalisation of the crate business and a key customer in-plant for liquids will follow, in line with the strategic imperative to invest to compete and in so doing defend market share. Demand for rigid plastics in South Africa is forecast to grow at 3.3% a year until 2019 as plastics’ share of packaging expands. We see opportunity to replace ageing machinery with state-of-the-art equipment through a multi-year investment programme, subject to this meeting hurdle rates of return. In this way we will improve our competitiveness through improved productivity, operational efficiencies, energy consumption and better quality products.
We also have several growth opportunities to support substrate shifts for customers in the food and spirits markets, import replacement and new product launches. We will continue to embed systems and processes to improve the effectiveness of the business and ensure that our people have clear skills development opportunities.
Operational review – Plastics continued
Nampak Limited Integrated Report 2017
66

REST OF AFRICA In Zimbabwe, the inconsistent availability of forex impacted on the performance of operations as well as on consumer demand, particularly for beverages like sorghum beer, which – unusually for the region – are packaged in rigid plastics. Subdued economic activity, a material issue for Nampak, suppressed sales of preforms, closures and crates. A shortage of water also affected demand from some customers. We explored alternative export markets as well as various measures to better manage costs.
Our Nigerian plastics business had a good year, thanks to robust demand for closures from our multinational customer base. This signifies delivery on our strategic imperative to partner with major multinational customers.
In Ethiopia, demand for our crates continued to be strong, but delays in securing foreign exchange to fund imports of raw materials remained a major constraint on production, and made forecasting difficult.
Looking aheadThe continued shortage of US dollar liquidity in Zimbabwe continues to be a concern. In Ethiopia, while the recent lifting of a state of emergency bodes well for the economy, the continued shortage of forex available is worrying, hampering the delivery of the required volume of products to our customers.
The fundamentals for growth in packaging demand in the Rest of Africa in the medium to long term remain strong, supported by a youthful and growing population, expanding disposable incomes and increased urbanisation.
In line with the strategic imperative to sensibly manage and grow our presence in current jurisdictions, we continue to consider further rigid plastics investments in Zambia and Zimbabwe and intend to expand our Nigerian closure business with additional moulds as soon as possible.
UNITED KINGDOM AND REPUBLIC OF IRELAND2017 was a year of consolidation for Nampak Plastics Europe, with new leadership driving improvements in operational performance. However, our financial performance remained poor in a weak UK dairy market characterised by plummeting milk prices and tight margins.
Project overruns and certain manufacturing difficulties at a property attached to a customer’s dairy and the installation of an in-plant facility on this customer’s site led to the assessment of this as an onerous contract, given the contracted pricing.
While negotiations continue to find a solution to the pricing mechanisms, assets related to the operation amounting to R56 million have been impaired and the unrecoverable portion of the contract has been provided for as an onerous contract
with both items being disclosed as an abnormal item, we took an impairment of R112 million related to the in-plant.
We are the leading producer of rigid plastic packaging in the UK, with our products representing some 38% of the milk bottle market. This is down from 55% in 2012, following consolidation among major milk producers and the subsequent loss of volumes to backward integration and self-manufacture by some customers. In 2017 this continued to put pressure on our cost structure.
However, we remained focused on our operations excellence drive: minimising our raw material usage, achieving greater energy efficiencies, getting our product quality right the first time, and optimising our machine efficiencies. The health and safety of our people remained our top priority. At the same time, we worked to leverage our facilities and lightweighting capabilities to serve a wider market, benefiting from the experience of our new commercial team to grow our customer base and product offerings.
The market responded positively and we had encouraging engagements with potential customers outside the dairy market who are seeking a more competitive product in which to package their products. We expect this market diversification drive to bear fruit in the medium to long term. Within the dairy market, we broadened our focus to include medium-sized dairies rather than attending solely to the largest players.
Nampak has been the driving force behind a reduction of up to 25% in the average weight of milk bottles in the UK in the past seven years. This provides us with opportunities in the home care, laundry care and personal care markets.
Looking aheadIn the year ahead, working in close cooperation with our customers, we intend to create added value through our innovative engineering and manufacturing processes. Our experienced new commercial team will continue to drive our growth plans. As the market seeks a partner with strong light-weighting and innovation credentials, we will leverage Nampak R&D’s many capabilities (including unique finite element analysis) to grow our customer and product base. We expect the business, which remains a generator of cash and a rand hedge, to return to profitability in the next two years.
STRATEGIC PERFORMANCE ] Nampak Limited Integrated Report 2017
67
HOW WE CREATE VALUE
STRATEGIC CONTEXT
STRATEGIC PERFORMANCE
GOVERNANCE AND REMUNERATION
SHAREHOLDER INFORMATIONWHO WE ARE
Operational review – Paper
Nampak’s Paper businesses are in Kenya, Malawi, Nigeria, Zambia and Zimbabwe. We supply a range of sectors, from milling, cigarettes and tobacco to the sorghum beer industry. In most of these markets we are the major producer. Among our extensive product range are cartons, sacks, bags, board and boxes.
Rob MorrisGroup executive: Rest of Africa
PAPER
Key developments » Reported strong Zimbabwe performance, helped by good tobacco crop
» Recorded lower paper sales in other markets
2017 2016 % change
Key natural capital inputsEnergy use (GJ) 1 527 722 1 527 600 No change
Outputs affecting natural capitalEmissions intensity (tCO2e/Rm revenue) 6.79 5.75 18.1
Financial capitalRevenue (Rm 1 497 1 749 (14.4)Trading profit (Rm) 177 236 (25.0)Trading margin (%) 11.8 13.5 –
Human capitalEmployees 673 702 (4.1)LTIFR 0.25 0.20 Deteriorated
Nampak Limited Integrated Report 2017
68

REST OF AFRICA In 2017, a very strong performance from our Zimbabwe business supported Nampak’s otherwise subdued paper operations, all of which are in African countries beyond the borders of South Africa. Revenue declined by 14% and trading profit fell by 25%.
Our operations in Zimbabwe benefited from a good crop of tobacco, which is packaged for export in large corrugated boxes, and the extension of the tobacco auction season. The better-than-expected performance was also supported by stronger general paper packaging demand and the imposition of duties on imported paper packaging, which led to a greater substitution of imports with locally produced products.
In Nigeria, cigarette carton sales were strong. We agreed pricing mechanisms with our key customers, where we were able to recover margins lost through foreign exchange rate variances. This only became effective in the second quarter of the year. We were also able to better extract earnings from our Nigerian operations with the establishment of the new NAFEX market, facilitating easier trade between importers and exporters.
In Kenya, the impact on agricultural harvests of below-average rainfall, new entrants to the market and greater backward integration by a large customer resulted in lower demand for self-opening bags for the maize and wheat milling industry. Volumes were also impacted by customers’ requirements for multi-colour printing.
Our business in Zambia had a tough year, with sales of sorghum beer cartons weak as a result of lower demand and the introduction by a large customer of alternative products and packaging types. The owner of the largest sorghum beer producer in the country announced plans to sell its sorghum business in Zambia.
In Malawi, sales to the sorghum beer industry were depressed as the new owner of the major sorghum beer producer started selling its product in returnable bottles. The owner also announced plans to dispose of its business in Malawi. Competitive pricing on imported tobacco cases had a negative impact on the sales of locally produced cases.
Looking aheadNampak’s strategic objective remains that we accelerate growth in the rest of Africa, based on the continent’s compelling long-term macro-economic and demographic trends. This requires patience, and that we hold on to our first-mover advantage to be there when an economic recovery takes hold, assisted by a turn in the commodity cycle.
However, in the meantime we need to unlock further value from our base business. In pursuit of this, in the year ahead we will rationalise our production facilities in southern and east Africa. We will concentrate production of sorghum beer cartons in Zambia. Our general and tobacco carton operations in Zimbabwe will supply our Malawi facility.
While liquidity constraints in Zimbabwe remain a risk and a material issue for Nampak, we expect the restrictions on imported products in these markets to continue to encourage the local sourcing of packaged goods. Throughout the region, we will closely monitor changes in the purchasing strategies of our multinational customers, which include in some cases a reduced emphasis on local procurement.
In Nigeria, a 10-year contract with a key client expires in March 2018 and we are in discussions with regard to a new tender.
STRATEGIC PERFORMANCE ] Nampak Limited Integrated Report 2017
69
HOW WE CREATE VALUE
STRATEGIC CONTEXT
STRATEGIC PERFORMANCE
GOVERNANCE AND REMUNERATION
SHAREHOLDER INFORMATIONWHO WE ARE

Creating value through good corporate governance
Nampak believes in the principle that good corporate governance contributes to enhanced accountability, competence, fairness and transparency. The board of directors leads with integrity, thereby ensuring an ethical approach to all matters. The board sets the direction for the organisation, ensuring that strategy, risk, performance and sustainable development are appropriately balanced and integrated while bringing informed and independent judgement and leadership to bear on material decisions.
ENSURING COMPLIANCE AND HIGH STANDARDS OF GOVERNANCE AND ETHICSThe board is ultimately accountable and responsible for the performance and affairs of the company and is satisfied that it has fulfilled all its duties and obligations in the 2017 financial year.
Nampak has complied with the Listings Requirements of the JSE Limited and applied all the principles of the King IV Report on Corporate Governance for South Africa 2016 (King IVTM).
A statement on Nampak’s application of the principles of King IVTM is available on www.nampak.com.
Nampak has the necessary processes in place to ensure that all entities in the group adhere to essential group requirements and appropriate corporate governance standards. Nampak is committed to conducting its business in compliance with all applicable laws and regulations, while focusing on effective risk management to ensure long-term sustainable development and growth. The primary purpose of Nampak’s compliance programme is to ensure that Nampak conducts its business strictly within the confines of the law.
The programme provides for the detection of contraventions of laws, regulations and company policy, enabling the company to address transgressions immediately.
Safety, health, environmental and competition laws are all identified as key legal compliance areas and therefore receive the necessary attention on an ongoing basis. Another key area to receive specific attention during the year ahead will be the implementation of the provisions of the Protection of Personal Information Act, No 4 of 2013.
During the year under review, there were no material violations of any laws or regulations, nor were any material penalties or fines imposed on the company or its directors for contraventions of any laws or regulations.
A code of conduct and business ethics sets the minimum standards expected of all directors and employees. Alleged violations may be reported through “Tip-Offs Anonymous”, which is independently administered by Deloitte and is accessible 24 hours a day, seven days a week.
Nampak Limited Integrated Report 2017
70

OUR GOVERNANCE STRUCTURES Nampak’s board of directorsThe board comprises an appropriate combination of executive and non-executive directors with the right balance of skills, experience and independence, to conduct the business of the company in a professional and effective manner.
The board is truly diverse in every respect: expertise, experience, age, gender and race. This diversity enriches the collective perspective and contributes towards a sustainable and competitive advantage. When reviewing the composition of the board and its committees, the board’s gender diversity policy is specifically taken into consideration.
All non-executive directors are considered to be independent. Nampak has reconfirmed the independence of its non-executive directors who have been in office for more than nine years, namely RJ Khoza, RC Andersen and PM Madi. Their experience, knowledge and independent judgement continue to benefit the company.
For a summary of the biographical details of directors, refer to pages 76 and 77 in the integrated report.
For full details, refer to our website, www.nampak.com.
The board met five times during the financial year. Directors and attendance details were as follows:
Board of directors1 21 Nov-16 01 Feb-17 05 May-17 30 May-17 19 Sep-17
Independent non-executive directorsTT Mboweni (Chairman) ü ü ü ü ü
RC Andersen ü ü ü ü ü
E Ikazoboh ü ü ü ü ü
RJ Khoza ü ü ü û5 ü
NV Lila ü ü ü ü ü
PM Madi ü ü ü ü û6
IN Mkhari ü ü ü ü ü
PM Surgey ü ü ü ü ü
J John2 n/a n/a n/a ü ü
DC Moephuli3 ü n/a n/a n/a n/aCWN Molope3 ü ü n/a n/a n/a
Executive directorsAM de Ruyter (CEO) ü ü ü ü ü
GR Fullerton (CFO) ü ü ü ü ü
MMF Seleoane4 n/a n/a n/a n/a ü
FV Tshiqi4 ü ü ü ü n/a1 Nampak’s memorandum of incorporation provides that the minimum number of directors shall be six and not less than such number as the board may determine from
time to time. One-third of directors must retire at every annual general meeting (excluding the CEO and CFO) and are eligible for re-election.2 Appointed on 5 May 2017.3 Resigned on 1 February 2017.4 FV Tshiqi retired as executive director: human resources on 30 June 2017 and MMF Seleoane was appointed on 1 July 2017.5 Did not attend the meeting due to prior commitments.6 Did not attend the meeting due to family commitments.
Tenure
0 – 3 years: 43 – 5 years: 36 – 8 years: 29+ years: 3
Age
40 – 50: 651 – 60: 261 – 70: 4
Women representation
2017
>35%target
34%
Diversity by race
(historically disadvantaged)
2017
>60%target
64%
Our board’s diversity targets and statistics
GOVERNANCE AND REMUNERATION ] Nampak Limited Integrated Report 2017
71
HOW WE CREATE VALUE
STRATEGIC CONTEXT
STRATEGIC PERFORMANCE
GOVERNANCE AND REMUNERATION
SHAREHOLDER INFORMATIONWHO WE ARE

Creating value through good corporate governance continued
Mr Surgey has been appointed as the lead independent director. In the event of the chairman’s absence or the chairman’s inability to perform his duties, or where the independence of the chairman is questionable or impaired, the lead independent director will assume the chairmanship for as long as circumstances require.
The roles and functions of the chairman, the lead independent director
and the CEO are described in the board charter available on our
website at www.nampak.com.
Board
attendance
96%
THE ROLE OF OUR COMMITTEESThe committees support the board by providing oversight and direction in their areas of responsibility. The committees play an important role in enhancing corporate governance and effectiveness within the group. The committees report to the board through their respective chairmen.
The CEO is not a member of the audit committee, the nomination committee or the remuneration committee, but attends meetings by invitation. He is requested to leave the meeting, where appropriate, before decisions are made which relate to him personally.
Audit committeeChairman Roy Andersen: “The audit committee plays a key role in ensuring the integrity of Nampak’s corporate reporting and this year the focus was on key accounting issues including the carrying value of assets, particularly Glass.”
The committee met six times during the financial year. Members and attendance details were as follows:
Members 8 Nov-16 10 Nov-16 14 Nov-16 10 March-17 19 May-17 08 Sep-17
Independent non-executive directorsRC Andersen (Chairman)1 ü ü ü ü ü ü
NV Lila ü ü ü ü ü û4
IN Mkhari ü ü ü ü ü ü
J John2 n/a n/a n/a n/a ü ü
CWN Molope3 ü ü ü n/a n/a n/a1 Appointed as Chairman on 1 February 2017.2 Appointed on 5 May 2017.3 Resigned on 1 February 2017.4 Did not attend the meeting due to illness.
The committee is a statutory committee constituted in terms of the Companies Act, No 71 of 2008. The committee primarily assists the board to oversee the quality and integrity of Nampak’s annual, integrated and financial reporting; the qualification and independence of the internal and external auditors; the scope and effectiveness of the external audit function, and the effectiveness of the internal audit function and internal controls.
Focus going forward: Continue to ensure that the financial systems, processes and controls, including IT controls, operate effectively, and respond to changes in the operating and regulatory environment.
Refer to the annual financial statements for the audit committee report.
Nampak Limited Integrated Report 2017
72

Remuneration committeeChairman Peter Surgey: “With our remuneration approach, we attempt to align reward with performance and achievement of the group’s strategic initiatives and at the same time balance business imperatives with retention and shareholder interests.”
The committee met three times during the financial year. Members and attendance details were as follows:
Members 09 Nov-16 15 Mar-17 21 Sep-17
Independent non-executive directorsPM Surgey (Chairman) ü ü ü
RC Andersen ü ü ü
TT Mboweni ü ü ü
The committee is responsible for ensuring that the group remunerates its directors and employees fairly, responsibly and transparently.
Focus going forward: » Continued engagement with our shareholders on our remuneration policy and implementation report
» Continue ensuring the appropriateness of our reward practices
Refer to the remuneration committee report for details of directors’ remuneration and other relevant remuneration information.
Nomination committeeChairman Tito Mboweni: “In the year we appointed two new directors – an independent non-executive director and an executive director. Both women bring a wealth of relevant experience to Nampak and further improve our diversity, enriching the board’s collective perspective. In 2018, we will focus on further bolstering our succession planning.”
The committee met twice during the financial year. Members and attendance details were as follows:
Members 15 Mar-17 21 Sep-17
Independent non-executive directorsTT Mboweni (Chairman) ü ü
RC Andersen ü ü
RJ Khoza ü û1
PM Surgey (LID) ü ü1 Did not attend the meeting due to family commitments.
The committee is mainly responsible for assisting the board and makes recommendations regarding the composition of the board and its committees, succession planning and the appointment of directors as well as managing the performance of the board, the board committees and directors
Focus going forward: » Succession planning with a long-term focus » Attracting and retaining critical skills
Investment committeeChairman Ipeleng Mkhari: “Management introduced a stage-gate approach to capex, ensuring proper assessment of capital projects before they are considered by the board. In 2018, we plan to better review investments made in the past 24 to 36 months and establish whether they have met the targets set at the time of investment, and ensure they are performing.”
The committee met once during the financial year. Members and attendance details were as follows:
Members 19 May-17
Independent non-executive directorsIN Mkhari (Chairman) ü
RC Andersen ü
E Ikazoboh ü
PM Madi û1
DC Moephuli2 n/aExecutive directorsAM de Ruyter (CEO) ü
GR Fullerton (CFO) ü1 Did not attend the meeting due to prior commitments.2 Resigned on 1 February 2017.
The committee is responsible for providing strategic direction and ensuring prioritisation and optimisation on group-wide, high-risk and value investment and funding decisions.
Focus going forward: » Continue to focus on optimising funding decisions and capital allocation and monitoring the progress of high- value capital projects
GOVERNANCE AND REMUNERATION ] Nampak Limited Integrated Report 2017
73
HOW WE CREATE VALUE
STRATEGIC CONTEXT
STRATEGIC PERFORMANCE
GOVERNANCE AND REMUNERATION
SHAREHOLDER INFORMATIONWHO WE ARE

Risk and sustainability committeeChairman Nopasika Lila: “It is essential that the company understands the risks it faces, so that it can ensure its sustainability. One of the important emerging risks for businesses everywhere comes from the internet: IT platforms are at risk of cyber attack. Mitigation is a continual process: from a financial point of view insurance is important; from an operational viewpoint, companies have to constantly upgrade their security and carry out penetration tests to determine the strength of their systems.”
The committee met twice during the financial year. Members and attendance details were as follows:
Members 04 Nov-16 09 May-17
Independent non-executive directorsNV Lila (Chairman) ü ü
RC Andersen1 n/a û3
PM Madi ü ü
PM Surgey ü ü
DC Moephuli2 ü n/aCWN Molope2 ü n/a
Executive directorsAM de Ruyter (CEO) ü ü
GR Fullerton (CFO) ü ü1 Ex officio member (audit committee chairman).2 Resigned 1 February 2017.3 Did not attend meeting due to prior commitments.
The committee is responsible for ensuring effective risk management oversight and providing direction on the overall sustainability processes.
Focus going forward: » Continued focus on the top risks affecting the group’s operations and our risk management processes
» Continue to identify, monitor and manage risks, which could affect the company’s sustainability, reputation and/or environment in which we operate and ensuring that the appropriate controls are in place
Social, ethics and transformation committeeChairman Phinda Madi: “Like many, Nampak suffered a B-BBEE status downgrade in line with the new codes. At the same time, the black ownership scheme matured and was wound up. We redoubled efforts on every aspect of B-BBEE. We refreshed our values and updated our code of ethics. We broadened our CSI reporting to include details of initiatives beyond South Africa’s borders.”
The committee met twice during the financial year. Members and attendance details were as follows:
Members 02 Nov-16 11 May-17
Independent non-executive directorsPM Madi (Chairman) ü ü
IN Mkhari ü ü
PM Surgey ü ü
Executive directorsAM de Ruyter (CEO) ü ü
MMF Seleoane1 n/a n/aFV Tshiqi1 ü ü1 FV Tshiqi retired as executive director: human resources on 30 June 2017
and MMF Seleoane was appointed on 1 July 2017.
The committee performs the role of a social and ethics committee as required in terms of the Companies Act, No 71 of 2008 and assists the board to ensure that the appropriate strategies, policies and processes are in place in order to drive transformation and the continued development and sustainability of an ethical culture within the group.
Focus going forward: » Continue driving the transformation agenda » Ensuring that the proper processes are in place to promote an ethical culture
A common future focus area for the board and all the committees is to actively support the company’s long-term strategy, ensuring Nampak improves margins through operational efficiency and cost management and unlocks further value.
The committee charters are reviewed regularly by the board and are available on our website, www.nampak.com.
Average committeeattendance
94%
Creating value through good corporate governance continued
Nampak Limited Integrated Report 2017
74

THE DEVELOPMENT AND PERFORMANCE OF OUR DIRECTORSThe development of industry knowledge is a continuous process and the board is continually appraised of new developments and changes in Nampak’s business environment. Training is also provided to individual directors on request. The company has a formal induction programme, which includes the opportunity for new directors to visit key operations.
Directors are entitled to obtain independent professional advice, at Nampak’s expense, and enjoy unfettered access to group records and company employees, in order to discharge their duties.
The evaluation of the performance and effectiveness of the board, its committees, individual directors and the chairman was externally assessed in 2017. The assessment confirmed that the board functions effectively and professionally and that decision-making processes are robust. The exercise affirmed the good relationship between the chairman and the CEO and there was an acknowledgment of the chairman’s leadership skills. Priority focus recommendations for the year ahead include board succession (with a focus on formalised succession planning for the position of CEO), the attraction and retention of critical skills and the establishment of a more structured approach to balancing long-term strategy while driving short-term performance.
The effective functioning of the board is facilitated and supported by the company secretariat. Nampak’s company secretary is IH van Lochem, who was appointed with effect from 1 September 2017, in accordance with the Companies Act, No 71 of 2008. Ms van Lochem was appointed to replace Mr NP O’Brien, who retired on 31 August 2017.
Ms van Lochem is a member of the group executive committee and reports to the CEO. The company secretary is not a director.
Having considered the competence, qualifications and experience of the company secretary, the board is satisfied that she is competent and has the appropriate qualifications and experience to serve as the company secretary.
The board considered the interactions between the company secretary and the board, and is satisfied that there is an arm’s length relationship between the board and the company secretary.
For more details on the responsibilities, powers, policies, and processes of the board, directors, the group executives, the company secretary and other officials, refer to the board charter as well as the memorandum of incorporation of the company on our website, www.nampak.com.
GOVERNANCE AND REMUNERATION ] Nampak Limited Integrated Report 2017
75
HOW WE CREATE VALUE
STRATEGIC CONTEXT
STRATEGIC PERFORMANCE
GOVERNANCE AND REMUNERATION
SHAREHOLDER INFORMATIONWHO WE ARE

Board of directorsINDEPENDENT NON-EXECUTIVE DIRECTORS
1. Tito Mboweni (58)ChairmanQualifications: BA, MA, CD(SA)Appointed: 1 June 2010Experience: Former South African Minister of Labour, former Governor of the South African Reserve Bank, member of the national executive committee of the African National Congress since 2012.Other directorships: Accelerate Property Fund Ltd, African Centre for Economic Transformation (chairman), Discovery Ltd, Mboweni Brothers Investments Holdings (Pty) Ltd, PPC Ltd, The New Development Bank BRICSExperience and expertise » Banking » Labour relations » Strategic leadership » Economics » Finance and macro-policy
2. Emmanuel Ikazoboh (Nigerian) (68)
Qualifications: FCCA, MBAAppointed: 1 October 2013Experience: Chairman of the board of Ecobank Transnational, MD of Hedonmark Management Services (Nigeria), former administrator of the Nigerian Stock Exchange, former chairman and CEO of Deloitte West and Central Africa.Other directorships: ARM Pension Fund Manager Ltd (chairman), Dangote Cement plc, Ecobank Transnational Inc (chairman), Oceanwinds Hospitality Ltd (chairman) and United Nigeria Textiles plc and the International Institute for Sustainable Development (Winnipeg Canada)Experience and expertise » Accounting » Auditing » Finance
3. Roy Andersen (69)Qualifications: CA(SA), CPA, CD(SA)Appointed: 28 November 2008Experience: Former chairman of Sanlam Ltd and Stanlib Ltd, former CEO of Liberty Group Ltd, former president of the JSE Ltd and currently a member of the King Committee on Corporate Governance.Other directorships: Aspen Pharmacare Holdings Ltd and Sasfin Holdings Ltd (chairman)Experience and expertise » Accounting » Auditing » Finance » Corporate governance
4. Jenitha John (46)Qualifications: BCompt (Hons), CTS, CA(SA), CIA, QIAL, F Inst D Senior executive programme (Wits and Harvard), Diploma in Company DirectionAppointed: 5 May 2017Experience: Chief audit executive at FirstRand Ltd, financial and audit roles at Discovery Holdings Ltd, Telkom SA Ltd, Eskom, Toyota SA and RMBT Property Services. Served on many boards and audit committees of both public and private sector entities. Global leadership roles with the Institute of Internal Auditors (vice-chairman – professional practices).Other directorships: Tongaat Hulett Ltd (chairman of the audit committee), Adcock Ingram (member of the audit committee and risk committee), FNB Pension Fund (board trustee and member of audit committee), FirstRand Empowerment Fund (board trustee), Institute of Internal Auditors Global Board of Directors and Executive CommitteeExperience and expertise » Risk management, internal controls and corporate
governance » Financial and strategic leadership » Socio-economic development and sustainability » Operational efficiencies and technology insights
Independent non-executive directors committee key
Nomination committee Chairman: Tito MboweniRemuneration committee Chairman: Peter SurgeyAudit committee Chairman: Roy AndersenInvestment committee Chairman: Ipeleng MkhariRisk and sustainability committee Chairman: Nopasika LilaSocial, ethics and transformation Chairman: Phinda Madi
Nampak’s board of directors is committed to ensuring that the group adheres to the highest standards of corporate governance. The board is responsible for the strategic direction of the group, while maintaining control over all material issues affecting Nampak.
Skills and expertise of all directors
1 2 3 4 5 6 7 8 9 10 11 12Number of directors
EconomicEntrepreneurship
LegalRisk management
People management and socio-economic development
Corporate governanceAccounting and finance
Strategic leadership
Nampak Limited Integrated Report 2017
76

5. Reuel Khoza (67)Qualifications: BA (Hons), MA, Eng D, LLD honoris causa, D Econ honoris causa, CD(SA) Appointed: 1 October 2005Experience: Former chairman of Eskom Holdings, former chairman of Nedbank Group Ltd, former director of Standard Bank Group, Liberty Life Group and Old Mutual Plc. Visiting professor at several universities: business leadership and ethics, strategy and change management, deputy chairman of the King Committee on Corporate Governance and President of IOD. Other directorships: Aka Capital (Pty) Ltd (chairman), Globeleq (chairman), Dzana Investments (Pty) Ltd (chairman) and Sasol Oil (Pty) LtdExperience and expertise » Strategic leadership » Corporate governance
6. Nopasika Lila (48)Qualifications: CA(SA)Appointed: 1 March 2014Experience: CFO of the Eskom Pension and Provident Fund, former independent non-executive director of Basil Read Holdings Ltd and former independent non-executive director of the Johannesburg Development Agency.Other directorships: Enx Group LtdExperience and expertise » Accounting » Finance » Corporate governance » Risk management
7. Ipeleng Mkhari (43)Qualifications: BAAppointed: 1 October 2013Experience: Co-founder and CEO of Motseng Investment Holdings (Pty) Ltd.Other directorships: Kap Industrial Holdings Ltd, Motseng Investment Holdings (Pty) Ltd, South African Property Owners AssociationExperience and expertise » Strategic leadership » Entrepreneurship
8. Phinda Madi (53)Qualifications: BProc, EDPAppointed: 21 November 2008Experience: Qualified attorney, professor of management studies, University of Johannesburg and owner of Madi Investments (capital venture business).Other directorships: Allcare Medical Administrators (Pty) Ltd (chairman), Illovo Sugar Ltd, Madi Investments (Pty) Ltd, Sovereign Foods Ltd and Spar Group Ltd, Automobile Association of South Africa and Lebone RenewablesExperience and expertise » Legal » Strategic leadership » Entrepreneurship » University professor
9. Peter Surgey (62)Qualifications: BA LLBAppointed: 29 July 2009Experience: Former MD of Plascon and CEO of Barloworld Coatings, former director of Barloworld Ltd, served on the remuneration and audit committees of Control Instruments (Pty) Ltd and NCS Resins (Pty) Ltd.Other directorships: Earth Probotic Industrial Ltd, Main Street 1416 (Pty) LtdExperience and expertise » Strategic leadership » Remuneration practices
EXECUTIVE DIRECTORS
10. André de Ruyter (49)Chief executive officerQualifications: BA, BLC, LLB, MBAAppointed: 1 April 2014Experience and expertise » Strategic leadership in the manufacturing sector
11. Glenn Fullerton (50)Chief financial officerQualifications: CA(SA)Appointed: 1 September 2015Experience and expertise » Financial » Strategic leadership
12. Mandisa Seleoane (44)Human resources directorQualifications: BA (Hons) Human resources and labour relations, BA (Psychology)Appointed: 1 July 2017Experience and expertise » Most recently the group human capital executive at
Adopt IT (Pty) Ltd » People management and development » Employee relations
GOVERNANCE AND REMUNERATION ] Nampak Limited Integrated Report 2017
77
HOW WE CREATE VALUE
STRATEGIC CONTEXT
STRATEGIC PERFORMANCE
GOVERNANCE AND REMUNERATION
SHAREHOLDER INFORMATIONWHO WE ARE

Executive committee
1. André de Ruyter (49)Chief executive officerQualifications: BA, BLC, LLB, MBARelevant skills and expertise » Strategic leadership in the manufacturing
sector
2. Glenn Fullerton (50)Chief financial officerQualifications: CA(SA)Relevant skills and expertise » Financial » Strategic leadership
3. Mandisa Seleoane (44)Group human resources directorQualifications: BA (Human resources and labour relations), BA (Psychology)Relevant skills and expertise » People management and development » Employee relations
The group executive committee assists the CEO in guiding and controlling the overall direction of the business. It also acts as a medium of communication and coordination between divisions, group companies and the board.
Nampak Limited Integrated Report 2017
78

4. Christiaan Burmeister (54)Group executive: DivFood and R&DQualifications: CA(SA)Relevant skills and expertise » Financial » Strategic leadership » Operational management » General management
5. Lynne Kidd (57)Group executive: Integrated strategy Qualifications: BA (Hons), Psychology (Hons) Relevant skills and expertise » Remuneration practices and policies » Employee benefits » Social and environmental issues
6. Mxolisi Khutama (41)Group executive: PlasticsQualifications: BSc Eng, PGDMM, PGDBMRelevant skills and expertise » Financial » Operational management » Business development » Administration
7. Rob Morris (55)Group executive: Africa and GlassQualifications: PrEng, BSc Eng, BComm (Hons)Relevant skills and expertise » General management » Operational management in
the Rest of Africa » Strategic leadership
8. Erik Smuts (47)Group executive: BevcanQualifications: CA(SA), ACMA, CIPM, GEDP, AMP (Harvard)Relevant skills and expertise » Financial » Operational management in
the Rest of Africa » General management » Strategic leadership
9. Ilse van Lochem (52)Group executive: Legal and secretarial Qualifications: BA, LLB, MBA, Post graduate diploma in corporate lawRelevant skills and experience » Legal » Company secretarial » Insurance
GOVERNANCE AND REMUNERATION ] Nampak Limited Integrated Report 2017
79
HOW WE CREATE VALUE
STRATEGIC CONTEXT
STRATEGIC PERFORMANCE
GOVERNANCE AND REMUNERATION
SHAREHOLDER INFORMATIONWHO WE ARE

Remuneration reportfor the year ended 30 September 2017
Nampak’s remuneration is designed to facilitate delivery of the group’s strategy and is aligned with shareholders’ expectations.
INTRODUCTION FROM THE CHAIRMAN OF THE REMUNERATION COMMITTEE
The remuneration reportThis year we have followed the same approach as we did in the previous few years in presenting a shortened version of our remuneration report within the integrated report, with the full, detailed report available online at
www.nampak.com/About/governance.
Within this report, we have provided a summary of the remuneration policy in the form of a detailed elements table, which sets out our policy regarding the different elements of executive and prescribed officer remuneration, including applicable performance conditions and targets, the target levels of pay and the maximum opportunity. To illustrate what remuneration is payable in different performance scenarios, remuneration mix graphs are provided which indicate the levels of pay at threshold and stretch performance.
King IVNampak has opted to produce a remuneration report which is fully compliant with the requirements of King IV. As such the report will contain the following three major sections:
Voting at the 2018 AGMAs required by King IV, shareholders will be asked to vote on the following in terms of a non-binding advisory vote » Remuneration policy » Implementation report
As required by the Companies Act, non-executive directors’ fees for the coming year will be put to shareholders by way of a special resolution.
We encourage all shareholders to provide feedback and contributions regarding their position on the various voting requirements. We will engage with shareholders as and when required to resolve material issues of concern.
PM SurgeyChairman of the remuneration committee
Bryanston2 November 2017
1 2 3BACKGROUND
Provides the context for
remuneration considerations and decisions
REMUNERATION POLICY
An overview of the provisions and objectives of the policy
IMPLEMENTATION REPORTActual
remuneration results for
performance concluded by
the end of the financial year
Remuneration report
Nampak Limited Integrated Report 2017
80

SECTION 1: BACKGROUND
The remuneration committee (the committee) brings experience from its participation on other remuneration committees and board positions, to assist with setting the company’s remuneration policy, and directors and prescribed officers’ remuneration, according to its charter, which can be found on the website at http://www.nampak.com/Content/Documents/
About/remuneration-committee-charter.pdf. The members of the committee and attendance of committee meetings during the year are set out on page 73 of the integrated report.
Achievement of objectivesThe committee was faced with the reality of significant retention risk of the CEO and CFO due to the earnings impact from foreign earnings repatriation issues and forex translation gain movements.
The committee thus determined that the outcomes of the current remuneration structures were not achieving the desired objective of aligning pay with performance and retaining executives who are performing well. After discussing with certain shareholders the committee determined that it was in the best interests of Nampak to make “once-off” cash retention awards to the CEO, CFO and group executive: Bevcan of 100% of guaranteed package each during the course of the financial year, for a retention period of three years.
This decision was supported by a view of both executives’ performance and contribution in the prior year where financial incentive targets were not achieved.
The performance targets for the Performance Share Plan (PSP) and the Share Appreciation Plan (SAP) were not achieved in respect of the December 2014 issues and therefore no shares will vest in December 2017.
Areas of focus for 2018 » we will look to consolidate and simplify the LTI portion of executive remuneration in only awarding PSP awards (no longer making SAP awards to executives);
» we wish to further simplify our remuneration structures and eliminate one element of double counting value drivers by removing the RONA modifier in the STI arrangement (RONA is already a PSP vesting criteria); and
» the overall remuneration structures and configuration will be assessed against desired objectives and changes contemplated where required.
External advice to the committee in 2017The remuneration structure was reviewed after considering advice from external advisers (PwC) to ensure that it remains appropriate in terms of current best market practice. Independent advisers (Vasdex Associates) were engaged to provide an alternative view on the Nampak remuneration policy, structure and remuneration report disclosure.
Voting outcomesResults of voting at the 2016 and 2017 annual general meeting are indicated in the table below:
% vote in favour
February 2017
%
February 2016
%
Remuneration policy 97.5 97.5Non-executive directors’ fees 99.9 99.9
Activities undertaken in 2017 » reviewed the guaranteed packages of the executive directors, group executive and divisional managing directors;
» reviewed performance targets applicable to the short and long-term incentives;
» established the future performance targets applicable to the short and long-term incentives;
» considered management’s recommendations for non-executive directors’ fees and the fees for the board sub-committees before recommending to the board and then to shareholders for approval;
» reviewed vesting of long-term incentives; and » reviewed salary increases for all employees.
GOVERNANCE AND REMUNERATION ] Nampak Limited Integrated Report 2017
81
HOW WE CREATE VALUE
STRATEGIC CONTEXT
STRATEGIC PERFORMANCE
GOVERNANCE AND REMUNERATION
SHAREHOLDER INFORMATIONWHO WE ARE

Remuneration report continued
for the year ended 30 September 2017
SECTION 2: REMUNERATION POLICY
Our remuneration philosophy remains largely unchanged from previous years, and continues to balance the delivery of financial and non-financial measures that underpin the group’s strategy. The objective is to support the attraction and retention of high-calibre and experienced individuals who are able to deliver under challenging conditions. Where certain changes were made, these are discussed in the sections which follow.
Guaranteed packageRetirement funding, life cover, disability cover, personal accident insurance and medical cover are provided on a defined contribution basis and form part of the guaranteed packages. Guaranteed package levels are recommended by the chief executive officer after taking into account market benchmarks, individual experience, current performance and contribution, future career progression as well as resource availability.
The remuneration committee uses the following process to make informed decisions surrounding guaranteed packages and increases:1. Size and complexity of the role is considered; 2. Director reference levels are established (with assistance
from external consultants);3. Deloitte and PwC provide general market survey data,
which takes into account similar companies with comparable market capitalisation and revenue;
4. Director reference levels are benchmarked against the market annually, using comprehensive survey and published data in related industries for each jurisdiction; and
5. Published remuneration of executives in similar roles, rolled forward by the average executive increases, is considered.
Annual cash incentive bonus (STI)The STI structure for 2017 remained unchanged from 2016. The Nampak STI can vary between an award of 0% of guaranteed package and the maximum potential awards indicated below.
Employee or employee group
Group component +
Divisional component +
Personal component =
Total(maximum
STI %)
CEO 85% + 40% = 125%CFO 74% + 31% = 105%ED 66% + 29% = 95%Prescribed officers – operations 19% + 62% + 14% = 95%
Prescribed officers – group support 60% + 25% = 85%
Group component of the STIThe group component of the CEO, CFO, executive director and prescribed officers for the current year is described in the table below. The group component is determined as a rating for group headline earnings per share (HEPS) growth multiplied by a rating for return on net assets (RONA). The RONA target was converted to use a calculation based on a 12-month net asset average and was adjusted for the sale and leaseback transaction. The RONA modifier has been removed for the coming 2018 financial year in order to eliminate duplication with LTI vesting metrics. STIs for South African executives are reduced by up to 15% for non-achievement of employment equity targets.
HEPS growth
RONA modifier
Metric 0% rating 60% rating 100% rating
Linear scaling from CPI to CPI + 9%
XLinear scaling from 11.5% to 13.5%
Nampak Limited Integrated Report 2017
82

Individual component of the STIIndividual performance targets are set and reviewed by the committee and cover progress on strategic initiatives which are considered by the board to be crucial for future growth and profitability within the group. The key performance indicators for the group for 2017 are indicated on page 25 of the integrated report.
The committee has deliberately not set weightings for key performance indicators since the exercise of assessing overall individual performance needs to be done holistically and should not become a mechanical or mathematical exercise.
Discretion of the committeeThe committee has discretion to withdraw or change the incentive bonus scheme. In addition, the committee holds overriding discretion on incentive bonus payments including a zero bonus and the RONA threshold target in the event of material corporate and strategic activities occurring, should circumstances warrant.
Annual long-term incentive (LTI) plansAnnual allocations are determined by PwC using market benchmarks which provide for upper quartile earnings for achievement of the top end performance targets. The maximum value of performance awards is set by the remuneration committee each year after taking into account individual performance and contribution, future succession and retention aspects. The standard expected value of the share plan allocations as a percentage of guaranteed package are set out below:
Awards are currently granted to the CEO, executive directors and prescribed officers under the following three plans: » Performance share plan » Share appreciation plan » Deferred bonus plan
The table below indicates the expected value of awards in the various plans applicable to the CEO, executive directors and prescribed officers:
Role
Performance share plan:
expected value as % of GP
Share appreciation
rights plan: expected value as % of GP
Total: expected value as % of GP
CEO 65% 15% 80%Executive directors 55% 15% 70%Prescribed officers 45% 10% 55%
The expected value of allocations under the deferred bonus plan has been excluded from the table as this depends on the number of shares pledged by the particular individual. Participation in the deferred bonus plan is dependent on the extent to which annual incentive bonus targets are achieved. Up to 50% of after-tax cash incentives can be used by directors to purchase shares in terms of the deferred bonus plan.
Performance share plan (PSP)The PSP provides for the granting of performance share awards to executive directors and group executive committee members on an annual basis. Vesting of shares is conditional on the group achieving specific stretch targets which are set by the remuneration committee at commencement of the three-year performance period. The performance periods commence on 1 October each year and end on 30 September three years later. Shares are allocated in the December immediately after the commencement of the performance period in order to avoid allocations during closed periods and to provide time for the stock market to adjust to the published results.
In order to align participant reward with shareholders’ returns and to support retention strategies, one-third of the shares are released and vest immediately on the vesting date, the second one-third a year after the vesting date and the final one-third two years after the vesting date or five years from the original award date. Additional shares are awarded on the release dates which equate to the dividends that were earned on the vested shares during the performance period.
The performance target for allocations in December 2016 and the proposed performance condition for the December 2017 awards are reflected below:
Role Weight
Minimum vesting
0%
Stretch vesting
60%
Maximum vesting 100%
Headline earnings per share growth 40% CPI + 9% CPI + 18% CPI + 24%Cumulative total shareholder return (TSR) 30% CPI + 9% CPI + 18% CPI + 24%RONA 30% Less than
11.5%11.5% 13.5%
Divisional component of the STIThe divisional component of the STI is only applicable to prescribed officers managing operational divisions. The targets for each metric in the divisional component are different for each particular division but the individual metrics and weightings are consistent across divisions.
EBITDA adjusted for interest
Inventory management
Safety
62%
23%
15%
Metric Weight 0% rating 60% rating 100% rating
Targets for each metric are set by the committee for each operating division
GOVERNANCE AND REMUNERATION ] Nampak Limited Integrated Report 2017
83
HOW WE CREATE VALUE
STRATEGIC CONTEXT
STRATEGIC PERFORMANCE
GOVERNANCE AND REMUNERATION
SHAREHOLDER INFORMATIONWHO WE ARE

Remuneration report continued
for the year ended 30 September 2017
Share appreciation plan (SAP)The SAP provides the remuneration committee with an instrument to retain executive directors and group executive committee members as well as providing the chief executive officer with a means to attract and retain talent at senior management levels within the group.
Under the SAP, a number of share appreciation rights are periodically offered to executive directors, group executive committee members and senior managers. These rights are conditional upon the group achieving specific performance criteria relating to real headline earnings per share growth. At the end of the three-year performance period, the number of shares that are released and vest to each participant is determined against achievement of the performance targets. The vesting structure for allocations after 2009 provides for immediate vesting if performance conditions are met and a reduction to seven years from the original award date for vested options to be exercised.
Consistent growth in headline earnings per share supports improved share price performance and forms the basis of the performance target under the SAP. As the SAP provides the retention component under the overall LTI bonus structures and a small component within the overall allocation of shares to directors and group executive committee members, the remuneration committee sets one target. The target ensures that a growth in headline earnings per share in excess of inflation is achieved before any shares vest. Therefore, no linear vesting exists between a threshold and target, and should the target (described below) not be met, no vesting will take place.
The performance target for allocations in December 2016 and the proposed performance condition for the December 2017 awards are reflected below:
Metric
Minimum vesting
0%
Maximum vesting 100%
Headline earnings per share growth < CPI + 6% >= CPI + 6%
Deferred bonus plan (DBP)The DBP is the third element of the share plan structure. The purpose of the DBP is to encourage executive directors and group executive committee members to use up to 50% of their after tax annual bonus, awarded at an operating level, to acquire shares in the company that are retained for three years. The incentive to do so is a matching award of the number of shares purchased and held for a three-year period on a one-for-one basis.
The plan supports retention aspects, encourages shareholding by executives and directly aligns executive experience with that of shareholders. For this reason, and also to reflect the fact that performance conditions are applied in order to determine the annual bonus payment, no performance conditions are imposed on the matching awards granted under this plan.
Remuneration mix at minimum, target and maximumNampak implements a minimum and maximum approach for the STI scheme and does not implement a target approach. For the purposes of illustration below, 50% of maximum is assumed to represent target. For the LTI awards, target is represented by the value expected at award and maximum represents the value should 100% of the award vest based on meeting performance targets. The LTI component represents the combination of PSP, SAP and dividends. The graphs below for executive directors and prescribed officers represent an average of all employees in those positions.
Chief executive of�cer
Max
Target
Min
■ GP ■ STI ■ LTI ■ Match
35 00030 00025 00020 00015 00010 0005 0000
Executive directors
Max
Target
Min
■ GP ■ STI ■ LTI ■ Match
0 15 00012 0009 0006 0003 000
Nampak Limited Integrated Report 2017
84
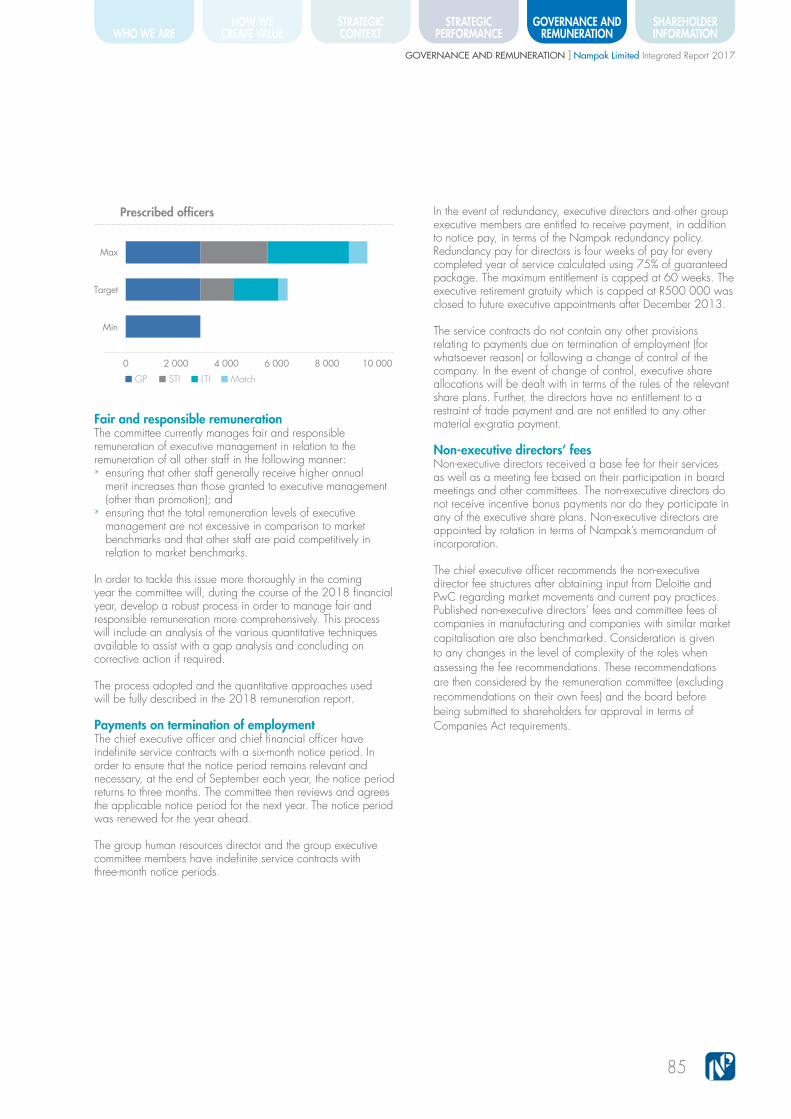
Prescribed of�cers
Max
Target
Min
■ GP ■ STI ■ LTI ■ Match
10 0008 0006 0004 0002 0000
Fair and responsible remunerationThe committee currently manages fair and responsible remuneration of executive management in relation to the remuneration of all other staff in the following manner: » ensuring that other staff generally receive higher annual merit increases than those granted to executive management (other than promotion); and
» ensuring that the total remuneration levels of executive management are not excessive in comparison to market benchmarks and that other staff are paid competitively in relation to market benchmarks.
In order to tackle this issue more thoroughly in the coming year the committee will, during the course of the 2018 financial year, develop a robust process in order to manage fair and responsible remuneration more comprehensively. This process will include an analysis of the various quantitative techniques available to assist with a gap analysis and concluding on corrective action if required.
The process adopted and the quantitative approaches used will be fully described in the 2018 remuneration report.
Payments on termination of employmentThe chief executive officer and chief financial officer have indefinite service contracts with a six-month notice period. In order to ensure that the notice period remains relevant and necessary, at the end of September each year, the notice period returns to three months. The committee then reviews and agrees the applicable notice period for the next year. The notice period was renewed for the year ahead.
The group human resources director and the group executive committee members have indefinite service contracts with three-month notice periods.
In the event of redundancy, executive directors and other group executive members are entitled to receive payment, in addition to notice pay, in terms of the Nampak redundancy policy. Redundancy pay for directors is four weeks of pay for every completed year of service calculated using 75% of guaranteed package. The maximum entitlement is capped at 60 weeks. The executive retirement gratuity which is capped at R500 000 was closed to future executive appointments after December 2013.
The service contracts do not contain any other provisions relating to payments due on termination of employment (for whatsoever reason) or following a change of control of the company. In the event of change of control, executive share allocations will be dealt with in terms of the rules of the relevant share plans. Further, the directors have no entitlement to a restraint of trade payment and are not entitled to any other material ex-gratia payment.
Non-executive directors’ feesNon-executive directors received a base fee for their services as well as a meeting fee based on their participation in board meetings and other committees. The non-executive directors do not receive incentive bonus payments nor do they participate in any of the executive share plans. Non-executive directors are appointed by rotation in terms of Nampak’s memorandum of incorporation.
The chief executive officer recommends the non-executive director fee structures after obtaining input from Deloitte and PwC regarding market movements and current pay practices. Published non-executive directors’ fees and committee fees of companies in manufacturing and companies with similar market capitalisation are also benchmarked. Consideration is given to any changes in the level of complexity of the roles when assessing the fee recommendations. These recommendations are then considered by the remuneration committee (excluding recommendations on their own fees) and the board before being submitted to shareholders for approval in terms of Companies Act requirements.
GOVERNANCE AND REMUNERATION ] Nampak Limited Integrated Report 2017
85
HOW WE CREATE VALUE
STRATEGIC CONTEXT
STRATEGIC PERFORMANCE
GOVERNANCE AND REMUNERATION
SHAREHOLDER INFORMATIONWHO WE ARE

Remuneration report continued
for the year ended 30 September 2017
SECTION 3: IMPLEMENTATION REPORT
The implementation report details the outcomes of implementing the approved policy in the current financial year, as detailed in section 2 of this report.Deviations from policyAs indicated earlier in this report, after much deliberation and discussion with certain shareholders, the committee decided to make “once-off” retention awards to the CEO, CFO and group executive: Bevcan. This is a “once-off” deviation from current policy.
2017 guaranteed package (GP)The following increases to GP were implemented in the reporting period for executive directors and prescribed officers, where the new amounts were applicable from 1 October 2016 to 30 September 2017.
GP at 30 September
2017
GP at 30 September
2016 % increase
Executive directorsAM de Ruyter 7 277 200 6 801 090 7.0%GR Fullerton 4 879 200 4 560 000 7.0%MMF Seleoane 2 850 000 – –FV Tshiqi 3 065 300 2 891 767 6.0%Prescribed officersC Burmeister 2 890 900 2 722 140 6.2%M Khutama1 2 771 600 2 200 000 26.0%LD Kidd 2 700 000 – –RG Morris 3 528 100 3 341 000 5.6%NP O’Brien 2 776 800 2 617 184 6.1%EE Smuts2 3 508 100 2 983 704 17.6%IH van Lochem 2 700 000 – –1 Market alignment increase applied in addition to merit increase of 6.6% to align GP with appropriate market levels for group executive committee member.2 Market alignment increase applied in addition to merit increase of 5.0% to align GP with appropriate market levels for group executive committee member.
The average merit increase of 6.1% (2016: 3.7%) for executive directors and prescribed officers in the table above compares to an average of 9.6% (2016: 7.7%) for the rest of the company.
Nampak Limited Integrated Report 2017
86

2017 STIThe committee’s assessment of performance against targets set for the various elements of the STI are indicated in the table below:
0% – 100%
There were varying performance achievements against the EBITDA adjusted for interest, inventory and safety targets.
Bevcan: Strong performance against targets.
Glass and DivFood: Challenging year.
Plastics: Advanced work to sustainably improve performance.
Rest of Africa: Impacted by foreign exchange liquidity.
Refer to the operational reviews for more detail.
57% – 100%
The key performance indicators for the group are indicated in the table below, together with the degree of performance against target on each.
Each executive director and prescribed officer is measured against an individually configured weighting of KPIs which may vary slightly in definition from the list indicated below.
Key performance indicators Performance
Improve safety performance
Focus on integrity and ethics management
Deleverage balance sheet
Manage liquidity
Manage inventory
Implement DivFood planReduce Bevcan spoilage; ensure solid project execution and minimise impacts of competitor activityEffect glass operating efficiency improvements and business turnaroundAchieve plastics operational excellence targets, business turnaround and new customers
Ensure world-class project execution
Secure operational excellence
Maintain project pipeline in Rest of Africa
Establish functional Nampak Enterprise Bargaining Forum
Enhance energy and water efficiency
Range of final ratings
Description
100%
The group achieved HEPS growth in excess of CPI +9% as well as the RONA target set for incentive purposes.
Group component
Divisional component Individual component
The result of applying the ratings indicated in the table above to the relevant reward policy of splits between group, divisional and individual components is indicated in the table below. The employment equity targets were achieved in 2017.
Group component
+ Divisional component
+ Individual component
=2017 STI % of GP
2016 STI % of GP
Executive directorsAM de Ruyter 85% + 27% = 112% 36%GR Fullerton 74% + 29% = 103% 37%MFF Seleoane 66% + 29% = 95%FV Tshiqi 66% + 25% = 91% 27%Prescribed officersC Burmeister 19% + 14% + 8% = 41% 61%M Khutama 19% + 23% + 10% = 52% 33%LD Kidd1 47% + 18% = 65%RG Morris 19% + 22% + 12% = 53% 55%NP O’Brien 60% + 20% = 80% 23%EE Smuts 19% + 57% + 14% = 90% 33%IH van Lochem1 7% + 7% + 17% = 31%1 STI is calculated on a weighted average for the period before and after appointment as prescribed officers.
Good progress made Some progress, more to come
Disappointing performance
GOVERNANCE AND REMUNERATION ] Nampak Limited Integrated Report 2017
87
HOW WE CREATE VALUE
STRATEGIC CONTEXT
STRATEGIC PERFORMANCE
GOVERNANCE AND REMUNERATION
SHAREHOLDER INFORMATIONWHO WE ARE

Remuneration report continued
for the year ended 30 September 2017
2017 LTI performance assessmentPSP awards made in December 2014 will vest in December 2017. The performance period for these awards concludes on 30 September 2017 and these awards will vest according to the following vesting percentages:
Metric WeightMinimum
0%Maximum
100% Achievement Result
Growth in HEPS 40% CPI + 9% CPI + 24% < CPI + 9% 0%Cumulative TSR 30% CPI + 9% CPI + 24% < CPI + 9% 0%RoE 30% < 15.5% 17.5% < 15.5% 0%Overall result 100% 0%
SAP awards made in December 2014 will vest in December 2017. The performance period for these awards concludes on 30 September 2017 and these awards will vest according to the following vesting percentages:
Metric WeightMinimum
0%Maximum
100% Achievement Result
Growth in HEPS 100% < CPI + 6% CPI + 6% < CPI + 6% 0%
The single total figure of remunerationThe following tables disclose the total remuneration received and receivable by executive directors and prescribed officers.
Executive directorsAM de Ruyter
2017(R’000)
2016(R’000) %
Basic salary 7 028 6 369Retirement funding 249 432GP 7 277 6 801 7.0Value of other benefits1 22 20Retention/termination4 – 7 277STI 8 165 2 442Cash remuneration 15 464 16 540 (6.5)SAP awards2 – –PSP awards2 – 755Matching awards3 763 –
Total remuneration 16 227 17 295 (6.2)
GR Fullerton
2017(R’000)
2016(R’000) %
Basic salary 4 545 3 831Retirement funding 334 32GP 4 879 3 863 26.3Value of other benefits1 15 12Retention/termination4 – 4 879STI 5 046 1 436Cash remuneration 9 940 10 190 (2.5)SAP awards2 – –PSP awards2 – –Matching awards3 – –
Total remuneration 9 940 10 190 (2.5)
Nampak Limited Integrated Report 2017
88

FV Tshiqi6
2017(R’000)
2016(R’000) %
Basic salary 2 121 2 642Retirement funding 178 250GP 2 299 2 892 (20.5)Value of other benefits1 7 9Retention/termination6 961 –STI 2 086 766Cash remuneration 5 353 3 667 46.0SAP awards2 – –PSP awards2 – 367Matching awards3 228 –
Total remuneration 5 581 4 034 38.3
MMF Seleoane5
2017(R’000)
2016(R’000) %
Basic salary 876Retirement funding 74
GP 950Value of other benefits1 3Retention/termination –STI 902
Cash remuneration 1 855SAP awards2 –PSP awards2 –Matching awards3 –
Total remuneration 1 855
Prescribed officersC Burmeister
2017R’000
2016R’000 %
Basic salary 2 655 2 476Retirement funding 236 246GP 2 891 2 722 6.2Value of other benefits1 9 8Retention/termination – –STI 1 194 1 664Cash remuneration 4 094 4 394 (6.8)SAP awards2 – –PSP awards2 – 236Matching awards3 131 32Total remuneration 4 225 4 662 (9.4)
LD Kidd7
2017R’000
2016R’000 %
Basic salary 2 341 –Retirement funding 228 –GP 2 569 –Value of other benefits1 8 –Retention/termination – –STI 1 673 –Cash remuneration 4 250 –SAP awards2 – –PSP awards2 – –Matching awards3 129 –Total remuneration 4 379 –
M Khutama
2017R’000
2016R’000 %
Basic salary 2 531 1 992Retirement funding 241 208GP 2 772 2 200 26.0Value of other benefits1 8 7Retention/termination – –STI 1 466 721Cash remuneration 4 246 2 928 45.0SAP awards2 – –PSP awards2 – –Matching awards3 – –Total remuneration 4 246 2 928 45.0
RG Morris
2017R’000
2016R’000 %
Basic salary 3 297 3 067Retirement funding 231 274GP 3 528 3 341 5.6Value of other benefits1 11 10Retention/termination – –STI 1 900 1 823Cash remuneration 5 439 5 174 5.1SAP awards2 – –PSP awards2 – 393Matching awards3 252 84Total remuneration 5 691 5 651 0.7
GOVERNANCE AND REMUNERATION ] Nampak Limited Integrated Report 2017
89
HOW WE CREATE VALUE
STRATEGIC CONTEXT
STRATEGIC PERFORMANCE
GOVERNANCE AND REMUNERATION
SHAREHOLDER INFORMATIONWHO WE ARE

Remuneration report continued
for the year ended 30 September 2017
NP O’Brien8
2017R’000
2016R’000 %
Basic salary 2 334 2 376Retirement funding 211 241GP 2 545 2 617 (2.8)Value of other benefits1 7 8Retention/termination10 1 042 –STI 2 030 599Cash remuneration 5 624 3 224 74.4SAP awards2 – –PSP awards2 – 292Matching awards3 191 61
Total remuneration 5 815 3 577 62.6
IH van Lochem9
2017R’000
2016R’000 %
Basic salary 1 525Retirement funding 149
GP 1 674Value of other benefits1 5Retention/termination10 –STI 529
Cash remuneration 2 208SAP awards2 –PSP awards2 –Matching awards3 –
Total remuneration 2 208
EE Smuts
2017R’000
2016R’000 %
Basic salary 3 314 2 731Retirement funding 194 253GP 3 508 2 984 17.6Value of other benefits1 11 8Retention/termination10 3 508 –STI 3 168 989Cash remuneration 10 195 3 981 156SAP awards2 – –PSP awards2 – 302Matching awards3 202 154
Total remuneration 10 397 4 437 134.3 1 Other benefits refer to group personal accident cover. 2 SAP and PSP awards disclosed were awarded in December 2014 (2016:
December 2013), with the applicable performance period ended 30 September 2017 (2016: 30 September 2016). Values represented are calculated using the VWAP as at 30 September 2017 (2016: 30 September 2016).
3 Matching awards disclosed were purchased in December 2014 (2016: December 2013), with expected matching to occur December 2017 (2016: December 2016) based on employment and not performance conditions. Values represented are at the time of matching since the scheme is a voluntary election and final value is dependent on share price movements. This choice of treatment ensures consistency with the treatment of SAP and PSP awards. 2016 tables have been restated to include the matching award valuation.
4 Cash retention awards paid to the CEO, CFO and group executive: Bevcan in the 2017 financial year in recognition of the performance and contributions made in the 2016 financial year.
5 MMF Seleoane was appointed with effect from 1 June 2017. 6 FV Tshiqi retired with effect from 30 June 2017. Termination pay comprises
a gratuity of R500 000, leave pay of R453 948 and a farewell gift to the value of R7 500.
7 LD Kidd appointed to the group executive committee with effect from 1 September 2017. Remuneration disclosed is for the full financial year.
8 NP O’Brien retired with effect from 31 August 2017. Termination pay comprises a gratuity of R500 000, leave pay of R533 918 and a farewell gift to the value of R7 500.
9 IH van Lochem appointed to the group executive committee with effect from 1 September 2017. Remuneration disclosed is for the full financial year.
10 Cash retention award to be paid to the group executive: Bevcan in the 2018 financial year in recognition of the performance and contribution made in the 2017 financial year and secures retention.
Nampak Limited Integrated Report 2017
90

The share disclosure tablesDisclosure of the quantum and value of awards outstanding at the beginning of the reporting period, as well as new awards made during the reporting period, will be provided for in the separate and full remuneration report available at www.nampak.com/About/governance.
Non-executive directors’ remuneration 2017/2016The non-executive director remuneration paid during the year under review (as approved previously by shareholders) and the total comparative figure for 2016 are disclosed below:
Name
Directors’ fee
(rand)
Audit committee total fees
(rand)
Remuneration committee
total fees (rand)
Nomination committee total fees
(rand)
Investment committee total fees
(rand)
Risk andsustain-ability
committee total fees
(rand)
Social, ethics and
transfor-mation
committee total fees
(rand)
Total 2017 (rand)
Total 2016 (rand)
RC Andersen4 265 700 300 773 104 400 69 450 113 420 51 783 – 905 526 799 750E Ikazoboh 265 700 – – – 86 800 – – 352 500 315 300J John5 107 382 72 004 – – – – – 179 386 –RJ Khoza 247 400 – – 63 150 – – – 310 550 339 450NV Lila3 265 700 179 250 – – – 187 400 – 632 350 623 101PM Madi 247 400 – – – 78 000 95 600 187 400 608 400 590 600TT Mboweni1 1 767 450 – – – – – – 1 767 450 1 667 400IN Mkhari6 265 700 196 250 – – 145 680 – 95 600 703 230 616 100DC Moephuli2 76 851 – – – 26 217 35 017 – 138 085 397 200CWN Molope7 95 151 166 256 – – – 35 017 – 296 424 727 802PM Surgey 285 100 17 000 202 500 69 450 – 95 600 95 600 765 250 710 900
3 889 534 931 533 306 900 202 050 450 117 500 417 378 600 6 659 151 6 787 603 Directors’ fees are shown including VAT where applicable.1 Fee includes participation in board sub-committees’ meetings.2 Fee donated to Transnet Foundation. DC Moephuli resigned from the board and all committees with effect from 1 February 2017.3 NV Lila took over chairman role of the risk and sustainability committee from CWN Molope with effect from 3 November 2016.4 RC Andersen took over chairman role of the audit committee from CWN Molope with effect 1 February 2017 and joined the risk and sustainability committee on
the same day.5 J John appointed to the board and audit committee with effect 5 May 2017.6 IN Mkhari took over the role of chairman of the investment committee from RC Andersen with effect 1 February 2017.7 CWN Molope resigned from the board an all committees with effect 1 February 2017.
GOVERNANCE AND REMUNERATION ] Nampak Limited Integrated Report 2017
91
HOW WE CREATE VALUE
STRATEGIC CONTEXT
STRATEGIC PERFORMANCE
GOVERNANCE AND REMUNERATION
SHAREHOLDER INFORMATIONWHO WE ARE

INTRODUCTION The social, ethics and transformation committee discharged all its responsibilities and carried out all the functions assigned to it in terms of regulation 43 made under the Companies Act, No 71 of 2008, and as contained in the committee’s charter.
COMPOSITION AND MEETING PROCEDURESIn 2017, the committee was chaired by an independent non-executive director of the company. It also comprised two independent non-executives. Key senior executives, including the CEO and the group human resources director, attended the meetings of the committee, which met twice.
ROLE, PURPOSE AND PRINCIPAL FUNCTIONSThe committee operates within written terms of reference which are reviewed from time to time.
Transformation responsibilities » Recommending transformation commitments and targets for approval by the board;
» Ongoing revision of the group’s approach, charter and targets in respect of B-BBEE;
» Ongoing revision of the group corporate social investment approach; and
» Ensuring that appropriate programmes, resources and internal committees are in place to drive transformation.
Social and ethics responsibilitiesMonitoring Nampak’s activities relating to social and economic development, including its standing in terms of the goals and purposes of: » the United Nations Global Compact Principles; » the OECD recommendations regarding corruption; » the Employment Equity Act; and » the Broad-Based Black Economic Empowerment Act; » Monitoring the company’s activities relating to good corporate citizenship, including the company’s: – promotion of equality, prevention of unfair discrimination and the elimination of corruption;
– contribution to development of the communities in which the company’s activities are predominantly marketed or within which its products are predominantly manufactured and marketed;
– record of sponsorship, donations and charitable giving; – consumer relationships, including the company’s advertising, public relations and compliance with consumer protection laws; and
– labour and unemployment including the company’s standing in terms of the International Labour Organisation Protocol on decent work and working conditions.
Assisting the board in building and sustaining an ethical corporate culture. In this regard, the committee continued to allocate time to evaluating the reports from the Tip-Offs Anonymous ethics line, in order to monitor trends, and any disciplinary action that had been implemented as a result thereof. The group human resources director, in her capacity as ethics officer for the group, did not report any issues to the board in the year under review.
REPORT ON KEY RESPONSIBILITIES TransformationNampak considers transformation imperative. The committee monitors the company’s performance against its B-BBEE targets in each category on the scorecard. We were disappointed by the significant downgrade in the group’s contributor status in the year as a result of the reconfiguration of the B-BBEE codes. In December 2016, Empowerdex accorded Nampak a level 6 contributor status, compared to level 3 achieved during 2015. We have not been pushed off course and have redoubled our efforts on every aspect of B-BBEE to improve this position.
The lock-in period of the Nampak Black Management Trust (the Trust) which was established in October 2005 as part of Nampak’s B-BBEE transaction expired on 31 December 2015. Nampak originally provided a founding grant to the Trust which purchased 27 369 195 Nampak shares at a price of R15.13 per share. The shares were allocated to 679 black managers in the employ of Nampak (the beneficiaries) and the Trust required these shares to be released to the beneficiaries on expiry of the 10-year lock-in period at 31 December 2015. On expiry of the lock-in period, the Trust was required to sell sufficient shares to pay Nampak an amount equal to the founding grant plus a notional return equal to 85% of the prime overdraft rate, less any dividends received by the Trust on the shares that it owned (the hurdle rate). At 31 December 2015, 189 beneficiaries were still in the employ of Nampak, while 490 of the beneficiaries had left Nampak. The share price at 31 December 2015 was above the hurdle rate, and all the beneficiaries that were no longer active employees of Nampak either sold all their shares or sold sufficient shares to pay the income tax that was due with the balance of the shares transferred into their own names. Active employees were provided the same options as the beneficiaries that left Nampak but were also provided with an additional option that allowed them to extend their participation in the Trust to 15 February 2017. At that point, as the share price was below the hurdle rate at that date, their participation was automatically extended to 31 December 2017. The decision to provide extended participation to active employees was premised on the basis that, as managers still in the employ
Social, ethics and transformation committee report
Nampak Limited Integrated Report 2017
92

of Nampak, they could be able to contribute significantly to Nampak’s performance and profitability during the period of the extension, thereby helping to improve the Nampak share price and potentially their own personal reward. Fifty-eight managers elected to extend their participation in the Trust. As at 30 September 2017, the hurdle rate was higher than the share price. The Trust will unwind on 31 December 2017.
Corporate social investmentNampak’s approach to corporate social investment is well established and we are pleased with the long-term relationships that have been cultivated with the seven carefully selected schools that we sponsor in areas near our operations. The extent of accountability of the Nampak management responsible for each of these schools is quite remarkable: the approach is not one of simply funding schools, but getting involved in assisting with many of the issues the schools face. During the year, we adopted a similar approach to CSI in our key markets in the Rest of Africa, receiving reports on the various initiatives undertaken beyond the borders of South Africa. While we continue to target contributions of 1% of net profit after tax in South Africa, we are looking for opportunities to extend this philosophy to the material operations in the Rest of Africa. In the year one of our bursars joined the Nampak graduate development programme.
Enterprise developmentWe continue to seek opportunities to sustainably increase our participation in enterprise development activities. We continued our support for several enterprise development initiatives during 2017, including TinPac packaging, Last Drop Juice and Vukani MaNtuli.
SocialThe committee considered and is satisfied with the progress in monitoring the company’s compliance with the company’s code of conduct and business ethics and the United Nations Global Compact’s 10 principles on human rights, labour, the environment and anti-corruption. The committee is pleased to report that there were no reportable offences during the year.
Integrity and ethicsIn the year we refreshed the Nampak values to include “safety”, alongside “excellence”, “responsibility”, “teamwork” and “integrity”. We made certain updates to our code of conduct and business ethics to ensure that we are comfortable in the face of the new phenomenon South Africa faces that is state capture. All directors and employees, irrespective of the country in which they are employed, are obligated under the same code to act with honesty and integrity and to maintain the highest ethical standards. The committee ensures that the code is enforced and by monitoring disciplinary action and sanctions, and can report that appropriate action has been taken.
Nampak operates Tip-Offs Anonymous, a hotline which allows callers to report confidentially on any violations of Nampak’s policies and procedures. All disclosures received, resultant investigations and the outcome thereof are communicated and reported to the social, ethics and transformation committee as well as the audit committee. A total of 29 (24 in 2016) reports were received in 2017, which resulted in 12 (six in 2016) disciplinary hearings and four (one in 2016) dismissals.
As a result of Tip-Offs Anonymous reports, 41 (33 in 2016) forensic reviews were conducted in addition to investigations. The reviews resulted in 10 (12 in 2016) disciplinary hearings, which led to six (three in 2016) dismissals. The remaining reviews did not reveal substantiated evidence of misconduct or irregularities.
No human rights violations were reported during the year, nor were any material incidents of corruption detected or reported.
Health and safetyThe committee recognises the importance of health and safety in the workplace and monitors performance against safety targets. We are pleased with the overall improvements in safety performance at our manufacturing operations and continue to support the linkage of safety performance to individual incentive bonus payments. OHSAS 18000 certification or other safety standards is held at 18 sites.
Customer relationshipsThe committee reviewed performance against customer and consumer legislation and regulations and noted that there were no material breaches.
We were pleased to note that 38 out of 54 manufacturing sites held quality certification. In addition, the manufacturing operations receive certification for various food safety standards with 32 out of 54 operations holding the standards required by their customers. Our smaller operations are subject to peer audits on a regular basis where it is not appropriate to implement and audit the full standard requirements. The operations are also subject to regular audits by over 40 customers.
PM Madi Chairman of the social, ethics and transformation committee
Bryanston28 November 2017
GOVERNANCE AND REMUNERATION ] Nampak Limited Integrated Report 2017
93
HOW WE CREATE VALUE
STRATEGIC CONTEXT
STRATEGIC PERFORMANCE
GOVERNANCE AND REMUNERATION
SHAREHOLDER INFORMATIONWHO WE ARE

Notice of annual general meeting
Nampak Limited(the company)Incorporated in the Republic of South AfricaRegistration number: 1968/008070/06Share code: NPK ISIN: ZAE000071676
Notice is hereby given that the 50th annual general meeting of shareholders of Nampak Ltd will be held on Thursday, 1 February 2018 at 12:00 at The Forum at The Campus, Wanderers building, 57 Sloane Street, Bryanston, 2021, South Africa.
The board of directors of Nampak Ltd (the board) has determined, in accordance with section 59 of the Companies Act, No 71 of 2008 (the Companies Act), that the record date for purposes of determining which shareholders are entitled to receive this notice is Friday, 8 December 2017. The record date for persons to be recorded as shareholders in the securities register of the company in order to be able to attend, participate and vote at the annual general meeting, is Friday, 26 January 2018. Accordingly, the last date to trade in order to be registered in the company’s securities register is Tuesday, 23 January 2018.
The holders of Nampak Ltd shares (the shareholders) and any persons who are not shareholders but who are entitled to exercise any voting rights in relation to the resolutions to be proposed at the meeting as at the record date of Friday, 26 January 2018, (collectively the holders or you), are entitled to participate in and vote at the annual general meeting in person or by proxy/ies.
This document is available in English only. Your attention is drawn to the notes at the end of this notice, which contain important information with regard to participation in the annual general meeting.
The purpose of the annual general meeting is for the following business to be transacted and for you to consider and, if approved, to pass with or without modification, the following ordinary and special resolutions, in the manner required by the Company’s memorandum of incorporation (MOI), the Companies Act, as read with the Listings Requirements of the stock exchange operated by the JSE Limited (the JSE) (the Listings Requirements):
PRESENTATION OF ANNUAL FINANCIAL STATEMENTS AND SOCIAL AND ETHICS REPORT1. Annual financial statements The consolidated audited annual financial statements of
the company and of the Nampak group, for the financial year ended 30 September 2017, together with the directors’ report, the audit committee report and the report from the external auditors, are available and can be obtained from the Nampak website at www.nampak.com. Summarised annual financial statements are included in the integrated report distributed with this notice; and
2. Social and ethics report The report of the social, ethics and transformation
committee for the financial year ended 30 September 2017, as required in terms of Regulation 43(5)(c) of the Companies Regulations, 2011 (the Regulations) is set out on pages 92 and 93 of the integrated report.
Nampak Limited Integrated Report 2017
94

ORDINARY RESOLUTIONSOrdinary resolutions, save to the extent expressly provided in respect of a particular matter contemplated in the Listings Requirements or MOI, shall be adopted with the support of more than 50% of the voting rights exercised on the resolution by those persons present at the meeting.
3. Election of retiring directors The holders are required to vote on the election, each by
way of a separate vote, of the following directors who are required to retire as directors of the company in terms of clause 29.1 of the MOI, and who are eligible and available for re-election, and therefore the holders are required to:
3.1 Ordinary resolution number 1 – re-election of RJ Khoza
“RESOLVE that RJ Khoza be and is hereby re-elected as director of the company”;
3.2 Ordinary resolution number 2 – re-election of TT Mboweni
“RESOLVE that TT Mboweni be and is hereby re-elected as director of the company”;
3.3 Ordinary resolution number 3 – re-election of IN Mkhari
“RESOLVE that IN Mkhari be and is hereby re-elected as director of the company”; and
3.4 Ordinary resolution number 4 – re-election of E Ikazoboh
“RESOLVE that E Ikazoboh be and is hereby re-elected as director of the company.”
The nomination committee has recommended the eligibility of the directors after due consideration of, inter alia, past performance and contributions made. It is the board’s view that the re-election of the directors referred to above would enable the company to reliably maintain a mixture of diversity, experience and skills relevant to the company and enable the company to maintain a balance of executive, non-executive and independent directors on the board.
Brief biographies of the aforementioned directors are included on pages 76 and 77 of the integrated report, distributed with this notice.
4. Election of new directors The holders are required to vote on the election, each
by way of a separate vote, of the following directors who were appointed by the board after the previous annual general meeting in terms of clause 28.3 of the MOI and who will cease to hold office at the end of the annual general meeting, unless they are elected at the annual general meeting, and therefore the holders are required to:
4.1 Ordinary resolution number 5 – election of J John “RESOLVE that J John be and is hereby elected as
director of the company”; and
4.2 Ordinary resolution number 6 – election of MMF Seleoane
“RESOLVE that MMF Seleoane be and is hereby elected as director of the company.”
J John was appointed as a director with effect from 5 May 2017 to fill a vacancy on the board. MMF Seleoane became the executive director: human resources with effect from 1 July 2017.
Brief biographies of the aforementioned directors are included on pages 76 and 77 of the integrated report, distributed with this notice.
SHAREHOLDER INFORMATION ] Nampak Limited Integrated Report 2017
95
HOW WE CREATE VALUE
STRATEGIC CONTEXT
STRATEGIC PERFORMANCE
GOVERNANCE AND REMUNERATION
SHAREHOLDER INFORMATIONWHO WE ARE

Notice of annual general meeting continued
5. Ordinary resolution number 7 – appointment of external auditors
The holders are required to vote on the appointment of Deloitte & Touche to act as the company’s independent external auditor until the end of the next annual general meeting.
The committee is satisfied that Deloitte & Touche and the individual auditor responsible for performing the functions of auditor are accredited as such on the JSE list of auditors and their advisers as required by the JSE Listings Requirements.
The audit committee has concluded that the appointment of Deloitte & Touche will comply with the requirements of the Companies Act and the Regulations, and accordingly nominates Deloitte & Touche for re-appointment as external auditor of the company, until the next annual general meeting and noted that Mr Trushar Kalan will undertake the audit during the financial year ending 30 September 2018 as the individual registered auditor of Deloitte & Touche.
The auditor will be re-appointed automatically without any resolution being passed if none of the circumstances set out in section 90(6) of the Companies Act apply as at the date of the annual general meeting.
6. Appointment of members of the audit committee The holders are required to vote on the election, each
by way of a separate vote, of the members of the audit committee of the company, and therefore the holders are required to:
6.1 Ordinary resolution number 8 – appointment of RC Andersen
“RESOLVE that RC Andersen be and is hereby elected a member of the audit committee of the company to hold office until the end of the next annual general meeting”;
6.2 Ordinary resolution number 9 – appointment of NV Lila
“RESOLVE that NV Lila be and is hereby elected a member of the audit committee of the company to hold office until the end of the next annual general meeting”;
6.3 Ordinary resolution number 10 – appointment of IN Mkhari
“RESOLVE that IN Mkhari be and is hereby elected a member of the audit committee of the company to hold office until the end of the next annual general meeting”; and
6.4 Ordinary resolution number 11 – appointment of J John
“RESOLVE that J John be and is hereby elected a member of the audit committee of the company (subject to her being elected as director in terms of ordinary resolution number 5) to hold office until the end of the next annual general meeting.”
At the date of this notice, there are no vacancies on the audit committee.
Nampak Limited Integrated Report 2017
96
The board has reviewed the proposed composition of the audit committee against the requirements of the Companies Act and the Regulations1, and has confirmed that the proposed audit committee will comply with the relevant requirements, and has the necessary knowledge, skills and experience to enable the audit committee to perform its duties in terms of the Companies Act. The board recommends the election by holders of the directors listed above as members of the audit committee, to hold office until the end of the next annual general meeting.
Brief biographies of the aforementioned directors are included on pages 76 and 77 of the integrated report, distributed with this notice.
NON-BINDING ADVISORY VOTESThe holders are required to consider and vote on the resolutions set out below, in the manner required by the Listings Requirements as read with the Report on Corporate Governance for South Africa 2016 (King IVTM), and therefore the holders are required to:
7. Remuneration policy of the company “ENDORSE on an advisory basis the company’s
remuneration policy (excluding the remuneration of the non-executive directors for their services as directors and members of board committees and the audit committee) as set out on pages 80 to 85 of the company’s integrated report for the year ended 30 September 2017”; and
8. Implementation report of the company’s remuneration policy
“ENDORSE on an advisory basis the implementation report of the company’s remuneration policy as set out on pages 86 to 91 of the company’s integrated report for the year ended 30 September 2017.”
Reason for advisory endorsement In terms of the Listings Requirements and King IVTM,
advisory votes should be obtained from the shareholders on the company’s remuneration policy and implementation report of the company’s remuneration policy. The votes allow shareholders to express their views on the remuneration policy adopted and the extent of the implementation of the company’s remuneration policy, but votes are not binding on the company.
1 Sections 94(4) and 94(5) of the Companies Act read with Regulation 42.
SHAREHOLDER INFORMATION ] Nampak Limited Integrated Report 2017
97
HOW WE CREATE VALUE
STRATEGIC CONTEXT
STRATEGIC PERFORMANCE
GOVERNANCE AND REMUNERATION
SHAREHOLDER INFORMATIONWHO WE ARE

Notice of annual general meeting continued
SPECIAL RESOLUTIONSSpecial resolutions shall be adopted with the support of at least 75% of the voting rights exercised on the resolution of those persons present at the meeting. The holders are required to:
9. Special resolution number 1 – approval of non-executive directors’ remuneration “RESOLVE that for the period commencing 1 October 2017 until this resolution is replaced, the remuneration payable to non-
executive directors of the company for their services as directors is as follows:
Proposed fees (note1) Current fees
Board/committee
Total proposed fee per annum
(rand)
Base fee per annum
(rand)
Fee per meeting for attendance
(rand)
Number of formal meeting
scheduled per annum
Total fee per annum
(rand)
Non-executive chairman (note 2) 1 870 000 1 767 450Non-executive director 281 300 184 300 19 400 5 265 700Chairman of the audit committee 287 000 167 300 39 900 3 271 250Member of the audit committee 153 700 99 700 18 000 3 145 250Chairman of the nominations committee Member of the nominations committee 73 500 60 100 6 700 2 69 450Chairman of the investment committee (note 3) 166 300 16 000 Member of the investment committee (note 3) 82 500 9 300 Chairman of the remuneration committee 198 300 166 300 16 000 2 187 400Member of the remuneration committee 101 100 82 500 9 300 2 95 600Chairman of the risk and sustainability committee 198 300 166 300 16 000 2 187 400Member of the risk and sustainability committee 101 100 82 500 9 300 2 95 600Chairman of the social, ethics and transformation committee 198 300 166 300 16 000 2 187 400Member of the social, ethics and transformation committee 101 100 82 500 9 300 2 95 6001. The proposed fees are exclusive of VAT.2. Single fee for the role of non-executive chairman and participation in sub-committee meetings, including fee for chairing nominations committee.3. Formal meetings not scheduled. Meeting fees paid only when investment committee meetings are required.
Nampak Limited Integrated Report 2017
98

Reason and effect of special resolution number 1 In terms of section 65(11)(h) of the Companies Act, read
with sections 66(8) and 66(9) of the Companies Act, remuneration may only be paid to directors for their services as directors in accordance with a special resolution approved by the holders within the previous 2 (two) years, and only if this is not prohibited in terms of the MOI.
The proposed remuneration payable to non-executive directors is based on best practice and aimed at ensuring fair and competitive remuneration. It is important for the company to attract and retain directors with the relevant experience and skills to effectively lead the company.
10. Special resolution number 2 – financial assistance in terms of sections 44 and 45 of the Companies Act
“TO AUTHORISE, to the extent required in terms of sections 44 and 45 of the Companies Act, the board (or any person/s authorised by the board), as it thinks fit, but subject to compliance with the requirements of the MOI, the Companies Act and the Listings Requirements applicable to the company, to grant authority to the company to provide:(I) direct or indirect financial assistance as contemplated
in section 44 of the Companies Act to any person approved by the Board (or any person/s to whom the Board has delegated the power to approve recipients of the financial assistance);
(II) direct or indirect financial assistance as contemplated in section 45 of the Companies Act to: » a related or inter-related company or corporation as contemplated in the Companies Act; and/or
» to a member of such a related or inter-related company or corporation; and/or
» to a director or prescribed officer of a related or inter-related company; and/or
» to a person related to any such company, corporation, member, director or prescribed officer,
for any purpose in the normal course of business of the Nampak group, and any black economic empowerment transaction, at any time during a period of 2 (two) years commencing on the date that this special resolution is passed.
The board will, before making any such financial assistance available satisfy itself that immediately after providing the financial assistance, the company will satisfy the solvency and liquidity test as contemplated in the Companies Act and that the terms under which the financial assistance is proposed to be given are fair and reasonable to the company.”
Reason for and effect of special resolution number 2 Special resolution number 2 is proposed in order to
comply with the requirements of sections 44 and 45 of the Companies Act. Financial assistance in terms of sections 44 and 45 of the Companies Act must be approved by a special resolution of the holders, adopted within the previous 2 (two) years.
The effect of special resolution number 2 will be to, amongst others, ensure that Nampak’s subsidiaries and other related and inter-related companies and corporations have access to financing and/or financial backing from Nampak.
11. Special resolution number 3 – general authority to repurchase company shares
“TO AUTHORISE the board, as it in its discretion deems fit, but subject to compliance with the MOI, section 48 of the Companies Act and the Listings Requirements applicable to the company, to approve the general repurchase by the company or purchase by any of its subsidiaries (repurchase) of any of the company’s ordinary shares provided that:(i) the number of shares acquired in any one financial
year shall not exceed 10% (ten percent) of the shares in issue in the applicable class at the date on which this resolution is passed;
SHAREHOLDER INFORMATION ] Nampak Limited Integrated Report 2017
99
HOW WE CREATE VALUE
STRATEGIC CONTEXT
STRATEGIC PERFORMANCE
GOVERNANCE AND REMUNERATION
SHAREHOLDER INFORMATIONWHO WE ARE

Notice of annual general meeting continued
(ii) a decision by the board involving the repurchase of more than 5% (five percent) of the issued shares of any class will be subject to the requirements of sections 114 and 115 of the Companies Act;
(iii) no voting rights attached to the company’s shares repurchased by a subsidiary of the company may be exercised while shares are held by that subsidiary, while it remains a subsidiary of the company;
(iv) this authority shall lapse on the earlier of the date of the next annual general meeting of the company or the date 15 (fifteen) months after the date on which this special resolution is passed;
(v) any repurchase may not be made at a price greater than 10% (ten percent) above the weighted average of the market value of the shares for the 5 (five) business days immediately preceding the date on which the repurchase transaction is effected;
(vi) the repurchase of shares may not be effected during a prohibited period, unless such repurchase is done in accordance with the Listings Requirements;
(vii) the repurchase must be effected through the order book operated by the JSE trading system and done without any prior understanding or arrangement between the company and the counterparty (reported trades are prohibited);
(viii) such details as may be required in terms of the Listings Requirements are announced when the company or its subsidiaries have repurchased an aggregate of 3% (three percent) of shares in issue at the time the authority is given;
(ix) at any point in time, the company may only appoint one agent to effect any repurchase(s) on its behalf;
(x) the board, by resolution, has authorised the repurchase and acknowledged that it has applied the
solvency and liquidity test and reasonably concluded that the company and its subsidiaries will satisfy the solvency and liquidity test immediately after the repurchase and subject to the board reconsidering the solvency and liquidity test at the time of any repurchase and that since the test was performed there have been no material changes to the financial position of the group; and
(xi) the general authority granted to the board may be varied or revoked, by special resolution, at any time prior to the next annual general meeting of the company.”
Reason and effect of special resolution number 3 In terms of paragraph 5.72(c) of the Listings Requirements,
a special resolution is required to approve a general repurchase by the company of its securities. In terms of the Companies Act, the board must make a determination to acquire its shares only if it reasonably appears that the company will satisfy the solvency and liquidity test immediately after completing the proposed acquisition.
The reason and effect for special resolution number 3 is to grant the company a general authority to allow it or any of its subsidiaries, if the board of the company deems it appropriate in the interests of the company, to acquire, through purchase on the JSE, ordinary shares up to a maximum of 10% (ten percent) issued by the Company subject to the restrictions contained in the above special resolution.
This general authority to acquire the company’s shares replaces the general authority granted at the annual general meeting of the company held on 1 February 2017.
Nampak Limited Integrated Report 2017
100

Statement of intent This authority will only be used if the circumstances are appropriate and ordinary shares will be purchased on the JSE.
The directors, after considering the effect of such general repurchase, are of the opinion that if such repurchase is implemented:(i) the company and its subsidiaries will be able to pay
their debts in the ordinary course of business for a period of 12 (twelve) months after the date of this notice;
(ii) recognised and measured in accordance with the accounting policies used in the latest audited group annual financial statements, the assets of the company and that of its subsidiaries will exceed the liabilities of the company and its subsidiaries for a period of 12 (twelve) months after the date of this notice;
(iii) the ordinary capital and reserves of the company and its subsidiaries will be adequate for the purposes of the business of the company and its subsidiaries for the period of 12 (twelve) months after the date of this notice;
(iv) the working capital of the company and its subsidiaries will be adequate for the purposes of the business of the company and its subsidiaries for the period of 12 (twelve) months after the date of this notice; and
(v) a resolution being passed by the board that it authorised the repurchase of shares, that the company and its subsidiaries have passed the solvency and liquidity test and that since the test was performed there have been no material changes to the financial position of the company.
For the purpose of considering special resolution number 3 and in compliance with paragraph 11.26 of the Listings Requirements, the following general information is included in the annual financial statements and integrated report:(i) Directors and management (pages 76 and 77 of the
integrated report);(ii) Major shareholders as at 30 September 2017
(page 84 of the annual financial statements);
(iii) There have been no material changes in the financial or trading position of the company between the date of publication of the financial results for the financial year ended 30 September 2017 and the date of this notice;
(iv) Directors’ interests in securities (page 17 of the annual financial statements);
(v) Share capital of the company as at 30 September 2017 (page 114 of the annual financial statements); and
(vi) The company is not party to any material litigation nor is it aware of any pending material litigation to which it may become a party.
The directors whose names appear on pages 76 and 77 of the integrated report, collectively and individually accept full responsibility for the accuracy of the information relating to this special resolution and certify that, to the best of their knowledge and belief, there are no other facts that have been omitted which would make any statement false or misleading, and that they have made all reasonable enquiries to ascertain such facts and that this special resolution contains all information required by law and the Listings Requirements.
12. Special resolution number 4 – company acquiring the company’s shares from a director or prescribed officer
“RESOLVE that, when any general repurchase by the company of its shares takes place in accordance with special resolution number 3, the board is authorised, as required by section 48(8)(a) of the Companies Act, to approve the purchase by the company of its issued shares from a director and/or a prescribed officer of the company, and/or person related to a director or prescribed officer of the company, subject to the provisions of the MOI, the Companies Act, and the Listings Requirements.”
SHAREHOLDER INFORMATION ] Nampak Limited Integrated Report 2017
101
HOW WE CREATE VALUE
STRATEGIC CONTEXT
STRATEGIC PERFORMANCE
GOVERNANCE AND REMUNERATION
SHAREHOLDER INFORMATIONWHO WE ARE

Notice of annual general meeting continued
Reason and effect of special resolution number 4 This resolution is proposed in order to enable the board,
from the date of passing of this special resolution until the date of the next annual general meeting of the company, (such resolution not to be valid for a period greater than 15 (fifteen) months from the date of the passing of this special resolution), to approve the acquisition by the company of its shares from a director and/or a prescribed officer of the company, and/or a person related to any of them when a general repurchase by the company of the company’s shares takes place in accordance with special resolution number 3.
Section 48(8)(a) of the Companies Act provides, among others, that a decision by the board to acquire shares of the company from a director or prescribed officer of the company, or a person related to a director or prescribed officer of the company, must be approved by a special resolution of the shareholders of the company. When a general repurchase by the company of the company’s shares takes place in accordance with special resolution number 3, the company may inadvertently acquire shares from a director and/or a prescribed officer of the company, and/or a person related to a director or prescribed officer of the company and such repurchase must, in terms of the Companies Act, be approved by a special resolution of the shareholders.
In terms of the Companies Act, the board must make a determination for the company to acquire securities issued by the company only if it reasonably appears that the company will satisfy the solvency and liquidity test immediately after completing the proposed acquisition.
The board has no specific intention of acquiring shares from a director and/or a prescribed officer of the company, and/or any person related to them. The authority is intended to provide for instances where shares are inadvertently acquired from directors and/or prescribed officers and/or persons related to any of them during the execution of a general share repurchase programme in accordance with the authority provided for in special resolution number 3 above.
By order of the board
I H Van Lochem Company secretary
Bryanston15 December 2017
Nampak LimitedNampak HouseHampton Office Park20 Georgian Crescent East Bryanston, Sandton2191Republic of South Africa
Nampak Limited Integrated Report 2017
102
IDENTIFICATION, VOTING AND PROXIES1. Shareholders holding dematerialised shares in their own
name, and who are unable to attend the annual general meeting and wish to be represented thereat, must complete the attached form of proxy in accordance with the instructions therein and lodge it with the share registrar, being Computershare Investor Services (Pty) Ltd, whose details are contained on the inside back cover.
2. Forms of proxy must be dated and signed by the shareholder appointing a proxy and should be forwarded to reach the share registrar by no later than 12:00 on Tuesday, 30 January 2018. Before a proxy exercises any rights of a shareholder at the annual general meeting, such form of proxy must be so delivered.
3. In compliance with the provisions of section 58(8)(b)(i) of the Companies Act, a summary of the rights of a shareholder to be represented by proxy, as set out in section 58 of the Companies Act, is set out below:(i) A shareholder entitled to attend and vote at the
annual general meeting may appoint one or more individuals concurrently as proxies and my appoint more than one proxy to attend, participate in and exercise voting rights attached to different securities held by such shareholder. A proxy need not be a shareholder of the company.
(ii) A proxy appointment must be in writing, dated and signed by the shareholder appointing a proxy, and, subject to the rights of a shareholder to revoke such appointment (as set out below), remains valid for one year after the date on which it was signed or any longer or shorter period expressly set out in the appointment.
(iii) A proxy may delegate the proxy’s authority to act on behalf of a shareholder to another person, subject to any restrictions set out in the instrument appointing the proxy.
(iv) The appointment of a proxy is suspended at any time and to the extent that the shareholder who appointed such proxy chooses to act directly and in person in the exercise of any rights as a shareholder.
(v) The appointment of a proxy is revocable by the shareholder in question cancelling it in writing and delivering a copy of the revocation instrument to the proxy and to the company. The revocation of a proxy appointment constitutes a complete and final cancellation of the proxy’s authority to act on behalf of the shareholder as of the later of: (a) the date stated in the revocation instrument, if any, and (b) the date on which the revocation instrument is delivered to the company as required in the first sentence of this paragraph.
(vi) If the instrument appointing the proxy has been delivered to the company, as long as that appointment remains in effect, any notice that is required by the Companies Act or the MOI to be delivered by the company to the shareholder, must be delivered by the company to: (a) the shareholder or (b) the proxy, if the shareholder has: (i) directed the company to do so in writing and (ii) paid any reasonable fee charged by the company for doing so.
(vii) Attention is also drawn to the notes to the form of proxy. The completion of a form of proxy does not preclude any shareholder from attending the annual general meeting.
4. In terms of section 63(1) of the Companies Act, before any person attends or participates in the annual general meeting, that person must present reasonably satisfactory identification and the person presiding at the meeting must be reasonably satisfied that the right of that person to participate in and vote (whether as a shareholder or as a proxy) has been reasonably verified. Without limiting the generality hereof, the company will accept a valid South African identify document, a valid driver’s licence or a valid passport as satisfactory identification.
5. In accordance with the MOI, voting shall be by ballot only.
6. Shareholders holding dematerialised shares, but not in their own name, must furnish their central securities depository participant (CSDP) or broker with their instructions for voting at the annual general meeting. If your CSDP or broker, as the case may be, does not obtain instructions from you, it will be obliged to act in accordance with your mandate furnished to it, or if the mandate is silent in this regard, complete the attached form of proxy.
7. Unless you advise your CSDP or broker, in terms of the agreement between you and your CSDP or broker by the cut-off time stipulated therein, that you wish to attend the annual general meeting or send a proxy to represent you at the meeting, your CSDP or broker will assume that you do not wish to attend the general meeting or send a proxy.
8. If you wish to attend the annual general meeting or send a proxy, you must request your CSDP or broker to issue the necessary letter of authority to you.
9. If you have disposed of all of your Nampak securities, this document should be handed to the purchaser of such securities or to the broker, CSDP, banker, attorney, accountant or other person through whom the disposal was effected.
Notes to the notice of annual general meeting
SHAREHOLDER INFORMATION ] Nampak Limited Integrated Report 2017
103
HOW WE CREATE VALUE
STRATEGIC CONTEXT
STRATEGIC PERFORMANCE
GOVERNANCE AND REMUNERATION
SHAREHOLDER INFORMATIONWHO WE ARE

Notes to the notice of annual general meeting continued
10. If you are in any doubt as to what action you should take arising from this document, please immediately consult your broker, CSDP, banker, attorney, accountant or other appropriate professional adviser.
11. Registration for those attending the meeting physically will be available from two hours before the meeting and we request that you or your proxy/ies register by not later than 15 minutes before the start of the annual general meeting.
12. The company does not accept responsibility and will not be liable for any failure on the part of the broker, CSDP, banker, attorney, accountant or other appropriate professional adviser of any holder of dematerialised securities to notify the holder thereof of the contents of this document.
ELECTRONIC COMMUNICATION13. In accordance with sections 61(10) and 63(3) of the
Companies Act, you or your proxy/ies, may participate in the annual general meeting by electronic means. Teleconference facilities will be available for this purpose, and may be accessed at your cost, for the duration of the annual general meeting, subject to the arrangements in respect of identification and practicality as referred to below:(i) In order for Nampak to arrange teleconferencing,
holders must deliver written notice to Computershare Investor Services (Pty) Ltd by 09:00 on Friday, 26 January 2018 to indicate that they wish to participate by means of electronic communication at the annual general meeting.
(ii) The written notice referred to above must contain: » a certified copy of your or your proxy’s/ies’ South African identity document/s or passport if the holder is an individual;
» a certified copy of a resolution or letter of representation/proxy given by the holder if you are a company or other juristic person and a certified copy of the identity documents or passports of the persons who passed the relevant resolution. The authorising resolution must set out who is authorised to represent you at the annual general meeting by means of teleconference facilities if you are a company or other juristic person; and
» your valid e-mail address and/or facsimile number and/or telephone number.
(iii) The company shall notify you, if you have delivered a valid written notice, by no later than 24 (twenty-four) hours before the annual general meeting of the relevant dial-in details as well as the passcodes through which you or your proxy/ies can participate via the teleconference facilities and of the process for participation.
14. Voting will not be possible via electronic facilities and shareholders wishing to vote their shares will need to be represented at the meeting either in person, by proxy or by letter of representation, as provided for in the notice of the meeting.
15. Should you or your proxy/ies wish to participate in the annual general meeting by way of electronic communication as aforesaid, you or your proxy/ies, will be required to dial in with the details provided by the company as referred to above by not later than 15 minutes prior to the commencement of the annual general meeting, during which time registration will take place.
Nampak Limited Integrated Report 2017
104

Form of proxy
Nampak Ltd(Incorporated in the Republic of South Africa)(Registration number: 1968/008070/06)(Share code: NPK ISIN: ZAE000071676)(Nampak or the company)
If you are a Nampak shareholder entitled to attend and vote at the annual general meeting you can appoint a proxy to attend, participate in, speak and vote in your stead. You must complete and return this form of proxy, in accordance with the instructions contained therein, to Computershare Investor Services (Pty) Ltd, to be received by them by 09:00 on Tuesday, 30 January 2018 or alternatively the form of proxy can be handed in before the relevant resolution on which the proxy is to vote, is considered at the annual general meeting.
If you are a Nampak shareholder and have dematerialised your share certificate through a CSDP (and have not selected own name registration in the sub-register maintained by a CSDP), do not complete this form of proxy but instruct your CSDP to issue you with the necessary letter of representation to attend the annual general meeting, or if you do not wish to attend, provide your CSDP with your voting instructions in terms of your custody agreement entered into with them.
I/We (Full names in BLOCK LETTERS please)
of (address)
telephone (work) (home) cellphone number
email address being the holder(s) of shares in the company, hereby appoint (see note 2):
1. or failing him/her
2. the chairman of the meeting as my/our proxy to attend, participate in and speak and, on a poll, to vote or abstain from voting on my/our behalf at the annual general meeting of the company to be held in The Forum at The Campus, Wanderers building, 57 Sloane Street, Bryanston, 2021, South Africa on Thursday, 1 February 2018 at 12:00 or at any adjournment thereof as follows:
Insert an “x” or the number of voting rights held in the company (see note 3) Number of voting rights:
For Against Abstain
3. To elect, by way of separate vote, each of the following directors retiring in terms of clause 29.1 of the MOI:3.1 RJ Khoza3.2 TT Mboweni3.3 IN Mkhari3.4 E Ikazoboh4. To elect, by way of separate vote, each of the following directors who were appointed by the board after the previous
annual general meeting in terms of clause 28.3 of the MOI:4.1. J John4.2 MMF Seleoane5. To appoint Deloitte & Touche and Mr Trushar Kalan to act as independent auditor of the company until the end of
the next annual general meeting6. To elect, by way of separate vote, each of the members of the audit committee:6.1 RC Andersen 6.2 NV Lila6.3 IN Mkhari6.4 J John7. To endorse, on a non-binding advisory basis, the company’s remuneration policy8. To endorse, on a non-binding advisory basis, the implementation report of the company’s remuneration policy9. Special resolution number 1: to approve the remuneration payable to the non-executive directors10. Special resolution number 2: to authorise the board to grant authority to the company to provide financial assistance in
terms of sections 44 and 45 of the Companies Act 11. Special resolution number 3: to authorise the board to approve the general repurchase of the company’s ordinary shares 12. Special resolution number 4: to approve the purchase by the company of its issued shares from a director and/or
prescribed officer, in the event it conducts a general repurchase of the company’s shares
My/our proxy/ies may (subject to any restriction set out herein)/may not delegate the proxies authority to act on behalf of me/us to another person (delete as appropriate). This form of proxy will lapse and cease to be of force and effect immediately after the annual general meeting of the company to be held at The Forum at The Campus, Wanderers building, 57 Sloane Street, Bryanston, 2021, South Africa on Thursday, 1 February 2018 at 12:00 or any adjournment(s) thereof, unless it is revoked earlier.
Signed at on 2017/2018
Signature
SHAREHOLDER INFORMATION ] Nampak Limited Integrated Report 2017
105
HOW WE CREATE VALUE
STRATEGIC CONTEXT
STRATEGIC PERFORMANCE
GOVERNANCE AND REMUNERATION
SHAREHOLDER INFORMATIONWHO WE ARE
Notes to form of proxy
1. Each holder entitled to attend and vote at the meeting is entitled to appoint one or more proxies (none of whom need be a shareholder of the company) to attend, participate in, speak and vote or abstain from voting in the place of that holder at the meeting.
2. A holder may insert the name of a proxy, or alternative proxies of the holder’s choice in the space provided, with or without deleting the words “the chairman of the meeting”. Any such deletion must be initialled by the holder. The person whose name appears first on this form of proxy and who is present at the annual general meeting will be entitled to act as proxy to the exclusion of those whose names follow.
3. A holder’s instructions to the proxy must be indicated by the insertion of an “X” or the insertion of the relevant percentage of voting rights exercisable by that holder in the appropriate space provided. If you fail to comply with the above, you would be deemed to have authorised the proxy to vote or abstain from voting at the meeting, as he deems fit, in respect of all the holder’s voting rights exercisable thereat, but where the proxy is the chairman, failure to comply will be deemed to authorise the proxy to vote in favour of the resolution.
4. A holder or his proxy is not obliged to use all the voting rights exercisable by the holder or by his proxy, but the total of the voting rights cast and in respect whereof abstention is recorded may not exceed the total of the voting rights exercisable by the holder or by his proxy.
5. A holder’s authorisation to the proxy, including the chairman of the meeting, to vote on his or her behalf, shall be deemed to include the authority to vote on procedural matters at the meeting.
6. The completion and lodging of this form of proxy will not preclude the holder from attending, participating in, and voting in person at the meeting to the exclusion of any proxy appointed in terms hereof, should such holder wish to do so.
7. In case of joint holders, the vote of the most senior who tenders a vote, whether in person or by proxy, will be accepted to the exclusion of the votes of the other joint holders, for which purpose seniority will be determined by the order in which the names appear on the company’s register of shareholders in respect of the joint holding.
8. Proxy appointment must be in writing, dated and signed by the holder. Documentary evidence establishing the authority of a person signing this form of proxy in a representative capacity must be attached to this form of proxy. Without limiting the generality hereof, the company will accept a valid identity document, a valid driver’s licence or a valid passport as satisfactory identification.
9. Any alteration or correction to this form of proxy must be initialled by the signatory/ies.
10. A holder may revoke the proxy appointment by cancelling it in writing and delivering a copy of the revocation instrument to the proxy/ies and to the company, to be received before the replacement proxy exercises any rights of the holder at the annual general meeting on Thursday, 1 February 2018 at 12:00 or adjournment thereof.
11. The revocation of a proxy appointment constitutes a complete and final cancellation of the proxy’s/proxies’ authority to act on behalf of the shareholder as of the later of (i) the date stated in the revocation instrument, if any; or (ii) the date on which the revocation instrument was delivered as required in note 10 above.
12. Please note that the reason holders are asked to send in their form of proxy before the meeting is because the scrutineers must consider each proxy to determine whether it is validly given and whether the voting rights have been correctly inserted. Significant delays could be caused at the annual general meeting if these checks have to be carried out by the scrutineers while the annual general meeting is in progress.
13. Forms of proxy must be presented to a representative of Computershare Investor Services (Pty) Ltd, PO Box 61051, Marshalltown, 2107 or Rosebank Towers, 15 Biermann Avenue, Rosebank, 2196, to be received on or before 09:00 on Tuesday, 30 January 2018, or may be presented to a representative of Computershare Investor Services (Pty) Ltd at The Forum at The Campus, Wanderers building, 57 Sloane Street, Bryanston, 2021, South Africa on Thursday, 1 February 2018 before the commencement of the meeting.
Nampak Limited Integrated Report 2017
106

Glossary of terms
B-BBEE Broad-based black economic empowerment
CAGR Compound annual growth rate
Capex Capital expenditure
CDP Carbon disclosure project
Cullet Waste glass
CSD Carbonated soft drinks
DBP Deferred bonus plan
DEA Department of Environmental Affairs
dti Department of Trade and Industry
EBITDA Earnings before interest, taxation, depreciation and amortisation
FABS Flavoured alcoholic beverages
FMCG Fast-moving consumer goods
FTSE/Russell ESG FTSE Russell Environmental Social & Governance
GDP Gross domestic product
HDPE High-density polyethylene
HEPS Headline earnings per share
IFRS International Financial Reporting Standards
IIRC International Integrated Reporting Council
IOM Isle of Man
ISO International Organisation for Standardisation
LTI Long-term incentive
LTIFR Lost-time injury frequency rate. It refers to the rate of occurrence of workplace incidents that result in an employee’s inability to work the next full work shift. It refers to the number of such injuries that occur within a given period relative to the total number of hours worked in the same accounting period
MTI Medium-term incentive
NAFEX Nigerian Autonomous Foreign Exchange market
OHSAS Occupational Health and Safety Assessment Series
PET Polyethylene terephthalate
Preforms Test-tube shaped containers with thick walls, blow-moulded on customers’ sites
PRMA Post-retirement medical aid
PRO Producer responsibility organisations
PSP Performance share plan
R&D Research and development
ROE Return on equity
RONA Return on net assets
rPET Recycled PET
SAP Share appreciation plan
SKU Stock keeping unit
STI Short-term incentive
TGRC The Glass Recycling Company
UHT Ultra-heat treated
SHAREHOLDER INFORMATION ] Nampak Limited Integrated Report 2017
107
HOW WE CREATE VALUE
STRATEGIC CONTEXT
STRATEGIC PERFORMANCE
GOVERNANCE AND REMUNERATION
SHAREHOLDER INFORMATIONWHO WE ARE

Shareholders’ diary
Annual general meeting Thursday, 1 February 2018Interim statement and ordinary dividend announcement for the half-year ending 31 March 2018 May 2018 Group results and ordinary dividend announcement for the year ending 30 September 2018 November 2018
DIVIDENDOrdinaryFinal for the year ending 30 September 2017 No dividend being paidInterim for the half-year ending 31 March 2018 To be paid in July 2018 if payable
Preference6.5% and 6% cumulative Payable twice per annum during February and August
Nampak Limited Integrated Report 2017
108

Corporate information
AuditorsDeloitte & ToucheBuildings 1 and 2, Deloitte PlaceThe Woodlands Office ParkWoodlands DriveWoodmead, Sandton
Business address and registered officeNampak HouseHampton Office Park20 Georgian Crescent EastBryanston, 2191, South AfricaPO Box 69983, Bryanston, 2021Telephone +27 719 6300Website www.nampak.com
Company secretaryIlse van LochemTelephone +27 11 719 [email protected]
Investor relationsNondyebo MqulwanaTelephone +27 11 719 [email protected]
Share registrarComputershare Investor Services (Pty) LtdRosebank Towers15 Biermann Avenue, Rosebank, 2196PO Box 61051, Marshalltown, 2107Telephone +27 11 370 5000Telefax +27 11 688 5200
SponsorUBS South Africa (Pty) Ltd64 Wierda Road EastSandton, 2196, South AfricaPO Box 652863, Benmore, 2010Telephone +27 11 322 7000Telefax: +27 11 784 8280
SustainabilityLynne KiddTelephone +27 11 719 [email protected]
Shareholder hotlineTelephone +27 11 373 0033Smart number +27 80 000 6497Telefax +27 688 5217email [email protected]
HOW WE CREATE VALUE
STRATEGIC CONTEXT
STRATEGIC PERFORMANCE
GOVERNANCE AND REMUNERATION
SHAREHOLDER INFORMATIONWHO WE ARE

Head officeNampak House, Hampton Office Park
20 Georgian Crescent East
Bryanston, Sandton, 2191
Tel: +27 11 719 6300
www.nampak.com
NA
MPA
K LIMITED
INTEG
RATED REPO
RT 2017