Embed Size (px)
Citation preview
www.ijbcnet.com International Journal of Business and Commerce Vol. 6, No.02: [01-14]
(ISSN: 2225-2436)
Published by Asian Society of Business and Commerce Research 1
Integrated Road Infrastructure Interventions on Implementation of
Pedestrian Safety Rules in the City of Kisumu, Kenya
Jessica Akinyi Ogombe,
Corresponding author
PhD (Project Planning and Management) Candidate
Department of Extra-Mural Studies
University of Nairobi
Nairobi, Kenya
Moses M. Otieno (PhD)
Lecturer
Department of Extra-Mural Studies
University Of Nairobi
Nairobi, Kenya
Patrick Iribe Mwangi (PhD)
Senior Lecturer
Faculty of Arts
University Of Nairobi
Nairobi, Kenya
Professor Tom Odago Opiyo
Consultant Engineer
ITEC Engineering Ltd
Nairobi,Kenya
Email: [email protected]
www.ijbcnet.com International Journal of Business and Commerce Vol. 6, No.02: [01-14]
(ISSN: 2225-2436)
Published by Asian Society of Business and Commerce Research 2
Abstract
The study investigates combined road infrastructure interventions namely Education,
Engineering, Enforcement and pedestrian demographic factors on implementation of
pedestrian safety rules in the City of Kisumu. From a target population of 409,928
residents, 384 road users were sampled for both quantitative and qualitative data. Mixed
method approach and pragmatism enabled the use of Ex post facto design and
descriptive survey designs to obtain, analyze and report the findings of the study. The
findings reveal that from the combined road infrastructure interventions (R2 = .254; p <
.001), enforcement of traffic laws (p < 0.001) and pedestrian demographic factors (p <
0.001) individually, statistically significant to influence implementation of pedestrian
safety rules. On the contrary, road engineering design (p = 0.102) and public education
on road safety (p = 0.313) did not have a statistically significant influence. The study
concludes that integrating road infrastructure interventions improves implementation of
pedestrian safety rules.
Key words: Enforcement, Implementation of pedestrian safety rules, Integrated,
Pedestrian demographic factors, Public education, Road engineering design,

www.ijbcnet.com International Journal of Business and Commerce Vol. 6, No.02: [01-14]
(ISSN: 2225-2436)
Published by Asian Society of Business and Commerce Research 3
1. INTRODUCTION
Road infrastructure interventions for pedestrians include Education, Engineering, Enforcement
and pedestrian demographic factors which exist globally but prove ineffective when used in isolation.
Previous studies on engineering, enforcement, education, pedestrian demographic factors and attitude of
pedestrians have been carried out in isolation with little focus on pedestrians, thus implementation of
pedestrian safety rules (Federal Highway Authority (FHWA), 2012; WHO, 2013) is still not adequately
addressed. Globally, the National Highway Transport Safety Authority (NHTSA), 2006 recommends the
development and implementation of an integrated road safety program, definitive of the state’s
demographic characteristics, so as to ensure considerable reduction in traffic crashes and injuries on the
roads. It further recommends a pedestrian safety program that promotes safe pedestrian practices,
educates drivers to share roads safely with other road users, and also provides safe facilities for
pedestrians through a integrated policy involving communication, education, engineering strategies and
enforcement. Given the multidisciplinary nature of the road safety problem, a comprehensive
implementation of pedestrian safety rules requires coordination among several state agencies (FHWA,
2012).
Thomas et al. (2012) in New Zealand and the Highway Safety Programs Guideline (2006) cited
this combined approach as effective solutions in reducing road crashes. Institutions and people working
towards implementation of pedestrian safety rules tend to favour either engineering measures or
behaviour-change measures depending on their training and experience, but significant and sustainable
improvement to pedestrian safety rules require a balanced approach that includes both perspectives
(Loreno, Clinton and Sleet 2006, Pedestrian Safety Manual 2013) essential to a balanced Safe System
Approach.
Despite the existence of road infrastructure interventions, pedestrian fatalities and injuries
remain high. In view of this, Zegeer (2006) advocated for a universal design that would involve designing
for all road users, the able bodied and the physically impaired that would address implementation of
pedestrian safety rules. Road engineering designs should ideally cater for all road users whether motorists
or non-motorists. The road transport system has historically focused on increasing mobility of motor
vehicles on the road and has therefore designed roads for motorists. Less attention has however been paid
to pedestrians and their safety (Campbell et al., 2004) hence its historical neglect as well (Massoud et al.,
2011). Universal design is therefore ideal in addressing implementation of pedestrian safety rules.
Acknowledging road infrastructure interventions as the road transport pillar and core foundation
on which road safety is founded, Massoud et al., (2011) adds that engineering interventions are critical
factor in determining the quality of the road transport system. However, engineering interventions alone
are inadequate without the influence of education, enforcement and pedestrian demographic factors. This
study adopted a proactive approach where integration of education, engineering, enforcement and
pedestrian demographic factors was expected to prevent or reduce fatalities and injuries of pedestrian road
users.
Road safety depends on man, vehicle and highway conditions that influence it (Fluery, 2006;
Tingrall and Haworth, 2006 and Zheng et al., 2010) where man represents all road users including
pedestrians and drivers, vehicle includes all instruments on the road causing injury or death while
highway conditions represent road infrastructure in line with the safe systems approach theory which
advocates for safer roads, safer vehicles, safer speeds and safer road users for a sustainable urban road
www.ijbcnet.com International Journal of Business and Commerce Vol. 6, No.02: [01-14]
(ISSN: 2225-2436)
Published by Asian Society of Business and Commerce Research 4
transport. Implementation of pedestrian safety rules needs to be tackled from the safe systems approach
theory. Harry (2010) attributes road engineering designs such as sidewalks, zebra crossings and
pavements as having the potential to minimize accidents or, in case of accidents, prevent road users from
severe injury or death. Despite putting these pedestrian facilities in place, implementation of pedestrian
safety rules is still a problem.
Statistical evidence reveal that pedestrians are the leading category of road users killed in road
traffic crashes at 46% in Kenya (Ogendi and Odero, 2012).The City of Kisumu follows at 45% (Opiyo,
2005) which is above the regional and global figures at 38% and 22% respectively. However, often lost in
these road safety statistics is the fact that a large number of auto related deaths and injuries every year
were not drivers and passengers but pedestrians (iRAP, 2009 Kenya results) yet in the City of Kisumu
alone pedestrian accidents caused one fifth of injury related hospital admissions (Ogendi et al., 2013).
Compared to other cities in Kenya such as Nairobi and Mombasa, pedestrians in the City of Kisumu are
highly vulnerable in the road safety situation and constitute 80% victims of the fatalities. Pedestrians are
over represented in the road traffic injuries and deaths yet often ignored in the road infrastructure
intervention planning process. Pedestrians account for 45% of road traffic fatalities but receive very little
of the road safety funding. The funding allocated for road infrastructure interventions development exists
but few projects are pedestrian-oriented. The national and county government has not only failed to
allocate adequate funding to address the implementation of pedestrian safety rules but are beginning to
remove the road infrastructure interventions due to the belief that they provide pedestrians with a false
sense of safety (Wasike, 2007).
The City of Kisumu is reported as having a high population of 409,938 residents and densely
populated areas in excess of 350 persons per kilometer square (RoK Census, 2009) with 48% of the urban
population living below the absolute poverty bracket yet, the city’s population continue to grow, at the
rate of 2.8% per annum (UN-HABITAT City of Kisumu Development Strategies (CDS), 2004 - 2009).
The high pedestrian activity and traffic mix that result leads to 55% of pedestrian collisions that occurred
within the City of Kisumu. It is based on the foregoing background and literature that this study
investigates the integration of road infrastructure interventions and implementation of pedestrian safety
rules in the City of Kisumu.
2. RESEARCH METHODOLOGY
2.1 Purpose
The purpose of this study was to establish integration of road infrastructure interventions, attitude
of pedestrians on implementation of pedestrian safety rules on selected roads in the city of Kisumu,
Kenya.
2.1.1 Hypothesis
Hypothesis: There is a significant relationship between the combined road infrastructure interventions
and implementation of pedestrian safety rules in the City of Kisumu.
2.2 Study Population
This study targeted road users from a universe population of 409,928 residents of the City of
Kisumu, including pedestrians assumed to have walked along or across and drivers who have driven on
the sampled roads.
www.ijbcnet.com International Journal of Business and Commerce Vol. 6, No.02: [01-14]
(ISSN: 2225-2436)
Published by Asian Society of Business and Commerce Research 5
2.3 Study design
This study adopted both Ex post facto design and descriptive survey designs. Ex post facto
exploratory design involved pilot testing, content analysis on previous research findings or documents,
theory formulation, one’s own observation, open ended questions, and test alternative hypotheses using
inferential statistics from samples drawn from the target population to account for the results obtained.
Descriptive survey research design was also used where information was obtained from a sample rather
than the entire population in line with the cross-sectional sub-type of descriptive survey study design.
From data collected using questionnaires, descriptive survey provided numeric descriptions of a sample as
they were, as they would be and did not involve manipulation of the independent variable. The choice of
these two research designs was informed by the fact that both descriptive and inferential data analysis was
adopted in this thesis. Ex post facto design and descriptive survey design blended and complemented the
strengths in a study that hoped to get the best of the difference.
2.4 Sample Size and Sampling Method
The study used Krejcie and Morgan (1970) formula applied at 95 % confidence level to select
384 road users from a universe population of 409,928 residents of Kisumu. The road users were
conveniently classified and proportionately distributed to include 284 pedestrians out of which 200
responded to the questionnaires, 50 to the observation checklist, 34 interview guide as well as 100 drivers
who responded to the driver questionnaires. Consequently, primary respondents were pedestrians with the
other categories of road users, such as drivers providing supporting information.
This study applied both probability and non-probability sampling procedures to obtain a sample
of roads and respondents. Probability sampling procedures included Stratified random sampling to control
for gender and quota sampling for type of urban road on the ten sampled roads and cluster random
sampling to divide the urban roads into clusters rather than use individual roads due to lack of sampling
frame. Non-probability sampling procedure included purposive sampling procedure to sample the ten
urban roads while convenience sampling to get the respondents.
2.5 Data Collection
This study applied four instruments namely questionnaire, interview schedule, observation
walkability checklist and document analysis to collect quantitative and qualitative data. The self
administered questionnaire adopted the iRAP star rating for pedestrians and drivers. The questionnaires
were designed on the basis of LIKERT summated scales for road infrastructure interventions and
implementation of pedestrian safety rules. To test reliability of the questionnaires, Cronbach’s alpha
coefficient was used. A research letter of transmittal was drafted by the student to the University of
Nairobi and forwarded by the University to enable the researcher approach the Ministry of roads officials
concerned with the sampled roads. The national research permit was obtained from the National
Commission for Science, Technology and Innovation (NACOSTI) as a research approval. For the
interview schedules, the researcher conducted face-to-face interviews from engineers, town planners,
Kenya Urban Roads Authority (KURA) officials, educators, law enforcement officers, parents and
pedestrians who gave relevant information.
2.6 Data Analysis
The quantitative data collected was processed and entered into SPSS version 22.0 for descriptive
and inferential analysis. For descriptive statistics, data was described and summarized into distribution of
www.ijbcnet.com International Journal of Business and Commerce Vol. 6, No.02: [01-14]
(ISSN: 2225-2436)
Published by Asian Society of Business and Commerce Research 6
scores using frequency, means and standard deviation. Qualitative data obtained from interviews with key
informants was analyzed thematically based on the emerging themes. In order to make inferences on the
study population and the research variables, inferential statistic, in this study multiple linear regression
was used. Multiple Linear Regression Analysis was used to explain the relationship between road
infrastructure interventions (public education, road engineering design, enforcement of traffic laws and
pedestrian demographic factors) and implementation of pedestrian safety rules. The variables were
hypothesized to be related by the following equation:
Ŷ = β0 + β1X1 + β2X2 + β3X3 + β4X4 + ɛ
Where: Ŷ is implementation of pedestrian safety rules
β0 is the constant term
β1, β2, β3 and β4 are coefficients of the road infrastructure interventions (X1, X2, X3 & X4)
X1, X2, X3 & X4 are the road infrastructure interventions (public education, road engineering
design, enforcement of traffic laws and pedestrian demographic factors)
During hypothesis testing, the final model only included variables whose coefficients were statistically
significant for 95% confidence level (p < .05).
3. FINDINGS
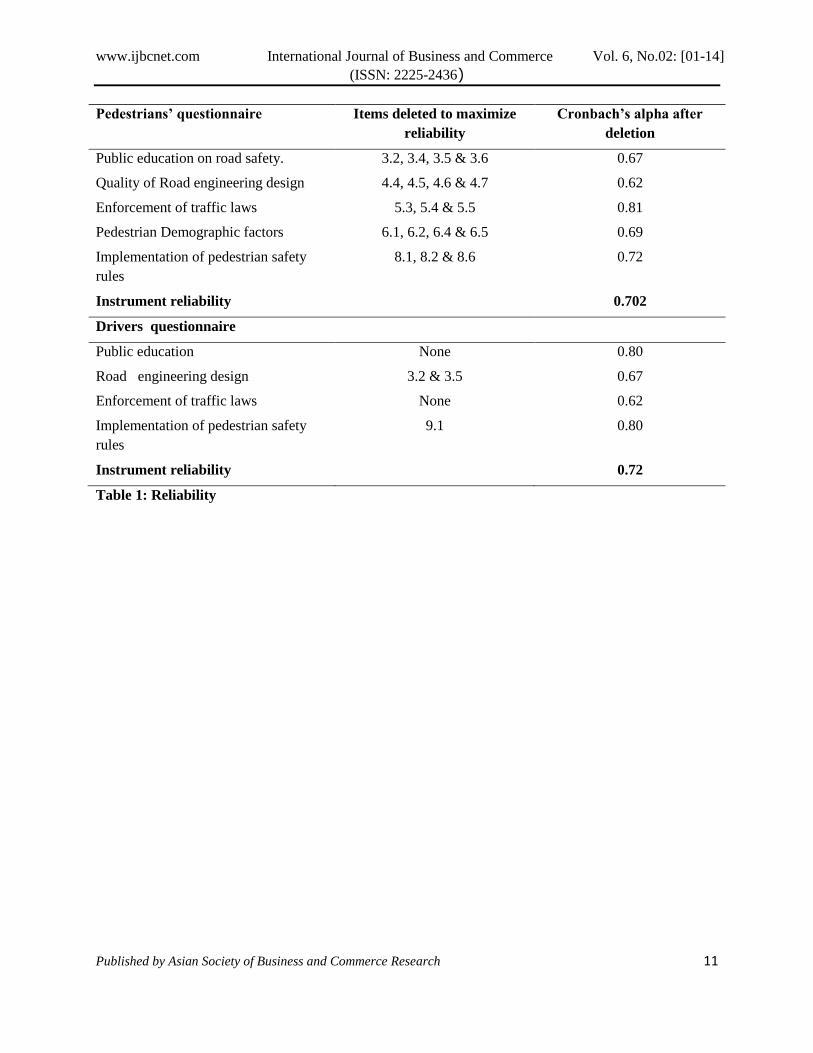
3.1 Reliability of the instruments
A reliability analysis was carried out using Cronbach alpha for each of the instruments. In cases
where the reliability values were low, items were deleted in order to maximize the reliability coefficient
for the instruments. The reliability co-efficient for various scales in each instrument is presented in Table
1.
Questionnaire for pedestrians returned an alpha coefficient α = 0.702 while the instrument for
drivers had α = 0.72. For social sciences, an alpha co-efficient of 0.7 and above is considered reliable in
social sciences research (Oso & Onen, 2009).
3.2 Socio-Demographic Characteristics of the road users
The socio-demographic characteristics for the participants were analyzed using frequencies and
percentages and presented in table 2.
From the analysis, 56% of the respondent pedestrians were male and 44% female while for
drivers, 77.0% were males and 23.0% females. Majority of the pedestrians who participated in the study
were aged between 30 to 40 years accounting for 30% with another 27.5% aged between 40 – 50 years.
On the other hand, the majority of drivers were aged between 30 and 40 years (38%), 26% were aged
between 20-30years. In terms of place of residence majority of pedestrians (59.5%) and 46% of drivers
lived in peri-urban areas.
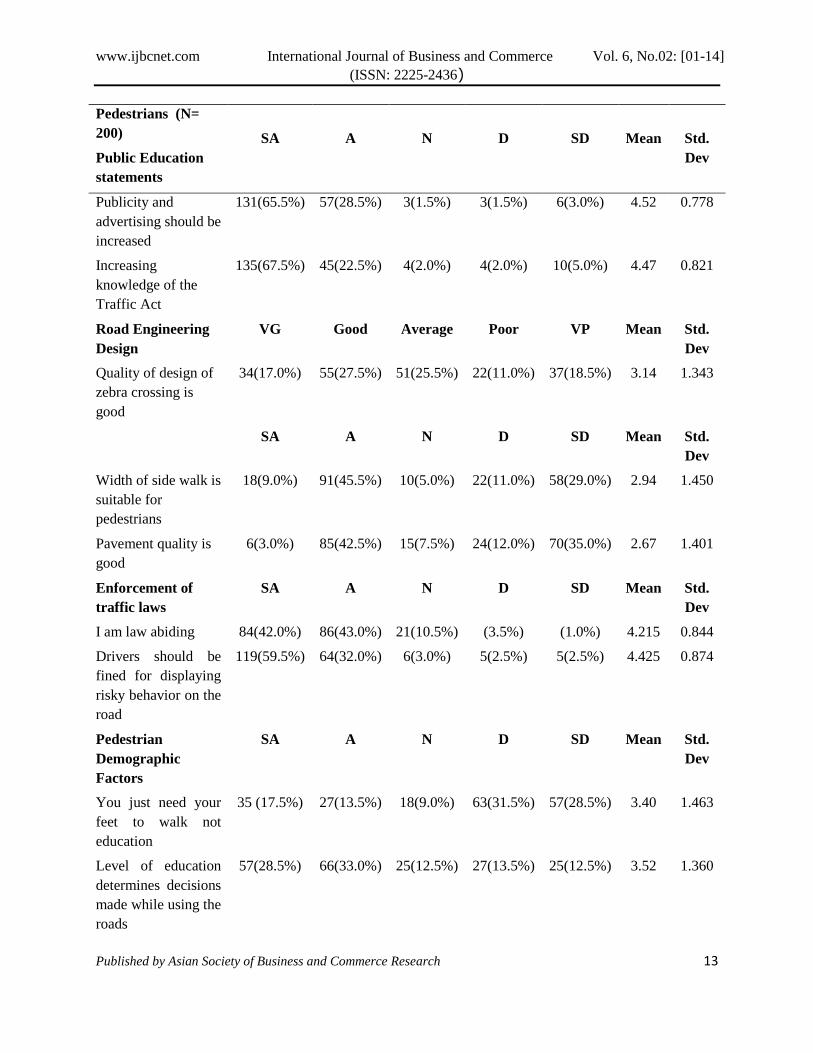
3.3 Road Infrastructure Interventions
Descriptive analysis of the road infrastructure interventions is presented in table 3
On public education on road safety, pedestrians generally agree that publicity and advertising
should be increased (Mean = 4.52; SD = 0.778) and that there should be increased knowledge of the
traffic act (Mean = 4.47; SD = 0.821). However, both pedestrians and drivers view on public education

www.ijbcnet.com International Journal of Business and Commerce Vol. 6, No.02: [01-14]
(ISSN: 2225-2436)
Published by Asian Society of Business and Commerce Research 7
was neutral (Mean = 3.118; SD = 0.818) which indicates that majority of the pedestrians and drivers
could neither approve of object the existing state of public education on road safety. The study found that
the pedestrians were not impressed with the status of road engineering design scoring from neutral to
disagree. Quality of design of zebra crossing had a mean of 3.14 and SD = 1.343 while width of sidewalk
(Mean = 2.94; SD = 1.450) and pavement quality (Mean = 2.67; SD = 1.401) indicated disagreement. The
study also found that pedestrians were generally positive with enforcement of traffic laws scoring a mean
of 4.215 and SD of 0.844 on being law abiding. Pedestrians strongly agreed that drivers should be fined
for displaying risky behavior on the road (Mean = 4.425; SD = 0.874). However, drivers were very
negative regarding enforcement of traffic laws (Mean = 1.828; SD = 0.534) indicating that they disagreed.
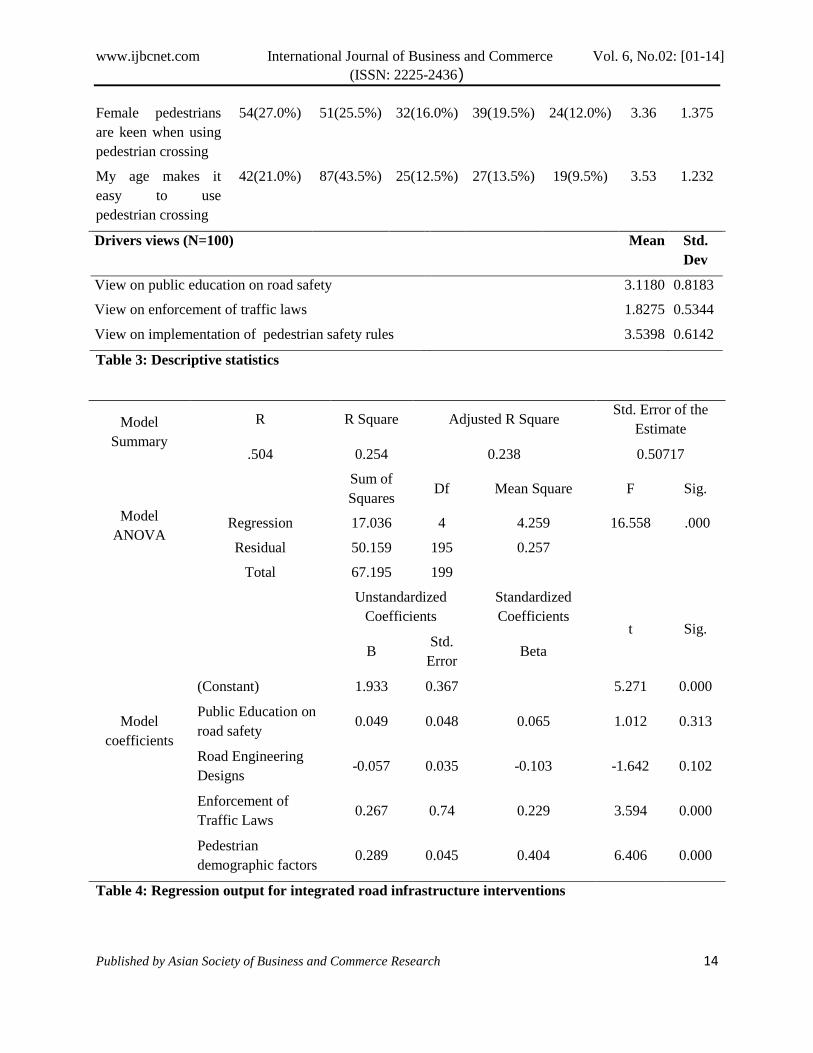
3.4 Integrated road infrastructure interventions and implementation of pedestrian safety rules
In order to test the hypothesis, scores on the individual scales of road infrastructure interventions
were obtained as well as that on implementation of pedestrian safety rules. Multiple linear regression was
conducted and the output presented in Table 4.
R2 =0.254, R
2 adjusted=0.238, Se= 0.50717, F-stat: 16.558 on 4 and 195 df, p = 0.000
The model shows that the independent variables (the predictors) accounts for 25.4% of the
variance in the dependent variable (Implementation of Pedestrian safety rules). The ANOVA shows the
regression is a good fit for our data with F (4,195) =16.558 which is statistically significant (p<0.05).
Using the multiple regression model equation: Y = β0 + β1X1 + β2X2+ β3X3+ β4X4 + ε and taking only
statistically significant coefficients, implementation of pedestrian safety rules and road infrastructure
interventions were related by the equation:
Y=1.933+0.267 X3 + 0.289 X4 where y is the implementation of pedestrian safety rules and X3
and X4 are the enforcement of traffic laws and pedestrian demographic factors respectively. The null
hypothesis was therefore rejected and the study concluded there was a significant relationship between
road infrastructure interventions and implementation of pedestrian safety rules.
4. DISCUSSION
The aim of the study was to investigate the relationship between the combined road infrastructure
interventions and implementation of pedestrian safety rules. In terms gender composition of the study
sample, the study found that majority of the pedestrians were males and the same applied for driver and
pedestrians. Further, the study found that majority of the pedestrians was of the middle youthful age
between 30 – 40 years. This supports the findings of Scot, (2010) Salmon (2005) Shah (2003) who all
found that age and sex were important determinants of pedestrian accidents among the middle aged.
In terms of the road infrastructure interventions, public education on road safety was found to
score highly with road users indicating that it should be increased to enhance implementation of
pedestrian safety rules. However, the study found a contradicting opinion among pedestrians and drivers
regarding enforcement of traffic laws with the pedestrians favoring strict enforcement and fines on
reckless driving. Similarly, Vaa et al., (2009) and Wundersitz et al., (2010) also suggested that for road
safety communications and advertising needed to be close to the point of impulse such as with radio,
outdoor advertising, variable and message signs and bus boards to be effective. On the other hand, drivers
scored low on enforcement of traffic laws giving the opinion that they do not approve of the strict fines
for reckless driving. The study found that the road engineering design, as an intervention, was inadequate
www.ijbcnet.com International Journal of Business and Commerce Vol. 6, No.02: [01-14]
(ISSN: 2225-2436)
Published by Asian Society of Business and Commerce Research 8
with rating being below average for all the indicators of road engineering design. As for the pedestrian
demographic factors, the study found that they influence, when quantified, was neutral with scores falling
on the average range for the various indicators. This showed that the pedestrian demographic factors
influence implementation of pedestrian safety rules to an average extent. These findings concur with
those of Kim et al., (2008); Knezek (2007); NJDOT, (2005) who also stressed that on motorists fault as a
pedestrian crash factor, driver education should be encouraged and more emphasis be put on pedestrian
safety through road crossing laws to ensure driver responsibility and liability while also educating road
users on hazardous pedestrian behaviors.
The study found that the combined integrated road infrastructure interventions statistically
significantly explained 25.4% of variance in implementation of pedestrian safety rules. Individually, only
enforcement of traffic laws (p < .001) and pedestrian demographic factors (p < 0.001) were found to
statistically significantly influence implementation of pedestrian safety rules. The findings are consistent
with that of Campbell et al., (2004) who concluded that pedestrian characteristics and safety rules be
integrated with other interventions. Both behavioural and engineering interventions would ensure
reduction in road accidents in general and specifically pedestrian safety.
5. CONCLUSION
This study investigated the integrated combined road infrastructure interventions and
implementation of pedestrian safety rules. The study found that applying the road infrastructure
interventions as simultaneously improves implementation. The study therefore concludes that road
infrastructure interventions, especially pedestrian demographic factors and enforcement of traffics to
realize a balanced and sustainable approach to implementation of pedestrian safety rules as an outcome
variable.
www.ijbcnet.com International Journal of Business and Commerce Vol. 6, No.02: [01-14]
(ISSN: 2225-2436)
Published by Asian Society of Business and Commerce Research 9
REFERENCES
[1]. Campbell B. J., Zagee C. V., Hyang H. H and Cynecki M. J. (2004) A Review of Pedestrian
Safety Research in the United States and Abroad. Federal Highway Administration.
[2]. Federal Highway Administration (2002)Pedestrian Facilities User Guide - Providing Safety and
Mobility.
[3]. Fleury D. (2006) Urban Safety Management: How to Deal with Complexity Advances in Complex
Systems, Vol.10, Suppl.No.2 World Scientific Publishing Company.
[4]. Harry T. (2010) Transport Models and Urban Planning Practice: Experiences with Albatross.
Transport Reviews, 31, No. 2, 199-207, March 2011.
[5]. Kim, K, Made B and Yamashita E. (2008) Modeling Fault Among Accident-involved
Pedestriansand Motorists in Hawaii. Accident Analysis and Prevention.
[6]. Knezek (2007)Do Attributes in the Physical Environment Influence Children Physical Activity?
A Review of Literature: International Journal of Behvioural and Physical Activity Vol.3.
[7]. Krejcie R.V. and Morgan D.W (1970). Determing Sample Size for Research Activities.
Educational and Psychological Measurement Vol 30.
[8]. Loreno LP and Clinton K, Mands Sleet D. (2006)Behaviour Change Intervetions in Road
SafetyInjury and Violence Prevention.
[9]. National Highway Traffic Safety Administration (2012) Traffic Safety Facts, 2010. Report no
DOT hs-811-659. Washington DC US Department of Transportation.
[10]. Ogendi J.Odero, W. Mitullah, W. and Khayesi, M. (2013)Patterns of Pedestrian Injuries in the
City of Nairobi: Implications for Urban Safety PlanningJournal of urban Health.
[11]. Ogendi, J. and Odero, W (2012)Trends of Motor Vehicle Crashes and Deaths in Kenya, 1963-
2008: An Emerging Public Health Challenge. SBHA 77:11-28
[12]. Opiyo, T. (2005)Kisumu Municipal Council-Sustainable Urban Mobility ProjectSUM City
Profile. Nairobi.
[13]. Oso W. O. and Onen D.,(2009). A General Guide to Writing Research and Proposal and Report:
A Handbook for Beginning Researchers Revised Edition Jomo Kenyatta Foundation.
[14]. Republic of Kenya (2009) Kenya’s National Road Safety nation plan 2009-2014, Ministry of
Transport. UNEP, 2009 Share the Road Initiative, www.unep.org/urban. Environment/NMT
Roads.
[15]. Safety Research in the United States and Abroad. Federal Highway Administration.
[16]. Salmon, P. Regan, M.and John I (2005)Human Error and Road Transport.Literature Review.
Monash University Accident Research Centre Report No 256.
[17]. Scot, A (2010) The effect of Police Enforcement on Road Traffic Accidents: A thesis submitted
in partial fulfillment for the degree of the requirement of the Degree of Doctor of Phiosophy in
the Edinburg Naper University.
www.ijbcnet.com International Journal of Business and Commerce Vol. 6, No.02: [01-14]
(ISSN: 2225-2436)
Published by Asian Society of Business and Commerce Research 10
[18]. Thomas, J.A., Rive, G., Garvitch, J., Frith, B., Charlton, S., and Barker, P. Australian Road
Safety Research (2012) Reducing Pedestrian Vehicle Conflict in the Central City through
improved Design.Policing and Education Conference. New Zealand.
[19]. Tingrall C. Haworth N. (2006) Vision zero. An Ethical Approach to Safety and Mobility. 6th ITE
International Conference Road Safety and Traffic Enforcement: Beyond 2000, Monash
University Accident Research Centre, Melbourne.
[20]. UN-HABITAT/IHE/ITDG (2005). The City of Kisumu Environment Profile on Sustainable
Urban Mobility: Nairobi Kenya.
[21]. Vaa, T. R. Phillips, Eds (2009) Effects of Road Safety Campaigns, Report D1.3, CAST Project.
European Commission.
[22]. Wasike (2007) Road Infrastructure Policies in Kenya; Historical Trends and Current Challenges
KIPPRA Working Paper No. 1.
[23]. World Health Organization WHO (2013)Make Walking Safe.A Brief Overview of Pedestrian Safe
around the World.
[24]. Wundersitz, L. N, Hutchinson T. P. and Wolley J. E. (2010) Best Practice in Road Safety
MassMedia Campaigns: A Literature Review.Adelaide: Centre for Automotive Safety
ResearchAustralia.
[25]. Zegeer, C. V. (2006)How to develop a Pedestrian Safety Action Plan. Federal Highway
Administration – office of Highway Safety University of North Carolina Chapel Hill.
[26]. Zheng, J, Wei Dai, Zhiqunsun and Yang Zhang (2010) Reliable Optimal Path for Pedestrian
Navigation. ICCTP: IntergratedTransportSystems.AmericanSociety of Civil Engineers.
www.ijbcnet.com International Journal of Business and Commerce Vol. 6, No.02: [01-14]
(ISSN: 2225-2436)
Published by Asian Society of Business and Commerce Research 11
Pedestrians’ questionnaire Items deleted to maximize
reliability
Cronbach’s alpha after
deletion
Public education on road safety. 3.2, 3.4, 3.5 & 3.6 0.67
Quality of Road engineering design 4.4, 4.5, 4.6 & 4.7 0.62
Enforcement of traffic laws 5.3, 5.4 & 5.5 0.81
Pedestrian Demographic factors 6.1, 6.2, 6.4 & 6.5 0.69
Implementation of pedestrian safety
rules
8.1, 8.2 & 8.6 0.72
Instrument reliability 0.702
Drivers questionnaire
Public education None 0.80
Road engineering design 3.2 & 3.5 0.67
Enforcement of traffic laws None 0.62
Implementation of pedestrian safety
rules
9.1 0.80
Instrument reliability 0.72
Table 1: Reliability

www.ijbcnet.com International Journal of Business and Commerce Vol. 6, No.02: [01-14]
(ISSN: 2225-2436)
Published by Asian Society of Business and Commerce Research 12
Characteristic Response Pedestrians Drivers
Frequency Percent Frequency Percent
Gender
Female 88 44 23 23
Male 112 6 77 77
Total 200 0 100 100
Age(years)
Below 20 10 5 4 4
Between 20 & 30 51 25.5 26 26
Between 30 & 40 60 30 38 38
Between 40 & 50 55 27.5 21 21
Between 50 & 60 21 10.5 10 10
Between 60 & 70 3 1.5 1 1
Total 200 100 100 100
Place of Residence
Rural 33 16.5 12 12
Peri-urban 119 59.5 46 46
Core urban 48 24 42 42
Total 200 100 100 100
Educational level
Primary 13 6.5 13 13
Secondary 49 24.5 26 26
Tertiary 49 24.5 16 16
University 89 44.5 45 45
Total 200 100 100 100
Table 2: Socio-demographic characteristics
www.ijbcnet.com International Journal of Business and Commerce Vol. 6, No.02: [01-14]
(ISSN: 2225-2436)
Published by Asian Society of Business and Commerce Research 13
Pedestrians (N=
200)
SA
A
N
D
SD
Mean
Std.
Dev Public Education
statements
Publicity and
advertising should be
increased
131(65.5%) 57(28.5%) 3(1.5%) 3(1.5%) 6(3.0%) 4.52 0.778
Increasing
knowledge of the
Traffic Act
135(67.5%) 45(22.5%) 4(2.0%) 4(2.0%) 10(5.0%) 4.47 0.821
Road Engineering
Design
VG Good Average Poor VP Mean Std.
Dev
Quality of design of
zebra crossing is
good
34(17.0%) 55(27.5%) 51(25.5%) 22(11.0%) 37(18.5%) 3.14 1.343
SA A N D SD Mean Std.
Dev
Width of side walk is
suitable for
pedestrians
18(9.0%) 91(45.5%) 10(5.0%) 22(11.0%) 58(29.0%) 2.94 1.450
Pavement quality is
good
6(3.0%) 85(42.5%) 15(7.5%) 24(12.0%) 70(35.0%) 2.67 1.401
Enforcement of
traffic laws
SA A N D SD Mean Std.
Dev
I am law abiding 84(42.0%) 86(43.0%) 21(10.5%) (3.5%) (1.0%) 4.215 0.844
Drivers should be
fined for displaying
risky behavior on the
road
119(59.5%) 64(32.0%) 6(3.0%) 5(2.5%) 5(2.5%) 4.425 0.874
Pedestrian
Demographic
Factors
SA A N D SD Mean Std.
Dev
You just need your
feet to walk not
education
35 (17.5%)
27(13.5%) 18(9.0%) 63(31.5%) 57(28.5%) 3.40 1.463
Level of education
determines decisions
made while using the
roads
57(28.5%) 66(33.0%) 25(12.5%) 27(13.5%) 25(12.5%) 3.52 1.360
www.ijbcnet.com International Journal of Business and Commerce Vol. 6, No.02: [01-14]
(ISSN: 2225-2436)
Published by Asian Society of Business and Commerce Research 14
Female pedestrians
are keen when using
pedestrian crossing
54(27.0%) 51(25.5%) 32(16.0%) 39(19.5%) 24(12.0%) 3.36 1.375
My age makes it
easy to use
pedestrian crossing
42(21.0%) 87(43.5%) 25(12.5%) 27(13.5%) 19(9.5%) 3.53 1.232
Drivers views (N=100) Mean Std.
Dev
View on public education on road safety 3.1180 0.8183
View on enforcement of traffic laws 1.8275 0.5344
View on implementation of pedestrian safety rules 3.5398 0.6142
Table 3: Descriptive statistics
Model
Summary
R R Square Adjusted R Square Std. Error of the
Estimate
.504 0.254 0.238 0.50717
Model
ANOVA
Sum of
Squares Df Mean Square F Sig.
Regression 17.036 4 4.259 16.558 .000
Residual 50.159 195 0.257
Total 67.195 199
Model
coefficients
Unstandardized
Coefficients
Standardized
Coefficients t Sig.
B Std.
Error Beta
(Constant) 1.933 0.367 5.271 0.000
Public Education on
road safety 0.049 0.048 0.065 1.012 0.313
Road Engineering
Designs -0.057 0.035 -0.103 -1.642 0.102
Enforcement of
Traffic Laws 0.267 0.74 0.229 3.594 0.000
Pedestrian
demographic factors 0.289 0.045 0.404 6.406 0.000
Table 4: Regression output for integrated road infrastructure interventions