Embed Size (px)
Citation preview
Journal of Information Processing Systems, Vol.7, No.3, September 2011 http://dx.doi.org/10.3745/JIPS.2011.7.3.473
473
Integrated Software Quality Evaluation: A Fuzzy Multi-Criteria Approach
Jagat Sesh Challa*, Arindam Paul*, Yogesh Dada*, Venkatesh Nerella*, Praveen Ranjan Srivastava** and Ajit Pratap Singh***
Abstract—Software measurement is a key factor in managing, controlling, and improving the software development processes. Software quality is one of the most important factors for assessing the global competitive position of any software company. Thus the quantification of quality parameters and integrating them into quality models is very essential. Software quality criteria are not very easily measured and quantified. Many attempts have been made to exactly quantify the software quality parameters using various models such as ISO/IEC 9126 Quality Model, Boehm’s Model, McCall’s model, etc. In this paper an attempt has been made to provide a tool for precisely quantifying software quality factors with the help of quality factors stated in ISO/IEC 9126 model. Due to the unpredictable nature of the software quality attributes, the fuzzy multi criteria approach has been used to evolve the quality of the software.
Keywords—Software Quality Parameters, ISO/IEC 9126, Fuzzy Software Quality Quantification Tool (FSQQT), Fuzzy Membership Function, Triangular Fuzzy Sets, KLOC, GUI, CUI
1. INTRODUCTION Software Engineering is the application of a systematic, disciplined, and quantifiable ap-
proach to the development, operation, and maintenance of software [1]. Due to the advancement of technology and the revolution brought about by the IT industry, the importance of the field of Software Engineering has been continuously growing. The importance of the field of Software Quality has grown in proportion to the growth in the applications of Software Engineering. The quality of software determines its value.
Software quality is a very important aspect for developers, users, and project managers. Vari-ous researchers have worked in developing suitable models that define software quality in dif-ferent perspectives as described in ISO/IEC 9126 Model [2], Boehm’s Model [3], Dromey’s Model [4] and the FURPS Model[5]. Quality, not only describes and measures the functional aspects of the software (what a system does), but also describes extra functional properties (how the system is built and performs). Different software quality models were proposed by various researchers in [2-5]. These models are proposed for generic software applications. Out of these
Manuscript received February 23, 2011; first revision June 7, 2011; accepted July 30, 2011. Corresponding Author: Praveen Ranjan Srivastava * M.E. Software Systems, Birla Institute of Technology and Science, Pilani, Rajasthan, India - 333031 ({jagatsesh;
arindampaul.bits; yogeshdada05; venkatesh.nerella56}@gmail.com) ** Lecturer - Department of Computer Science and Information Systems, Birla Institute of Technology and Science,
Pilani, Rajasthan, India- 333031 ([email protected]) *** Associate Professor - Department of Civil Engineering, Birla Institute of Technology and Science, Pilani, Rajast-
hanm India - 33301 ([email protected])
Copyright ⓒ 2011 KIPS (ISSN 1976-913X)
Integrated Software Quality Evaluation: A Fuzzy Multi-Criteria Approach
474
models, ISO/IEC 9126 model [2] is the most prominent model, which includes the findings of almost all other models. This is widely accepted and recognized in the industry and research community. Researchers made several efforts to implement this model for component based systems with minor modifications. This present work attempts to quantify the software quality parameters using the ISO/IEC 9126 Model [2] as the base model with appropriate modifications to it. In order to deal with the fuzziness or uncertainty in quantifying the actual software parame-ters, the fuzzy multi criteria approach has been used.
The remainder of the paper is structured as follows: Section 2 describes the related work. Sec-tion 3 discusses the general concepts of software quality with special reference to the ISO 9126 [2] model. Section 3.1 describes the characteristics and sub-characteristics in the ISO/IEC 9126 model and the modifications that have been incorporated into the model are discussed in Section 3.2. The basics of the fuzzy multi criteria approach has been briefly elucidated in Section 4. The assumptions have been stated in Section 5 and the procedure for fuzzifying the software quality metrics have been discussed in Section 6. Section 7 describes the criteria for fuzzifying the met-rics. Section 8 explains the evaluation performed on the proposed model using the software - Income Tax Calculator. Section 9 discusses some analysis that has been made by contrasting the present work with the existing work. Section 10 concludes the paper along with stating limita-tions and recommendations for future work.
2. RELATED WORK: SOFTWARE QUALITY AND THE FUZZY APPROACH Currently, one of the important aspects of research in the field of Software Engineering is the
“Quantification of Parameters Affecting the Software Quality.” Various researchers have made attempts to quantify the software quality criteria [6-8]. Sharma et al. [8] had considered the Component Based Software Development Model to quantify the software quality criteria men-tioned in the ISO/IEC 9126 model [2] with minor modifications. They used the Analytical Hier-archy Process (AHP) model and assigned weights to the software quality criteria to get the ac-tual software quality quantified. P. R. Srivastava et al. has also considered quantifying the soft-ware quality parameters in developer’s, user’s, and project manager’s perspectives and then took the weighted average for all of these factors to get the actual software quality [6]. S.A. Slaughter et al. has made an attempt to evaluate the cost of software quality [9]. M. Agarwal and K. Chari had considered the software quality in terms of quality, effort, and cycle time [10]. O. Maryoly, M.A. Perez, and T. Rojas developed a systemic quality model for developing and evaluating the software product [11]. Various characteristics and sub characteristics affecting the software quality have been quantified by using metrics to evaluate the software quality. Lamouchi Olfa, Amar R. Cherif, and Nicole Lévyalso attempted to quantify the software quality factors by sub-dividing the factors into criteria and sub criteria and by quantifying the metrics that are affecting them [12]. They have elucidated their approach clearly by showing an example of quantifying portability. Y. Kanellopoulos et al. evaluated the code quality using various metrics with the help of the Analytical Hierarchy process model [13]. They tried to evaluate the internal quality, which includes the characteristics - functionality, efficiency, maintainability and portability. I. Heitlager et al. emphasized estimating software quality based on maintainability [14] and R. Fitzpatrick et al. [15] and M.Bertoa et al. [16] have tried to estimate the software quality by mainly emphasizing usability. J. R. Brown has tried to evaluate reliability [17] and O. Maryoly
Jagat Sesh Challa, Arindam Paul, Yogesh Dada, Venkatesh Nerella, Praveen Ranjan Srivastava and Ajit Pratap Singh
475
[11] has tried to evaluate functionality. D. Gupta has provided a case study of different software quality estimation techniques to build a software quality model [18]. They also made a compara-tive survey of the performance of these models. Some of the techniques include the Artificial Neural Network, the Case-Base Rule, the Regression Tree, the Rule Based System, Multiple Linear Regression, and the Fuzzy System, etc. Their inferences suggest that the Fuzzy and Rule Based System techniques are better for designing and evaluating a Software Quality Model.
Previously, L. Lin et al. presented a new assessment method to obtain the integrated software quality for evaluating user satisfaction by using the fuzzy set theory based on the ISO 9126 Sample Quality Model with a single evaluator [19]. B. Yanghad proposed a software quality prediction model based on a fuzzy neural network, which helps in identifying design errors in software products in the early stages of a software lifecycle [20]. G. Buyukozkan presented a Fuzzy AHP approach for the selection of software development strategy [21]. They used the Extent Analysis Method (EAM) in fuzzy AHP. C. W. Chang et al. proposed Fuzzy AHP for the selection of software projects by using the subcriteria in ISO 9126-1:2001[22]. K. K. F. Yuen et al. employed Fuzzy AHP and specifically Fuzzy logarithmic least square method to estimate the software quality [23]. Various prioritizations and synthesis have been done to arrive at final software quality in terms of triangular fuzzy numbers, which can be defuzzified to get the origi-nal software quality. K. K. F. Yuen et al. proposes a Fuzzy AHP model for software quality evaluation and software vendor selection under uncertainty [24]. The model uses the modified Fuzzy Logarithmic Least Squares Method. This model rank various software so that the best can be chosen appropriately. J. Senior developed a method to visually represent metric scores so that the managers can easily see how their organisation is performing relative to the quality goals with respect to each metric [25]. The metrics were given appropriate colour scores or bands so that the project manager can visualize and evaluate them. This arrangement of ranges and colour scores led them to use fuzzy sets, where each colour was set in the universe of the discourse of metric scores. Each colour was represented by a certain fuzzy set. K. K. Aggarwal et al. pro-posed a fuzzy model for the assessment of maintainability where, maintainability is estimated based on the characteristics of software such as source code-readability, documentation quality, and cohesiveness among source codes and documents [26]. This model integrates four factors namely, the average number of Live Variables (LV), the average Life Span (LS) of variables, the average Cyclomatic Complexity (ACC), and the Comments Ratio (CR) to provide an esti-mate for maintainability. H. Mittal et al. proposed a fuzzy logic based precise approach to quan-tify the quality of software [27]. Software has been given quality grades on the basis of two met-rics-inspection rates per hour and error density, which are represented by triangular fuzzy num-bers.
Multi criteria decision making has been an age old process with there being much classical lit-erature available on this field [28,29]. S. Kanhe proposed a ranking methodology to cope with the cases when criteria values and the relative importance of criteria were independent random variables with given distributions [30]. In most of the literature the multi criteria approach has been used quantitatively where the values of the parameters are in numeric terms. Recent litera-ture used the qualitative approach as well, mainly by using fuzzy sets [31]. Baas and Kwaker-naak introduced fuzzy concepts in ranking, assuming that criteria values and the relative impor-tance of criteria were fuzzy numbers [32]. They extended the classical weighted average rating method to handle fuzzy numbers. Carlsson C. and Fuller R. gave a comprehensive survey of fuzzy multi-criteria decision-making methods with emphasis on fuzzy relations between inter-
Integrated Software Quality Evaluation: A Fuzzy Multi-Criteria Approach
476
dependent criteria [33]. P. R. Srivastava et al. tried to rank the software quality using the fuzzy multi criteria approach [7]. This paper mainly speaks about decision making in choosing the appropriate software. They ranked the software on the basis of SRS (Software Requirement Specifications) documents using the fuzzy multi criteria approach. This gives us the best suitable software for our needs. Similar analysis has been done using the ISO/IEC 9126 Quality Model [34]. A.P. Singh and A. K. Vidyarthi emphasized the decision making with the fuzzy multi crite-ria approach [35].They tried to locate the optimal landfill site from among three available sites. They ranked them using the fuzzy multi criteria approach to find out best possible site.
In this paper an attempt has been made to precisely quantify the software quality parameters using the ISO/IEC 9126 Model [2] as base model along with minor modifications to it. The Fuzzy Software Quality Quantification Tool (FSQQT) is a tool that has been developed based on the algorithm discussed in this paper. This tool takes several real time values of the metrics as inputs and gives the quantified software quality as output with respect to the user’s, developer’s, and project manager’s perspectives. It also gives the overall quality of the software. Section 6 explains the procedure to quantify software quality. The quantified quality lies in the range of 0 to 1. The fuzzy weighted average approach is used to evaluate the software quality in this paper.
3. SOFTWARE QUALITY The study of software quality involves a planned and systematic set of activities to ensure the
effectiveness of software. It consists of various sub topics like software quality assurance, qual-ity control, and quality engineering. According to the IEEE 610.12 standard [36], software qual-ity is a set of attributes of a software system and is defined as:
1. The degree to which a system, component, or process meets specified requirements. 2. The degree to which a system, component, or process meets customer or user needs or
expectations. 3. Quality also comprises of the factors leading to the satisfaction of its requirements. The quality of the software is measured in terms of its capability to fulfill the needs of the us-
ers and also its ability to achieve the developer’s goals. Quality is mainly studied by quality models. The quality model describes the set of characteristics, which are the basis for establish-ing the quality requirements and for evaluating software quality. In the present paper, the ISO/IEC 9126 Model [2] has been considered as the base model.
3.1 The ISO/IEC 9126 Model
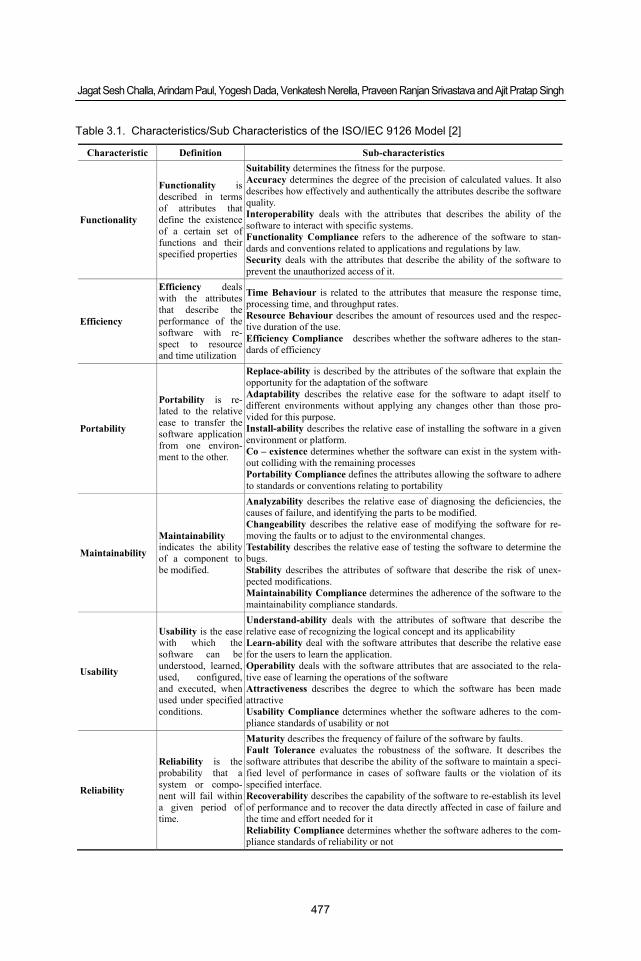
ISO (International Standard Organization) proposed a standard, known as the ISO/IEC 9126 Model [2], which provides a generic definition of software quality in terms of six main charac-teristics for software evaluation. These characteristics are functionality, efficiency, maintainabil-ity, portability, reliability and usability. The model covers almost all of the aspects covered in previously proposed models such as Boehm’s model [3], McCall’s model [4], Dromey’s model [5], etc. It covers both the internal and external quality characteristics of a software product. It does not however describe how these characteristics and sub characteristics can be quantified. Table 3.1 mentions the characteristics and sub characteristics of the ISO/IEC 9126 Model [2] in brief.
Jagat Sesh Challa, Arindam Paul, Yogesh Dada, Venkatesh Nerella, Praveen Ranjan Srivastava and Ajit Pratap Singh
477
Table 3.1. Characteristics/Sub Characteristics of the ISO/IEC 9126 Model [2]
Characteristic Definition Sub-characteristics
Functionality
Functionality is described in terms of attributes that define the existence of a certain set of functions and their specified properties
Suitability determines the fitness for the purpose. Accuracy determines the degree of the precision of calculated values. It also describes how effectively and authentically the attributes describe the software quality. Interoperability deals with the attributes that describes the ability of the software to interact with specific systems. Functionality Compliance refers to the adherence of the software to stan-dards and conventions related to applications and regulations by law. Security deals with the attributes that describe the ability of the software to prevent the unauthorized access of it.
Efficiency
Efficiency deals with the attributes that describe the performance of the software with re-spect to resource and time utilization
Time Behaviour is related to the attributes that measure the response time, processing time, and throughput rates. Resource Behaviour describes the amount of resources used and the respec-tive duration of the use. Efficiency Compliance describes whether the software adheres to the stan-dards of efficiency
Portability
Portability is re-lated to the relative ease to transfer the software application from one environ-ment to the other.
Replace-ability is described by the attributes of the software that explain the opportunity for the adaptation of the software Adaptability describes the relative ease for the software to adapt itself to different environments without applying any changes other than those pro-vided for this purpose. Install-ability describes the relative ease of installing the software in a given environment or platform. Co – existence determines whether the software can exist in the system with-out colliding with the remaining processes Portability Compliance defines the attributes allowing the software to adhere to standards or conventions relating to portability
Maintainability
Maintainability indicates the ability of a component to be modified.
Analyzability describes the relative ease of diagnosing the deficiencies, the causes of failure, and identifying the parts to be modified. Changeability describes the relative ease of modifying the software for re-moving the faults or to adjust to the environmental changes. Testability describes the relative ease of testing the software to determine the bugs. Stability describes the attributes of software that describe the risk of unex-pected modifications. Maintainability Compliance determines the adherence of the software to the maintainability compliance standards.
Usability
Usability is the ease with which the software can be understood, learned, used, configured, and executed, when used under specified conditions.
Understand-ability deals with the attributes of software that describe the relative ease of recognizing the logical concept and its applicability Learn-ability deal with the software attributes that describe the relative ease for the users to learn the application. Operability deals with the software attributes that are associated to the rela-tive ease of learning the operations of the software Attractiveness describes the degree to which the software has been made attractive Usability Compliance determines whether the software adheres to the com-pliance standards of usability or not
Reliability
Reliability is the probability that a system or compo-nent will fail within a given period of time.
Maturity describes the frequency of failure of the software by faults. Fault Tolerance evaluates the robustness of the software. It describes the software attributes that describe the ability of the software to maintain a speci-fied level of performance in cases of software faults or the violation of its specified interface. Recoverability describes the capability of the software to re-establish its level of performance and to recover the data directly affected in case of failure and the time and effort needed for it Reliability Compliance determines whether the software adheres to the com-pliance standards of reliability or not
Integrated Software Quality Evaluation: A Fuzzy Multi-Criteria Approach
478
3.2 Changes Made to the Model
As mentioned earlier, the ISO/IEC 9126 Model [2] has been used as a base to develop an ap-propriate model to quantify the software quality parameters. Table 3.1 clearly illustrates the characteristics and sub characteristics of the ISO/IEC 9126 Model.
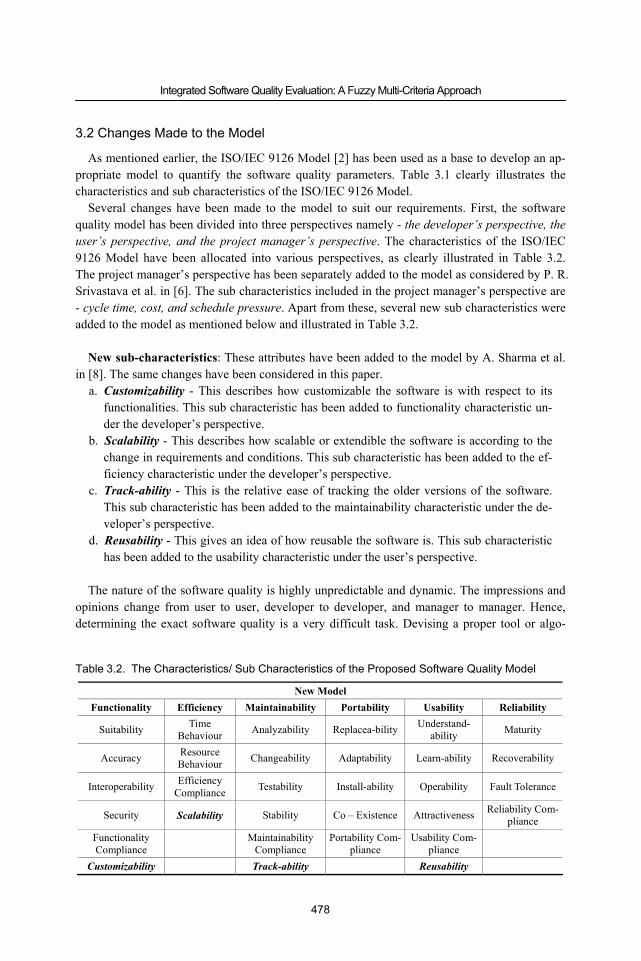
Several changes have been made to the model to suit our requirements. First, the software quality model has been divided into three perspectives namely - the developer’s perspective, the user’s perspective, and the project manager’s perspective. The characteristics of the ISO/IEC 9126 Model have been allocated into various perspectives, as clearly illustrated in Table 3.2. The project manager’s perspective has been separately added to the model as considered by P. R. Srivastava et al. in [6]. The sub characteristics included in the project manager’s perspective are - cycle time, cost, and schedule pressure. Apart from these, several new sub characteristics were added to the model as mentioned below and illustrated in Table 3.2.
New sub-characteristics: These attributes have been added to the model by A. Sharma et al.
in [8]. The same changes have been considered in this paper. a. Customizability - This describes how customizable the software is with respect to its
functionalities. This sub characteristic has been added to functionality characteristic un-der the developer’s perspective.
b. Scalability - This describes how scalable or extendible the software is according to the change in requirements and conditions. This sub characteristic has been added to the ef-ficiency characteristic under the developer’s perspective.
c. Track-ability - This is the relative ease of tracking the older versions of the software. This sub characteristic has been added to the maintainability characteristic under the de-veloper’s perspective.
d. Reusability - This gives an idea of how reusable the software is. This sub characteristic has been added to the usability characteristic under the user’s perspective.
The nature of the software quality is highly unpredictable and dynamic. The impressions and
opinions change from user to user, developer to developer, and manager to manager. Hence, determining the exact software quality is a very difficult task. Devising a proper tool or algo-
Table 3.2. The Characteristics/ Sub Characteristics of the Proposed Software Quality Model
New Model Functionality Efficiency Maintainability Portability Usability Reliability
Suitability Time Behaviour Analyzability Replacea-bility Understand-
ability Maturity
Accuracy Resource Behaviour Changeability Adaptability Learn-ability Recoverability
Interoperability Efficiency Compliance Testability Install-ability Operability Fault Tolerance
Security Scalability Stability Co – Existence Attractiveness Reliability Com-pliance
Functionality Compliance Maintainability
Compliance Portability Com-
pliance Usability Com-
pliance
Customizability Track-ability Reusability
Jagat Sesh Challa, Arindam Paul, Yogesh Dada, Venkatesh Nerella, Praveen Ranjan Srivastava and Ajit Pratap Singh
479
rithm to determine the exact software quality is very difficult. In order to deal with the dynamic nature of parameters affecting the software quality, Fuzzy Logic has been used in this paper. Fuzzy Logic is mainly helpful in determining the values of the software quality parameters in terms of propositions rather than simple numeric values. This helps us to resolve the vagueness in the software quality to some extent. In this paper, the weights and ratings of the software quality parameters have been quantified in terms of fuzzy sets, which are finally converted to crisp or numeric values.
4. THE FUZZY MULTI- CRITERIA APPROACH Fuzzy Logic is a powerful problem-solving methodology that can be used for applications in
many areas such as embedded control and information processing. Fuzzy Logic provides an easier way to infer definite conclusions from highly imprecise, vague, and ambiguous informa-tion when compared with classical logic. Fuzzy Logic brings us close to human decision making, enabling one to analyze approximate data to precise solutions. Classical logic requires a high understanding of the system, whereas Fuzzy Logic allows for the modelling of a complex sys-tem using a higher level of abstraction originating from our experience and knowledge, without diving deep into the system.
The concept of Fuzzy Logic was first conceived by Lofti Zadeh in 1965, who presented it as a way of processing data by allowing a partial membership set rather than a crisp membership set or non-membership. Fuzzy Logic incorporates a simple, rule-based “If X and Y then Z” ap-proach for solving the problem rather than solving it mathematically. The Fuzzy Logic model is completely empirical and relies on the experience of the operator rather than the technical un-derstanding of the subject.
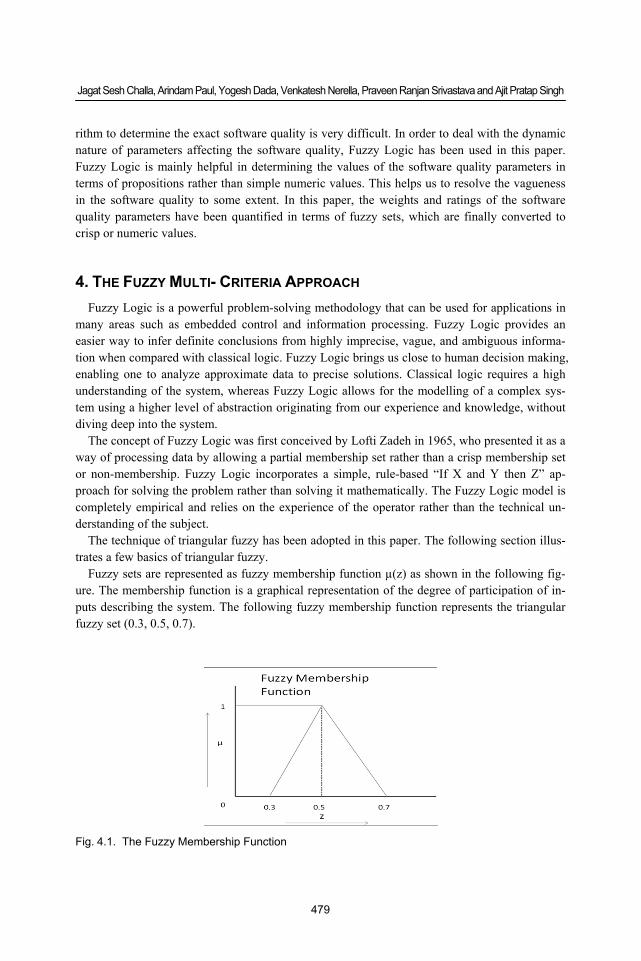
The technique of triangular fuzzy has been adopted in this paper. The following section illus-trates a few basics of triangular fuzzy.
Fuzzy sets are represented as fuzzy membership function µ(z) as shown in the following fig-ure. The membership function is a graphical representation of the degree of participation of in-puts describing the system. The following fuzzy membership function represents the triangular fuzzy set (0.3, 0.5, 0.7).
Fig. 4.1. The Fuzzy Membership Function
Integrated Software Quality Evaluation: A Fuzzy Multi-Criteria Approach
480
4.1 Fuzzy Operations
The weighted average technique of fuzzy sets is used in this paper to evolve software quality. The Extension Principle is adopted for the fuzzy operations in this paper. Fuzzy operations [37] such as fuzzy addition and fuzzy multiplication are explained below.
Fuzzy Multiplication - Let (a,b,c) and (x,y,z) be two triangular fuzzy sets, then the fuzzy
multiplication for triangular fuzzy sets is defined as (a,b,c) × (x,y,z) = (a×x, b×y, c×z)
Fuzzy Addition - Let (a,b,c) and (x,y,z) be two triangular fuzzy sets, then the fuzzy addition
is defined as (a,b,c) + (x,y,z) = [max(a,x), max(b,y), max(c,z)]
4.2 Fuzzification
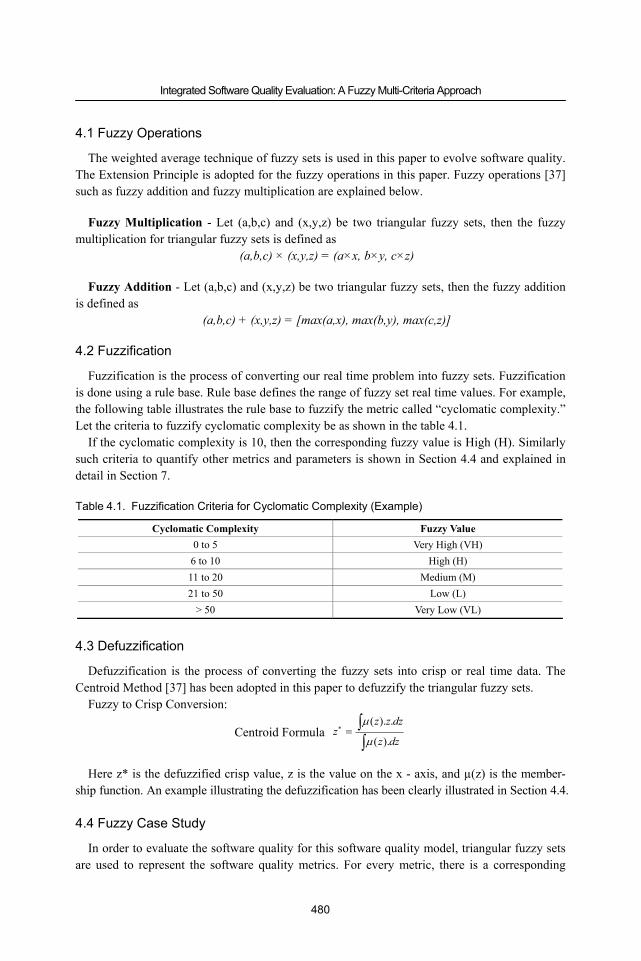
Fuzzification is the process of converting our real time problem into fuzzy sets. Fuzzification is done using a rule base. Rule base defines the range of fuzzy set real time values. For example, the following table illustrates the rule base to fuzzify the metric called “cyclomatic complexity.” Let the criteria to fuzzify cyclomatic complexity be as shown in the table 4.1.
If the cyclomatic complexity is 10, then the corresponding fuzzy value is High (H). Similarly such criteria to quantify other metrics and parameters is shown in Section 4.4 and explained in detail in Section 7.
4.3 Defuzzification
Defuzzification is the process of converting the fuzzy sets into crisp or real time data. The Centroid Method [37] has been adopted in this paper to defuzzify the triangular fuzzy sets.
Fuzzy to Crisp Conversion:
Centroid Formula ∫∫=∗
dzz
dzzzz
).(
.).(
μ
μ
Here z* is the defuzzified crisp value, z is the value on the x - axis, and µ(z) is the member-
ship function. An example illustrating the defuzzification has been clearly illustrated in Section 4.4.
4.4 Fuzzy Case Study
In order to evaluate the software quality for this software quality model, triangular fuzzy sets are used to represent the software quality metrics. For every metric, there is a corresponding
Table 4.1. Fuzzification Criteria for Cyclomatic Complexity (Example)
Cyclomatic Complexity Fuzzy Value 0 to 5 Very High (VH)
6 to 10 High (H) 11 to 20 Medium (M) 21 to 50 Low (L)
> 50 Very Low (VL)
Jagat Sesh Challa, Arindam Paul, Yogesh Dada, Venkatesh Nerella, Praveen Ranjan Srivastava and Ajit Pratap Singh
481
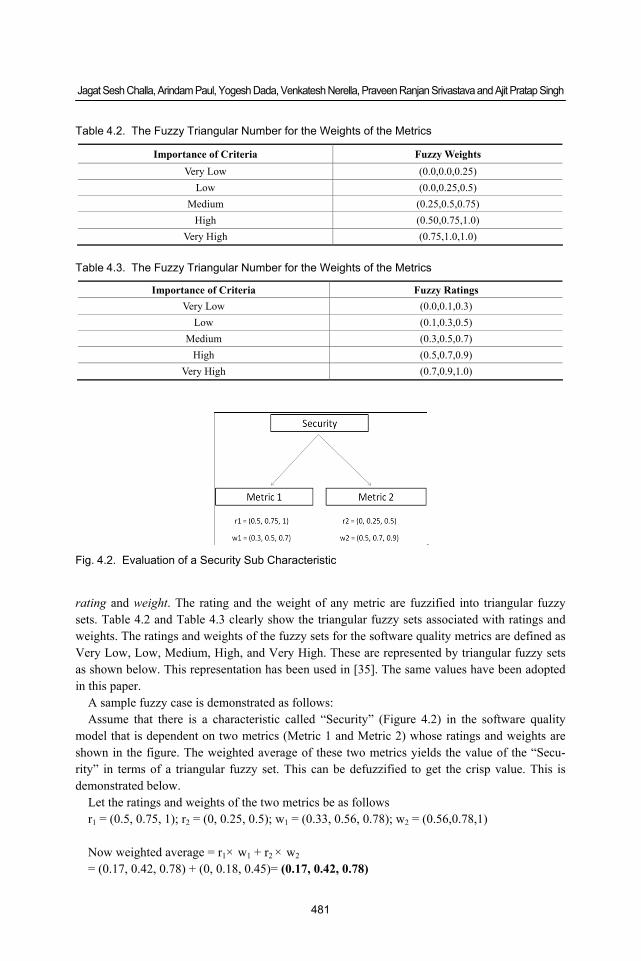
rating and weight. The rating and the weight of any metric are fuzzified into triangular fuzzy sets. Table 4.2 and Table 4.3 clearly show the triangular fuzzy sets associated with ratings and weights. The ratings and weights of the fuzzy sets for the software quality metrics are defined as Very Low, Low, Medium, High, and Very High. These are represented by triangular fuzzy sets as shown below. This representation has been used in [35]. The same values have been adopted in this paper.
A sample fuzzy case is demonstrated as follows: Assume that there is a characteristic called “Security” (Figure 4.2) in the software quality
model that is dependent on two metrics (Metric 1 and Metric 2) whose ratings and weights are shown in the figure. The weighted average of these two metrics yields the value of the “Secu-rity” in terms of a triangular fuzzy set. This can be defuzzified to get the crisp value. This is demonstrated below.
Let the ratings and weights of the two metrics be as follows r1 = (0.5, 0.75, 1); r2 = (0, 0.25, 0.5); w1 = (0.33, 0.56, 0.78); w2 = (0.56,0.78,1) Now weighted average = r1× w1 + r2 × w2
= (0.17, 0.42, 0.78) + (0, 0.18, 0.45)= (0.17, 0.42, 0.78)
Table 4.2. The Fuzzy Triangular Number for the Weights of the Metrics
Importance of Criteria Fuzzy Weights Very Low (0.0,0.0,0.25)
Low (0.0,0.25,0.5) Medium (0.25,0.5,0.75)
High (0.50,0.75,1.0) Very High (0.75,1.0,1.0)
Table 4.3. The Fuzzy Triangular Number for the Weights of the Metrics
Importance of Criteria Fuzzy Ratings Very Low (0.0,0.1,0.3)
Low (0.1,0.3,0.5) Medium (0.3,0.5,0.7)
High (0.5,0.7,0.9) Very High (0.7,0.9,1.0)
Fig. 4.2. Evaluation of a Security Sub Characteristic
Integrated Software Quality Evaluation: A Fuzzy Multi-Criteria Approach
482
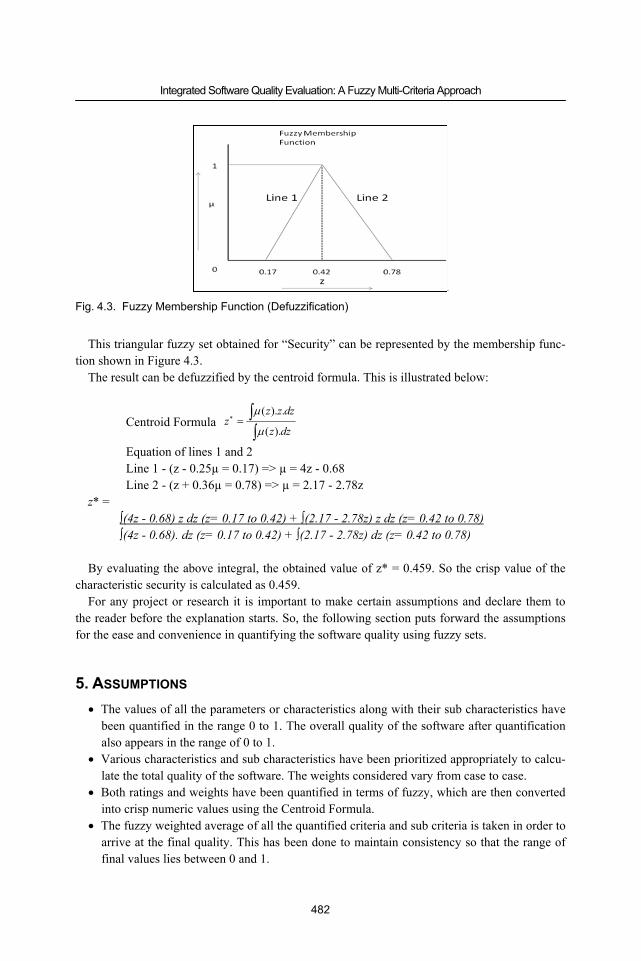
This triangular fuzzy set obtained for “Security” can be represented by the membership func-tion shown in Figure 4.3.
The result can be defuzzified by the centroid formula. This is illustrated below:
Centroid Formula ∫∫=∗
dzz
dzzzz
).(
.).(
μ
μ
Equation of lines 1 and 2 Line 1 - (z - 0.25µ = 0.17) => µ = 4z - 0.68 Line 2 - (z + 0.36µ = 0.78) => µ = 2.17 - 2.78z
z* = ∫(4z - 0.68) z dz (z= 0.17 to 0.42) + ∫(2.17 - 2.78z) z dz (z= 0.42 to 0.78) ∫(4z - 0.68). dz (z= 0.17 to 0.42) + ∫(2.17 - 2.78z) dz (z= 0.42 to 0.78)
By evaluating the above integral, the obtained value of z* = 0.459. So the crisp value of the
characteristic security is calculated as 0.459. For any project or research it is important to make certain assumptions and declare them to
the reader before the explanation starts. So, the following section puts forward the assumptions for the ease and convenience in quantifying the software quality using fuzzy sets.
5. ASSUMPTIONS • The values of all the parameters or characteristics along with their sub characteristics have
been quantified in the range 0 to 1. The overall quality of the software after quantification also appears in the range of 0 to 1.
• Various characteristics and sub characteristics have been prioritized appropriately to calcu-late the total quality of the software. The weights considered vary from case to case.
• Both ratings and weights have been quantified in terms of fuzzy, which are then converted into crisp numeric values using the Centroid Formula.
• The fuzzy weighted average of all the quantified criteria and sub criteria is taken in order to arrive at the final quality. This has been done to maintain consistency so that the range of final values lies between 0 and 1.
Fig. 4.3. Fuzzy Membership Function (Defuzzification)
Jagat Sesh Challa, Arindam Paul, Yogesh Dada, Venkatesh Nerella, Praveen Ranjan Srivastava and Ajit Pratap Singh
483
Now the following section clearly illustrates the exact procedure for quantifying all the soft-ware quality parameters that contribute to the software quality as discussed in ISO/IEC 9126 Model [2].
6. PROCEDURE The exact procedure to quantify the software quality has been described in this section. As it
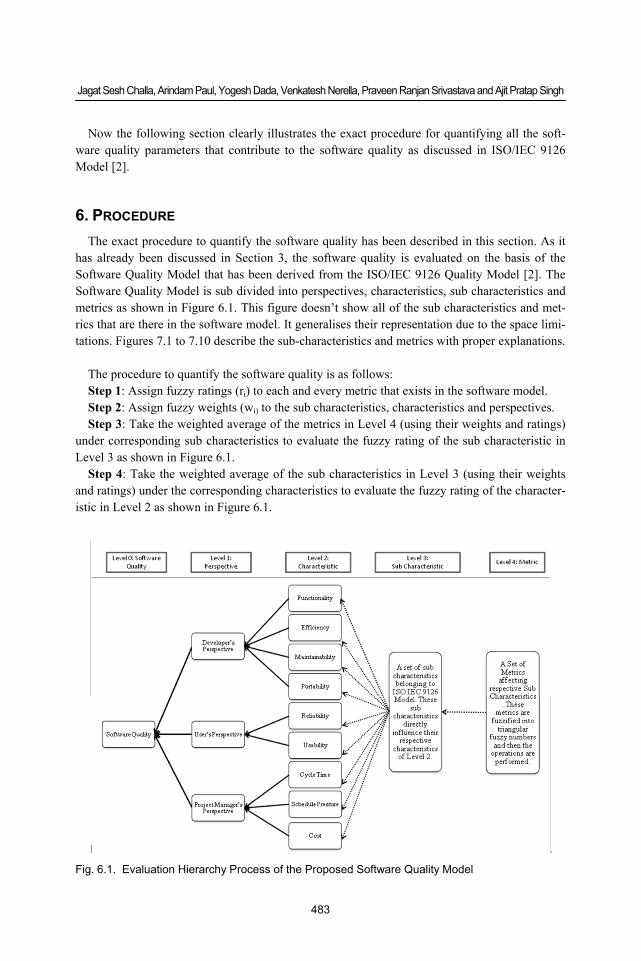
has already been discussed in Section 3, the software quality is evaluated on the basis of the Software Quality Model that has been derived from the ISO/IEC 9126 Quality Model [2]. The Software Quality Model is sub divided into perspectives, characteristics, sub characteristics and metrics as shown in Figure 6.1. This figure doesn’t show all of the sub characteristics and met-rics that are there in the software model. It generalises their representation due to the space limi-tations. Figures 7.1 to 7.10 describe the sub-characteristics and metrics with proper explanations.
The procedure to quantify the software quality is as follows: Step 1: Assign fuzzy ratings (ri) to each and every metric that exists in the software model. Step 2: Assign fuzzy weights (wi) to the sub characteristics, characteristics and perspectives. Step 3: Take the weighted average of the metrics in Level 4 (using their weights and ratings)
under corresponding sub characteristics to evaluate the fuzzy rating of the sub characteristic in Level 3 as shown in Figure 6.1.
Step 4: Take the weighted average of the sub characteristics in Level 3 (using their weights and ratings) under the corresponding characteristics to evaluate the fuzzy rating of the character-istic in Level 2 as shown in Figure 6.1.
Fig. 6.1. Evaluation Hierarchy Process of the Proposed Software Quality Model
Integrated Software Quality Evaluation: A Fuzzy Multi-Criteria Approach
484
Step 5: Take the weighted average of the characteristics quality in Level 2 (using their weights and ratings) under the corresponding perspectives to evaluate the fuzzy rating of the different perspectives in Level 1 as shown in Figure 6.1.
Step 6: Take the weighted average of the perspective quality in Level 1 (using their weights and ratings) under the corresponding perspectives to evaluate the fuzzy rating of the different perspectives in Level 0 as shown in Figure 6.1.
Step 7: The obtained fuzzy rating in Step 6 is the final software quality. This has to be de-fuzzified by using the centroid Formula to get the crisp value of the software quality.
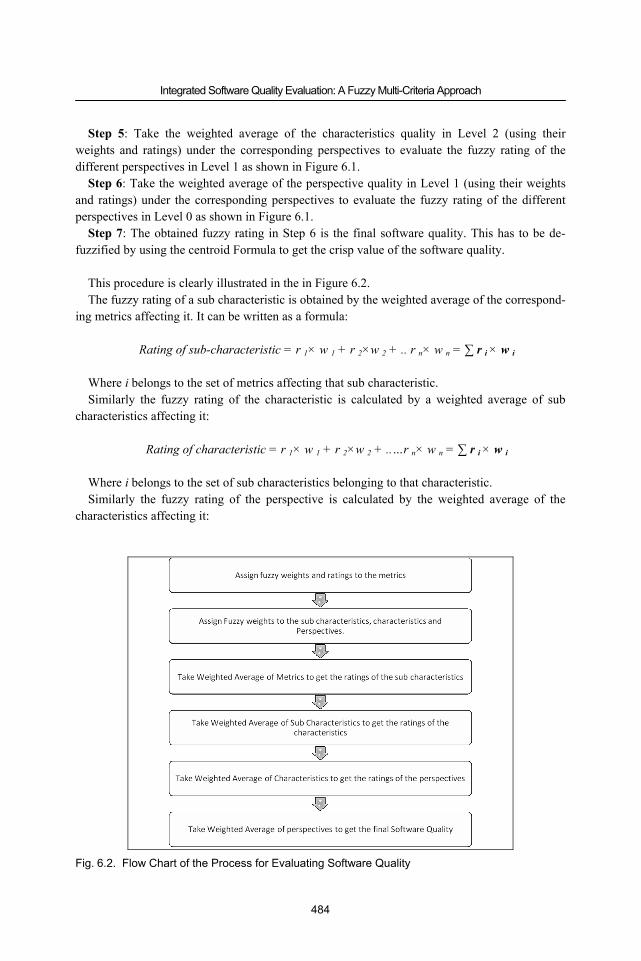
This procedure is clearly illustrated in the in Figure 6.2. The fuzzy rating of a sub characteristic is obtained by the weighted average of the correspond-
ing metrics affecting it. It can be written as a formula:
Rating of sub-characteristic = r 1× w 1 + r 2×w 2 + .. r n× w n = ∑ r i × w i Where i belongs to the set of metrics affecting that sub characteristic. Similarly the fuzzy rating of the characteristic is calculated by a weighted average of sub
characteristics affecting it:
Rating of characteristic = r 1× w 1 + r 2×w 2 + ..…r n× w n = ∑ r i × w i Where i belongs to the set of sub characteristics belonging to that characteristic. Similarly the fuzzy rating of the perspective is calculated by the weighted average of the
characteristics affecting it:
Fig. 6.2. Flow Chart of the Process for Evaluating Software Quality
Jagat Sesh Challa, Arindam Paul, Yogesh Dada, Venkatesh Nerella, Praveen Ranjan Srivastava and Ajit Pratap Singh
485
Rating of perspective = r 1× w 1 + r 2×w 2 + …… r n× w n = ∑ r i × w i where i belongs to the set of characteristics belonging to that perspective. Now the fuzzy rating of the overall quality can be calculated using equation.
r Net Quality = r Developer’s×w Developer’s+ r User’s× w User’s+ r Project Manager’s× w Project Manager’s
The metrics are real time values and can be obtained via questionnaires or interactive inter-
face. In this paper, the required inputs of the ratings of the metrics and weights at different levels are obtained from the users, developers, and project manager separately via an interactive user interface.
Section 7 describes all the fuzzy metrics in detail along with the method used to fuzzify them. For further explanation on the evaluation of software quality, please refer to Section 8.
After understanding the exact procedure for quantifying the software quality, the following section illustrates how different metrics belonging to different characteristics (mentioned in the ISO/IEC 9126 Model) are fuzzified using various criteria.
7. CRITERIA TO EVALUATE AND FUZZIFY THE METRICS To evaluate the software quality, the software quality has first been evaluated with respect to
different perspectives - developer’s, user’s, and project manager’s perspectives. There are various characteristics that are associated with every perspective. Every characteris-
tic is associated with several sub characteristics. Each sub characteristic is further associated with metrics. These metrics are real time values. The criteria to fuzzify these metrics are dis-cussed in the latter section.
Before explaining this section further, readers are requested to note the abbreviations used. In the process of fuzzification, fuzzy sets are assigned to the real time values. They are assigned as Very High (VH), High (H), Low (L) or Very Low (VL). The above abbreviations are used throughout this section.
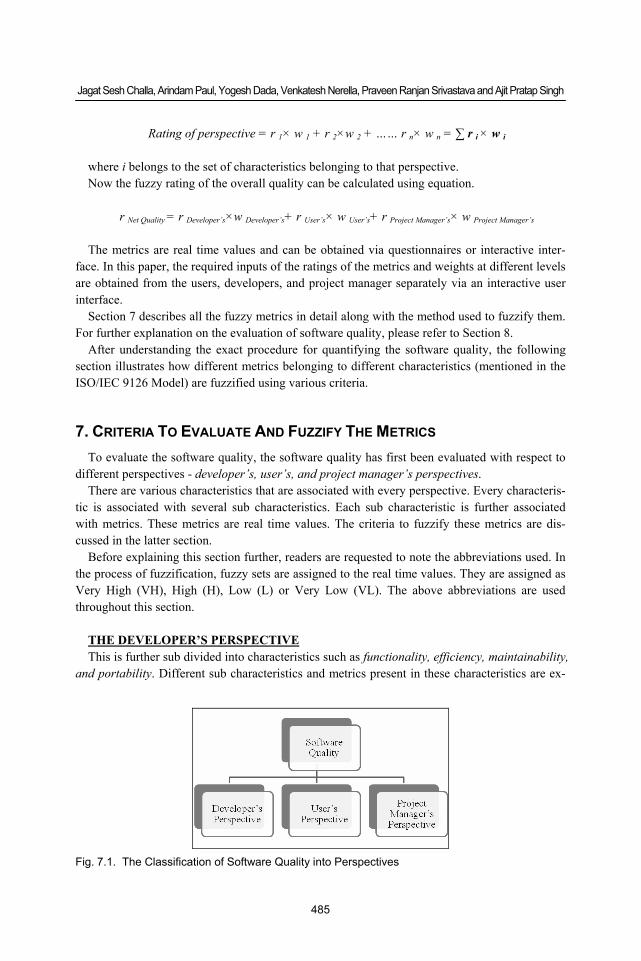
THE DEVELOPER’S PERSPECTIVE This is further sub divided into characteristics such as functionality, efficiency, maintainability,
and portability. Different sub characteristics and metrics present in these characteristics are ex-
Fig. 7.1. The Classification of Software Quality into Perspectives
Integrated Software Quality Evaluation: A Fuzzy Multi-Criteria Approach
486
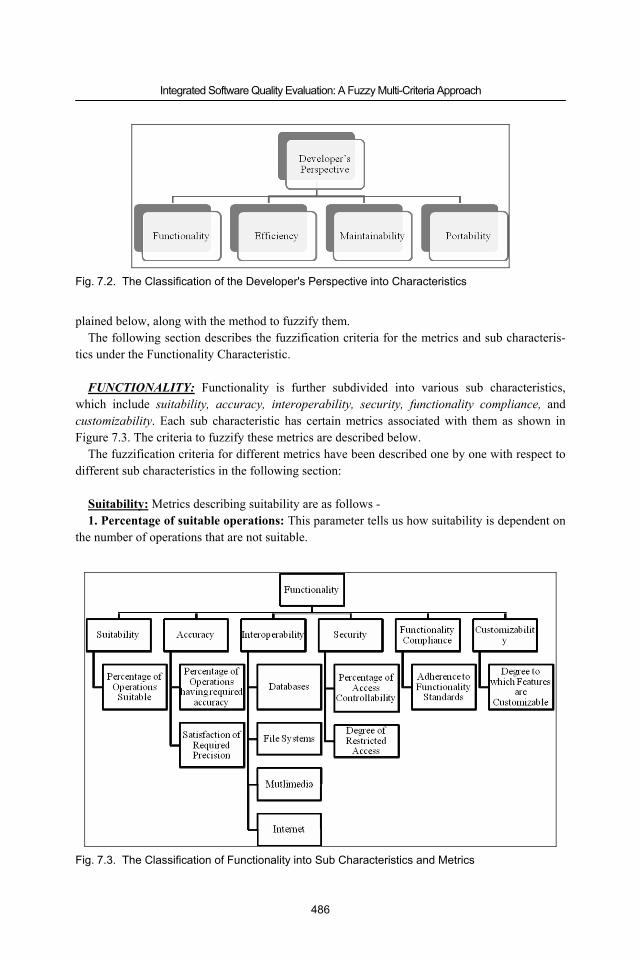
plained below, along with the method to fuzzify them. The following section describes the fuzzification criteria for the metrics and sub characteris-
tics under the Functionality Characteristic. FUNCTIONALITY: Functionality is further subdivided into various sub characteristics,
which include suitability, accuracy, interoperability, security, functionality compliance, and customizability. Each sub characteristic has certain metrics associated with them as shown in Figure 7.3. The criteria to fuzzify these metrics are described below.
The fuzzification criteria for different metrics have been described one by one with respect to different sub characteristics in the following section:
Suitability: Metrics describing suitability are as follows - 1. Percentage of suitable operations: This parameter tells us how suitability is dependent on
the number of operations that are not suitable.
Fig. 7.2. The Classification of the Developer's Perspective into Characteristics
Fig. 7.3. The Classification of Functionality into Sub Characteristics and Metrics
Jagat Sesh Challa, Arindam Paul, Yogesh Dada, Venkatesh Nerella, Praveen Ranjan Srivastava and Ajit Pratap Singh
487
Percentage of operations suitable=1-(No.of operations not suitable/Total number of opera-tions provided)
The more number of unsuitable operations, lesser is the suitability and so is the quality of the software. So, this metric can be fuzzified in the range of VL to VH as [< 0.3 (VL); 0.3 to 0.5 (L); 0.5 to 0.7 (M); 0.7 to 0.85 (H); > 0.85 (VH)].
The suitability sub characteristic is simply obtained by the value of the above metric. There is no need for any weighted average, as there is only one metric influencing the suitability sub characteristic.
Accuracy: Metrics describing accuracy are as follows: - 1. The percentage of operations that have required accuracy: This parameter tells us how
the number of accurate operations affects accuracy. The percent of operations having required accuracy=No.of operations having required accu-
racy/Total number of operations × 100 The more number of accurate operationsthe more accuracy there is and thus, it is the same
with the quality of the software. So, this metric can be fuzzified in the range of VL to VH as [< 0.3 (VL); 0.3 to 0.5 (L); 0.5 to 0.7 (M); 0.7 to 0.85 (H); > 0.85 (VH)].
2. Satisfaction of required precision: This parameter tells us how accuracy is affected by the information where the precision is satisfied or not. If precision is satisfied, the accuracy is high, otherwise it is low. So, this metric can be fuzzified in the range of L to H as [Precision Satisfied (H); Precision not Satisfied (L)]
The value of the accuracy sub characteristic is obtained by the weighted average of the above two metrics.
Interoperability: Metrics describing interoperability are as follows: - 1. Databases: This parameter tells us how the popularity of the database affects interoperabil-
ity. If database popularity is high, interoperability is very high. Similarly, if the database chosen is less popular, interoperability is also less. So, this metric can be fuzzified in the range of L to VH as [Oracle (VH); MS SQL Server and My SQL(H);MS Access (M); Others (L)].
2. Multimedia: This parameter tells us how multimedia affects interoperability. If multimedia is too high or too low, software quality is reduced. So, multimedia should be sufficient enough. So, this metric can be fuzzified in the range of M to H as [If multimedia is - Too High (M); Sufficient Enough (H); Too Low (M)].
3. File-Systems: This parameter tells us how the presence of file-system support affects inter-operability. If file-system support is present, interoperability of the software is high, otherwise it is low. So, this metric can be fuzzified in the range of L to H as [File System Support - Present (H); Not Present (L)].
4. Internet: This parameter tells us how the presence of internet support affects interoperabil-ity. If internet support is present, the interoperability of the software is high, otherwise it will be low. So, this metric can be fuzzified in the range of L to H as [Internet System Support - Pre-sent (H); Not Present (L)].
The value of the interoperability sub characteristic is obtained by the weighted average of the above four metrics.
Integrated Software Quality Evaluation: A Fuzzy Multi-Criteria Approach
488
Security: Metrics describing security are as follows: - 1. Percentage of access controllability provided: This parameter tells us how the amount of
access controllability provided affects security. The percent of operations having access controllability provided=No.of access controllability
provided/Total number of access controllability required. The more the access controllability is provided, the greater the security and vice versa. Simi-
larly, if access controllability is less, security is reduced. So, this metric can be fuzzified in the range of VL to VH as [< 0.3 (VL); 0.3 to 0.5 (L); 0.5 to 0.7 (M); 0.7 to 0.85 (H); > 0.85 (VH)].
2. Degree of restricted access: This parameter tells us how the degree of restricted user ac-cess affects interoperability. If there is restricted access with password encryption, security is very high and vice versa. So, this metric can be fuzzified in the range of L to VH as [Presence of Restricted Access - with Password (VH); Without Password (H); No Protection (L)].
The value of the security sub characteristic is obtained by the weighted average of the above two metrics.
Functionality Compliance: Metrics describing functionality compliance are as follows: 1. Adherence of software to standards: This parameter tells us how software quality is af-
fected by adherence to functionality compliance standards. This metric can be fuzzified in the range of L to VH as [Adheres to Compliance Standards (VH); Doesn’t Adhere to Standards (L)].
Functionality compliance is simply obtained by the value of the above metric. There is no need for any weighted average as there is only one metric influencing the functionality compli-ance sub characteristic.
Customizability: Metrics describing customizability are as follows: - 1. Degree to which features are customizable: This parameter tells us how the number of
customizable features affects customizability. Degree of customizability= (1-1/k) where k denotes the number of customizable features. The more number of features that are customizable the greater the degree of customizability
and thus, the quality of the software is higher. So, this metric can be fuzzified in the range of VL to VH as [< 0.4 (L); 0.4 to 0.6 (M); 0.6 to 0.8 (H); > 0.8 (VH)].
The customizability sub characteristic is simply obtained by the value of the above metric. There is no need for any weighted average as there is only one metric influencing the custom-izability sub characteristic.
After obtaining the values of all the sub characteristics, the value of the functionality charac-teristic can be calculated simply by taking the weighted average of all of the sub characteristics.
r functionality= r 1×w 1 + r 2× w 2 + … r n×w n = ∑ r i × w i
where i belongs to the set {suitability, accuracy, interoperability, security, compliance, and
customizability}. The following section illustrates the fuzzification criteria for various metrics and sub charac-
teristics under the characteristic efficiency.
Jagat Sesh Challa, Arindam Paul, Yogesh Dada, Venkatesh Nerella, Praveen Ranjan Srivastava and Ajit Pratap Singh
489
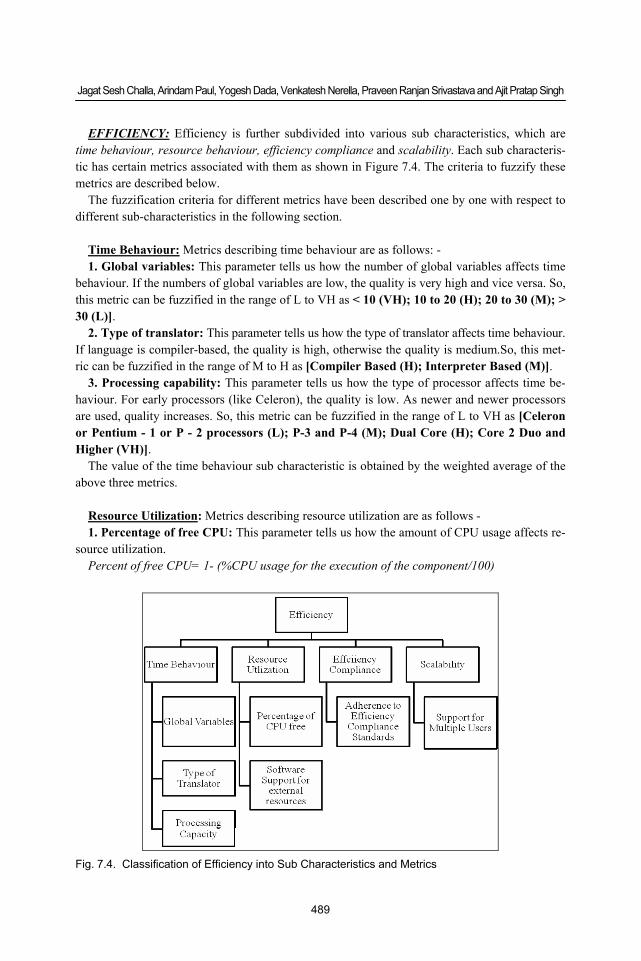
EFFICIENCY: Efficiency is further subdivided into various sub characteristics, which are time behaviour, resource behaviour, efficiency compliance and scalability. Each sub characteris-tic has certain metrics associated with them as shown in Figure 7.4. The criteria to fuzzify these metrics are described below.
The fuzzification criteria for different metrics have been described one by one with respect to different sub-characteristics in the following section.
Time Behaviour: Metrics describing time behaviour are as follows: - 1. Global variables: This parameter tells us how the number of global variables affects time
behaviour. If the numbers of global variables are low, the quality is very high and vice versa. So, this metric can be fuzzified in the range of L to VH as < 10 (VH); 10 to 20 (H); 20 to 30 (M); > 30 (L)].
2. Type of translator: This parameter tells us how the type of translator affects time behaviour. If language is compiler-based, the quality is high, otherwise the quality is medium.So, this met-ric can be fuzzified in the range of M to H as [Compiler Based (H); Interpreter Based (M)].
3. Processing capability: This parameter tells us how the type of processor affects time be-haviour. For early processors (like Celeron), the quality is low. As newer and newer processors are used, quality increases. So, this metric can be fuzzified in the range of L to VH as [Celeron or Pentium - 1 or P - 2 processors (L); P-3 and P-4 (M); Dual Core (H); Core 2 Duo and Higher (VH)].
The value of the time behaviour sub characteristic is obtained by the weighted average of the above three metrics.
Resource Utilization: Metrics describing resource utilization are as follows - 1. Percentage of free CPU: This parameter tells us how the amount of CPU usage affects re-
source utilization. Percent of free CPU= 1- (%CPU usage for the execution of the component/100)
Fig. 7.4. Classification of Efficiency into Sub Characteristics and Metrics
Integrated Software Quality Evaluation: A Fuzzy Multi-Criteria Approach
490
The more the amount of CPU usage, the lower the percentage of free CPU and thus, quality decreases. So, this metric can be fuzzified in the range of L to VH as [< 0.2 (L); 0.2 to 0.4 (M); 0.4 to 0.6 (H); > 0.6 (VH)].
2. Software support for external resources (scanners, printers, etc.): This parameter tells us how the presence of software support for external resources affects interoperability. If soft-ware support for external resources are present, resource utilization of the software is high and vice versa. So, this metric can be fuzzified in the range of L to H as [External Resources - Supported (H); Not Supported (L)]
The value of the resource utilization sub characteristic is obtained by the weighted average of the above two metrics.
Efficiency Compliance: Metrics describing efficiency compliance are as follows: - 1. Adherence to efficiency compliance standards: This parameter tells us how adherences
to efficiency compliance standards affects interoperability. This metric can be fuzzified in the range of L to VH as [Adheres to Compliance Standards (VH); Doesn’t Adhere to Standards (L)].
The efficiency compliance sub characteristic is simply obtained by the value of the above metric. There is no need for any weighted average as there is only one metric influencing the efficiency compliance sub characteristic.
Scalability: Metrics describing scalability are as follows: - 1. Support for multiple users: This parameter tells us how support for multiple users affects
scalability. This metric can be fuzzified in the range of L to VH as [Software is Scalable to Accommodate Multiple Users (VH); Not Scalable (L)].
The scalability sub characteristic is simply obtained by the value of the above metric. There is no need for any weighted average as there is only one metric influencing the scalability sub characteristic.
After obtaining the values of all the sub characteristics under the efficiency characteristic, the value of the efficiency characteristic can be calculated simply by taking the weighted average of all the sub characteristics.
r efficiency= r 1× w 1 + r 2× w 2 + … r n× w n = ∑ r i× w i
where i belong to the set {time behavior, resource utilization, compliance, and scalability} The following section illustrates the fuzzification criteria for various metrics and sub charac-
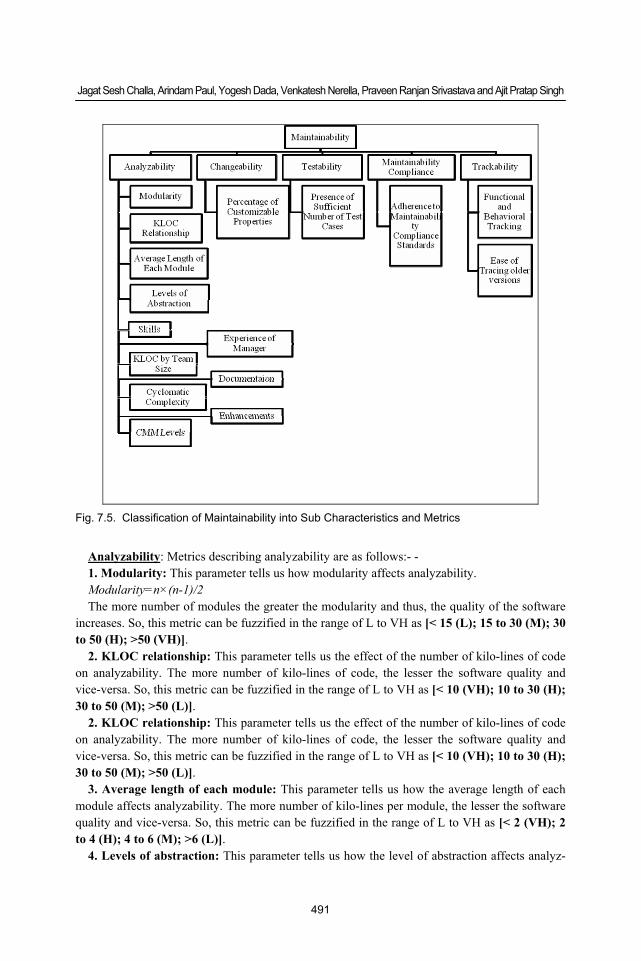
teristics under the characteristic maintainability. MAINTAINABILITY: Maintainability is further subdivided into various sub characteristics,
which include analyzability, changeability, testability, stability, maintainability compliance, and track-ability. Each sub characteristic has certain metrics associated with them as shown in Fig-ure 7.5. The criteria to fuzzify these metrics are described below.
The fuzzification criteria for different metrics have been described one by one with respect to different sub characteristics in the following section.
Jagat Sesh Challa, Arindam Paul, Yogesh Dada, Venkatesh Nerella, Praveen Ranjan Srivastava and Ajit Pratap Singh
491
Analyzability: Metrics describing analyzability are as follows:- - 1. Modularity: This parameter tells us how modularity affects analyzability. Modularity=n×(n-1)/2 The more number of modules the greater the modularity and thus, the quality of the software
increases. So, this metric can be fuzzified in the range of L to VH as [< 15 (L); 15 to 30 (M); 30 to 50 (H); >50 (VH)].
2. KLOC relationship: This parameter tells us the effect of the number of kilo-lines of code on analyzability. The more number of kilo-lines of code, the lesser the software quality and vice-versa. So, this metric can be fuzzified in the range of L to VH as [< 10 (VH); 10 to 30 (H); 30 to 50 (M); >50 (L)].
2. KLOC relationship: This parameter tells us the effect of the number of kilo-lines of code on analyzability. The more number of kilo-lines of code, the lesser the software quality and vice-versa. So, this metric can be fuzzified in the range of L to VH as [< 10 (VH); 10 to 30 (H); 30 to 50 (M); >50 (L)].
3. Average length of each module: This parameter tells us how the average length of each module affects analyzability. The more number of kilo-lines per module, the lesser the software quality and vice-versa. So, this metric can be fuzzified in the range of L to VH as [< 2 (VH); 2 to 4 (H); 4 to 6 (M); >6 (L)].
4. Levels of abstraction: This parameter tells us how the level of abstraction affects analyz-
Fig. 7.5. Classification of Maintainability into Sub Characteristics and Metrics
Integrated Software Quality Evaluation: A Fuzzy Multi-Criteria Approach
492
ability. The level of abstraction depends on the programming language used. The more the level of abstraction the higher the analyzability. So, this metric can be fuzzified in the range of L to VH as [Programming Language - Java, ASP.NET, VB.NET and C# (VH); C and C++ (H); Others (L)]
5. Skills: This metric is further sub divided into sub metrics as explained below. 5-1. Technical Skills: This parameter tells us how the satisfaction of all or some of the requi-
site technical skills by the developer affects the quality of the software. If all the requisite skills are satisfied by the developer, the quality is high. As the number of technical skills met reduces, the quality decreases. Programming skills, database skills, design skills, analyzing skills, and technical management skills are the skills considered here. This metric can be fuzzified in the range of VL to VH as [Number of Skills - All 5 Skills (VH); 4 skills (H); 3 skills (M); 2 skills (L); 1 or less than 1 skill (VL)].
5-2. Organizational Skills i) Industry experience: This parameter describes the effect of the number of years of In-
dustry experience of the developer on the level of organizational skills of the software. If the industry experience of developer is low, the level of organization skill is low and vice versa. This metric can be fuzzified in the range of L to VH as [< 2 (L); 2 to 4 (M); 4 to 7 (H); > 7 (VH)].
5-3. Team Skills a) Average quality of the citizenship of team members: This parameter tells us how the
average quality of the citizenship of the team-members affects the team skills and thus the organizational skills of the developer. If the average quality of citizenship is low, the level of the developer's team skill is low and vice versa. This metric can be fuzzified in the range of L to VH as [Low (L); Average (M); Good (H); Excellent (VH)].
b) Cooperation among team members: This parameter tells us how cooperation among the team-members affects the team skills and thus the organizational skills of the devel-oper. The more the cooperation among team members, greater is the quality of the soft-ware. This metric can be fuzzified in the range of L to VH as [Low (L); Average (M); Good (H); Excellent (VH)].
c) Overall performance of the team: This parameter tells us how the overall performance of the team affects the team skills and thus the organizational skills of the developer. As the overall performance of the team increases, the quality of the software increases. This metric can be fuzzified in the range of L to VH as [Low (L); Average (M); Good (H); Excellent (VH)].
The fuzzy weighted average of the above three sub-sub-sub metrics would give the value of the sub metric team skills.
The fuzzy weighted average of the sub-sub metrics-team skills and industry experi-ence would give the value of the sub metric organizational skills.
The fuzzy weighted average of the sub metrics-technical skills and organizational skills shall give the value of the metric skills.
6. The Manager's Experience: This metric is further sub divided into sub metrics as shown below:
6-1. Experience in a software firm: This parameter describes the effect of the number of years of the manager's experience in a software firm on the overall managerial experi-ence. If their experience in a software firm increases, overall manager experience also
Jagat Sesh Challa, Arindam Paul, Yogesh Dada, Venkatesh Nerella, Praveen Ranjan Srivastava and Ajit Pratap Singh
493
increases. This metric can be fuzzified in the range of L to VH as [>2 years (L); 2 to 4 years (M); 4 to 7 (H); >7 years (VH)].
6-2. Experience in a managerial position: This parameter describes the effect of the number of years of the manager's experience in a managerial position on the overall managerial experience. If experience in a managerial position is low, managerial experience is low and vice versa. This metric can be fuzzified in the range of L to VH as [<2 years (L); 2 to 4 years (M); 4 to 7 (H); >7 years (VH)].
The weighted average of the sub metrics 6-1 and 6-2 shall give the value of the metric experi-ence of the manager.
7. KLOC by team size: This parameter tells us how the number of kilo-lines of code per team member affects analyzability.
KLOC by team size= (Total KLOC/Total No.of team members) The more the ratio of kilo-lines of code by team-size increases, the lower the software quality
and vice-versa. This metric can be fuzzified in the range of L to VH as [< 1 (L); 1 to 3 (M); 3 to 5 (H); >5 (VH)].
8. Documentation: This parameter tells us how the availability of a proper developer’s man-ual affects analyzability. If proper developer’s manual is available, the analyzability of the soft-ware is very high, otherwise it is low. This metric can be fuzzified in the range of L to VH as [Developer’s manual - available (VH); otherwise (L)].
9. Cyclomatic complexity: This parameter describes the effect of the cyclomatic complexity of the software on analyzability. As the cyclomatic complexity of the software increases, ana-lyzability reduces and vice-versa. This metric can be fuzzified in the range of L to VH as [0 to 5 (VH); 6 to 10 (H); 11 to 20 (M); 21 to 50 (L); > 50 (VL)].
10. Enhancements: This parameter tells us how the number of versions released affects ana-lyzability. The more number of versions released, the higher the analyzability of the software and vice-versa. This metric can be fuzzified in the range of L to VH as [1 (L); 2 or 3 (M); 4 or 5 (H); > = 6 (VH)].
11. CMM levels: This parameter tells us how analyzability depends on CMM levels. If the CMM level is low, The analyzability of the software is low and vice versa. This metric can be fuzzified in the range of L to VH as [Level 1 or 2 (L); Level 3 (M); Level 4 (H); Level 5 (VH)].
The value of the analyzability sub characteristic is obtained by the weighted average of the above eleven metrics.
Changeability: Metrics describing changeability are as follows: - 1. Percentage of customizable properties: This parameter tells us how the percentage of
customizable properties affects changeability. Percentage of customizable properties=No.of customizable properties/total number of prop-
erties. If the percentage of customizable properties increases, changeability increases. This metric
can be fuzzified in the range of VL to VH as [< 0.3 (VL); 0.3 to 0.5 (L); 0.5 to 0.75 (M); 0.75 to 0.85 (H); > 0.85 (VH)].
The changeability sub characteristic is simply obtained by the value of the above metric. There is no need for any weighted average as there is only one metric influencing the change-ability sub characteristic.
Integrated Software Quality Evaluation: A Fuzzy Multi-Criteria Approach
494
Testability: Metrics describing testability are as follows: - 1. Presence of a sufficient No. of test cases: This parameter tells us how the presence of a
sufficient No. of test cases affects testability. If a sufficient No. of test cases is present, testabil-ity of the software is very high, otherwise it is low. This metric can be fuzzified in the range of L to VH as [Sufficient Test Cases Provided- Yes (VH); No (L)].
The testability sub characteristic is simply obtained by the value of the above metric. There is no need for any weighted average as there is only one metric influencing the testability sub characteristic.
Maintainability Compliance: Metrics describing maintainability compliance are as follows:- 1. Maintainability compliance: This parameter tells us how adherence to maintainability
compliance standards affects maintainability. This metric can be fuzzified in the range of L to VH as [Adheres to Compliance Standards (VH); doesn’t Adhere to Standards (L)].
The maintainability compliance sub characteristic is simply obtained by the value of the above metric. There is no need for any weighted average as there is only one metric influencing the maintainability compliance sub characteristic.
Track-ability: Metrics describing track-ability are as follows:- 1. Functional and behavioural tracking system provided for easy maintenance: This pa-
rameter tells us how the presence of a functional and behavioural tracking system for easy main-tenance affects track-ability. If a functional and behavioural tracking system is provided, the track-ability of the software is very high, otherwise it is low. This metric can be fuzzified in the range of L to VH as [Presence of Functional and Behavioural Tracking System - Yes (VH); No (L)].
2. Ease of tracking the older versions of the software: This parameter tells us how the ease of tracking older versions of the software affects track-ability. If it is easy to track older versions, the track-ability of the software is very high and vice versa. This metric can be fuzzified in the range of VL to VH as [Ease of Tracking - Very Easy and Comfortable (VH); Easy and Comfortable (H); Not Easy but Comfortable (M); Tough and Not Comfortable (L); Night Mare (VL)]
The value of the track-ability sub characteristic is obtained by the weighted average of the above two metrics.
After obtaining the values of all the sub characteristics under the maintainability characteristic, the value of the maintainability characteristic can be calculated simply by taking the weighted average of all the sub characteristics.
r Maintainability= r 1× w 1 + r 2× w 2 + … r n× w n = ∑ r i × w i where i belongs to the set {analyzability, changeability, testability, maintainability compli-
ance, track-ability, and skills} The following section illustrates the fuzzification criteria for various metrics and sub charac-
teristics under the characteristic portability. PORTABILITY: Portability is further subdivided into various sub characteristics that are:
adaptability, install-ability, co-existence, and portability compliance. Each sub characteristic
Jagat Sesh Challa, Arindam Paul, Yogesh Dada, Venkatesh Nerella, Praveen Ranjan Srivastava and Ajit Pratap Singh
495
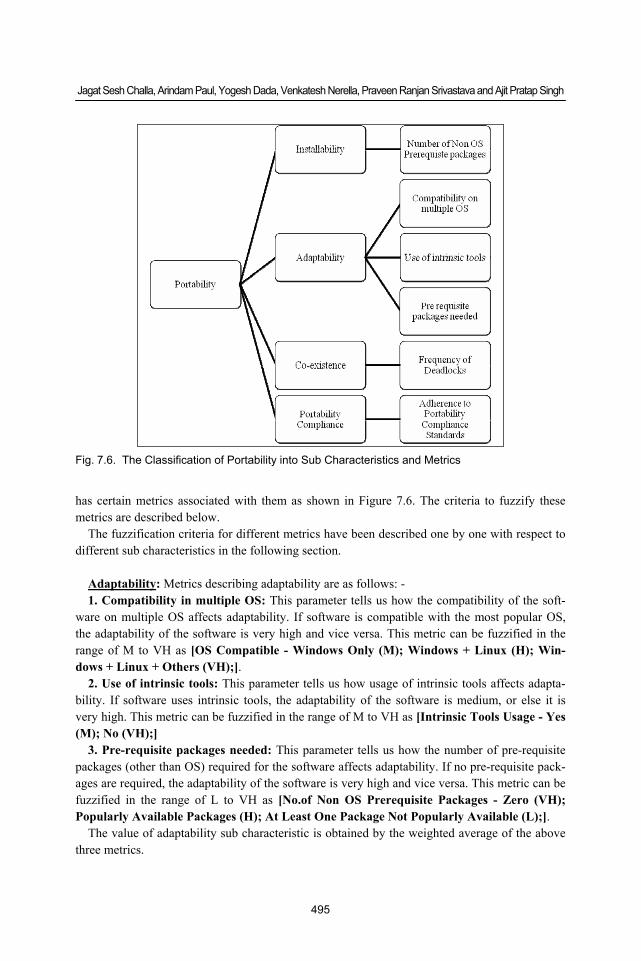
has certain metrics associated with them as shown in Figure 7.6. The criteria to fuzzify these metrics are described below.
The fuzzification criteria for different metrics have been described one by one with respect to different sub characteristics in the following section.
Adaptability: Metrics describing adaptability are as follows: - 1. Compatibility in multiple OS: This parameter tells us how the compatibility of the soft-
ware on multiple OS affects adaptability. If software is compatible with the most popular OS, the adaptability of the software is very high and vice versa. This metric can be fuzzified in the range of M to VH as [OS Compatible - Windows Only (M); Windows + Linux (H); Win-dows + Linux + Others (VH);].
2. Use of intrinsic tools: This parameter tells us how usage of intrinsic tools affects adapta-bility. If software uses intrinsic tools, the adaptability of the software is medium, or else it is very high. This metric can be fuzzified in the range of M to VH as [Intrinsic Tools Usage - Yes (M); No (VH);]
3. Pre-requisite packages needed: This parameter tells us how the number of pre-requisite packages (other than OS) required for the software affects adaptability. If no pre-requisite pack-ages are required, the adaptability of the software is very high and vice versa. This metric can be fuzzified in the range of L to VH as [No.of Non OS Prerequisite Packages - Zero (VH); Popularly Available Packages (H); At Least One Package Not Popularly Available (L);].
The value of adaptability sub characteristic is obtained by the weighted average of the above three metrics.
Fig. 7.6. The Classification of Portability into Sub Characteristics and Metrics
Integrated Software Quality Evaluation: A Fuzzy Multi-Criteria Approach
496
Install-ability: Metrics describing install-ability are as follows:- 1. Number of non-OS pre-requisite packages: This parameter tells us how the number of
pre-requisite packages, other than OS, required for the software affects install-ability. If no non-OS pre-requisite packages are required, the install-ability of the software is very high and vice versa. This metric can be fuzzified in the range of L to VH as [No.of Non OS Prerequisite Packages - Zero (VH); Popularly Available Packages (H); At Least One Package Not Popularly Available (L);].
The install-ability sub characteristic is simply obtained by the value of the above metric. There is no need for any weighted average, as there is only one metric influencing the install-ability sub characteristic.
Co-existence: Metrics describing co-existence are as follows: - 1.Frequency of deadlocks: This parameter tells us how the frequency of deadlocks in the
running of the software affects co-existence. If deadlocks occur very frequently, the degree of the co-existence of the software is very low and vice versa. This metric can be fuzzified in the range of VL to VH as [Frequency of Deadlocks - Very Frequent (VL); Frequent (L); Some-times (M); Rarely (H); Not at All (VH)].
The co-existence sub characteristic is simply obtained by the value of the above metric. There is no need for any weighted average as there is only one metric influencing the co-existence sub characteristic.
Portability Compliance: Metrics describing portability compliance are as follows: 1. Software adhering to portability compliance standards: This parameter tells us how the
software's adherence to portability compliance standards affects portability compliance. This metric can be fuzzified in the range of L to VH as [Adheres to Compliance Standards (VH); Doesn’t Adhere to Standards (L)].
The portability compliance sub characteristic is simply obtained by the value of the above metric. There is no need for any weighted average as there is only one metric influencing the portability compliance sub characteristic.
After obtaining the values of all the sub characteristics under the portability characteristic, the value of the portability characteristic can be calculated simply by taking the weighted average of all the sub characteristics that were calculated above.
r Portability= r 1× w 1 + r 2× w 2 + … r n× w n = ∑ r i × w i where i belong to the set {adaptability, install-ability, co-existence, and portability compli-
ance} Similarly by taking the weighted average of the following characteristics: functionality, effi-
ciency, maintainability and portability, the developer’s perspective quality can be obtained. r Developer’s = r Functionality× w Functionality+ r Efficiency× w Efficiency+ r Maintainability× w Maintainability+
r Portability× w Portability The quality is obtained in terms of fuzzy set, which can be defuzzified using the Centroid For-
mula to get the actual crisp value for the developer’s perspective quality.
Jagat Sesh Challa, Arindam Paul, Yogesh Dada, Venkatesh Nerella, Praveen Ranjan Srivastava and Ajit Pratap Singh
497
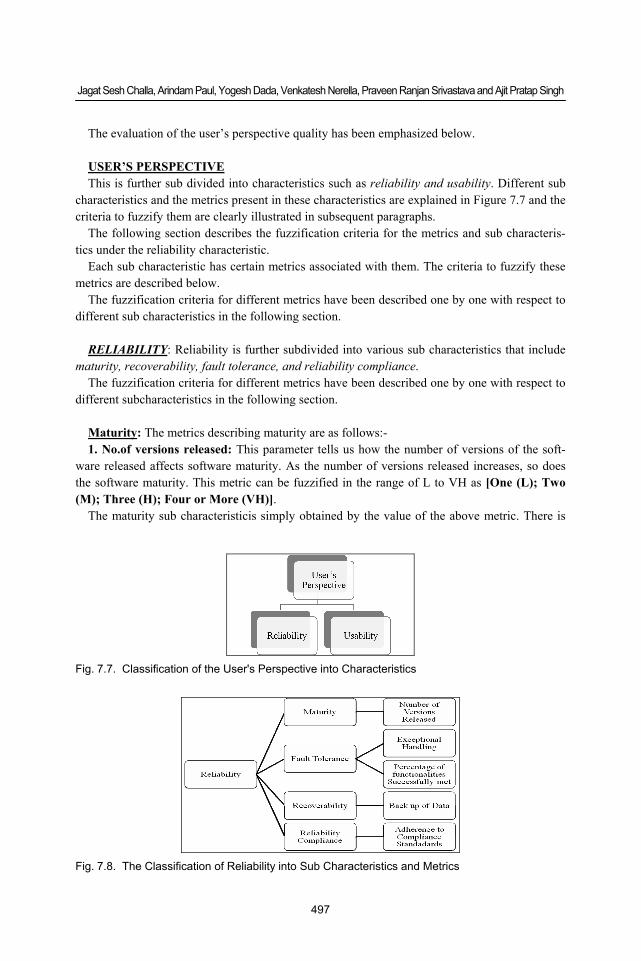
The evaluation of the user’s perspective quality has been emphasized below. USER’S PERSPECTIVE This is further sub divided into characteristics such as reliability and usability. Different sub
characteristics and the metrics present in these characteristics are explained in Figure 7.7 and the criteria to fuzzify them are clearly illustrated in subsequent paragraphs.
The following section describes the fuzzification criteria for the metrics and sub characteris-tics under the reliability characteristic.
Each sub characteristic has certain metrics associated with them. The criteria to fuzzify these metrics are described below.
The fuzzification criteria for different metrics have been described one by one with respect to different sub characteristics in the following section.
RELIABILITY: Reliability is further subdivided into various sub characteristics that include
maturity, recoverability, fault tolerance, and reliability compliance. The fuzzification criteria for different metrics have been described one by one with respect to
different subcharacteristics in the following section. Maturity: The metrics describing maturity are as follows:- 1. No.of versions released: This parameter tells us how the number of versions of the soft-
ware released affects software maturity. As the number of versions released increases, so does the software maturity. This metric can be fuzzified in the range of L to VH as [One (L); Two (M); Three (H); Four or More (VH)].
The maturity sub characteristicis simply obtained by the value of the above metric. There is
Fig. 7.7. Classification of the User's Perspective into Characteristics
Fig. 7.8. The Classification of Reliability into Sub Characteristics and Metrics
Integrated Software Quality Evaluation: A Fuzzy Multi-Criteria Approach
498
no need for any weighted average as there is only one metric influencing the maturity sub char-acteristic.
Fault Tolerance: The metrics describing fault tolerance are as follows: 1. Exception handling: This parameter tells us how the presence of an exception handling
mechanism in the software affects fault-tolerance. If software has exception handling mecha-nisms present, fault tolerance is very high, and otherwise it is moderate. This metric can be fuzzified in the range of M to VH as [Exceptional Handling Present (VH); Not Present (M)].
2. Percentage of functionalities successfully met: This parameter tells us how the percent-age of functionalities successfully met affects changeability.
The percentage of functionalities successfully met=Total number of functionalities success-fully met/Total number of functionalities available.
As the percentage of functionalities successfully met increases, fault tolerance increases. The following table illustrates this effect. This metric can be fuzzified in the range of VL to VH as [< 0.3 (VL); 0.3 to 0.5 (L); 0.5 to 0.7 (M); 0.7 to 0.85 (H); > 0.85 (VH)].
The fault tolerance sub characteristic can be obtained by the weighted average of the above two metrics.
Recoverability: The metrics describing recoverability are as follows:- 1. Back up of the data: This parameter tells us how the availability of the backup of data af-
fects recoverability. If software has a data backup facility available, the recoverability of the software is very high, otherwise it is low. This metric can be fuzzified in the range of L to VH as [Data Backup Available (VH); otherwise (L)].
The recoverability sub characteristic is simply obtained by the value of the above metric. There is no need for any weighted average as there is only one metric influencing the recover-ability sub characteristic.
Reliability Compliance: The metrics describing reliability compliance are as follows:- 1. Software adheres to reliability compliance standards: This parameter tells us how ad-
herence of the software to reliability compliance standards affects reliability compliance. This metric can be fuzzified in the range of L to VH as [Adheres to Compliance Standards (VH); Doesn’t Adhere to Standards (L)].
The reliability compliance sub characteristic is simply obtained by the value of the above met-ric. There is no need for any weighted average as there is only one metric influencing the reli-ability compliance sub characteristic.
After obtaining the values of all the sub characteristic under the reliability characteristic, the value of the reliability characteristic can be calculated simply by taking the weighted average of all the sub characteristics that were calculated above.
r Reliability= r 1× w 1 + r 2× w 2 + … r n× w n = ∑ r i × w i where i belongs to the set {maturity, fault tolerance, recoverability, and reliability compli-
ance} The following section illustrates the fuzzification criteria for various metrics and sub charac-
teristics under the Characteristic Usability.
Jagat Sesh Challa, Arindam Paul, Yogesh Dada, Venkatesh Nerella, Praveen Ranjan Srivastava and Ajit Pratap Singh
499
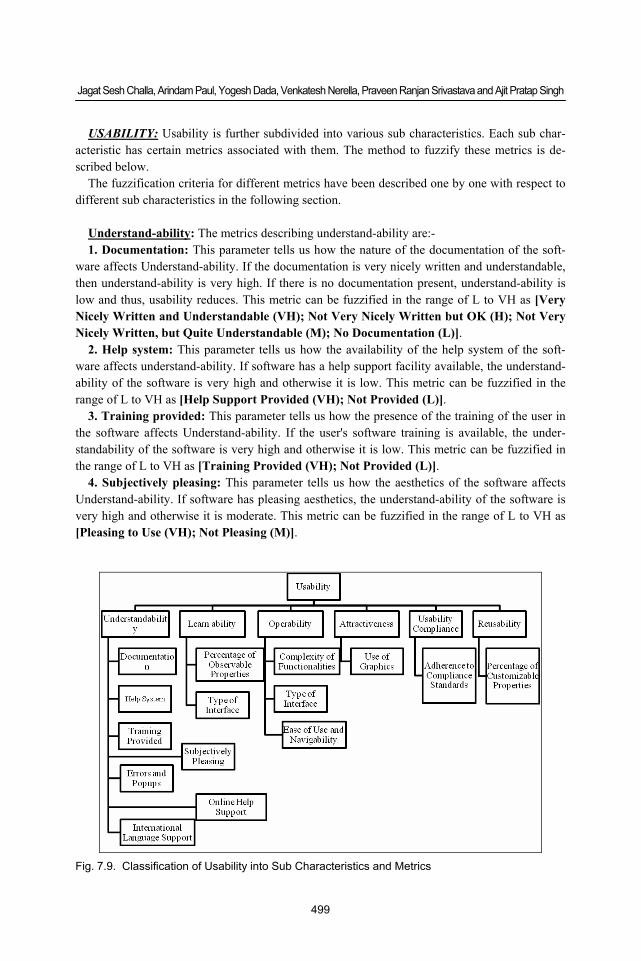
USABILITY: Usability is further subdivided into various sub characteristics. Each sub char-acteristic has certain metrics associated with them. The method to fuzzify these metrics is de-scribed below.
The fuzzification criteria for different metrics have been described one by one with respect to different sub characteristics in the following section.
Understand-ability: The metrics describing understand-ability are:- 1. Documentation: This parameter tells us how the nature of the documentation of the soft-
ware affects Understand-ability. If the documentation is very nicely written and understandable, then understand-ability is very high. If there is no documentation present, understand-ability is low and thus, usability reduces. This metric can be fuzzified in the range of L to VH as [Very Nicely Written and Understandable (VH); Not Very Nicely Written but OK (H); Not Very Nicely Written, but Quite Understandable (M); No Documentation (L)].
2. Help system: This parameter tells us how the availability of the help system of the soft-ware affects understand-ability. If software has a help support facility available, the understand-ability of the software is very high and otherwise it is low. This metric can be fuzzified in the range of L to VH as [Help Support Provided (VH); Not Provided (L)].
3. Training provided: This parameter tells us how the presence of the training of the user in the software affects Understand-ability. If the user's software training is available, the under-standability of the software is very high and otherwise it is low. This metric can be fuzzified in the range of L to VH as [Training Provided (VH); Not Provided (L)].
4. Subjectively pleasing: This parameter tells us how the aesthetics of the software affects Understand-ability. If software has pleasing aesthetics, the understand-ability of the software is very high and otherwise it is moderate. This metric can be fuzzified in the range of L to VH as [Pleasing to Use (VH); Not Pleasing (M)].
Fig. 7.9. Classification of Usability into Sub Characteristics and Metrics
Integrated Software Quality Evaluation: A Fuzzy Multi-Criteria Approach
500
5. Errors and Pop-Ups: This parameter tells us how the availability of pop-up and error han-dling and provision for user convenience of the software affects Understand-ability. If pop-ups and error handling is available, the understand-ability of the software is very high or else it is low. This metric can be fuzzified in the range of L to VH as [Pop-ups Provided (VH); Not Provided (L)].
6. Online help support: This parameter tells us how the availability of the online help system of the software affects Understand-ability. If the software has online help support facility avail-able, the understand-ability of the software is very high or else it is low. This metric can be fuzzified in the range of L to VH as [Online Help Support Provided (VH); Not Provided (L)].
7. International language support: This parameter tells us how the nature of the interna-tional language support of the software affects software Understand-ability. If software has sup-port for any other language but not English, understand-ability is low. If English is supported, Understand-ability is high and if more languages are supported, international language support is very high. This metric can be fuzzified in the range of L to VH as [Only English (VH); Any Other Language (L); English and Other Languages Together (VH)].
The understand-ability sub can be obtained by the weighted average of the above seven met-rics.
Learn-ability: The metrics describing learn-ability are: - 1. Percentage of observable properties: This parameter tells us how the percentage of ob-
servable properties affects learn-ability. The percentage of observable properties=Number of observable properties/Total number of
properties As the percentage of observable properties increases, learn-ability increases. This metric can
be fuzzified in the range of VL to VH as [< 0.3 (VL); 0.3 to 0.5 (L); 0.5 to 0.7 (M); 0.7 to 0.85 (H); > 0.85 (VH)].
2. Type of interface: This parameter tells us how the type of interface affects learn-ability. If graphic user interface is used, learn-ability is very high or else it is moderate. This metric can be fuzzified in the range of VL to VH as [CUI (M); GUI (VH)].
The learn-ability sub characteristic can be obtained by the weighted average of the above two metrics.
Operability: The metrics describing operability are as follows:- 1. Complexity of the functionalities: This parameter tells us how the complexity of the func-
tionalities of the software affects operability. If the functionalities are very complicated to oper-ate on, the operability is very low and vice versa. This metric can be fuzzified in the range of VL to VH as [Very Complicated (VL); Complicated (L); Average (M); Easy to Operate (H); Very Easy to Operate (VH)]. As the functionalities become easier to operate, the operability of the software increases.
2. Type of interface: This parameter tells us how the type of interface affects operability. If graphic user interface is used, operability is very high or else it is moderate. This metric can be fuzzified in the range of M to VH as [CUI (M); GUI (VH)].
3. Ease of use and navigability: This parameter tells us how the ease of use and navigability of the software affects operability. If the software is easy to use and navigate, the operability is very high and vice versa. This metric can be fuzzified in the range L to VH as [Easy and Com-
Jagat Sesh Challa, Arindam Paul, Yogesh Dada, Venkatesh Nerella, Praveen Ranjan Srivastava and Ajit Pratap Singh
501
fortable (VH); Average (H); Difficult (L)]. The operability sub characteristic can be obtained by the weighted average of the above three
metrics. Attractiveness: The metrics describing attractiveness are as follows:- 1. Usage of graphics to enhance attractiveness: This parameter tells us how the usage of
graphics affects attractiveness. If the software has a lot of graphic usage, attractiveness is very high and vice versa. This metric can be fuzzified in the range of L to VH as [Very Attractive with Graphics (VH); Suits the Purpose (H); Average (M); Not so Attractive (L)].
The attractiveness sub is simply obtained by the value of the above metric. There is no need for any weighted average as there is only one metric influencing the attractiveness sub character-istic.
Usability Compliance: The metrics describing usability compliance are as follows:- 1. Software adhering to usability compliance standards: This parameter tells us how the
adherence of the software to usability compliance standards affects usability compliance. This metric can be fuzzified in the range of L to VH as [Adheres to Compliance Standards (VH); Doesn’t Adhere to Standards (L)].
The usability compliance sub characteristic is simply obtained by the value of the above met-ric. There is no need for any weighted average as there is only one metric influencing the usabil-ity compliance sub characteristic.
Reusability: The metrics describing reusability are as follows:- 1. Percent of customizable properties: This parameter tells us how the percentage of cus-
tomizable properties affects reusability. The percentage of customizable properties=Number of customizable properties/Total number
of properties As the percentage of customizable properties increases, reusability increases. This metric can
be fuzzified in the range of VL to VH as [< 0.3 (VL); 0.3 to 0.5 (L); 0.5 to 0.7 (M); 0.7 to 0.85 (H); > 0.85 (VH)].
The reusability sub characteristic is simply obtained by the value of the above metric. There is no need forany weighted average as there is only one metric influencing the reusability sub characteristic.
After obtaining the values of all the sub characteristics under the usability characteristic, the value of usability characteristic can be calculated simply by taking the weighted average of all the sub characteristics that were calculated above.
r Usability= r 1× w 1 + r 2× w 2 + … r n× w n = ∑ r i × w i where i belong to the set {understand-ability, learn-ability, operability, attractiveness, usabil-
ity compliance, and re-usability} Similarly, by taking the weighted average of the characteristics - reliability and usability, the
user’s perspective quality can be obtained. r User’s = r Reliability× w Reliability+ r Usability× w Usability
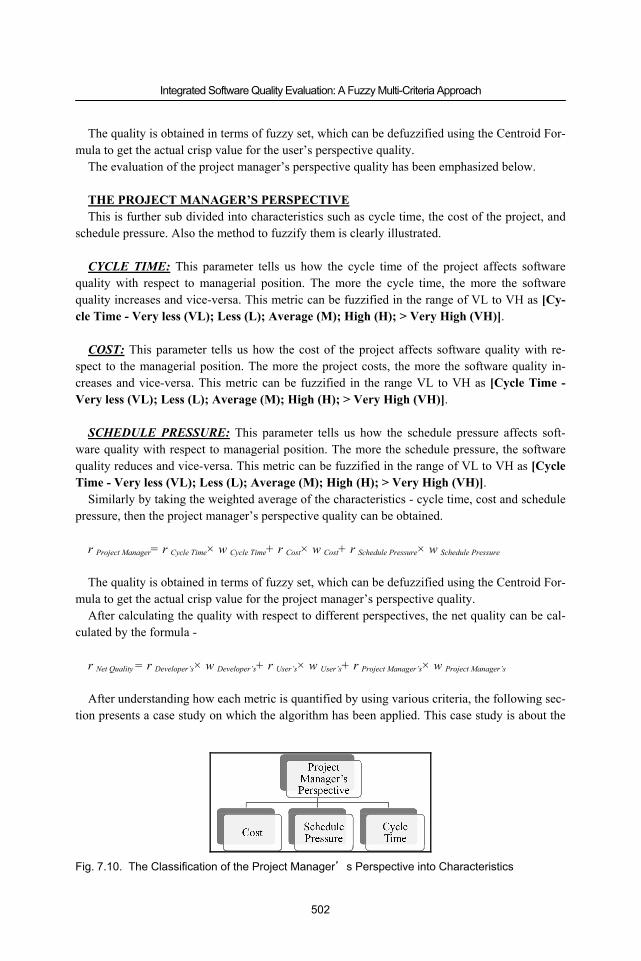
Integrated Software Quality Evaluation: A Fuzzy Multi-Criteria Approach
502
The quality is obtained in terms of fuzzy set, which can be defuzzified using the Centroid For-mula to get the actual crisp value for the user’s perspective quality.
The evaluation of the project manager’s perspective quality has been emphasized below. THE PROJECT MANAGER’S PERSPECTIVE This is further sub divided into characteristics such as cycle time, the cost of the project, and
schedule pressure. Also the method to fuzzify them is clearly illustrated. CYCLE TIME: This parameter tells us how the cycle time of the project affects software
quality with respect to managerial position. The more the cycle time, the more the software quality increases and vice-versa. This metric can be fuzzified in the range of VL to VH as [Cy-cle Time - Very less (VL); Less (L); Average (M); High (H); > Very High (VH)].
COST: This parameter tells us how the cost of the project affects software quality with re-
spect to the managerial position. The more the project costs, the more the software quality in-creases and vice-versa. This metric can be fuzzified in the range VL to VH as [Cycle Time - Very less (VL); Less (L); Average (M); High (H); > Very High (VH)].
SCHEDULE PRESSURE: This parameter tells us how the schedule pressure affects soft-
ware quality with respect to managerial position. The more the schedule pressure, the software quality reduces and vice-versa. This metric can be fuzzified in the range of VL to VH as [Cycle Time - Very less (VL); Less (L); Average (M); High (H); > Very High (VH)].
Similarly by taking the weighted average of the characteristics - cycle time, cost and schedule pressure, then the project manager’s perspective quality can be obtained.
r Project Manager= r Cycle Time× w Cycle Time+ r Cost× w Cost+ r Schedule Pressure× w Schedule Pressure The quality is obtained in terms of fuzzy set, which can be defuzzified using the Centroid For-
mula to get the actual crisp value for the project manager’s perspective quality. After calculating the quality with respect to different perspectives, the net quality can be cal-
culated by the formula - r Net Quality = r Developer’s× w Developer’s+ r User’s× w User’s+ r Project Manager’s× w Project Manager’s After understanding how each metric is quantified by using various criteria, the following sec-
tion presents a case study on which the algorithm has been applied. This case study is about the
Fig. 7.10. The Classification of the Project Manager’s Perspective into Characteristics
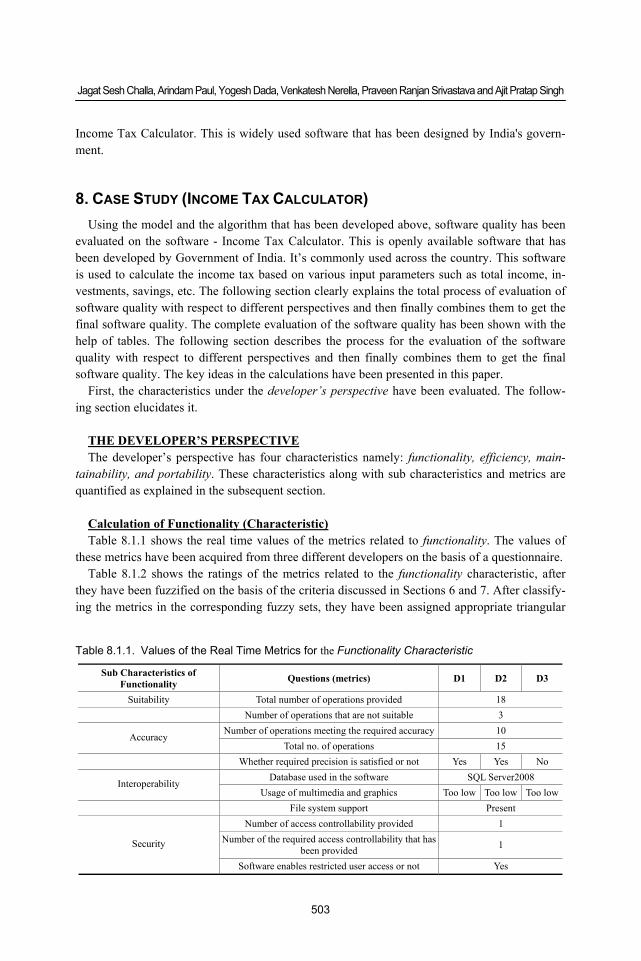
Jagat Sesh Challa, Arindam Paul, Yogesh Dada, Venkatesh Nerella, Praveen Ranjan Srivastava and Ajit Pratap Singh
503
Income Tax Calculator. This is widely used software that has been designed by India's govern-ment.
8. CASE STUDY (INCOME TAX CALCULATOR) Using the model and the algorithm that has been developed above, software quality has been
evaluated on the software - Income Tax Calculator. This is openly available software that has been developed by Government of India. It’s commonly used across the country. This software is used to calculate the income tax based on various input parameters such as total income, in-vestments, savings, etc. The following section clearly explains the total process of evaluation of software quality with respect to different perspectives and then finally combines them to get the final software quality. The complete evaluation of the software quality has been shown with the help of tables. The following section describes the process for the evaluation of the software quality with respect to different perspectives and then finally combines them to get the final software quality. The key ideas in the calculations have been presented in this paper.
First, the characteristics under the developer’s perspective have been evaluated. The follow-ing section elucidates it.
THE DEVELOPER’S PERSPECTIVE The developer’s perspective has four characteristics namely: functionality, efficiency, main-
tainability, and portability. These characteristics along with sub characteristics and metrics are quantified as explained in the subsequent section.
Calculation of Functionality (Characteristic) Table 8.1.1 shows the real time values of the metrics related to functionality. The values of
these metrics have been acquired from three different developers on the basis of a questionnaire. Table 8.1.2 shows the ratings of the metrics related to the functionality characteristic, after
they have been fuzzified on the basis of the criteria discussed in Sections 6 and 7. After classify-ing the metrics in the corresponding fuzzy sets, they have been assigned appropriate triangular
Table 8.1.1. Values of the Real Time Metrics for the Functionality Characteristic
Sub Characteristics of Functionality Questions (metrics) D1 D2 D3
Suitability Total number of operations provided 18 Number of operations that are not suitable 3
Number of operations meeting the required accuracy 10 Accuracy
Total no. of operations 15 Whether required precision is satisfied or not Yes Yes No
Database used in the software SQL Server2008 Interoperability
Usage of multimedia and graphics Too low Too low Too low File system support Present
Number of access controllability provided 1 Number of the required access controllability that has
been provided 1 Security
Software enables restricted user access or not Yes
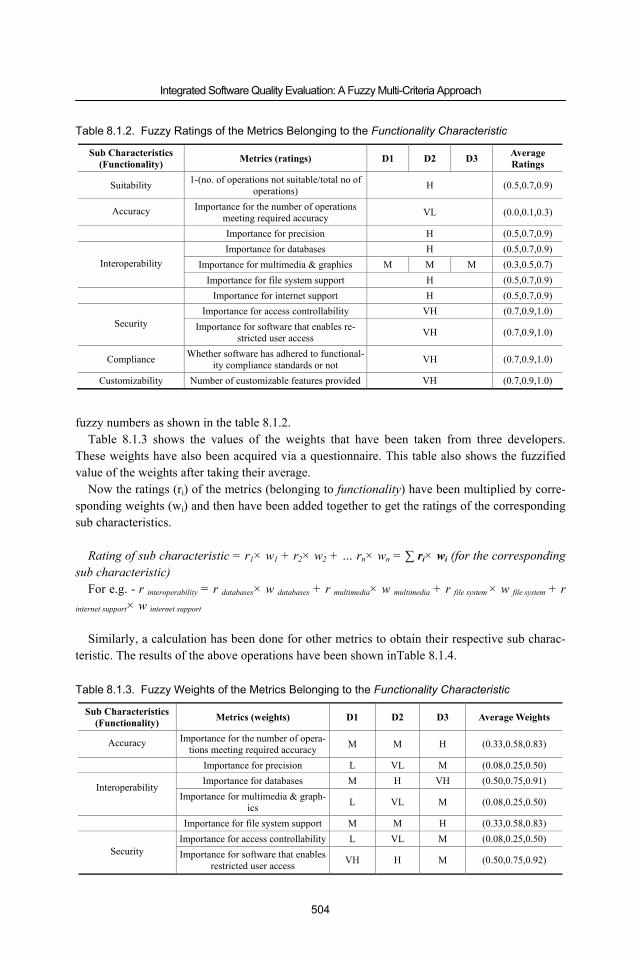
Integrated Software Quality Evaluation: A Fuzzy Multi-Criteria Approach
504
fuzzy numbers as shown in the table 8.1.2. Table 8.1.3 shows the values of the weights that have been taken from three developers.
These weights have also been acquired via a questionnaire. This table also shows the fuzzified value of the weights after taking their average.
Now the ratings (ri) of the metrics (belonging to functionality) have been multiplied by corre-sponding weights (wi) and then have been added together to get the ratings of the corresponding sub characteristics.
Rating of sub characteristic = r1× w1 + r2× w2 + … rn× wn = ∑ ri× wi (for the corresponding
sub characteristic) For e.g. - r interoperability = r databases× w databases + r multimedia× w multimedia + r file system × w file system + r
internet support× w internet support Similarly, a calculation has been done for other metrics to obtain their respective sub charac-
teristic. The results of the above operations have been shown inTable 8.1.4.
Table 8.1.2. Fuzzy Ratings of the Metrics Belonging to the Functionality Characteristic
Sub Characteristics (Functionality) Metrics (ratings) D1 D2 D3 Average
Ratings
Suitability 1-(no. of operations not suitable/total no of operations) H (0.5,0.7,0.9)
Accuracy Importance for the number of operations meeting required accuracy VL (0.0,0.1,0.3)
Importance for precision H (0.5,0.7,0.9) Importance for databases H (0.5,0.7,0.9)
Importance for multimedia & graphics M M M (0.3,0.5,0.7) Interoperability
Importance for file system support H (0.5,0.7,0.9) Importance for internet support H (0.5,0.7,0.9)
Importance for access controllability VH (0.7,0.9,1.0) Security Importance for software that enables re-
stricted user access VH (0.7,0.9,1.0)
Compliance Whether software has adhered to functional-ity compliance standards or not VH (0.7,0.9,1.0)
Customizability Number of customizable features provided VH (0.7,0.9,1.0)
Table 8.1.3. Fuzzy Weights of the Metrics Belonging to the Functionality Characteristic
Sub Characteristics (Functionality) Metrics (weights) D1 D2 D3 Average Weights
Accuracy Importance for the number of opera-tions meeting required accuracy M M H (0.33,0.58,0.83)
Importance for precision L VL M (0.08,0.25,0.50) Importance for databases M H VH (0.50,0.75,0.91)
Interoperability Importance for multimedia & graph-
ics L VL M (0.08,0.25,0.50)
Importance for file system support M M H (0.33,0.58,0.83) Importance for access controllability L VL M (0.08,0.25,0.50)
Security Importance for software that enables restricted user access VH H M (0.50,0.75,0.92)
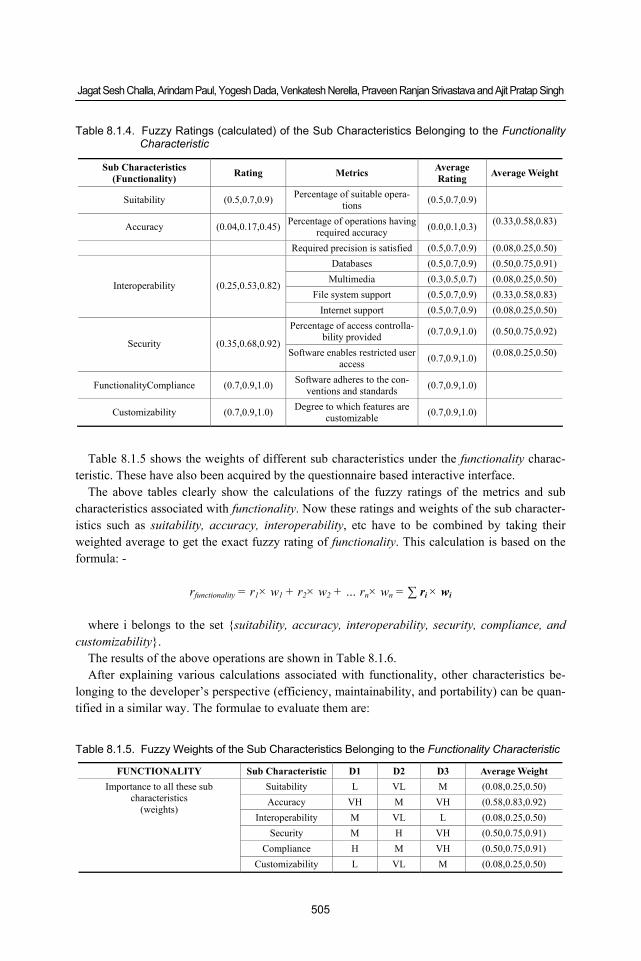
Jagat Sesh Challa, Arindam Paul, Yogesh Dada, Venkatesh Nerella, Praveen Ranjan Srivastava and Ajit Pratap Singh
505
Table 8.1.5 shows the weights of different sub characteristics under the functionality charac-teristic. These have also been acquired by the questionnaire based interactive interface.
The above tables clearly show the calculations of the fuzzy ratings of the metrics and sub characteristics associated with functionality. Now these ratings and weights of the sub character-istics such as suitability, accuracy, interoperability, etc have to be combined by taking their weighted average to get the exact fuzzy rating of functionality. This calculation is based on the formula: -
rfunctionality = r1× w1 + r2× w2 + … rn× wn = ∑ ri × wi
where i belongs to the set {suitability, accuracy, interoperability, security, compliance, and
customizability}. The results of the above operations are shown in Table 8.1.6. After explaining various calculations associated with functionality, other characteristics be-
longing to the developer’s perspective (efficiency, maintainability, and portability) can be quan-tified in a similar way. The formulae to evaluate them are:
Table 8.1.4. Fuzzy Ratings (calculated) of the Sub Characteristics Belonging to the Functionality Characteristic
Sub Characteristics (Functionality) Rating Metrics Average
Rating Average Weight
Suitability (0.5,0.7,0.9) Percentage of suitable opera-tions (0.5,0.7,0.9)
Accuracy (0.04,0.17,0.45) Percentage of operations having required accuracy (0.0,0.1,0.3) (0.33,0.58,0.83)
Required precision is satisfied (0.5,0.7,0.9) (0.08,0.25,0.50) Databases (0.5,0.7,0.9) (0.50,0.75,0.91)
Multimedia (0.3,0.5,0.7) (0.08,0.25,0.50) File system support (0.5,0.7,0.9) (0.33,0.58,0.83)
Interoperability (0.25,0.53,0.82)
Internet support (0.5,0.7,0.9) (0.08,0.25,0.50) Percentage of access controlla-
bility provided (0.7,0.9,1.0) (0.50,0.75,0.92) Security (0.35,0.68,0.92)
Software enables restricted user access (0.7,0.9,1.0) (0.08,0.25,0.50)
FunctionalityCompliance (0.7,0.9,1.0) Software adheres to the con-ventions and standards (0.7,0.9,1.0)
Customizability (0.7,0.9,1.0) Degree to which features are customizable (0.7,0.9,1.0)
Table 8.1.5. Fuzzy Weights of the Sub Characteristics Belonging to the Functionality Characteristic
FUNCTIONALITY Sub Characteristic D1 D2 D3 Average Weight Suitability L VL M (0.08,0.25,0.50) Accuracy VH M VH (0.58,0.83,0.92)
Interoperability M VL L (0.08,0.25,0.50) Security M H VH (0.50,0.75,0.91)
Compliance H M VH (0.50,0.75,0.91)
Importance to all these sub characteristics
(weights)
Customizability L VL M (0.08,0.25,0.50)
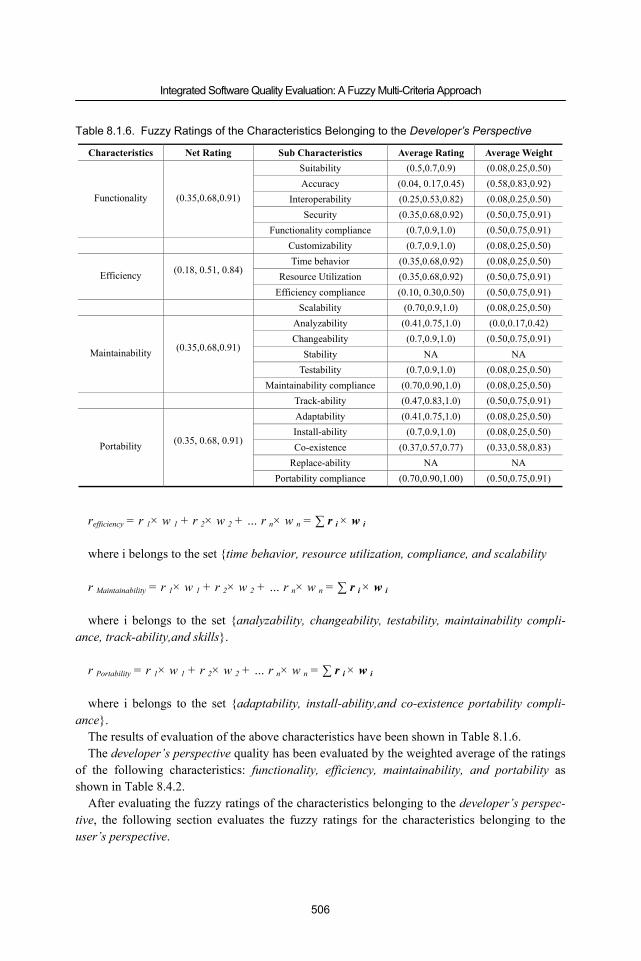
Integrated Software Quality Evaluation: A Fuzzy Multi-Criteria Approach
506
refficiency = r 1× w 1 + r 2× w 2 + … r n× w n = ∑ r i × w i where i belongs to the set {time behavior, resource utilization, compliance, and scalability r Maintainability = r 1× w 1 + r 2× w 2 + … r n× w n = ∑ r i × w i where i belongs to the set {analyzability, changeability, testability, maintainability compli-
ance, track-ability,and skills}. r Portability = r 1× w 1 + r 2× w 2 + … r n× w n = ∑ r i × w i where i belongs to the set {adaptability, install-ability,and co-existence portability compli-
ance}. The results of evaluation of the above characteristics have been shown in Table 8.1.6. The developer’s perspective quality has been evaluated by the weighted average of the ratings
of the following characteristics: functionality, efficiency, maintainability, and portability as shown in Table 8.4.2.
After evaluating the fuzzy ratings of the characteristics belonging to the developer’s perspec-tive, the following section evaluates the fuzzy ratings for the characteristics belonging to the user’s perspective.
Table 8.1.6. Fuzzy Ratings of the Characteristics Belonging to the Developer’s Perspective
Characteristics Net Rating Sub Characteristics Average Rating Average Weight Suitability (0.5,0.7,0.9) (0.08,0.25,0.50) Accuracy (0.04, 0.17,0.45) (0.58,0.83,0.92)
Interoperability (0.25,0.53,0.82) (0.08,0.25,0.50) Security (0.35,0.68,0.92) (0.50,0.75,0.91)
Functionality (0.35,0.68,0.91)
Functionality compliance (0.7,0.9,1.0) (0.50,0.75,0.91) Customizability (0.7,0.9,1.0) (0.08,0.25,0.50)
Time behavior (0.35,0.68,0.92) (0.08,0.25,0.50) Resource Utilization (0.35,0.68,0.92) (0.50,0.75,0.91) Efficiency (0.18, 0.51, 0.84)
Efficiency compliance (0.10, 0.30,0.50) (0.50,0.75,0.91)
Scalability (0.70,0.9,1.0) (0.08,0.25,0.50) Analyzability (0.41,0.75,1.0) (0.0,0.17,0.42) Changeability (0.7,0.9,1.0) (0.50,0.75,0.91)
Stability NA NA Testability (0.7,0.9,1.0) (0.08,0.25,0.50)
Maintainability (0.35,0.68,0.91)
Maintainability compliance (0.70,0.90,1.0) (0.08,0.25,0.50) Track-ability (0.47,0.83,1.0) (0.50,0.75,0.91)
Adaptability (0.41,0.75,1.0) (0.08,0.25,0.50) Install-ability (0.7,0.9,1.0) (0.08,0.25,0.50) Co-existence (0.37,0.57,0.77) (0.33,0.58,0.83)
Replace-ability NA NA
Portability (0.35, 0.68, 0.91)
Portability compliance (0.70,0.90,1.00) (0.50,0.75,0.91)
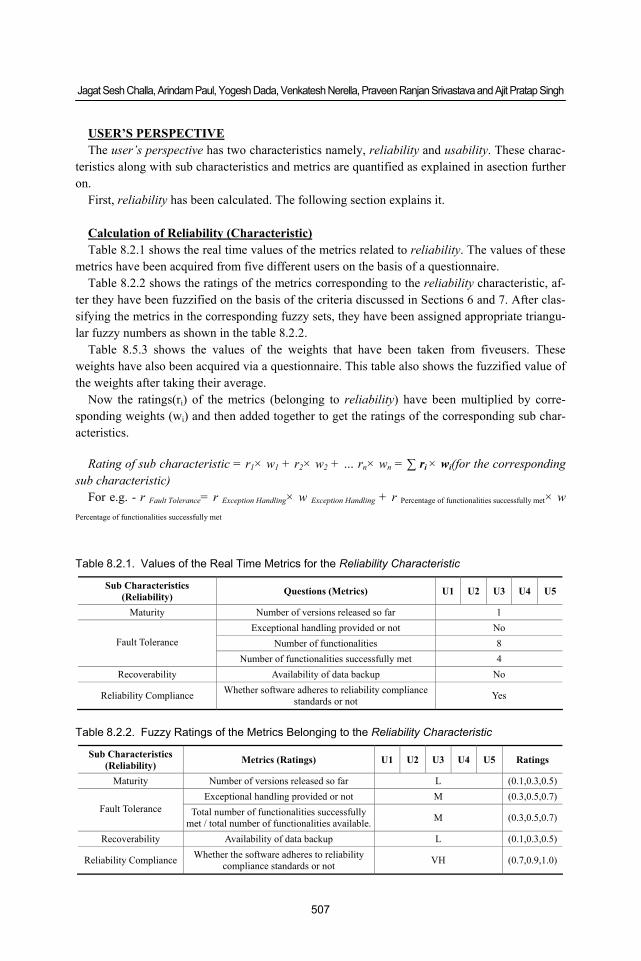
Jagat Sesh Challa, Arindam Paul, Yogesh Dada, Venkatesh Nerella, Praveen Ranjan Srivastava and Ajit Pratap Singh
507
USER’S PERSPECTIVE The user’s perspective has two characteristics namely, reliability and usability. These charac-
teristics along with sub characteristics and metrics are quantified as explained in asection further on.
First, reliability has been calculated. The following section explains it. Calculation of Reliability (Characteristic) Table 8.2.1 shows the real time values of the metrics related to reliability. The values of these
metrics have been acquired from five different users on the basis of a questionnaire. Table 8.2.2 shows the ratings of the metrics corresponding to the reliability characteristic, af-
ter they have been fuzzified on the basis of the criteria discussed in Sections 6 and 7. After clas-sifying the metrics in the corresponding fuzzy sets, they have been assigned appropriate triangu-lar fuzzy numbers as shown in the table 8.2.2.
Table 8.5.3 shows the values of the weights that have been taken from fiveusers. These weights have also been acquired via a questionnaire. This table also shows the fuzzified value of the weights after taking their average.
Now the ratings(ri) of the metrics (belonging to reliability) have been multiplied by corre-sponding weights (wi) and then added together to get the ratings of the corresponding sub char-acteristics.
Rating of sub characteristic = r1× w1 + r2× w2 + … rn× wn = ∑ ri × wi(for the corresponding
sub characteristic) For e.g. - r Fault Tolerance= r Exception Handling× w Exception Handling + r Percentage of functionalities successfully met× w
Percentage of functionalities successfully met
Table 8.2.1. Values of the Real Time Metrics for the Reliability Characteristic
Sub Characteristics (Reliability) Questions (Metrics) U1 U2 U3 U4 U5
Maturity Number of versions released so far 1 Exceptional handling provided or not No
Number of functionalities 8 Fault Tolerance
Number of functionalities successfully met 4 Recoverability Availability of data backup No
Reliability Compliance Whether software adheres to reliability compliance standards or not Yes
Table 8.2.2. Fuzzy Ratings of the Metrics Belonging to the Reliability Characteristic
Sub Characteristics (Reliability) Metrics (Ratings) U1 U2 U3 U4 U5 Ratings
Maturity Number of versions released so far L (0.1,0.3,0.5) Exceptional handling provided or not M (0.3,0.5,0.7)
Fault Tolerance Total number of functionalities successfully met / total number of functionalities available. M (0.3,0.5,0.7)
Recoverability Availability of data backup L (0.1,0.3,0.5)
Reliability Compliance Whether the software adheres to reliability compliance standards or not VH (0.7,0.9,1.0)
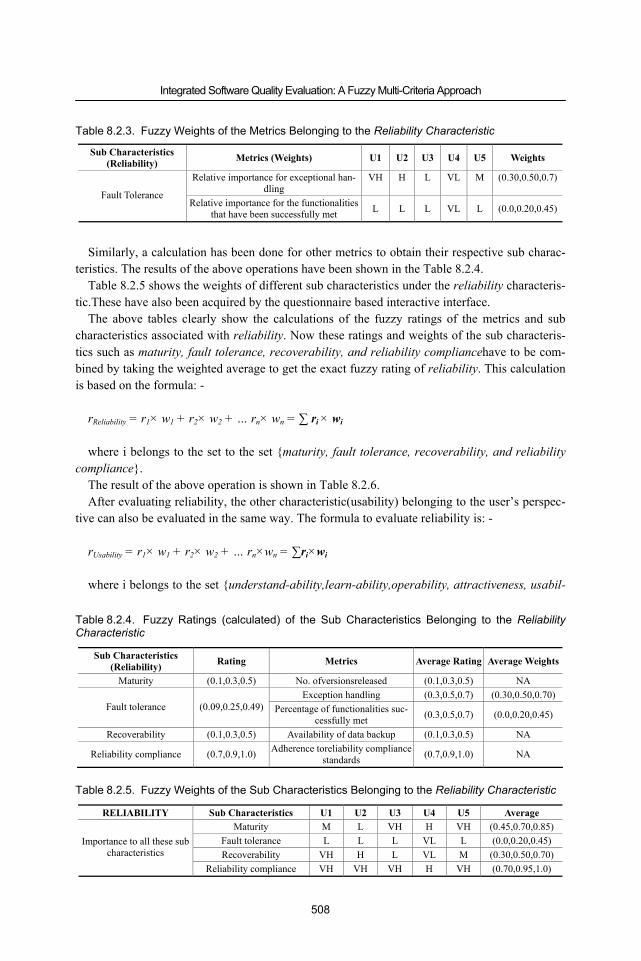
Integrated Software Quality Evaluation: A Fuzzy Multi-Criteria Approach
508
Similarly, a calculation has been done for other metrics to obtain their respective sub charac-teristics. The results of the above operations have been shown in the Table 8.2.4.
Table 8.2.5 shows the weights of different sub characteristics under the reliability characteris-tic.These have also been acquired by the questionnaire based interactive interface.
The above tables clearly show the calculations of the fuzzy ratings of the metrics and sub characteristics associated with reliability. Now these ratings and weights of the sub characteris-tics such as maturity, fault tolerance, recoverability, and reliability compliancehave to be com-bined by taking the weighted average to get the exact fuzzy rating of reliability. This calculation is based on the formula: -
rReliability = r1× w1 + r2× w2 + … rn× wn = ∑ ri × wi where i belongs to the set to the set {maturity, fault tolerance, recoverability, and reliability
compliance}. The result of the above operation is shown in Table 8.2.6. After evaluating reliability, the other characteristic(usability) belonging to the user’s perspec-
tive can also be evaluated in the same way. The formula to evaluate reliability is: - rUsability = r1× w1 + r2× w2 + … rn×wn = ∑ri×wi where i belongs to the set {understand-ability,learn-ability,operability, attractiveness, usabil-
Table 8.2.3. Fuzzy Weights of the Metrics Belonging to the Reliability Characteristic
Sub Characteristics (Reliability) Metrics (Weights) U1 U2 U3 U4 U5 Weights
Relative importance for exceptional han-dling
VH H L VL M (0.30,0.50,0.7)
Fault Tolerance Relative importance for the functionalities
that have been successfully met L L L VL L (0.0,0.20,0.45)
Table 8.2.4. Fuzzy Ratings (calculated) of the Sub Characteristics Belonging to the Reliability Characteristic
Sub Characteristics (Reliability) Rating Metrics Average Rating Average Weights
Maturity (0.1,0.3,0.5) No. ofversionsreleased (0.1,0.3,0.5) NA Exception handling (0.3,0.5,0.7) (0.30,0.50,0.70)
Fault tolerance (0.09,0.25,0.49) Percentage of functionalities suc-cessfully met (0.3,0.5,0.7) (0.0,0.20,0.45)
Recoverability (0.1,0.3,0.5) Availability of data backup (0.1,0.3,0.5) NA
Reliability compliance (0.7,0.9,1.0) Adherence toreliability compliance standards (0.7,0.9,1.0) NA
Table 8.2.5. Fuzzy Weights of the Sub Characteristics Belonging to the Reliability Characteristic
RELIABILITY Sub Characteristics U1 U2 U3 U4 U5 Average Maturity M L VH H VH (0.45,0.70,0.85)
Fault tolerance L L L VL L (0.0,0.20,0.45) Recoverability VH H L VL M (0.30,0.50,0.70)
Importance to all these sub characteristics
Reliability compliance VH VH VH H VH (0.70,0.95,1.0)
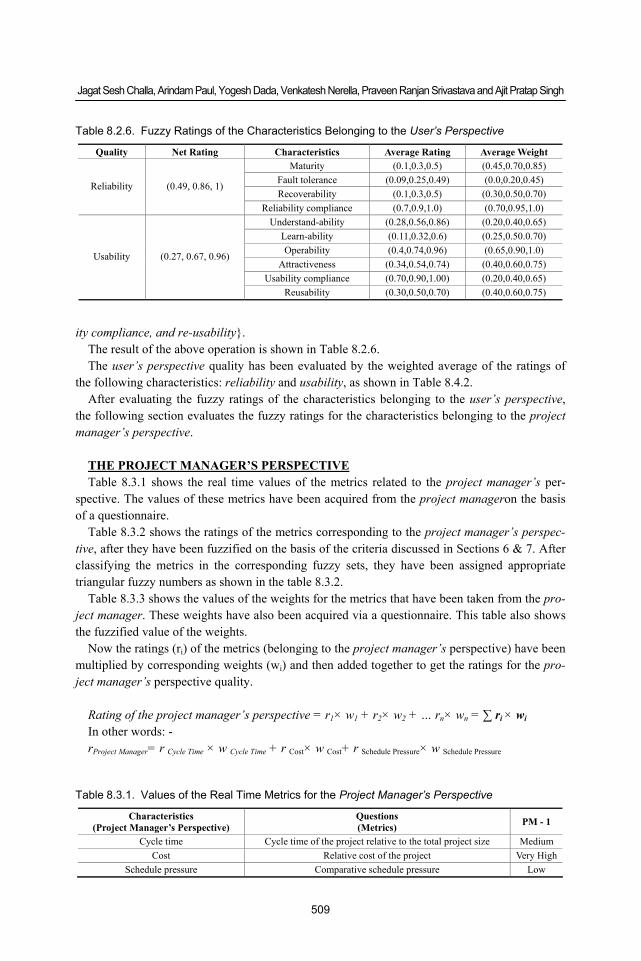
Jagat Sesh Challa, Arindam Paul, Yogesh Dada, Venkatesh Nerella, Praveen Ranjan Srivastava and Ajit Pratap Singh
509
ity compliance, and re-usability}. The result of the above operation is shown in Table 8.2.6. The user’s perspective quality has been evaluated by the weighted average of the ratings of
the following characteristics: reliability and usability, as shown in Table 8.4.2. After evaluating the fuzzy ratings of the characteristics belonging to the user’s perspective,
the following section evaluates the fuzzy ratings for the characteristics belonging to the project manager’s perspective.
THE PROJECT MANAGER’S PERSPECTIVE Table 8.3.1 shows the real time values of the metrics related to the project manager’s per-
spective. The values of these metrics have been acquired from the project manageron the basis of a questionnaire.
Table 8.3.2 shows the ratings of the metrics corresponding to the project manager’s perspec-tive, after they have been fuzzified on the basis of the criteria discussed in Sections 6 & 7. After classifying the metrics in the corresponding fuzzy sets, they have been assigned appropriate triangular fuzzy numbers as shown in the table 8.3.2.
Table 8.3.3 shows the values of the weights for the metrics that have been taken from the pro-ject manager. These weights have also been acquired via a questionnaire. This table also shows the fuzzified value of the weights.
Now the ratings (ri) of the metrics (belonging to the project manager’s perspective) have been multiplied by corresponding weights (wi) and then added together to get the ratings for the pro-ject manager’s perspective quality.
Rating of the project manager’s perspective = r1× w1 + r2× w2 + … rn× wn = ∑ ri × wi In other words: - rProject Manager= r Cycle Time × w Cycle Time + r Cost× w Cost+ r Schedule Pressure× w Schedule Pressure
Table 8.3.1. Values of the Real Time Metrics for the Project Manager’s Perspective
Characteristics (Project Manager’s Perspective)
Questions (Metrics) PM - 1
Cycle time Cycle time of the project relative to the total project size Medium Cost Relative cost of the project Very High
Schedule pressure Comparative schedule pressure Low
Table 8.2.6. Fuzzy Ratings of the Characteristics Belonging to the User’s Perspective
Quality Net Rating Characteristics Average Rating Average Weight Maturity (0.1,0.3,0.5) (0.45,0.70,0.85)
Fault tolerance (0.09,0.25,0.49) (0.0,0.20,0.45) Recoverability (0.1,0.3,0.5) (0.30,0.50,0.70)
Reliability (0.49, 0.86, 1)
Reliability compliance (0.7,0.9,1.0) (0.70,0.95,1.0) Understand-ability (0.28,0.56,0.86) (0.20,0.40,0.65)
Learn-ability (0.11,0.32,0.6) (0.25,0.50.0.70) Operability (0.4,0.74,0.96) (0.65,0.90,1.0)
Attractiveness (0.34,0.54,0.74) (0.40,0.60,0.75) Usability compliance (0.70,0.90,1.00) (0.20,0.40,0.65)
Usability (0.27, 0.67, 0.96)
Reusability (0.30,0.50,0.70) (0.40,0.60,0.75)
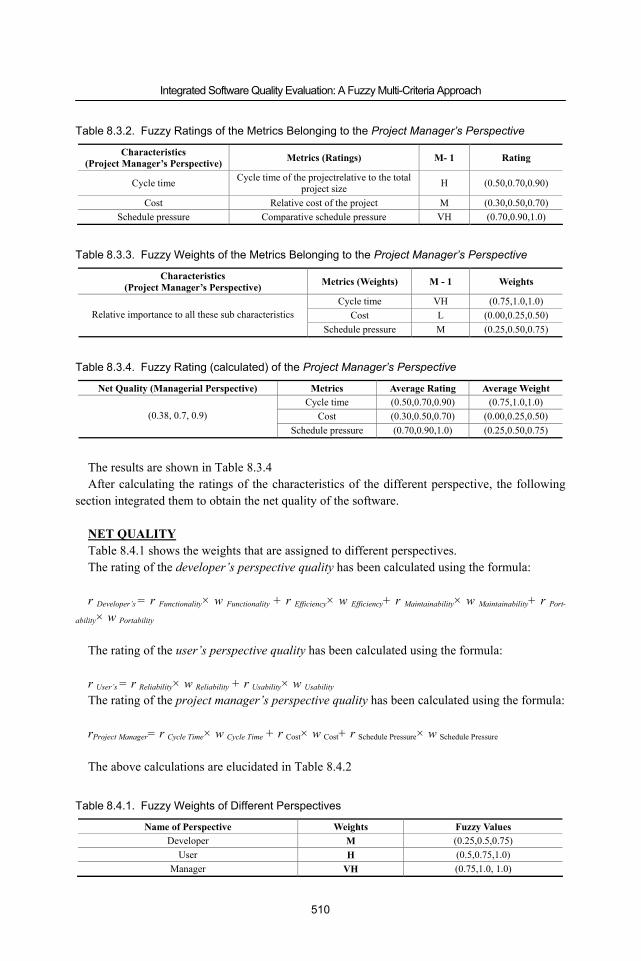
Integrated Software Quality Evaluation: A Fuzzy Multi-Criteria Approach
510
The results are shown in Table 8.3.4 After calculating the ratings of the characteristics of the different perspective, the following
section integrated them to obtain the net quality of the software. NET QUALITY Table 8.4.1 shows the weights that are assigned to different perspectives. The rating of the developer’s perspective quality has been calculated using the formula: r Developer’s = r Functionality× w Functionality + r Efficiency× w Efficiency+ r Maintainability× w Maintainability+ r Port-
ability× w Portability
The rating of the user’s perspective quality has been calculated using the formula: r User’s = r Reliability× w Reliability + r Usability× w Usability
The rating of the project manager’s perspective quality has been calculated using the formula: rProject Manager= r Cycle Time× w Cycle Time + r Cost× w Cost+ r Schedule Pressure× w Schedule Pressure The above calculations are elucidated in Table 8.4.2
Table 8.3.2. Fuzzy Ratings of the Metrics Belonging to the Project Manager’s Perspective
Characteristics (Project Manager’s Perspective) Metrics (Ratings) M- 1 Rating
Cycle time Cycle time of the projectrelative to the total project size H (0.50,0.70,0.90)
Cost Relative cost of the project M (0.30,0.50,0.70) Schedule pressure Comparative schedule pressure VH (0.70,0.90,1.0)
Table 8.3.3. Fuzzy Weights of the Metrics Belonging to the Project Manager’s Perspective
Characteristics (Project Manager’s Perspective) Metrics (Weights) M - 1 Weights
Cycle time VH (0.75,1.0,1.0) Cost L (0.00,0.25,0.50) Relative importance to all these sub characteristics
Schedule pressure M (0.25,0.50,0.75)
Table 8.3.4. Fuzzy Rating (calculated) of the Project Manager’s Perspective
Net Quality (Managerial Perspective) Metrics Average Rating Average Weight Cycle time (0.50,0.70,0.90) (0.75,1.0,1.0)
Cost (0.30,0.50,0.70) (0.00,0.25,0.50) (0.38, 0.7, 0.9) Schedule pressure (0.70,0.90,1.0) (0.25,0.50,0.75)
Table 8.4.1. Fuzzy Weights of Different Perspectives
Name of Perspective Weights Fuzzy Values Developer M (0.25,0.5,0.75)
User H (0.5,0.75,1.0) Manager VH (0.75,1.0, 1.0)
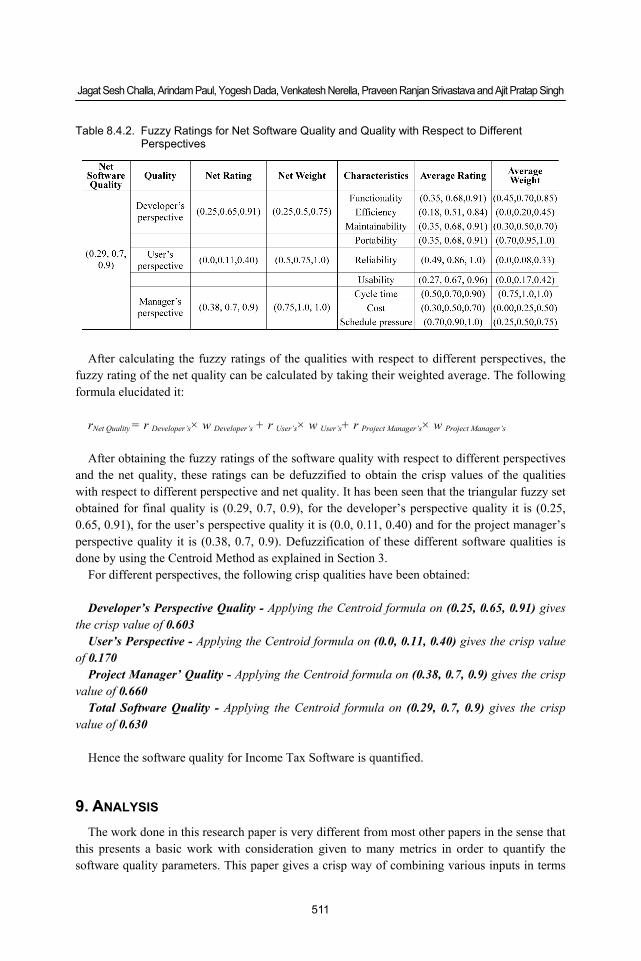
Jagat Sesh Challa, Arindam Paul, Yogesh Dada, Venkatesh Nerella, Praveen Ranjan Srivastava and Ajit Pratap Singh
511
After calculating the fuzzy ratings of the qualities with respect to different perspectives, the fuzzy rating of the net quality can be calculated by taking their weighted average. The following formula elucidated it:
rNet Quality = r Developer’s× w Developer’s + r User’s× w User’s+ r Project Manager’s× w Project Manager’s After obtaining the fuzzy ratings of the software quality with respect to different perspectives
and the net quality, these ratings can be defuzzified to obtain the crisp values of the qualities with respect to different perspective and net quality. It has been seen that the triangular fuzzy set obtained for final quality is (0.29, 0.7, 0.9), for the developer’s perspective quality it is (0.25, 0.65, 0.91), for the user’s perspective quality it is (0.0, 0.11, 0.40) and for the project manager’s perspective quality it is (0.38, 0.7, 0.9). Defuzzification of these different software qualities is done by using the Centroid Method as explained in Section 3.
For different perspectives, the following crisp qualities have been obtained: Developer’s Perspective Quality - Applying the Centroid formula on (0.25, 0.65, 0.91) gives
the crisp value of 0.603 User’s Perspective - Applying the Centroid formula on (0.0, 0.11, 0.40) gives the crisp value
of 0.170 Project Manager’ Quality - Applying the Centroid formula on (0.38, 0.7, 0.9) gives the crisp
value of 0.660 Total Software Quality - Applying the Centroid formula on (0.29, 0.7, 0.9) gives the crisp
value of 0.630 Hence the software quality for Income Tax Software is quantified.
9. ANALYSIS The work done in this research paper is very different from most other papers in the sense that
this presents a basic work with consideration given to many metrics in order to quantify the software quality parameters. This paper gives a crisp way of combining various inputs in terms
Table 8.4.2. Fuzzy Ratings for Net Software Quality and Quality with Respect to Different Perspectives
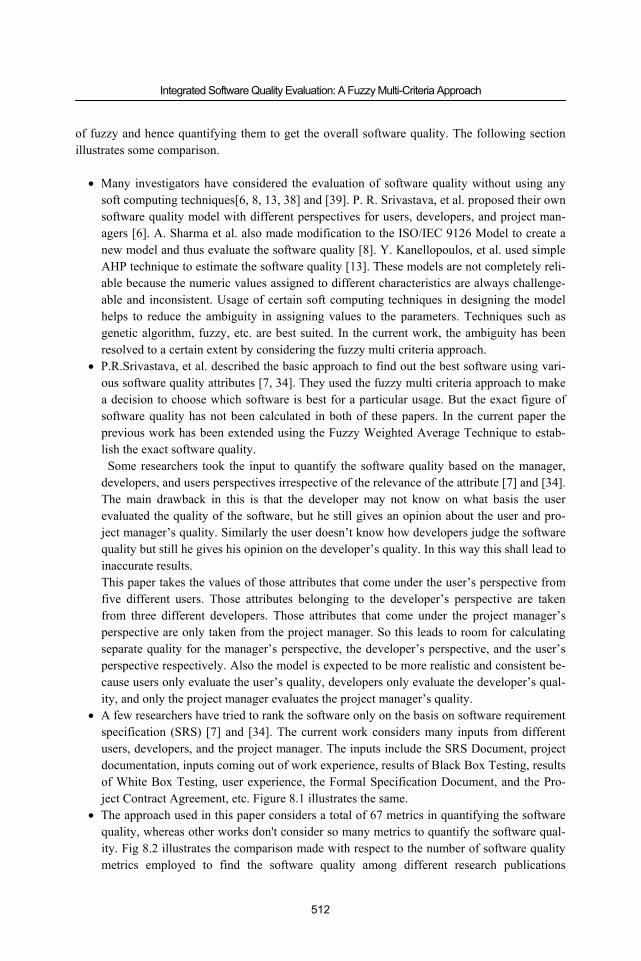
Integrated Software Quality Evaluation: A Fuzzy Multi-Criteria Approach
512
of fuzzy and hence quantifying them to get the overall software quality. The following section illustrates some comparison.
• Many investigators have considered the evaluation of software quality without using any
soft computing techniques[6, 8, 13, 38] and [39]. P. R. Srivastava, et al. proposed their own software quality model with different perspectives for users, developers, and project man-agers [6]. A. Sharma et al. also made modification to the ISO/IEC 9126 Model to create a new model and thus evaluate the software quality [8]. Y. Kanellopoulos, et al. used simple AHP technique to estimate the software quality [13]. These models are not completely reli-able because the numeric values assigned to different characteristics are always challenge-able and inconsistent. Usage of certain soft computing techniques in designing the model helps to reduce the ambiguity in assigning values to the parameters. Techniques such as genetic algorithm, fuzzy, etc. are best suited. In the current work, the ambiguity has been resolved to a certain extent by considering the fuzzy multi criteria approach.
• P.R.Srivastava, et al. described the basic approach to find out the best software using vari-ous software quality attributes [7, 34]. They used the fuzzy multi criteria approach to make a decision to choose which software is best for a particular usage. But the exact figure of software quality has not been calculated in both of these papers. In the current paper the previous work has been extended using the Fuzzy Weighted Average Technique to estab-lish the exact software quality.
Some researchers took the input to quantify the software quality based on the manager, developers, and users perspectives irrespective of the relevance of the attribute [7] and [34]. The main drawback in this is that the developer may not know on what basis the user evaluated the quality of the software, but he still gives an opinion about the user and pro-ject manager’s quality. Similarly the user doesn’t know how developers judge the software quality but still he gives his opinion on the developer’s quality. In this way this shall lead to inaccurate results. This paper takes the values of those attributes that come under the user’s perspective from five different users. Those attributes belonging to the developer’s perspective are taken from three different developers. Those attributes that come under the project manager’s perspective are only taken from the project manager. So this leads to room for calculating separate quality for the manager’s perspective, the developer’s perspective, and the user’s perspective respectively. Also the model is expected to be more realistic and consistent be-cause users only evaluate the user’s quality, developers only evaluate the developer’s qual-ity, and only the project manager evaluates the project manager’s quality.
• A few researchers have tried to rank the software only on the basis on software requirement specification (SRS) [7] and [34]. The current work considers many inputs from different users, developers, and the project manager. The inputs include the SRS Document, project documentation, inputs coming out of work experience, results of Black Box Testing, results of White Box Testing, user experience, the Formal Specification Document, and the Pro-ject Contract Agreement, etc. Figure 8.1 illustrates the same.
• The approach used in this paper considers a total of 67 metrics in quantifying the software quality, whereas other works don't consider so many metrics to quantify the software qual-ity. Fig 8.2 illustrates the comparison made with respect to the number of software quality metrics employed to find the software quality among different research publications
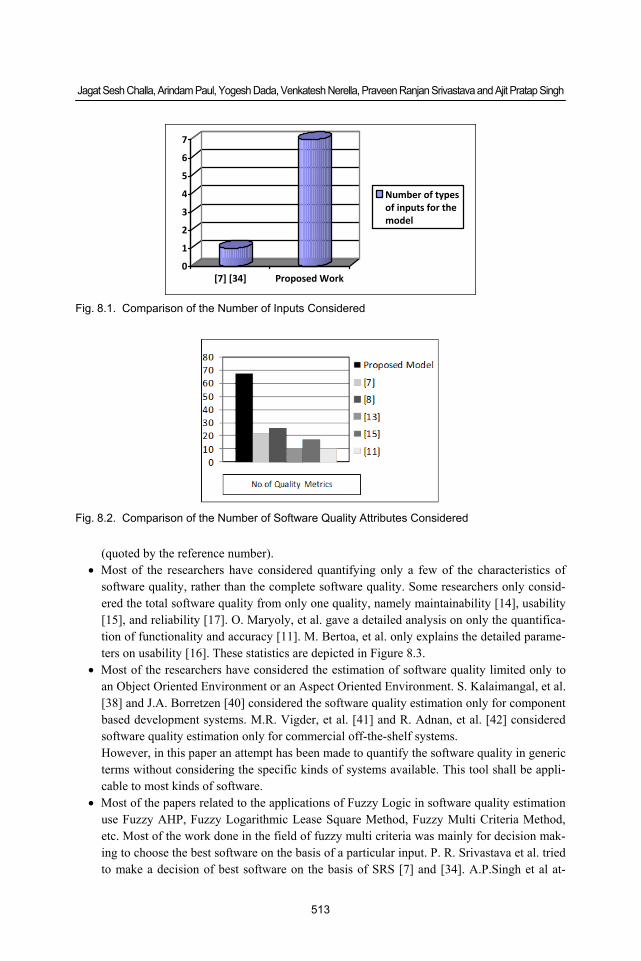
Jagat Sesh Challa, Arindam Paul, Yogesh Dada, Venkatesh Nerella, Praveen Ranjan Srivastava and Ajit Pratap Singh
513
(quoted by the reference number). • Most of the researchers have considered quantifying only a few of the characteristics of
software quality, rather than the complete software quality. Some researchers only consid-ered the total software quality from only one quality, namely maintainability [14], usability [15], and reliability [17]. O. Maryoly, et al. gave a detailed analysis on only the quantifica-tion of functionality and accuracy [11]. M. Bertoa, et al. only explains the detailed parame-ters on usability [16]. These statistics are depicted in Figure 8.3.
• Most of the researchers have considered the estimation of software quality limited only to an Object Oriented Environment or an Aspect Oriented Environment. S. Kalaimangal, et al. [38] and J.A. Borretzen [40] considered the software quality estimation only for component based development systems. M.R. Vigder, et al. [41] and R. Adnan, et al. [42] considered software quality estimation only for commercial off-the-shelf systems. However, in this paper an attempt has been made to quantify the software quality in generic terms without considering the specific kinds of systems available. This tool shall be appli-cable to most kinds of software.
• Most of the papers related to the applications of Fuzzy Logic in software quality estimation use Fuzzy AHP, Fuzzy Logarithmic Lease Square Method, Fuzzy Multi Criteria Method, etc. Most of the work done in the field of fuzzy multi criteria was mainly for decision mak-ing to choose the best software on the basis of a particular input. P. R. Srivastava et al. tried to make a decision of best software on the basis of SRS [7] and [34]. A.P.Singh et al at-
0
1
2
3
4
5
6
7
[7] [34] Proposed Work
Number of typesof inputs for themodel
Fig. 8.1. Comparison of the Number of Inputs Considered
Fig. 8.2. Comparison of the Number of Software Quality Attributes Considered
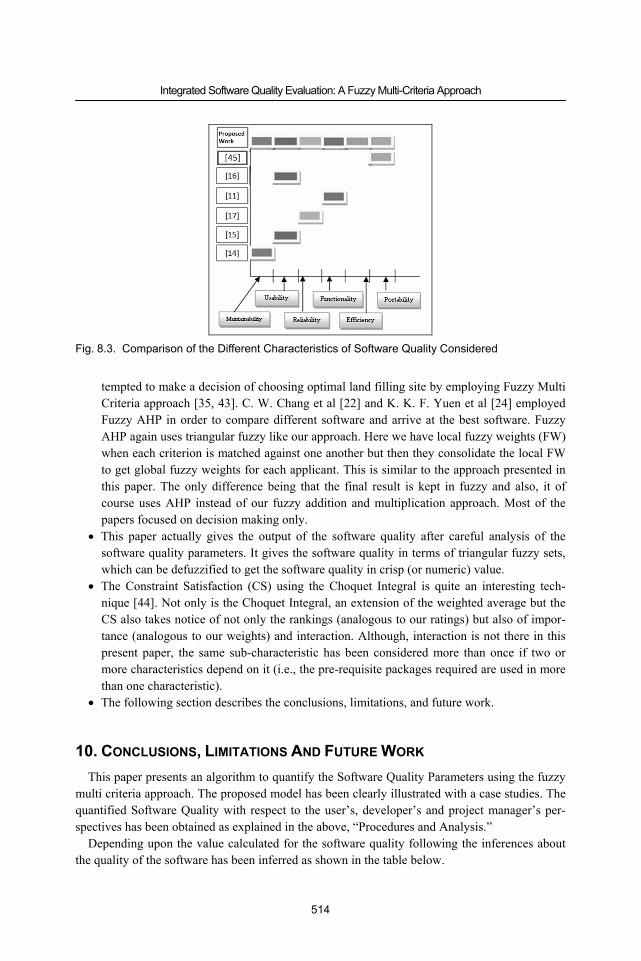
Integrated Software Quality Evaluation: A Fuzzy Multi-Criteria Approach
514
tempted to make a decision of choosing optimal land filling site by employing Fuzzy Multi Criteria approach [35, 43]. C. W. Chang et al [22] and K. K. F. Yuen et al [24] employed Fuzzy AHP in order to compare different software and arrive at the best software. Fuzzy AHP again uses triangular fuzzy like our approach. Here we have local fuzzy weights (FW) when each criterion is matched against one another but then they consolidate the local FW to get global fuzzy weights for each applicant. This is similar to the approach presented in this paper. The only difference being that the final result is kept in fuzzy and also, it of course uses AHP instead of our fuzzy addition and multiplication approach. Most of the papers focused on decision making only.
• This paper actually gives the output of the software quality after careful analysis of the software quality parameters. It gives the software quality in terms of triangular fuzzy sets, which can be defuzzified to get the software quality in crisp (or numeric) value.
• The Constraint Satisfaction (CS) using the Choquet Integral is quite an interesting tech-nique [44]. Not only is the Choquet Integral, an extension of the weighted average but the CS also takes notice of not only the rankings (analogous to our ratings) but also of impor-tance (analogous to our weights) and interaction. Although, interaction is not there in this present paper, the same sub-characteristic has been considered more than once if two or more characteristics depend on it (i.e., the pre-requisite packages required are used in more than one characteristic).
• The following section describes the conclusions, limitations, and future work.
10. CONCLUSIONS, LIMITATIONS AND FUTURE WORK This paper presents an algorithm to quantify the Software Quality Parameters using the fuzzy
multi criteria approach. The proposed model has been clearly illustrated with a case studies. The quantified Software Quality with respect to the user’s, developer’s and project manager’s per-spectives has been obtained as explained in the above, “Procedures and Analysis.”
Depending upon the value calculated for the software quality following the inferences about the quality of the software has been inferred as shown in the table below.
Fig. 8.3. Comparison of the Different Characteristics of Software Quality Considered
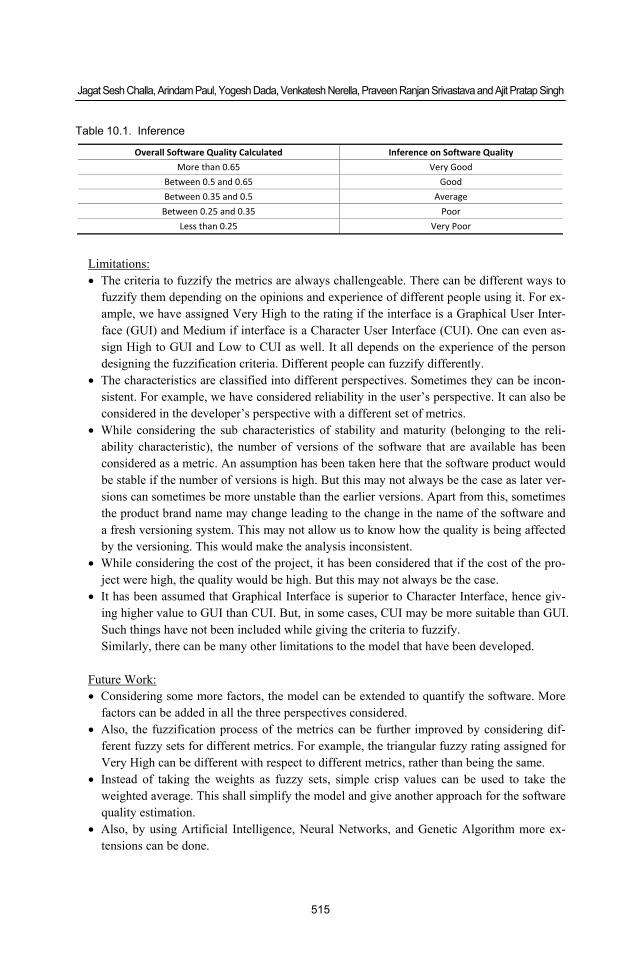
Jagat Sesh Challa, Arindam Paul, Yogesh Dada, Venkatesh Nerella, Praveen Ranjan Srivastava and Ajit Pratap Singh
515
Limitations: • The criteria to fuzzify the metrics are always challengeable. There can be different ways to
fuzzify them depending on the opinions and experience of different people using it. For ex-ample, we have assigned Very High to the rating if the interface is a Graphical User Inter-face (GUI) and Medium if interface is a Character User Interface (CUI). One can even as-sign High to GUI and Low to CUI as well. It all depends on the experience of the person designing the fuzzification criteria. Different people can fuzzify differently.
• The characteristics are classified into different perspectives. Sometimes they can be incon-sistent. For example, we have considered reliability in the user’s perspective. It can also be considered in the developer’s perspective with a different set of metrics.
• While considering the sub characteristics of stability and maturity (belonging to the reli-ability characteristic), the number of versions of the software that are available has been considered as a metric. An assumption has been taken here that the software product would be stable if the number of versions is high. But this may not always be the case as later ver-sions can sometimes be more unstable than the earlier versions. Apart from this, sometimes the product brand name may change leading to the change in the name of the software and a fresh versioning system. This may not allow us to know how the quality is being affected by the versioning. This would make the analysis inconsistent.
• While considering the cost of the project, it has been considered that if the cost of the pro-ject were high, the quality would be high. But this may not always be the case.
• It has been assumed that Graphical Interface is superior to Character Interface, hence giv-ing higher value to GUI than CUI. But, in some cases, CUI may be more suitable than GUI. Such things have not been included while giving the criteria to fuzzify. Similarly, there can be many other limitations to the model that have been developed.
Future Work: • Considering some more factors, the model can be extended to quantify the software. More
factors can be added in all the three perspectives considered. • Also, the fuzzification process of the metrics can be further improved by considering dif-
ferent fuzzy sets for different metrics. For example, the triangular fuzzy rating assigned for Very High can be different with respect to different metrics, rather than being the same.
• Instead of taking the weights as fuzzy sets, simple crisp values can be used to take the weighted average. This shall simplify the model and give another approach for the software quality estimation.
• Also, by using Artificial Intelligence, Neural Networks, and Genetic Algorithm more ex-tensions can be done.
Table 10.1. Inference
Overall Software Quality Calculated Inference on Software Quality
More than 0.65 Very Good
Between 0.5 and 0.65 Good
Between 0.35 and 0.5 Average
Between 0.25 and 0.35 Poor
Less than 0.25 Very Poor
Integrated Software Quality Evaluation: A Fuzzy Multi-Criteria Approach
516
ACKNOWLDGEMENT Authors thank to, Prof. G Raghurama, Director BITS Pilani for many insightful discussions
during the development of the ideas in this paper. Authors are also thankful to all references cited in the text.
REFERENCES [1] P. Bourque and R. Dupuis, Guide to the Software Engineering Body of Knowledge, 2004 Edition,
Vol.1, IEEE Press Piscataway, NJ, USA, 2004, pp.1-1. [2] ISO/IEC 9126-1:2001, “Software Engineering-Product Quality—Part 1: Quality Model”, Int’l Or-
ganization for Standardization, 2001, Available at “www.iso.org” [3] B. W. Boehm, J. R. Brown and M. L. Lipow, “Quantitative Evaluation of Software Quality,” Pro-
ceedings of the 2nd International Conference on Software Engineering, San Francisco, CA, USA, Oc-tober, 1976, pp.592-605.
[4] J. A. McCall, P. K. Richards, and G. F. Walters, Factors in Software Quality, 1977, Vol.I, II, and III, US Rome Air Development Center Reports - NTIS AD/A-049 014, NTIS AD/A-049 015 and NTIS AD/A-049 016, U. S. Department of Commerce.
[5] R. G. Dromey, “A model for software product quality,” IEEE Transactions on Software Engineering, Vol.21, No.2, February, 1995, pp.146-162.
[6] P. R. Srivastava and K. Kumar, “An Approach towards Software Quality Assessment,” Communica-tions in Computer and Information Systems Series (CCIS Springer Verlag), Vol.31, No.6, 2009, pp.345-346.
[7] P. R. Srivastava, A. P. Singh, K.V. Vageesh, “Assessment of Software Quality: A Fuzzy Multi - Cri-teria Approach,” Evolution of Computationand Optimization Algorithms in Software Engineering: Applications and Techniques, IGI Global USA, 2010, chapter - 11, pp.200-219.
[8] A. Sharma, R. Kumar and P.S. Grover, “Estimation of Quality for Software Components - an Empiri-cal Approach,” ACM SIGSOFT Software Engineering Notes, Vol.33, No.5, November, 2008, pp.1-10.
[9] S.A. Slaughter, D. E. Harter, & M. S. Krishnan, “Evaluating the Cost of Software Quality,” Commu-nications of the ACM, Vol.41, No.8, August, 1998, pp.67-73.
[10] M. Agarwal, & K. Chari, “Software Effort, Quality, and Cycle Time: A Study of CMM Level 5 Pro-jects,” IEEE Transactions on Software Engineering, Vol.33, No.3, March, 2007, pp.145-156.
[11] O. Maryoly, M.A. Perez and T. Rojas, “Construction of a Systemic Quality Model for Evaluating Software Product,” Software Quality Journal, Vol.11, No.3, July, 2003, pp.219-242.
[12] O. Lamouchi, A.R. Cherif, and N. Lévy, “A framework based measurements for evaluating an IS quality,” Proceedings of the fifth on Asia-Pacific conference on conceptual modelling, Wollongong, NSW, Australia, January, 2008, pp.39-47.
[13] Y.Kanellopoulos, P.Antonellis, D. Antoniou, C.Makris, E.Theodoridis, C. Tjortjis and N.Tsirakis, “Code Quality Evaluation Methodology Using The Iso/Iec 9126 Standard,” International Journal of Software Engineering & Applications (IJSEA), Vol.1, No.3, July, 2010, pp.17-36.
[14] I.Heitlager, T.Kuipers, J.Visser, “A Practical Model for Measuring Maintainability - a preliminary report,” 6th International Conference on Quality of Information and Communications Technology (QUATIC), September, 2007, pp.30-39.
[15] R. Fitzpatrick and C. Higgins, “Usable Software and its Attributes:A synthesis of Software Quality European Community Law and Human-Computer Interaction”, Proceedings of the HCI'98 Confer-ence, Springer, London, United Kingdom. 1998, pp.1-19.
[16] M. Bertoa and A. Vallecillo, “Usability metrics for software components,” Proceedings of Quantita-tive Approaches in Object-Oriented Software Engineering (QAOOSE), Oslo, April, 2006, pp.136-143.
[17] J. R. Brown and M. Lipow, “Testing for Software Reliability”, Proceedings of the international con-ference on Reliable software, Los Angeles, CA, USA, June, 1975, pp.518-527.
[18] D. Gupta, K. Vinay andG. H. Mittal, “Comparative Study of Soft Computing Techniques for Soft-ware Quality Model,” International Journal of Software Engineering Research & Practices, Vol.1,
Jagat Sesh Challa, Arindam Paul, Yogesh Dada, Venkatesh Nerella, Praveen Ranjan Srivastava and Ajit Pratap Singh
517
No.1, Jan, 2011, pp.33-37. [19] L. Lin and H. M. Lee, “A Fuzzy Software Quality Assessment Model to Evaluate User Satisfaction,”
Proceedings of the Second International Conference on Innovative Computing, Information and Con-trol, Washington DC, USA, September, 2007, pp.438-442.
[20] B. Yang, L. Yao and H. Z. Huang, “Early Software Quality Prediction Based on a Fuzzy Neural Net-work Model,” Proceedings of the Second International Conference on Innovative Computing, Infor-mation and Control, Washington DC, USA, September, 2007, pp.760-764
[21] G. Buyukozkan, C. KahramanandD. Ruan, “A fuzzy multi-criteria decisionapproach for software development strategy selection,” International Journal ofGeneral Systems, Vol.33, No.(2-3), 2004, pp.259-280.
[22] C. W. Chang, C. R. Wu&H. L. Lin, “Integrating fuzzy theory and hierarchyconcepts to evaluate soft-ware quality,”Software Quality Journal, Vol.16, No.2, 2008, pp.263-276.
[23] K. K. F. Yuen and H. C. W. Lau, “Fuzzy group analytical hierarchy process approach for software qualityassurance management: Fuzzy logarithmic least squares method,”Expert Systems with Appli-cations: An International Journal, Vol.38, No.8, August, 2011, pp.10292-10302.
[24] K. K. F. Yuen and H. C. W. Lau, “Evaluating Software Quality of Vendors using Fuzzy Analytic Hierarchy Process,”Proceedings of the International MultiConference of Engineers and Computer ScientistsVol I (IMECS 2008), Hong Kong, March, 2008, pp.126-130.
[25] J. Senior,I.Allison, and J. A.Tepper, “Automated Software Quality Visualisation Using Fuzzy Logic Techniques,”Communication of the IIMA, Vol.7, No.1, 2007, pp.25-40.
[26] K. K. Aggarwal, Y. Singh, P. Chandra and M. Puri, “Measurement of Software Maintainability Using a Fuzzy Mode,”Journal of Computer Sciences, Vol.1, No.4, 2005, pp.538-542.
[27] H. Mittal, P. K. Bhatia and P. Goswami, “Software Quality Assessment Based on Fuzzy Logic Tech-nique,”International Journal of Software Computing Applications, Issue 3, 2008, pp.105-112.
[28] P. C. Fishburn,mUtility Theory for Decision Making, Wiley, New York, 1964. [29] B. Roy, “Problems and Methods with Multiple Objective Functions, Math. Program,” Vol.1, 1971,
pp.239-266. [30] S. Kanhe, “A Contribution to Decision Making in Environmental Design,” Proceedings of the IEEE,
Vol.63, Issue.3, 1975, pp.518-528. [31] G. Klir and T. Folger, “Fuzzy Sets, Uncertainty and Information,” Prentice Hall, New Jersey, USA, 1988. [32] S. M. Baas and H. Kwakernaak, “Rating and Ranking of Multiple - Aspect Alternatives Using Fuzzy
Sets,”Automatica, Vol.13, No.1, 1977, pp.47-58. [33] C. Carlssonand R. Fuller, “Fuzzy multiple criteria decision making: Recent developments,”Fuzzy
Sets and Systems, Vol.78, 1996, pp.139-153. [34] P. R. Srivastava, P. Jain, A. P. Singh, G. Raghurama, “Software quality factor evaluation using Fuzzy
multi-criteria approach,”Proceedings of the 4th Indian International Conference on Artificial Intelli-gence (IICAI 2009), Tumkur, Karnataka, India, December, 2009, pp.1012-1029.
[35] A.P.Singh and A. K. Vidyarthi, “Optimal allocation of landfill disposal site: A fuzzy multi criteria approach,”Iranian Journal of Environmental Health Science & Engineering, Vol.5, No.1, 2008, pp.25-34.
[36] IEEE Standard Glossary of Software Engineering terminology, IEEE Std 610.12-1990. [37] T.J. Ross, Fuzzy Logic with Engineering Applications,2nd Ed, Wiley India Pvt. Ltd, New Delhi,
India, 2004. [38] S. Kalaimangal and R. Srinivasan, “A Retrospective on Software Component Quality Models,” ACM
SIGSOFT Software Engineering Notes, Vol.33, No.5, November, 2008, pp.1-9, [39] V. Salvatore, A. Cucchiarelli and M. Panti, “Computer Based Assessment Systems Evaluation via the
ISO9126 Quality Model,”Journal of Information Technology Education, Vol.1, No.3, 2002, pp.157-175. [40] J.A. Borretzen, “The Impact of Component Based Development on Software Quality Attrib-
utes,”available at http://www.idi.ntnu.no/emner/dt8100/Essay2005/Boerretzen.pdf [41] M.R. Vigder, & A.W. Kark, “Maintaining COTS-Based Systems: Start with the Design,”Fifth Inter-
national Conference on Commercial-off-the-Shelf (COTS)-Based Software Systems, Orlando, Florida, USA, February, 2006, pp.8-13.
[42] R. Adnan, and B. Matalkah, “A New Software Quality Model for Evaluating COTS Compo-
Integrated Software Quality Evaluation: A Fuzzy Multi-Criteria Approach
518
nents,”Journal of Computer Science, Vol.2, No.4, 2006, pp.373-381. [43] A.P. Singh , “An Integrated Fuzzy Approach to Assess Water Resources’ Potential in a watershed”,
ICFAI Journal of Computational Fluid Mathematics, Vol.1, No.1, 2008, pp.7-23. [44] M. Grabisch and M. Roubens, “Application of the Choquet Integral in Multicriteria Decision Mak-
ing,” Fuzzy measures and integrals, PhysicaVerlag, Berlin, 2000, pp.348-374. [45] James D Mooney, Bringing portability to the software process, Technical Report TR 97-1, West Vir-
ginia University, Dept. of Statistics and Comp.Science, 1997.
Jagat Sesh Challa is presently doing his M.E. in Software Systems at BITS, Pilani. His research areas are software engi-neering, software testing, and supply chain management. Contact him at: [email protected] Arindam Paul is working as a Project Assistant in the Information Processing Center at BITS Pilani. He is presently a graduate student in the Computer Science and Information Systems Department at BITS, Pilani. His research areas are Map Reduce, P2P systems, cluster computing, distributed systems, and software engineering. Contact him at: [email protected] Yogesh Dada is doing his M.E. in Software Systems at BITS, Pilani. Contact him at: [email protected] Venkatesh Nerella is doing his M.E. in Software Systems at BITS, Pilani. Contact him at: [email protected] Praveen Ranjan Srivastava is working under the Software Engineering and Testing Research Group in the Computer Science and Information Systems Department at the Birla Institute of Technology and Science (BITS) Pilani India. He is currently doing research in the area of software testing. His research areas are software testing, quality assurance, quality attributes ranking, testing effort, software release, test data generation, agent oriented software testing, and soft computing techniques. He has published more than 60 research papers in various leading international journals and conferences in the area of software testing. He has been actively involved in reviewing various research papers submitted in his field to different leading journals and various international and national level conferences. Contact him at:praveenrsrivastava@ gmail.com Dr. Ajit Pratap Singh is an Associate Professor and Dean in the Civil Engineering Department of the Birla Institute of Tech-nology and Science, Pilani, Rajasthan, India. He has more than 17 years of teaching and research experience in the field of mathematical modeling, simulation, and soft computing with a special empha-sis on the application in environmental engineering and sustainable water resources management groundwater contaminant transport prediction, assessment, and management. He has published more than 28 research papers in different journals and international conference proceedings in his area of interest. He has been actively involved in reviewing various research papers submitted in his field to journals of international and national repute such as The Journal of Water Resources Management, Springer, The Journal of Environment Management, Elsevier, The International Journal of Environ-mental Engineering Science (IJEES), and at the World Scientific and Engineering Academy and Soci-ety (WSEAS) conferences etc. He may be contacted at: [email protected].