Embed Size (px)
Citation preview
Integrated SOx Emission Trend Estimation for the Sustainability Transition
Students
K. Miller, C. Reid, J. Agan, J. Reynolds
Instructor
Rudolf B. HusarWashington University, St. Louis, MO
Sustainable Air Quality - Class Project Report, May 2003 Presented at
NARSTO Workshop on Innovative Methods forEmission-Inventory Development and Evaluation
Austin, TX ; October 14-17, 2003
Sustainable Development NAS: Our Common Journey: A Transition Toward Sustainability
• SD is the process of reconciling society’s developmental needs with the environmental limits over the long term.
• During the ‘journey’, the pathways of a transition to sustainability have to be ‘navigated’ adaptively incorporating differing views on what should be developed, what should be sustained and over what time period.
• Human activities exert pressures, such as burning fossil fuels that alter the state of environment, such air quality. The impaired environmental state, elicits responses, such as regulations.
• Each can be measured using historical data and quantify the causality chain
Sustainable Air Quality Class Project:
Sustainability Transition for Sulfurous Pollution
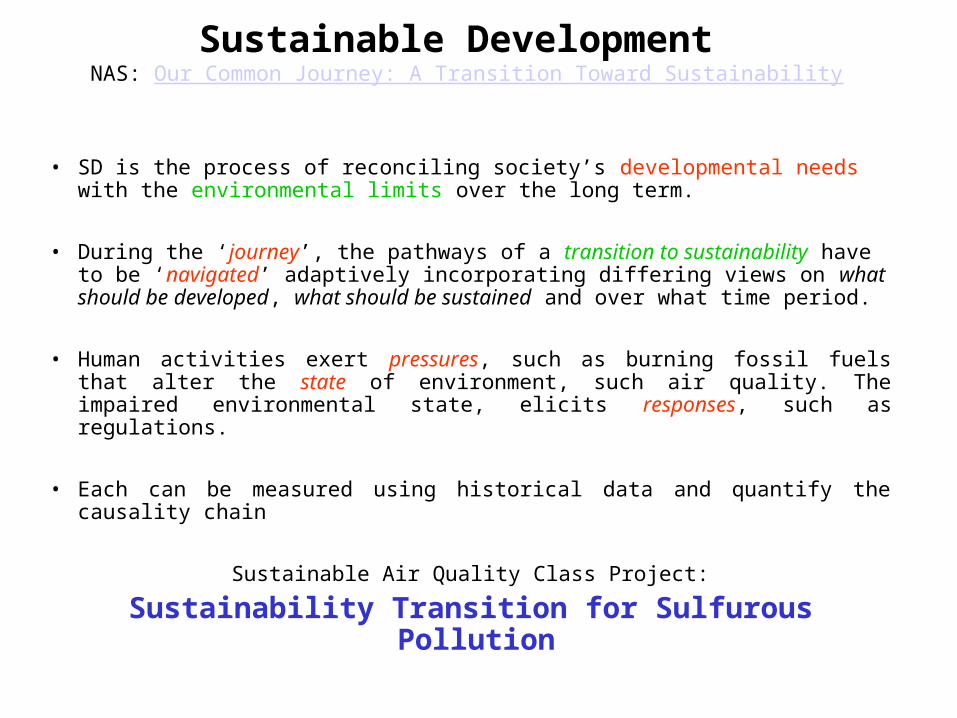
SOX Emissions Drivers: Linear Causality ModelSOX Emissions Drivers: Linear Causality Model
The driver of SOX emissions is the population, modified by economic, energy and emission factors
Emissions changes can be caused by any of the four key ‘drivers’
Energy, BTU Economy, $SOX
Sox = (Sox/Btu) x (Btu/GDP) x (GDP/P) x (Pop)
Persons, P
Economic VigorEnergy EfficiencyEmissions Factor
US SOX Emission Trend
0
5000
10000
15000
20000
25000
30000
35000
1900 1950 2000 2050
Causality of change?
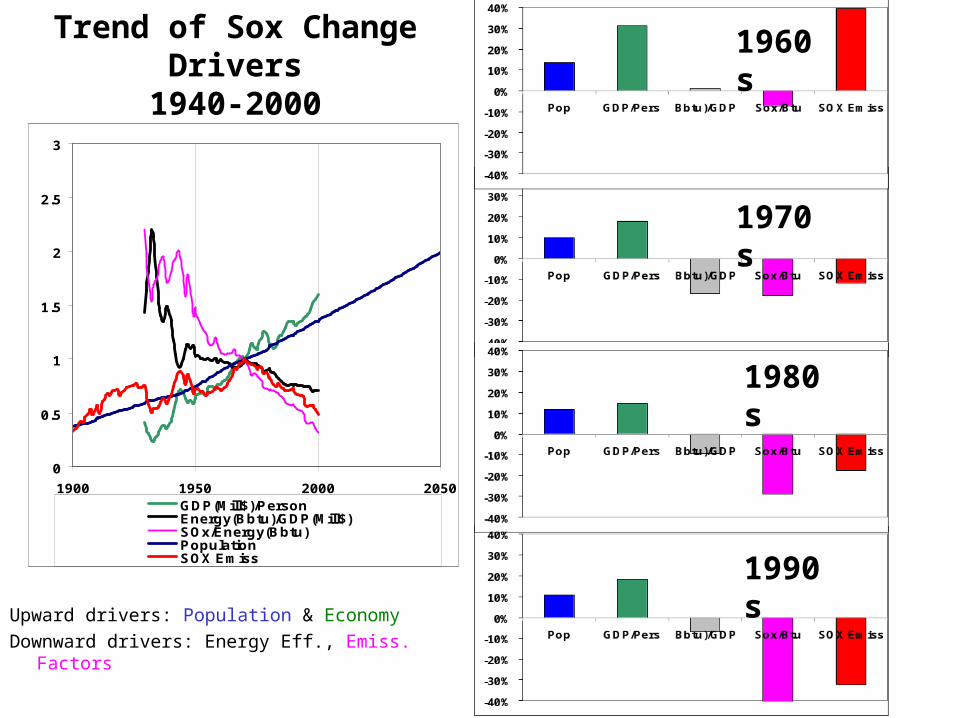
Trend of Sox Change Drivers1940-2000
Upward drivers: Population & Economy
Downward drivers: Energy Eff., Emiss. Factors
1960s
1970s
1980s
1990s
0
0.5
1
1.5
2
2.5
3
1900 1950 2000 2050GDP(Mill$)/PersonEnergy(Bbtu)/GDP(Mill$)SOx/Energy(Bbtu)PopulationSOX Emiss
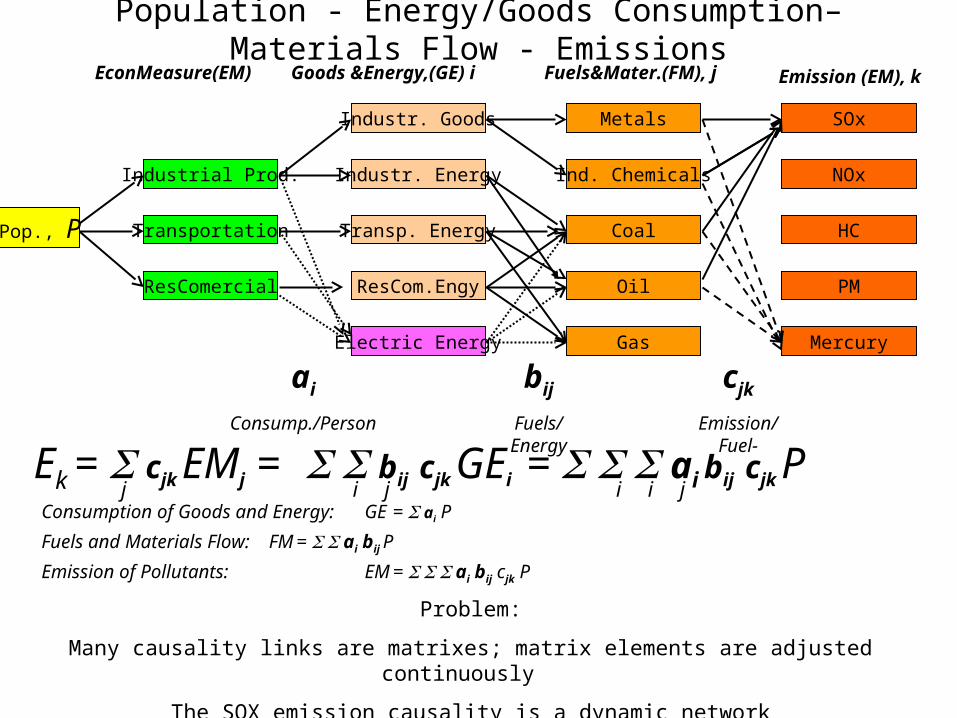
Population - Energy/Goods Consumption– Materials Flow - Emissions
Ek = cjk EMj = bij cjk GEi = ai bij cjk P
Industr. Energy
Transp. Energy
ResCom.Engy
Coal
Oil
GasElectric Energy
SOx
NOx
HC
PM
Goods &Energy,(GE) i Fuels&Mater.(FM), j Emission (EM), k
Ind. Chemicals
Industr. Goods
Pop., P
Metals
Mercury
ai
Consump./Person
bij
Fuels/Energy
cjk
Emission/Fuel-
j ji i i jConsumption of Goods and Energy: GE = ai P
Fuels and Materials Flow: FM = ai bij P
Emission of Pollutants: EM = ai bij cjk P
Industrial Prod.
Transportation
ResComercial
EconMeasure(EM)
Problem:
Many causality links are matrixes; matrix elements are adjusted continuously
The SOX emission causality is a dynamic network
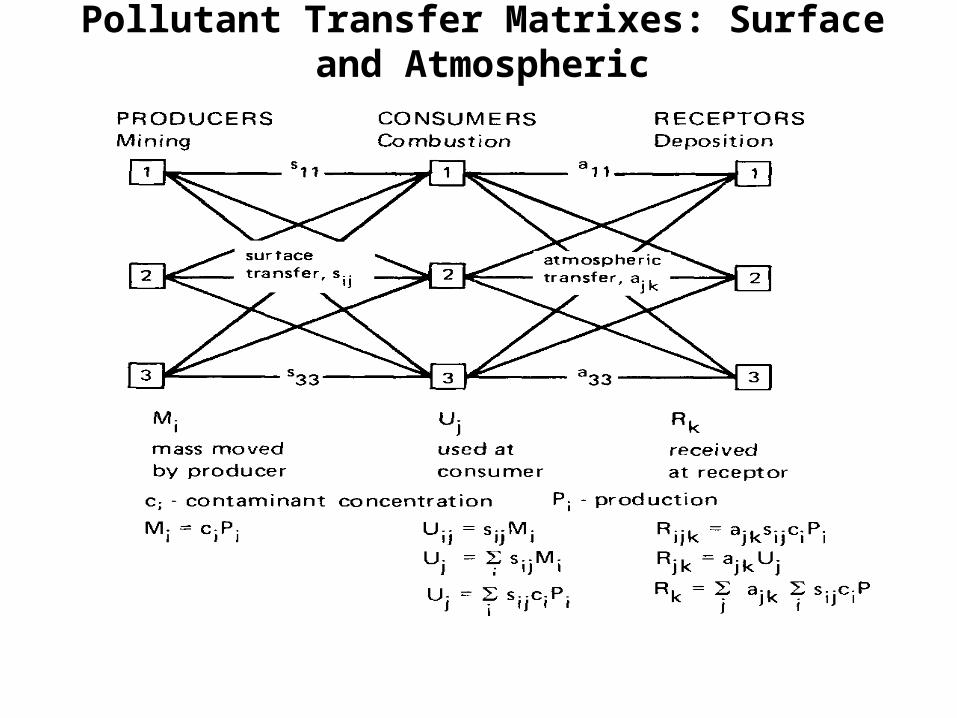
Pollutant Transfer Matrixes: Surface and Atmospheric
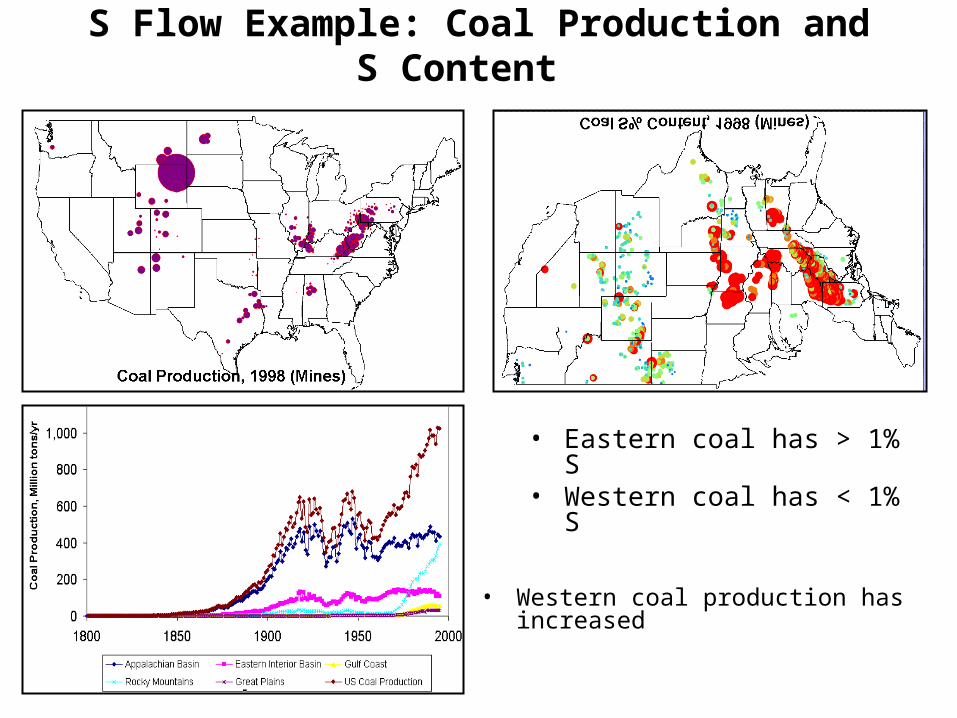
S Flow Example: Coal Production and S Content
• Western coal production has increased
• Eastern coal has > 1% S• Western coal has < 1% S
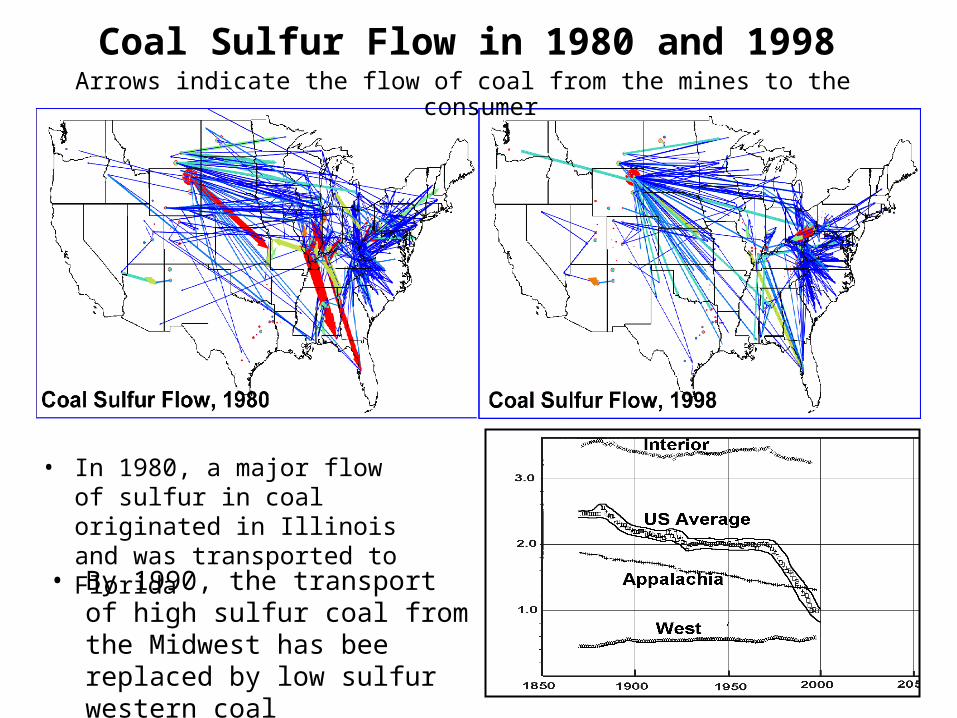
Coal Sulfur Flow in 1980 and 1998
• In 1980, a major flow of sulfur in coal originated in Illinois and was transported to Florida
Arrows indicate the flow of coal from the mines to the consumer
• By 1990, the transport of high sulfur coal from the Midwest has bee replaced by low sulfur western coal
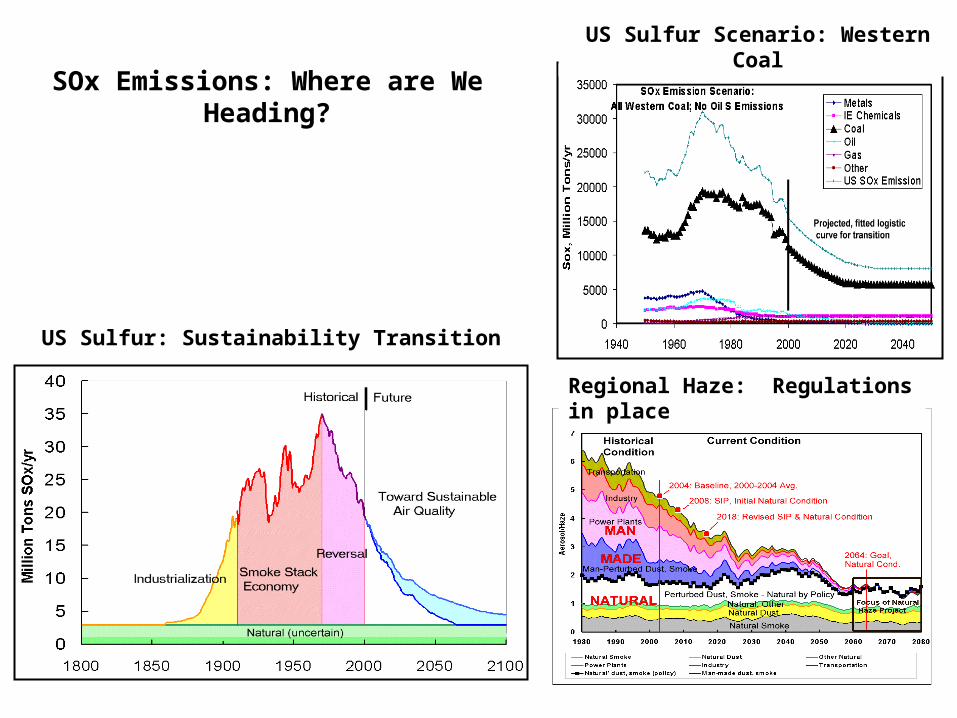
SOx Emissions: Where are We Heading?
US Sulfur: Sustainability Transition
Regional Haze: Regulations in place
US Sulfur Scenario: Western Coal
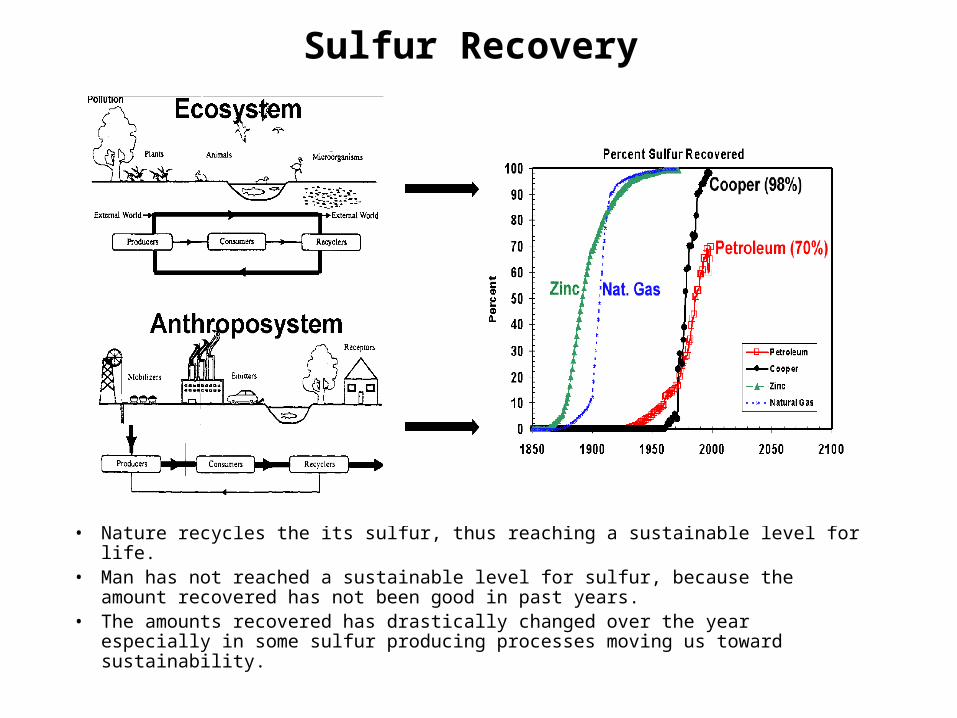
Sulfur Recovery
• Nature recycles the its sulfur, thus reaching a sustainable level for life.• Man has not reached a sustainable level for sulfur, because the amount
recovered has not been good in past years.• The amounts recovered has drastically changed over the year especially in
some sulfur producing processes moving us toward sustainability.
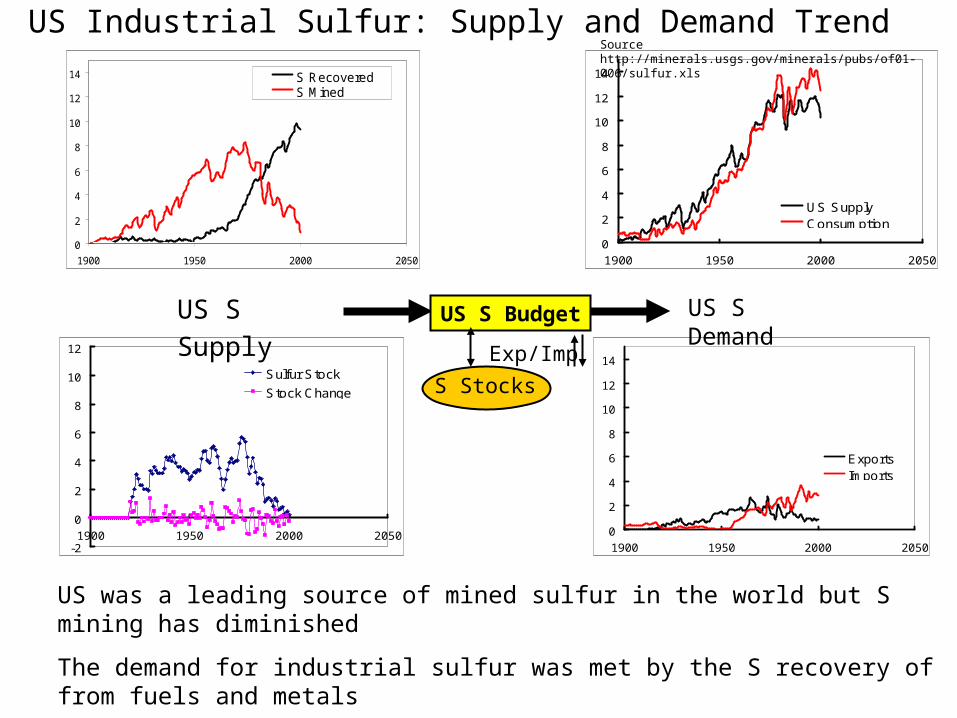
US Industrial Sulfur: Supply and Demand Trend
US S Budget
S Stocks
Exp/Imp
0
2
4
6
8
10
12
14
1900 1950 2000 2050
ExportsImports
0
2
4
6
8
10
12
14
1900 1950 2000 2050
US SupplyConsumption
-2
0
2
4
6
8
10
12
1900 1950 2000 2050
Sulfur Stock
Stock Change
0
2
4
6
8
10
12
14
1900 1950 2000 2050
S RecoveredS Mined
US S Supply US S Demand
Source http://minerals.usgs.gov/minerals/pubs/of01-006/sulfur.xls
US was a leading source of mined sulfur in the world but S mining has diminished
The demand for industrial sulfur was met by the S recovery of from fuels and metals
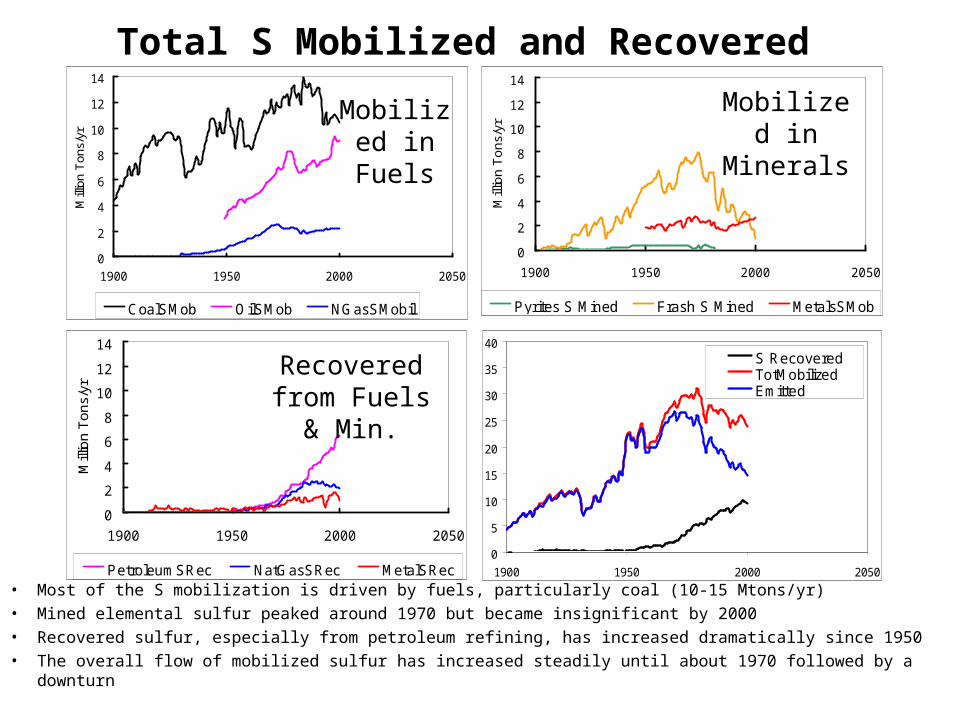
Total S Mobilized and Recovered
• Most of the S mobilization is driven by fuels, particularly coal (10-15 Mtons/yr)
• Mined elemental sulfur peaked around 1970 but became insignificant by 2000
• Recovered sulfur, especially from petroleum refining, has increased dramatically since 1950
• The overall flow of mobilized sulfur has increased steadily until about 1970 followed by a downturn
0
2
4
6
8
10
12
14
1900 1950 2000 2050
Mill
ion
Ton
s/yr
CoalSMob OilSMob NGasSMobil
0
2
4
6
8
10
12
14
1900 1950 2000 2050
Mill
ion
To
ns/
yr
PetroleumSRec NatGasSRec MetalSRec
0
2
4
6
8
10
12
14
1900 1950 2000 2050
Mill
ion
To
ns/
yr
Pyrites S Mined Frash S Mined MetalsSMob
Mobilized in Fuels
Mobilized in Minerals
Recovered from Fuels &
Min.
0
5
10
15
20
25
30
35
40
1900 1950 2000 2050
S RecoveredTotMobilizedEmitted
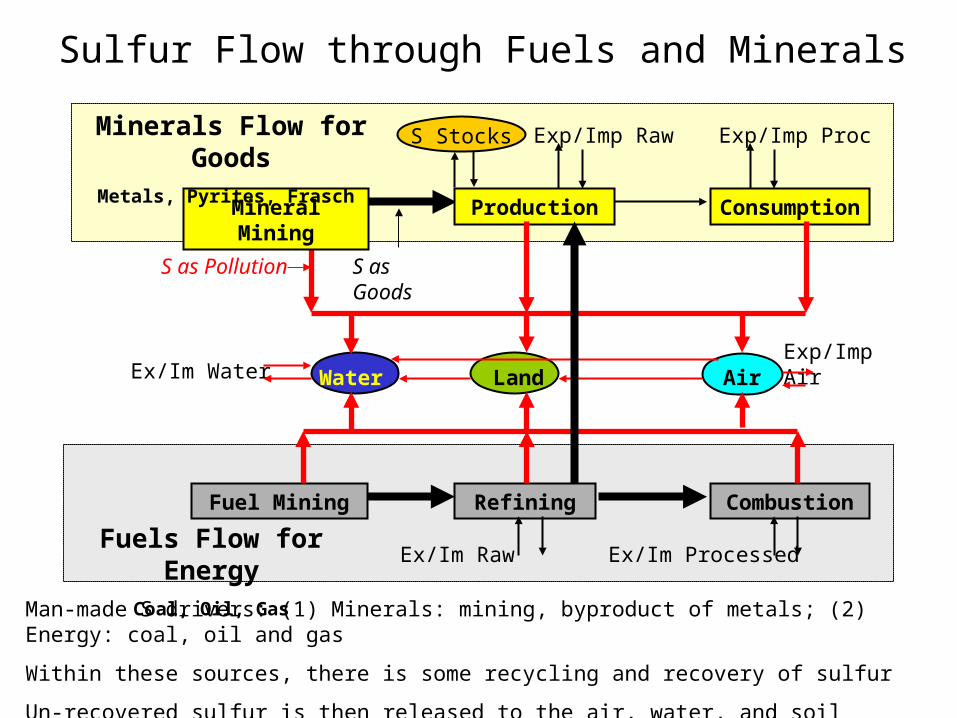
Sulfur Flow through Fuels and Minerals
Mineral Mining Production Consumption
AirLandWater
S Stocks Exp/Imp Raw
Fuel Mining Refining Combustion
Minerals Flow for GoodsMetals, Pyrites, Frasch
Fuels Flow for EnergyCoal, Oil, Gas
Exp/Imp Proc
Ex/Im Raw Ex/Im Processed
Exp/Imp AirEx/Im Water
S as Pollution S as Goods
Man-made S drivers: (1) Minerals: mining, byproduct of metals; (2) Energy: coal, oil and gas
Within these sources, there is some recycling and recovery of sulfur
Un-recovered sulfur is then released to the air, water, and soil environment as pollution
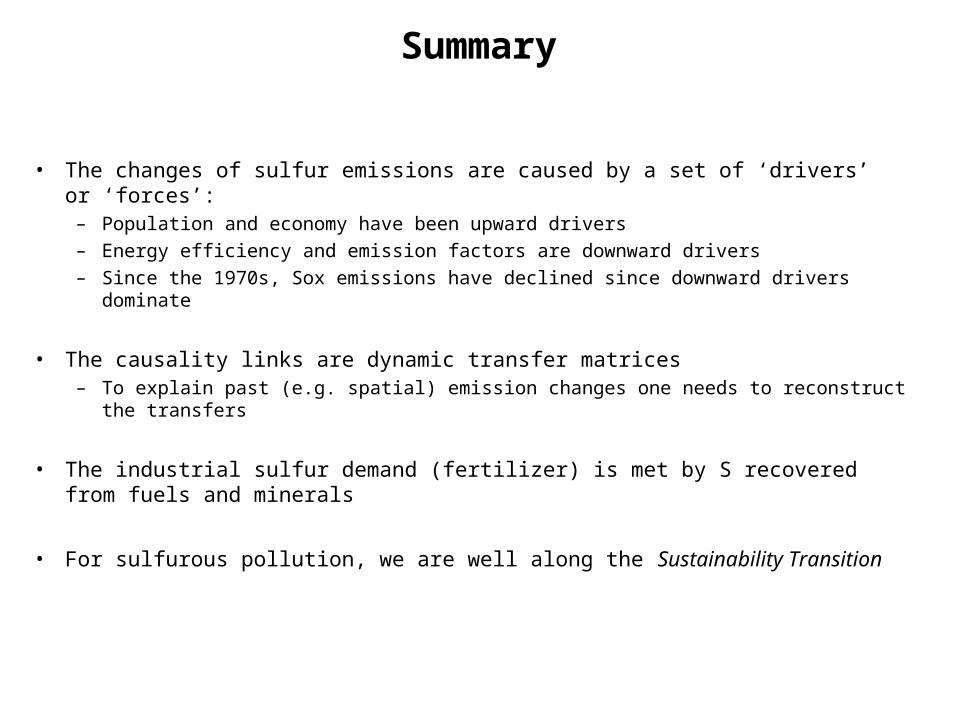
Summary
• The changes of sulfur emissions are caused by a set of ‘drivers’ or ‘forces’:– Population and economy have been upward drivers
– Energy efficiency and emission factors are downward drivers
– Since the 1970s, Sox emissions have declined since downward drivers dominate
• The causality links are dynamic transfer matrices– To explain past (e.g. spatial) emission changes one needs to reconstruct the transfers
• The industrial sulfur demand (fertilizer) is met by S recovered from fuels and minerals
• For sulfurous pollution, we are well along the Sustainability Transition


![Adrian Husar Dacia Romana Ist Antica[1]](https://img.pdfslide.net/doc/110x75/55cf9d1e550346d033ac4fd3/adrian-husar-dacia-romana-ist-antica1-56327cebf2c8b.jpg)