Embed Size (px)
Citation preview

Uppsala BioCenter Independent project 2011:4 Department of Microbiology Faculty of Natural Resources and Agriculture Sciences Swedish University of Agricultural Sciences ISSN 1101-8151 Uppsala ISRN SLU-MIKRO-EX–11/4–SE
Integrated Storage and Pretreatment of Wheat Straw for Biofuel Production Harikrishnan Anjaly Sukumaran Nair


Uppsala BioCenter Independent project 2011:4 Department of Microbiology Faculty of Natural Resources and Agriculture Sciences Swedish University of Agricultural Sciences ISSN 1101-8151 Uppsala ISRN SLU-MIKRO-EX–11/4–SE
Integrated Storage and Pretreatment of Wheat Straw for Biofuel Production Harikrishnan Anjaly Sukumaran Nair Supervisor: Matilda Olstorpe
Examiner: Volkmar Passoth Keywords: Biofuel; Wet storage; Dil acid pretreatment; Enzyme
sacharification EX0564 Independent project in Biology – Master’s thesis 30 HEC, level A1E, within the program in Masters in Biotechnology


ABSTRACT
The study aims for the development of a Pretreatment method for wheat straw,
when it is stored at low temperature. The hypothesis is that an initial disruption of
the crystalline nature of lignocellulose can improve the efficiency of current
pretreatment method during low temperature storage. A silo model storage of
wheat straw, with high moisture, involving 3 different fungal species
(Holtermanniella takashimae , Pichia anomala and Anthracophyllum discolor) and
their combination at two different temperatures (4°C and 15°C) was tested. The
microbiology of samples was studied for analyzing the effectiveness of
conservation. Dilute acid treatment was done prior to the saccharification with
Accellerase™ 1000 enzyme. The soluble fraction of hydrolysate was fermented in
15 ml serum flask with Saccharomyces cerevisiae.
The biomass stored with combination of Holtermanniella takashimae and Pichia
anomala at 4°C showed significant improvement in initial ethanol yield (2.8%
increase in ethanol at P‐value<0.05) compared to the non inoculated wet control
sample. A detailed study of the simple sugars released, showed that the total
sugar yield for P. anomala inoculated sample was double as that of control sample
(29.283g/L Vs 17.43g/L). The ethanol yield for A. discolor inoculated samples
(59%) was higher than the theoretical maximum (<50%), which suggests that the
saccharification may not have completed at the time of fermentation.
The samples stored with P. anomala showed significant inhibition of mold and
other contaminants. But the results were compared with wet non inoculated
samples which were non sterile and had high microbial load (106 CFU/g of fungus,
108 CFU/g aerobic bacteria, 107 CFU/g of enterobacteria) during incubation. So it
is suggested to carry out a future study with simultaneous saccharification and
fermentation (SSF) to completely utilize the free sugars and with a dry stored
material as control, to avoid the effect of natural microflora.


POPULAR ABSTRACT The ever growing human population and shrinking arable land areas cause the
first generation biofuels derived from edible biomass, such as corn and sugar cane
made as a non feasible option. In the 21st century, we need to develop a new way
to fuel our cars without competing with the food and reduced environmental
impact. The second generation biofuel, so called cellulosic ethanol can be
produced from literally any part of biomass, and can be one contribution for our
growing fuel needs. But the technologies for converting the plant biomass into
fuel are not yet a reality. Primarily, the conversions of cellulose to fermentable
sugars (the pretreatment of material) still acts as a bottle neck in the process.
Storage of biomass is an important issue of biofuel production since we need a
constant supply of material for industrial production processes. In Sweden, the
normal conservation of material by drying should be replaced by wet silo model of
storage. In the current project, we have developed an ingenious solution for
breaking down the hard cellulosic structure during the time of storage itself in the
presence of high moisture, making it more accessible to the further enzymatic
steps without increasing the cost of production. We have used 3 fungal species
which can grow in low temperature, and still disrupt the complex cellulosic
structure, and studied the effect for ethanol yield. Storing the wheat straw at
higher moisture level with our combination of fungal species was able to increase
the ethanol yield by approximately 2.8%. But there were some more aspects of
this study, which need to be extended since the experimental design was unable
to include the insoluble part of the hydrolysate into ethanol. So a future study
with the proposed changes may be a breakthrough in the cellulosic bioethanol
industry, making it as a reality.


TABLE OF CONTENTS
ABSTRACT ....................................................................................................................... 3
POPULAR ABSTRACT ....................................................................................................... 5
1. INTRODUCTION ...................................................................................................... 9
1.1. Energy efficient Storage ................................................................................. 9
2. AIM ...................................................................................................................... 11
3. MATERIALS AND METHODS .................................................................................. 12
3.1. Wheat straw ................................................................................................ 12
3.2. Water activity .............................................................................................. 12
3.3. Fungal strains .............................................................................................. 12
3.4. Media composition ...................................................................................... 12
3.4.1. Yeast Extract‐ Peptone‐ Dextrose Medium (YPD) ................................ 12
3.4.2. YNB media ........................................................................................... 12
3.4.3. de Man, Rogosa and Sharpe (MRS) Media .......................................... 13
3.4.4. Violet Red Bile Agar with Glucose (VRBG) ........................................... 13
3.4.5. Tryptone Glucose Extract Agar (TGEA) ................................................ 13
3.5. Inoculum preparation .................................................................................. 13
3.6. Experimental Setup ..................................................................................... 13
3.7. Phenol oxidase activity measurement ......................................................... 14
3.8. Dilute Acid Pretreatment ............................................................................. 15
3.9. Enzymatic saccharification ........................................................................... 15
3.10. Fermentation ............................................................................................... 15
3.11. HPLC analysis ............................................................................................... 15
4. RESULTS AND DISCUSSION ................................................................................... 17
4.1. Moisture analysis ......................................................................................... 17
4.2. Water activity test ....................................................................................... 17
4.3. Microbial characteristics .............................................................................. 17
4.3.1. Natural micro flora of the sample ....................................................... 17
4.3.2. At the start of the experiment (t0) ...................................................... 17
4.3.3. Two week Incubation .......................................................................... 20
4.3.4. One Month Sample ............................................................................. 21
4.4. Yeast growth during storage ........................................................................ 23
4.5. Lactic acid Bacteria ...................................................................................... 23
4.6. Aerobic bacteria .......................................................................................... 24
4.7. Enterobacteria .............................................................................................. 25
4.8. Phenol oxidase activity in stored wheat straw ............................................. 25
4.9. Pretreatment ............................................................................................... 26
4.10. Saccharification ........................................................................................... 26
4.11. Glucose Production ..................................................................................... 27
4.12. Fermentation studies ................................................................................... 27
4.12.1. Ethanol Production ............................................................................. 27
4.12.2. Yield Factor ......................................................................................... 28
4.12.3. Other sugars ........................................................................................ 29
4.12.4. Toxicity of hydrolysate ........................................................................ 30
4.12.5. Statistical significance ......................................................................... 31
5. CONCLUSION AND FUTURE PROSPECTIVE ............................................................ 32
6. ACKNOWLEDGEMENT .......................................................................................... 33
7. REFERENCES ......................................................................................................... 34
Appendix ..................................................................................................................... 36


9
1. INTRODUCTION
It is important to have a liquid fuel replacement for petroleum, as the world’s
fossil fuel supply is limited. Ethanol is one of the most attractive biofuels in the
21st century mainly because of its renewable nature, and lower environmental
impact than the conventional fossil fuels. But currently produced ethanol, mainly
form corn (starch) and sugarcane is not sustainable as it can cause competition
with food, and creates other major problems like land use issue, green house gas
release[1] etc. The second generation biofuel[2] or lignocellulosic biofuel can be
produced literally from any cellulosic materials like wood chips, agricultural
residues and special energy crops, making it a global fuel[3]. But cellulosic biofuel
is not yet a reality since the production of fermentable sugars from cellulose is not
economically viable and current methods of pretreatment (Physical and chemical
breakdown of the material to make it more accessible for the subsequent
hydrolysis step) are quite harsh, resulting in the production of highly toxic
fermentation inhibitors like furfural and hydroxymethyl furfural [4].
The common fermentation yeast Saccharomyces cerevisiae can only ferment
hexoses and few disaccharides [5], whereas the plant material usually contains
practically no glucose, but in abundance of polysaccharides cellulose and
hemicellulose entrapped in phenolic lignin compounds. The direct conversion of
lignocellulose to glucose is practically impossible, because of the rigid and
polymer nature of wood. Currently an additional step called thermo chemical
pretreatment, is used to breakdown the polymer nature of plant material making
it more vulnerable for the further hydrolysis and saccharification process. But
there are several disadvantages of this process. The harsh and costly
pretreatment makes the pretreated hydrolysate rich in fermentation inhibitors
and makes the process less feasible. Researchers around the world have tested
several possible alternatives to the pretreatments but no substantial progress has
been achieved. Hattakka in 1983 has proposed a biological pretreatment[6],
where he used several lignolytic fungi to breakdown wheat straw and produce
glucose in a sterile environment. Even though Hattakka succeeded to produce
high amounts of glucose, without any inhibitors, the sterilization requirement and
long incubation time (15days) made the pretreatment non feasible [7]. The
combination of biological pretreatment with chemical treatment also failed since
the high amount of sugar produced during biological treatment remains as a
source of fermentation inhibitors in the further chemical steps. So it is clear that,
the focus of this research is not to produce free sugar, but to disrupt the structure
of lignocellulosic feed stock, without any further requirement of sterilization,
material handling problems and cost. Working with non sterile feedstock creates
several other problems such as difficulty in overall microbial control, lower yield
and other hygiene related problems.
1.1. Energy efficient Storage The primary target of cellulosic ethanol production is the net energy output. That
is, achieving good bioethanol production with low energy and chemical input.
Currently 32% of total cost investment is for the pretreatment and chemicals [8].

10
The traditional way of conservation of biomass is based on drying the material
which reduces the water content and in turn prevents the growth of spoilage
microorganisms. Storage of feed stock will become more important when
industrial production of biofuel needs constant flow of material, whereas the
biomass production process is seasonal. But the currently practiced drying is
energy intensive and much difficult in areas like Sweden, where the vegetation
period is rather short. In 2009 Passoth et al demonstrated that storing moist
wheat grains in airtight situation improves the bioethanol yield [9]. The concept of
integrated storage and pretreatment of biomass is based on storing materials
with high moisture content, favoring useful micro organisms which allows partial
breakage of cellulosic structure and eases the release of sugar in the later
production process.
1.2. Biopreservation
The concept of integrated storage and pretreatment in countries like Sweden,
involve biopreservation with low temperature preferring microorganisms, which
can grow at typical Swedish temperatures and at the same time help in breaking
down complex lignocellulose. At the same time working with non sterile material
is rather troublesome, since the overall microbial characteristic of the material
depends on the initial microbial load also. So it is desired to have a microorganism
which has the ability to control (inhibit the growth) other microorganisms. Pichia
anomala is known as a potential biopreservative agent [10] and known to improve
feed hygiene in moist wheat grains. Also the ability of P. anomala to grow in
extreme conditions like low and high pH and low oxygen [11] makes it a good
candidate for the current study.
Holtermanniella takashimae is a novel yeast species originally isolated from plant
litter and agriculture land around the world [12]. H. takashimae is able to grow at
low temperatures (4°C) and able to degrade cellulose. Co‐cultivation of H.
takashimae with P. anomala may result in a symbiotic relation where H.
takashimae degrades cellulose and provides P. anomala with enough glucose to
survive, which in turns kills all other contaminants including H. takashimae.
White rot fungi belong to the most efficient wood degrading microorganisms [13],
widely known for their ability to produce extracellular enzymes like Lignin
peroxidase (Lip), manganese peroxidase (MnP) and laccase [14]. Anthracophyllum
discolor was shown to be able to grow in wheat straw and compete with other
natural soil microorganisms in non sterile conditions and produce lignolytic
enzymes[15].

11
2. AIM The aim of this study was to establish an energy efficient integrated storage and
pretreatment of wheat straw for ethanol production.
The study also aimed for microbial characterization of stored wheat straw at high
moisture level, and to optimize a smaller scale pretreatment system for storage
studies in a controlled environment.

12
3. MATERIALS AND METHODS
3.1. Wheat straw Dry wheat straw used was obtained from SLU. It was then milled into fine powder
in an Ultra centrifugal mill ZM 1000 (Retsch Germany). Milled materials were
stored airtight in a plastic bag in 4°C until use. The original water activity (aw) of
the material was 0.233 corresponding to 5.72 % moisture.
3.2. Water activity Water activity (aw) is a measurement of free water content. It is defined as the
partial vapor pressure of water in the substance divided by that of pure water at
the same temperature [16]. Higher aw substances tend to support more
microorganisms. Bacteria usually require at least aw 0.91, and fungi 0.7. If a
product is kept below a certain water activity, then mold growth is inhibited. This
results in a longer shelf‐life. Water activity was measured in Aqua Lab CX‐2,
(Decagon Devices inc. Washington, USA). Moisture content was measured in
Sartorious Moisture analyzer MA‐45 (Göttingen, Germany).
3.3. Fungal strains The Fungal strains used in the study are shown in the table (table: 1).
Table 1: Fungal strains used in the study. CBS stands for the culture collection in Centraalbureau voor Schimmelcultures Fungal Biodiversity Centre, Utrecht Netherlands. J Represents the culture collection in the department of microbiology.
† Not deposited in any culture collections. Donated by Dr. Leticia Pizzul, Dept of Microbiology, SLU.
3.4. Media composition
3.4.1. Yeast Extract Peptone Dextrose Medium (YPD) YPD medium (Yeast extract 10 g/L, Peptone 20 g/L from Oxoid LTD Basingstoke,
New Hampshire, Glucose 20 g/L (Duchefa Biochemie B.V, Duchefa Netherlands)
were used for yeast growth. 15 g/L Agar (Oxoid LTD Basingstoke, New Hampshire)
was used for solid plates. 0.1 g/L of Chloramphenicol (Sigma Aldrich Chemie
GmbH, Steinheim, Germany) was added for preventing bacterial growth.
3.4.2. YNB media The Yeast Nitrogen Base 6.7 g/L (difcoTM, Becton Dickinson and Co, USA) was
filter sterilized (0.2 µm) (Sarstedt, AG & Co, Nümbercht; Germany). Glucose
Yeast strain Known Activity
Holtermanniella takashimae J596(CBS
10506)
Cellulolytic enzyme
Pichia anomala J121 Biopreservative yeast
Anthracophyllum discolor† Lignolytic white rot fungi
Saccharomyces cerevisiae J672
Pichia stipitis J563 (CBS 5774)
Dekkera bruxellensis J355 (CBS 74)
Fermentation yeast
Xylose fermenting yeast
Alternative fermentation yeast
13
solution that was separately autoclaved was added to the YNB for a final glucose
concentration of 20 g/L.
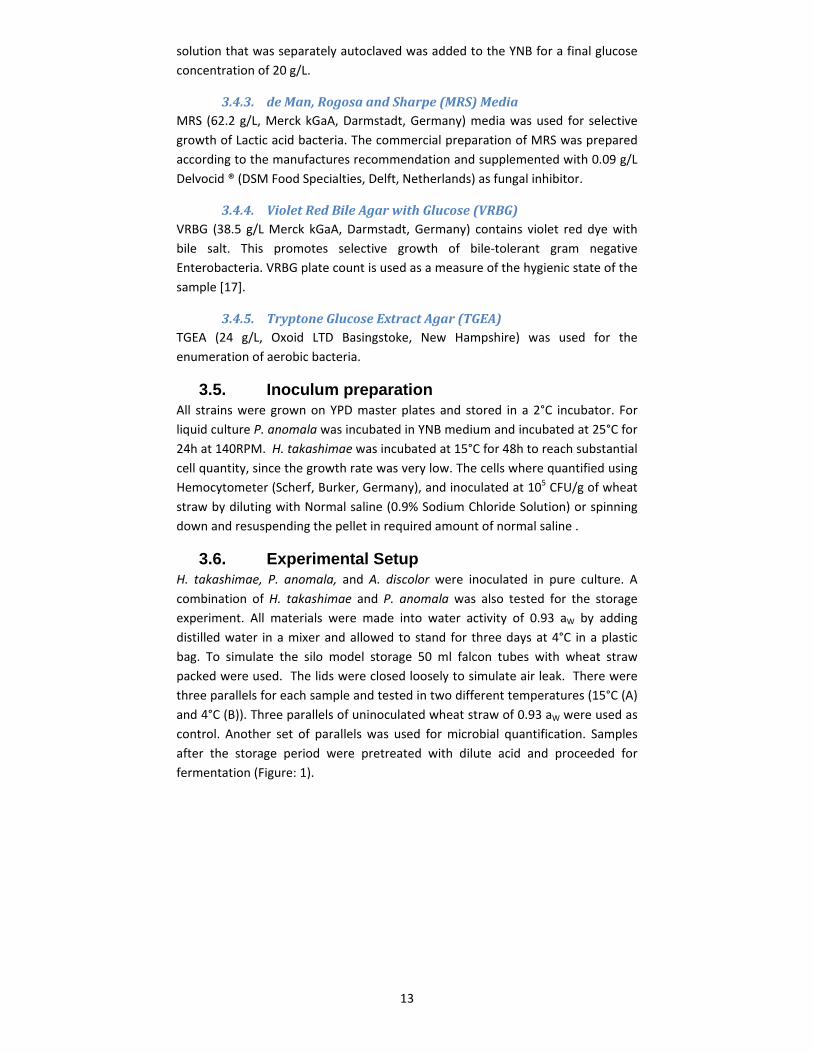
3.4.3. de Man, Rogosa and Sharpe (MRS) Media MRS (62.2 g/L, Merck kGaA, Darmstadt, Germany) media was used for selective
growth of Lactic acid bacteria. The commercial preparation of MRS was prepared
according to the manufactures recommendation and supplemented with 0.09 g/L
Delvocid ® (DSM Food Specialties, Delft, Netherlands) as fungal inhibitor.
3.4.4. Violet Red Bile Agar with Glucose (VRBG) VRBG (38.5 g/L Merck kGaA, Darmstadt, Germany) contains violet red dye with
bile salt. This promotes selective growth of bile‐tolerant gram negative
Enterobacteria. VRBG plate count is used as a measure of the hygienic state of the
sample [17].
3.4.5. Tryptone Glucose Extract Agar (TGEA) TGEA (24 g/L, Oxoid LTD Basingstoke, New Hampshire) was used for the
enumeration of aerobic bacteria.
3.5. Inoculum preparation All strains were grown on YPD master plates and stored in a 2°C incubator. For
liquid culture P. anomala was incubated in YNB medium and incubated at 25°C for
24h at 140RPM. H. takashimae was incubated at 15°C for 48h to reach substantial
cell quantity, since the growth rate was very low. The cells where quantified using
Hemocytometer (Scherf, Burker, Germany), and inoculated at 105 CFU/g of wheat
straw by diluting with Normal saline (0.9% Sodium Chloride Solution) or spinning
down and resuspending the pellet in required amount of normal saline .
3.6. Experimental Setup H. takashimae, P. anomala, and A. discolor were inoculated in pure culture. A
combination of H. takashimae and P. anomala was also tested for the storage
experiment. All materials were made into water activity of 0.93 aW by adding
distilled water in a mixer and allowed to stand for three days at 4°C in a plastic
bag. To simulate the silo model storage 50 ml falcon tubes with wheat straw
packed were used. The lids were closed loosely to simulate air leak. There were
three parallels for each sample and tested in two different temperatures (15°C (A)
and 4°C (B)). Three parallels of uninoculated wheat straw of 0.93 aW were used as
control. Another set of parallels was used for microbial quantification. Samples
after the storage period were pretreated with dilute acid and proceeded for
fermentation (Figure: 1).

14
Dry Wheat Straw
Milled into fine powder
Store airtight at 2°C until use
(aW‐0.23)
Moisture to aW‐0.93 and
stored at 2°C for 3 days
Store at 4°C1 Month (4X4)
Store at 15°C
1 Month (4X4)
Acid Pretreatment78.3 g/l
120°C ,1Hr,1.1 Bar
Enzymaticsaccharification
60 g/l 45°C, 72Hr, 90 RPM
Fermentation37°C, 96Hr
HPLC before
fermentation
HPLC after
fermentation
Ethanol
Inoculation (105CFU/g)
Na‐Citrate buffer
Enzyme AccelleraseTM 1000 Dis.Water
Samples for microbial
QuantificationH2SO4
Separation
of solid &
liquid part
Unconverted cellulose and
hemicelluloses is discarded
Data
Analysis
Figure 1: Flowchart of the experimental procedure
3.7. Phenol oxidase activity measurement
The assay is based on photometric measurement of color formation of 3‐methyl‐
2‐benzothiazolinone hydrazone (MBTH) and 3‐(dimethylamino)benzoic acid
(DMAB) in presence of Hydrogen peroxide (H2O2) and Manganese sulfate (MnSO4)
[18]. 4 g of material was extracted with Succinate Buffer for 1 hour in a shaker
[15], and the absorbance was measured in Kinetics Mode by Shimadzu UV‐1800

15
UV‐VIS spectrophotometer (Shimadzu Corporation Chiyoda‐ku, Tokyo 101‐8448,
Japan) for the period of 3 minutes.
3.8. Dilute Acid Pretreatment
The wheat straw was converted to a slurry (78.3 g/L) by dilute Sulfuric acid (0.291
M)( Merk kGoA, Darmstadt, Germany) in 500ml conical flask and treated in an
Uniclave 360 autoclave( Sjukhusservice AB, Vemdalem,Sweden), with constant
time of heating (18‐22 min) and cooling time approximately 35 min (120°C to
80°C). The bottles were allowed to stand for 1 hr at 121°C and 15 psi
(1.1 Bar) pressure [19]. The pretreated sample was then adjusted to pH 5 by
adding 250 g/L NaOH (Fig: 1).
3.9. Enzymatic saccharification
AccelleraseTM 1000 enzyme, which was a kind gift of Genencor Copenhagen, was
used for the enzymatic degradation of pretreated materials to fermentable
sugars. The enzyme preparation is a cocktail of several enzymes including β‐
glucosidase [20]. The saccharification was done at 6% dry matter of wheat straw.
And the enzymes were added at the concentration of 0.1 g/g of dry mass (1g
represents 2500 CMC U of Endoglucanase activity, 400pNPG of β‐Glucosidase
activity at 50°C and at pH 4.8). 1M Sodium Citrate buffer was used for keeping the
pH optimum. The flasks were kept for shaking at 90rpm for 72hrs at 45°C.
3.10. Fermentation Fermentation was conducted in 15 ml serum flasks with rubber stopper to obtain
oxygen limitation along with 22 gauge needle for the CO2 to escape. Water soluble
sugar parts were filtered from the insoluble fraction using a 0.45µm filter. Yeast
extract was added at the concentration of 5 g/L for providing the nutrient for
yeast growth and ammonium sulphate ((NH4)2SO4) (2 g/L) was added to provide
ammonium salt [21]. Fermentation yeast Saccharomyces cerevisiae was added for
final OD 1. Fermentation were done at 30°C for 4 days and the resulting media
were analyzed for ethanol concentration by HPLC
3.11. HPLC analysis The sugar and ethanol concentrations were analyzed by High performance liquid
chromatography with refractive index detector in an Agilent 1100 series (Agilent
Technologies;Waldbronn,Germany). The column used was HC‐75 (Skandinaviska
Genetec AB, Sweden) at 60°C with 0.05 M H2SO4 as eluent. Areas under the peaks
were quantified by comparison with standard solutions of concentrations from 1
g/L to 30 g/L.
A Dionex (Sunnyvale, CA; USA ICS‐3000) High‐performance anion exchange
coupled with pulsed amperometric detection (HPAE‐PAD) was used for measuring
mono‐ and disaccharides. The system consists of a 2 × 250 mm analytical
CarboPac PA1 column at 30°C coupled with gold working electrode running in the
integrated amperometry mode. A gradient method was used for the
determination of maltose and cellobiose where 100 mM NaOH without (eluent A)
and with 200 mM sodium acetate (eluent B) were used as eluents, with a gradient
from 0 to 85 % B in 25 minutes at a flow rate of 0.25 ml/min. The standard curve
for calibration was made with a mixture of maltose and cellobiose ranging from

16
10 to 100 μM in concentration. Other monosaccharides were separated by
isocratic method using 15 mM NaOH at a flow rate of 0.25 ml/min[9].
3.12. Student T-test A student’s t test was performed to find out the significance of yield differences. A
homogenous, 2 tail normal distribution was done at a significance level of P‐value
<0.05

17
4. RESULTS AND DISCUSSION
4.1. Moisture analysis The dry weight of original wheat straw was 94.28 %( 0.225aw) corresponding to
5.72 % moisture. It is impossible to grow yeast on this low moisture value[16],
and it needs to be raised to allow the yeast to grow. In order to find the optimum
moisture content for the yeast cell to grow, a series of water activity tests were
performed, by inoculating P. anomala in different tubes with increasing moisture
level.
4.2. Water activity test Tubes containing wheat straw of different water activity were inoculated with
yeast samples to reach a cell concentration of 104 CFU/g of wheat straw and
incubated at 15°C for 2 week (Table: 2). The colony count of yeasts at water
activity 0.93 was considered as optimum and further experiments were done by
adjusting the aw to 0.93
Table 2: Fungal growth in different water activity mini silos. E0‐E6 represents Tubes 50ml Falcon tubes filled with wheat straw of increasing water activity)
Sample Water activity Fungal colony
E0 0.225 2Х102
E1 0.748 21Х104
E2 0.840 23Х105
E3 0.853 112Х105
E4 0.928 47Х107
E5 0.947 21Х107
E6 0.966 123Х105
4.3. Microbial characteristics
4.3.1. Natural micro flora of the sample The wheat straw may already contain a consortium of microorganisms. Since the
water activity was kept low by drying, the microbial growth was suppressed in the
original sample, even though there could be some dormant activities, which could
proliferate on suitable conditions. The control in our experiment (E0) was high
moisture level 0.93 aw non inoculated sample. So the microbial flora of mini silo‐
E0 was assumed as the natural micro flora in the experiment.
4.3.2. At the start of the experiment (t0) The microbial load just after the addition of inoculum (Fig: 2) shows greater
variation among fungal, Lactic acid bacteria and aerobic bacterial CFU. The
samples should differ only by the amount of yeasts inoculum addition, and the
effect of these yeasts on the growth of other microorganisms has to be

18
disregarded since the sample was standing only for less than an hour before it got
plated, which is less than the doubling time of baker’s yeast at 30°C. Also it is
interesting to note that the uninoculated wheat straw also had 106 fungal CFU/g.
That is the fungal populations in the inoculated samples may be a consortium of
different fungal species along with the inoculated yeast species. Also the
enterobacteria, indicating the hygienic state of sample had quite high initial load
(~104 CFU/g of wheat straw) in the sample [22].
Figure 2: Microbial population at the start of experiment. (Control‐Un Inoculated wheat straw, H.t‐ Holtermanniella takashimae inoculated wheat straw, P.a‐ Pichia anomala inoculated wheat straw, H.t+P.a ‐Co culture of Holtermanniella takashimae, and‐ Pichia anomala inoculated wheat straw. 15°C represents Higher storage temperature, 4°C represents low storage temperature. LAB‐Lactic acid bacteria, AB‐Aerobic bacteria, Enter‐Enterobacteria)
To get a more detailed understanding of the variation of the microbial load, a
chart is plotted (Fig: 3) with the CFU of the control as 1, and all other CFU as the
multiple of the control sample. Since the yeast inoculum was in the order of 106
and the control sample shows 106 fungal CFU/g, one has to assume a 2 fold
increase in fungal CFU for all inoculated samples and a 3 fold increment for co
culture inoculated samples. The number of fungal CFU was 2 times higher in the P.
anomala inoculated sample, and approximately 1.2 times in H. takashimae
inoculated sample, but the co culture fungal CFU was surprisingly higher than the
expected value of 3 and showed a 9.6‐ fold increment. That is the combined effect
of H. takashimae and P. anomala was higher than the individual effect.
1.00E+00
1.00E+01
1.00E+02
1.00E+03
1.00E+04
1.00E+05
1.00E+06
1.00E+07
1.00E+08
CFU
/g of wheat straw
At the start of the experiment
0‐Day Fungi
0‐Day LAB
0‐Day AB
0‐Day Enter

19
Figure 3: Effect of initial inoculum on microbial load with reference to the control at 15°C. (Control‐Un Inoculated wheat straw, H.t‐ Holtermanniella takashimae inoculated wheat straw, P.a‐ Pichia anomala inoculated wheat straw, H.t+P.a ‐Co culture of Holtermanniella takashimae, and‐ Pichia anomala inoculated wheat straw. 15°C represents Higher storage temperature, 4°C represents low storage temperature. LAB‐Lactic acid bacteria, AB‐Aerobic bacteria, Enter‐Enterobacteria)
At the same time, one has to assume the same number of Lactic acid Bacterial and
Aerobic Bacterial CFU for all the samples, since there is no external addition of any
of these organisms and the effect due to the growth of yeast addition may take at
least a few hours, which is not possible in t0. LAB CFU were found to be shooted
out to a 13 fold increment for the co‐culture inoculated samples, and a 9‐fold
increment for both H. takashimae and P. anomala. The aerobic Bacteria were 9
times higher than the control sample in both the coculture and Pichia anomala
inoculated sample. There is no general answer for this scenario right now, but a
general trend of high CFU/g of wheat straw was seen in all co‐culture inoculated
samples, except for enterobacteria.
0
2
4
6
8
10
12
14
16
fungi LAB Entero AB
Fold increase
Axis Title
Effect of Initial inoculum
Control 15oC
H.t 15 oC
P.a 15 oC
H.t+P.a 15oC
Control 4 oC
H.t 4oC
P.a 4 oC
H.t+P.a 4oC

20
4.3.3. Two week Incubation After two weeks of incubation, the control at 15°C in the experiment had
approximately 106 fungal, and enterobacterial CFU/g, 107 aerobic bacteria and
zero lactic acid bacteria (Table: 5). Whereas the samples inoculated with P.
anomala at 15°C showed the highest fungal growth (~109 CFU/g) among all the
samples (Figure: 3). Also the sample with co‐inoculation showed growth up to
~108 CFU/g. Low temperature has shown to retard the growth of microorganisms
in the all samples (an increment of 105 CFU/g to 108 CFU/g) except control at low
temperature (reduced to 104 CFU/g from 106 CFU/g at t0).
Figure 4 Microbial population after 2 weeks (Control‐Un Inoculated wheat straw, H.t‐ Holtermanniella takashimae, P.a‐ Pichia anomala,H.t+P.a‐Coculture of Holtermanniella takashima, and‐ Pichia anomala. 15oC represents Higher storage temperature of15°C, 4oC represents low storage temperature of 4°C)
It is interesting to note the enterobacteria count in relation with the yeast
population. The biopreservative behavior of P. anomala was not observed in the
present experiment, instead all the yeast strains found have a slight negative
impact on the enterobacteria at 15°C in compared to the control at the same
condition.
Aerobic bacteria were in the range of 105 CFU/g at the start of incubation. In all
the samples aerobic bacterial count increased (Table: 5) suggesting that the
aerobic bacteria got benefited by the incubation with yeast.
The lactic acid bacterial population vanished after 2 week of time. There was
some growth at one of the plates from H. takashimae incubated at low
temperature. Since there was no LAB detected in any of the plates or after 1
month, one has to conclude that as a contamination during the handling or during
plating.
1.00E+00
1.00E+01
1.00E+02
1.00E+03
1.00E+04
1.00E+05
1.00E+06
1.00E+07
1.00E+08
1.00E+09
15‐Day fungus
015‐Day Lactic acid bacteria
15‐Day aerobic bacteria
15‐Day Entero bacteria
CFU
/g of wheat straw
After Two weeks of incubation
Control 15oC
H.t 15 oC
P.a 15 oC
H.t+P.a 15oC
Control 4 oC
H.t 4oC
P.a 4 oC
H.t+P.a 4oC
21
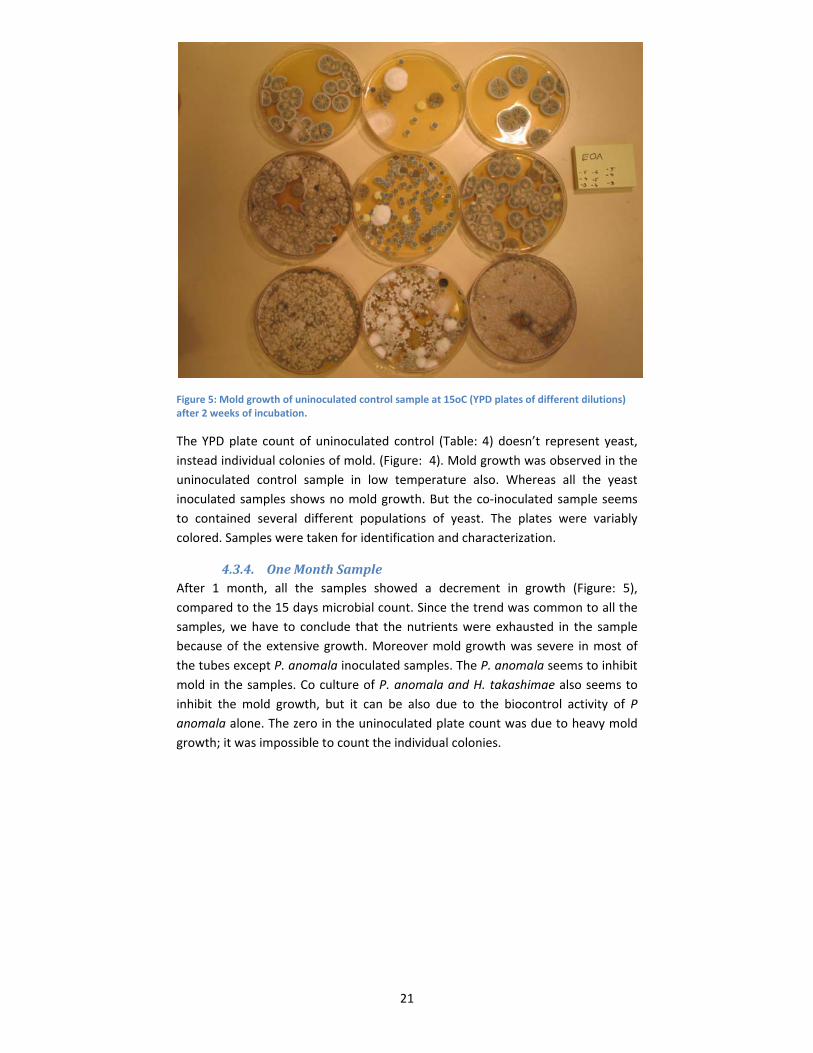
Figure 5: Mold growth of uninoculated control sample at 15oC (YPD plates of different dilutions) after 2 weeks of incubation.
The YPD plate count of uninoculated control (Table: 4) doesn’t represent yeast,
instead individual colonies of mold. (Figure: 4). Mold growth was observed in the
uninoculated control sample in low temperature also. Whereas all the yeast
inoculated samples shows no mold growth. But the co‐inoculated sample seems
to contained several different populations of yeast. The plates were variably
colored. Samples were taken for identification and characterization.
4.3.4. One Month Sample After 1 month, all the samples showed a decrement in growth (Figure: 5),
compared to the 15 days microbial count. Since the trend was common to all the
samples, we have to conclude that the nutrients were exhausted in the sample
because of the extensive growth. Moreover mold growth was severe in most of
the tubes except P. anomala inoculated samples. The P. anomala seems to inhibit
mold in the samples. Co culture of P. anomala and H. takashimae also seems to
inhibit the mold growth, but it can be also due to the biocontrol activity of P
anomala alone. The zero in the uninoculated plate count was due to heavy mold
growth; it was impossible to count the individual colonies.

22
Figure 6: Plate count after 1 month of inoculation (Control‐Un Inoculated wheat straw, H.t‐ Holtermanniella takashimae inoculated wheat straw, P.a‐ Pichia anomala inoculated wheat straw, H.t+P.a ‐Co culture of Holtermanniella takashimae, and Pichia anomala inoculated wheat straw. 15°C represents Higher storage temperature, 4°C represents low storage temperature.)
Even the TGEA plates, which were supposed to support the growth of bacteria,
also were heavily populated with mold. The H. takashimae inoculated samples
also shown to have mold growth, but less severe than the control (Fig: 6). Some
yeast was also able to recover from the H. takashimae samples after 30 days
incubation.
Figure 7: YPD plate count of H. takashimae inoculated wheat straw at 15oC (Plates of different dilutions). The different color may represent the occurrence of different fungal species.
There was no lactic acid bacterial growth 15°C or in the control samples, whereas
yeast inoculated samples at low temperature some growth of lactic acid bacterial
population was observed. In contrast to the P. anomala overtaken sample in the
1.00E+00
1.00E+01
1.00E+02
1.00E+03
1.00E+04
1.00E+05
1.00E+06
1.00E+07
1.00E+08
1.00E+09
30‐Day 30‐Day 30‐Day 30‐Day
CFU
/g of wheat straw
After 1 month
Control 15oC
H.t 15 oC
P.a 15 oC
H.t+P.a 15oC
Control 4 oC
H.t 4oC
P.a 4 oC
H.t+P.a 4oC

23
co culture at high temperature, Co culture at low temperature was overtaken by
mold
4.4. Yeast growth during storage Yeast population was the primary target of interest of this project. During the
experiment, mold contaminations have inferred with the yeast counting. So the
figure (Figure: 6) is not exact for the yeast growth alone. Moreover, the yeasts can
belong to different species, other than the inoculated ones. Especially the yeast
colonies in the H. takashimae inoculated plates were differentially colored and
may thus represent different species. This suggests that the H. takashimae’s
breakdown of cellulose to simple sugars benefits other organisms to proliferate.
At the same time, P. anomala incubated samples shown high growth with no
mold contamination were observed on plates. It may be due to its biocontrol
activity [11].
Figure 8: Yeast growth during storage of wheat straw in the mini silos. (Control‐Un Inoculated wheat straw, H.t‐ Holtermanniella takashimae inoculated wheat straw, P.a‐ Pichia anomala inoculated wheat straw, H.t+P.a ‐Co culture of Holtermanniella takashimae, and Pichia anomala inoculated wheat straw. 15°C represents Higher storage temperature, 4°C represents low storage temperature.)
The population of yeasts in the uninoculated control was replaced by mold during
2 week incubation time. P. anomala showed to have very high growth in all the
conditions (109 CFU/g Vs 106 CFU/g of control). It reached the order of ~109 CFU/g
in 15°C sample. In all the cases low temperature was shown to retard the growth.
After 1 month time the co culture sample at 4°C was found to be dominated by
mold, whereas the co culture at high temperature was shown to dominated by a
single colony (Colony morphology was same as that of P. anomala; samples were
preserved for identification).
4.5. Lactic acid Bacteria As being stated previously, the LAB population dipped to zero in almost all the
samples except low temperature incubated P. anomala and H. takashimae (Fig:8).
The reason for such an increment should be investigated further.
1.00E+00
1.00E+01
1.00E+02
1.00E+03
1.00E+04
1.00E+05
1.00E+06
1.00E+07
1.00E+08
1.00E+09
0‐Day 15‐Day 30‐Day
CFU
/g of wheat straw
Yeast growth
Control 15oC
H.t 15 oC
P.a 15 oC
H.t+P.a 15oC
Control 4 oC
H.t 4oC
P.a 4 oC
H.t+P.a 4oC

24
Figure 9: Lactic acid bacterial population during storage in the mini silo. (Control‐Un Inoculated wheat straw, H.t‐ Holtermanniella takashimae inoculated wheat straw, P.a‐ Pichia anomala inoculated wheat straw, H.t+P.a ‐Co culture of Holtermanniella takashimae, and Pichia anomala inoculated wheat straw. 15°C represents Higher storage temperature, 4°C represents low storage temperature.)
4.6. Aerobic bacteria The aerobic bacteria were at the range of 106 CFU/g at the start of incubation. A
general trend of an increment of bacteria was observed in all the samples by time
(Figure: 9). Highest aerobic bacterial load (108 CFU/g) was observed for co‐culture
at low temperature. P. anomala inoculated wheat straw at 15°C also had high
growth compared to the control. After 1 moth of incubation, several plates were
unable to count because of mold contamination. Since all the samples had high
aerobic bacterial CFU than the control at the same condition, It can be concluded
that the yeast growth doesn’t have any negative effect on the aerobic bacterial
growth.
Figure 10: Arerobic bacterial population during the storage in the mini silo. (Control‐Un Inoculated wheat straw, H.t‐ Holtermanniella takashimae inoculated wheat straw, P.a‐ Pichia anomala
1.00E+00
1.00E+01
1.00E+02
1.00E+03
1.00E+04
1.00E+05
1.00E+06
1.00E+07
1.00E+08
0‐Day 15‐Day 30‐Day
CFU
/g of wheat straw
Lactic acid Bateria
Control 15oC
H.t 15 oC
P.a 15 oC
H.t+P.a 15oC
Control 4 oC
H.t 4oC
P.a 4 oC
H.t+P.a 4oC
1.00E+00
1.00E+01
1.00E+02
1.00E+03
1.00E+04
1.00E+05
1.00E+06
1.00E+07
1.00E+08
1.00E+09
0‐Day 15‐Day 30‐Day
CFU
/g of wheat straw
Aerobic bacteriaControl 15oC
H.t 15 oC
P.a 15 oC
H.t+P.a 15oC
Control 4 oC
H.t 4oC
P.a 4 oC
H.t+P.a 4oC
25
inoculated wheat straw, H.t+P.a ‐Co culture of Holtermanniella takashimae, and Pichia anomala inoculated wheat straw. 15°C represents Higher storage temperature, 4°C represents low storage temperature.)
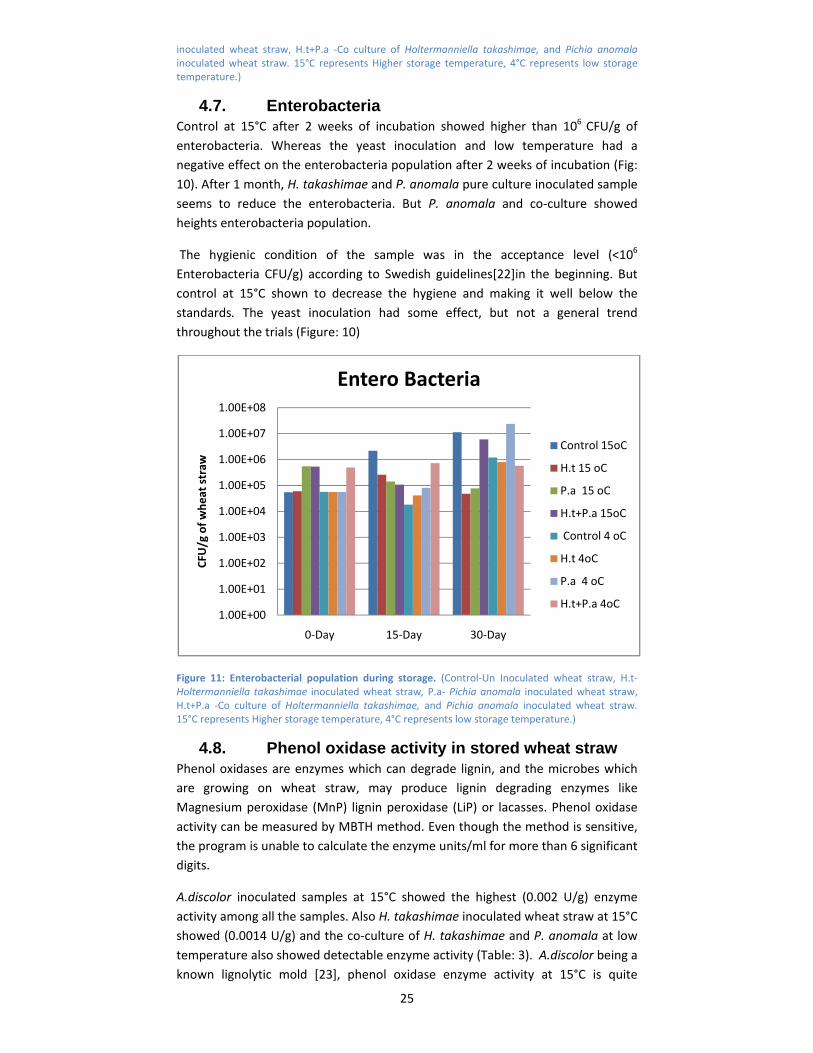
4.7. Enterobacteria Control at 15°C after 2 weeks of incubation showed higher than 106 CFU/g of
enterobacteria. Whereas the yeast inoculation and low temperature had a
negative effect on the enterobacteria population after 2 weeks of incubation (Fig:
10). After 1 month, H. takashimae and P. anomala pure culture inoculated sample
seems to reduce the enterobacteria. But P. anomala and co‐culture showed
heights enterobacteria population.
The hygienic condition of the sample was in the acceptance level (<106
Enterobacteria CFU/g) according to Swedish guidelines[22]in the beginning. But
control at 15°C shown to decrease the hygiene and making it well below the
standards. The yeast inoculation had some effect, but not a general trend
throughout the trials (Figure: 10)
Figure 11: Enterobacterial population during storage. (Control‐Un Inoculated wheat straw, H.t‐ Holtermanniella takashimae inoculated wheat straw, P.a‐ Pichia anomala inoculated wheat straw, H.t+P.a ‐Co culture of Holtermanniella takashimae, and Pichia anomala inoculated wheat straw. 15°C represents Higher storage temperature, 4°C represents low storage temperature.)
4.8. Phenol oxidase activity in stored wheat straw Phenol oxidases are enzymes which can degrade lignin, and the microbes which
are growing on wheat straw, may produce lignin degrading enzymes like
Magnesium peroxidase (MnP) lignin peroxidase (LiP) or lacasses. Phenol oxidase
activity can be measured by MBTH method. Even though the method is sensitive,
the program is unable to calculate the enzyme units/ml for more than 6 significant
digits.
A.discolor inoculated samples at 15°C showed the highest (0.002 U/g) enzyme
activity among all the samples. Also H. takashimae inoculated wheat straw at 15°C
showed (0.0014 U/g) and the co‐culture of H. takashimae and P. anomala at low
temperature also showed detectable enzyme activity (Table: 3). A.discolor being a
known lignolytic mold [23], phenol oxidase enzyme activity at 15°C is quite
1.00E+00
1.00E+01
1.00E+02
1.00E+03
1.00E+04
1.00E+05
1.00E+06
1.00E+07
1.00E+08
0‐Day 15‐Day 30‐Day
CFU
/g of wheat straw
Entero Bacteria
Control 15oC
H.t 15 oC
P.a 15 oC
H.t+P.a 15oC
Control 4 oC
H.t 4oC
P.a 4 oC
H.t+P.a 4oC

26
expected. But at low temperature growth of A.discolor may have been retarded
and according to the personnel communication with Dr. Leticia Pizzul (Dept of
microbiology, SLU) it may be difficult for the mold to grow solely on wheat straw
at the beginning stage (Soon after it is transferred from MS‐Agar plates). So it is
advisable to add little amount of starch material, for the mold to grow on, and to
produce lignolytic enzyme. Since the A.discolor was a later addition to the project,
its growth characteristics were not studied in this work. Most importantly we
cannot say how much significant these results are in disturbing the structure of
cellulose.
Table 3: Phenol oxidases activity in wheat straw. (Control‐Non Inoculated wheat straw, H.t‐ Holtermanniella takashimae inoculated wheat straw, P.a‐ Pichia anomala inoculated wheat straw, H.t+P.a ‐Co culture of Holtermanniella takashimae, and Pichia anomala inoculated wheat straw, A.d‐ A. discolor inoculated wheat straw. 15°C represents Higher storage temperature, 4°C represents low storage temperature.)
Units/ g of Wheat straw
15°C 4°C
Control 0 0
H. t 0.001447 0
P. a 0 0
H. t +P. a 0 0.00062
A. d 0.00207 0
4.9. Pretreatment Several pretreatment techniques were tested since the sugar yield of
saccharification of non pretreated material was quite low (2,38g of glucose/l of
medium) to perform a comparative study (results were not shown). A series of
trials simulating steam explosion was done in a bench top autoclave and the
glucose produced was compared in HPLC. The maximum amount of glucose
produced was 6.21 g/L and the process parameters were difficult to control
(sudden release of pressure and initial heating time varies from sample to
sample). The dilute acid treatment was easy to perform at laboratory scale and
was able to produce up to 14 g/L Glucose. A simple biological toxicity test were
performed later to find out the extent of severity of our the dilute acid treatment
(see section 4.12.4)
4.10. Saccharification Saccharification was done in the same bottles where we have done the dilute acid
treatment. The samples after acid treatment were sterile, and since the
saccharification is highly vulnerable for contamination, it is important to keep the
sterility. The pretreated samples were at very low pH (~1) so the pH was increased
by the addition of 25 % NaOH, and Citrate –buffer was added to give a buffer for
the Accellerase™ 1000 enzyme. Unfortunately some of the 15°C samples fell
down from the shaker and are not included in the final results. But we were able
to get more than one parallel for each sample.

27
4.11. Glucose Production Control at 15°C showed highest glucose yield (13.1 g/L) compared to the fungi
inoculated samples. And the difference between control and inoculated sample
was quite low (~2 g/L) (Figure: 11). It indicates that the tested organisms had only
little effect on pretreatment efficiency or apparently growth of microorganisms
reduced the yield of sugar. Since the hypothesis was high ethanol production for
the samples with highest microbial growth, the results was not promising.
Figure 12: Amount of glucose in the hydrolysate before start of fermentation. (Control‐Non Inoculated wheat straw, H.t‐ Holtermanniella takashimae inoculated wheat straw, P.a‐ Pichia anomala inoculated wheat straw, H.t+P.a ‐Co culture of Holtermanniella takashimae, and Pichia anomala inoculated wheat straw, A.d‐ A. discolor inoculated wheat straw. 15°C represents Higher storage temperature, 4°C represents low storage temperature.)
4.12. Fermentation studies
The yeast cells produce ethanol under anaerobic situation, when they convert the
pruvate (which is the break down product of glucose) into ethanol for gain of 2
molecules NAD+, which is needed for the continuation of the energy yielding
glycolsis process. The overall reaction of ethanol fermentation can be represented
by
C6H12O6 → 2C2H5OH + 2CO2 (Glucose→2*ethanol+2*carbondioxide)
The fermentation medium was initially analyzed for glucose, acetate and ethanol.
The ethanol productions varied in different samples. The highest yield was for P.
anomala at 15°C (6.87 g/L) Vs 6.47 g/L of uninoculated control
4.12.1. Ethanol Production The HPLC analysis of fermented medium shows an inverse co‐relation between
amounts of glucose detected previously. The inoculated samples gave better
ethanol production than the uninoculated‐control sample (figure 12). Highest
value for ethanol was A. discolor at 15°C (6.85 g/L), where as the co‐inoculated
sample (5.83 g/L) gave the least ethanol production value than the control. At low
temperature (4°C) P. anomala inoculated wheat straw showed the highest
ethanol production (6.23 g/L). But the overall ethanol yield was lower in 4°C
Control
15oC
H.t 15 oC
P.a 15 oC
H.t+P.a
15oC
A.d 15oC
Control 4 oC
H.t 4oC
P.a 4 oC
H.t+P.a 4oC
A.d 4oC
Series1 13.1 13.08 13.05 10.9 13.04 11.23 11.04 10.95 10.94 10.85
02468
10121416
Glucose(g/L
Glucose

28
stored samples than the 15°C stored samples. It may be an indication of low
ethanol production due to low structural damage/ low growth of microorganisms
(figure 3&4).
Figure 13: Amount of ethanol after 3 days of fermentation. (Control‐Non Inoculated wheat straw, H.t‐ Holtermanniella takashimae inoculated wheat straw, P.a‐ Pichia anomala inoculated wheat straw, H.t+P.a ‐Co culture of Holtermanniella takashimae, and Pichia anomala inoculated wheat straw, A.d‐ A. discolor inoculated wheat straw. 15°C represents Higher storage temperature, 4°C represents low storage temperature.)
4.12.2. Yield Factor
It is theoretically impossible to produce 6.18g of ethanol from a hydrolysate
containing 10.8g of glucose, unless there are other sources of fermenting sugars
left in the medium. Since the fermenting medium was already filtered out to
remove non hydrolyzed solid factors, the only possible scenario is the presence of
soluble polysaccharides left over from the saccharification step, which were
further converted to sugars during fermentation step. The yields of ethanol Vs
glucose have been shown in the graph below, showing highest yield at 57 % for P.
anomala at 4°C (figure: 13). It also raises a question why the yield factor is less for
uninoculated sample.
Control
15oC
H.t 15 oC
P.a 15 oC
H.t+P.a
15oC
A.d 15oC
Control 4 oC
H.t 4oC
P.a 4 oC
H.t+P.a 4oC
A.d 4oC
Series1 6.47 6.76 6.87 5.83 6.85 6.02 6.07 6.23 6.20 6.18
11.52
2.53
3.54
4.55
5.56
6.57
Ethan
ol (g/L)
Ethanol

29
Figure 14: Yield of ethanol from amount of glucose before the start of fermentation. (Control‐Un Inoculated wheat straw, H.t‐ Holtermanniella takashimae inoculated wheat straw, P.a‐ Pichia anomala inoculated wheat straw, H.t+P.a ‐Co culture of Holtermanniella takashimae, and‐ Pichia anomala inoculated wheat straw. 15°C represents Higher storage temperature, 4°C represents low storage temperature.)
4.12.3. Other sugars Since the yield factor is very high (Figure: 13), we have to assume that, the
hydrolysate contains other possible simple sugars which can be fermented by the
yeast, or other soluble poly saccharides which can be converted to glucose by the
still active enzyme. So an investigation was done to measure other simple sugars
like xylose, arabinose, mannose and cellobiose in a Dionex Anion‐exchange high‐
performance liquid chromatography (HPAEX) system.
Control
15oC
H.t 15 oC
P.a 15 oC
H.t+P.a
15oC
A.d 15oC
Control 4 oC
H.t 4oC
P.a 4 oC
H.t+P.a 4oC
A.d 4oC
Yeild 49.38 51.70 52.66 53.48 52.53 53.65 54.96 56.93 56.66 56.92
49.38931298
51.70806267
52.6618154
53.48165138
52.53737064
53.65875371
54.96528826
56.93852708
56.66352038
56.92354928
0
5
10
15
20
25
30
35
40
45
50
55
60
Yield (%)
Yield

30
Figure 15: Simple sugars produced in the hydrolysate after 3 days of saccharification. (Control‐Un Inoculated wheat straw, H.t‐ Holtermanniella takashimae inoculated wheat straw, P.a‐ Pichia anomala inoculated wheat straw, H.t+P.a ‐Co culture of Holtermanniella takashimae, and‐ Pichia anomala inoculated wheat straw. 15°C represents Higher storage temperature, 4°C represents low storage temperature.)
There was a significant difference between the amounts of xylose produced
among various samples. An 88% higher xylose yield was obtained for P. anomala
inoculated sample than that of control. It is interesting to note that the amount of
glucose was lowest for the co culture (10.9 g/L) but the total sugars, and ethanol
yield was not affected by the low glucose concentration.
4.12.4. Toxicity of hydrolysate It is interesting to find out the extent of toxicity of the hydrolysate generated by
the primitive pretreatment step. But quantification of such compounds is quite
difficult and costly. So a biological feasibility test was conducted. Since it was
shown that S. cerevisiae can grow in 100% hydrolysate; P. stipitis, a yeast species
known for its vulnerability to inhibitors, which also can ferment on xylose and an
alternative fermentation yeast D. bruxellensis (at OD 2 and 1) was inoculated into
a test fermentation. Since the incubation time was quite long for D.bruxellensis,
ethanol concentration was measured after 1 week.
Both the species were able to grow in 100 % medium (un inoculated wheat straw
hydrolysate). D. bruxellensis produced little more ethanol (6.7 g/L) than the
previous S. cerevisiae fermentation. P. stipitis produced only 4.8 g/L ethanol (may
be due to the long incubation time of 1 week and air diffusion through the needle
hole in the fermentation cap). Since both the species was able to grow in
concentrated medium, and able to produce ethanol, it is obvious that the used
Control 15oC
H.t 15 oC
P.a 15 oC
H.t+P.a 15oC
A.d 15oC
Control 4 oC
H.t 4oCP.a 4 oC
H.t+P.a 4oC
A.d 4oC
Cellobiose 466.49 190.54 198.25 393.71 194.39 417.00 186.15 266.11 305.72 374.55
Mannose 265.36 241.56 247.82 278.12 213.82 229.48 174.41 145.27 185.07 203.46
Xylose 1556.0 1219.8 13766. 12997. 12974. 14469. 12874. 12529. 12045. 12696.
Galactose 649.34 532.24 562.08 562.03 539.26 588.61 509.00 505.79 487.95 523.97
Arabinose 1860.5 1537.0 1657.9 1550.1 1521.8 1735.0 1547.2 1520.0 1451.6 1533.0
Glucose 13100. 13085. 13050. 10900. 13040. 11230. 11040. 10950. 10940. 10850.
0.00
5000.00
10000.00
15000.00
20000.00
25000.00
30000.00
35000.00
mg\L
Total Sugars

31
pretreatment produces much less fermentation inhibitors than the previous
hydrolysate obtained by steam explosion [21] and quite vulnerable yeast strains
were able to grow with fairly good ethanol yield.
A back calculation of the dilute acid pretreatment showed that, the current H2SO4
concentration was only 0.66 % instead of the targeted 0.75 % because of the
moisture content in the sample. So we can conclude that, our pretreatment was
less severe and produced almost equal amount of sugar to that of commercial
harsh pretreatment step [21] without production of inhibitors.
4.12.5. Statistical significance Since one of the 3 bottles of the control at 15°C got fall down from the shaker, it
created an unbalanced distribution, and the program was unable to calculate the
statistical significance with the data. So the control at 4°C was used as a reference
for calculating the significance of ethanol production. Moreover, it is logical to
compare the ethanol production of high microbial growth with samples having
less growth.
The higher yield obtained by the co‐culture (2.8 %) and the A.discolor (2.5 %) at
low temperature was statistically significant compared to the wet non inoculated
wheat straw at low temperature.

32
5. CONCLUSION AND FUTURE PROSPECTIVE Even though the difference in ethanol production was marginal(2.8 % higher
ethanol produced by the Co‐culture at 4°C than the control at the same
temperature), the theoretically impossible yield (57 % conversion of glucose to
ethanol) suggests that, there were more unconverted soluble sugar in the
A.discolor inoculated sample than the non inoculated sample. That is, the
saccharification was not efficient enough to convert all the cellulose to glucose,
instead, it reached a certain value and got inhibited for some reasons. When the
S. cerevisiae started ethanol fermentation, the soluble sugars got converted to
glucose by the still active enzyme in the medium.
The comparison of total sugar yield indicates that wheat straw inoculated with P.
anomala at 15°C produce approximately double the quantity of simple sugars that
of control sample. Moreover, there was more xylose than glucose, which the
common baker’s yeast cannot utilize. So it is suggested to use other fermenting
yeast like P. stipitis which can utilize xylose also. In order to meet the objective of
the current project, it is highly advisable to run the projects with more enzymes
until all the cellulose is converted to sugar monomers or a simultaneous
saccharification and fermentation to fully utilize the cellulose to ethanol. Greater
yield difference is between uninoculated sample at 4°C and that of lignolytic mold
at higher temperature (12.3 %), suggests that the storage is more efficient where
microorganisms capable of degrading cellulose are more active. Moreover in
future it is more meaningful to compare the results with dry non stored wheat
straw with inoculated stored samples.

33
6. ACKNOWLEDGEMENT I would like to express my deep gratitude towards my supervisor Matilda
Olstorpe, Dept of Microbiology, SLU, Uppsala for guidance and support
throughout the work.
I would also like to thank Volkmar Passoth, Jerry Ståhlberg, Leticia Pizzul, Henrik
Hansson and Elizabeth Börjesson for their kind help and support for the
completion of this project.
I would also like to thank all the members of department of microbiology for the
kind help and encouragement throughout the work.

34
7. REFERENCES 1. Williams, P.R.D., et al., Environmental and Sustainability Factors
Associated With Next‐Generation Biofuels in the U.S.: What Do We Really Know? Environmental Science & Technology, 2009. 43(13): p. 4763‐4775.
2. Larson, E.D., A review of life‐cycle analysis studies on liquid biofuel systems for the transport sector. Energy for Sustainable Development, 2006. 10(2): p. 109‐126.
3. Louime, C. and H. Uckelmann, Cellulosic ethanol: securing the planet future energy needs. Int J Mol Sci, 2008. 9(5): p. 838‐41.
4. Luo, C., D.L. Brink, and H.W. Blanch, Identification of potential fermentation inhibitors in conversion of hybrid poplar hydrolyzate to ethanol. Biomass and Bioenergy, 2002. 22(2): p. 125‐138.
5. van Maris, A., et al., Alcoholic fermentation of carbon sources in biomass hydrolysates by <i>Saccharomyces cerevisiae</i>: current status. Antonie van Leeuwenhoek, 2006. 90(4): p. 391‐418.
6. Hatakka, A.I., Pretreatment of wheat straw by white‐rot fungi for enzymic saccharification of cellulose. Applied Microbiology and Biotechnology, 1983. 18(6): p. 350‐357.
7. Kuhar, S., L.M. Nair, and R.C. Kuhad, Pretreatment of lignocellulosic material with fungi capable of higher lignin degradation and lower carbohydrate degradation improves substrate acid hydrolysis and the eventual conversion to ethanol. Canadian Journal of Microbiology, 2008. 54: p. 305‐313.
8. Zhu, J., X. Pan, and R. Zalesny, Pretreatment of woody biomass for biofuel production: energy efficiency, technologies, and recalcitrance. Applied Microbiology and Biotechnology, 2010. 87(3): p. 847‐857.
9. Passoth, V., et al., Airtight storage of moist wheat grain improves bioethanol yields. Biotechnology for Biofuels, 2009. 2(1): p. 16.
10. Olstorpe, M., et al., Pichia anomala yeast improves feed hygiene during storage of moist crimped barley grain under Swedish farm conditions. 2010. 156(1): p. 47‐56.
11. Passoth, V., et al., Biotechnology, physiology and genetics of the yeast Pichia anomala. FEMS Yeast Research, 2006. 6(1): p. 3‐13.
12. Wuczkowski, M., et al., Description of Holtermanniella takashimae sp. nov., Holtermanniella gen. nov. and proposal of the order Holtermanniales to accommodate Tremellomycetous yeasts of the Holtermannia clade. Int J Syst Evol Microbiol, 2010: p. ijs.0.019737‐0.
13. Hatakka, A., Lignin‐modifying enzymes from selected white‐rot fungi: production and role from in lignin degradation. FEMS Microbiology Reviews, 1994. 13(2‐3): p. 125‐135.
14. Tortella, G., et al., Enzymatic characterization of Chilean native wood‐rotting fungi for potential use in the bioremediation of polluted environments with chlorophenols. World Journal of Microbiology and Biotechnology, 2008. 24(12): p. 2805‐2818.
15. Acevedo, F., et al., Degradation of polycyclic aromatic hydrocarbons by the Chilean white‐rot fungus Anthracophyllum discolor. Journal of Hazardous Materials, 2011. 185(1): p. 212‐219.
16. Mugnier, J. and G. Jung, Survival of Bacteria and Fungi in Relation to Water Activity and the Solvent Properties of Water in Biopolymer Gels. Appl. Environ. Microbiol., 1985. 50(1): p. 108‐114.
17. Pronadisa, Violet Red Bile Agar with Glucose (VRBG) (European Pharmacopeia)Cat NO: 1092, 2009.
18. Castillo, M.D., J. Stenstrom, and P. Ander, Determination of Manganese Peroxidase Activity with 3‐Methyl‐2‐benzothiazolinone Hydrazone and 3‐(Dimethylamino)benzoic Acid. Analytical Biochemistry, 1994. 218(2): p. 399‐404.

35
19. Saha, B., et al., Dilute acid pretreatment, enzymatic saccharification and fermentation of wheat straw to ethanol. Process Biochemistry, 2005. 40(12): p. 3693‐3700.
20. DaniscoUSA, ACCELLERASE™ 1000‐ Cellulase Enzyme Complex for Lignocellulosic Biomass Hydrolysis. www.genencor.com, 2007.
21. South, E., Fermentation of lignocellulosic material by the alternative industrial ethanol yeast Dekkera bruxellensis. Master's Thesis, Swedish University of Agricultural Sciences, Department of Microbiology, 2010:4, 2010.
22. Olstorpe, M., Feed grain improvement through biopreservation and bioprocessing. PhD thesis, Acta Universitatis agriculturae Sueciae, 1652‐6880 ; 2008:77 2008.
23. Rubilar, O., et al., Biodegradation of Pentachlorophenol in Soil Slurry Cultures by Bjerkandera adusta and Anthracophyllum discolor. Industrial & Engineering Chemistry Research, 2007. 46(21): p. 6744‐6751.

36
Appendix Table 4: Microbial enumeration of initial sample‐after water activity normalization and inoculation with the respective yeast sample. (Control‐Non Inoculated wheat straw, H.t‐ Holtermanniella takashimae inoculated wheat straw, P.a‐ Pichia anomala inoculated wheat straw, H.t+P.a ‐Co culture of Holtermanniella takashimae, and‐ Pichia anomala inoculated wheat straw. 15°C represents Higher storage temperature, 4°C represents low storage temperature.)
Incubated
at 15°C
Sample Name YPD0 MRS0 TGEA0 VRBG0
Control E0A1t0 1.10E+06 5.00E+02 6.80E+05 5.80E+04
Control E0A2t0 9.80E+05 1.00E+02 8.10E+05 5.00E+04
Control E0A3t0 1.20E+06 1.00E+02 7.80E+05 5.70E+04
H.t E1A1t0 1.03E+05 0.00E+00 1.01E+06 6.00E+04
H.t E1A2t0 3.90E+06 7.00E+02 6.40E+05 6.60E+04
H.t E1A3t0 6.90E+05 6.00E+02 7.90E+05 5.40E+04
P.a E2A1t0 2.40E+06 5.90E+03 7.80E+05 4.80E+05
P.a E2A2t0 4.50E+06 1.00E+02 6.00E+05 7.20E+05
P.a E2A3t0 2.20E+06 3.00E+02 7.70E+05 4.60E+05
H.t +P.a E3A1t0 1.16E+07 9.70E+03 6.60E+05 4.60E+05
H.t +P.a E3A2t0 8.40E+06 0.00E+00 6.30E+05 6.30E+05
H.t +P.a E3A3t0 1.14E+07 7.00E+02 5.40E+05 5.10E+05
Incubated
at 4°C
Control E0B1t0 2.10E+06 1.00E+02 6.50E+05 6.50E+04
Control E0B2t0 1.80E+06 4.00E+02 6.50E+05 4.40E+04
Control E0B3t0 9.00E+05 1.00E+02 7.60E+05 6.00E+04
H.t E1B1t0 2.40E+06 0.00E+00 1.12E+06 6.00E+04
H.t E1B2t0 6.10E+05 1.00E+02 1.00E+06 5.00E+04
H.t E1B3t0 1.21E+06 5.00E+02 1.08E+06 5.80E+04
P.a E2B1t0 2.02E+06 4.00E+02 7.60E+05 4.40E+04
P.a E2B2t0 4.10E+06 0.00E+00 7.60E+05 6.60E+04
P.a E2B3t0 4.00E+06 1.00E+02 7.60E+05 5.80E+04
H.t +P .a E3B1t0 1.37E+07 5.80E+03 6.90E+05 4.70E+05
H .t +P .a E3B2t0 2.51E+06 0.00E+00 7.70E+05 5.10E+05
H.t +P.a E3B3t0 1.40E+07 5.00E+02 7.70E+05 5.00E+05

37
Table 5: Microbial population at 2 week. (Control‐Non Inoculated wheat straw, H.t‐ Holtermanniella takashimae inoculated wheat straw, P.a‐ Pichia anomala inoculated wheat straw, H.t+P.a ‐Co culture of Holtermanniella takashimae, and‐ Pichia anomala inoculated wheat straw. 15°C represents Higher storage temperature, 4°C represents low storage temperature.)
Incubated
at 15°C
Sample Name YPD15 MRS15 TGEA15 VRBG15
Control E0A1t1 8.00E+05 0.00E+00 6.30E+06 2.00E+06
Control E0A2t1 1.40E+06 0.00E+00 9.40E+06 2.30E+06
Control E0A3t1 2.70E+06 0.00E+00 mold 2.24E+06
H.t E1A1t1 9.10E+06 0.00E+00 7.20E+06 1.28E+05
H.t E1A2t1 9.90E+06 0.00E+00 7.80E+06 1.10E+05
H.t E1A3t1 8.80E+06 0.00E+00 6.00E+06 5.40E+05
P.a E2A1t1 7.70E+08 0.00E+00 1.66E+08 1.41E+05
P.a E2A2t1 8.00E+08 0.00E+00 1.69E+03 1.68E+05
P.a E2A3t1 7.20E+08 0.00E+00 1.60E+08 1.18E+05
H.t +P .a E3A1t1 1.96E+08 0.00E+00 2.20E+06 1.07E+05
H.t +P.a E3A2t1 3.60E+08 0.00E+00 1.80E+06 8.00E+04
H.t +P.a E3A3t1 4.20E+08 0.00E+00 2.60E+06 1.34E+05
Incubated
at 4°C
Control E0B1t1 2.30E+04 0.00E+00 1.18E+06 1.70E+04
Control E0B2t1 1.40E+04 0.00E+00 1.20E+06 1.10E+04
Control E0B3t1 2.20E+04 0.00E+00 1.33E+06 2.70E+04
H.t E1B1t1 3.90E+05 9.40E+05 8.40E+06 4.00E+04
H.t E1B2t1 2.60E+06 1.53E+06 1.50E+06 1.16E+04
H.t E1B3t1 3.60E+06 0.00E+00 6.60E+06 7.30E+04
P.a E2B1t1 5.10E+06 0.00E+00 9.80E+05 8.00E+04
P.a E2B2t1 1.80E+06 0.00E+00 7.50E+05 6.90E+04
P.a E2B3t1 1.70E+06 0.00E+00 1.23E+06 9.40E+04
H.t +P .a E3B1t1 1.60E+06 0.00E+00 2.24E+08 1.08E+06
H.t +P .a E3B2t1 2.90E+06 0.00E+00 2.00E+08 4.40E+05
H.t +P .a E3B3t1 2.40E+06 0.00E+00 1.64E+08 6.60E+05
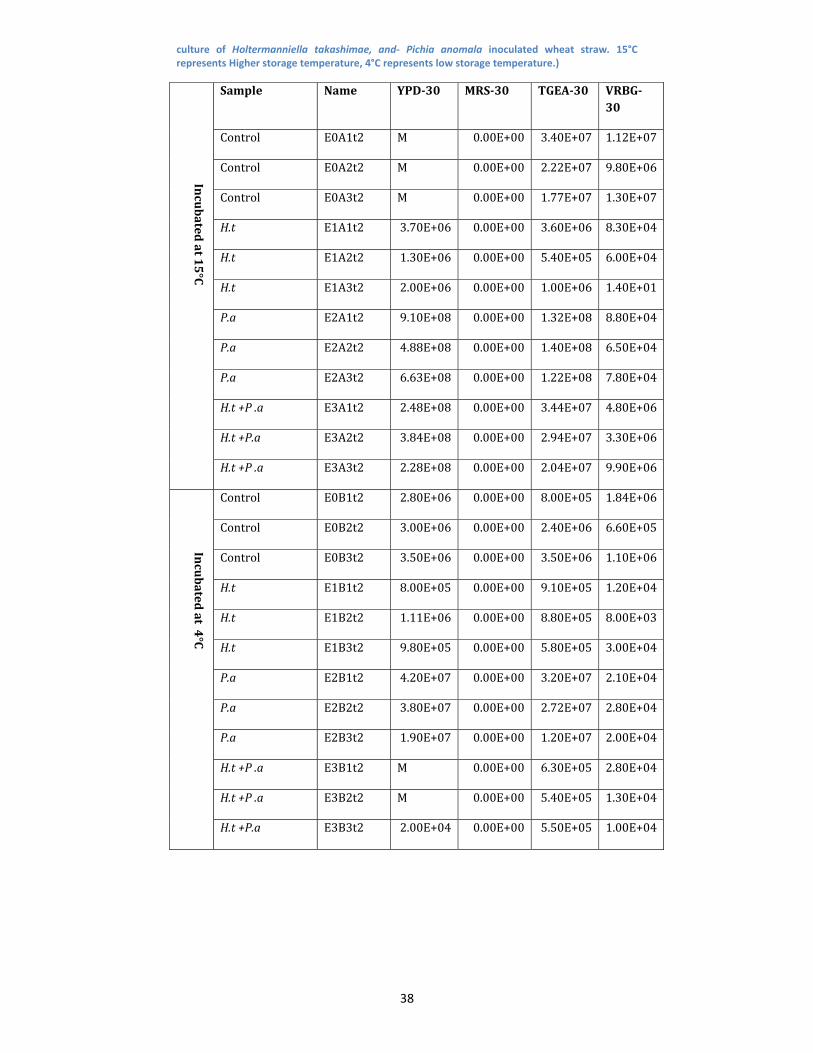
Table 6: Microbial population after 1 month. ‘M’ represents a non zero value, due to high mold contamination in the counting plates. (Control‐Non Inoculated wheat straw, H.t‐ Holtermanniella takashimae inoculated wheat straw, P.a‐ Pichia anomala inoculated wheat straw, H.t+P.a ‐Co
38
culture of Holtermanniella takashimae, and‐ Pichia anomala inoculated wheat straw. 15°C represents Higher storage temperature, 4°C represents low storage temperature.)
Incubated
at 15°C
Sample Name YPD30 MRS30 TGEA30 VRBG30
Control E0A1t2 M 0.00E+00 3.40E+07 1.12E+07
Control E0A2t2 M 0.00E+00 2.22E+07 9.80E+06
Control E0A3t2 M 0.00E+00 1.77E+07 1.30E+07
H.t E1A1t2 3.70E+06 0.00E+00 3.60E+06 8.30E+04
H.t E1A2t2 1.30E+06 0.00E+00 5.40E+05 6.00E+04
H.t E1A3t2 2.00E+06 0.00E+00 1.00E+06 1.40E+01
P.a E2A1t2 9.10E+08 0.00E+00 1.32E+08 8.80E+04
P.a E2A2t2 4.88E+08 0.00E+00 1.40E+08 6.50E+04
P.a E2A3t2 6.63E+08 0.00E+00 1.22E+08 7.80E+04
H.t +P .a E3A1t2 2.48E+08 0.00E+00 3.44E+07 4.80E+06
H.t +P.a E3A2t2 3.84E+08 0.00E+00 2.94E+07 3.30E+06
H.t +P .a E3A3t2 2.28E+08 0.00E+00 2.04E+07 9.90E+06
Incubated
at 4°C
Control E0B1t2 2.80E+06 0.00E+00 8.00E+05 1.84E+06
Control E0B2t2 3.00E+06 0.00E+00 2.40E+06 6.60E+05
Control E0B3t2 3.50E+06 0.00E+00 3.50E+06 1.10E+06
H.t E1B1t2 8.00E+05 0.00E+00 9.10E+05 1.20E+04
H.t E1B2t2 1.11E+06 0.00E+00 8.80E+05 8.00E+03
H.t E1B3t2 9.80E+05 0.00E+00 5.80E+05 3.00E+04
P.a E2B1t2 4.20E+07 0.00E+00 3.20E+07 2.10E+04
P.a E2B2t2 3.80E+07 0.00E+00 2.72E+07 2.80E+04
P.a E2B3t2 1.90E+07 0.00E+00 1.20E+07 2.00E+04
H.t +P .a E3B1t2 M 0.00E+00 6.30E+05 2.80E+04
H.t +P .a E3B2t2 M 0.00E+00 5.40E+05 1.30E+04
H.t +P.a E3B3t2 2.00E+04 0.00E+00 5.50E+05 1.00E+04

39
Table 7: HPLC analysis of wheat straw hydrolysate after 3 days enzyme treatment with Acerylase 1000. (Control‐Non Inoculated wheat straw, H.t‐ Holtermanniella takashimae inoculated wheat straw, P.a‐ Pichia anomala inoculated wheat straw, H.t+P.a ‐Co culture of Holtermanniella takashimae, and Pichia anomala inoculated wheat straw, A.d‐ A. discolor inoculated wheat straw. 15°C represents Higher storage temperature, 4°C represents low storage temperature.)
Table 8: HPLC analysis Fermentation medium after 3 days of fermentation with S. cerevisiae at 30°C. (Control‐Non Inoculated wheat straw, H.t‐ Holtermanniella takashimae inoculated wheat straw, P.a‐ Pichia anomala inoculated wheat straw, H.t+P.a ‐Co culture of Holtermanniella takashimae, and Pichia anomala inoculated wheat straw, A.d‐ A. discolor inoculated wheat straw. 15°C represents Higher storage temperature, 4°C represents low storage temperature.)
Before fermentation
Incubated
at 15°C
Sl No Sample Glucose (g/L) Acetate (g/L) Ethanol (g/L)
1 Control 13.1±0 1.25±0 0
2 H.t 13.085±0.120 1.28±0.05 0
3 P.a 13.05±0.34 1.28±0.02 0
4 H.t +P.a 10.9±2.20 1.25±0.02 0
5 A. d 13.045±1.56 1.25±0.09 0
Incubated
at 4°C
6 Control 11.23±0.75 1.66±0.03 0
7 H.t 11.043±0.04 1.56±0.01 0
8 P.a 10.95±0.10 1.56±0.05 0
9 H.t +P.a 10.94±0.056 1.52±0.08 0
10 A. d 10.856±0.14 1.60±0.02 0
After fermentation
Incubated
at 15°C
Sl No
Sample Glucose (g/L)
Acetate (g/L) Ethanol (g/L)
Yield (%)
1 Control 0 1.19±0 6.47±0 49.38931
2 H.t 0 1.21±0.28 6.76±0.07 51.70806
3 P.a 0 1.2±0.21 6.87±0.06 52.66182
4 H.t +P.a 0 5.8295±0.042 5.82±1.28 53.48165
5 A. d 0 1.21±0.04 6.85±0.59 52.53737
ted
at
6 Control 0 1.6±0.05 6.02±0.01 53.65875

40
Table 9: HPLC analysis of wheat straw hydrolysate in Dionex system. (Control‐Non Inoculated wheat straw, H.t‐ Holtermanniella takashimae inoculated wheat straw, P.a‐ Pichia anomala inoculated wheat straw, H.t+P.a ‐Co culture of Holtermanniella takashimae, and Pichia anomala inoculated wheat straw, A.d‐ A. discolor inoculated wheat straw. 15°C represents Higher storage temperature, 4°C represents low storage temperature.)
Sample Arabinose(mg/L) Galactose(mg/L) Xylose(mg/L) Manose(mg/L) Cellobiose(mg/L)
Incubated
at 15°C
Control 1860.55 649.3448 15576.08 265.369 466.493
H.t 1537.04±7.13 532.24±2.89 1219.86±308.41 241.56±36.65 190.54±11.67
P.a 1657±113.07 562.08±42.44 13766.81±882.51 247.82±54.10 198.25±1.19
H.t +P.a 1550.16±12.6 562.03±11.28 12997.60±208.69 278.12±4.6 393.71±44.63
A. d 1521.84±94.72 539.29±19.26 12974.96±893.056 213.82±19.34 194.39±16.49
Incubated
at 4°C
Control 1735.04±180.63 588.61±65.65 14496.54±1562.527 229.48±31.99 417±20.56
H.t 1547.27±79.29 509±41.78 12874.78±485.26 174.417±42.28 186.15±3.10
P.a 1520.04±77.52 505.79±34.08 12529.04±686.41 145.27±126.02 266.11±72.05
H.t +P.a 1451.62±71.75 487.95±16 12045.91±615.02 185.07±13.54 305.72±7.12
A. d 1533.07±29.04 523.97±18.33 12696.61±215.97 203.465±17.52 374.55±6.72
7 H.t 0 1.53±0.052 6.07±0.09 54.96529
8 P.a 0 1.53±.00 6.23±0.23 56.93853
9 H.t +P.a 0 1.46±0.65 6.20±0.10 56.66352
10 A. discolor 0 1.65±0.31 6.18±0.07 56.92355